regulator’s 2016 quantitative survey and 2015 qualitative ... · regulator’s 2016 quantitative...
TRANSCRIPT
Researching record-keeping and
administration in trust-based pension schemes
Findings from The Pensions
Regulator’s 2016 quantitative survey
and 2015 qualitative research
June 2016
Prepared for
By OMB Research
Contents
1 Executive summary ............................................................................................. 2
1.1 Introduction ................................................................................................... 2
1.2 Record-keeping and administration ............................................................... 2
1.3 Key findings................................................................................................... 2
2 Background and methodology ............................................................................. 6
2.1 Background ................................................................................................... 6
2.2 Methodology.................................................................................................. 6
2.2.1 The 2016 record-keeping survey ............................................................ 6
2.2.2 The 2015 scheme administration research ............................................. 7
2.3 Reporting considerations .............................................................................. 8
2.4 Acknowledgements ....................................................................................... 9
3 Main findings...................................................................................................... 10
3.1 Common data .............................................................................................. 10
3.1.1 Qualitative findings on common data .................................................... 10
3.1.2 Common data measurement ................................................................ 11
3.1.3 Common data score ............................................................................. 12
3.1.4 Aspects of common data being measured ............................................ 14
3.1.5 Frequency of common data measurement ........................................... 14
3.1.6 Change in common data scores ........................................................... 15
3.1.7 Date of most recent measurement and prompts ................................... 16
3.1.8 Improving common data scores ............................................................ 16
3.1.9 Reasons for non-measurement common data ...................................... 16
3.2 Conditional data .......................................................................................... 18
3.2.1 Qualitative findings on conditional data ................................................ 18
3.2.2 Conditional data measurement ............................................................. 18
3.2.3 Conditional data score .......................................................................... 20
3.2.4 Aspects of conditional data being measured ........................................ 21
3.2.5 Frequency of conditional data measurement ........................................ 22
3.2.6 Improving conditional data scores ........................................................ 23
3.2.7 Guidance for improving conditional data............................................... 24
3.2.8 Reasons for non-measurement of conditional data .............................. 24
3.2.9 Processes in place for those not measuring conditional data ............... 25
3.3 Trustee boards’ engagement with administration and record-keeping ........ 26
3.3.1 Qualitative findings on trustee-administrator engagement .................... 26
3.3.2 Attendance at trustee meetings ............................................................ 27
3.3.3 Reporting to the trustee board .............................................................. 27
3.3.4 Trustee engagement ............................................................................ 29
3.4 Service level agreements, data improvement activities and data security .. 31
3.4.1 Service Level Agreements (SLAs) ........................................................ 31
3.4.2 Qualitative findings on SLAs ................................................................. 31
3.4.3 Data improvement activities .................................................................. 32
3.4.4 Data security ......................................................................................... 33
3.5 Materials and guidance ............................................................................... 34
Appendix: Survey outcomes and response rate ................................................... 35
Record-keeping and administration research 2015/16 2
1 Executive summary
1.1 Introduction
This report summarises the results from the 2016 record-keeping survey conducted by The Pensions Regulator (TPR) among a sample of 497 scheme administrators, who provided data in relation to 532 occupational, trust-based pension schemes. The survey data was weighted and analysed in two ways: firstly, it was weighted to the membership profile of pension schemes to be representative of the member universe. Secondly it was weighted to the scheme profile to be representative of the scheme universe.
The main aim of the survey was to determine current standards of record-keeping performance and administration, comparing to findings from our previous record-keeping surveys. OMB Research, an independent market research agency, conducted the survey on TPR’s behalf. The survey fieldwork took place between January and March 2016.
The report also includes findings from qualitative research conducted with scheme trustees and administrators in 2015, which sought to understand in more detail how schemes approach and undertake scheme administration and record-keeping.
1.2 Record-keeping and administration
Record-keeping and administration are fundamental daily activities for any pension scheme and are relevant throughout a scheme’s lifecycle. Incomplete and inaccurate records can increase scheme costs and put member benefits at risk where errors relate to financial transactions, so trustees need to maintain accurate and complete membership data and records.
TPR expects schemes to manage record-keeping as part of their internal controls framework, to understand the risks (including potential costs) associated with poor data quality, and to take action to address this issue.
There are two types of data held in scheme member records that TPR’s record-keeping guidance refers to: common data and conditional data. Common data refers to data used to identify scheme members, such as name, address and National Insurance number. These data are applicable to all schemes. Conditional data is scheme-specific data needed to calculate member benefits, such as pensionable salary or contributions. While every scheme needs to measure some conditional data, the specific components vary between schemes, according to the scheme design.
1.3 Key findings
1.3.1 Consistent with the 2014 survey findings, the large majority (90%) of pension scheme members were in schemes where common data had been measured, while two-thirds were in schemes that achieved a common data score of at least 95%.
The large majority of pension scheme members were in schemes where common data had been measured (90%), while two-thirds (66%) of members were in schemes with a common data score of at least 95% (i.e. the scheme’s common data items were complete for at least 95% of members). Both these findings are statistically similar to the 2014 survey findings.
Administrators of DC schemes were less likely to have measured their scheme’s common data compared to administrators of DB and hybrid schemes, while in-house administrators were also less likely than external administrators to have measured it.
Record-keeping and administration research 2015/16 3
1.3.2 Micro and small schemes were much less likely than larger schemes to measure common data or achieve a score of 95% or more.
Analysing the findings by schemes reveals that 41% of schemes had measured their common data and 24% had achieved a score of 95% or higher. There was considerable variation by scheme size, with micro and small schemes less likely to have measured common data and to have achieved a common data score of 95%.
1.3.3 Conditional data measurement was also found to improve with scheme size, with some overall improvement since 2014 driven mainly by DB schemes and DC master trusts.
The majority of pension scheme members were in schemes where the conditional data had been measured (69%), an increase from 2014 (58%), owing to improvements among DB schemes and DC master trusts. Just over a third of members (36%) were in schemes with a conditional data score of at least 90% (i.e. the scheme’s conditional data items were complete for at least 90% of members), which is in line with the 2014 survey findings.
Analysis by schemes reveals better performance among large and medium than small and micro schemes, while DB and Hybrid schemes performed better than DC schemes.
1.3.4 Administrators’ understanding of the terms ‘common data’ and ‘conditional data’ was not universal. Conditional data was clearly seen as secondary to common data.
The qualitative research with administrators and trustees revealed that awareness of the terms ‘common data’ and ‘conditional data’ was far from widespread, particularly among participants from smaller schemes. The record-keeping survey found that 12% of scheme administrators did not know what common or conditional data was, the large majority belonging to micro and small schemes.
The qualitative research found that administrators and trustees often felt conditional data was secondary to common data, which was reinforced in the minds of some by the absence of target setting by TPR for conditional data.
1.3.5 Being a ‘low priority’ was cited by administrators as a key reason for not measuring common and conditional data, with trustees of micro schemes least likely to make record-keeping a high priority.
The record-keeping survey found that 40% of administrators who had not measured their scheme’s common data did not do so because it was ‘not a priority’. A similar proportion (39%) gave this reason for not measuring conditional data.
When asked how engaged trustees were with the scheme’s record-keeping and administration function, the administrators of micro schemes were least likely to rate record-keeping as a high priority for their trustees, compared to those administering small, medium or large schemes.
These findings reflect insight from the qualitative research, which found that many of the trustees spoken to treated administration and record-keeping as a lower priority than activities such as valuations and investments which they saw as being higher risk to members and more complex.
Trustees of micro and small DC schemes, who were in many cases focused on keeping the costs of administration and record-keeping low, often felt that their record-keeping standards were sufficient and appropriate for the needs of the scheme. In several cases, these trustees
Record-keeping and administration research 2015/16 4
also cited an increased workload resulting from new legislation and the changing pensions landscape as reasons for the sometimes limited focus on record-keeping.
1.3.6 Not being aware of TPR’s guidance on record-keeping and interest in this area was another commonly cited reason for failing to measure common and conditional data.
Lack of awareness of TPR’s guidance to measure common and conditional data was the other most mentioned reason for non-measurement; 45% of administrators who had not measured their scheme’s common data cited this as a reason, as did 36% who had not measured their conditional data.
Over a third of scheme administrators said they had not used any of TPR’s record-keeping materials, while half had used the record-keeping guidance document.
The qualitative research indicated that administrators and trustees of micro and small schemes were typically unaware of TPR’s expectations and interest in the area of record-keeping and administration.
1.3.7 In a notable number of cases administrators and trustees felt that the onus for keeping data complete was on members. Tracing efforts were often associated with scheme size and resourcing.
The qualitative research found that the perception of where responsibility should rest for finding missing data was contested. A number of trustees and administrators believed the onus should be almost completely on members to inform schemes when details change. The level of effort put in to tracing was often determined by the size and resourcing of schemes.
1.3.8 Trustees of large schemes tend to be kept regularly informed by administrators about record-keeping and administration. Administrators’ contact with trustees of small and micro schemes was typically minimal.
The record-keeping survey found that a majority of administrators attended trustee meetings at least annually (59%) and a similar proportion supplied stewardship reports to the trustee board at least annually (63%). Administrators to large schemes attended board meetings and supplied reports more regularly than smaller scheme administrators. Nearly all administrators (84%) have attended a trustee meeting or supplied a stewardship report.
1.3.9 Service level agreements (SLAs) were common in large schemes, rare in micro schemes, and three times more likely to be used with external rather than internal administrators.
Two fifths of scheme administrators had a service level agreement or scheme administration contract (SAC) in place with the trustee board (42%). Large schemes were considerably more likely to have an SLA in place compared to micro schemes, as were externally administered schemes compared to internally administered schemes.
The qualitative research found that trustees often felt SLAs provided reassurance and accountability to ensure administration and record-keeping standards were met. In some cases, however, trustees were comfortable having informal arrangements in place.
1.3.10 The scheme’s status (open or closed with deferred members), its systems and the extent to which the scheme utilised professional support also influenced the scheme’s record-keeping practices.
The qualitative research found that the trustees and administrators of the large schemes spoken to - often schemes with a large number of active members - gave more attention to
Record-keeping and administration research 2015/16 5
customer service and tended to exhibit higher standards of record-keeping. In contrast, schemes with a large proportion of deferred members or closed schemes inherited by an employer were among the schemes with limited input from pension professionals, with little investment put into scheme administration.
Well-resourced schemes with good access to professional advice were better equipped to embed and maintain good record-keeping practices, while also being more likely to utilise purpose built IT systems. In contrast, schemes with little or no input to administration from pension professionals and/or with poor IT systems (using multiple legacy or incompatible systems) were typically associated with low standards of record-keeping.
1.3.11 Specific projects undertaken by a scheme can lead to a greater focus on data quality.
The qualitative research also suggested that specific projects by a scheme can lead to an increased focus on data quality. Switching to a new administrator, Guaranteed Minimum Protection (GMP) reconciliation, planning for a buyout, moving the scheme to a bundled arrangement and communications campaigns to members were examples given of where data quality was enhanced by events in the life of the scheme.
Record-keeping and administration research 2015/16 6
2 Background and methodology
2.1 Background
Administration and record-keeping are fundamental daily activities for any pension scheme and are relevant throughout a scheme’s lifecycle. Incomplete and inaccurate records can lead to the incorrect payment of member benefits, and to increased costs at key events such as a scheme buy out in a DB scheme, or compounded investment errors in a DC scheme, which may then be absorbed by the employer or by members. Regardless of how the scheme is administered (either in-house, via an insurer or via a third-party administrator), in a trust-based scheme the trustees have ultimate responsibility and should therefore be closely monitoring record-keeping and administration activity within their schemes. Trustees, therefore, need to ensure that accurate and complete membership data and records are maintained. They should be confident that controls ensure data is accurately recorded, regularly reviewed and all data fields are complete. TPR first published guidance on record-keeping in 20101, in which the need for schemes to measure both the presence and the accuracy of common and conditional data items was identified2. Schemes should manage record-keeping as part of their internal controls framework, understand the risks (including potential costs) associated with poor data quality, and take action to address this issue. Trustees should identify and measure the presence of important data items, as outlined in the record-keeping guidance and take concrete steps to improve the quality of this data where this is necessary. In March 2014, TPR published a thematic review of record-keeping within trust-based occupational pension schemes, which focused on data. Areas of concern highlighted by the thematic review included a lack of action and risk assessment by trustees in schemes where the presence of common and conditional data was low, and a failure to have processes in place for regular and systematic reconciliation of member data. The thematic review drew on findings from the 2014 record-keeping survey3. The 2016 record-keeping survey and qualitative research conducted in 2015 were undertaken in order to understand in more detail the day-to-day practice of administration and record-keeping within schemes of all types and sizes, and to monitor any change in attitudes, action and performance since 2014.
2.2 Methodology
2.2.1 The 2016 record-keeping survey
The sample for this research was extracted from TPR’s database and consisted of DB, DC and hybrid trust-based schemes with 2 or more members. Micro schemes (with less than 12 members) were included for the first time in the 2016 survey but small self administered schemes (SSAS) and Executive Pension Plans (EPPs) were excluded.
1 http://www.thepensionsregulator.gov.uk/guidance/guidance-record-keeping.aspx
2 ‘Common data’ is data that should be present and accurate for all members of a scheme, such as a
member’s date of birth, date of retirement and National Insurance number. ‘Conditional data’ relates to how benefits are maintained and calculated and is specific to each scheme. 3 http://www.thepensionsregulator.gov.uk/docs/record-keeping-survey-2014.pdf
Record-keeping and administration research 2015/16 7
In total around 3,500 schemes were selected for possible interview, although a significant proportion of these were found to be ineligible (e.g. paid-up, SSAS, etc) or unusable (eg wrong number). The final survey response rate was 27%. A more detailed analysis of the survey outcomes and response rates by size and type of scheme can be found in Appendix A.
The administrators of all selected schemes were sent an introductory letter or email prior to being telephoned. This email explained the purpose of the research, provided reassurances about its bona fide and confidential nature and introduced OMB Research as an independent market research agency that had been appointed by TPR to conduct the survey.
Interviews took place between 15 January and 19 March 2016. In total, data was gathered about 532 schemes. 497 telephone interviews were completed, (lasting an average of 15 minutes). External administrators involved in the administration of multiple schemes were also asked to provide key information on up to 5 other schemes via an online follow-up survey. Twelve external administrators completed the online survey, providing briefer data on another 36 schemes.
Each respondent was asked about a pre-specified pension scheme, and to qualify for interview they had to be an administrator of that scheme. Further screening questions were included to ensure that schemes were active (ie not paid up, winding up or wound up), that they were private sector work-based schemes, and that they were not a SSAS.
All interviews were administered using CATI (Computer Assisted Telephone Interviewing) by a team of experienced business-to-business interviewers.
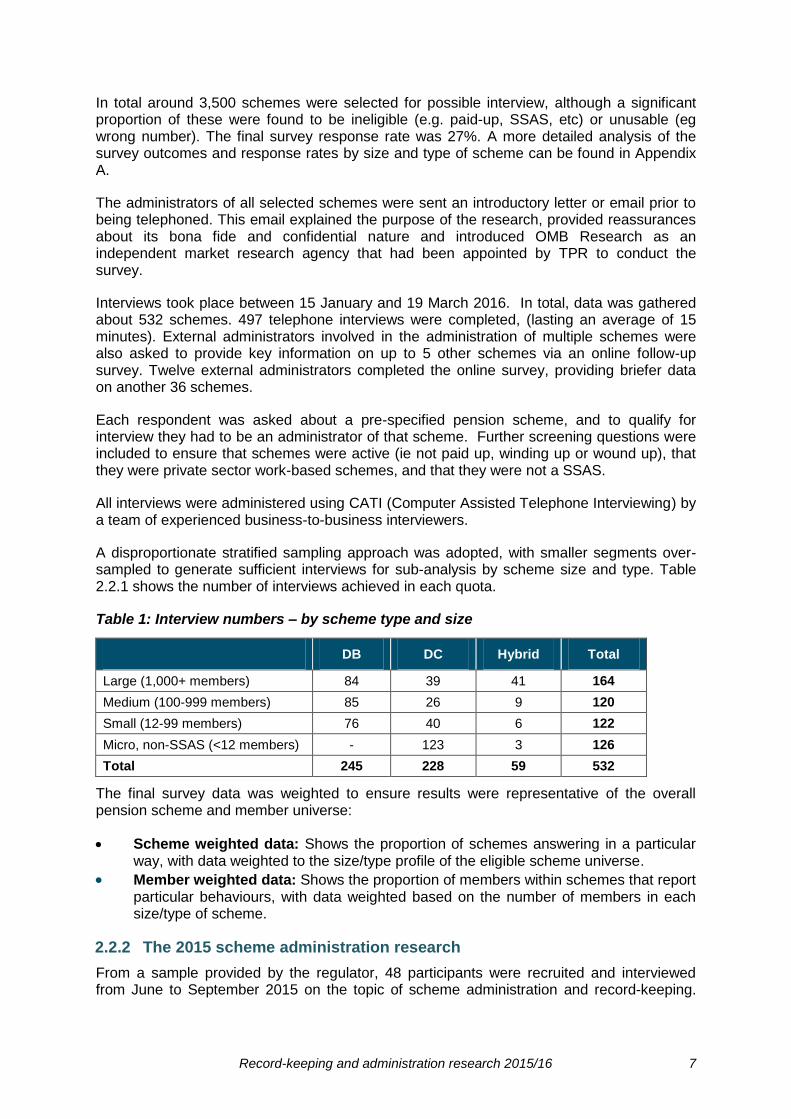
A disproportionate stratified sampling approach was adopted, with smaller segments over-sampled to generate sufficient interviews for sub-analysis by scheme size and type. Table 2.2.1 shows the number of interviews achieved in each quota.
Table 1: Interview numbers – by scheme type and size
DB DC Hybrid Total
Large (1,000+ members) 84 39 41 164
Medium (100-999 members) 85 26 9 120
Small (12-99 members) 76 40 6 122
Micro, non-SSAS (<12 members) - 123 3 126
Total 245 228 59 532
The final survey data was weighted to ensure results were representative of the overall pension scheme and member universe:
Scheme weighted data: Shows the proportion of schemes answering in a particular way, with data weighted to the size/type profile of the eligible scheme universe.
Member weighted data: Shows the proportion of members within schemes that report particular behaviours, with data weighted based on the number of members in each size/type of scheme.
2.2.2 The 2015 scheme administration research
From a sample provided by the regulator, 48 participants were recruited and interviewed from June to September 2015 on the topic of scheme administration and record-keeping.
Record-keeping and administration research 2015/16 8
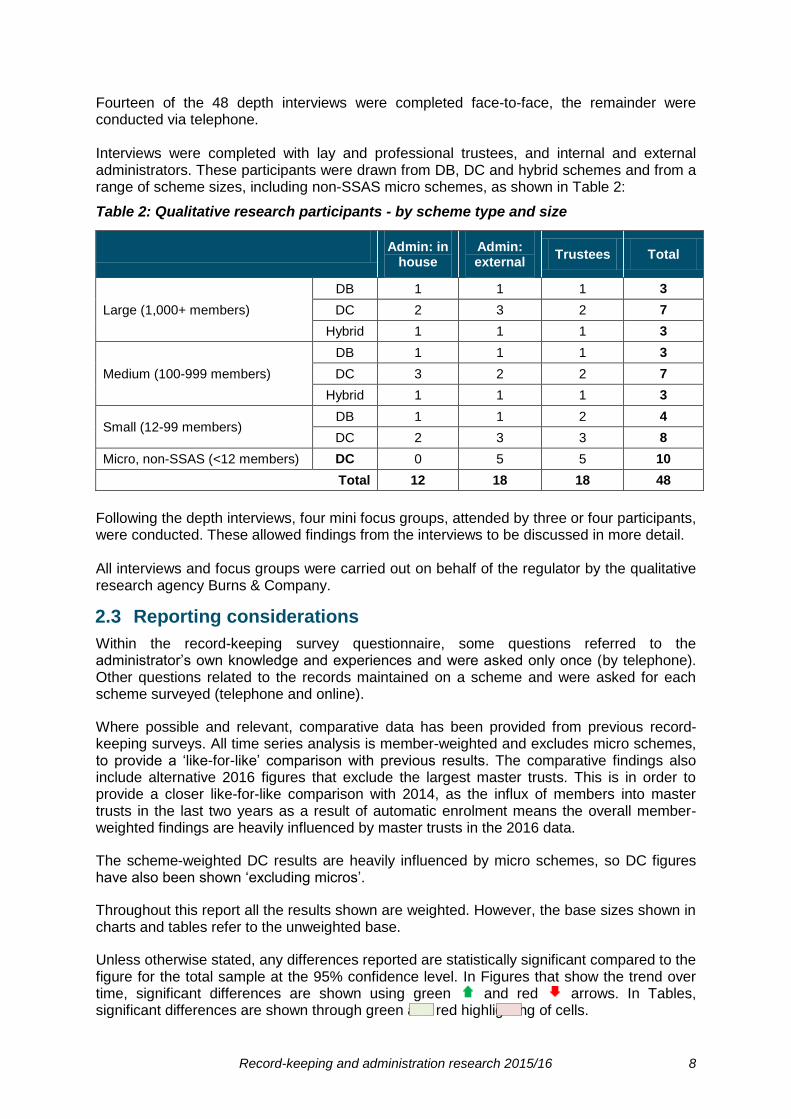
Fourteen of the 48 depth interviews were completed face-to-face, the remainder were conducted via telephone. Interviews were completed with lay and professional trustees, and internal and external administrators. These participants were drawn from DB, DC and hybrid schemes and from a range of scheme sizes, including non-SSAS micro schemes, as shown in Table 2:
Table 2: Qualitative research participants - by scheme type and size
Admin: in house
Admin: external
Trustees Total
Large (1,000+ members)
DB 1 1 1 3
DC 2 3 2 7
Hybrid 1 1 1 3
Medium (100-999 members)
DB 1 1 1 3
DC 3 2 2 7
Hybrid 1 1 1 3
Small (12-99 members) DB 1 1 2 4
DC 2 3 3 8
Micro, non-SSAS (<12 members) DC 0 5 5 10
Total 12 18 18 48
Following the depth interviews, four mini focus groups, attended by three or four participants, were conducted. These allowed findings from the interviews to be discussed in more detail. All interviews and focus groups were carried out on behalf of the regulator by the qualitative research agency Burns & Company.
2.3 Reporting considerations
Within the record-keeping survey questionnaire, some questions referred to the administrator’s own knowledge and experiences and were asked only once (by telephone). Other questions related to the records maintained on a scheme and were asked for each scheme surveyed (telephone and online).
Where possible and relevant, comparative data has been provided from previous record-keeping surveys. All time series analysis is member-weighted and excludes micro schemes, to provide a ‘like-for-like’ comparison with previous results. The comparative findings also include alternative 2016 figures that exclude the largest master trusts. This is in order to provide a closer like-for-like comparison with 2014, as the influx of members into master trusts in the last two years as a result of automatic enrolment means the overall member-weighted findings are heavily influenced by master trusts in the 2016 data.
The scheme-weighted DC results are heavily influenced by micro schemes, so DC figures have also been shown ‘excluding micros’.
Throughout this report all the results shown are weighted. However, the base sizes shown in charts and tables refer to the unweighted base.
Unless otherwise stated, any differences reported are statistically significant compared to the figure for the total sample at the 95% confidence level. In Figures that show the trend over time, significant differences are shown using green and red arrows. In Tables, significant differences are shown through green and red highlighting of cells.
Record-keeping and administration research 2015/16 9
Findings from the qualitative research are summarised at the start of the sub-sections in Chapter 3, where relevant. Verbatim quotes from the research are in italics.
2.4 Acknowledgements
This report was co-authored by TPR and OMB Research.
Record-keeping and administration research 2015/16 10
3 Main findings
This chapter includes detailed findings from the quantitative survey and a summary of findings from the qualitative research structured by the sub-sections in this chapter. The qualitative findings are at the beginning of each sub-section where relevant.
3.1 Common data
TPR’s record-keeping guidance refers to two types of data held in scheme member records: common data and conditional data. Common data refers to data used to identify scheme members, such as name, address and National Insurance number. These data are applicable to all schemes.
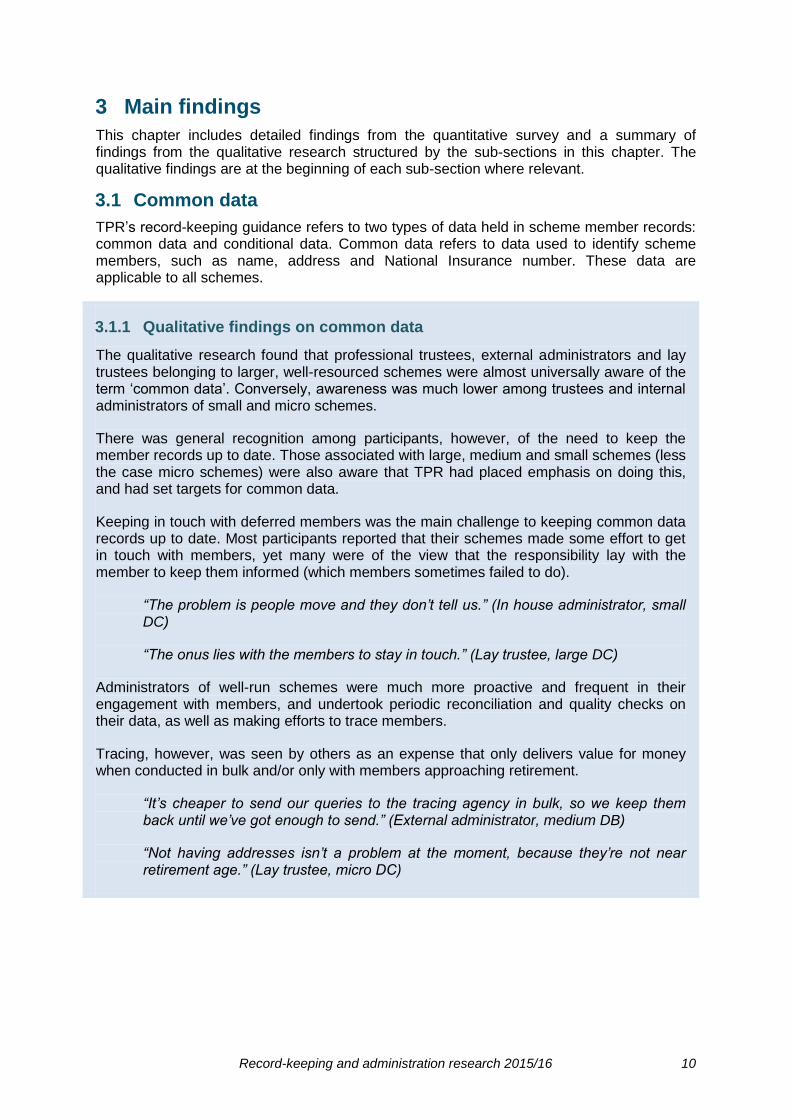
3.1.1 Qualitative findings on common data
The qualitative research found that professional trustees, external administrators and lay trustees belonging to larger, well-resourced schemes were almost universally aware of the term ‘common data’. Conversely, awareness was much lower among trustees and internal administrators of small and micro schemes.
There was general recognition among participants, however, of the need to keep the member records up to date. Those associated with large, medium and small schemes (less the case micro schemes) were also aware that TPR had placed emphasis on doing this, and had set targets for common data.
Keeping in touch with deferred members was the main challenge to keeping common data records up to date. Most participants reported that their schemes made some effort to get in touch with members, yet many were of the view that the responsibility lay with the member to keep them informed (which members sometimes failed to do).
“The problem is people move and they don’t tell us.” (In house administrator, small DC)
“The onus lies with the members to stay in touch.” (Lay trustee, large DC)
Administrators of well-run schemes were much more proactive and frequent in their engagement with members, and undertook periodic reconciliation and quality checks on their data, as well as making efforts to trace members.
Tracing, however, was seen by others as an expense that only delivers value for money when conducted in bulk and/or only with members approaching retirement.
“It’s cheaper to send our queries to the tracing agency in bulk, so we keep them back until we’ve got enough to send.” (External administrator, medium DB)
“Not having addresses isn’t a problem at the moment, because they’re not near retirement age.” (Lay trustee, micro DC)
Record-keeping and administration research 2015/16 11
3.1.2 Common data measurement
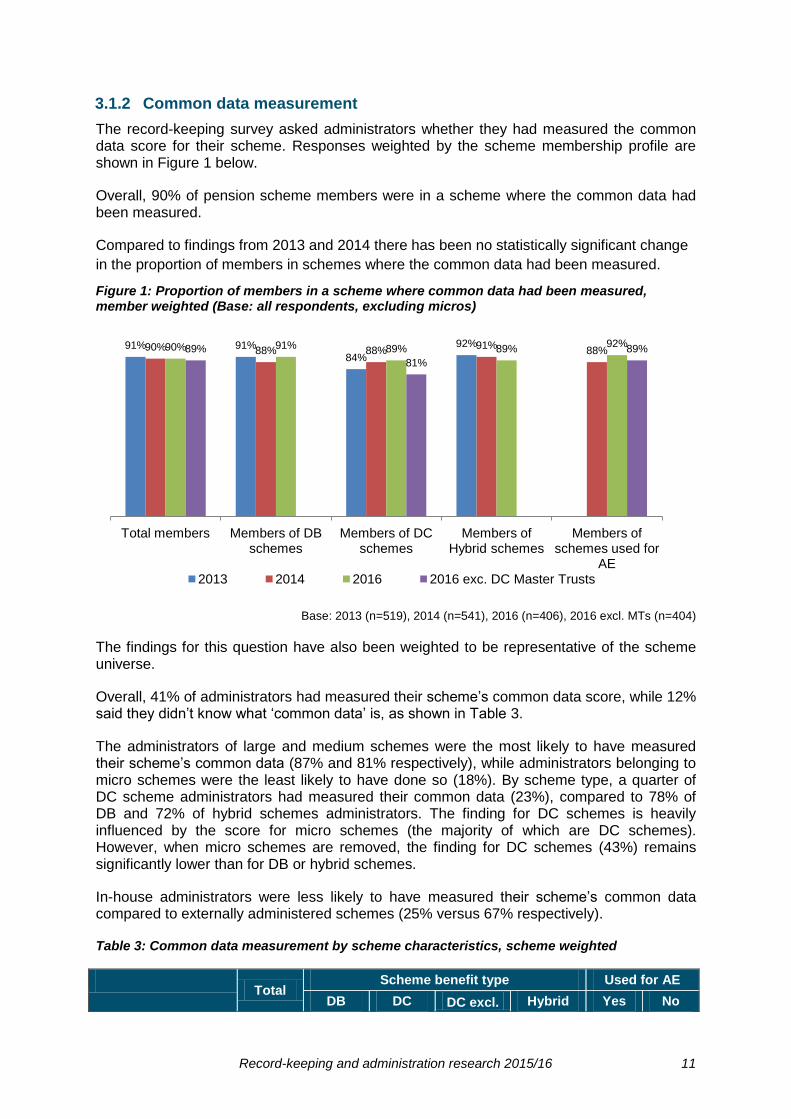
The record-keeping survey asked administrators whether they had measured the common data score for their scheme. Responses weighted by the scheme membership profile are shown in Figure 1 below.
Overall, 90% of pension scheme members were in a scheme where the common data had been measured.
Compared to findings from 2013 and 2014 there has been no statistically significant change
in the proportion of members in schemes where the common data had been measured.
Figure 1: Proportion of members in a scheme where common data had been measured, member weighted (Base: all respondents, excluding micros)
Base: 2013 (n=519), 2014 (n=541), 2016 (n=406), 2016 excl. MTs (n=404)
The findings for this question have also been weighted to be representative of the scheme universe.
Overall, 41% of administrators had measured their scheme’s common data score, while 12% said they didn’t know what ‘common data’ is, as shown in Table 3.
The administrators of large and medium schemes were the most likely to have measured their scheme’s common data (87% and 81% respectively), while administrators belonging to micro schemes were the least likely to have done so (18%). By scheme type, a quarter of DC scheme administrators had measured their common data (23%), compared to 78% of DB and 72% of hybrid schemes administrators. The finding for DC schemes is heavily influenced by the score for micro schemes (the majority of which are DC schemes). However, when micro schemes are removed, the finding for DC schemes (43%) remains significantly lower than for DB or hybrid schemes.
In-house administrators were less likely to have measured their scheme’s common data compared to externally administered schemes (25% versus 67% respectively).
Table 3: Common data measurement by scheme characteristics, scheme weighted
Total
Scheme benefit type Used for AE
DB DC DC excl. Hybrid Yes No
91% 91% 84%
92% 90% 88% 88% 91%
88% 90% 91% 89% 89% 92%
89%
81%
89%
Total members Members of DB schemes
Members of DC schemes
Members of Hybrid schemes
Members of schemes used for
AE 2013 2014 2016 2016 exc. DC Master Trusts

Record-keeping and administration research 2015/16 12
micro
Base: All respondents (incl. online) 532 245 228 105 59 169 349
Yes 41% 78% 23% 43% 72% 39% 41%
No – Have not measured ‘common data’
44% 18% 56% 41% 24% 37% 47%
No – Do not know what ‘common data’ is
12% 3% 17% 13% 0% 18% 10%
Don’t know 3% 1% 4% 3% 4% 7% 2%
Total
Scheme size Administrator
Micro Small Med Large In-
house Extern
al
Base: All respondents (incl. online) 532 126 122 120 164 240 292
Yes 41% 18% 50% 81% 87% 25% 67%
No – Have not measured ‘common data’
44% 60% 36% 16% 10% 54% 26%
No – Do not know what ‘common data’ is
12% 18% 12% 1% 1% 17% 5%
Don’t know 3% 4% 2% 1% 2% 4% 2%
3.1.3 Common data score
Administrators were asked about their scheme’s common data score the last time it was measured.
Two-thirds (66%) of members were in a scheme with a common data score of at least 95%, as shown in Figure 2.
Although there appears to be some evidence of common data scores improving over time, the apparent differences at the total level are not statistically significant. There is a significant increase from 2014 to 2016 in the proportion of DC schemes with a common data score of 95%+, which is driven by master trusts. Excluding master trusts from the DC finding indicates no statistically significant increase.
Figure 2: Proportion of members in a scheme with a common data score of 95%+, member weighted (Base: all respondents, excluding micros)

Record-keeping and administration research 2015/16 13
Base: 2013 (n=519), 2014 (n=541), 2016 (n=406), 2016 excl. MTs (n=404)
When weighted by scheme profile, a quarter (24%) of schemes achieved a score of 95% or more, as shown in Table 4.
This result was pulled down by DC scheme administrators (77% of which had never measured their common data or were unable to say whether they had measured it, 57% when micro DC schemes are excluded). Medium and large schemes were most likely to have achieved a score of 95% or more (58% and 62% respectively). Performance was also better among externally administered schemes, with 43% attaining a score of 95% or more, compared to 12% of in-house administered schemes.
Table 4: Common data score by scheme characteristics, scheme weighted
Total
Benefit type Used for AE
DB DC DC excl.
micro Hybrid Yes No
Base: All respondents 532 245 228 105 59 169 349
95 – 100% 24% 55% 8% 21% 45% 25% 24%
91 – 94% 3% 8% 1% 2% 12% 2% 4%
Up to 90% 8% 7% 8% 8% 11% 4% 9%
Measured but don't know score
6% 8% 6% 13% 4% 8% 5%
Not measured 59% 22% 77% 57% 28% 61% 59%
Total
Scheme size Administrator
Micro Small Med Large In-
house Extern
al
Base: All respondents 532 126 122 120 164 240 292
95 – 100% 24% 6% 27% 58% 62% 12% 43%
91 – 94% 3% 1% 5% 6% 11% 1% 7%
Up to 90% 8% 7% 7% 9% 8% 7% 9%
57% 56%
47%
59% 63%
68%
55% 57% 60%
67% 64%
76%
62%
71%
63% 60%
64%
Total members Members of DB schemes
Members of DC schemes
Members of Hybrid schemes
Members of schemes used for
AE
2013 2014 2016 2016 exc. DC Master Trusts

Record-keeping and administration research 2015/16 14
Measured but don't know score
6% 4% 11% 8% 6% 6% 7%
Not measured 59% 82% 50% 19% 13% 75% 33%
3.1.4 Aspects of common data being measured
Administrators who had measured the common data score for their scheme were asked whether this related to the presence of this data, the accuracy, or both.
Of the members in schemes where the common data had been measured, the majority were in schemes where administrators had measured both the presence and accuracy of the common data (77%), while 22% were in schemes where administrators had measured only the presence of data.
Compared to the 2014 survey, the proportion of members in schemes where the presence and accuracy of common data had been measured has increased for all scheme types and those used for AE, as shown in Figure 3.
Figure 3: Proportion of members in a scheme where the presence and accuracy of common data had been measured, member weighted (Base: respondents who had measured their scheme’s common data, excluding micros)
Base: 2014 (n=320), 2016 (n=284), 2016 excl. MTs (n=282)
When weighting responses by scheme profile, 82% of scheme administrators measuring common data had assessed both the presence and accuracy of this data. This was particularly true of schemes used for AE (90% had measured both, compared to 79% among schemes not used for AE).
3.1.5 Frequency of common data measurement
Administrators who measured their scheme’s common data were asked about the frequency with which they measure it.
Of the members in schemes where the common data had been measured, over three quarters (78%) were in schemes where it was measured at least annually, and a fifth (20%) were in schemes where it was measured at least quarterly.
62% 68% 69%
54%
64%
77% 78%
65%
87%
77% 82%
89% 88%
Total members Members of DB schemes
Members of DC schemes
Members of Hybrid schemes
Members of schemes used for
AE 2014 2016 2016 exc. DC Master Trusts
Record-keeping and administration research 2015/16 15
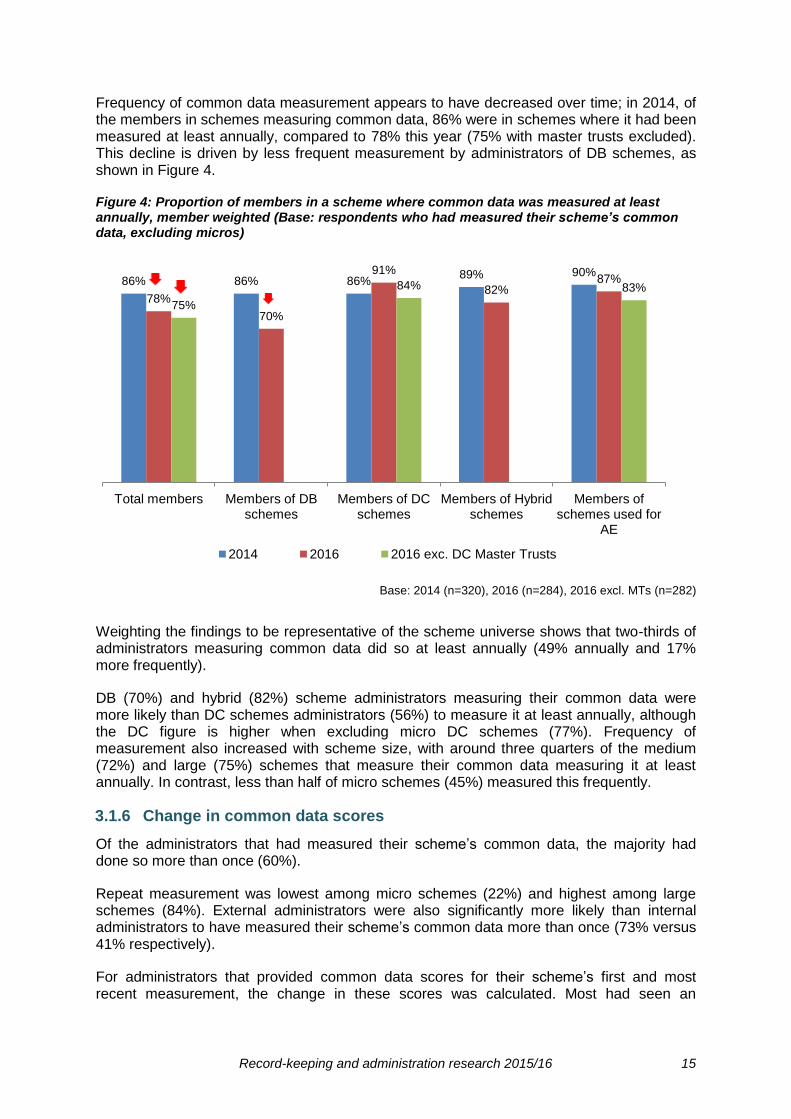
Frequency of common data measurement appears to have decreased over time; in 2014, of the members in schemes measuring common data, 86% were in schemes where it had been measured at least annually, compared to 78% this year (75% with master trusts excluded). This decline is driven by less frequent measurement by administrators of DB schemes, as shown in Figure 4.
Figure 4: Proportion of members in a scheme where common data was measured at least annually, member weighted (Base: respondents who had measured their scheme’s common data, excluding micros)
Base: 2014 (n=320), 2016 (n=284), 2016 excl. MTs (n=282)
Weighting the findings to be representative of the scheme universe shows that two-thirds of administrators measuring common data did so at least annually (49% annually and 17% more frequently).
DB (70%) and hybrid (82%) scheme administrators measuring their common data were more likely than DC schemes administrators (56%) to measure it at least annually, although the DC figure is higher when excluding micro DC schemes (77%). Frequency of measurement also increased with scheme size, with around three quarters of the medium (72%) and large (75%) schemes that measure their common data measuring it at least annually. In contrast, less than half of micro schemes (45%) measured this frequently.
3.1.6 Change in common data scores
Of the administrators that had measured their scheme’s common data, the majority had done so more than once (60%).
Repeat measurement was lowest among micro schemes (22%) and highest among large schemes (84%). External administrators were also significantly more likely than internal administrators to have measured their scheme’s common data more than once (73% versus 41% respectively).
For administrators that provided common data scores for their scheme’s first and most recent measurement, the change in these scores was calculated. Most had seen an
86% 86% 86% 89% 90%
78%
70%
91%
82% 87%
75%
84% 83%
Total members Members of DB schemes
Members of DC schemes
Members of Hybrid schemes
Members of schemes used for
AE
2014 2016 2016 exc. DC Master Trusts
Record-keeping and administration research 2015/16 16
improvement (58%), with just 5% reporting that their score had fallen over time. For 37% of schemes the score remained the same.
A quarter of DC schemes that had measured their common data score at least twice witnessed an increase in the score (25%) since the first measurement, which was ten percentage points higher when excluding micro DC schemes (35%). In comparison, hybrid schemes showed the most improvement, with 86% of schemes increasing their scores, while 64% of DB schemes had improved.
Externally administered schemes were more likely to have improved their score compared to internally administered schemes (64% versus 42% respectively).
3.1.7 Date of most recent measurement and prompts
Administrators who had measured their common data more than once were asked about the date and reason for the most recent measurement of the scheme’s common data.
Of these administrators, over half (54%) had measured their scheme’s score in the last 6 months, with two in five having measured it in the last three months (41%). One in seven administrators (16%) had last measured their scheme’s common data between 1 and 3 years ago.
When asked what prompted them to undertake the most recent measurement, the majority (77%) of these administrators said they treated it as a routine task, which was either required (33%) or not required (44%) as part of a SAC or SLA. One in ten (9%) administrators mentioned automatic enrolment as a prompt and a further 6% mentioned GMP reconciliation.
3.1.8 Improving common data scores
Administrators of schemes with a common data score below 95% were asked what item(s) would make the most difference to this score.
Nearly two-thirds of these administrators mentioned address, and over half mentioned postcode (53%) as items where improvement would make the biggest difference. The next most mentioned was expected retirement/maturity date (45%), while around a third of administrators mentioned NI numbers (33%), policy start date (33%) and/or membership status (31%).
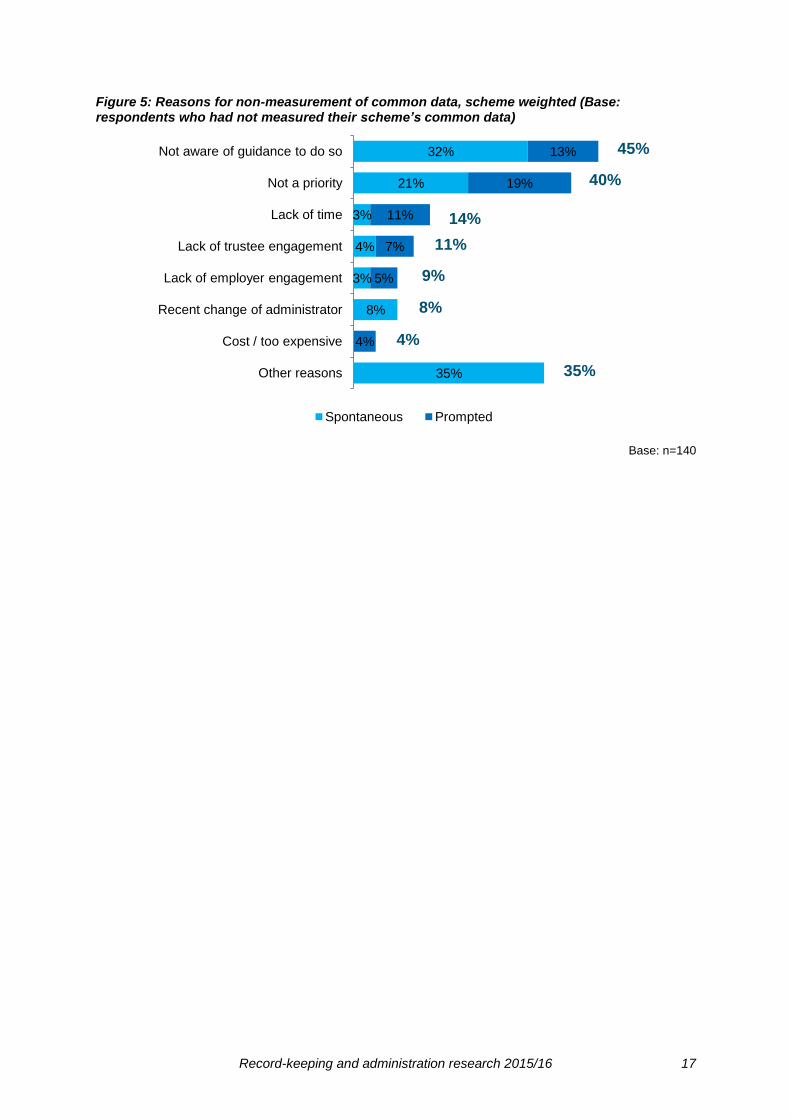
3.1.9 Reasons for non-measurement common data
Administrators that had not measured their scheme’s common data were asked the reasons for this. The top mentions – which were provided on both a spontaneous and prompted basis – are shown in Figure 5 below, weighted by scheme profile.
Just under half (45%) of these administrators mentioned a lack of knowledge of the guidance/requirements as a barrier to common data measurement, although this proportion was much lower among administrators of large schemes (3%).
External administrators were less likely than internal administrators to lack awareness of guidance/requirements to measure common data (28%) but were more likely to be restrained by a recent change of administrator (24%) or cost restrictions (17%).
Overall, two fifths of administrators (40%) perceived common data measurement to have low importance.
Record-keeping and administration research 2015/16 17
Figure 5: Reasons for non-measurement of common data, scheme weighted (Base: respondents who had not measured their scheme’s common data)
Base: n=140
32%
21%
3%
4%
3%
8%
35%
13%
19%
11%
7%
5%
4%
Not aware of guidance to do so
Not a priority
Lack of time
Lack of trustee engagement
Lack of employer engagement
Recent change of administrator
Cost / too expensive
Other reasons
Spontaneous Prompted
45%
40%
14%
11%
9%
8%
4%
35%
Record-keeping and administration research 2015/16 18
3.2 Conditional data
Conditional data is scheme-specific data needed to calculate member benefits, such as pensionable salary or contributions. While every scheme will need to measure some conditional data, the fields of conditional data will vary from scheme to scheme.
3.2.1 Qualitative findings on conditional data
Interviews with administrators and trustees of larger schemes found they were generally aware of conditional data, and tended to take proactive steps to measure it on a frequent basis.
“We measure common and conditional data, we run it off our admin system for each trustee meeting. It’s in the regulator’s code of practice. I’d like to think we’re good.” (In house administrator, large DB)
However, due to the nature of conditional data, varying as it does from scheme to scheme and constituted by several factors, TPR is not in a position to produce a data specification covering all possible circumstances. As such, unlike with common data, where TPR has recommended standard targets for data completeness, TPR has not set targets for conditional data. This was cited as a reason for the lesser focus on conditional data by some scheme trustees and administrator, with terms such as ‘optional’ and ‘secondary’ used to describe the attention given to it.
“The regulator doesn’t yet have a target on conditional data, so it hasn’t had the same focus.” (External administrator, medium DC)
“We’ve never been asked for our conditional data score.” (External administrator, medium DB)
The greater complexity of conditional data, as opposed to common data, meant it was harder to keep up to date and accurate, according to several participants. A number of participants pointed to the fact that different items of conditional data may be held by different parties (eg payroll, HR, administrator, insurer, actuary).
Therefore, several participants attested to not measuring or checking routinely conditional data in the same way as carried out for common data. Events in the life of a member (eg member takes benefits, transfers out) or of the scheme (eg change of administrator, wind-up, GMP reconciliation) were often seen to be the trigger for data reconciliation and checking, and it was felt that any errors would be picked up through this process (by actuaries, administrators or auditors).
“This is information that you don’t really need now.” (Professional trustee, small DC)
Well-resourced schemes, however, often had a programme of conditional data improvement in place, such as data checking (including spot checks), correspondence with members and cross-checking with other data sources.
3.2.2 Conditional data measurement
When weighted to the scheme membership profile, the record-keeping survey found that over two-thirds of members (69%) were in schemes where the conditional data had been measured.
Record-keeping and administration research 2015/16 19
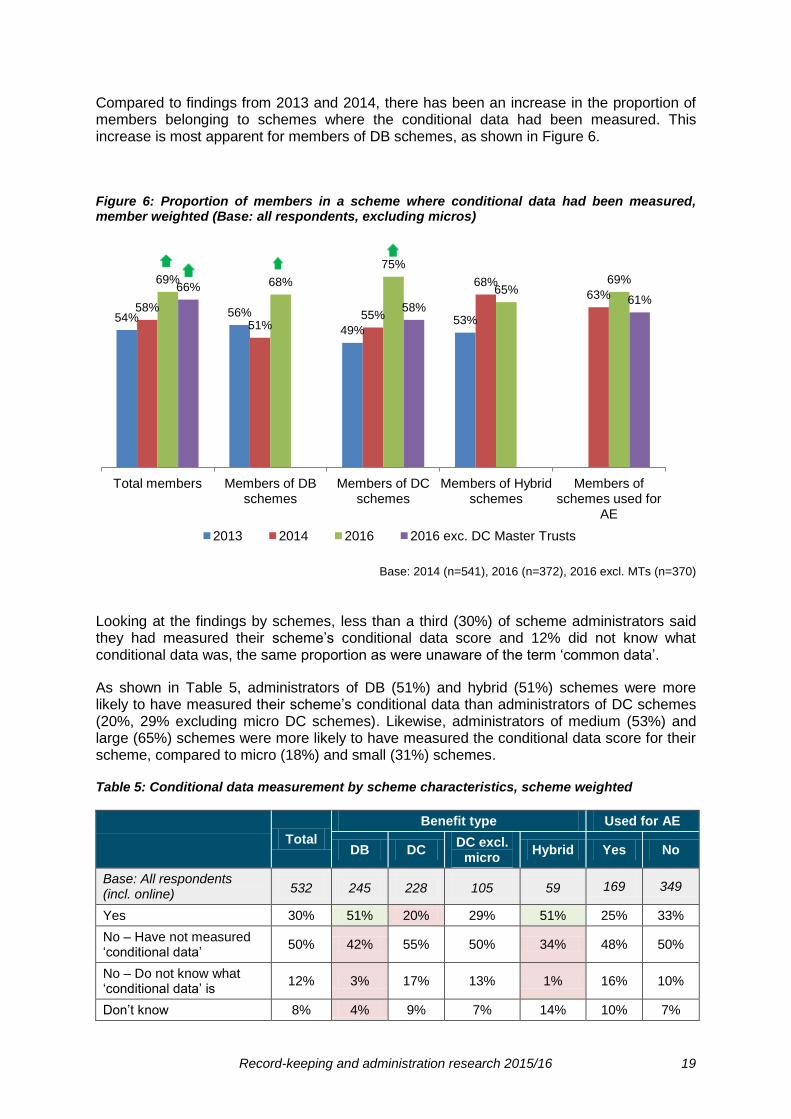
Compared to findings from 2013 and 2014, there has been an increase in the proportion of members belonging to schemes where the conditional data had been measured. This increase is most apparent for members of DB schemes, as shown in Figure 6.
Figure 6: Proportion of members in a scheme where conditional data had been measured, member weighted (Base: all respondents, excluding micros)
Base: 2014 (n=541), 2016 (n=372), 2016 excl. MTs (n=370)
Looking at the findings by schemes, less than a third (30%) of scheme administrators said they had measured their scheme’s conditional data score and 12% did not know what conditional data was, the same proportion as were unaware of the term ‘common data’.
As shown in Table 5, administrators of DB (51%) and hybrid (51%) schemes were more likely to have measured their scheme’s conditional data than administrators of DC schemes (20%, 29% excluding micro DC schemes). Likewise, administrators of medium (53%) and large (65%) schemes were more likely to have measured the conditional data score for their scheme, compared to micro (18%) and small (31%) schemes.
Table 5: Conditional data measurement by scheme characteristics, scheme weighted
Total
Benefit type Used for AE
DB DC DC excl.
micro Hybrid Yes No
Base: All respondents (incl. online) 532 245 228 105 59 169 349
Yes 30% 51% 20% 29% 51% 25% 33%
No – Have not measured ‘conditional data’
50% 42% 55% 50% 34% 48% 50%
No – Do not know what ‘conditional data’ is
12% 3% 17% 13% 1% 16% 10%
Don’t know 8% 4% 9% 7% 14% 10% 7%
54% 56%
49% 53%
58%
51% 55%
68% 63%
69% 68%
75%
65% 69%
66%
58% 61%
Total members Members of DB schemes
Members of DC schemes
Members of Hybrid schemes
Members of schemes used for
AE
2013 2014 2016 2016 exc. DC Master Trusts
Record-keeping and administration research 2015/16 20
Total
Scheme size Administrator
Micro Small Med Large In-
house Extern
al
Base: All respondents (incl. online) 532 126 122 120 164 240 292
Yes 30% 18% 31% 53% 65% 21% 46%
No – Have not measured ‘conditional data’
50% 56% 49% 41% 31% 53% 45%
No – Do not know what ‘conditional data’ is
12% 17% 11% 2% 2% 18% 3%
Don’t know 8% 9% 9% 3% 3% 9% 6%
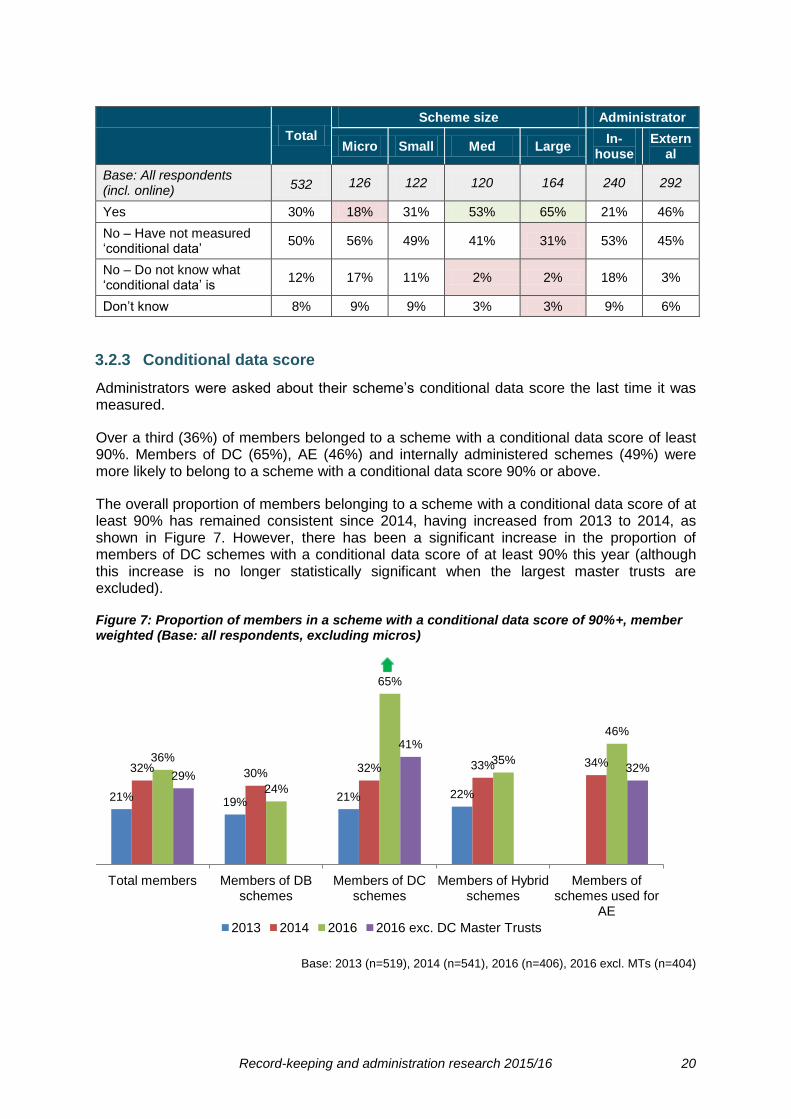
3.2.3 Conditional data score
Administrators were asked about their scheme’s conditional data score the last time it was measured.
Over a third (36%) of members belonged to a scheme with a conditional data score of least 90%. Members of DC (65%), AE (46%) and internally administered schemes (49%) were more likely to belong to a scheme with a conditional data score 90% or above.
The overall proportion of members belonging to a scheme with a conditional data score of at least 90% has remained consistent since 2014, having increased from 2013 to 2014, as shown in Figure 7. However, there has been a significant increase in the proportion of members of DC schemes with a conditional data score of at least 90% this year (although this increase is no longer statistically significant when the largest master trusts are excluded).
Figure 7: Proportion of members in a scheme with a conditional data score of 90%+, member weighted (Base: all respondents, excluding micros)
Base: 2013 (n=519), 2014 (n=541), 2016 (n=406), 2016 excl. MTs (n=404)
21% 19% 21% 22%
32% 30% 32% 33% 34% 36%
24%
65%
35%
46%
29%
41%
32%
Total members Members of DB schemes
Members of DC schemes
Members of Hybrid schemes
Members of schemes used for
AE
2013 2014 2016 2016 exc. DC Master Trusts
Record-keeping and administration research 2015/16 21
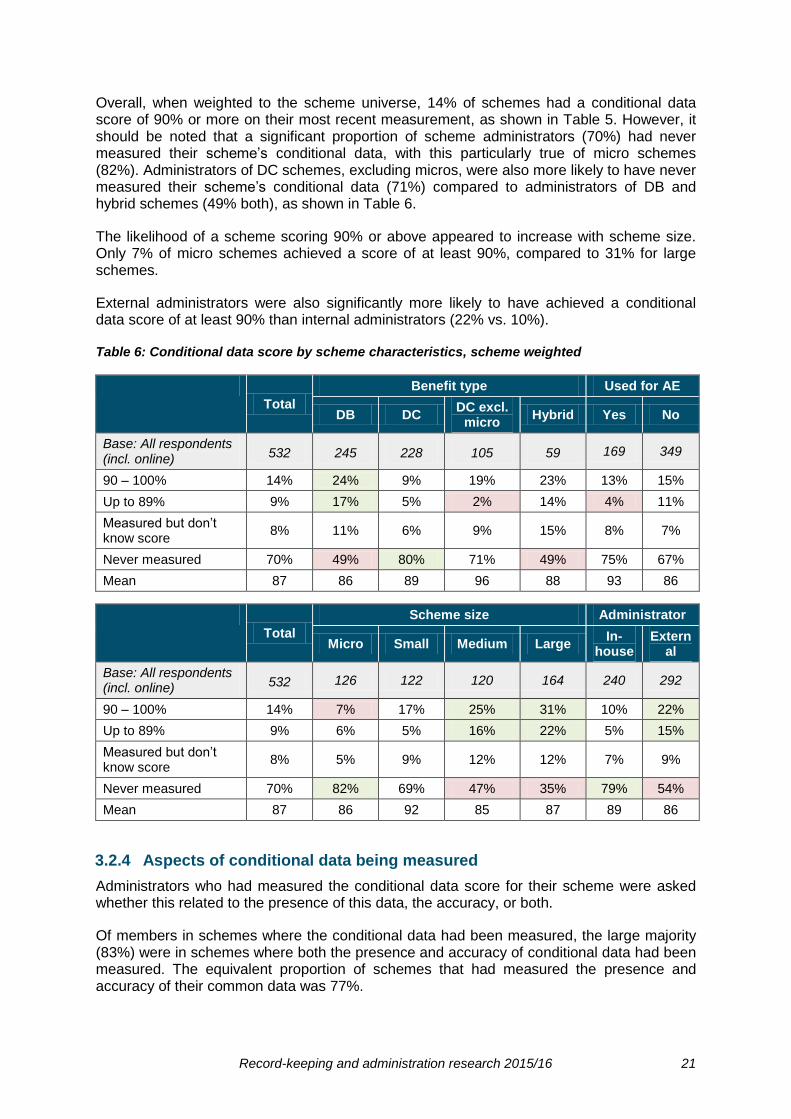
Overall, when weighted to the scheme universe, 14% of schemes had a conditional data score of 90% or more on their most recent measurement, as shown in Table 5. However, it should be noted that a significant proportion of scheme administrators (70%) had never measured their scheme’s conditional data, with this particularly true of micro schemes (82%). Administrators of DC schemes, excluding micros, were also more likely to have never measured their scheme’s conditional data (71%) compared to administrators of DB and hybrid schemes (49% both), as shown in Table 6.
The likelihood of a scheme scoring 90% or above appeared to increase with scheme size. Only 7% of micro schemes achieved a score of at least 90%, compared to 31% for large schemes.
External administrators were also significantly more likely to have achieved a conditional data score of at least 90% than internal administrators (22% vs. 10%).
Table 6: Conditional data score by scheme characteristics, scheme weighted
Total
Benefit type Used for AE
DB DC DC excl.
micro Hybrid Yes No
Base: All respondents (incl. online) 532 245 228 105 59 169 349
90 – 100% 14% 24% 9% 19% 23% 13% 15%
Up to 89% 9% 17% 5% 2% 14% 4% 11%
Measured but don’t know score
8% 11% 6% 9% 15% 8% 7%
Never measured 70% 49% 80% 71% 49% 75% 67%
Mean 87 86 89 96 88 93 86
Total
Scheme size Administrator
Micro Small Medium Large In-
house Extern
al
Base: All respondents (incl. online) 532 126 122 120 164 240 292
90 – 100% 14% 7% 17% 25% 31% 10% 22%
Up to 89% 9% 6% 5% 16% 22% 5% 15%
Measured but don’t know score
8% 5% 9% 12% 12% 7% 9%
Never measured 70% 82% 69% 47% 35% 79% 54%
Mean 87 86 92 85 87 89 86
3.2.4 Aspects of conditional data being measured
Administrators who had measured the conditional data score for their scheme were asked whether this related to the presence of this data, the accuracy, or both.
Of members in schemes where the conditional data had been measured, the large majority (83%) were in schemes where both the presence and accuracy of conditional data had been measured. The equivalent proportion of schemes that had measured the presence and accuracy of their common data was 77%.
Record-keeping and administration research 2015/16 22
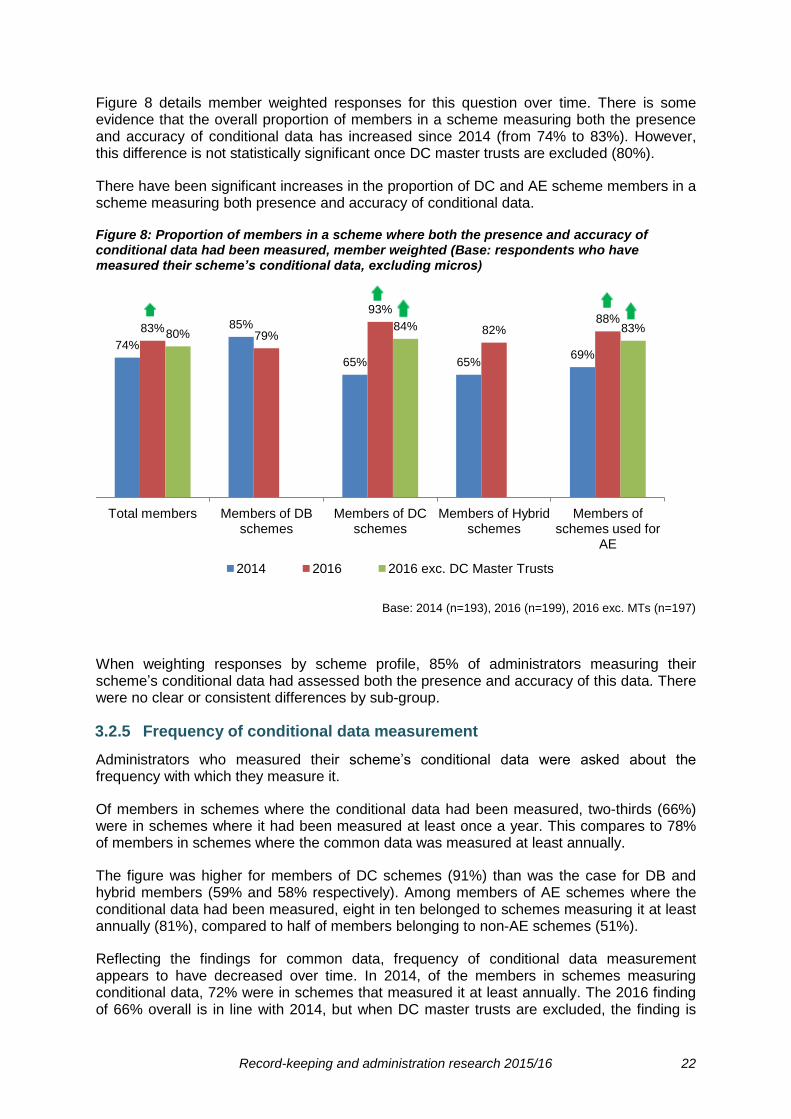
Figure 8 details member weighted responses for this question over time. There is some evidence that the overall proportion of members in a scheme measuring both the presence and accuracy of conditional data has increased since 2014 (from 74% to 83%). However, this difference is not statistically significant once DC master trusts are excluded (80%).
There have been significant increases in the proportion of DC and AE scheme members in a scheme measuring both presence and accuracy of conditional data.
Figure 8: Proportion of members in a scheme where both the presence and accuracy of conditional data had been measured, member weighted (Base: respondents who have measured their scheme’s conditional data, excluding micros)
Base: 2014 (n=193), 2016 (n=199), 2016 exc. MTs (n=197)
When weighting responses by scheme profile, 85% of administrators measuring their scheme’s conditional data had assessed both the presence and accuracy of this data. There were no clear or consistent differences by sub-group.
3.2.5 Frequency of conditional data measurement
Administrators who measured their scheme’s conditional data were asked about the frequency with which they measure it.
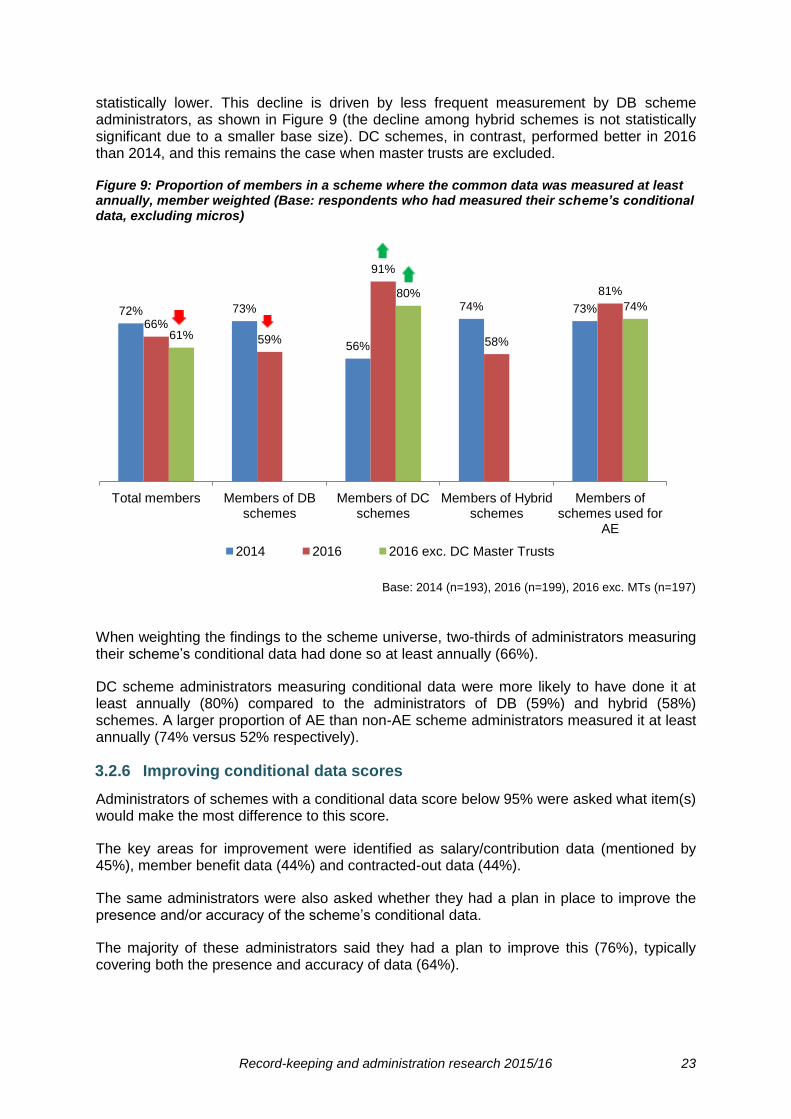
Of members in schemes where the conditional data had been measured, two-thirds (66%) were in schemes where it had been measured at least once a year. This compares to 78% of members in schemes where the common data was measured at least annually.
The figure was higher for members of DC schemes (91%) than was the case for DB and hybrid members (59% and 58% respectively). Among members of AE schemes where the conditional data had been measured, eight in ten belonged to schemes measuring it at least annually (81%), compared to half of members belonging to non-AE schemes (51%).
Reflecting the findings for common data, frequency of conditional data measurement appears to have decreased over time. In 2014, of the members in schemes measuring conditional data, 72% were in schemes that measured it at least annually. The 2016 finding of 66% overall is in line with 2014, but when DC master trusts are excluded, the finding is
74%
85%
65% 65% 69%
83% 79%
93%
82% 88%
80% 84% 83%
Total members Members of DB schemes
Members of DC schemes
Members of Hybrid schemes
Members of schemes used for
AE
2014 2016 2016 exc. DC Master Trusts
Record-keeping and administration research 2015/16 23
statistically lower. This decline is driven by less frequent measurement by DB scheme administrators, as shown in Figure 9 (the decline among hybrid schemes is not statistically significant due to a smaller base size). DC schemes, in contrast, performed better in 2016 than 2014, and this remains the case when master trusts are excluded.
Figure 9: Proportion of members in a scheme where the common data was measured at least annually, member weighted (Base: respondents who had measured their scheme’s conditional data, excluding micros)
Base: 2014 (n=193), 2016 (n=199), 2016 exc. MTs (n=197)
When weighting the findings to the scheme universe, two-thirds of administrators measuring their scheme’s conditional data had done so at least annually (66%).
DC scheme administrators measuring conditional data were more likely to have done it at least annually (80%) compared to the administrators of DB (59%) and hybrid (58%) schemes. A larger proportion of AE than non-AE scheme administrators measured it at least annually (74% versus 52% respectively).
3.2.6 Improving conditional data scores
Administrators of schemes with a conditional data score below 95% were asked what item(s) would make the most difference to this score.
The key areas for improvement were identified as salary/contribution data (mentioned by 45%), member benefit data (44%) and contracted-out data (44%).
The same administrators were also asked whether they had a plan in place to improve the presence and/or accuracy of the scheme’s conditional data.
The majority of these administrators said they had a plan to improve this (76%), typically covering both the presence and accuracy of data (64%).
72% 73%
56%
74% 73%
66%
59%
91%
58%
81%
61%
80% 74%
Total members Members of DB schemes
Members of DC schemes
Members of Hybrid schemes
Members of schemes used for
AE
2014 2016 2016 exc. DC Master Trusts

Record-keeping and administration research 2015/16 24
Those with a plan for improvement were then asked when they expected these improvements to be completed. Most anticipated it being this year (62%), a quarter (23%) said 2017 and 12% said 2018 or later.
3.2.7 Guidance for improving conditional data
Administrators were asked what type of guidance from TPR would be most useful and effective in improving standards of conditional data.
Most were unsure as to what additional guidance would be valuable (63%). The top specific mentions were to simplify the guidance (7%) and to set targets, deadlines or benchmarks (6%).
Administrators of DB (14%), medium (16%) and large (11%) schemes, as well as external administrators (12%) were most likely to suggest setting more targets or deadlines for conditional data.
3.2.8 Reasons for non-measurement of conditional data
Administrators of schemes that had never formally measured their conditional data were asked to outline the reasons for this. The top mentions – which were provided on both a spontaneous and prompted basis – are outlined in Figure 10 below.
Two fifths (39%) of administrators felt the measurement of conditional data was not a priority for their scheme and a similar proportion (36%) of schemes were not aware of the guidance to measure the conditional data score. These were also the two most mentioned reasons among administrators not measuring their scheme’s common data.
Administrators of micro schemes (44%) and in-house administrators (44%) were most likely to say that they were not aware of the guidance.
Figure 10: Reasons for non-measurement of conditional data, scheme weighted (Base: respondents who had not measured their scheme’s conditional data)
Base: n=209
22%
31%
6%
8%
6%
5%
6%
7%
30%
17%
5%
16%
6%
6%
5%
3%
Not a priority
Not aware of guidance to do so
No specific targets set by TPR
Lack of time
Lack of trustee engagement
Lack of employer engagement
Cost / too expensive
Recent change of administrator
Other reasons
Spontaneous Prompted
39%
36%
21%
15%
13%
10%
10%
7%
30%
Record-keeping and administration research 2015/16 25
3.2.9 Processes in place for those not measuring conditional data
Administrators of schemes that had not yet undertaken any measurements of conditional data (equating to 70% of schemes) were asked whether there were processes in place, or processes planned, to measure it.
Reflecting the findings above that indicate a lack of priority and/or awareness of the guidance to do so, the large majority (80%) of those not measuring had no plans to do so in future. One in ten (10%) had processes already in place to measure it, while the remainder had processes planned (planned and on track: 5%; planned but delayed: 2%).
Administrators of large schemes were comparatively more likely to have processes in place/planned to start measuring their conditional data scores (52%). In contrast, 8% of micro scheme administrators that had not measured their conditional data had a plan/process to do so.
Of those with processes already in place or who planned to measure their scheme’s conditional data score in future, the vast majority (93%) were going to place a focus on both the presence and accuracy of this data, with the remainder (7%) focusing only on data presence.
These administrators were also asked when they expected to complete the first assessment of conditional data. Two-thirds (67%) anticipated doing so this year (2016), 19% said 2017 and 2% said 2018 or later.
Record-keeping and administration research 2015/16 26
3.3 Trustee boards’ engagement with administration and record-keeping
3.3.1 Qualitative findings on trustee-administrator engagement
Trustees who took part in the qualitative research were generally found to be less engaged with administration than other aspects of their duties. Specifically, valuations and investments were viewed by trustees as complex and likely to pose greater risks to good outcomes for members and so more deserving of attention. Administration, in contrast, tended to be viewed as a day-to-day, technical function that could be outsourced or delegated. As a result, trustees often approached administration in a passive way, with attention only being paid to it when issues arose or special projects or events necessitated greater trustee involvement (e.g. switching administrators, GMP reconciliation).
“The main priority of the trustees is investment performance.” (Lay trustee, large DC)
“This [investment performance] is what keeps trustees awake at night. They far outweigh administration in terms of risk and responsibility.” (External administrator)
“It’s one of those services that if it’s working OK then it’s fine. If there’s no noise from it, then trustees are happy.” (External administrator)
“They take administration for granted, and not much time is given to it.” (In house administrator, medium DC)
However, the trustees of larger schemes, which were often better-resourced, were quick to acknowledge the importance of good and robust administration and record-keeping, and the need to ensure the scheme administration function was properly equipped to achieve this.
“It’s the basis of everything. Without good records, everything else falls apart.” (Professional trustee)
This was evidenced in various ways, such as through the use of sub-committees to which administrators were required to report in detail, by identifying a trustee to have particular oversight of administration and record-keeping, and through frequent reporting by administrators to the trustee board, including evidence of how SLAs are being met.
The trustees of smaller schemes, in contrast, were less likely to have formal processes in place for the measurement and reporting of administrative and record-keeping activity. SLAs and/or key performance indicators (KPIs) were uncommon, and there was limited reporting to the trustee board and limited attendance by administrators at trustee meetings.
“Small schemes don’t include administrators in the meeting. They don’t invite us.” (External administrator, small DC)
“They don’t discuss administration because it ticks over smoothly.” (In house administrator, small DC)
Scheme running costs were often top-of-mind for trustees of smaller and some medium schemes, and this was sometimes cited as a reason for the limited reporting
Record-keeping and administration research 2015/16 27
requirements set for administrators.
“The main concern is more about the cost of administration rather than the benefit of it. It ticks along. If we can reduce the costs of it, that’s even better” (Lay trustee, medium DB)
A number of trustees, from various sized schemes, also mentioned an increase in workload resulting from changes to pensions legislation and the greater level of scrutiny trustees are subject to. Several participants attributed the lack of focus on administration to this increase, with their time now being stretched too far to give administration a significant level of attention.
3.3.2 Attendance at trustee meetings
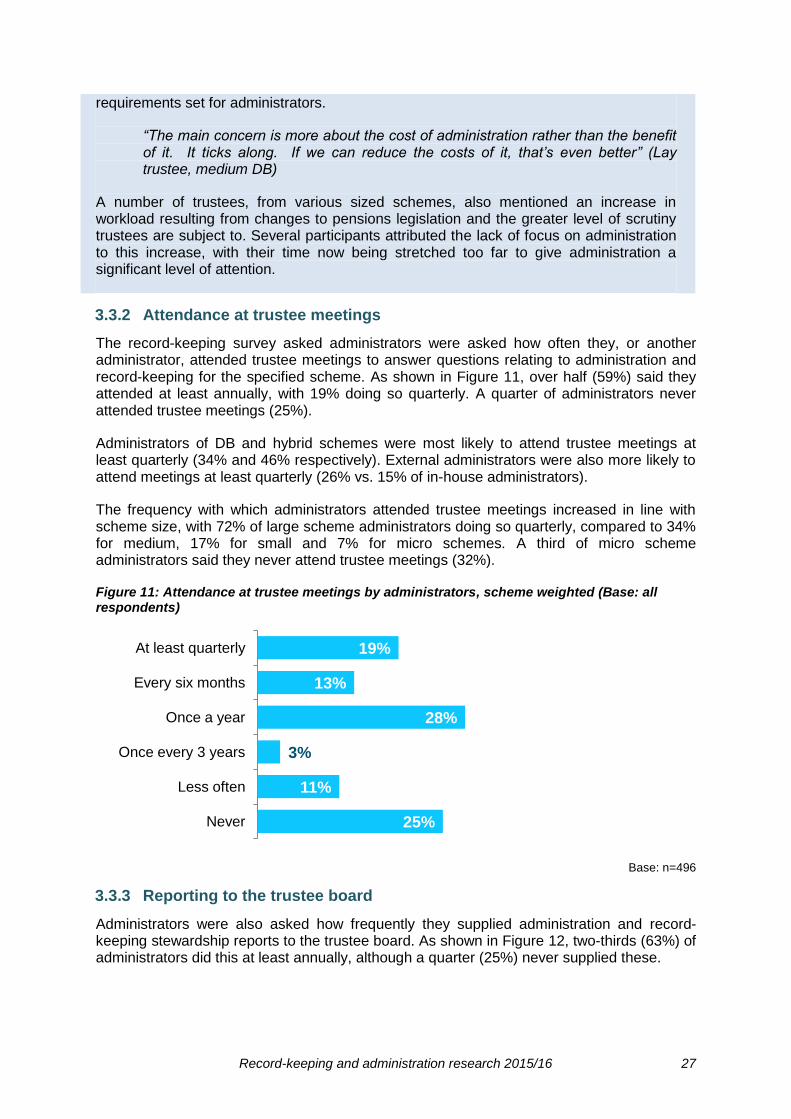
The record-keeping survey asked administrators were asked how often they, or another administrator, attended trustee meetings to answer questions relating to administration and record-keeping for the specified scheme. As shown in Figure 11, over half (59%) said they attended at least annually, with 19% doing so quarterly. A quarter of administrators never attended trustee meetings (25%).
Administrators of DB and hybrid schemes were most likely to attend trustee meetings at least quarterly (34% and 46% respectively). External administrators were also more likely to attend meetings at least quarterly (26% vs. 15% of in-house administrators).
The frequency with which administrators attended trustee meetings increased in line with scheme size, with 72% of large scheme administrators doing so quarterly, compared to 34% for medium, 17% for small and 7% for micro schemes. A third of micro scheme administrators said they never attend trustee meetings (32%).
Figure 11: Attendance at trustee meetings by administrators, scheme weighted (Base: all respondents)
Base: n=496
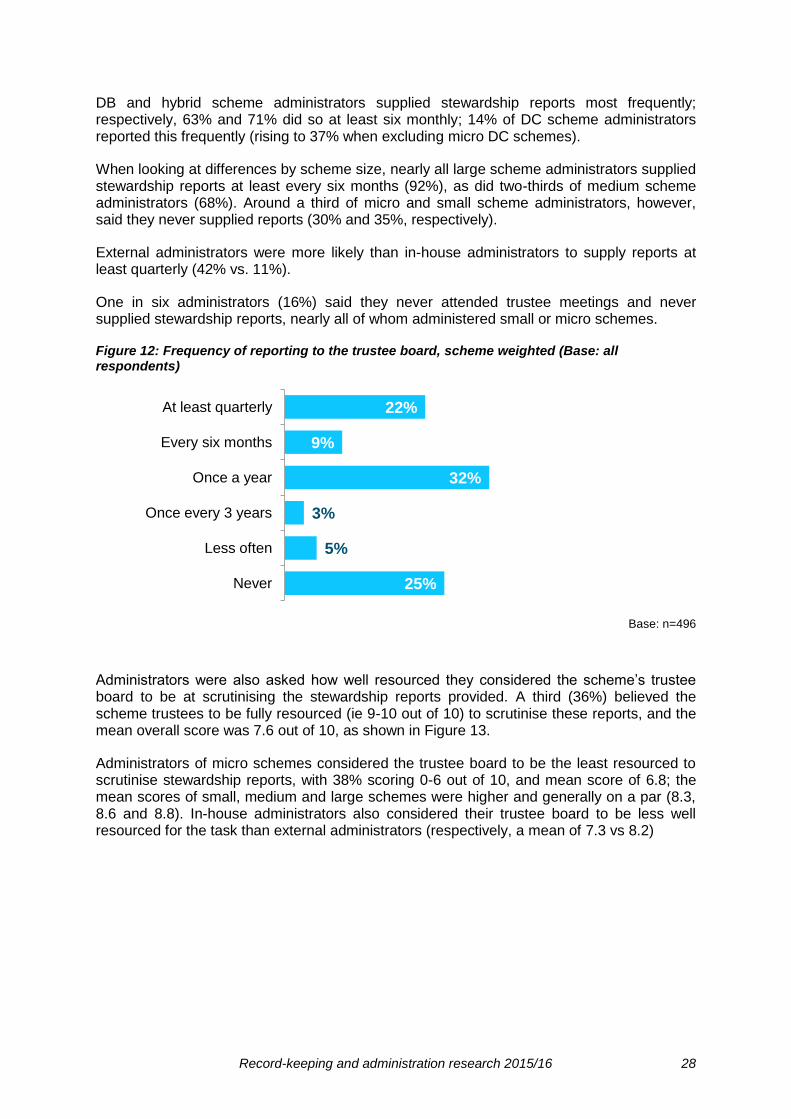
3.3.3 Reporting to the trustee board
Administrators were also asked how frequently they supplied administration and record-keeping stewardship reports to the trustee board. As shown in Figure 12, two-thirds (63%) of administrators did this at least annually, although a quarter (25%) never supplied these.
19%
13%
28%
3%
11%
25%
At least quarterly
Every six months
Once a year
Once every 3 years
Less often
Never
Record-keeping and administration research 2015/16 28
DB and hybrid scheme administrators supplied stewardship reports most frequently; respectively, 63% and 71% did so at least six monthly; 14% of DC scheme administrators reported this frequently (rising to 37% when excluding micro DC schemes).
When looking at differences by scheme size, nearly all large scheme administrators supplied stewardship reports at least every six months (92%), as did two-thirds of medium scheme administrators (68%). Around a third of micro and small scheme administrators, however, said they never supplied reports (30% and 35%, respectively).
External administrators were more likely than in-house administrators to supply reports at least quarterly (42% vs. 11%).
One in six administrators (16%) said they never attended trustee meetings and never supplied stewardship reports, nearly all of whom administered small or micro schemes.
Figure 12: Frequency of reporting to the trustee board, scheme weighted (Base: all respondents)
Base: n=496
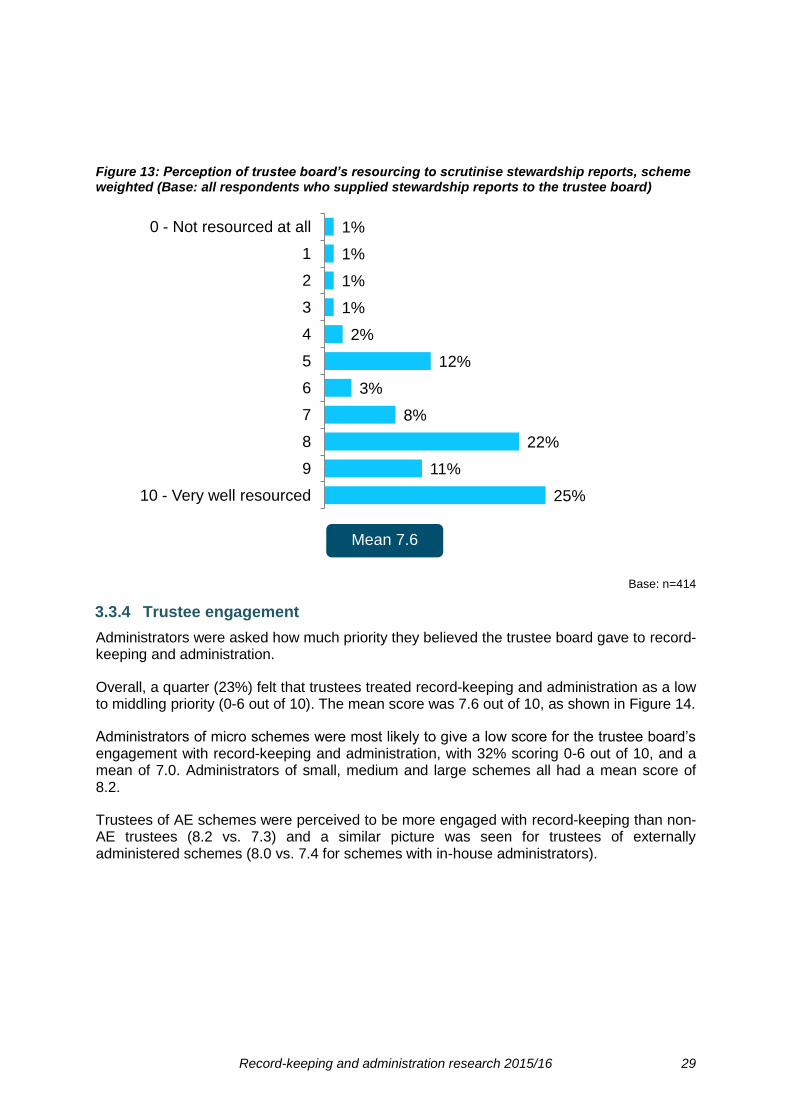
Administrators were also asked how well resourced they considered the scheme’s trustee board to be at scrutinising the stewardship reports provided. A third (36%) believed the scheme trustees to be fully resourced (ie 9-10 out of 10) to scrutinise these reports, and the mean overall score was 7.6 out of 10, as shown in Figure 13.
Administrators of micro schemes considered the trustee board to be the least resourced to scrutinise stewardship reports, with 38% scoring 0-6 out of 10, and mean score of 6.8; the mean scores of small, medium and large schemes were higher and generally on a par (8.3, 8.6 and 8.8). In-house administrators also considered their trustee board to be less well resourced for the task than external administrators (respectively, a mean of 7.3 vs 8.2)
22%
9%
32%
3%
5%
25%
At least quarterly
Every six months
Once a year
Once every 3 years
Less often
Never
Record-keeping and administration research 2015/16 29
Figure 13: Perception of trustee board’s resourcing to scrutinise stewardship reports, scheme weighted (Base: all respondents who supplied stewardship reports to the trustee board)
Base: n=414
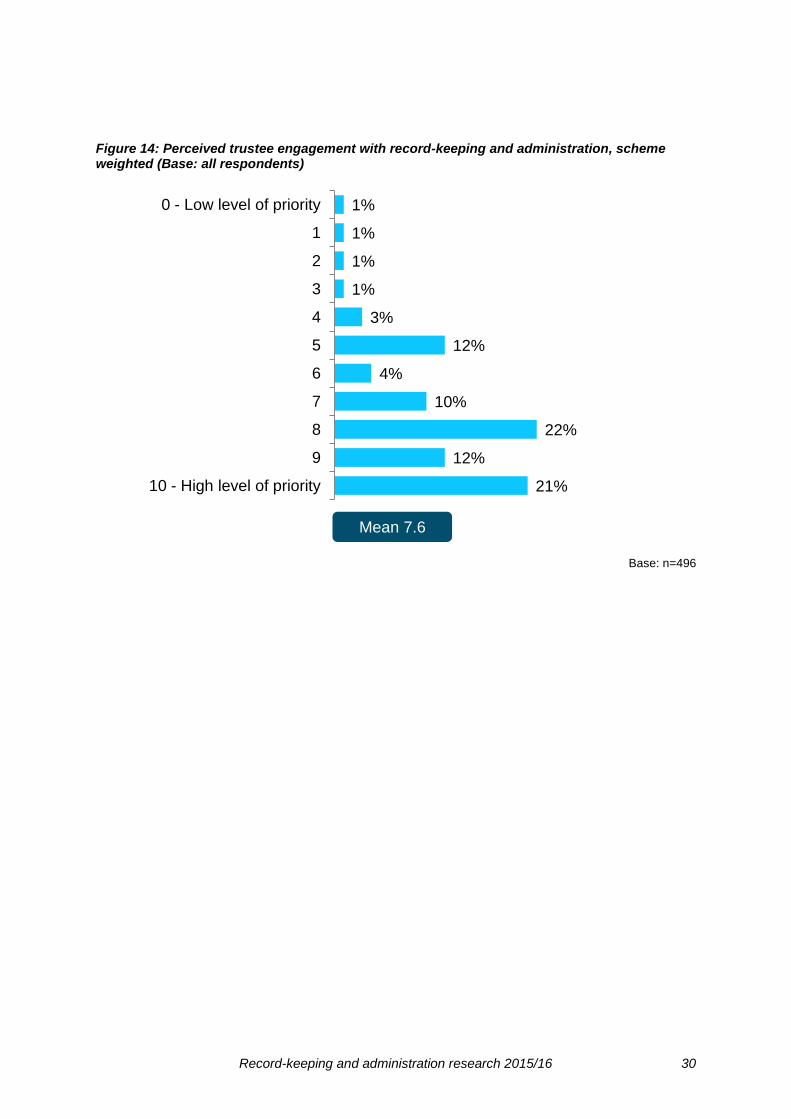
3.3.4 Trustee engagement
Administrators were asked how much priority they believed the trustee board gave to record-keeping and administration.
Overall, a quarter (23%) felt that trustees treated record-keeping and administration as a low to middling priority (0-6 out of 10). The mean score was 7.6 out of 10, as shown in Figure 14.
Administrators of micro schemes were most likely to give a low score for the trustee board’s engagement with record-keeping and administration, with 32% scoring 0-6 out of 10, and a mean of 7.0. Administrators of small, medium and large schemes all had a mean score of 8.2.
Trustees of AE schemes were perceived to be more engaged with record-keeping than non-AE trustees (8.2 vs. 7.3) and a similar picture was seen for trustees of externally administered schemes (8.0 vs. 7.4 for schemes with in-house administrators).
1%
1%
1%
1%
2%
12%
3%
8%
22%
11%
25%
0 - Not resourced at all
1
2
3
4
5
6
7
8
9
10 - Very well resourced
Mean 7.6
Record-keeping and administration research 2015/16 30
Figure 14: Perceived trustee engagement with record-keeping and administration, scheme weighted (Base: all respondents)
Base: n=496
1%
1%
1%
1%
3%
12%
4%
10%
22%
12%
21%
0 - Low level of priority
1
2
3
4
5
6
7
8
9
10 - High level of priority
Mean 7.6
Record-keeping and administration research 2015/16 31
3.4 Service level agreements, data improvement activities and data security
3.4.1 Service Level Agreements (SLAs)
3.4.2 Qualitative findings on SLAs
SLAs were found to be standard practice among the third party administrators, insurers, professional trustees and large in-house professional pensions departments (which saw themselves as competing with outsourced services) who took part in the qualitative research. Among these audiences, SLAs were felt to provide reassurance and accountability to ensure administration and record-keeping standards were met.
However, a number of internal administrators for micro, small or medium schemes were found to have no formal measures in place, with the administrator sometimes a member of staff at the company who had other non-scheme-related responsibilities. In these cases, trustees sometimes seemed comfortable to have an informal arrangement in place with the administrator.
In schemes where there was little activity, such as the smallest schemes and/or closed schemes, some trustees and administrators felt there was no need for formal reporting and data measurement, other than to complete the scheme return.
“Nobody is joining or leaving, and there are no contributions…so there is very little to do on scheme administration apart from the scheme return. The trustees rarely meet and administration is discussed as and when required because there is very little activity.” (In house administrator, medium DB)
The record-keeping survey asked administrators whether they had a scheme administration contract (SAC) or service level agreement (SLA) in place with the trustee board
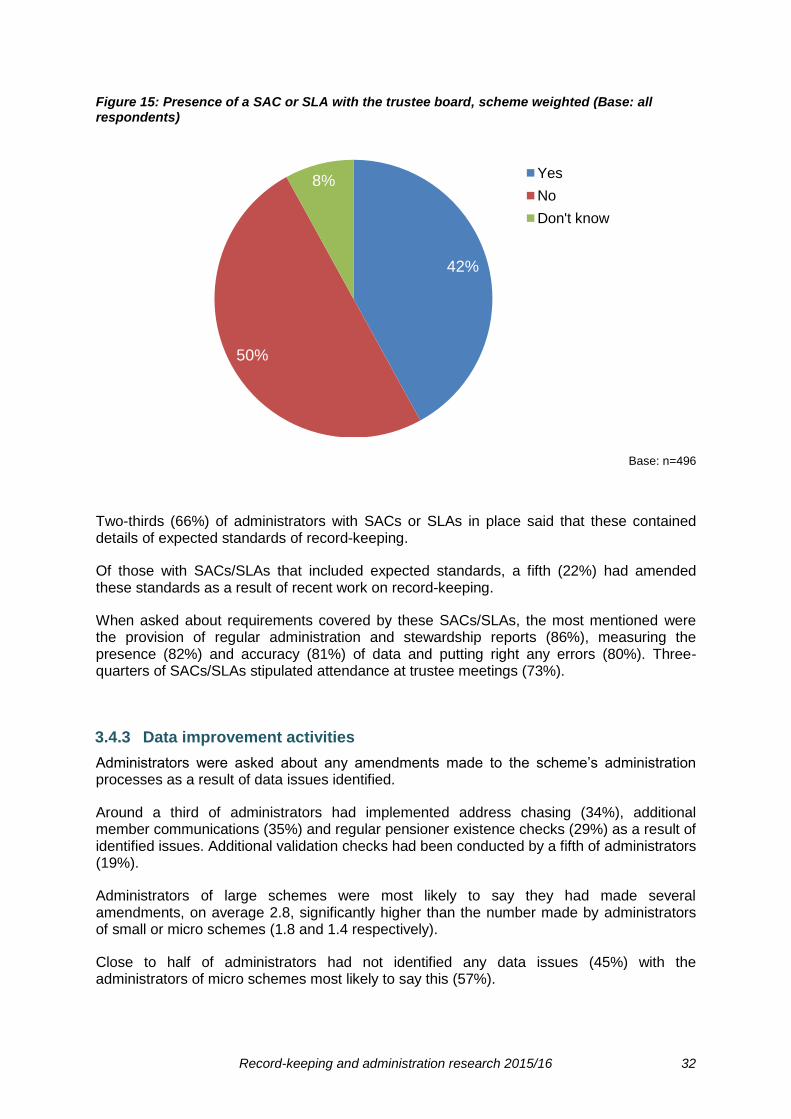
Overall, two fifths (42%) of administrators had an SAC or SLA in place, while half did not (50%), as shown in Figure 15.
Use of these was highest for administrators of large schemes (87%) and much less prevalent among administrators of micro (23%) schemes and in-house administrators (23%, compared to 75% of external administrators).
Record-keeping and administration research 2015/16 32
Figure 15: Presence of a SAC or SLA with the trustee board, scheme weighted (Base: all respondents)
Base: n=496
Two-thirds (66%) of administrators with SACs or SLAs in place said that these contained details of expected standards of record-keeping.
Of those with SACs/SLAs that included expected standards, a fifth (22%) had amended these standards as a result of recent work on record-keeping.
When asked about requirements covered by these SACs/SLAs, the most mentioned were the provision of regular administration and stewardship reports (86%), measuring the presence (82%) and accuracy (81%) of data and putting right any errors (80%). Three-quarters of SACs/SLAs stipulated attendance at trustee meetings (73%).
3.4.3 Data improvement activities
Administrators were asked about any amendments made to the scheme’s administration processes as a result of data issues identified.
Around a third of administrators had implemented address chasing (34%), additional member communications (35%) and regular pensioner existence checks (29%) as a result of identified issues. Additional validation checks had been conducted by a fifth of administrators (19%).
Administrators of large schemes were most likely to say they had made several amendments, on average 2.8, significantly higher than the number made by administrators of small or micro schemes (1.8 and 1.4 respectively).
Close to half of administrators had not identified any data issues (45%) with the administrators of micro schemes most likely to say this (57%).
42%
50%
8% Yes
No
Don't know
Record-keeping and administration research 2015/16 33
3.4.4 Data security
Administrators were asked about the measures the scheme had in place to ensure data about their members and their benefits was kept securely.
The measures mentioned most frequently by administrators were secure cabinets/rooms (36%), username/password protection (26%) and secure systems and servers (18%). Just over one in ten mentioned regulation compliance, with bodies such as ICAEW’s4 Audit and Assurance Faculty and ISO5.
Administrators of DB schemes were most likely to have the majority of these measures in place (with the exception of secure cabinets/rooms). Micro scheme administrators appeared to have less sophisticated/wide ranging security measures, being more likely to rely on physical barriers such as secure storage (49%).
4 Institute for Chartered Accountants in England and Wales (ICAEW)
5 International Organisation for Standardization (ISO)
Record-keeping and administration research 2015/16 34
3.5 Materials and guidance
Administrators were asked whether they had personally used any of the record-keeping guidance materials from TPR.
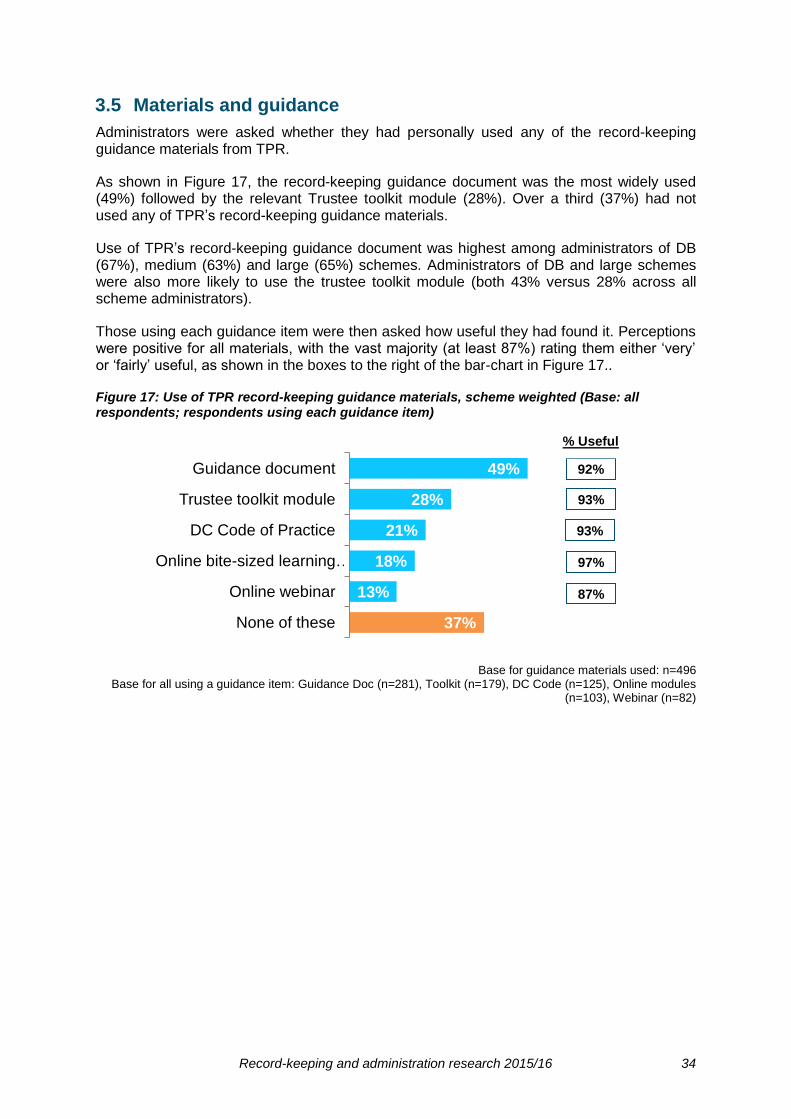
As shown in Figure 17, the record-keeping guidance document was the most widely used (49%) followed by the relevant Trustee toolkit module (28%). Over a third (37%) had not used any of TPR’s record-keeping guidance materials.
Use of TPR’s record-keeping guidance document was highest among administrators of DB (67%), medium (63%) and large (65%) schemes. Administrators of DB and large schemes were also more likely to use the trustee toolkit module (both 43% versus 28% across all scheme administrators).
Those using each guidance item were then asked how useful they had found it. Perceptions were positive for all materials, with the vast majority (at least 87%) rating them either ‘very’ or ‘fairly’ useful, as shown in the boxes to the right of the bar-chart in Figure 17..
Figure 17: Use of TPR record-keeping guidance materials, scheme weighted (Base: all respondents; respondents using each guidance item)
Base for guidance materials used: n=496 Base for all using a guidance item: Guidance Doc (n=281), Toolkit (n=179), DC Code (n=125), Online modules
(n=103), Webinar (n=82)
49%
28%
21%
18%
13%
37%
Guidance document
Trustee toolkit module
DC Code of Practice
Online bite-sized learning …
Online webinar
None of these
92%
93%
93%
97%
87%
% Useful
Record-keeping and administration research 2015/16 35
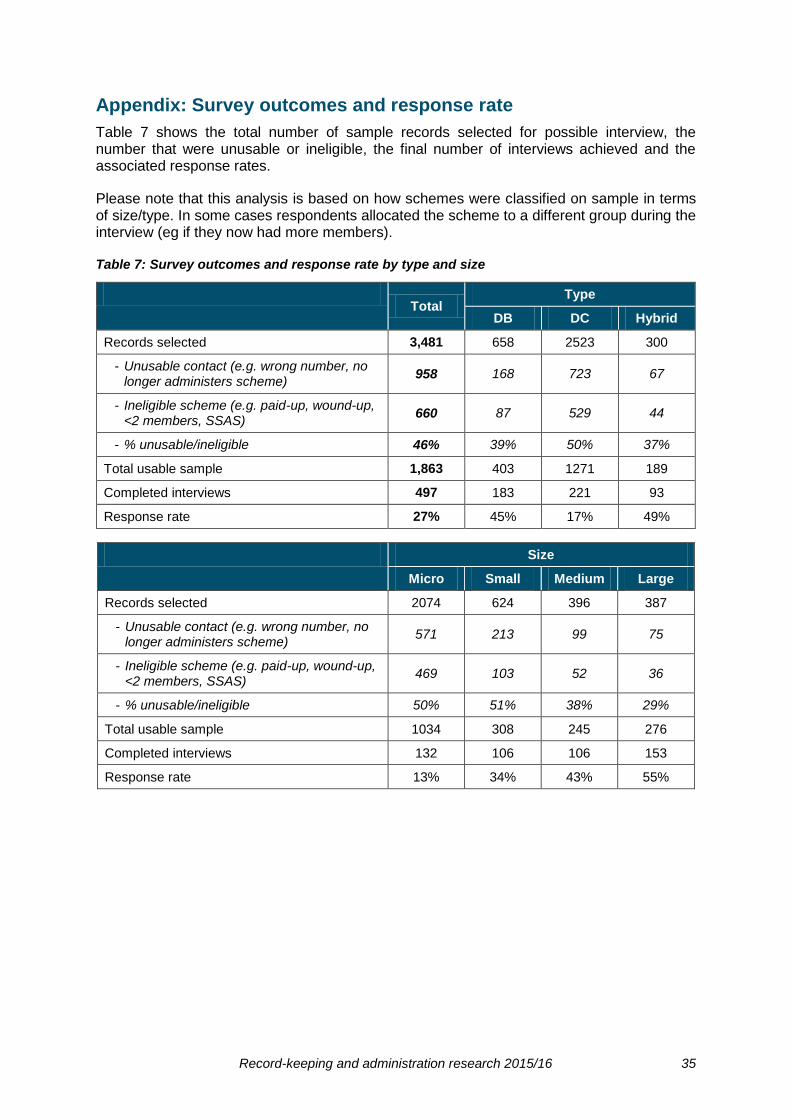
Appendix: Survey outcomes and response rate
Table 7 shows the total number of sample records selected for possible interview, the number that were unusable or ineligible, the final number of interviews achieved and the associated response rates.
Please note that this analysis is based on how schemes were classified on sample in terms of size/type. In some cases respondents allocated the scheme to a different group during the interview (eg if they now had more members).
Table 7: Survey outcomes and response rate by type and size
Total
Type
DB DC Hybrid
Records selected 3,481 658 2523 300
- Unusable contact (e.g. wrong number, no longer administers scheme)
958 168 723 67
- Ineligible scheme (e.g. paid-up, wound-up, <2 members, SSAS)
660 87 529 44
- % unusable/ineligible 46% 39% 50% 37%
Total usable sample 1,863 403 1271 189
Completed interviews 497 183 221 93
Response rate 27% 45% 17% 49%
Size
Micro Small Medium Large
Records selected 2074 624 396 387
- Unusable contact (e.g. wrong number, no longer administers scheme)
571 213 99 75
- Ineligible scheme (e.g. paid-up, wound-up, <2 members, SSAS)
469 103 52 36
- % unusable/ineligible 50% 51% 38% 29%
Total usable sample 1034 308 245 276
Completed interviews 132 106 106 153
Response rate 13% 34% 43% 55%