regulatory approaches to reliable electricity grids in the ...€¦ · 1 sec is the dominant player...
TRANSCRIPT

1
Regulatory Approaches to Reliable Electricity Grids in the Kingdom of Saudi Arabia
18 May 2016
2
Contents
1. Background and Objectives 2
2. Study Phases 5
3. Benchmarking on the Quality of Electricity Supply 6 3-1 Network Length and Fault rates 6
3-2 Gap Analysis to Good Practise 8 4. Key Analysis 10 4-1 Performance and Fault Causes 10 4-2 Faults with a Transient Cause 11 4-3 Planned Interruptions 12 5. Regulatory Areas for Electricity Network Reliabilit y Improvement 14 5-1 Distribution Protection system 14 5-2 Dead switching on the Distribution Network. 15 5-3 Operational Security and Planning Standards 15 5-4 Use of Generators 15 5-5 Cable Damages 16 5-6 Outage Management 16 5-7 Cable Joint Failure 16 5-8 Contractor Management 17 5-9 Materials Management and Stock Control 17 5-10 Resource Planning 17 5-11 Inspections 18 5-12 Staff Training 18 6. Potential Benefits Summary 18 7. Regulatory Incentive Mechanisms 19 8. Conclusion 21

3
1. Background and Objectives
In 2008 the Electricity & Co-Generation Regulatory Authority (ECRA) for the Kingdom of Saudi Arabia
(KSA) developed a Key Performance Indicators (KPIs) regulatory framework. The intention was for
these KPIs to be used by ECRA, as the regulatory body for the electricity sector, to monitor licensed
companies involved in the generation, transmission and delivery of electricity supply to customers in
the KSA. The study established the following 26 KPIs which were most relevant, and in line with
international best practice. These KPIs are subject to annual auditing.
Suggested target levels were proposed by ECRA as a precursor to setting of target incentives. This
was to ensure all necessary systems for data collection and reporting were in place for ECRA to carry
out an annual audit of the KPI data submitted by each license holder.
As a result of the KPI submission ECRA has noted from the System Average Interruption Frequency
Index (SAIFI) and System Average Interruption Duration Index (SAIDI) data provided that the
distribution network performance is variable, with the poorest performance exhibited in areas which
are serviced by less secure networks. For completeness we show the Saudi Electricity Company1
(SEC) SAIDI and SAIFI performance indices for 2012, 2013 and 2014 in Figure 1 and Figure 2 below.
The significant variance between the best and worst performing regions is quite apparent and is
understood to reflect nature of the worst performing regions.
Within the KSA, the Grid Code, the Distribution Code and supporting Standards provide a regulatory
framework to which electricity utilities must adhere as part of license obligations. They also provide
guidance on how to manage and operate all technical aspects of the electricity industry.
This paper focuses on the key points from the KPIs analysis and presents a detailed electrical
Network Reliability improvement Plan (NRIP) focusing on the regulatory measures that enable ECRA
to drive system improvement measures. The intent is to provide overall system performance
1 SEC is the dominant player in the Saudi Arabian electricity utility industry. It is a vertically integrated electricity utility and the company is engaged in power generation, transmission and distribution. It operates oil, gas, steam, and diesel generation plants. SEC Distribution supplies electricity to some 8 million customers in four operating areas.
Generation
G1 Availability Factor (AF)
G2 Forced OutageFactor (FOF)
G3 ScheduledOutageFactor (SOF)
G4 Equivalent ForcedOutageRate (EFOR)
G5 Starting Reliability (SR)
G6 Gross CapacityFactor (GCF)
G7 Net Capacity Factor (NCF)
Transmission
T1 ENS
T2 SAIDI-T
T3 SAIFI-T
T4 MAIFI-T
T5 Out100 km
T6 Voltage Dips [2012]
T7 Network Losses [2012]
Distribution
D1 SAIDI
D2 SAIFI
D3 MAIFI [2011]
D4 Network Losses [2012]
Customer Service
C1 Average Time to Supply – Existing Connections [2013]
C2 Average Time to Supply – New Connections
C3 Average Time to Reconnect After Payment
C4 Notification of Interruption of Supply [2012]
C5 Frequency of Complaints
C5 Frequency of Billing Complaints
C7 Average Time to Resolve Billing Complaints
C8 AverageWaiting Time Call Center

4
improvement focused predominantly on the poorer performing parts of the distribution networks of
SEC.
The overall objective of this paper is to present a thorough review of the power system performance
and establish regulatory measures to reduce both the frequency and duration and thus the impact of
future distribution network outages and/or disturbances.
� Figure 1: Performance for SEC by Electricity Depart ments – SAIDI
� Figure 2: Performance for SEC by Electricity Depart ments – SAIFI
50
150
250
350
450
550
650
750
850
950
Riy
ad
h C
ity
Riy
ad
h R
eg
ion
Ha
il
Qss
im
Dw
ad
mi
Al
Kh
arj
Ma
kk
ah
Jed
da
h
Ta
bu
k
Al
Ma
de
na
h
Ta
if
Da
mm
am
Al
Ah
sa
No
rth
err
n R
eg
ion
Jou
f
Asi
r
Na
jra
n
Jaza
l
Al
Ba
ha
Min
/Cu
sto
me
r
Performance for SEC by Department - SAIDI
2014
2013
2012
Target = 150 Min
0
2
4
6
8
10
12
14
16
18
20
22
24
Inte
rrru
pti
on
s #
/Cu
sto
me
r
Performance for SEC by Department - SAIFI
2014
2013
2012
Target = 2

5
2. Study Phases
ECRA undertook benchmarking on the quality of electricity supply and two phases of data collection.
The first phase involved a preliminary analysis of SEC’s reliability data to gain an understanding of the
overall reliability performance and identify poor performing sections of the network and identify the
departments that would be the focus of the study. This was followed by a second phase which
involved site visits to the selected departments throughout SEC’s operating areas, where ECRA met
with local SEC staff to discuss their business operations. During the site visits ECRA also undertook
site inspections and condition assessments, focussing on the poorer performing network sections.
ECRA used ranking in terms of SAIDI, SAIFI, Customer Minutes Lost (CML) and Customer
Interruptions (CI) to assess the departments that would be the subject of the site visits. Analysis
focused on Planned and Unplanned interruptions, excluding Force Majeure, Generation and
Transmission interruptions which are not generally in the control of the distribution sector. Below is the
ranking of the departments based on CML
� Figure 3 Electricity Departments ranked by CML.
From the analysis the departments to be visited were agreed with SEC. The departments are
represented as follows:
• Asir Electricity Department
• Jazan Electricity Department
• Taif Electricity Department
• Qassim Electricity Department
• Riyadh Region Electricity Department
• Dwadmi Electricity Department
6
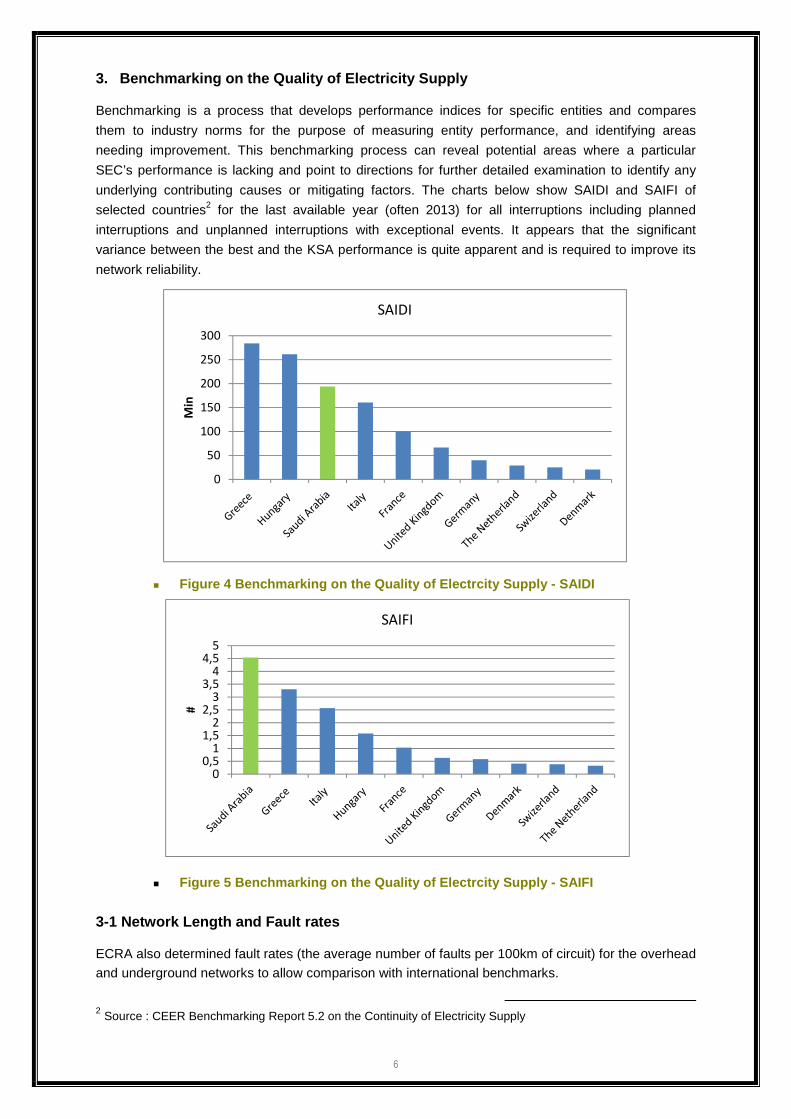
3. Benchmarking on the Quality of Electricity Suppl y
Benchmarking is a process that develops performance indices for specific entities and compares
them to industry norms for the purpose of measuring entity performance, and identifying areas
needing improvement. This benchmarking process can reveal potential areas where a particular
SEC’s performance is lacking and point to directions for further detailed examination to identify any
underlying contributing causes or mitigating factors. The charts below show SAIDI and SAIFI of
selected countries2 for the last available year (often 2013) for all interruptions including planned
interruptions and unplanned interruptions with exceptional events. It appears that the significant
variance between the best and the KSA performance is quite apparent and is required to improve its
network reliability.
� Figure 4 Benchmarking on the Quality of Electrcity Supply - SAIDI
� Figure 5 Benchmarking on the Quality of Electrcity Supply - SAIFI
3-1 Network Length and Fault rates
ECRA also determined fault rates (the average number of faults per 100km of circuit) for the overhead
and underground networks to allow comparison with international benchmarks.
2 Source : CEER Benchmarking Report 5.2 on the Continuity of Electricity Supply
0
50
100
150
200
250
300
Min
SAIDI
00,5
11,5
22,5
33,5
44,5
5
#
SAIFI

7
3-1-1 Cable Fault Rates
ECRA analysed the cable fault rate for SEC. The rate for damages has been separately drawn out to
indicate the impact that these faults are having on the overall fault rate. The final column shows the comparison against an international benchmark3 figure of 3.5 faults per 100km. Clearly Considering
the international average fault rates based on (USA, UK, Aus., NZ) shown above it can be seen that
the SEC cable fault rates are relatively high. Even excluding the high level of damages SEC are more
than 50% higher than would be expected.
Cable faults Fault rate /100km
All 6,802 8.11
Excluding Damage 4,294 5.12
Table 1 SEC Underground fault rates
System Typical voltages
Outage rates (per 100 km/annum)
Underground
Distribution 11kV, 22kV, 13.8kV, etc. 3.5
Sub-transmission 33kV, 44kV, 66kV, 88kV, etc. 1.6
Table 2 International comparator underground fault rates
3-1-2 Overhead Fault Rates
For the overhead network there is a different picture with underlying fault rates being relatively low. The data shows faults that have duration greater than 5 minutes and are classed as sustained by
ECRA KPIs system definition and therefore contribute to SAIDI and SAIFI. In the analysis the cause
of the faults has been analysed and those that were classified by SEC as having a ‘Transient’ cause
have been separately identified as with a correctly operating protection and operational regime it should be possible to restore a significant number of these faults within 5 minutes.
From the analysis it can be seen that overall the overhead fault rate is lower than the international
benchmark4 of 10.2 faults /100km/annum however the impact of the transient faults can be clearly seen across most departments but most particularly in some area.
OH line Faults Fault rate /100km
All >5min 11,590 8.39
All Sustained >5min excl. transient 3,394 2.46
Table 3 SEC Overhead fault rates
System Typical voltages
Outage rates (per 100 km/annum)
Overhead
Distribution 11kV, 22kV, 13.8kV, etc. 10.2
Sub-transmission 33kV, 44kV, 66kV, 88kV, etc. 3.2
3 Source : Sinclair Knight Merz, Consulting firm

8
Table 4 International Overhead fault average fault rates (USA, UK, Aus., and NZ)
This shows that if the impact of transient interruptions is excluded then the overhead network
performs better than international comparators. This supports the view from the site visits which found
that in general the overhead system is well constructed and will not be prone to inherent failure.
3-2 Gap Analysis to Good Practise
In considering the SEC organisation and processes ECRA use the model below a basis for
assessment.
� Figure 6 Utility Management Model
In good organisations ECRA would expect the utility management model to be used to determine:
• the impact of Distribution network outages on SAIDI/SAIFI
• Assess the most critical departments and “rogue circuits”.
• Determine the main underlying causes of poor performance by equipment and fault type.
• Adequacy of existing distribution system to meet peak demand.
• Adequacy of reinforcement plans to meet projected demand growth, including the timing of project development.
• Adequacy of system performance and implementation of improvement projects where
performance is below the standard.
SEC’s network planning systems and processes appear reasonable where network development is
concerned, although the focus is predominantly based on network capacity and voltage issues rather than reliability by design. The key gap of the KSA to the international practise is in the planning
process where reliability is concerned is the strategic planning of the network to ensure that reliability
is better incorporated into network planning and design. This can be achieved by basing design guidelines on Network Security Standards and reliability targets.
If SEC were to apply the existing planning processes that were observed in the site visits to Network
Security Standards and reliability targets similar to those used in place in Australia and the UK the
network reliability could be improved significantly. However, rather than using the Australian or UK
standards and targets directly, specific standards and targets developed in consideration of the SEC

9
network and conditions in Saudi Arabia should be developed. These should be based on an overall cost versus benefits assessment to determine the most appropriate level of network security and
reliability for the SEC distribution network.

10
4. Key Analysis
4-1 Performance and Fault Causes
ECRA reviewed KPI recording data which provided a great deal of insight into how the networks
perform, the fault causes and also allows interpretation of the operational practices in place in the
different departments. In addition to fault causes reviewed, the impact of transmission decisions to
limit auto reclose in the summer months was also considered.
Below are the top 10 causes of Customer minutes lost as derived from the KPI data for the whole of
SEC:
Type and Cause CML >5 min CML <5mins %Total CML>5
TRANSIENT 183,412,797 6,266,611 18%
Maintenance 158,441,248 3,218,933 16%
Implementation 148,521,340 1,475,449 15%
Cable Fault; Due to Joint Failure 61,661,611 45,542 6%
Cable Fault; Other 55,446,729 214,361 5%
Cable Damage 49,604,770 79,490 5%
Outdoor Termination Flashover 30,957,154 62,073 3%
System Improvement 29,395,754 291,715 3%
Repair 25,111,642 2,525,107 2%
Detached Conductor 23,601,590 31,145 2%
Other 250,159,610 28,608,471 25%
Grand Total all CML 1,016,314,245 42,818,897 100%
Table 5 Customer Minutes Lost by Cause
It can be seen that the planned interruptions are high, with 36% of all CML arising from these causes.
It can also be seen that there are a significant number of short duration interruptions for these planned activities which indicates there are a large number of the interruptions to facilitate dead
switching on the distribution network. The top individual cause of CML for interruptions lasting more
than 5 minutes is transient interruptions. These points strongly to the need to improve the protection
on radial overhead feeders as correctly operating protection would be expected to clear such faults or
isolate a small section if the transient fault persists through several reclose operations. The next highest causes of CML are associated with the underground network which is joint failures and cable
damages.
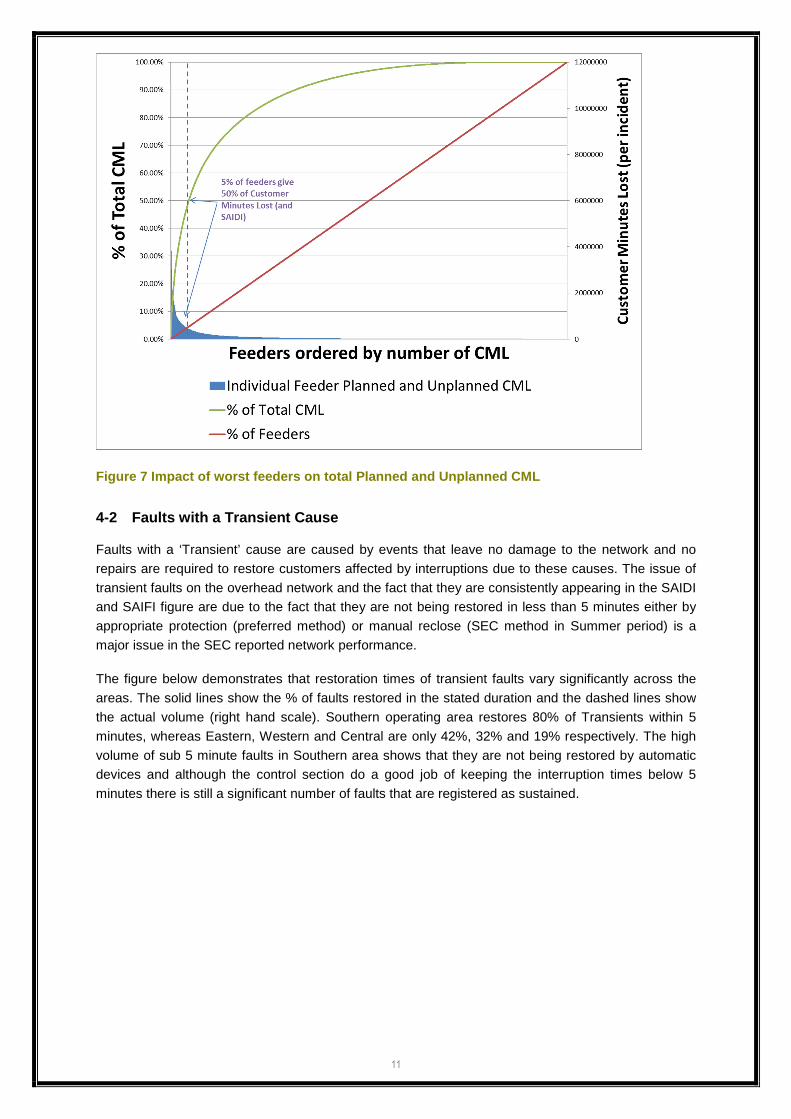
In the site visits ECRA focused on the 10 worst feeders in each of the departments visited. The graph below shows the cumulative CML from all feeders on the green line with the red line showing the
cumulative number of feeders ordered by the number of CMLs that they contribute to the total ranked by the feeders with the highest CML. It can be seen from this that 50% of the CMLs in SE C are contributed by 5% of the feeders and so addressing this 5% amounting to 500 feeders will significantly improve the overall reliability.
11
Figure 7 Impact of worst feeders on total Planned a nd Unplanned CML
4-2 Faults with a Transient Cause
Faults with a ‘Transient’ cause are caused by events that leave no damage to the network and no
repairs are required to restore customers affected by interruptions due to these causes. The issue of
transient faults on the overhead network and the fact that they are consistently appearing in the SAIDI and SAIFI figure are due to the fact that they are not being restored in less than 5 minutes either by
appropriate protection (preferred method) or manual reclose (SEC method in Summer period) is a
major issue in the SEC reported network performance.
The figure below demonstrates that restoration times of transient faults vary significantly across the
areas. The solid lines show the % of faults restored in the stated duration and the dashed lines show
the actual volume (right hand scale). Southern operating area restores 80% of Transients within 5
minutes, whereas Eastern, Western and Central are only 42%, 32% and 19% respectively. The high
volume of sub 5 minute faults in Southern area shows that they are not being restored by automatic devices and although the control section do a good job of keeping the interruption times below 5
minutes there is still a significant number of faults that are registered as sustained.

12
Figure 8 Duration of interruptions with a “Transien t” cause
Clearly this supports the focus of the reliability plan in addressing “transient “ interruptions and also
indicates why the Eastern Operating Area did not appear in the analysis as one of the areas that
needed to be visited given the overall low number of transient interruptions and the fact that of those 42% were quickly restored.
4-3 Planned Interruptions
The figure below shows the duration of Planned Interruptions. Clearly the duration of a planned interruption should be sufficient for the work to be undertaken. It can therefore be assumed that any
duration of less than 30 minutes is probably not allowing much work to be undertaken, given the need
for isolation, earthing and permits to work and so is probably just switching to allow dead switching to
isolate the area to be worked on. It can be seen that Southern and Western Areas have approximately 6000 and 3500 interruptions per year of this nature. Around half of these are less than
5 minutes. The sub 5 minute interruptions clearly show focus of the departments on minimising the
impact but these are probably full feeder interruption each time. Conversely, Central and Eastern
have less than 1000 interruptions each, and almost none of less than 5 minutes.

13
� Figure 9 Restoration times with Planned Interruptio ns

14
5. Regulatory Areas for Electricity Network Reliabi lity Improvement
Below ECRA have drawn out the main issues that were found to affect the reliability of the SEC
network and the recommendations that ECRA propose that will form the basis of the network
reliability improvement plan.
5-1 Distribution Protection system
Unplanned Transient Interruptions
These non-damage faults dominate the SAIDI and SAIFI for the worst performing overhead networks.
The primary cause is;
� There are insufficient auto-reclosers and sectionalisers used on the 33kV and 13.8 kV distribution network to reduce the impact of transient faults remote from the main substation.
� The auto reclose feature at the 33 kV busbars which is designed to restore the supply after a
transient fault is switched out for 5 months of the year or in the case of substations in the south it
is not installed on some of the feeders.
� When the auto reclose is disabled the feeder circuit breakers are not always reclosed within 5 minutes of tripping for non-damage faults.
� There seems to be an issue with discrimination between the pole mounted auto-reclose schemes
and the primary circuit breakers so the primary circuit breaker is beating any protection
downstream on the distribution system that should be clearing the fault.
� New substations fitted with 33 kV feeder distance protection will reduce the ability to use downstream protection to minimise SAIDI and SAIFI.
Recommendation 1 – Distribution system protection
Improvements are required with regard to distribution automation involving the following:
� The 33kV and 13.8kV radial feeders should be fitted with pole mounted reclosers and
sectionalisers. It will improve the ability to discriminate as they work on number of shots rather than time curves.
� Where primary circuit breakers are not fitted with auto reclose, then an auto recloser should be
installed at the start of the overhead line (assuming load and fault level allows).
Recommendation 2 – Transmission / Distribution prot ection interface
There needs to be a review of the protection arrangements and policy to reduce the levels of SAIDI
and SAIFI due to non-damage faults. This will involve;
� Power system analysis studies to determine the substations which are more likely to be affected by voltage dips due to motor inrush currents
� The type of protection to be used on 33kV feeders (e.g. O/C, E/F, Sensitive E/F, distance
protection)
� Correct Protection settings to be adopted at each substation
� Co-ordination of Main Substation settings with the protection installed downstream on the feeders
� There needs to be a clearer understanding between the operations of how to use the protection
systems available on the distribution 33kV and 13.8kV radial feeders

15
5-2 Dead switching on the Distribution Network.
As described above, there is a practice of not operating Main line switches live. This is particularly the
case in the South area and Asir region in particular where no live switching is undertaken. This means that to isolate any branch or part of the network for planned interruptions, the main circuit breaker is
opened (for up to 10 minutes) and then when the network is to be restored, the main breaker is
opened again for a short time. This varies significantly by area and some areas will allow live closing
and some only restrict operation of some types of areal switch.
Recommendation 3 – Live Network operation
� Identify and register all switchgear that is not considered safe to operate live. � Verify if the equipment is unsafe or if a working procedure is required.
� If unsafe do not procure or install any more of this equipment.
� If the equipment meets specification consider if an amendment to working procedure is required.
E.g. Approved Insulating Gloves for Operation of line switches or conversion to Insulated Rod
operation. � For new switches install full rated and high specification switch gear (e.g. gas switches or Rod
Operated Air break) to allow confident safe live opening and closing.
� Prioritise installation to allow long branches and main feeders to be sectioned (if gas breakers
are to be installed consideration should be given to making these sectionalisers that can
discriminate with upstream reclosers and allow remote control capabilities.
5-3 Operational Security and Planning Standards
The distribution network has not been developed with an N-1 security standard on 33kV and 13.8kV
distribution feeders. Unusually distribution feeders would be N-1 with a maximum load allowed to be
disconnected for repair time. The distribution planning standard allows load and customers to be
connected to a radial feeder up to the capacity of the line and using capacitors and voltage regulators
to maintain voltage at the end customers.
This has given rise to circuits with over 200 connected kilometres of line and coupled with limited
protective devices, with over 2000 customers connected. This has led to many customers being
affected for faults anywhere on an extensive network.
Recommendation 4 – Limit radial feeder length and d emand per feeder
The planning standard should include a maximum size for radial feeders that will take into account the
inherent increase in fault incidents on longer lines. There should be a limit to the number of customers
connected to radial overhead lines either in absolute number or as is more usual a capacity limit.
These should form the basis of a network security standard that can be referenced by the Distribution
Code and hence be included by the transmission company in justification for additional primary injection points to the distribution network.
5-4 Use of Generators
At present the generator fleet are only used by the maintenance teams and as there has been a
significant increase in the number of generators owned by SEC in the last few months then SEC
needs to move to get the most benefit out of these. This means that they should be planned like any
other resource and should be used on construction projects as well as maintenance projects to make sure that customer interruptions are minimised where ever possible.

16
Recommendation 5 – Resource Planning
The outage planning meeting should consider the use of the generation fleet and make sure that they
are used on the projects that will have the biggest impact on SAIDI and SAIFI. The use should not be
restricted to one group such as maintenance. The resource planning should take account of the needs to retain short notice availability for emergency use.
5-5 Cable Damages
Review the practices adopted for minimising cable damages.
Reccomendation-6 – Active cable identification
� Best practice in this area is to actively engage with the 3rd parties prior to any excavation and
send SEC teams out to locate and mark the cable route where the excavation is to take place.
� When a cable is damaged record the company who causes that damage and use this to identify worst offenders.
� Establish a damage mitigation team and general awareness training such that staff will stop next
to excavation works to check if they have safe dig plans and have had the cables identified.
� Use the full force of the law to prosecute persistent offenders.
5-6 Outage Management
Coordination of Planned interruptions across Maintenance and construction activities is required to
minimise interruptions to customers.
Recommendation 7
� Establish outage planning meetings on a fortnightly basis to coordinate the planned outages of
the construction and maintenance teams one month in advance. These meeting should enable
flexible maintenance and construction works to be moved to be undertaken in the same outages as the customer driven construction work.
� Set firm limits on the maximum planned interruptions on a feeder in a set period. Some areas
currently limit this to 1 interruption in two weeks. This can be improved and a target of only one
planned interruption per month should be accepted. This would seem a good starting point and can be made more stringent as planning processes improve.
5-7 Cable Joint Failure
High number of Cable joint failure, due to poor jointing, poor materials, poor condition of cables. It is
essential that SEC address this issue. The analysis in this report shows how fault rate statistics can
be used to identify the departments with particular issues.
Recommendation 8
� Develop a refresher course and programme to ensure that all jointers have their capabilities reassessed on a regular basis.
� All jointers to be issued with Authorisation cards when trade test is successfully passed - expiry
date of 3 years then return for refresher and re-trade test
� Establish, communicate and implement a process to breakdown all faulted MT joints less than 5 years old at the training school.
� Establish and train a policy to ensure that sufficient distance is removed from either side of the
point of fault to clear any damp or carbon migration and test before jointing.

17
� Work with the material supplier to ensure that the straight joint kit is fit for purpose (align joint analysis findings above rationalise the number of MT straight joints
5-8 Contractor Management
In some areas in the south there are low levels of direct SEC staff and resources are supplemented
by contract staff. Site visit feedback indicates that either the Contractors are not good in these areas
or the SEC staff do not have the contract and supervision mechanisms to ensure that the contractors provide the right skilled staff at the right time. Within the unified contract there are compliance
requirements that contractors have to meet. SEC should be rigorous in enforcing these. This may
mean that higher cost contractors are the only ones that can comply but if these are to replace direct
resources then this may still be cost effective.
Recommendation 9 – Contractor Control
� Establish a contract management department, with sufficient headcount to pro rata contractors employed
� Review existing inspection sheets/reports to ensure they are fit for purpose in all activities e.g.
OHL work, jointing etc.
� Review efficiency of data collection and handling and consider PDAs to carry out inspections to
ensure efficient ways of working (not paper based), monitoring and produce management information.
� Develop standard reports to allow trend analysis on contractors' performance and remove those
whose performance is not up to the required standard.
� Review trends and reward good contractor performance, remove poor performing contractors
5-9 Materials Management and Stock Control
Materials are not always delivered, available or of the right quality to carry out works, which results in additional SAIDI on faults and failure of the network due to incorrect materials being used.
Recommendation 10
� Review the stores and materials processes in place at all areas currently - to include ordering
process, number of stores, and store keepers employed.
� Appoint required staff (store keepers and logistics managers)
� Review locations of main stores and mini stores to ensure strategic fit for faults occurring.
5-10 Resource Planning
Coordination is required with regards to the management of resources, to include work profiles,
demographics, training and succession development.
Recommendation 12 – HR Planning
� Establish a local planning meeting, to allocate the required resources to projects efficiently. This
can be linked to outage planning meetings above and be used to forecasts future contractor skills
and requirements to improve contract management � Recruit schedulers. Establish short and medium term scheduling meetings - to include
contractors to ensure awareness and availability.
� Implement management information and reports on efficiency of planning, health and safety,
productivity

18
� Produce a skills matrix and training plan to cover, OHL and jointing, store keeping/materials handling, driving, H&S, technical and academic training.
5-11 Inspections
The inspection process is paper based and is very labour intensive, populated spreadsheets etc.
Automating the process in much the same way that SEC has automated the LT despatch process will improve efficiency and the ability to evaluate the data to prioritise work that needs attention from
those that can be included in later scheduled outages.
Recommendation 14
� Review inspection sheets to ensure they are fit for purpose
� Consider procurement of PDAs to carry out inspections to ensure efficient ways of working,
monitoring and remedial actions, moving away from paper based processes.
5-12 Staff Training
It is clear from the site visits that the new technology and equipment being installed on the distribution
system and to support the distribution staff requires additional training.
Recommendation 15
� Protection skills need to be increased at the planning and operational level to ensure staff are
aware of how equipment such as Auto reclosers and Sectionalisers are meant to operate in conjunction with each other and with the Feeder protection.
6. Potential Benefits Summary
To determine the benefits of the key initiatives the following assumptions have been made.
� The cessation of dead switching will remove all interruptions planned interruptions and sustained
faults lasting less than 30minutes
� The damage rate in Western and Southern areas will reduce to average level in Eastern and
Central areas.
� The cable fault rate in all areas will reduce to international benchmark averages.
� The auto reclosers and protection review projects will reduce the transient interruptions by 80%.
� Establishing the Reliability Planning Standard and undertaking the works to bring the system into
compliance will reduce Overhead Planned and Sustained Fault SAIDI by 30%.
Given the above, the impact of the proposed improvement plan is approximately 75 minutes (SAIDI).
The initial focus of the initiative will target the highest impact first. Damages and live switching will
focus on all potential benefits. The Auto reclose features and protection will address the worst 500 feeders initially; In this case, the benefit to transient interruptions will be approximately 21 of the
potential 25 minutes saving in SAIDI from transient causes. The SAIDI outturn is the potential network
performance level following the SAIDI reductions.

19
7. Regulatory Incentive Mechanisms
Once the KPI targets have been identified, the next step is to consider the methods that can be used
to encourage the utility to achieve these targets. There are three main methods which such incentives can be provided namely; (1) performance publication, (2) minimum standards, and (3) penalty/reward
schemes.
Currently, ECRA is simply publishing the service provider’s performance in an attempt to create an incentive and motivation towards its improvement. In order to further incentivize customer service and improve network reliability ECRA has finished t he introduction of guaranteed standards 5 for specific KPIs . Thereby, ECRA shifted the customer service regulation from a currently reactive
state, i.e. focused on complaint resolution, to a proactive system, i.e. complaint prevention.
Guaranteed standards are essentially an incentive mechanism designed to improve customer
services. Therefore, guaranteed standard schemes set a minimum level of service with respect to
customer service which is enforced through a threshold level, and service below the threshold will be penalized.
The table below presents the recommended guaranteed standards. In particular, these standards are
will incentivize customer service providers to deliver better services.
It has been decided that a guaranteed standard shall be considered in addition to the typical customer service standards, covering the frequency of interruptions and allowing individual customers to claim
for compensation, if the standard is not achieved.
GS1 Time to Register and Supply – Existing Connections
GS2 Time to Supply – New Connections
GS3 Time to Reconnect after Payments (Hours)
GS4 Notification of Interruption of Supply
GS5 Time to Resolve Billing Complaints (Working Days)
GS6 Supply Restoration – Normal Conditions (Hours/Case)
GS7 Frequency of Interruptions
In the following charts, the recommendations regarding some of the above guaranteed standards will
be explained. With respect to the setting of the threshold values for the guaranteed standards, the
approach taken is as a first step to consider international practice applied for the relevant guaranteed
standards in terms of threshold values and compensation levels. In a second step the potential level of compensations to be paid by the licensees should be estimated in order to assess their impact on
the financial performance of the licensees.
5 Guaranteed Standards are standards of service that must be provided to any customer and therefore must be met by each distribution company to guarantee a level of service that is reasonable to expect. If a licensee fails to meet the minimum standard of service required, it must make a payment to the customer subject to certain exemptions.

20
� Figure 10 New connection
� Figure 11 Reconnection of Payment
� Figure 12 Number of billing complaints
In conclusion, ECRA adopted implementing the following guaranteed standards:
� About 337,000 meters were connected
in 2014 (302,000 in 2013)
� Internationally the standard is in the
range of 15 to 20 Workdays. � Abu Dhabi has a standard of 43
Workdays � Average value in KSA in 2014 is 49
Workdays � Considering the compensation at 200
SAR per case and the current target in
KSA (30 Workdays) result for 2014 in a
payment of SAR 38 million.
� About 700,000 total cases were
reported for SEC in 2013
� Not all departments seem to have
reported in this respect
� Reconnection is an important issue
given local conditions
� Standard at 4 hours after payment
leave some 110,000 cases (or some
16%) of the cases unresolved.
� Considering a compensation of SAR 50
in this case the total compensation will
be 5,500,000 SAR based on 2013
figures
� More than 10% of the Billing
Complaints are resolved on the same
day
� In international average the standard
for resolving billing complaints is at 15
days
� Staying with this standard means that
some 1,700 complaints (or 9.4%) are
not resolved within that standard
� Considering a 50 SAR compensation
payment will result in a total
compensation of 85,000 SAR

21
� Figure 13 The Guaranteed Standards
8. Conclusion
There is a regulatory room to improve the network reliability looking to the strategic planning of the
network to ensure that reliability is better incorporated into network planning and design. The
performance indicators currently used by SEC to improve reliability do not directly align with the SAIDI
and SAIFI KPIs. Feeders are currently targeted based upon loading and number of faults. While addressing these indicators would be expected to improve reliability, they don’t specifically target the
reliability KPIs for SAIDI and SAIFI.
The approach taken has been to identify the key areas for improvement which will give the greatest return in improvement terms. In other countries where the performance of the network is significantly
better than it is in the KSA, the potential to continue to improve reliability reduces, with the costs
increasing significantly and the incremental benefits reducing. An example of this is with system
automation and remote control, where having to provide remote switching facilities at most ground mounted substations becomes very expensive. The approach ECRA are recommending is to address
the causes of the underground interruptions and eliminate them as much as possible. Once the
overall performance improves with cable damage initiatives, jointer training and route cause analysis
then applying automation or remote control in some areas, particularly the main city centres and
business districts.
The longer term reliability of the system will be improved through the recommendations to the
interface between Transmission and Distribution protection increased contractor competence and
staff training through making sure that the network is built consistently well and giving the SEC staff the skills to make sure that the contractors are doing what is required. These improvements will need
to be supplemented by more rigorous and longer term coordination and planning of outages and
resources and SEC should address the reasons for dead switching as a matter of urgency.
It can be concluded from the study that addressing and implementing the NRIP will significantly improve the overall reliability and achieve the approved target 6 of SAIDI and SAIFI.
6 ECRA set a target of 150 min for SAIDI and 2 for SAIFI