regulatory barriers to trade undermine africa’s potential...
TRANSCRIPT
17
Pho
tog
rap
h b
y Jo
sep
h H
adar
, Wo
rld B
ank
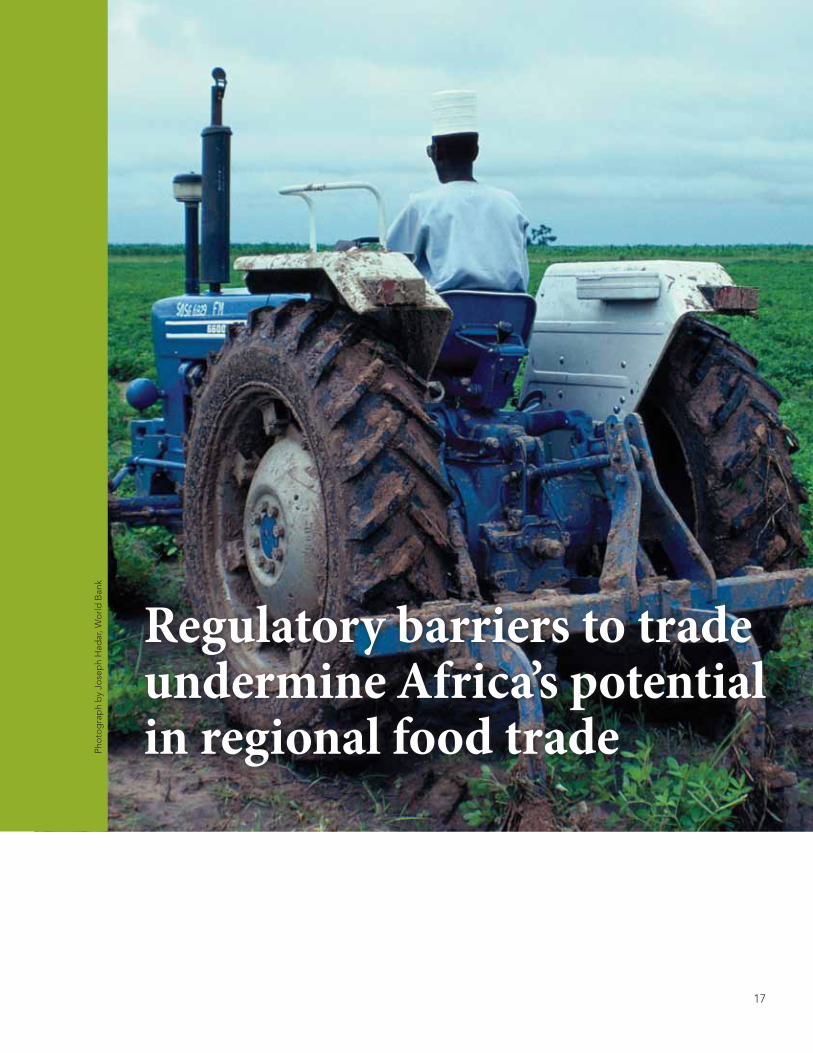
Regulatory barriers to trade undermine Africa’s potential in regional food trade

18
Africa Can Help Feed Africa
Africa must increase outputs to moderate rising food import bills and satisfy growing demands. The degree of access to markets for final products is critical. Linking rural food surplus production zones in Africa to major deficit urban consumption centers requires
a well-functioning regional market for these products. But improved productivity and a decline in the enormous gap in yields between Africa and
the rest of the world requires the using higher-yield seed varieties, more intensive fertilizer use, and better production techniques. Yet there are major constraints on access to these key inputs, often because of trade barriers and limitations on the movement of professionals across borders.
The debate about agricultural policy is often presented as a dilemma between pursuing high-er producer prices for farmers (to encourage investment in higher yield seeds, use of fertilizers, and better techniques) and delivering lower final prices for consumers. But this dilemma does not appear when policy interventions have raised transaction costs between farmers and consumers, and the policy environment has permitted limited competition at key points along the value chain. Such policies lead to a large gap between producer and consumer prices and entail that the bene-fits of previous reforms and investments, such as tariff removal and better quality roads, may not have accrued to either farmers or consumers, but rather to those providing services along the chain, such as transport and distribution.
African smallholder farmers who sell surplus harvest typically receive less than 20 percent of the consumer price of their products, with the rest eaten away by transaction costs and post har-vest losses (AGRA 2009). Clearly, this limits the incentive to produce for the market. Policies that reduce transaction costs and increase competition in the provision of services that affect the pro-duction and distribution of food staples could reduce the gap between consumer and producer prices by reducing consumer prices, increasing producer prices, or both. USAID (2011) estimates that in West Africa a reduction in transaction costs equivalent to 10 percent of the farm gate price of agricultural products would lead to a four percent increase in production and a similar increase in the real income of farmers, together with an eight percent fall in consumer food prices and a seven percent increase in real disposable incomes of consumers.
Many of the key barriers to trade in food staples relate to regulatory and competition issues at elements along the value chain. As tariffs have come down, so a tangled web of rules, fees, and expensive services is strangling Africa’s regional trade in food.
But in many cases an effective market system in food inputs and final products requires well- designed regulations—for example, to ensure that consumers receive reliable information about the quality of the food or seeds they buy. This is important to protect countries from disease and pests that could devastate local production. In some cases, the policies restricting trade are deliber-ately protectionist; but in other instances the lack of regulations limits the development of region-al markets, such as in the case of fertilizers. In many cases the issue is to define appropriate regu-lations and create better institutions to implement them.
The following section summarizes information on the key barriers to trade at different points along the value chain of food staples. Specifically examined are: (a) barriers to trade that limit access to seeds and fertilizers; (b) factors that lead to high transport costs in Africa; (c) dangers of cross-ing borders, especially for small informal traders many of whom are women; (d) costs of opaque

19
Regulatory barriers to trade undermine Africa’s potential in regional food trade
and unpredictable trade policies that limit trade in staples across borders, mainly non-tariff barri-ers (NTBs); (e) inefficient distribution services that fail to link poor producers to poor consumers.
Trade barriers limit access to key inputs: Seeds, fertilizers, and extension services
Seed security is closely linked with food security in Africa, but many Africa farmers lack access to modern high-yield seed varieties. In Ethiopia, for example, Alemu (2010) estimates that only about one-quarter of the demand for improved seed is being satisfied. Use of modern seed is fundamen-tal to increasing productivity towards its potential; and use of improved hybrid maize in Ethiopia could quadruple productivity. Even if just half the farmers achieved the productivity associated with using hybrid seeds, the domestic production would replace commercial imports (Alemu 2010).
Trade barriers that create high transaction costs between countries prevent seeds from mov-ing quickly across borders when a seed deficit occurs due to a disaster, such as flooding, drought, or pest infestation. Inappropriate regulations and burdensome requirements governing the release of new varieties create small and fragmented seed markets and ensure that varieties available else-where are not widely disseminated in Africa (Minde and Waithaka 2006). Even within Africa, farm-ers on one side of a border may not have access to higher yield seeds that have been approved by the neighboring country under similar agro-climatic conditions.
Seed trade is constrained by regulations and policies established when plant breeding and for-mal seed production were the responsibility of the public sector. Procedures for the release of new varieties were designed to meet the needs of public research institutes, and seed certification was primarily an internal quality control mechanism.
Now, however, a key concern with seed regulation in Africa is the inordinate amount of time required for the approval process (Tripp 2005), which can take around two to three years or more. This puts African farmers at a serious disadvantage in competing with imports from the global market, which are derived from seeds that deliver much higher yields, and which may require less fertilizers and pesticides and be more pest and drought resistant. African farmers must therefore be allowed to acquire seeds widely available elsewhere. A first step would be to ensure that test data used in the approval process in other countries is included in African approval processes to avoid duplicative testing.
Certification plays a crucial role in a market system in providing confidence and bringing buy-ers and sellers together. In the past, each African country developed its own seed regulatory regime; however, these different regulatory arrangements have now created a situation where sourcing seeds between neighboring countries is complicated, lengthy, and expensive.
While many countries have implemented a degree of liberalization in seed markets, government and its agencies still heavily control the introduction of new varieties, trade, entry of seed compa-nies, and in some cases seed prices and production. Central controls on seed production, includ-ing compulsory certification and licensing for seed farms, can create conflicts with pro-market and pro-reform processes. As a result, the private sector is often poorly integrated into the national

20
Africa Can Help Feed Africa
seed production and distribution system. In Ethiopia, for example, “tensions exist between the state and the emergent private sector,” and “the argument of the strategic importance of food and agri-culture and the perceived weak presence of the private sector is deployed to argue for strong state control” (Alemu 2010 p15).
Restrictions on the cross-border movement of seed are primarily due to NTBs, resulting from sanitary, phytosanitary and plant quarantine measures, seed certification, and variety release regu-lations, which differ across regions and countries. Regional trade in seeds has been hindered by a lack of agreement among agencies in different countries about standards, and by inconsistent and heavy-handed application of control procedures for imports. These costs and delays are exacer-bated by border customs officials who do not understand seed trade policy. One trader reported that a batch of seeds for the Ethiopian market has been stuck at the border for 12 months simply because of bureaucratic procedures—“a myriad of documents that have in the end been impossi-ble to fill.”7 The seeds are now useless since germination and viability have passed. And there are usually no simple dispute procedures for a trader to contest an official decision (or lack of) that is causing delays and raising costs.
There have been attempts to free up the seed trade in Africa. For example, the Alliance for Commodity Trade in Eastern and Southern Africa (ACTESA) is a specialized agency of COME-SA established to integrate small farmers in domestic, regional, and international markets. When in March 2008 the COMESA Council of Ministers declared that COMESA should rationalize and harmonize its seed regulations and policies within two years, ACTESA (from October 2010) began helping implement seed harmonization through the COMESA Regional Agro-inputs Programmes (COMRAP). COMRAP is harmonizing seed trade for 12 crops, namely, maize, rice, groundnuts, cotton, beans, cassava, wheat, potato, sunflower, soya beans, millet, and sorghum. Harmonization should ensure that seeds that have satisfied the release and certification requirements of one coun-try should not have to “jump through all the same hoops again” (Tripp 2005).
SADC accomplished seed harmonization on February 5, 2010 at which time it signed a mem-orandum of understanding for the implementation of the SADC-harmonized seed regulatory sys-tem. This is now being piloted by four countries: Malawi, Zimbabwe, Swaziland, and Zambia.
A common theme throughout this report is that effective regulatory reform requires an inclu-sive process involving a wide range of stakeholders. This applies to seeds, where it is important to include farmers and seed distribution companies, as well as officials and representatives of the government agencies involved in regulating seed trade. Experience from the regional projects dis-cussed previously (Tripp 2005) suggests that building capacity among all stakeholders is impor-tant if regional agreements that lead to modifications in national laws and regulations are to have a positive impact on seed trade. Reforming seed regulations will require changes in institution-al responsibilities and appropriate resources for new regulatory procedures, for example, shifting from centralized control to allowing more decisions to be made at border crossings.
Fertilizers are a critical element for staples production, but fertilizer use in Africa averages only around eight kilograms per hectare, which is less than 10 percent of the world average (Bumb et
7 Author’s interviews with traders and farmers in East Africa

21
Regulatory barriers to trade undermine Africa’s potential in regional food trade
al. 2011). A large body of evidence has demonstrated the substantial impact on yields and output that increased fertilizer use would have in Africa. A key determinant of fertilizer use is the price of fertilizer relative to the price of the staple output. Barriers to trade in fertilizers increase their price and lead to a smaller variety of fertilizers available in Africa, especially for smallholders. Barriers to trade in staples reduce the price that producers receive for their produce and hence the returns to investments in greater fertilizer use.8
Farmers in African countries, especially in the landlocked countries, face higher prices for fer-tilizers than farmers in other developing countries. Figure 6 shows that landlocked countries, such as Burundi, Malawi, Zambia, and Uganda, contend with prices that are as much as ten times high-er than other developing countries. Farmers in Burundi pay US$2,700 for a ton of fertilizers, while farmers in Malawi, Zambia, and Uganda pay (respectively) US$1,500, US$1,400 and US$1,100 per ton of nutrients. These prices far exceed those of farmers in countries like Pakistan, Argentina and Brazil, where the price of fertilizers is between US$250 and US$500.
Farmers in coastal countries in Africa generally enjoy better prices for fertilizer. For exam-ple, prices in South Africa are a little over US$600 and in Kenya less than US$500. But this is not always the case, since fertilizer prices in Nigeria are the second highest in the sample of countries in Figure 6. In addition, being landlocked does not necessarily mean high fertilizer prices since
8 For example, Abdoulaye and Sanders (2005) show that the ration of fertilizer to millet price is a key factor affecting adoption of fertilizers in Niger.
Figure 6: Nitrogen-based fertilizer prices in 2010 (US$ per mt of nutrients)
0 250 500 750 1000 1250 1500 1750 2000 2250 2500 2750
UkrainePakistan
IndiaKenya
ArgentinaBrazil
KazakhstanTurkeyEgypt
ThailandSouth Africa
GuatemalaCôte d'Ivoire
TanzaniaMadagascar
CameroonZimbabwe
UgandaAlgeriaZambiaMalawi
SenegalNigeriaBurundi
Source: FAOSTAT.

22
Africa Can Help Feed Africa
farmers in Kazakhstan have access to fertilizers at relatively low prices. This suggests that the reg-ulatory policies adopted by countries determine outcomes in fertilizer markets.
Markets in many African countries are too small to exploit scale economies associated with fertilizer production and even blending. Regional markets in fertilizers have not emerged part-ly because individual countries usually specify their own fertilizer blend and specialty products (Bumb et al. 2011). Hence, fertilizers cannot move freely from country to country. As a result many countries import directly from the global market but, since they are small buyers, cannot obtain the same price as larger buyers. In addition, shipping companies charge more for smaller deliver-ies. This means that regional markets with common specifications for fertilizers could obtain much lower prices if quantities are ordered for the whole region.
In some countries long and cumbersome tendering and procurement systems exacerbate the process. While many countries have liberalized importation of fertilizers, governments are often still heavily involved in procurement. For example, in Mali, the current SOE-managed tendering process adds 50 percent to the cost of fertilizers as compared to direct negotiations between pro-ducer organizations and suppliers.9
An open market system for fertilizers must have strongly enforced regulations that ensure quality, quantity, nutrient contents, and truth-in-labeling. Standards convey essential information to both consumers and producers.
However, in many African countries regulations and the institutions to implement them do not exist. Even when appropriate regulations have been defined, problems continue because trad-ers are not aware of the rules. Worse, weak enforcement allows unscrupulous traders to repack-age and/or adulterate genuine products, resulting in poor quality and outdated products. Farm-ers then are unsure about the make-up of the available fertilizers. This lack of standards becomes a major obstacle to cross-border trade and regional fertilizer markets.
In the past, when the government played a greater role in supplying inputs to farmers, there was little need for regulations. But now that governments have allowed the private sector a role in supplying inputs, they have to assume responsibility for designing and implementing standards that support the market. This issue of institutional capacity to support integrated markets will be discussed in more detail in subsequent sections, but here we note that Kenya, a country with low fertilizer prices in Figure 6 has implemented a successful reform program that has increased both access to fertilizers and maize yields (see Ariga and Jayne 2011).
Many governments intervene through subsidy schemes. For example, Senegal farmers receive half of their fertilizer requirements through a subsidy system. However, uncertainties about the scheme make farmers reluctant to purchase the remaining half of their needs in the expectation that government will pay for this as well. Uncertainty also undermines decisions by private sector trad-ers about imports that would fill the gap. Similarly, in Nigeria, while fertilizer products are import-ed by the private sector, the government subsidy program impedes the development of a competi-tive and efficient fertilizer supply chain (Bumb et al. 2011). Delays in the payment of subsidy funds
9 Chemonics and IFDC 2007 referred to in Bumb et al. (2011).

23
Regulatory barriers to trade undermine Africa’s potential in regional food trade
create cash flow problems for importers and wholesalers; uncertainty arises because the quantity of fertilizer to be procured remains uncertain until the budget is approved. Finally, different subsi-dy schemes in different countries require checks at the border, which raises another barrier to the establishment of a regional market for fertilizers.
Removing barriers to regional trade in fertilizers is essential to reduce transaction costs and to allow farmers access to good quality fertilizer for increased productivity in food staple production. This was recognized in the Abuja Declaration of 2006 on Fertilizer for an African Green Revolution. African leaders declared fertilizer, “a strategic commodity without borders” and resolved that “the African Union Member States will accelerate the timely access of farm-ers to fertilizers.”
Leaders also committed to take measures by mid-2007 to reduce the cost of fertilizer procure-ment at national and regional levels, especially through the harmonization of policies and regu-lations to ensure duty-free and tax-free movement across regions, and to develop the capacity for quality control. They clearly stated that “as an immediate measure, we recommend the elimination of taxes and tariffs on fertilizer and on fertilizer raw materials.” However, some countries in West Africa still levy tariffs on fertilizer imports, including those from regional neighbors. For example, the Democratic Republic of Congo and Senegal levy tariffs of five percent on imports of fertilizers.10
Two key issues must be addressed to allow regional fertilizer markets to develop and deliv-er competitive fertilizer products to farmers: (a) installing a consistent and stable policy environ-ment for regional trade in fertilizers; and (b) investing in institutions that reduce the transaction costs of coordination failures. Many countries have enacted new fertilizer laws in recent years, but few have provided the resources to strengthen the capacity to define and enforce appropriate reg-ulations through standards and testing capacity.
Trade in inputs is often subject to costly requirements relating to product registration, trade permits, phytosanitary certificate (seed), non-GMO certificate (seed), quality assessment, certifi-cate of origin, as well as normal customs documentation. Streamlining trade procedures for inputs of seeds and fertilizers could have a leveraged impact on farmers’ incomes and trade competitive-ness. Box 4 provides an illustrative example from Malawi where improvements in trade procedures for fertilizers, which lead to a 7.7 percent reduction in farm gate fertilizer prices and a subsequent 10 percent increase in fertilizer use and a 15 percent increase in yields, could increase profits per hectare of maize by 50 percent.
Subsequent analysis suggests that while use of fertilizers varies considerably within income groups in Malawi a 10 percent increase in the number of farmers applying fertilizer in Malawi would reduce the poverty rate by 1.5 percent. Hence simply reducing costly and wasteful trade procedures for food staple inputs alone could have substantial impacts on poor farmers.
The mobility of agricultural specialists to provide extension services in Africa
10 In Zambia, for example, fertilizers and fertilizer ingredients enter duty and VAT free except that the micronutrients needed for blending fertilizers locally are subject to duty and 16 percent VAT. Apparently, this is because the micronutri-ents can also be used in the mining industry for which different tax policies apply.

24
Africa Can Help Feed Africa
Extension services are critical for boosting productivity, increasing food security, and easing link-ages between farmers and input suppliers, and farmers and markets. New approaches to extension that are more responsive to farmers’ needs—less top down and more integrated with research and technology development—are gradually replacing the non-participatory, supply-driven methods typical of agricultural extension services in Africa. But new approaches will require extension agents and agricultural specialists with skills that differ from those now available in most African countries.
Possible solutions might include the introduction of mid-career training courses (for exam-ple, as is being done in Uganda), the development of farmer field schools (for example, in Kenya),
Box 4: Trade Costs and Rural Incomes in Malawi: Improving Access to Fertilizers
This example is based on indicative data from the 2007/08 agricultural season in Malawi. The point of this quick example is not to recommend specific policy alternatives for Malawi, but to illustrate how efforts aimed at reducing trade costs could have a leveraged impact on trade competitiveness and rural incomes. First, Table 1 shows the estimated price build-up of fertil-izer under two price scenarios. The base scenario reflects the actual conditions that prevailed in Malawi in 2007/08 in which the economic (unsubsidized) price of imported fertilizer was esti-mated to be US$50.25 per 50kg bag. The reduced cost scenario, on the other hand, reflects the type of savings that might result from efforts to introduce bulk procurement of fertilizer and oth-erwise streamline import requirements and certification procedures. Malawi does not charge import duty or VAT on fertilizer, yet this example shows how 10 percent to 30 percent savings on selected trade costs could result in a 7.7 percent overall reduction in the economic value of fertilizer at the farm gate.
Table 1: Farm gate build-up of 2007/08 fertilizer prices in Malawi (US$/ton)
Base Case
Hypothetical Reduction Hypothetical Reduction
Price at origin 650 585 –10% (bulk procurement, change in licensing and permits)
Transport to frontier 163 163
Clearing and inspection 41 28 –30% (savings on clearing and certifi-cation, fewer border delays).
Domestic transport 43 43
Distribution costs and profit 90 90
Transport to farm 20 20
Total (USD per ton) 1,005 928
USD/50kg bag 50.25 46.39 7.7% savings overall
Next, Table 2 summarizes a set of key value chain indicators for medium- and high-input hybrid maize using the base 2007/08 price of fertilizer and hypothetical 7.7 percent reduction modeled
(continued on next page)

25
Regulatory barriers to trade undermine Africa’s potential in regional food trade
above. In the analysis, total accumulated costs at the into mill or depot location exclude profits paid to farmers and domestic assemblers. This approach allows total costs to be subtracted from the import or export parity price to show how much total profit is available to flow upstream to farmers and other value chain participants. Unless indicated, all values are expressed in US$ per ton of tradable grain.
Table 2: Value chain indicators for Malawi hybrid maize (US$/ton tradable grain, 2007/08 prices)
Fertilizer use (bags basal x top dress per ha):Medium input
2x2High input
4x4
Base conditions (2007/08 season)
Farmer yield (tons/ha) 1.40 2.60
Farm costs 227.90 216.84
Assembly costs 61.54 61.54
Total value chain costs into mill or depot 289.43 278.38
Total available profits per ton @ import parity 90.57 101.62
Total available profits per ton @ export parity (19.43) (8.38)
Scenario 1 – Streamlined trade procedures (7.7% savings on fertilizer)
Farmer yield (tons/ha) 1.40 2.60
Farm costs 216.87 204.97
Assembly costs 61.54 61.54
Total value chain costs into mill or depot 278.41 266.50
Total available profits per ton @ import parity 101.59 113.50
Total available profits per ton @ export parity (8.41) 3.50
Scenario 2 – 7.7% savings on fertilizer, 10% more use, 15% more yeild
Farmer yield (tons/ha) 1.61 2.99
Farm costs 196.21 186.30
Assembly costs 61.54 61.54
Total value chain costs into mill or depot 257.75 247.84
Total available profits per ton @ import parity 122.25 132.16
Total available profits per ton @ export parity 12.25 22.16
Import parity = USD 380/ton; export parity = USD 270/ton.
Significant benefit could be derived from efforts to streamline trade procedures for fertilizer. Although there is no guarantee that incremental profits will flow all the way up the chain to farm-ers, Scenario 1 shows how a 7.7 percent reduction in fertilizer costs would result in 12.2 percent
(continued on next page)
Box 4: Trade Costs and Rural Incomes in Malawi: Improving Access to Fertilizers (continued)

26
Africa Can Help Feed Africa
or participatory demonstration and extension systems (for example, in Ethiopia), coupled with a greater involvement of the private sector. Equally important is the temporary movement of agri-cultural specialists to address the shortages of workers skilled enough to deliver extension servic-es across the continent and improve access to agriculture knowledge.
Case studies on the mobility of agricultural specialists in Africa have examined a variety of skill levels, ranging from horticultural farmers to grain trade advisers, agro-commodity supply chain specialists, and agricultural education experts. These studies reveal that the potential for provid-ing extension services by agricultural specialists familiar with the African context is vast. Exported
and 11.7 percent more total profit per ton of tradable grain at the medium- and high-input lev-els respectively when sold as an import substitute. In Scenario 2, it is assumed that the lower price of fertilizer results in 10 percent more use per hectare and 15 percent higher yields. Under these conditions, the total available profits from one ton of import substitute maize would be 35 per-cent to 30 percent higher at the medium- and high-input levels respectively compared with base conditions. In all cases, the analysis shows that export maize is a marginal activity for Malawi and even returned a net loss under 2007/08 base conditions.
Finally, Table 3 looks at total available profits in per hectare terms, which is the most relevant mea-sure for farmers. As shown in Scenario 2 where yield increases as a result of more intensive fertil-izer use, each hectare of maize would provide 55 percent to 50 percent more total profit at the medium and high input levels respectively. According to the estimates, export maize remains a marginal activity even with the improved yield, but is still more than US$88 more profitable per hectare in Scenario 2 compared with base conditions.
Table 3: Total available profits per hectare from Malawi hybrid maize, 2007/08 (US$/ha)
Fertilizer use (bags basal x top dress per ha): Medium input
2x2High input
4x4
Base conditions (2007/08 season)
Total available profits per ha @ import parity 126.79 264.22
Total available profits per ha @ export parity (27.21) (21.78)
Scenario 1 – Streamlined trade procedures (7.7% savings on fertilizer)
Total available profits per ha @ import parity 142.23 295.09
Total available profits per ha @ export parity (11.77) 9.09
Scenario 2 – 7.7% savings on fertilizer, 10% more use, 15% more yeild
Total available profits per ha @ import parity 196.83 395.16
Total available profits per ha @ export parity 19.73 66.26
Box 4: Trade Costs and Rural Incomes in Malawi: Improving Access to Fertilizers (continued)

27
Regulatory barriers to trade undermine Africa’s potential in regional food trade
services—technical advice on farm management and greenhouse production, advice on sourcing agricultural commodities, developing and delivering agricultural training programs, and agro-com-modity supply chain management—were exported without modifications to the service provided in the domestic economy. These services seem to be portable across borders.
Most service providers are deterred from exporting by a lack of knowledge about exporting opportunities, markets, and processes, and little awareness about how to acquire knowledge. Agri-cultural specialists lack networks and find it difficult to obtain information on demand for exten-sion services in neighboring countries.
The surveyed providers also noted the difficulty in obtaining work permits to provide the service. For example, for a Kenyan specialist to provide advisory services on horticulture pro-duction in Uganda, his employer had to write to the Uganda Flower Exporters Association, which assessed his qualifications and domestic needs before providing a recommendation to the Uganda Investment Authority and the Ministry of Foreign Affairs regarding the issuance of the work permit.
The mobility of extension service providers across Africa could be improved by creating a regional database that farmer associations could access, with links to opportunities and agricultural specialists, including their area of specialization. And removing labor market barriers, such as eco-nomic needs tests or lengthy administrative procedures to obtain a work permit, as well as intro-ducing transparent procedures to recognize the qualifications of agricultural specialists (such as mutual recognition agreements of professional qualifications), would help de-fragment the region-al market for agricultural specialists and improve the quality of extension services.
High transport costs, especially for smallholders, limit access to regional markets
Regional trade in food staples in Africa is generally carried out by bulk transportation on roads in trucks. The staples are often grown and harvested by small-scale producers and collected by traders who transport the bulk over greater distances to regional markets. Transportation costs, because of the low value-to-bulk ratio and the multiple steps involved, can significantly influence food staple prices. A recent study of agricultural supply chains in Central America shows that between 29 and 48 percent of the import prices of grains comes from logistics costs.11 Regardless of the interna-tional prices of staples foods, a large proportion of food products are sensitive to transport, ware-housing, and logistics costs.
The cost of moving goods in sub-Saharan Africa is high, transit times uncertain, and delays exceptionally long. Studies have estimated that the cost are between US$0.04–0.10 per km-ton for long-distance road transport and US$0.10-0.40 per km-ton for shorter-distance transport.12 This is much higher than road transport in OECD countries, where the estimated costs are US$0.03
11 See Jordan Schwartz’s blog on ‘Food Prices: Eating the Cost of Logistics’ at http://blogs.worldbank.org/latinamerica/food-prices-eating-the-cost-of-logistics

28
Africa Can Help Feed Africa
–0.04 for road transportation . But transport costs differ across the continent, with southern Afri-ca having significantly lower costs than western and central African (Rashid and Minot 2010).
Road infrastructure along the major international trade corridors is in fair to good condition and no longer the primary reason for high transport costs. In West Africa a recent study concludes that:
“One historical constraint that is no longer as important as was once the case is the physical condition of the regional road network… the road surface does not gener-ally constrain trucking speeds significantly… nor does it accelerate the depreciation of many of the trucks travelling along it .” (USAID 2011)
Nevertheless, trade connections in Africa were developed to link to overseas markets, and some of the key gaps in infrastructure and logistics services are between African countries. More ener-gy should therefore be invested in plugging these gaps. Even within countries, some regions face special disadvantages because of their remoteness from national markets and export gateways as well as small traffic volumes over large areas.
But investments in transport infrastructure are not enough. Improvements in infrastructure can help reduce travel time and vehicle operating costs, while other measures are needed to reduce operational and bureaucratic delays and regulatory burdens, which in many cases are the prime reason for high transport costs compared to other regions in the world. The benefits of shorter travel times will be diminished if long waiting times at the border and multiple roadblocks con-tinue along the transport network. This is also true if the lack of competition allows transporters to accrue the benefits of better infrastructure rather than passing them on to consumers and pro-ducers of food staples.
Africa needs approaches that tackle both hard infrastructure and the “soft” infrastructure (such as institutional and regulatory reforms) for transport and trade efficiency. However, the soft issues have not received as much attention as the hard infrastructure, even though they generally may have a lower cost. This could be because such reforms have to be addressed in challenging polit-ical environments and thus may have to confront vested interests. Also, the lack of well- defined monitoring systems for policy reforms means that the impacts of soft interventions are not as vis-ible to donors as are, for example, new roads.
One of the more obvious but stubbornly persistent problems is that of roadblocks (Box 5). They cause delays and offer ripe opportunities for bribe seekers. While individual delays and unofficial payments made at each roadblock are relatively small, multiple roadblocks over short distances add up to significant expense and delay, raising transport costs and undermining the efficient use of transport equipment and drivers.
To reduce transport cost, the priority now is to ensure competitive, high-quality transport and logistics services (see Box 6). As infrastructure has improved across SSA, the constraints faced in logistics services have become more pronounced. Research shows that regional corridors with
12 These rates can be significantly higher for farmers moving small quantities of goods. In Cameroon, for example, Key-ser et al. found a family farmer with a small consignment paid the equivalent of US$71.45 to move a ton of fresh cassava 130km using a shared bus, compared to US$20.31 per ton for a large farmer with a hired truck.
29
Regulatory barriers to trade undermine Africa’s potential in regional food trade
limited competition in road transport services (e.g., West Africa) face higher prices than those with more competition (e.g., Southern Africa). It is therefore important to invest in regulatory reform in the logistics services sector, including trucking, warehousing, and customs clearing and freight forwarding. One priority area will be to improve the performance of logistics services. Rwanda has prioritized such reforms and has seen reductions in transport costs.
Coordinating and linking infrastructure investments with policy reform is essential. Policy con-straints must be addressed as an integral part of programs for improving infrastructure that links food production areas to regional markets, with special attention given to linking rural areas. High
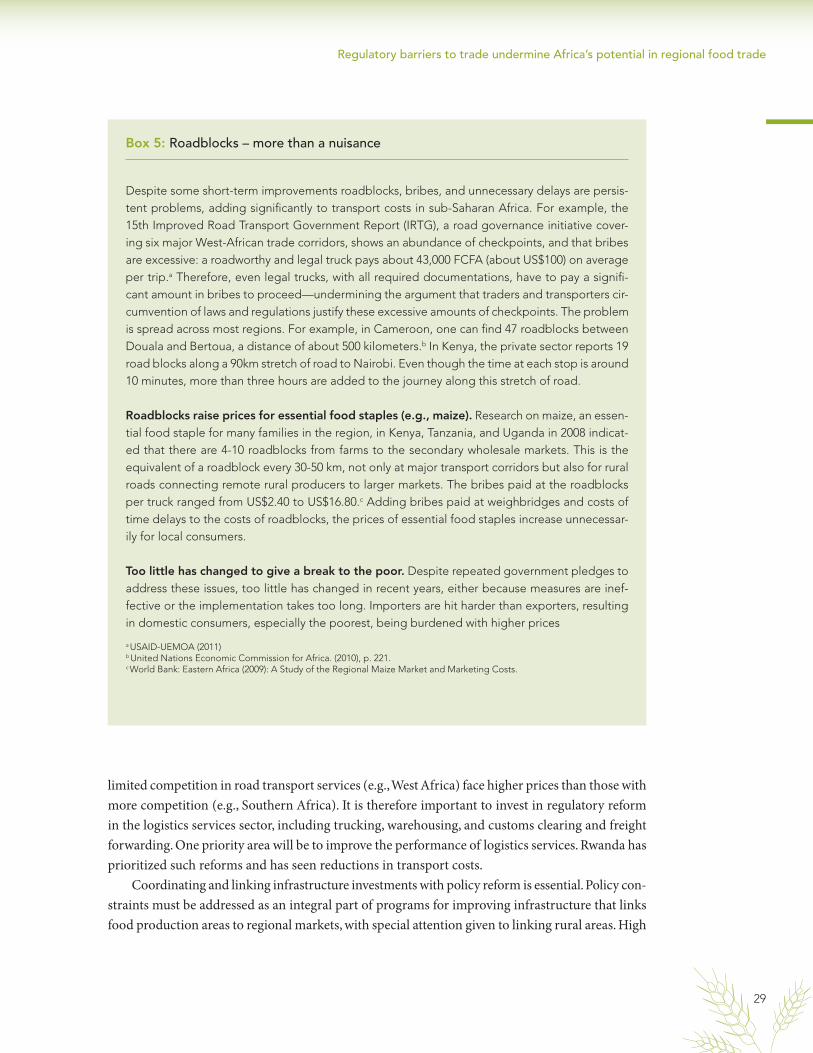
Box 5: Roadblocks – more than a nuisance
Despite some short-term improvements roadblocks, bribes, and unnecessary delays are persis-tent problems, adding significantly to transport costs in sub-Saharan Africa. For example, the 15th Improved Road Transport Government Report (IRTG), a road governance initiative cover-ing six major West-African trade corridors, shows an abundance of checkpoints, and that bribes are excessive: a roadworthy and legal truck pays about 43,000 FCFA (about US$100) on average per trip.a Therefore, even legal trucks, with all required documentations, have to pay a signifi-cant amount in bribes to proceed—undermining the argument that traders and transporters cir-cumvention of laws and regulations justify these excessive amounts of checkpoints. The problem is spread across most regions. For example, in Cameroon, one can find 47 roadblocks between Douala and Bertoua, a distance of about 500 kilometers.b In Kenya, the private sector reports 19 road blocks along a 90km stretch of road to Nairobi. Even though the time at each stop is around 10 minutes, more than three hours are added to the journey along this stretch of road.
Roadblocks raise prices for essential food staples (e.g., maize). Research on maize, an essen-tial food staple for many families in the region, in Kenya, Tanzania, and Uganda in 2008 indicat-ed that there are 4-10 roadblocks from farms to the secondary wholesale markets. This is the equivalent of a roadblock every 30-50 km, not only at major transport corridors but also for rural roads connecting remote rural producers to larger markets. The bribes paid at the roadblocks per truck ranged from US$2.40 to US$16.80.c Adding bribes paid at weighbridges and costs of time delays to the costs of roadblocks, the prices of essential food staples increase unnecessar-ily for local consumers.
Too little has changed to give a break to the poor. Despite repeated government pledges to address these issues, too little has changed in recent years, either because measures are inef-fective or the implementation takes too long. Importers are hit harder than exporters, resulting in domestic consumers, especially the poorest, being burdened with higher prices
a USAID-UEMOA (2011)b United Nations Economic Commission for Africa. (2010), p. 221.c World Bank: Eastern Africa (2009): A Study of the Regional Maize Market and Marketing Costs.

30
Africa Can Help Feed Africa
Box 6: Competing transport services – key to lower food prices for consumers
Two often-cited problems for food trade in sub-Saharan Africa are high transport costs and pric-es. Not surprisingly, sub-Saharan Africa as a region scored lower than any other region world-wide on the World Bank’s Logistics Performance Index 2010. Large parts of the continent pro-vide insufficient affordable and reliable transport and logistics services.
Lack of competition in trucking sector: The limited competition between transport services has several causes. Outdated trucking regulations foster the establishment of transport cartels, ben-efiting transporters but increasing prices for transport services and ultimately consumers. For example, the existing freight-sharing schemes, such as the trucking queuing scheme used in many parts of West Africa, leaves the trucking sector open to domination by cartels. In queuing systems, large and small firms “queue up” and loads are distributed according to the next turn. The goal of these systems has been to ensure the survival of small companies but instead has brought less competition, higher prices, and low-quality service. Teravaninthorn and Raballand cite Rwanda, which went ahead with trucking reforms in 1994: “After deregulation of internation-al transport, prices declined by more than 30 percent in nominal terms and by almost 75 per-cent in real terms when taking into account the continued increase in input prices” (Teravanin-thorn & Raballand 2009, p 23).
Little incentive to modernize: Without competition, providers of transport services have few incen-tives to modernize. Investments are not rewarded because transporters cannot freely expand loads and routes. Many transporters use outdated vehicles and overload trucks to obtain enough revenue from the restricted number of trips. Overloaded and aged trucks cause numerous prob-lems as breakdowns and accidents cost lives, money, and delays, and increase transport costs. They also damage roads and provide an argument for installing numerous weighbridges, which themselves become a problem by creating queues and an opportunity for abuse by officials in terms of demands for extra payments. For example, the queuing systems in West Africa discour-age investment in new trucks since modern trucks provide little benefit if they’re stuck in long lines waiting for access to cargo.
Lifting cabotage, quotas and other cross-border restrictions: Measures to protect landlocked countries force consumers to pay for the benefit of the transport cartels. The ECOWAS quota systems, which reserve two-thirds of loads to landlocked countries to trucks from those coun-tries, prevent more competitive fleets from expanding their market shares. Niger, for example, protects its transporters, with the result that trucks are often old; thus, inefficient trucks and the local trucking fleet lack the capacity to fill the quota. Foreign trucks have to pay an extra fee to the Nigerien shipping council to fill the quota. Benin truckers cannot gain market share above their one-third quota; and, without competition, Nigerien truckers have little incentive to upgrade their fleets and improve service. The enforcement of queuing and quotas plus additional fees for foreign trucks increases prices for food staples for consumers (Zerelli and Cook 2010, p.9). Mean-while, Niger is a net-food importing country with serious food insecurity for significant parts of its population, according to the FAO.
(continued on next page)

31
Regulatory barriers to trade undermine Africa’s potential in regional food trade
transaction costs compromise the ability of small-scale food producers, most of whom are women, to benefit from regional trade. Their remoteness from regional and in some cases domestic markets is exacerbated by poor connecting logistics infrastructure and expensive and unreliable services. As a result, both scale and geographical alienation raise the risk that large numbers of people and sig-nificant chunks of territory in Africa will remain excluded from regional supply chains. Obviously, this diminishes the opportunities for poverty eradication through trade and regional integration.
Transport costs are especially high for producers in rural areas. World Bank (2009) concludes that “transport prices per ton-km from farm-gate to primary markets are three to five times larger than those from secondary to wholesale markets located in the countries capitals. As a result, about 45 percent of average transport charges occur during the first 28 percent of the transport distance.”
Current research suggests that the “first mile” is usually the biggest hurdle in helping small-scale producers in isolated communities gain market access (Kunaka 2011). For decades, trade initiatives hinged mostly on infrastructure investment to improve small producers’ access to markets. Some evidence points to a strong correlation between road infrastructure upgrading (ensuring all-season access) and reductions in poverty and growth in consumption in isolated areas (Warr 2005; Dercon and Hoddinott 2005). Again though, infrastructure upgrading is not enough to significantly reduce trade costs and allow farmers and small-scale producers to secure key inputs (seeds, fertilizer, etc.) and higher prices for their products. This access depends on (a) the prices they receive compared to the prices they face; (b) the costs of moving produce and inputs between secondary and primary markets and farm gates; (c) the degree of market information asymmetries; and (d) the availability of market competition among buyers, sellers, and transporters (Raballand 2010a).
In turn, affordability of logistics services to attain market access it is also crucial: producers’ transport prices depend upon the fixed and variable costs of moving goods per unit, unit values of products, volumes carried, and how competitive these services are. Depending on the scale and pro-ductivity of farming and other activities, as well as the unit value of the goods and the location of production, different optimal combinations of intermediate means of transport and consolidation will emerge (Raballand 2010a). Unless strategies are developed to improve the quality of logistics
Why things have not moved—political economy: Any reforms where the status quo benefits a small group and the costs are borne by many are difficult. The challenge of activating a critical mass for consensus and reforms is often huge. Groups in danger of losing their privileges will fight restructuring. Nevertheless, the potential gains to the economy and to food producers and consumers are substantial. An analysis of proposed transport reforms for parts of West Africa suggests that a 12.5 percent reduction in transport costs is achievable within five-years and a 50 percent reduction in transport costs within 10 years (Bromley et al. 2011, p.84).
Box 6: Competing transport services – key to lower food prices for consumers (continued)

32
Africa Can Help Feed Africa
infrastructure and services at the sub-national level, then large numbers of people may not bene-fit from deeper regional integration.
Producers in one country need to link with consumers in another; and the benefits that accrue in the neighboring country must be considered when transport policy and infrastructure invest-ments are defined. Actions to improve transport services within a country often have significant positive spillovers on neighbors. For example, Abdulai et al. (2006) estimate that a 50 percent decline in transportation costs in Mozambique, while increasing real agricultural GDP in Mozambique by seven percent, leads to a rise in agricultural GDP in Malawi of three percent. Hence, regional coordination on transport and other services reforms will deliver more reform than would oth-erwise occur and, if it leads to regional opening up of transport services, will deliver greater com-petition and lower prices for transport services. However, as discussed in the next section, factors related to political economy have limited transport reform in many regions, even where indepen-dent research shows that reforms have benefited the whole economy.
Opaque and unpredictable trade policies undermine regional food trade
Trade policy for food staples in Africa can be unpredictable and discretionary and not defined in clear objectives relating to agricultural policy. Common problems include: export and import bans; variable import tariffs and quotas; restrictive rules of origin; price controls; government tenders for the import of crops and flour that are then sold at subsidized prices. Countries ban imports dur-ing good harvest years to ensure domestic production is consumed first, and limit exports during periods of low yields.
Export restrictions, in particular, decrease food security. Farmers are unable to secure higher prices in neighboring markets and so may shift to producing other crops or reduce output, creating losses to the economy as a whole. Lower output prices then result in lower incentives for farmers to increase output, which hurts net buyers since food staple output is kept below potential. Thus, food trade restrictions may exacerbate the price spiral and instability in regional markets, especial-ly when implemented in an ad hoc and uncoordinated manner by different countries at the same time. Increased volatility may in turn worsen food security in neighboring countries.
In addition, uncertainty over trade policy and the sudden imposition of export bans can hold back extension and advisory services. Farmers may hesitate to invest in new techniques, and pro-fessionals may refrain from providing their services where trade barriers might undermine the benefits from increased productivity.
There is often a lack of transparency in decisions governing food staples trade policy; and in most countries decisions to introduce or remove food trade restrictions are poorly commu-nicated. Sometimes, small groups of officials decide on bans via unpublished decisions or inter-nal documentation. This can result in bans by border officials each season merely as a season-al “norm,” or to bans extending beyond their legal life because customs officials don’t know the bans have expired.

33
Regulatory barriers to trade undermine Africa’s potential in regional food trade
“Last year we had a contract to deliver corn to Niger but were stopped at the bor-der because of an export ban . And who knows from where these bans were being ordered? Such export bans not only limit access to food—they discourage farmers . We look for the best markets . If we don’t have exterior markets, we don’t have an incentive to produce .” 13
In Tanzania, the use of export bans has left crops rotting in the fields, with substantial income loss for farmers.13 The persistence of these barriers and uncertainty about their implementation can erase regional trade and often ensure that domestic food prices will exceed the cost of import-ing food. NTBs raise transactions costs for firms, farms, and consumers alike, and can result in a supply vacuum even during critical periods of low local food supplies and high prices. They lower the prices farmers receive for their produce in food surplus areas and increase consumer prices paid in food deficit ones.
NTBs also increase food price volatility (Govereh 2007). Production booms and busts in food staples, when confined to small domestic markets, can quickly lead to collapses and surges in prices. Food prices are more unstable in countries that restrict trade than in countries with open borders. Empirical findings suggest that food price instability is high in countries like Malawi and Zambia (for maize); moderate in Mozambique and Mali (for maize); and low in Mali (for rice) and Kenya (Chapoto and Jayne 2007). In Zambia it was estimated in 2007 that a 30 percent boost in maize production would lead to a 50 percent fall in prices, if borders remain closed.
However, when policy makers allow maize exports to neighboring DR Congo, the export par-ity price becomes a price floor, limiting the decline in prices to about one-half (see Table 4). Open-ing regional borders to food staple trade can therefore contribute to both agricultural growth in food surplus zones and to food security in deficit ones by increasing farmer incentives to produce in the former and by dampening price spikes in the latter.
An underlying policy objective of self-sufficiency, while seen as a way of de-linking from glob-al markets to avoid volatility, frequently results in more volatility than in world markets. This is because any individual market will have more variable supply than an integrated and more diversified
Table 4: Trade policy impacts on maize prices in Zambia
Maize price under alternative trade regimes (Percentage change from normal)
Maize harvest Closed border Open border
Bumper harvest (30% above normal)
–50% –26%
Drought (30% below normal)
+150% +36%
Source: Dorosh, Dradri, and Haggblade (2007).
13 Comments from a cross-border trader in West Africa, Source: USAID West Africa Trade Hub. 14 In2EastAfrica, December 12, 2011.

34
Africa Can Help Feed Africa
market—the same reason why investors spread risks by diversifying their assets portfolio rather than putting all their eggs in one basket. Hence, food price stability will be more likely if countries exploit their comparative advantages to export more comprehensively by linking to regional and global markets and avoiding ad hoc interventions that discourage local production.
Trade policy restrictions also drive cross-border trade from formal into informal channels. Because handling for small consignments—with transfers from truck to bicycle and back on to trucks—to avoid border controls is costly, NTBs raise trade costs and widen food prices margins within regional markets. For example, at the peak of the last food crisis maize retail prices in Lilongwe (Malawi) were in the range of US$368/ton compared to US$240–290 in Zambia (Jayne et al. 2009).
SSA countries that have resisted using NTBs to limit their food staple trade (South Africa, Uganda, Mali, and Mozambique) and adopted more open border policies for these products have seen benefits through higher production, exports, and trade. For example, Uganda’s position as a net food exporter, particularly to Southern Sudan, Western Kenya, and organic markets in Europe, has become especially important with the government fighting domestic political pressure to limit food exports as a way of reducing the country’s high food prices (Box 7).
Net food importing countries in other regions of the world have also benefited from liberal-izing trade in food staples. In South Asia, trade liberalization in Bangladesh, Nepal, and Sri Lanka has raised competition and lowered domestic prices. It has also helped to smooth seasonal fluctu-ations with the narrowing of seasonal highs and lows in rice prices between the 1980s and 2000s. In Bangladesh, India has replaced Thailand as the main supplier of rice, with the real price of rice falling by 2.57 percent per year between 1981 and 2003. Similarly, in Nepal nearly 10 percent of the rice consumed now comes from India. Following trade liberalization in Sri Lanka, rice prices have fallen by 34 percent, resulting in a 45 percent increase in demand and a 33 percent increase in calorie intake (IFPRI 2010).
One NTB that afflicts trade in staples and the inputs to staples production relates to standards and their enforcement at the border. While an effective standards system is critical to a market based agricultural system open to trade, as will be subsequently discussed in more detail, the absence of standards and the lack of capacity to ensure compliance with regulations can be a major barrier to trade. Regional integration of food markets not only allows for the free movement of food across borders but also offers an opportunity for a common approach to food safety—including plant health, pests, and disease—at lower cost.
However, food safety and sanitary and phytosanitary standards (SPS) rules and regulations for food staples differ across SSA countries despite many having similar agro-ecological con-ditions for pests and diseases, and similar demands on food safety. This means that food staple imports must often meet different food safety and SPS declarations between importing countries. Food producing companies in Kenya can export to developed markets in Japan, Europe, and Sin-gapore, which each have strict regulations, yet are unable to export to countries on the continent because of regulations.
Food quality standards also vary from one country to another and stifle the formalization and commercialization of regional trade in African food staples, especially where traders are unaware of the destination country’s standards and only learn of them at the port of entry. For example, the
35
Regulatory barriers to trade undermine Africa’s potential in regional food trade
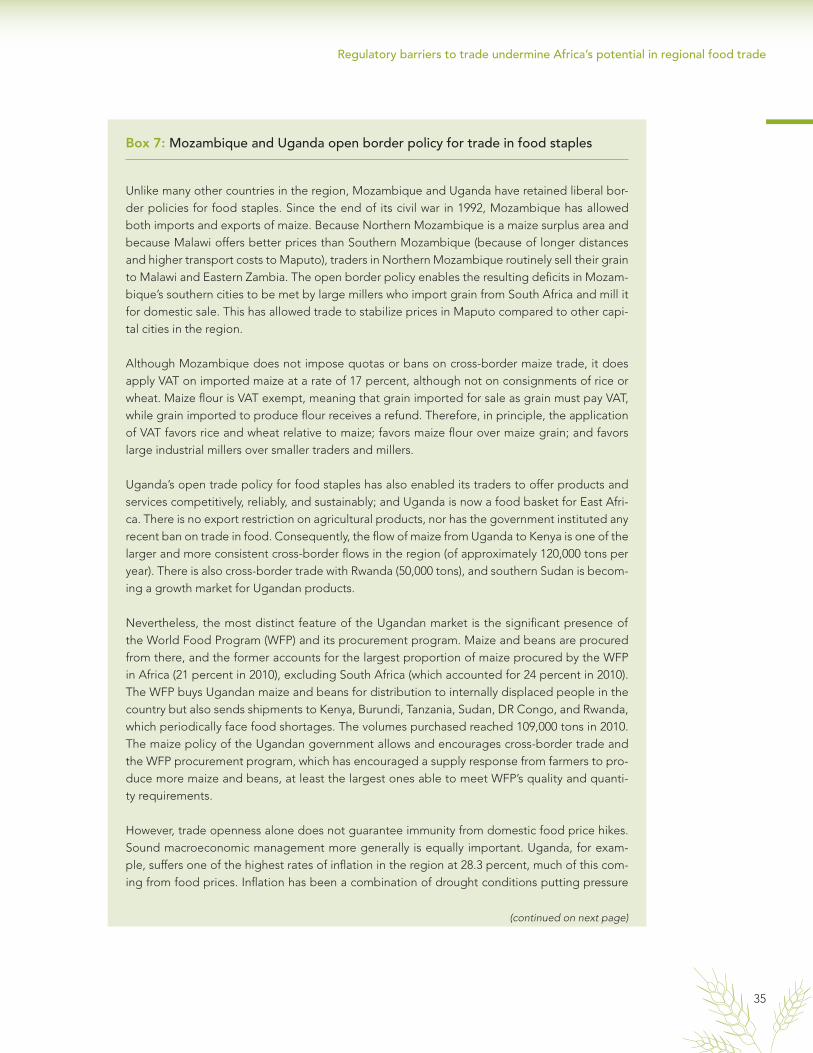
Box 7: Mozambique and Uganda open border policy for trade in food staples
Unlike many other countries in the region, Mozambique and Uganda have retained liberal bor-der policies for food staples. Since the end of its civil war in 1992, Mozambique has allowed both imports and exports of maize. Because Northern Mozambique is a maize surplus area and because Malawi offers better prices than Southern Mozambique (because of longer distances and higher transport costs to Maputo), traders in Northern Mozambique routinely sell their grain to Malawi and Eastern Zambia. The open border policy enables the resulting deficits in Mozam-bique’s southern cities to be met by large millers who import grain from South Africa and mill it for domestic sale. This has allowed trade to stabilize prices in Maputo compared to other capi-tal cities in the region.
Although Mozambique does not impose quotas or bans on cross-border maize trade, it does apply VAT on imported maize at a rate of 17 percent, although not on consignments of rice or wheat. Maize flour is VAT exempt, meaning that grain imported for sale as grain must pay VAT, while grain imported to produce flour receives a refund. Therefore, in principle, the application of VAT favors rice and wheat relative to maize; favors maize flour over maize grain; and favors large industrial millers over smaller traders and millers.
Uganda’s open trade policy for food staples has also enabled its traders to offer products and services competitively, reliably, and sustainably; and Uganda is now a food basket for East Afri-ca. There is no export restriction on agricultural products, nor has the government instituted any recent ban on trade in food. Consequently, the flow of maize from Uganda to Kenya is one of the larger and more consistent cross-border flows in the region (of approximately 120,000 tons per year). There is also cross-border trade with Rwanda (50,000 tons), and southern Sudan is becom-ing a growth market for Ugandan products.
Nevertheless, the most distinct feature of the Ugandan market is the significant presence of the World Food Program (WFP) and its procurement program. Maize and beans are procured from there, and the former accounts for the largest proportion of maize procured by the WFP in Africa (21 percent in 2010), excluding South Africa (which accounted for 24 percent in 2010). The WFP buys Ugandan maize and beans for distribution to internally displaced people in the country but also sends shipments to Kenya, Burundi, Tanzania, Sudan, DR Congo, and Rwanda, which periodically face food shortages. The volumes purchased reached 109,000 tons in 2010. The maize policy of the Ugandan government allows and encourages cross-border trade and the WFP procurement program, which has encouraged a supply response from farmers to pro-duce more maize and beans, at least the largest ones able to meet WFP’s quality and quanti-ty requirements.
However, trade openness alone does not guarantee immunity from domestic food price hikes. Sound macroeconomic management more generally is equally important. Uganda, for exam-ple, suffers one of the highest rates of inflation in the region at 28.3 percent, much of this com-ing from food prices. Inflation has been a combination of drought conditions putting pressure
(continued on next page)

36
Africa Can Help Feed Africa
allowable moisture content for imports of maize is set at 13 percent in Tanzania, 13.5 percent in Kenya, and 14 percent in Uganda. The tolerance for insect damage is one percent in Uganda, two percent in Kenya, and three percent in Tanzania.15 Malawi requires that maize should meet the fol-lowing requirements: maximum of 14 percent moisture content, maximum of 2.6 percent of for-eign matter, maximum of 11.5 percent of broken grains, and aflatoxin of 3ug per kilogram. Policy reforms to move these different national frameworks towards simplicity, transparency, harmoni-zation, and equivalence in regulations would ease cross-border trade.
The consequences of the status quo are costly for traders who fail to meet food standards. The usual courses of action are either the return of the consignment to the country of origin, quarantine, or destruction of the consignment, all at the trader’s expense. Rejections on the grounds of stan-dards can be reduced if food staple standards are harmonized across the region, based on interna-tional standards where appropriate, and properly administered rather than having border author-ities apply country-specific standards.
Most African regional trade arrangements (RTA) focus on harmonization and cooperation in the area of standards, with the others trying to develop frameworks in this area.16 For example, COMESA has defined a list of the most commonly traded commodities within the region. Of these, regional-ly harmonized standards have been developed for approximately 300 products, including maize and maize flour, rice, wheat, wheat flour, and cereals. It is also establishing a harmonized SPS regime with a regional certification scheme, the COMESA Green Pass, at the center of this for ensuring its imple-mentation (Box 8). Efforts like the Green Pass, which encourage member states to recognize each other’s conformity assessment procedures, could be developed to boost regional trade in food staples.
ECOWAS, SADC, and EAC also have regional standards harmonization processes. But appli-cation remains lacking. In SADC, for example, only Namibia and Swaziland, which recently creat-ed national standards bodies of their own, have adopted all 78 (to date) of the SADC-defined har-monized standards for the region.
on normally bountiful harvests, currency depreciation in light of the Eurozone confidence crisis, and the surge in global food and fuel prices. With the economy already close to full capacity, and the monetary policy responses to the shock not robust, both food and non-food price increases have escalated dramatically in recent months.
Source: Adapted from Haggblade et al. (2008); World Bank (2009a); and IMF (2011).
Box 7: Mozambique and Uganda open border policy for trade in food staples (continued)
15 These requirements are now being harmonized under the EAC.16 COMESA, EAC, SADC, WAEMU, and ECOWAS have all developed SPS frameworks, while IGAD, CEN-SAD and ECCAS are planning to develop them (Magalhaes, 2010).
37
Regulatory barriers to trade undermine Africa’s potential in regional food trade
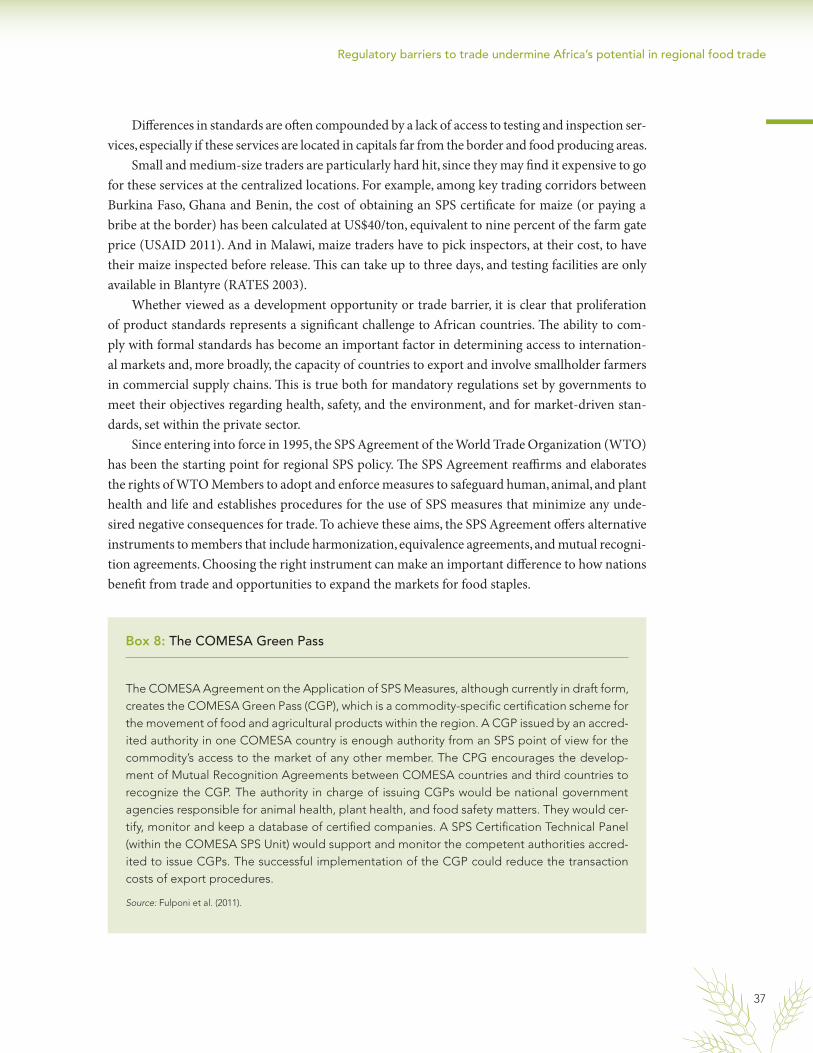
Differences in standards are often compounded by a lack of access to testing and inspection ser-vices, especially if these services are located in capitals far from the border and food producing areas.
Small and medium-size traders are particularly hard hit, since they may find it expensive to go for these services at the centralized locations. For example, among key trading corridors between Burkina Faso, Ghana and Benin, the cost of obtaining an SPS certificate for maize (or paying a bribe at the border) has been calculated at US$40/ton, equivalent to nine percent of the farm gate price (USAID 2011). And in Malawi, maize traders have to pick inspectors, at their cost, to have their maize inspected before release. This can take up to three days, and testing facilities are only available in Blantyre (RATES 2003).
Whether viewed as a development opportunity or trade barrier, it is clear that proliferation of product standards represents a significant challenge to African countries. The ability to com-ply with formal standards has become an important factor in determining access to internation-al markets and, more broadly, the capacity of countries to export and involve smallholder farmers in commercial supply chains. This is true both for mandatory regulations set by governments to meet their objectives regarding health, safety, and the environment, and for market-driven stan-dards, set within the private sector.
Since entering into force in 1995, the SPS Agreement of the World Trade Organization (WTO) has been the starting point for regional SPS policy. The SPS Agreement reaffirms and elaborates the rights of WTO Members to adopt and enforce measures to safeguard human, animal, and plant health and life and establishes procedures for the use of SPS measures that minimize any unde-sired negative consequences for trade. To achieve these aims, the SPS Agreement offers alternative instruments to members that include harmonization, equivalence agreements, and mutual recogni-tion agreements. Choosing the right instrument can make an important difference to how nations benefit from trade and opportunities to expand the markets for food staples.
Box 8: The COMESA Green Pass
The COMESA Agreement on the Application of SPS Measures, although currently in draft form, creates the COMESA Green Pass (CGP), which is a commodity-specific certification scheme for the movement of food and agricultural products within the region. A CGP issued by an accred-ited authority in one COMESA country is enough authority from an SPS point of view for the commodity’s access to the market of any other member. The CPG encourages the develop-ment of Mutual Recognition Agreements between COMESA countries and third countries to recognize the CGP. The authority in charge of issuing CGPs would be national government agencies responsible for animal health, plant health, and food safety matters. They would cer-tify, monitor and keep a database of certified companies. A SPS Certification Technical Panel (within the COMESA SPS Unit) would support and monitor the competent authorities accred-ited to issue CGPs. The successful implementation of the CGP could reduce the transaction costs of export procedures.
Source: Fulponi et al. (2011).

38
Africa Can Help Feed Africa
In the SPS Agreement, harmonization is merely an encouragement to base standards on inter-national ones, not a mandatory requirement. The basic rule is that standards must be science-based, which may be proven either by applying international standards or through risk assessment. The emphasis on harmonization therefore arises from the role it plays in the legal defense against a potential challenge to SPS measures. A WTO member can avoid the burdensome requirement of having to provide a risk assessment by harmonizing their standards with international ones there-by making this approach a popular choice when in fact it may not be the most efficient instrument or even a feasible one.
Indeed, despite the perceived advantages of harmonization this approach has been the subject of much controversy. In the first place, there is considerable misunderstanding about the legal status of harmonization in the SPS Agreement whereby many capacity-building projects have assumed that the harmonization of domestic standards with international ones is compulsory. This misperception has often led governments and the donors that support them to view standards harmonization as a goal in itself rather than a means to an end. As a result, many standards in Africa have been copied almost verbatim from the Western ones with little or no consideration for the impact of the regula-tions or for the capacity of producers and inspection agencies to comply with the new requirements.
The use of harmonization to pursue trade facilitation in developing countries is also contro-versial because international standards primarily reflect developed country conditions. SPS prob-lems in African countries differ from those in developed countries, with African countries having only limited capacity to tackle those problems. Many international standards, for example, assume the existence of a conformity assessment infrastructure that may not exist in developing countries and/or can only be established for a high cost. Moreover, in developed countries, domestic standards often approach, if not exceed, the international ones, meaning that harmonization is mainly a ques-tion of making minor adjustments to match international norms. In Africa, on the other hand, mak-ing domestic standards equal to the international ones can demand a revolutionary new approach to standards management with considerable upgrading of inspection and public outreach capabil-ities for the new standards to work. Without basic awareness and promotion of good practices for hygiene and safety, for example, higher-level investments in standards diplomacy or development of advanced laboratory capabilities can have little practical benefit and may even be counterproductive.
Standards harmonization therefore carries important risks. Harmonized standards are of lit-tle value if they cannot be implemented. Worse, advanced standards themselves can be used as a non-tariff barrier if full compliance cannot be verified. There is also a risk of excluding small farm-ers and traders from the market if they are unable to comply with the new standards and/or if the standards raise the price of delivering a compliant product beyond the level consumers can afford. Box 9 highlights these issues with the case of harmonized standards in the EAC for maize.
Equivalence agreements, whereby trade partners recognize that each country’s respective stan-dards, despite being different, achieve similar levels of protection, are an alternative to harmoni-zation in the WTO SPS Agreement. Equivalence can be achieved in a variety of ways, including formal agreements to recognize the equivalence of SPS measures, agreements on equivalence for specific products, or ad hoc agreements on the equivalence of specific technical aspects of certain SPS measures. System-wide equivalence is naturally more complex to negotiate and achieve, but

39
Regulatory barriers to trade undermine Africa’s potential in regional food trade
product-specific equivalence is less burdensome and can be a good way for developing countries to achieve acceptable levels of SPS protection.
Mutual recognition agreements are a third trade facilitation instrument provided for in the WTO SPS Agreement whereby two countries may agree to accept certain aspects of each other’s SPS measures. These aspects need not be the same (i.e. be harmonized) or equivalent (i.e. result in identical protection levels), yet both parties still agree to accept the trade of goods regulated by these different systems. Often such acceptance is used in situations where differences in national regulatory measures and objectives are considered to be less important than trade objectives. Con-sequently, mutual recognition is less demanding to negotiate and can be more expedient and effec-tive than harmonization or equivalence in facilitating trade. In practice, mutual recognition agree-ments are most likely to be established between countries that are in some kind of political or legal association with each other and often occur between neighboring countries with a long tradition of trading food and other SPS-regulated products.
Hence while harmonization of standards can offer important benefits for facilitating trade, it is important that the standards process at the regional level is defined openly with the participa-tion of all interested stakeholders and proposed solutions are assessed carefully relative to alterna-tive options. When a small group of technocrats defines harmonized standards, with little analysis of impacts on markets and competitiveness, standards can be overly restrictive.
There are also issues about norms relating to the size of bags allowed for packaging grains. For example, in Kenya and Tanzania the convention is to use a 90kg bag for maize, while Malawi and Zambia use 50kg bags. This can bring about the costly situation of grains being discharged from one bag size and repacked into a different bag at the border.
Quantifying the impact of these non-tariff barriers to trade is important in identifying their impact, mobilizing support for their removal, and prioritizing from among the many barriers those which should be addressed first. Among the problems preventing open and inclusive discussions of food trade policies in Africa are the lack of comprehensive data on the range of policies being applied; and a careful analysis of the magnitude and impact of the barriers to trade they create. Box 10 summarizes work underway to remedy this, although much more needs to be done. The initial estimates suggest that the impacts of non-tariff barriers on food trade in Africa can be substantial, raising prices for basic products by more than 30 percent.
Crossing borders to deliver food staples to neighbors is costly and dangerous
When you look at a country you start with its borders and if already things don’t work at the border won’t you ask yourself ‘what will I find in the interior?16
17 Celestin Bashige, Professor and Regional Trade Expert, University of Bukavu. Taken from Les Petites Barrières, a video on cross-border conditions in the east of the DRC, available to watch at www.worldbank.org/afr/trade

40
Africa Can Help Feed Africa
Box 9: Regional quality standards for food staples in Africa: Harmonization not always appropriate
In the East Africa Community, a decision was made to harmonize the standards for food staples on a regional basis. Prior to harmonization each country in East Africa has different national quality standards for maize grain with different tolerances for moisture content, Aflatoxin, and damaged or discolored grains, among other factors. A regional policy paper produced for the COMESA and EAC Secretariats by the USAID-funded Regional Agriculture Trade Expansion Support Pro-gram (RATES), identified these differences as a “technical barrier to trade,” and recommended that the standards be harmonized across the entire EAC and COMESA region.
The EAC has developed standards covering at least 42 staple foods. In the case of maize, for example, a first set of East African Standards (EAS) were adopted in 2005 while revised Final Draft East African Standards (FDEAS) are now awaiting final approval. East African Standards come up for review every five to six years and the preparation of new FDEAS is an ongoing part of EAC standards management. Table 5 compares the current, 2005 harmonized EAC standards for maize grains with the international Codex standard. As shown, the “domesticated” EAC standards are in several cases more demanding than the Codex standard meaning the EAC has not harmo-nized strictly with international norms. This is particularly true with regard to maximum moisture content where the EAC standard is significantly more demanding than Codex. The EAC stan-dards also include a specification for total defective grain that did not exist in Kenya and Ugan-da before harmonization and is not part of Codex.
The Table also compares the current EAC Standards (EAS) for maize grains with the revised Final Daft East African Standards (FDEAS). Since coming into force in 2005, formal sector traders have complained that the EAS are difficult to meet and impose high costs for sourcing acceptable grain and proving compliance. As long as the maize is fit for human consumption and does not pose any other animal or plant health risk, grain traders say they should be free to buy and sell whatever type of product there is a market for. As shown, the FDEAS go some way to relaxing the trade requirements by creating new specifications for Grade 3 maize, but even this level is still more demanding than Codex while the FDEAS also propose to tighten the tolerance for mois-ture content and introduce new testing requirements for Fumonisin.
On the one hand, the EAC’s approach of establishing different grades for maize is consistent with private sector systems used for determining a commodity’s value, yet at the same time, the EAS (and FDEAS) still create several problems for regional trade. In the first place, the East Africa SQMT (Standardization, Quality Assurance, Metrology and Testing) Act makes standards compli-ance mandatory and states that no product shall be allowed into the region that does not meet the minimum specifications. To the extent that problems with broken, discolored, and shriveled grains often arise for reasons completely unrelated to mycotoxin, maize with a high share of these characteristics can be kept out of the region on spurious grounds. Moreover, EAC-SQMT Act commits member states to ensure that domestic standards are fully harmonized with the East Africa ones, technically meaning that any grain that does not fully comply with EAC minimum standards requirements cannot be traded in domestic markets either.
(continued on next page)

41
Regulatory barriers to trade undermine Africa’s potential in regional food trade
Unlike East Africa where standards for food staples are mandatory, traders in Zambia and other Southern Africa countries say they use standards more as reference point so that buyers and sell-ers know what they are dealing in and how to assess the commodity’s value. Quality attributes and SPS concerns that do not impact directly on human or animal and plant health are not reg-ulated by law as in the EAC.
Thus far, for example, the Zambia National Bureau of Standards (ZABS), Zambia Food Reserve Agency (FRA), and Zambia Agricultural Commodity Exchange (ZAMACE) each have their own different definitions and grading systems for the quality attributes of maize. None of these stan-dards, including the ones set by ZABS, are mandatory. Contrary to the view that says lack of har-monization is a non-tariff barrier, grain traders in Lusaka and Johannesburg report that the cur-rent system works perfectly well, whereby buyers specify the quality attributes they require and leave it to the seller to match those requirements. Public health and other SPS concerns are still addressed through phytosanitary regulations, but other factors that are of commercial importance
Table 5: Comparison of current and final draft East African standards for maize with Codex
Current 2005 EAS FDEAS (now pending) CODEX
Grade 1 Grade 2 Grade 1 Grade 2 Grade 3 Standard
Moisture content (maximum)
13.5% 13.5% 13% 13% 13% 15%
Aflatoxin (max) 10 ppb 10 ppb 10 ppb 10 ppb 10 ppb Set by CODEXAflatoxin B1 5 ppb 5 ppb 5 ppb 5 ppb 5 ppb
Fumonisin — — 2 ppb 2 ppb 2 ppb
Foreign matter 0.5% 1% 0.5% 1% 1.5% 1.5%
Inorganic matter 0.25% 0.5% 0.25% 0.5% 0.75% 0.5%
Broken grains 2% 4% 2% 4% 6% 6%
a. Insect damaged grains 1% 3% 1% 3% 5% 7%
b. Rotten, diseased grains 2% 4% 2% 4% 5% 7%
c. Discolored grains 0.5% 1% 0.5% 1% 1.5% 2%
d. Other colored grains — — — — — —
e. Live insect infestation — — — — — —
f. Immature/shriveled grains
1% 2% 1% 2% 3% —
Total defective grain (Sum a to f)
4% 5% 4% 5% 7% —
Filth 0.1% 0.1% 0.1% 0.1% 0.1% 0.1%Source: RATES, 2003; EAC, 2005; EAC, 2011; CODEX, 1995.
Box 9: Regional quality standards for food staples in Africa: Harmonization not always appropriate (continued)
(continued on next page)

42
Africa Can Help Feed Africa
are left for buyers and sellers to decide. In practice, most transactions in Zambia are based on the ZAMACE grading system, which in turn is modeled on the SAFEX standards in South Afri-ca. Table 6 provides a side-by-side comparison of the EAC Standards and ZAMACE standards.
In comparing the EAC and ZAMACE standards, several important differences stand out. First are the tight restrictions on the maximum share of discolored, immature, and shriveled grains in the EAC. In Zambia, the vast majority of marketed maize is now produced by smallholder farmers
Box 9: Regional quality standards for food staples in Africa: Harmonization not always appropriate (continued)
(continued on next page)
Table 6: Comparison of draft EAC standards and ZAMACE standards
FDEAS (now pending) ZAMACE standards
Grade 1 Grade 2 Grade 3 A Grade B Grade C Grade
Moisture content (maximum)
13% 13% 13% 12.5% 12.5% 12.5%
Aflatoxin (max) 10 ppb 10 ppb 10 ppb n/s n/s n/s
Aflatoxin B1 5 ppb 5 ppb 5 ppb n/s n/s n/s
Fumonisin 2 ppb 2 ppb 2 ppb 0.5% 0.5% 0.5%
Foreign matter 0.5% 1% 1.5% 1% 1.5% 2%
Inorganic matter 0.25% 0.5% 0.75%
Broken grains 2% 4% 6% 6% 7% 8%
a. Insect damaged grains 1% 3% 5% 3% 6% 9%
b. Rotten and diseased grains (EAC); Diseased grains (ZAMACE)
2% 4% 5% 2% 2% 2%
c. Discolored grains 0.5% 1% 1.5% 3% 6% 9%
d. Other colored grains — — — 3% 4% 5%
e. Fungal damaged grains
f. Immature/shriveled grains
1% 2% 3% 1% 1.5% 2%
Total defective grains (Sum a to f)
4% 5% 7% 11% 18.5% 26%
Germinated grains n/s n/s n/s Nil Nil Nil
Pass through 4.15mm sieve (max)
n/s n/s n/s 1.5% 2% 2.5%
Diplodia (ear rot) n/s n/s 0.1% Nil Nil Nil
Filth 0.1% 0.1% 0.1% 0.1% 0.1% 0.1%Source: EAC, 2005; EAC 2011; ZAMACE, 2008.Notes: Current 2005 EAS identical to FDEAS except do not include specifications for Grade 3 maize or testing requrie-ment for Fumonsin. ZAMACE standard for foreign/inorganic matter defined as “extraneous matters”. n/s = not specified.

43
Regulatory barriers to trade undermine Africa’s potential in regional food trade
and is therefore a sundried product with uneven color. Sun bleached maize is perfectly safe to consume and merely yields flour that is less than snow white so is only important to appearance and a miller’s financial return. Similarly, immature and shriveled grains are common in smallhold-er maize for reasons completely unrelated to mycotoxin. These grains result in lower milling out-turn, but are otherwise very safe to consume.
Zambia currently has the world’s largest surplus of non-genetically modified white maize equal to a stock of over 1.5 million tons available for export. In practice, however, large traders includ-ing the World Food Programme, say the EAC requirements make it difficult and expensive to export this grain to Kenya where there is strong demand for commercial and humanitarian pur-poses. The very tight restrictions on total defective grains (4–7 percent in the EAC compared with 11–26 percent according to ZAMACE) were identified as a particular constraint to trading Zambian smallholder maize for the reasons previously described. Moreover, because the maize marketing system in Zambia is not well geared to inspect for quality on reception, exporters say they typically have to visit several depots at a reported cost US$2.50 per ton per place inspect-ed to find maize that meets the EAC’s requirements. After sourcing EAC compliant grain, pre-shipment certification and testing can add anywhere from US$0.50 to more than US$3.00 per ton to the cost of trade with similar or even higher inspection and testing costs arising on entry to the EAC. Rather than create a more favorable trading environment for small- and medium-scale business people, therefore, the EAC standards can actually prevent these operators from par-ticipating in the market.
As shown, there are also important differences in the EAC and ZAMACE standards for Aflatoxin. While Aflatoxin can indeed be a serious health risk, traders say this is extremely rare in Southern Africa because of there being only one rainy season unlike East Africa where there are two rainy seasons per year. In this regard, grain traders say that the EAC’s mandatory testing requirement is not needed for maize in Southern Africa and that any attempt to extend mandatory Aflatoxin test-ing to this region as part of harmonized standards regime would only add unnecessarily to cost.
Differences in moisture content are another important factor. Because maize in Zambia is main-ly stored in the open under tarpaulin covers, 12.5 percent moisture is considered the maximum acceptable level to avoid grain rot. In the EAC, on the other hand, where there is a generally a wetter climate and maize is usually stored in a shed, 13 percent to 14 percent moisture is consid-ered realistic and acceptable. In South Africa, maize is typically stored in modern silos in which 14 percent moisture is acceptable and therefore this number is the quality benchmark used by the South African Futures Exchange (SAFEX).
Finally, it should be noted that any attempt to promote compliance with regional EAC standards needs to be supported with appropriate marketing policies and quality control systems in the exporting country. In Zambia, the Food Reserve Agency (FRA) has recently been buying maize
Box 9: Regional quality standards for food staples in Africa: Harmonization not always appropriate (continued)
(continued on next page)

44
Africa Can Help Feed Africa
from smallholder farmers at subsidized prices higher than import parity. As a social function, the FRA rarely rejects smallholder maize meaning that there is no penalty or reward for on-farm grad-ing or other types of quality control that could help meet the EAC requirements. ZAMACE has been carrying out a project funded by USAID to train farmers in on-farm grading, but says this initiative has been undermined by the FRA’s marketing polices. Moreover, the FRA does not buy grain from commercial farmers and sells to local mills for less than import parity. Consequently, commercial farmers that could fairly easily grow the type of maize required by the EAC are not able to earn an attractive price and have more or less switched away from maize as a cash crop in favor of other more profitable commodities.
Box 9: Regional quality standards for food staples in Africa: Harmonization not always appropriate (continued)
Box 10: Quantifying the effects of non-tariff barriers on African food staples
Until recently, quantifying the price-raising effect of NTBs was constrained by the availability of comparable data across countries. Thanks to a collaborative effort between the World Bank and other agencies, including UNCTAD and the African Development Bank, a new wave of data col-lection was undertaken in 2009–10. So far, 30 countries have been covered, with NTBs coded according to the 2009 MAST nomenclature for each of the Harmonized System’s 5,000 product lines. Combining this data with price data collected as part of the World Bank’s International Com-parison project (for a smaller set of products) made it possible, using econometric methods, to estimate directly the price-raising effect of NTBs on African food staples.
The approach used consisted of running regressions of country-level product prices on “dummy” (binary) variables marking the application of NTBs of various types, using a panel of 1,260 coun-try-product pairs. The regressions control for systematic differences in cost-of-living (COL) across countries, as well as in market-structure diversity across products, with a full array of country and product fixed effects. Interaction terms between NTBs and either region or country dummies pro-vide tentative estimates of their price-raising effect in Africa or in specific countries.
As normal with this type of exercise, results should be interpreted with caution, as many confound-ing influences can affect estimates. Although many controls are used in the regressions to limit these confounding influences, they put heavy demands on the data and result in many coefficients
(continued on next page)

45
Regulatory barriers to trade undermine Africa’s potential in regional food trade
being estimated with large confidence intervals. Be that as it may, results, shown graphically in the figure below, are telling. On average Africa’s SPS measures, which often suffer from a lack of harmonization, poor design and haphazard enforcement, raise the price of food staples by 13–15 percent. Quantitative restrictions, where they are applied (the database so far covers only imper-fectly temporary bans and does not cover export restrictions) add another 20 percent. Such price increases have the potential to affect significantly the real income of poor households.
Price-raising effect of NTMs, Africa average (all affected products)a
Product-specific effects are even more difficult to quantify than averages. With all appropriate caveats, estimates suggest substantial effects of SPS regulations in Kenya on rice prices (+42 per-cent), meat (+34–37 percent), fish (+33 percent), and edible oils and fats (29 percent). Rice prices seem to be similarly affected in Uganda (+30 percent), as are meat and fish prices (+41 percent).
Figure 7: Price raising effect of NTMs on rice in Kenya
SPS (A)
Region FE Country FE
–15
–20
–10
–5
0
5
10
15
20
25
TBT (B) PSI &form alities
(C)
Pricecontrols
(D)
QRs (E)
Source: Cadot et al, 2012
a The vertical axis measures the price-raising effect of NTMs in percentage points after correction for tariffs and systematical cost-of-living (COL) differences. Dark grey bars give coefficient estimates from a regression including an All-Africa dummy and vector of interaction terms; the light-grey bars are from a regression including a full set of country-specific dummies and interactions. This latter approach is less vulnerable to confounding influences, but is more demanding on the data and there-fore returns more frequently insignificant estimates, marked here by transparent, dotted-line bars. All regressions include product-fixed effects and allow for an unrestricted covariance structure within products.
Box 10: Quantifying the effects of non-tariff barriers on African food staples (continued)

46
Africa Can Help Feed Africa
Hundreds of thousands of Africans are crossing borders daily to deliver food staples from areas of relative surplus to areas where prices are higher. This essential arbitrage activity, which brings benefits to both producers in surplus areas and consumers in deficit areas, is in many cases subject to financial and physical risks. For example, cross-border trade is the key means of supplying vital food products and other commodities to cities and towns on the borders of countries in the Great Lakes region, such as of Goma, Bukavu. Such trade directly and indirectly employs approximately 22,000 persons in the Goma/Gisenyi area, while an estimated 500 to 1,000 cross-border traders are established in Bukavu, probably generating ten times as many derived jobs in the border region of South Kivu province.18 The monthly value or cross-border trader imports in Goma coming from Rwanda is estimated in excess of US$1 million. Between 1,800 and 2,000 crossings are estimat-ed to take place at Petite Barrière in Goma and 900 per day at the Ruzizi border post in Bukavu.
Throughout Africa women dominate cross-border trade, which provides an essential source of income to many households. While the vast majority of small traders are women, most of the offi-cials who regulate the border are men. A recent survey of cross-border traders in the Great Lakes region supports studies elsewhere in Africa that show that cross-border traders regularly have to pay bribes and suffer harassment.19 The responses from the detailed interviews and focus groups paint a dark picture of the conditions poor women cross-border traders experience in the Great Lakes region—that is, serious risks and losses each time they cross the border. Figure 7 summa-rizes the main findings. Payment of bribes is a regular occurrence for the majority of traders, and many also report having their goods confiscated and having to pay fines. A large number of traders report being subject to acts of violence, threats, and sexual harassment. They are exposed to beat-ings, verbal insults, stripping, sexual harassment, and even rape, much of which goes unreported. This lack of economic and physical security and safety undermines the livelihoods of these traders and compounds their lack of access to finance, information, and business knowledge.
Providing security at the border and implementing a transparent and predictable regime for those crossing the border would help trade, improve incomes, contribute to regional food security, and secure greater stability in the region. In many cases, the large number and range of officials at the border should be reduced.20 And aggravating the situation, both traders and officials are either unfamiliar with the rules and regulations that govern cross-border movements of goods and peo-ple, or there is just a lack of transparency. Reducing the number of border agencies and officials and increasing the transparency and predictability of the policy regime will be crucial to creating an environment where traders flourish and expand.
There has been little support in Africa for institution building at internal borders. A common perception of informal trade would be border trade that seeks to avoid formal rules and institutions. At many of the border crossings the formal institutions are at best very weak, and the complexity
18 International Alert report “La Traversée,” June 2010.19 World Bank (2011a).20 For example, in the DRC four agencies are legally entitled to be present at the border: Customs, Immigration, Hygiene service, and Quality Control service. Nevertheless, officials from between 10 to 15 different agencies are often operating at the border. While extreme this is not untypical of borders elsewhere in Africa.

47
Regulatory barriers to trade undermine Africa’s potential in regional food trade
and lack of transparency of rules and regulations governing cross-border trade encourages harass-ment and bad behavior by officials as well as disobedience by traders. Informal traders—especial-ly poor women food traders—usually lack representation, making them vulnerable and without recourse to contesting official decisions and actions. And without knowledge of the regulations and obligations, traders are more easily exploited. For example, Congolese women taking products from Congo to sell in Burundi are often required to pay a tax by officials when they exit the coun-try, yet there are no official export taxes.
Communities are pulled apart economically by the costs of getting across borders. Analysis of market level price data suggests that crossing the border into the DRC is a major hurdle for traders of food products. In a study of the prices of key food products such as maize and cassava in differ-ent markets in the DRC, Burundi and Rwanda, Brenton and Portugal (2011) find that, after taking into account both product and market specific factors, as well as proxies for the costs of transport-ing goods between markets, there is an additional effect for markets on different sides of a border: The effect of crossing the Burundi-Rwanda border on relative prices is equivalent to pushing the two markets an additional 174 km or 4.6 hours further apart.
However, crossing the Burundi-DRC border is equivalent on average to pushing markets in each country 1824 km or 41 hours further apart, whereas crossing the DRC-Rwanda border is equivalent to adding an extra 1,549 km and an additional 35 hours. This suggests that there are major barri-ers to cross-border trade between the DRC and Burundi and Rwanda, and that there are substan-tial opportunities for trade to play a greater role in integrating food markets in the region. Hence, there would be very large economic pay-offs from interventions that reduce the size of the border and promote freer movement of goods and people across the border. Similar analysis using data from markets in West Africa on prices of maize, rice, and cowpea suggest that the effect on relative prices of crossing the Niger-Nigeria border is equivalent to pulling markets an additional 639 km apart, whereas the Nigeria-Chad border effect is equivalent to 594 km.
Figure 8: Bringing staples across borders can be a risky business
Bribes Confiscation of goods
Acts ofviolence,
threats and sexual
harassment
Fines Long waits Rudebehavior,
verbal abuseand insults
10%
0%
20%
30%
40%
50%
60%
70%
80%
90% 85%
38%
54%60%
19%
38%
Reported frequency of risks from a survey of 181 traders at four border posts between the DRC and Burundi, Rwanda, and Uganda in 2010

48
Africa Can Help Feed Africa
When moving formal consignments of food staples across borders, traders also face a host of repetitive fees, permission requirements, redundant documentation/procedures, and uneven cer-tificate of origin requirements. As a result, customs clearance in many SSA countries involves long delays, even for goods that should require minimum clearance times. Individually, most of these requirements may be a small delay or expense to traders, but collectively they represent a signifi-cant barrier to trade.
Even where single entry documents (SED) have been introduced, the information and accom-panying documents required from traders (for example, import declaration forms, origin certifi-cates, invoices, import permits, and standards compliance stamps) remain burdensome, and small cross-border traders may be unable to provide the required information for the entry document.
For example, if original invoices are a condition for customs clearance, then cross-border traders may be unable to obtain invoices from their suppliers if these happen to be small farmers or small traders in the source countries based near cross-border markets. Similarly, if certificates of origin are required to be eligible for tariff preferences or permits required to trade at all, then access to these is often limited since their issuance is usually from centralized capitals or regional towns, which can be far from the food staple trading zones. In Tanzania, all certificates and per-mits can only be obtained in person in Dar-es-Salaam. In Kenya, permits to legally import grain are only available in Nairobi (Nyameino et al. 2003). Traders wanting to export food staples from Northern Mozambique to Southern Malawi have to get an export permit from Quelimane (Tsch-irley et al. 2005).
Consequently, cross-border trade is either subject to tariffs, effectively prohibited or, more commonly, pushed into informal channels. These regulatory obstacles impose transactions costs on traders that bring about lower demand and lower prices for farmers while increasing prices for consumers.
There have been some attempts to simplify customs procedures for small traders. For exam-ple, for trade between Zambia, Zimbabwe, and Malawi, COMESA has devised a Simplified Trade Regime (STR) (see Box 11). In West Africa, under ECOWAS and UEMOA, agricultural goods do not require a certificate of origin: however, they do require SPS certification and, depending on the country of export, traders may require export permits. For example, Mali requires export autho-rization for livestock and an “Intent to Export” form.
But these efforts have had little success in helping trade. The pilot of the COMESA STR has been sparsely used and appears to have increased rather than reduced crossing times (since trad-ers have to fill out two forms and wait for ASYCUDA data capture). In addition, under STR, trad-ers are now being identified as commercial players, whereas they may not have been before, imply-ing they must now pay additional taxes, (e.g., US$10 customs processing fee (at each border), VAT, and excise for some commodities) all of which discourage informal traders from declaring their goods for customs processing. And, of course, the other requirements for trade (e.g., export/import permits; sanitary and phytosanitary certificates) are unaffected by the STR. These requirements are costly and centrally managed, leading many small traders to continue breaking bulk consignments into smaller ones to avoid border controls.

49
Regulatory barriers to trade undermine Africa’s potential in regional food trade
It would be useful to define a set of standards of basic rights and obligations for small traders, and then display the standards openly at all border posts in the local language. This would support small traders in developing their businesses as well as encourage a safe and predictable environ-ment at the border. It would also help build trust between traders and border officials. The inter-national community could then support governments to provide training to officials, encourage
Box 11: The COMESA Simplified Trade Regime (STR) for Zambia, Zimbabwe and Malawi
The STR is a pilot scheme designed to overcome problems with small traders needing to prove that goods have originating status to be exempt from import duties under the COMESA cus-toms union. It was developed for small consignments, currently defined as being below US$500. For these, traders can fill out a Simplified Customs Document, which is accepted by customs in place of the full document that must be filled out by a customs clearance agent. In addition, for certain products the normal proof of origin required at a COMESA border post is relaxed and a Simplified Certificate of Origin can be used instead, although goods must still meet COME-SA origin requirements.
Ordinary COMESA origin certificates are usually issued at capital cities and must be stamped by the customs authorities. At the border a trader must normally present the stamped certificate of origin together with an invoice and the customs document declaring the goods to the customs officer in the importing country. Under the STR, governments have agreed bilaterally on a list of products that do not require ordinary origin certificates for small consignments but can instead use the Simplified Certificate of Origin. The lists of eligible products are displayed at the bor-der posts and the Simplified Certificates of Origin can also be obtained there; they are signed by the customs office.
Beyond the Simplified Customs Document and Simplified Certificate of Origin, the STR makes no other changes to the border requirements for trade in small consignments. These remain the same and include travel documentation for immigration as well as licenses and certificates for agricultural produce. The latter usually must be obtained from the offices of ministries of agri-culture and often involve export permits and phytosanitary certificates stating that the products are free from disease.
STR requires an average of 1–4 hours to cross. In terms of transactions that use STR, the number has been dwindling over time although they have stabilized at Livingstone and Mwami. For all borders that use STR the average number of STR transactions is less than 100 per month. Chirun-du and Mwami have the highest values of transactions that use STR, approaching an average of US$250 per transaction. However, values generally remain low as most of the items on the STR list are low value products.
Sources: COMESA (2010) and COMESA (2011).

50
Africa Can Help Feed Africa
trader associations, and improve the basic infrastructure at the border. Annex 1 provides examples of issues that could be included in the standards.
Inefficient distribution services hamper regional trade in staples and contribute to food insecurity in Sub-Saharan Africa
Distribution services, comprising retail distribution, wholesale distribution, commission agents’ trade, franchising services, and electronic commerce, are a crucial link between farmers, food proces-sors, manufacturers, and consumers. The performance of the sector affects consumer welfare, price levels, and trade because its transport costs and margins are a significant proportion of final prices.
In addition, the change in the nature of distribution systems, such as the emergence of modern distribution outlets and the increased internationalization of the sector across sub-Saharan Afri-ca, is driving a rapid transformation of the region’s retail food sector, with important implications for intra-regional trade in food staples. For example, the integration and centralization of super-markets’ procurement and warehouse systems could defragment the market for staples through regional distribution centers that allow coordinated procurement over a set of countries. This trend would mirror intra-firm trade across countries.
But at this stage distribution services are not linking poor producers to domestic and foreign consumers. Several factors can explain this outcome. First, informality prevails and lack of access to finance, uneven cash flows, absence of management knowledge, and highly fragmented and inef-ficient supply chains limit the operational capacities of informal operators. Second, the majority of small-scale farmers remain marginalized by the distribution sector and its new practices. Third, reg-ulatory barriers, poor infrastructure, insecurity, and cumbersome import processes constrain trade activities of formal distribution operators. Fourth, very poor households at the bottom of the income pyramid pay higher prices for basic goods, including food staples, than do wealthier consumers.
Designing a comprehensive reform strategy linked to national development plans will first require raising awareness about the importance of distribution services in facilitating intra-regional trade in food staples and addressing food security issues. The priority should then be on including smallholders in food distribution channels and addressing the concerns of the poorest households.
Collective action remains an important strategy for increased smallholder participation in mar-ket exchanges. Organized associations and collective marketing strategies are effective in reducing transaction costs, while storage facilities are important to minimize post-harvest losses, mitigate price volatility, and address food security concerns.
Facilitating access to financial services in the informal sector is also important as is helping tra-ditional and informal operators to acquire skills. For example, training courses focusing on basic hygiene standards, merchandising, sampling, or promotion techniques offered in the slums could improve the skills of retailers in wet markets, kiosk sellers, or hawkers.
Policy actions to improve access to and participation of smallholders in modern distribution chains include (a) encouraging horizontal coordination such as farmer associations and cooperatives
51
Regulatory barriers to trade undermine Africa’s potential in regional food trade
to increase the bargaining power of small farmers, allow for economies of scale, and lower mar-keting and negotiation costs; and (b) ensuring there are incentives for the development of private storage facilities to alleviate the large post-harvest losses facing small-scale farmers.
Steps should also be taken to eliminate the regulatory barriers that limit competition, and trade and investment in the distribution sector. Reforms should focus on developing the regula-tory frameworks for modern distribution services, including rules and regulations affecting the business environment. The lack of licensing and operation rules for distribution companies, inad-equate codes on investment, commerce, labor and taxation, as well as the lack of bankruptcy pro-cedures, create significant uncertainty, and encumber firms trying to conduct business operations in the formal distribution sectors of African countries.
Finally, improvements to regulatory frameworks should eliminate disproportionate entry requirements, such as lengthy registration procedures, multiple licenses, or inadequate zoning reg-ulations. Price controls imposed across the region and among the cartels in several African coun-tries present a serious impediment to competition, and should be removed.
Many of the restrictions to trade discussed in this section raise transaction costs and increase the gap between producer and consumer prices. This gap often contributes to farmers preferring to consume their own production rather than exploit what would otherwise be profitable oppor-tunities in nearby markets in neighboring countries. Measures that reduce this mark-up will ben-efit both producers and consumers, and decrease distributional issues that often surround food trade policies. In addition to their direct costs, these trade barriers add to other problems of food staples production (see Box 12 on post-harvest losses) and can constrain the development of insti-tutions designed to address some of the key market failures afflicting agricultural markets, includ-ing those that ameliorate risk.

52
Africa Can Help Feed Africa
Box 12: The problem of post-harvest loss
The value chain analysis of food staples in SSA focuses on the costs and barriers of production and trade in the region. One cost component of agricultural products and a major contributor to food insecurity is the significant loss after harvest experienced in many parts of Africa. Those losses are for a multitude of reasons: physical deterioration, loss of nutritional value and con-tamination, and economic and monetary losses, such as a lack of access to markets. The need to improve food productivity in the Africa region to keep pace with urbanization and popula-tion growth underlines the importance of reducing post-harvest losses. The African Postharvest Losses Information System (APHLIS) has estimated that physical losses for grain (before process-ing) could be 10 to 20 percent, representing losses of US$1.6 billion per year, or about 13.5 per-cent of the total value of grain production (US$11 billion) for Eastern and Southern Africa alone. A decline of these losses could provide an additional contribution to better food security and lower consumer prices.
Improving post-harvest losses along the value chain of food staples can be achieved with the help of technical changes, such as bagging procedures and new technical solutions for harvest-ing and cleaning; but removing transport and border barriers and more enabling regulations are also important. Long delays at the border can cause loss of food products—for example, need-less requirements for inspections that result in multiple up- and off-loading of commodities cause damage and loss that could have been avoided. Better access to agricultural extension workers can also contribute to better adoption of available low-cost technical solutions to avoid losses and improve food safety.
Source: World Bank (2011b).