rehabilitative adult tricycle adult tricycle a major qualifying project report submitted to the...
TRANSCRIPT

Project Number: HXA 1503
Rehabilitative Adult Tricycle
A Major Qualifying Project Report
Submitted to the Faculty
of the
WORCESTER POLYTECHNIC INSTITUTE
in partial fulfillment of the requirements for the
Degree of Bachelor of Science
in Mechanical Engineering
by
Eric Correia
Jaime Espinola
James Gruenbaum
John Papa
Date: April 28, 2016
Advisors:
Professor Holly Ault
Professor Allen Hoffman
This report represents the work of WPI undergraduate students. It has been submitted to the faculty as evidence of
completion of a degree requirement. WPI publishes these reports on its website without editorial or peer review.

i
Abstract
Each year, 800,000 people experience a stroke in the United States, and many develop
hemiparesis, a weakness occurring on one side of the body. Exercise is proven to be helpful in recovery
from stroke. The goal of this project was to develop a human-powered device that can aid in recovery
from a stroke, while also serving a recreational purpose. This project resulted in the creation of a tricycle,
which stores the pedaling energy of the strong leg with a spring in order to assist the weak leg in pedaling.
Testing with force plates demonstrated that the force required to pedal the weak side with the highest
spring constant was 49% lower than the baseline with no spring. The tricycle was a good proof of concept
and with further modifications could be a viable tricycle in the future.

ii
Acknowledgements
The following people and organizations greatly assisted in the completion of this project, and we
would like to thank them for their support:
Scott Guzman: Scott is a WPI alumnus. He provided us with feedback about the feasibility of
many aspects of our design and provided us with advice about how to improve the design. In
addition, Scott performed all of the welding for the build, including the seat extender, frame, and
the spring sprocket support plate. Scott’s welding was very helpful, as none of the group
members had prior experience welding.
Burt Seger: Burt owns a small machine shop in Jefferson, MA. His machining work greatly
expedited the manufacturing process. In just two brief visits, Burt was able to machine both the
spring sprocket plate and the handlebar extenders to our desired specifications. In addition, Burt
was very hospitable, allowing us to run some of his machines, and giving us advice to assist us in
our future careers.
Worcester Earn-a-Bike: This organization allows volunteers to earn their own bike for free in
exchange for performing work for the shop. The staff of Earn-a-Bike are very knowledgeable
about bikes, and helped us install the brakes and sprockets to the tricycle. In addition, they sold
us many of the components of our design for a reasonable price, including the BMX bike we
used as part of the frame, and the cranksets we used to connect the spring sprocket mechanism.

iii
Authorship
Abstract ...................................................................................................................................................... EC
Introduction ................................................................................................................................................ EC
Literature Review .................................................................................................................................... ALL
Strokes .................................................................................................................................................... JE
Goals for Rehabilitation .......................................................................................................................... JG
Benefits of Recreational Therapy .................................................................................................... JE, EC
Existing Therapies and Devices ........................................................................................................ JE, JP
Mechanics Involved in Cycling ............................................................................................................. EC
Mechanisms ............................................................................................................................... EC, JP, JG
Goal Statement ............................................................................................................................................ JE
Design Specifications ........................................................................................................................... JE, EC
Power Adjustability ......................................................................................................................... JE, EC
Ergonomics ...................................................................................................................................... JE, EC
Cost .................................................................................................................................................. JE, EC
Manufacturability ............................................................................................................................. JE, EC
Safety ............................................................................................................................................... JE, EC
Range of Motion .............................................................................................................................. JE, EC
User Requirements ........................................................................................................................... JE, EC
Stability ............................................................................................................................................ JE, EC
Preliminary Design Concepts.................................................................................................................. ALL
Design 1: Piston ..................................................................................................................................... EC
Design 2: Motor ..................................................................................................................................... EC
Design 3: Planetary Gear ........................................................................................................................ JG
Design 4: Continuously Variable Transmission (CVT) .......................................................................... JP
Design 5: Push Pedal ........................................................................................................................ JG, JE
Design 6: Spring Resistance ............................................................................................................. JG, JE
Analysis of Initial Design Concepts........................................................................................................ ALL
Power Mechanisms ................................................................................................................................. JE
Remaining Tricycle Components............................................................................................................ JE
Tipping Analysis ..................................................................................................................................... JP
Selection of Best Concepts ......................................................................................................................... JE
Power Mechanism ................................................................................................................................... JE
Remaining Design Components ............................................................................................................. JE
Selection of Final Design ........................................................................................................................ ALL
Propulsive Force Calculations ................................................................................................................ JG
Performance Analysis ............................................................................................................................. JG
Input Force Comparisons .................................................................................................................. JG, JE
Mechanism Bounding Conditions .................................................................................................... EC, JP
Size and Complexity Analysis ............................................................................................................... EC
Decision Matrix ...................................................................................................................................... JE
Final Design ................................................................................................................................................ JG

iv
Frame Selection and Modification .......................................................................................................... JG
Spring Mechanism and Support Structure .............................................................................................. JG
Spring ...................................................................................................................................................... JG
Design Analysis .................................................................................................................................... JG, JE
Design Structural Analysis ..................................................................................................................... JG
Spring Bracket Analysis ......................................................................................................................... JG
Seat Extender Analysis ..................................................................................................................... JG, JE
Manufacturing ...................................................................................................................................... EC, JP
Machined Parts....................................................................................................................................... EC
Welding ............................................................................................................................................ EC, JP
Additional Modifications ....................................................................................................................... EC
Assembly ............................................................................................................................................... EC
Testing ...........................................................................................................................................JG, JE, EC
Safety and Functionality Testing ........................................................................................................... EC
Qualitative Testing .................................................................................................................................. JE
Quantitative Testing ................................................................................................................................ JG
Results ................................................................................................................................................... JG, JE
Qualitative Results .................................................................................................................................. JE
Quantitative Results ................................................................................................................................ JG
Analysis of Results ............................................................................................................................... JG, JE
Analysis of Qualitative Results ............................................................................................................... JE
Analysis of Quantitative Results ............................................................................................................. JG
Conclusion .............................................................................................................................................. ALL
Recommendations ................................................................................................................................ EC, JP
Appendix A: Tricycle Safety Standards ............................................................................................... EC, JE
Appendix B: Remaining Component Pictures ............................................................................................ JE
Appendix C: Tipping Analysis ................................................................................................................... JP
Position and Weight of the Center of Gravity ......................................................................................... JP
Appendix D: Additional Design Considerations for Selection of Best Concepts ....................................... JE
Appendix E: Propulsive Force Calculations ......................................................................................... JG, JE
Appendix F: Additional Design Considerations for Selection of Final Design .......................................... JE

v
Table of Contents
Abstract .......................................................................................................................................................... i
Acknowledgements ....................................................................................................................................... ii
Introduction ................................................................................................................................................... 1
Literature Review .......................................................................................................................................... 2
Strokes ...................................................................................................................................................... 2
Goals for Rehabilitation ............................................................................................................................ 3
Benefits of Recreational Therapy ............................................................................................................. 4
Existing Therapies and Devices ................................................................................................................ 5
Mechanics Involved in Cycling ................................................................................................................ 9
Mechanisms ............................................................................................................................................ 13
Goal Statement ............................................................................................................................................ 19
Design Specifications .................................................................................................................................. 20
Power Adjustability ................................................................................................................................ 20
Ergonomics ............................................................................................................................................. 21
Cost ......................................................................................................................................................... 21
Manufacturability .................................................................................................................................... 21
Safety ...................................................................................................................................................... 22
Range of Motion ..................................................................................................................................... 22
User Requirements .................................................................................................................................. 23
Stability ................................................................................................................................................... 24
Preliminary Design Concepts...................................................................................................................... 25
Design 1: Piston ...................................................................................................................................... 25
Design 2: Motor ...................................................................................................................................... 26
Design 3: Planetary Gear ........................................................................................................................ 27
Design 4: Continuously Variable Transmission (CVT) .......................................................................... 31
Design 5: Push Pedal .............................................................................................................................. 32
Design 6: Spring Resistance ................................................................................................................... 34
Analysis of Initial Design Concepts............................................................................................................ 36
Power Mechanisms ................................................................................................................................. 36
Remaining Tricycle Components............................................................................................................ 38
Tipping Analysis ..................................................................................................................................... 42
Selection of Best Concepts ......................................................................................................................... 44
Power Mechanism ................................................................................................................................... 44
Remaining Design Components ............................................................................................................. 51
Selection of Final Design ............................................................................................................................ 60
Propulsive Force Calculations ................................................................................................................ 60
Performance Analysis ............................................................................................................................. 62
Input Force Comparisons ........................................................................................................................ 70
Mechanism Bounding Conditions ........................................................................................................... 72
Size and Complexity Analysis ................................................................................................................ 75
Decision Matrix ...................................................................................................................................... 76

vi
Final Design ................................................................................................................................................ 77
Frame Selection and Modification .......................................................................................................... 77
Spring Mechanism and Support Structure .............................................................................................. 79
Spring ...................................................................................................................................................... 80
Design Analysis .......................................................................................................................................... 82
Design Structural Analysis ..................................................................................................................... 82
Spring Bracket Analysis ......................................................................................................................... 92
Seat Extender Analysis ........................................................................................................................... 96
Manufacturing ........................................................................................................................................... 103
Machined Parts...................................................................................................................................... 103
Welding ................................................................................................................................................. 105
Assembly .............................................................................................................................................. 108
Testing ...................................................................................................................................................... 114
Safety and Functionality Testing .......................................................................................................... 114
Qualitative Testing ................................................................................................................................ 114
Quantitative Testing .............................................................................................................................. 115
Results ....................................................................................................................................................... 119
Qualitative Results ................................................................................................................................ 119
Quantitative Results .............................................................................................................................. 120
Analysis of Results ................................................................................................................................... 123
Analysis of Qualitative Results ............................................................................................................. 123
Analysis of Quantitative Results ........................................................................................................... 124
Conclusion ................................................................................................................................................ 130
Recommendations ..................................................................................................................................... 132
Works Cited .............................................................................................................................................. 138
Appendix A: Tricycle Safety Standards .................................................................................................... 142
Appendix B: Remaining Component Pictures .......................................................................................... 150
Appendix C: Tipping Analysis ................................................................................................................. 160
Position and Weight of the Center of Gravity ....................................................................................... 161
Appendix D: Additional Design Considerations for Selection of Best Concepts ..................................... 175
Appendix E: Propulsive Force Calculations ............................................................................................. 181
Appendix F: Additional Design Considerations for Selection of Final Design ........................................ 182
Appendix G: Spring Bracket Analysis ...................................................................................................... 184
Appendix H: Seat Extender Buckling Analysis Calculations ................................................................... 189
Appendix I: Qualitative Testing Procedures ............................................................................................. 192
Appendix J: Quantitative Testing Procedure ............................................................................................ 198
Appendix K: Updated Subject Testing Procedure .................................................................................... 201
Appendix L: Subject Testing Results........................................................................................................ 207

vii
List of Figures
Figure 1: CAD Model of the Pool Walker (Aqua Creek Products, 2015) _________________________ 5
Figure 2: Isokinetic Exercise Machine (htherapy, 2015) ______________________________________ 6
Figure 3: Tilt Table (triwg, 2015) ________________________________________________________ 7
Figure 4: Limb Load Monitor (ASME, 2015) ______________________________________________ 7
Figure 5: Anti-gravity Treadmill (Alterg, 2015) _____________________________________________ 8
Figure 6: Split Belt Treadmill (Woodway, 2015) ____________________________________________ 9
Figure 7: Recumbent Tricycle (tyrx.com) _________________________________________________ 11
Figure 8: Centrifugal and Tangential Forces during Pedaling (Fonda, 2010) ____________________ 12
Figure 9: Torque Converter Cross-Section (How Stuff Works, 2015) ___________________________ 15
Figure 10: Pulley Driven CVT (Pratte, 2014) _____________________________________________ 16
Figure 11: Toroidal CVT, 1:1 Ratio (Harris, 2015) _________________________________________ 16
Figure 12: Toroidal CVT, High Ratio (Harris, 2015) _______________________________________ 17
Figure 13: Differential (Nice, 2000) _____________________________________________________ 18
Figure 14: Piston Design Concept ______________________________________________________ 25
Figure 15: Motor Design _____________________________________________________________ 26
Figure 16: Motor Design Force Curves __________________________________________________ 27
Figure 17: Planetary Gear Design ______________________________________________________ 28
Figure 18: Torque Splitter ____________________________________________________________ 29
Figure 19: Reducer __________________________________________________________________ 29
Figure 20: Torque Splitter Side View ____________________________________________________ 30
Figure 21: Toroidal CVT Design _______________________________________________________ 32
Figure 22: Push Pedal Design Sketch, A: Side View of Four Bar Mechanism; B: Front View ________ 33
Figure 23: 3D Model of Push Pedal Mechanism ___________________________________________ 34
Figure 24: Spring Resistance Mechanism Sketch (angles measured from horizontal) ______________ 35
Figure 25: 3D Model of the Spring Resistance Mechanism ___________________________________ 35
Figure 26: Plot of Rollover Velocity while Turning on an Inclined Surface ______________________ 43
Figure 27: Powered Wheel Free Body Diagram ___________________________________________ 61
Figure 28: Piston Input Torque Required Versus Position in Pedaling Cycle for Spring Constants 100
N/m to 1900 N/m ____________________________________________________________________ 63
Figure 29: Spring Resistance and Push Pedal Input Torque Required Versus Position in Pedaling Cycle
for Spring Constants 200 N/m to 2000 N/m _______________________________________________ 64
Figure 30: Piston Design _____________________________________________________________ 65
Figure 31: Crank Slider Mechanism Definition (Norton 1999) ________________________________ 66
Figure 32: Slider Displacement vs Crank Rotation _________________________________________ 67
Figure 33: Slider Crank Applied Piston Force (METU, nd.) __________________________________ 68
Figure 34: Diagram of Slider Crank Mechanism (METU, nd.) ________________________________ 68
Figure 35: Pedal Crank Torque versus Angle (k = 100:2000 N/m) _____________________________ 69
Figure 36: Piston Design Pedal Forces __________________________________________________ 71
Figure 37: Spring Resistance Design Pedal Forces _________________________________________ 71
Figure 38: Boundary Box for the Spring Resistance Mechanism _______________________________ 73
Figure 39: Boundary Box for the Piston Mechanism ________________________________________ 74
Figure 40: Boundary Box for the Spring Resistance Mechanism _______________________________ 75
Figure 41: MOBO Triton Pro (Mobo Triton Pro Ultimate Ergonomic Cruiser, 2015) ______________ 77
Figure 42: Custom Front End __________________________________________________________ 78
Figure 43: Chain Profile _____________________________________________________________ 80

viii
Figure 44: Spring Performance Curves __________________________________________________ 81
Figure 45: Support Structure __________________________________________________________ 83
Figure 46: Typical Coupler Plate Connection Stack-Up _____________________________________ 83
Figure 47: Secondary Sprocket Section w/ Applied External Spring Load _______________________ 85
Figure 48: Geometry Analyzed using FEM _______________________________________________ 86
Figure 49: FEM Boundary Conditions ___________________________________________________ 87
Figure 50: FEM Mesh _______________________________________________________________ 88
Figure 51: Von-Mises Fringe Plot, Bottom View ___________________________________________ 89
Figure 52: Von-Mises Fringe Plot, B1 Interface (Section A-A) ________________________________ 90
Figure 53: Minimum Factor of Safety at B2 Section ________________________________________ 90
Figure 54: Spring to Sprocket Interface __________________________________________________ 91
Figure 55: Cantilevered Beam FBD (Beam Deflection Formulae) _____________________________ 91
Figure 56: Spring Bracket Location _____________________________________________________ 93
Figure 57: Simplified Geometry and Spring Bracket Free Body Diagram _______________________ 94
Figure 58: Free Body Diagram of Spring Bracket from Points A to B __________________________ 95
Figure 59: Free Body Diagram of Spring Bracket from Points B to C __________________________ 95
Figure 60: Axis of Orientation for Analysis of Seat Extender _________________________________ 97
Figure 61: Free Body Diagram of the Seat Extender Plate ___________________________________ 98
Figure 62: MathCAD to Solve for Forces Acting on the Bolts _________________________________ 99
Figure 63: Area Over Which the Shear Stress Acts _________________________________________ 99
Figure 64: MathCAD to determine the Shear Stresses Acting on the Bolt _______________________ 100
Figure 65: Simplified Free Body Diagram Showing Eccentric Buckling of the Seat Extender _______ 101
Figure 66: Plate with Tie Rod Ends ____________________________________________________ 104
Figure 67: Outside Profile of Handlebar Extender ________________________________________ 105
Figure 68: Frame with Welding Fixture _________________________________________________ 106
Figure 69: Welding of Plate to Channels ________________________________________________ 107
Figure 70: Fully Installed Seat Extender ________________________________________________ 109
Figure 71: Chain and Tie Rod Alignment ________________________________________________ 110
Figure 72: Bracket Installed into Plate Assembly _________________________________________ 110
Figure 73: Spring Connected to Frame and Sprocket ______________________________________ 112
Figure 74. Spring Attached to Sprocket _________________________________________________ 112
Figure 75: Force Sensor showing Load Cell Array ________________________________________ 115
Figure 76: Force Sensor Applied Pressures ______________________________________________ 116
Figure 77: Load Cell Used (Load Sensor – 50kg) _________________________________________ 116
Figure 78: Load Cell Internal Wiring___________________________________________________ 117
Figure 79: Load Sensor Wiring Diagram ________________________________________________ 117
Figure 80: Pedal Force Control, No Spring ______________________________________________ 120
Figure 81: Strong Leg Pedal Forces with three different springs _____________________________ 121
Figure 82: Weak Leg Pedal Forces with three different springs ______________________________ 121
Figure 83: Peaks and Valleys of Pedal Forces ____________________________________________ 125
Figure 84: Recumbent Pedaling Cycle __________________________________________________ 126
Figure 85: Upright Relative Pedal Force (Allen, Blasius & Puttre, Pp. 73) _____________________ 127
Figure 86: Pedal Force Calculations Updated for Manufactured Tricycle ______________________ 129
Figure 87: Attachment of spring to sprocket, detailing limited number of attachment points ________ 134
Figure 88: National Instruments X-Series DAQ Box (National Instruments, 2016) _______________ 136
Figure 89: Illustration of a Bicycle and its Part ___________________________________________ 143
Figure 90: Diagram Demostrating Area on a Bicycle where there can be no Protrusions __________ 144

ix
Figure 91: Three Wheel, Single in Rear (Bicycleman, 2015) _________________________________ 150
Figure 92: Three Wheel, Single in Front (Target, 2015) ____________________________________ 150
Figure 93: Four Wheels (Quadracycle, 2015) ____________________________________________ 151
Figure 94: Road Tire (Performance Bicycle, 2015) ________________________________________ 151
Figure 95: Multi-Use Bike Tire (maxxis.com) ____________________________________________ 152
Figure 96: Mountain Tire (Old Glory MTB, 2015) ________________________________________ 152
Figure 97: Upright Seat, No Back (Rideouttech, 2015) _____________________________________ 153
Figure 98: Upright Seat with Added Back (Morgancycle, 2015) ______________________________ 153
Figure 99: Once Piece Molded Seat with Back (Hostel Shoppe, 2015) _________________________ 154
Figure 100: Handle Bars (Kite, Bike, Surf, Rambling, 2015) _________________________________ 154
Figure 101: Tiller (Hell Bent Cycles, 2015) ______________________________________________ 155
Figure 102: Platform Pedal (The Mountain Bike Encyclopedia, 2015) _________________________ 156
Figure 103: Pedal Toe Clips (Amazon, 2015) ____________________________________________ 156
Figure 104: Clipless Bike Pedals (Art of Triathlon, 2015) ___________________________________ 157
Figure 105: Upright Design (Bike Forums, 2015) _________________________________________ 157
Figure 106: Recumbent Design (Rehabmart, 2015) ________________________________________ 158
Figure 107: Rim Brake (Bike-Riding-Guide, 2015) ________________________________________ 158
Figure 108: Drum Brakes (Chester Cycling, 2015) (chestercycling.wordpress.com) ______________ 159
Figure 109: Drum Brakes (Singletracks, 2015) ___________________________________________ 159
Figure 110: Drivetrain of a four-wheeled vehicle _________________________________________ 160
Figure 111: Bicycle Model of a Delta (left) and a Tadpole (right) Tricycle _____________________ 161
Figure 112: Free Body Diagram of the Tricycle (Side View) _________________________________ 163
Figure 113: Minimum Deceleration during Braking based on Wheelbase Length ________________ 164
Figure 114: Change of contact area of tricycle by change of surface's incline. __________________ 165
Figure 115: Diagram for Tipping Analysis ______________________________________________ 165
Figure 116: Angle ϕ2 based on Wheelbase Length _________________________________________ 166
Figure 117: Free Body Diagram of a Delta Tricycle (Huston & Johnson, 1982) _________________ 168
Figure 118: Plot of Rollover Velocity when Turning _______________________________________ 170
Figure 119: Free Body Diagram of a Delta Tricycle on an Incline (Huston & Johnson, 1982) ______ 171
Figure 120: Maximum Incline Angle until Rollover, based on Wheelbase Length ________________ 172
Figure 121: Free Body Diagram of Tricycle Turning on an Inclined Surface (Huston & Johnson, 1982)
________________________________________________________________________________ 173
Figure 122: Test Path Along the Quadrangle (Google, 2016) ________________________________ 192
Figure 123: Test Course Diagram _____________________________________________________ 198
Figure 124: Test Path along the Quadrangle (Google, 2016) ________________________________ 201

x
List of Tables
Table 1: Muscle Activation during Cycling (Fonda, 2010) ........................................................................ 10
Table 2: Gear Definitions for Planetary Mechanism ................................................................................. 30
Table 3: Power Mechanism Comparison Chart ......................................................................................... 36
Table 4: Wheel layout Comparison Chart .................................................................................................. 39
Table 5: Tire Comparison Chart ................................................................................................................ 39
Table 6: Seat Comparison Chart ................................................................................................................ 40
Table 7: Steering Comparison Chart .......................................................................................................... 40
Table 8: Pedal Comparison Chart .............................................................................................................. 41
Table 9: Frame Comparison Chart ............................................................................................................ 41
Table 10: Brake Comparison Chart............................................................................................................ 42
Table 11: Mechanism Pairwise Comparison Chart Average ..................................................................... 46
Table 12: Final Rank-Order of Design Goals for Mechanism ................................................................... 46
Table 13: Relative Weighting Factors for Mechanism ............................................................................... 47
Table 14: Numerical Weighting Factor for Mechanism Design Goals ...................................................... 47
Table 15: Ranking Criteria for Power Mechanism .................................................................................... 48
Table 16: Mechanism Component Decision Matrix Average ..................................................................... 51
Table 17: Constant Components Summary ................................................................................................. 52
Table 18: Combination 1 Morphological Chart ......................................................................................... 52
Table 19: Combination 2 Morphological Chart ......................................................................................... 53
Table 20: Combination 3 Morphological Chart ......................................................................................... 53
Table 21: Combination 4 Morphological Chart ......................................................................................... 53
Table 22: Combination 5 Morphological Chart ......................................................................................... 53
Table 23: Combination 6 Morphological Chart ......................................................................................... 53
Table 24: Tricycle Component Pairwise Comparison Chart Average ....................................................... 55
Table 25: Final Rank-Order of Design Goals for Tricycle Components .................................................... 55
Table 26: Relative Weighting Factors for Tricycle Components ................................................................ 56
Table 27: Numerical Weighting Factor for Tricycle Component Design Goals ........................................ 56
Table 28: Ranking Criteria for Tricycle Components ................................................................................ 57
Table 29: Tricycle Component Decision Matrix Average .......................................................................... 59
Table 30: Final Initial Design Combinations ............................................................................................. 59
Table 31: Pedal Force Scaling Factors (Passive Assistance Pedaling Device MQP, 2014) ..................... 70
Table 32: Average Decision Matrix for Final Mechanism Design ............................................................. 76
Table 33: Spring Data ................................................................................................................................ 80
Table 34: Material Properties .................................................................................................................... 88
Table 35: Connecting Bolt Properties ........................................................................................................ 92
Table 36: Spring Bracket Dimensions ........................................................................................................ 93
Table 37: Material Properties (AL 6061-T6) ............................................................................................. 94
Table 38: Summary of Factors of Safety in Seat Extender ....................................................................... 102
Table 39: Subject Testing Results for Each Question on Survey .............................................................. 119
Table 40: Average Survey Scores from 6 Test Subjects ............................................................................ 123
Table 41: Pedal Force Deviation from Control, All Spring Constants .................................................... 127
Table 42: Eric’s Mechanism Pairwise Comparison Chart ....................................................................... 175
Table 43: Jaime’s Mechanism Pairwise Comparison Chart .................................................................... 175
Table 44: Nick’s Mechanism Pairwise Comparison Chart ...................................................................... 175
Table 45: Henry’s Mechanism Pairwise Comparison Chart .................................................................... 176

xi
Table 46: Eric’s Power Mechanism Decision Matrix............................................................................... 176
Table 47: Jaime’s Power Mechanism Decision Matrix ............................................................................ 176
Table 48: Nick’s Power Mechanism Decision Matrix .............................................................................. 177
Table 49: Henry’s Mechanism Decision Matrix ....................................................................................... 177
Table 50: Eric’s Tricycle Component Pairwise Comparison Chart ......................................................... 177
Table 51: Jaime’s Component Pairwise Comparison Chart .................................................................... 178
Table 52: Nick’s Component Pairwise Comparison Chart ...................................................................... 178
Table 53: Henry’s Component Pairwise Comparison Chart .................................................................... 178
Table 54: Nick’s Tricycle Component Decision Matrix ........................................................................... 179
Table 55: Henry’s Tricycle Component Decision Matrix ......................................................................... 179
Table 56: Jaime’s Tricycle Component Decision Matrix ......................................................................... 180
Table 57:Eric’s Component Decision Matrix ........................................................................................... 180
Table 58: Henry’s Decision Matrix for Final Mechanism Design ........................................................... 182
Table 59: Nick’s Decision Matrix for Final Mechanism Design .............................................................. 182
Table 60: Jaime’s Decision Matrix for Final Mechanism Design ............................................................ 183
Table 61: Eric’s Decision Matrix for Final Mechanism Design .............................................................. 183
Table 62: Subject's Comments to Subject Testing Questions .................................................................... 207

1
Introduction
Stroke is the 5th leading cause of death in the United States, with more than 800,000 strokes
occurring each year. Of those 800,000 strokes, approximately 130,000 result in death, leaving behind
670,000 living stroke patients (CDC, 2015). Roughly 40% of stroke patients experience moderate to
severe impairments that require special care (National Stroke Association, 2015). Among these
impairments is hemiparesis, which is an isolated weakness occurring on one side of the body.
Hemiparesis can make it extremely difficult for the patient to perform normal tasks, such as movement. In
addition to physical impairments, many stroke patients experience emotional effects such as anxiety and
depression.
An effective way to treat the physical effects of strokes is to undergo physical therapy. However,
many patients only attend therapy 2-3 times per week (National Stroke Association, 2015). Therefore,
patients need other forms of exercise in their daily lives to help improve their mobility (American Heart
Association, 2014). Exercise has also been shown to help reduce the emotional effects of stroke, such as
depression (Harvard, 2009). One form of exercise, which can be used to help treat hemiparesis is cycling.
In addition to helping treat the effect of stroke, cycling can also help stroke patients regain a sense of
independence and normalcy in their lives.
An extensive search of existing recreational products for stroke patients revealed that there are a
limited number of products for that purpose on the market. A previous MQP group developed a
recreational tricycle for stroke patients, which used a compound gear train with a separate gear ratio for
each leg. Although their tricycle allowed the two legs to pedal with different forces, it did so by allowing
the pedals to rotate at different angular velocities, which makes even pedaling challenging. Therefore, our
design focused on alternative methods to vary the required force from each leg while keeping an even
cadence between pedals.

2
Literature Review
In order to create a device that can serve a recreational purpose for a stroke patient, it is important
to understand how strokes affect people, including through hemiparesis (isolated weakness in one side of
the body). It is also important to research common methods of rehabilitation for hemiparesis, and how
those devices can be related to a recreational device.
Strokes
Prevalence
Stroke, a disease that affects the arteries, occurs when a blood vessel that carries oxygen-enriched
blood to the brain is either blocked or bursts. When the blood cannot reach its destination, oxygen does
not reach this part of the brain, which leads to death of brain cells (American Stroke Association, 2015).
Stroke is the 5th leading cause of death in the United States, killing around 130,000 Americans
each year (CDC, 2015). With more than 800,000 strokes occurring each year, an American dies from a
stroke every four minutes. Nearly a quarter of strokes occur to people who have previously had a stroke.
Ischemic strokes, which take place when blood flow to the brain is stopped, account for 87% of all strokes
(CDC, 2015). Although stroke risk does increase with age, 34% of people hospitalized for strokes are
under the age of 65. Of all stroke patients, 10% recover almost completely, 25% recover with minor
impairments, 40% have moderate to severe impairments that require special care, 10% require care in a
long-term facility or nursing home, and 10% die shortly after the stroke (National Stroke Association,
2015).
Physical Impacts of Strokes
Stroke is the leading cause of long-term disability in the United States (Mozaffarian, 2015).
Effects of a right hemisphere stroke include partial or full paralysis on the left side of the body, difficulty
recognizing familiar objects and understanding their use, short term memory loss, mood swings and poor
judgment, and inability to judge distances. Effects of a left hemisphere stroke include partial or total

3
paralysis of the right side, difficulty communicating, difficulty learning and retaining information, and
trouble communicating (Public Health Agency of Canada, 2011). Including the cost of medications,
health services, and missed work, strokes cost the United States approximately $34 billion each year
(CDC, 2015).
Mental and Emotional Effects of Strokes
Very often, people who experience a stroke experience devastating mental and emotional effects.
Stroke survivors can develop depression and anxiety. Most often, the best treatment for these issues is
therapy and medication (National Stroke Association, 2015). However, there is growing evidence that
exercise can also play a role in the treatment of anxiety and depression (Anxiety and Depression
Association of America, 2015).
Goals for Rehabilitation
When a person experiences a stroke, they can lose the ability to perform basic functions that are
usually taken for granted. Common impairments include loss of muscle strength, motor control, and
balance, which can inhibit leg use and walking. Stroke rehabilitation helps stroke survivors re-learn skills
that were lost due to brain damage. A common skill lost is the ability to coordinate leg movements. While
stroke rehabilitation cannot “cure” the effects of a stroke, its benefits can allow stroke survivors to move
on with a sense of “normality.” Stroke rehabilitation can begin as soon as a patient becomes stable, which
may be as soon as 24 to 48 hours after the initial attack. Typical stroke rehabilitation programs include
four elements: physical therapy, occupational therapy, speech therapy, and recreational therapy. Physical
therapy aims to recover basic motor skills such as walking and maintaining balance, whereas occupational
therapy specifically focuses on learning everyday tasks such as eating and dressing. Strokes can cause
difficulty with skills such as speaking or swallowing, and speech therapy is designed to help recover some
of these skills. Finally, recreational therapy is essential in re-introducing social and leisure activities into
one’s life.
4
Benefits of Recreational Therapy
By conducting common leisure activities which they enjoyed before their stroke, patients will not
only be able to rehabilitate their weaker limbs, but also be able to keep themselves mentally and
emotionally healthy.
Physical
Typical stroke patients only go to formal physical therapy 2-3 times a week, making recreational
activity key to successful rehabilitation. Recreational activities can include stretching, walking, yoga,
paddle sports, and interactive computer games (National Stroke Association, 2015). Stretching, walking,
and yoga help strengthen the body and keep it flexible. Paddle sports work on hand-eye coordination and
motor function, while interactive computer games encourage increased focus. These activities can help
improve quality of life, mobility, and improve the patient’s ability to carry out activities of daily living
(American Heart Association, 2015). In a 6-month study of a home exercise program, stroke patients
who exercised at least 3 times a week showed significant reduction in cholesterol and resting heart rate,
which help to reduce the risk of a second stroke (Gordon et al., 2004).
Anxiety and Depression
Exercise has been shown to be an effective therapy for anxiety and depression. A study published
in the Archives of Internal Medicine compared people who took medication, people who exercised, and
people who did both, and found that 60-70 percent of people in all 3 groups no longer had depression
after 16 weeks of treatment. This study suggests that exercise can be just as effective as antidepressants at
treating depression. Another study found that a 60-minute walk 3 times per week could reduce mild to
moderate depression symptoms (Harvard, 2009). Since exercise has been shown to alleviate depression
and anxiety, and strokes often cause these disorders, we can conclude that recreational activities can be
beneficial to the mental and emotional health in stroke patients.

5
Existing Therapies and Devices
Therapies
Various types of therapeutic devices have been created to facilitate recreational pastimes for the
patients. Some of these activities include aquatic therapy and yoga, all of which help the patient not only
strengthen the function of their limbs and regain their balance, but to have social interaction with a group
while doing so (Pande, 2012).
Recreational Devices
Various recreational devices have been made in order to help stroke patients be able to return to
their favorite leisure activates once again. If a patient’s leisure activity is swimming or relaxing in the
pool, a pool walker (Figure 1) can be used to walk around the shallow part of the pool. Similar to a
common walker, but made mostly out of PVC piping, this device is lightweight enough for the user to
easily move the walker through the water.
Figure 1: CAD Model of the Pool Walker (Aqua Creek Products, 2015)

6
Therapeutic Devices
In stroke rehabilitation, patients use a variety of devices including isokinetic exercise machines,
tilt tables, limb load monitors, and anti-gravity treadmills. Isokinetic exercise machines are designed to
target individual muscle groups by using uniform resistance that is adjustable to each user’s abilities. To
use the isokinetic exercise machine (Figure 2), the patient sits in the chair, and their leg is firmly attached
to the lever of the machine. The machine then resists the patient’s motion when they both bend and
straighten their leg, working on strengthening both of these motions. This device is useful because it can
be adjusted so that the patient still maintains full range of motion and proper form, while maximizing the
amount of strengthening.
Figure 2: Isokinetic Exercise Machine (htherapy, 2015)
The tilt table (Figure 3) allows patients to learn to stand through progressive weight addition. The
user is attached to a board, and as the patient goes from horizontal to vertical, more weight is supported
by their feet as they stand. This type of therapy is useful because the patient relearns to stand without the

7
potential for injury that comes if they attempt to stand up but cannot support their own weight. This
device is also useful because the patient can start with very little weight and increase to full body weight
in whatever increments are necessary.
Figure 3: Tilt Table (triwg, 2015)
A limb load monitor can be used in combination with the tilt table or other devices to ensure that
the patient does not exceed the amount of force they can support. The patient steps on the limb load
monitor (Figure 4) to measure the amount of force being applied. The device can also be used to
determine the maximum amount of weight the patient can currently support, so that weight can be
progressively increased as the patient gets stronger.
Figure 4: Limb Load Monitor (ASME, 2015)

8
The anti-gravity treadmill (Figure 5) allows users to “reduce gravity’s impact” (AlterG, 2015) by
selecting 20-100% of their body weight. With the reduced body weight, patients can relearn proper
walking mechanics and strengthen lower body muscles. The reduced weight allows patients to more
easily move their lower limbs through a maximum range of motion while reducing the pain of walking.
The level of safety also increases because the patient can easily adjust the amount of weight they are
supporting so they do not exceed their abilities. The treadmill also works to increase the patient’s
confidence in their ability to walk.
Figure 5: Anti-gravity Treadmill (Alterg, 2015)
Split belt treadmills (Figure 6) are often used in stroke rehabilitation. The split belt design allows
for independent, variable speed control for each leg. The control for each leg helps stroke patients to
recover a normal gait. The speed of the affected leg can be slowed down so that the patient can focus on
proper form on that leg. Repetitive split belt treadmill usage has been shown to reduce post stroke step
length asymmetry (Reisman, 2013).

9
Figure 6: Split Belt Treadmill (Woodway, 2015)
Mechanics Involved in Cycling
One important aspect of this project is the mechanics involved in cycling. This topic is very
broad, and includes aspects such as biomechanics, muscle activation, position (upright or recumbent),
mechanical efficiency, and the effects of pedaling rate, seat height, and the movement of the back leg
upon the rider. Biomechanics covers the joint excursions during cycling. This topic, along with the
muscle activation sequence and the position, helps provide an understanding of how the user must interact
with a bicycle in order to cycle successfully. The latter four topics help provide an understanding of the
basic forces governing the pedaling cycle, which will assist in the creation, testing, and realization of the
design concepts which are discussed later in this report.
Biomechanics of Cycling
In order to fully understand the benefits of cycling, the biomechanics of cycling, which includes
the activation sequence of the muscles as well as the transmission of power, must be studied. Much of the
research for this project focused on cyclical pedaling, which has many advantages for rehabilitation.
During cycling, the forces on the leg muscles are not significantly influenced by the weight of the rider.
Therefore, the rider who cannot overcome their weight is able to successfully exercise and regain their

10
strength. In addition, cycling allows a therapist to change the geometry of the pedaling cycle in order to
selectively strengthen specific muscles (Fonda, 2010).
Muscle Activation during Cycling
The motion of cycling requires a very complex sequence of muscle activation. Muscle activation
is typically defined in relation to the position of the foot within the pedaling cycle. The 0 and 360-degree
positions are defined as the pedal being completely vertical and above the axis of rotation. The 180-
degree position is defined as the pedal being vertical below the axis of rotation. Table 1 illustrates the
muscles activated during the pedaling sequence.
Table 1: Muscle Activation during Cycling (Fonda, 2010)
Muscle Crank Position
(Degrees)
Peak Activation Position
(Degrees)
Gluteus Maximus (GMax) 340-130 80
Vastus Lateralis (VL) & Vastus Medialis (VM) 300-130 30
Rectus Femoris (RF) 200-110 20
Soleus (SOL) 340-270 90
Gastrocnemius Medialis (GM) & Gastrocnemius
Lateralis (GL) 350-270 110
Tibalis Anterior (TA) 0-360 280
Semimembranosus (SM) & Semitendinosus
(ST) 10-230 100
Biceps Femoris (BF) 350-230 110

11
Comparison of Upright and Recumbent Cycling
In order to create a wide variety of design concepts, many different configurations must be
considered. Besides upright cycling, one common form of cycling is recumbent cycling, in which the
rider sits in a reclined position to pedal. The muscle activation during recumbent cycling was therefore
investigated in order to ensure that it does not change the mechanics of cycling when compared to upright
cycling.
In upright cycling, the crank and seat are aligned close to vertical, whereas in recumbent cycling,
they are aligned close to horizontal. Recumbent cycling is an excellent tool for rehabilitation, and has
many advantages over upright cycling. One advantage of recumbent cycles, Figure 7, is that they have
backrests on the seats, which can help provide support for the upper body. In addition, they are lower to
the ground, which makes it easier for people with mobility impairments to access the bike (Lopes, 2014).
However, for recumbent cycling to be a viable alternative to upright cycling, it must not significantly
change the mechanical patterns of cycling.
Figure 7: Recumbent Tricycle (tyrx.com)
In a study published in the International Journal of Sports Physical Therapy, researchers
measured muscle activity in the legs of 10 participants while they pedaled at a set cadence of 80 rpm and

12
a workload of 100 watts using both upright and recumbent cycles. The results showed no significant
difference in the muscle activity between the two types of pedaling (Lopes, 2014).
It can be concluded that recumbent cycling could in fact be a viable design for a final design. This
finding allows for flexibility in selecting the most appropriate design to meet the design goals.
Mechanical Efficiency
The mechanical efficiency of pedaling is highest when the force is tangent to the path of the pedal
(Fonda, 2010). Figure 8 illustrates both tangent and centrifugal pedaling force components. A cyclist will
only transmit the entirety of their power tangent to the pedal’s path when the crank is at 90 degrees
(Pruitt, 2014). Studies have shown that the highest centrifugal force (most inefficient) occurs between 120
and 195 degrees off top dead center of the pedaling cycle. In addition, expert cyclists have been shown to
be 11% more mechanically efficient than amateurs while only doing 9% more work. This finding shows
that the expert cyclists are better at applying tangential force during the drive phase of the cycle (Fonda,
2010).
Figure 8: Centrifugal and Tangential Forces during Pedaling (Fonda, 2010)

13
Effects of Seat Height
Saddle height is defined as the distance from the top of the seat to the pedal when the pedal is in
the lowest position (Fonda, 2010). Adjusting the height of the seat changes the angles of the joints and
affects efficiency. One study found that a saddle height which is 109% of inseam length is most powerful,
while 107% is most energy efficient (Woznia-Timmer, 1991). However, there is no single most optimal
position for all riders at all times. Another study found the optimal height to be closer to 103% of inseam
length. A seat position that is too low is associated with knee pain (Fonda, 2010).
Effect of the Back Leg on the Pedaling Cycle
Many people have long believed that pulling up the back leg during the recovery phase of
pedaling can help increase efficiency. If this fact is true, then elite cyclists should show some upward
force with the back leg during recovery. However, many studies have shown that even elite cyclists do
not demonstrate very much upward force (Wozniak-Timmer, 1991). A human in the act of pedaling must
use the front foot to overcome the weight of the back leg, which resists the motion of the pedal, thus
explaining why the force on the front pedal doubles in magnitude from the back pedal. The finding that
the back leg does not pull up is very significant for our project. When deciding on the mechanical
advantage we give the hemi- paretic leg, we must take into account the fact that the hemi-paretic leg will
have to provide the power for the healthy leg to recover. Depending on the severity of the hemiparesis,
the patient might need significant help to provide this recovery.
Mechanisms
The previous section of this report described the various parameters that govern the pedaling
motion in cycling. Although this research will make it easier to understand the mechanics of cycling, the
aforementioned information does not fully set the foundation for the creation of a successful device. The
users of the device will have a lateral discrepancy in strength, which will make the normal pedaling
mechanics difficult, if not impossible for the users. Additional mechanisms must be added to the device in

14
order to modify it and differentiate it from a normal tricycle. These mechanisms will be used to provide a
mechanical advantage to the weak leg, thus allowing the user to successfully propel the device. Therefore,
this section will investigate many mechanisms, including torque converters, continuously variable
transmissions (CVTs), differentials, and flywheels, which can be used to create a device which achieves
the desired functionality.
Torque Converters
A torque converter (Figure 9) is a type of mechanical device that transfers torque via hydraulic
coupling. Most commonly, they are seen on automatic transmissions in automobiles, as a way of
eliminating a mechanical clutch. Torque is transferred from a power source to an output shaft by spinning
hydraulic fluid from the “pump” to the “turbine”. The advantage to torque converters compared to a
conventional clutch is the ability for the output shaft to remain stationary without mechanically
decoupling from the power source. This could be especially useful in developing a power transmission
with multiple inputs requiring different amounts of force, as the hydraulic coupling of a torque converter
would not require both input sources to be mechanically tied together. However, in order to obtain
efficient torque transfer, a function of fluid viscosity and angular velocity of the input shaft, the device
must be moving at high speeds, such as in a car.

15
Figure 9: Torque Converter Cross-Section (How Stuff Works, 2015)
Continuously Variable Transmission
The most common type of continuously variable transmission (CVT) uses a pulley system, which
has an infinite number of gear ratios. No discrete shifts are needed, unlike traditional gears. CVTs consist
of 3 main parts:
Metal or rubber belt
Driven Gear
Driving Gear
CVTs usually also require microprocessors and sensors to make shifting possible. A basic CVT, such
as the one shown in Figure 10, contains 2 cones that are driven by a belt with a v-shaped cross-section.
The pulleys must change the pitch radius relative to each other in order to keep the belt in tension. In
order to change the pitch radius, each pair of cones must change their spacing, and the two pairs of cones
must move closer or further apart. Metal belts are superior to rubber belts because they do not wear out as
easily, can withstand more torque, and are quieter. Another type of CVT is known as a toroidal CVT,
appears in Figure 11. This type of CVT uses 2 cone-shaped discs that connect to the engine and drive

16
shaft. Two rollers perpendicular to the axis change gear ratios by tilting up and down. An example of this
tilting motion is shown in Figure 12 (Harris, 2015).
Figure 10: Pulley Driven CVT (Pratte, 2014)
Figure 11: Toroidal CVT, 1:1 Ratio (Harris, 2015)

17
Figure 12: Toroidal CVT, High Ratio (Harris, 2015)
Differentials
A differential is a mechanism that allows two wheels on the same shaft to rotate at different
speeds, which allows for smooth turning. When a car turns, the inside back wheel rotates more slowly
than the outside back wheel because it has to cover less distance in the same amount of time. By allowing
the wheels to rotate at different speeds, the differential eliminates the need for one tire to slip in order to
make the turn (Nice, 2000). Differentials use a planetary gear system, as shown in Figure 13. The input
pinion drives the ring gear, which is coaxial with one of the sun gears. The two sun gears connect through
the two planet gears. When both shafts rotate at the same speed, the planet gears do not rotate with respect
to the sun gears, locking the two sun gears into the same rotational speed. When the two output shafts turn
at different speeds, the planet gears rotate with respect to the ring gear, allowing the two sun gears to turn
at different speeds (Pearlman, 1999). A regular differential will always transmit the same amount of
torque to each wheel. If one wheel slips, such as on ice, the wheel will just keep spinning. Because of this
problem, many cars have limited slip differentials to allow more torque to be transmitted to the wheel that
has more traction when the other is slipping (Nice, 2000).

18
Figure 13: Differential (Nice, 2000)
Flywheels
Flywheels store kinetic energy, which can be produced with electricity, an engine (such as in a
car), or pedaling. A previous MQP group proposed the use of a flywheel as a component in one of their
designs (Allen et al., 2014). The flywheel keeps spinning due to inertia. The amount of energy stored by a
flywheel is a function of the rotational speed squared. Higher speeds are necessary to store more energy,
and thus maximum speed is needed for highest energy storage. Flywheels have many advantages
including high resistance to wear, good energy density, maintenance of good mechanical properties, even
after many cycles, and very quick response times (Flywheels, 2015).
An engineering student has made a flywheel bicycle that utilizes a CVT. When the bike slows
down, the rider shifts to maximize the flywheel to bike speed ratio. To speed up, the rider must minimize
this ratio. The maker claims that flywheel increases acceleration and provides a 10% energy savings.
However, the flywheel weighs about 15 lbs. (Coxworth, 2011). The previous MQP group cited not adding
a lot of weight to their design as part of their specifications, so the weight of the flywheel suggests that
this design would be unsuitable to this project (Allen et al., 2014).

19
Goal Statement
Stroke is a leading cause of death in the United States. Many people who experience strokes have
hemiparesis, or weakness in one side of the body. The goal of this project is to develop a human-powered
device that can be used by people experiencing hemiparesis to aid in recovery from a stroke. The device
should allow the user to slowly build up strength by offering varying levels of pedaling assistance to the
weak leg. This recreational product should provide a sense of freedom to its user and encourage exercise
to aid in rehabilitation.

20
Design Specifications
The design specifications are divided into 9 categories: power adjustability, ergonomics, cost,
manufacturability, safety, range of motion, user requirements, ease of control, and stability.
Power Adjustability
1. The device must be propelled by different power inputs from each leg.
Stroke patients that experience hemiparesis are weaker in one leg than the other. This
weakness would make pedaling a standard bike very difficult if each leg was required to
output the same amount of force. Having different power inputs for each leg allows the
patient to pedal using less force with the weaker leg while using the stronger leg to help
power the device.
2. The required power input must be adjustable independently of each leg.
If the power input is independent of each leg, soon after the stroke, the patient can set the
weaker side to only require a small amount of force. As the leg becomes stronger, the
amount of force given to the weaker leg can increase so that the amount of force it takes
to pedal becomes more similar to that of the stronger leg.
3. The device must be powered by human input.
The purpose of the device is to be a recreational device that also provides therapeutic
benefits. The device must be primarily powered by the movement of the legs of the user
to encourage physical activity and provide satisfaction for the rider knowing that they are
capable of powering the device.
4. The power input from each leg should be with an even cadence.
The previous group’s design allowed the two pedals to have separate angular velocities.
This pedaling pattern was unfamiliar to many of their test subjects. Although some
people were able to use the device successfully, many people were unable to adapt to the

21
pedaling motion (Allen et al., 2014). Therefore, it would be preferable if the next device
allowed users to pedal with an even cadence.
Ergonomics
Each of the seat dimensional requirements is based on standard wheelchair dimensions. We
decided to use wheelchairs as our reference because it is a position that will be most familiar to a stroke
patient. Additionally, if both their wheelchair and the seat in the device are at approximately the same
height, it will be much easier for the user to transfer to the device from a wheelchair.
5. Seat height should be ±4 inches from the standard wheelchair seat height of 20 inches.
6. Seat backrest height should be ±4 inches from the standard wheelchair backrest height of 36
inches off ground.
7. Seat width should be ±2 inches from the standard wheelchair width of 19.5 inches.
Cost
8. The device should be able to be constructed for less than the budget of $800.
The budget allowed for MQP groups is $200 per team member. This MQP team contains
4 members, so the allowable budget is $800.
Manufacturability
9. The device should be able to be manufactured by the team using primarily parts ordered off the
shelf.
Due to the many other project groups, as well as the limited resources of the WPI
machine shop, it will be difficult to machine parts. In addition, creating custom parts
requires a lot of time. Therefore, parts should be ordered already made unless they are
unique to the device and must be created from scratch.

22
Safety
10. The device must conform to the Consumer Products Safety Commission standards for bicycles
(Code of Federal Regulations Title 16, Chapter II, Subchapter C, and Part 1512).
The requirements specify that the tricycle will have no sharp edges, no loose fasteners,
and have no protrusions in the user’s personal space, among other requirements. The full
requirements can be found in Appendix A.
11. The device must allow the user to freely pedal without colliding with any part of the device.
Range of Motion
In the following 3 cases (12-14), the user may not be able to produce these ranges of motion due
to hemiparesis. In fact, the joint angles the user is capable of producing will most likely be much smaller
than the values given. However, a trained physical therapist may adjust the geometrical configuration of
the device in order to accommodate users with different degrees of flexibility. Therefore, the device will
be able to accommodate users without full mobility. Since the device will be able to accommodate users
with up to and including full mobility, the users will be able to use the device throughout every stage of
their recovery. The users will be able to use the device up to, and including the point at which they regain
full mobility. If the user regains full mobility, they can still use the device to rebuild their strength.
12. The device must allow the user to move through a range of motion from their knee of up to 37-
111 degrees.
According to the Journal of Orthopedic & Sports Physical Therapy, the typical range of
motion in the knee during cycling is 37-111 degrees (Wozniak-Timmer, 1991).
13. The device must allow the user to move through a range of motion from their hips over 28
degrees.

23
The Journal of Orthopedic & Sports Physical Therapy states that a minimum of 28
degrees of flexion is required to ride a bicycle. The flexion can be as high as 90 degrees
(Wozniak-Timmer, 1991).
14. The device must allow the user to move through a range of motion from their ankle of up to 53-
103 degrees.
The Journal of Orthopedic & Sports Physical Therapy states that the ankle motion
required to ride a bicycle is 53-103 degrees, where the neutral position is 90 degrees
(Wozniak-Timmer, 1991). Other medical literature defines the neutral position as 0
degrees, which would make the range -37 to 13 degrees (Perry, 2015).
User Requirements
15. The user must be between 57” – 75” tall.
For women in the United States, the 5th percentile of height is approximately 57”. For
men in the United States, the 95th percentile of height is approximately 75” (CDC, 2012).
Since men are taller than women on average, a device which can accommodate users
between 57” and 75” should benefit the vast majority of potential users.
16. The user must weigh less than 250 pounds.
For men in the United States, the 95th percentile of weight is 279 pounds, while for
women it is much lower (CDC, 2012). In addition, many wheelchair distributors sell
wheelchairs at a standard weight capacity of 250-300 pounds (PHC, 2015). Since users of
the device could possibly require the use of a wheelchair, the device should benefit as
many wheelchair users as possible.
17. User must be able to propel him or herself up a 4.8 degree grade using the device.
The Americans with Disabilities Act (ADA) requires that a wheelchair ramp will not
have a rise to run ratio of less than 1:12, which corresponds to an angle of 4.8 degrees

24
from the horizontal (ADA, 2010). Since users of the device could possibly require the use
of a wheelchair, they should be able to traverse this slope easily.
18. The user must be able to support his or her own weight without assistance.
The force required to pedal a bicycle is difficult to determine due to the multitude of
factors affecting the pedaling. There are no existing data on the average force to pedal a
bicycle, but it is reasonable to assume that it will not exceed the weight of the user due to
the mechanical advantage of the gear system.
Stability
19. The device must be able to traverse pavement, grass, hard-packed dirt and dried mud.
In order to operate the device in diverse terrain, it must be able to transition into softer
surfaces and not get stuck.

25
Preliminary Design Concepts
In order to select the best overall design for the tricycle, the team generated multiple design
concepts for the power mechanism. The generated designs include a variety of different types of
mechanisms including a piston, a motor, planetary gears, a CVT (continuously variable transmission), a
push pedal device, and a spring resistance design. Each of the initial designs creates the potential for
different pedaling inputs from each leg.
Design 1: Piston
The piston design (Figure 14) uses a spring-loaded piston to artificially resist the strong leg. The
driving sprocket has a linkage attached to it. As the strong leg reaches 0 degrees of the pedaling cycle, the
piston begins advancing into the cylinder, compressing the spring. Once the strong leg reaches 180
degrees of the pedaling cycle, the piston will reach its lowest vertical position and thus fully compress the
spring. As the strong leg enters the recovery phase, and the weak leg begins the drive phase, the spring
will decompress, thus assisting the effort of the weak leg.
Figure 14: Piston Design Concept

26
Design 2: Motor
The motor design (Figure 15) uses a motor to assist the pedaling motion of the weak leg. The
device will contain a processor and two strain gages. The strain gages will allow the processor to measure
the torque applied by each leg throughout each leg’s drive phase. The processor will store the torque data
from the strong leg for each cycle. The processor will then detect the torque applied by the weak leg on a
1-millisecond delay. The motor will then apply a torque equal to the difference between the strong and
weak leg torques for each equivalent position of the weak leg. If the strong leg applies 100 N-m of torque
at the 15-degree position, and then the weak leg applies 75 N-m of torque at 15 degrees, then the motor
will apply 25 N-m of torque to make up for the difference in torques. Figure 16 shows the difference in
applied torque between the legs throughout the pedaling cycle. The motor will supply the difference in
pedaling torques to the drive train. This design would also make it very easy to switch the advantage
between the left and right legs.
Figure 15: Motor Design

27
Figure 16: Motor Design Force Curves
Design 3: Planetary Gear
The planetary gear design (Figure 17) consists of a gear transmission with two major
components, the torque splitter (Figure 18) and the reducer (Figure 19). Input torques are taken from the
right and left side of the torque splitter (Figure 20) with values τleft and τright and angular velocities ωleft and
ωright. Once combined, the output torque is transferred through an outer ring gear, which serves as the
input for the reducer. The reducer is a single stage gear train in which the angular velocity from the torque
splitter is reduced while raising the output torque. Within the torque splitter, two sets of internal pinions
rotate around Sun 1 and Sun 2. Sun 1 (red) is connected to the left pedal and acts as a torque input for the
system. Sun 2 is fixed, allowing the ring gear to rotate concentric to it. The ring gear has both internal
(not shown) and external teeth, allowing it to couple with the reducer.

28
Figure 17: Planetary Gear Design
Output Axis
(Powering Wheels)
Input Pedal Axis (Powered by User)

29
Figure 18: Torque Splitter
Figure 19: Reducer
Small
Large
Sun 1
Pinion 1 Sun 2 (Fixed)
Pinion 2
Ring

30
Figure 20: Torque Splitter Side View
The gear definitions for this proof of concept can be found in Table 2.
Table 2: Gear Definitions for Planetary Mechanism
Gear Diametric
Pitch
Number of
Teeth Pitch Diameter Variable
Sun 1 20 30 1.5 D1
Sun 2 20 50 2.5 D3
Pinion 1 20 10 0.5 D2
Pinion 2 20 15 0.75 D4
Ring 20 80 4 D5
Large 20 90 4.5 D6
Small 20 30 1.5 D7
The torque values at gear connections inside the torque splitter are expressed as:
4 5D5
D4
2 4D4
D2
L1 4D4
D3
R1 2D2
D1
Left Pedal
Input
Right Pedal
Input

31
Where τR1 and τR2 are the input torques for the right and left side, prior to the application of the
“Reducer”. The “Reducer” ratio is expressed as:
Therefore, the final input torques are given as:
Which yields system gear ratios of:
This means that the input torque applied by each leg will be less than the final, combined output
torque of the system. Furthermore, this design allows for one side of the system to require significantly
less input torque than the other, ideal for patients experiencing hemiparesis. It should be noted that the
pedals will rotate at different angular velocities.
Design 4: Continuously Variable Transmission (CVT)
The CVT design (Figure 21) uses a wheel (shown in red) and two spindle cones to change the
torque input of each leg to achieve the same torque output. As the wheel moves from one side of the
cones to the other, the ratio between the input and output cone contact diameters changes, thus changing
the torque ratio.
6D7
D6
L2 L1 6 R2 R1 6
RL 0.533 RR 0.889

32
Figure 21: Toroidal CVT Design
Just before the strong leg begins to apply torque (before reaching 0 degrees on the pedaling
cycle), the wheel will shift left between the cones. This shift will make the output torque smaller than the
input torque. Once the strong leg begins to apply torque, it will need to maintain a large amount of torque
to achieve a certain output torque. When the strong leg reaches its point of recovery (180 degrees of the
pedaling position cycle) and the weak leg is about to turn the input spindle, the wheel will shift to the
right. This shift will allow the weak leg to apply the same output torque as strong leg, but with a smaller
input torque required.
Design 5: Push Pedal
The push pedal design is shown in Figure 22. The wheels are connected by the metal axle. The
bars attached to the pedals (1) are also connected to the frame. As the bars move back and forth due to the
pushing of the pedals, the metal axle rotates in a circular motion, which rotates the wheel. As the left
pedal is pushed, the axle (2) rotates 180 degrees, and then when the right pedal is pushed, the axle rotates

33
the remaining 180 degrees. To make one side easier to press, a torsion spring (Figure 23) was added at the
pivot for link 2 (Figure 22). As the left pedal is pushed, link 2 is forced to rock forward, thus stretching
the spring and resisting that pedal. Then, as the right pedal is pressed, link 2 rocks back while the torsion
spring releases its energy. This energy release is partly captured to assist the leg in pushing the right pedal
forward. Additionally, due to the linear motion rather than rotational motion, this mechanism requires less
range of motion for the user.
Figure 22: Push Pedal Design Sketch, A: Side View of Four Bar Mechanism; B: Front View

34
Figure 23: 3D Model of Push Pedal Mechanism
Design 6: Spring Resistance
In the spring resistance design (Figure 24) the pedals are attached to a gear (3). This is meshed
with a gear of the same size (4). Gear (4) is attached to a spring (2) that is attached to a stationary point on
the frame. As the reference pedal (1) rotates to 0 degrees off the horizontal (B), the spring stretches and
resists the pedal rotation. At 270 degrees the spring is fully extended. As the pedal returns to 90 degrees,
recoils, making 270 – 90 degrees aided by spring retraction. Figure 25 gives an overview of this
mechanism in 3 dimensions.

35
Figure 24: Spring Resistance Mechanism Sketch (angles measured from horizontal)
Figure 25: 3D Model of the Spring Resistance Mechanism

36
Analysis of Initial Design Concepts
Prior to selecting the top designs, the advantages and disadvantages of the initial design concepts
were analyzed to get a better understanding of how well each aspect of the design would work for our
overall design. The information obtained from this analysis will be used during the decision making
process in the following chapter.
Power Mechanisms
For the power mechanism initial design concepts, in addition to the advantages and disadvantages
for each design, fixed and variable parameters were also examined to determine the feasibility of each
design (Table 3).
Table 3: Power Mechanism Comparison Chart
Design Fixed
Parameters
Variable
Parameters Advantages Disadvantages
Piston Rotational
speed
between legs
Mechanical
advantage
between legs
Pedaling rate
Power input
Easy to
fabricate
Can be used
to modify
existing
device
Allows
strong leg to
create stored
energy,
which assists
the weak leg
High wear
Cannot change
advantage
between legs
Cannot change
sides for
different users

37
Design Fixed
Parameters Variable
Parameters Advantages Disadvantages
Motor Design Rotational speed
between pedals Pedaling rate
Power input
from strong
leg
Power output
from motor
Mechanical
advantage
between legs
Which side has
mechanical
advantage
Allows for
different
mechanical
advantages
between legs
Can switch
to assist
either left or
right leg
Allows weak leg
to rehabilitate at
a natural pace
Would require
batteries, thus
increasing
weight and
limiting
operation time
Would require
modifications if
installed into
existing device
Planetary Gear
Design Torque input
for each leg
(as is), could
be
redesigned
with more
ratios.
“Pedal”
Orientation
Torque input
between
legs.
Allows for
different
mechanical
advantages
between
legs.
Can be
adapted to
switch assist
to either side.
Forces weak
leg to pedal
Could be
integrated
into a
standard
bicycle chain
system.
May require
specialized
gears.
Requires
custom frame
to support
device.
Complex
Variable Pulley
Mechanism
(CVT)
Torque input
for each leg.
“Pedal”
Orientation
Torque input
between
legs.
Continuously
variable
torque ratios.
Potential to
be
lightweight.
Complex
Difficult to
manufacture
Potential for
slippage of
wheel with
spindle cones.

38
Design Fixed
Parameters
Variable
Parameters Advantages Disadvantages
Push Pedal Even
cadence
Force acting
between each
“Pedal”
Less range of
motion
required for
pushing
instead of
rotating.
Even
cadence
Switch assist
between
legs.
Not
continuously
variable.
Spring
Resistance
Design
Even
cadence
Force acting
between each
“Pedal”
Torque input
between each
leg.
Variable
torque.
Even
cadence
Independentl
y adjustable
torque for
each leg.
Simple
design
Switch assist
between
legs.
Not
continuously
variable.
Remaining Tricycle Components
Although the power transmission mechanisms are an important aspect of the design, the design
will not be successful unless these mechanisms can be seamlessly integrated into the overall tricycle
configuration. The configuration consists of many aspects, including the wheel layout, tires, seat, pedals,
steering mechanism, and brakes. Finding the ideal combination of components, as well as the ideal
mechanism to work with these components, allowed the team to generate the best possible design.
Portions of the device will be made using commercially available parts. To ensure the best
design, several options must be considered for each aspect of the design. Comparisons of potential
commercially available options can be found in Table 4 – Table 10. Pictures of each available option are
in Appendix B.

39
Table 4: Wheel layout Comparison Chart
Wheel layout
Advantages Disadvantages
Three Wheel, Single in Rear
Better controlled
braking (2 wheels
contacting ground to
brake in front)
More even weight
distribution
More difficult to steer
with 2 wheels rather
than one
Three Wheel, Single in Front Simple, direct steering Poor weight distribution
Less contact area on the
front of the vehicle for
braking
Four Wheels
Increased stability Increased weight and
size
Table 5: Tire Comparison Chart
Tire
Advantages Disadvantages
Road Tires
Light weight Decreased comfort over
bumps
Reduced Stability
Multi-Use Tires
Increased comfort of
bumps
Improved stability
Medium weight
Mountain Tires
Maximum comfort over
bumps
Maximum stability
Heavy weight

40
Table 6: Seat Comparison Chart
Seat
Advantages Disadvantages
Upright Seat, No Back
Light weight
Readily available
Uncomfortable
Requires balance to
remain seated
Little support for legs
Upright Seat with Added Back
Provides support for
back
Back and seat
individually adjustable
Multi-piece design
requires more moving
parts
Little support for legs
One-Piece Molded Seat with
Back
Simple one piece design
Provides more support
for legs
Minimally adjustable
Table 7: Steering Comparison Chart
Steering
Advantages Disadvantages
Handle Bars
Intuitive design
Integrated braking and
steering
Requires force to
physically turn wheels
Must use both arms
equally
Tiller
Allows for use with only
one arm
Requires less force to
turn
Less intuitive design
requires time for the
user to learn

41
Table 8: Pedal Comparison Chart
Table 9: Frame Comparison Chart
Frame
Advantages Disadvantages
Upright
Ready available frames
High sitting height may
make it difficult for the
user to get onto the seat
Requires balance to
remain upright
Recumbent
Height is more similar
to a chair, so it makes it
easier for users to sit on
the seat
Activates the same
muscles as upright
bicycling despite a more
comfortable position
Fewer frames available
Pedals
Advantages Disadvantages
Platform Pedals
Large area evenly
distributes force
No need to attach and
reattach when getting on
and off the device
Does not allow user to
power the pedal stroke
when pulling up with
their foot
Pedal Toe Clips
Allows user to power
the pedal stroke when
pulling up with their
foot
Does not require special
shoes
Have to attach and
reattach to the pedals
when getting on and off
the bike
Clipless Bike Pedals (shoes clip
into metal or plastic clip on
medal)
Firmly attached pedal to
user’s feet for a very
natural feel
Allows user to power
the pedal stroke when
pulling up with their
foot
Requires special shoes
Clipping in and out of
the pedal can be difficult
and requires practice

42
Table 10: Brake Comparison Chart
Brakes
Advantages Disadvantages
Rim
Can be used on any
frame
Lightweight
Inexpensive
Perform poorly when
wet
Require replacement of
pads
Drum
Consistent braking
regardless of condition
(wet or dry)
Require less
maintenance
Heavy
Complicated design
Weaker braking
Disc
Compatible with rear
and front suspensions
Strong braking
Consistent braking
regardless of condition
Heavy
Expensive
Tipping Analysis
Another vital design aspect for the tricycle is its stability. The tipping analysis makes it possible
to determine the conditions that will lead to the tricycle rolling over when making a turn or riding on an
inclined plane. It is very important to determine these conditions, as a propensity to tip will make the
design unsafe for the rider. This analysis determines what slopes and what turning speeds the tricycle can
traverse without tipping over, which will be compared to the desired characteristics of the design
configurations in order to determine their feasibility.
If the velocity of the tricycle, at a certain turning radius and wheel-span length, goes above the
curve, tipping will occur. By taking into account the maximum angle of incline for static turnover on hills
(17°), the rollover velocity curve dramatically changes based on the wheel-span length. For this case, the
curve with the lowest rollover velocity values at certain turning radii, in Figure 26, will be considered. To
ensure stability while turning on an inclined surface (one no larger than 17°), the rollover velocity curve
for the shortest possible wheel-span length (L= 117.2 cm) must be used. The full calculations for this
graph can be found in Appendix C.

43
Figure 26: Plot of Rollover Velocity while Turning on an Inclined Surface
44
Selection of Best Concepts
Once all of the aspects of the design were accounted for, each design was analyzed. The team
used various techniques to determine the feasibility of each design. The team first generated pairwise
comparison charts for both the mechanism and the configuration. These charts allowed the team to
determine the ranking order of the design criteria. From the ranking order, the team was able to determine
the weight of each design aspect for the decision matrix. The group then generated a ranking rubric for
each design criterion. The score given to each aspect of each mechanism and configuration was multiplied
by the weighting factor in order to create full decision matrices. From these selections, the top four
designs were determined. These four designs were further analyzed in order to select the final design.
When selecting a final design, the mechanism for the power train and the other components of the
design were analyzed separately. This analysis method works because any power train can be used with
any combination of the other components of the design.
Power Mechanism
To select the best power mechanism, each design was evaluated using a decision matrix. After
completion of the decision matrix, the best designs were carried forward for further analysis prior to
selection of a final design. The power mechanism initial designs that are evaluated in the following
sections are the piston, motor, planetary gear, push pedal, spring resistance, and CVT.

45
Design Goals
The first step in the decision making process was to create design goals. The design goals
describe components of the power mechanisms that should be included to have an optimal design.
Power Adjustability: The primary goal for creating this device is the power adjustability
between each pedal, including the choice of the assistive pedal, and the torque ratios that can be
achieved between each pedal.
Ergonomics: The mechanism should allow the user to pedal with an even cadence, no
aspect of the mechanism should interfere with the pedaling motion, and the mechanism should be
adjustable for comfortable pedaling based on different rider heights and weights.
Conform to User Requirements: The mechanisms must not prevent users that fit the
user requirements from being able to use the device by making the force to steer or pedal too
large.
Ease of Control: The input rotational velocity should be constant throughout the entire
pedaling cycle and the mechanism should allow the rider to "coast" when they stop pedaling.
Safety: The mechanism must not create a safety issue for the user.
Manufacturability: The mechanism must not be so complicated in design that it cannot
be manufactured in a standard machine shop and with off the shelf components.
Cost: The mechanism components must not be expensive so that the overall cost of the
device remains affordable.
Pairwise Comparison Chart
Once the design goals were created, pairwise comparison charts were carried out to determine the
relative importance of each design goal. In the pairwise comparison charts, at the cell intersecting a
design goal in a row and a design goal in a column, if the design goal in the row is more important than

46
the design goal in the column, a one is placed in the cell. If the item in the row is less important than the
item in the column, a 0 is put in the cell, and if they are equally important, a 0.5 is put in the cell. The
values in the cells are summed across the row, and the total at the end of the row represents the number
for the design goal in that row. The larger the total for a design goal, the more important that design goal
is for the power mechanism. Each member of the team completed a pairwise comparison chart
individually (Appendix D) and then the results were averaged to determine a final pairwise comparison
chart (Table 11).
Table 11: Mechanism Pairwise Comparison Chart Average
Rank Ordering
Based on the values in Table 11, the design goals were rank ordered based on the total values for
each criterion (Table 12).
Table 12: Final Rank-Order of Design Goals for Mechanism
Final Rank Order
1 Power Adjustability
2 Safety
3 Conform to User Req
4 Ergonomics
5 Ease of Control
6 (Tie) Manufacturability
6 (Tie) Cost

47
Weighting Factors
Next, weighting factors were assigned to the design goals. A range for ranking factors was
established based on whether the design goal was critical, important, or encouraged (Table 13). Based on
the ranges, each design goal was awarded a numerical weighting factor (Table 14).
Table 13: Relative Weighting Factors for Mechanism
Critical 31-40
Important 11-30
Encouraged 6-10
Table 14: Numerical Weighting Factor for Mechanism Design Goals
Critical Power Adjustability 35
Important
Safety 18
Conform to User Requirements 16
Ergonomics 11
Encouraged
Ease of Control 10
Cost 5
Manufacturability 5
Power adjustability is the most important factor, and therefore accounts for around a third of the
total weight. Safety, conform to user requirements, and ergonomics are important design goals, with
safety being weighted the highest. Finally, ease of control, cost, and manufacturability are encouraged
design goals.
Ranking Criteria
After creating weighting factors for the design goals, ranking criteria were created to evaluate
how well each mechanism design meets the design goals (Table 15). In the ranking criteria, each design

48
goal is split into excellent (5), good (4), satisfactory (3), mediocre (2), and unacceptable (1). For each
design goal, the necessary criteria are listed for that design goal to achieve an excellent, good,
satisfactory, mediocre, or unacceptable ranking.
Table 15: Ranking Criteria for Power Mechanism
Excellent (5) Good (4) Satisfactory (3) Mediocre (2) Unacceptable
(1)
Ergonomics
The mechanism
allows the user
to pedal with an
even cadence
between the two
pedals, and no
component
interferes with
the user during
a normal
pedaling cycle,
and the device
can be adjusted
to achieve a
comfortable
pedaling
position.
The
mechanism
allows the
user to pedal
with an even
cadence
between the
two pedals,
but the device
cannot be
adjusted to
achieve a
comfortable
pedaling
position. No
component
interferes
with the user
during a
normal
pedaling
cycle.
The mechanism
does not allow
the user to pedal
with an even
cadence
between the two
pedals, but the
device can be
adjusted to
achieve a
comfortable
pedaling
position. No
component
interferes with
the user during
a normal
pedaling cycle.
The
mechanism
does not
allow the user
to pedal with
an even
cadence
between the
two pedals,
and the
device cannot
be adjusted to
achieve a
comfortable
pedaling
position. No
component
interferes
with the user
during a
normal
pedaling
cycle.
The mechanism
does not allow
the user to
pedal with an
even cadence
between the
two pedals, and
the device
cannot be
adjusted to
achieve a
comfortable
pedaling
position.
Mechanism
components
may interfere
with the user
during a normal
pedaling cycle.

49
Excellent (5) Good (4) Satisfactory (3) Mediocre (2) Unacceptable
(1)
Safety
Meets the
Consumer
Product Safety
Commission
standards on
bicycle safety.
Code of Federal
Regulations
(CFR) in Title
16, Part 1512.
Does not meet
the Consumer
Product Safety
Commission
standards on
bicycle safety.
Code of Federal
Regulations
(CFR) in Title
16, Part 1512.
Conform to
User Rqmts
The mechanism
does not use
stored
mechanical
energy to assist
the weak leg.
The mechanism
can be driven
using solely
human power.
The
mechanism
does not add
additional
force to the
strong leg
unless the
additional
force is
stored as
energy, and
released to
the weak leg.
The device
can be driven
using solely
human
power.
The mechanism
adds additional
force to the
strong leg
without storing
the energy to
release to the
weak leg. The
device can be
driven using
solely human
power.
The
mechanism
does not add
additional
force to the
strong leg,
but assists the
weak leg
using stored
electrical
energy.
The mechanism
adds additional
force to the
strong leg and
assists the weak
leg using stored
electrical
energy.

50
Power
Adjustability
Both pedals can
be more
assistive, and
any torque ratio
within a
specified range
can be
achieved.
Either pedal
can be more
assistive,
limited torque
ratios can be
achieved
Either pedal can
be more
assistive, fixed
torque ratio
Only one
pedal can be
assistive,
fixed torque
ratio
Neither pedal
can be assistive,
fixed torque
ratio
Excellent (5) Good (4) Satisfactory (3) Mediocre (2) Unacceptable
(1)
Ease of
Control
The input
torque shape
profile is the
same for each
pedal, although
they have
different
magnitudes.
The device can
"coast" when
the user stops
pedaling.
The input
torque shape
profile is
similar for each
pedal, although
they have
different
magnitudes.
The device can
"coast" when
the user stops
pedaling.
The input
torque shape
profile for each
pedal is
dissimilar. The
device cannot
"coast" when
the user stops
pedaling.
Manufactur-
ability
All major
components can
be purchased
"Commercially
Off the Shelf"
and require
minimal
modifications.
More than
half the major
components
can be
ordered off
the shelf,
manufactured
parts are
simple and
can be
machined at
the WPI shop
Some of the
major
components can
be ordered off
the shelf and
parts of simple
to moderate
complexity can
be machined at
the WPI shop.
Some of the
major
components
can be
ordered off
the shelf and
manufactured
parts are
complex and
may require
outside
machining.
None of the
major
components can
be ordered off
the shelf and
are very
complicated to
manufacture.
Cost
The mechanism
costs $0-64
USD.
The
mechanism
costs $65-128
USD.
The mechanism
costs $129-192
USD.
The
mechanism
costs $193-
256 USD.
The mechanism
costs more than
$256 USD.

51
Decision Matrices
Finally, using the weighting factors and the ranking criteria, each member of the group
individually created a decision matrix (Appendix D), and then the values were averaged to create a final
decision matrix (Table 16). The design was assigned a numerical value 1-5 for each design goal based on
the ranking criteria, multiplied by the weighting factor, and finally the values for each design goal were
summed to get a total for each power mechanism.
Table 16: Mechanism Component Decision Matrix Average
Based on the decision matrix average, the highest design was the CVT. However, because this
design contains very complex and customized parts, it received a 1 (unacceptable) in cost, so the design
was eliminated. Upon further examination of the bicycle safety codes, a bicycle with a motor would not
pass the standards of the code, so the ranking for safety of the motor design was shifted to a 1. The motor
was then eliminated because it received a 1 (unacceptable) in safety. After eliminating these two designs,
the highest three designs are the piston, the push pedal, and spring resistance designs, which will be
paired with the highest designs in the remaining components section to follow.
Remaining Design Components
To analyze the components of the design, morphological charts of the possible component
combinations were created. Prior to creating the morphological charts, several components were pre-
selected independent of the other components. The components that remain constant throughout each
design combination are frame, pedals, wheels, and seat. We began by selecting the recumbent frame with
a one-piece molded seat design. We chose these components because they are far more feasible for use

52
with recovering stroke patients. The recumbent frame allows patients to sit in a more comfortable, well-
supported position, at a height that is easy to climb onto. In addition, as previously shown in our
background chapter, these positive factors do not change the muscle activation required to pedal. With the
selection of a recumbent design, platform pedals were also chosen because clips are not used in
recumbent cycling. Finally, multi-use wheels were chosen as a compromise between the lightweight
design of road tires and the stability of mountain tires. The patients are not trying to achieve a maximum
speed; so adding some additional weight to the tires does not negatively affect the user. The patients are
also not navigating harsh terrain, so the additional stability from the mountain tires does not prove useful
for this specific application. The constant components are summarized in Table 17.
Table 17: Constant Components Summary
Frame Pedals Wheels Seat
Upright Platform Road Tires Upright seat-no back
Recumbent Pedal toe clips Multi-Use Tires upright seat with added back
Clipless bike pedals Mountain Tires one-piece molded seat with back
The components that were analyzed in different combinations were drive-train, brakes, and
steering. The rim brake design was eliminated from every design because the brakes do not function well
when wet. Due to the single wheel in the front, the three wheel single in front design could be paired with
either handlebars or a tiller for steering and either drum or disc brakes. The three wheel single in the rear
and four wheel designs were limited to the tiller steering and disc brakes because both handlebar steering
and drum brakes are only suited to rear-drive train designs. Each morphological chart is shown in Table
18-Table 23.
Table 18: Combination 1 Morphological Chart
Combination 1 (Rear, Tiller, Disc)
Drivetrain Brakes Steering
3 Wheel Single in Rear Rim Handle bars
3 Wheel single in front Drum Tiller

53
4 wheels Disc
Table 19: Combination 2 Morphological Chart
Combination 2 (Front, Handle Bars, Drum)
Drivetrain Brakes Steering
3 Wheel Single in Rear Rim Handle bars
3 Wheel single in front Drum Tiller
4 wheels Disc
Table 20: Combination 3 Morphological Chart
Combination 3 (Front, Handle Bar, Disc)
Drivetrain Brakes Steering
3 Wheel Single in Rear Rim Handle bars
3 Wheel single in front Drum Tiller
4 wheels Disc
Table 21: Combination 4 Morphological Chart
Combination 4 (Front, Tiller, Drum)
Drivetrain Brakes Steering
3 Wheel Single in Rear Rim Handle bars
3 Wheel single in front Drum Tiller
4 wheels Disc
Table 22: Combination 5 Morphological Chart
Combination 5 (Front, Tiller, Disc)
Drivetrain Brakes Steering
3 Wheel Single in Rear Rim Handle bars
3 Wheel single in front Drum Tiller
4 wheels Disc
Table 23: Combination 6 Morphological Chart
Combination 6 (Four, Tiller, Disc)

54
Drivetrain Brakes Steering
3 Wheel Single in Rear Rim Handle bars
3 Wheel single in front Drum Tiller
4 wheels Disc
Design Goals
Similar to the decision making process for the power mechanism, for the remaining tricycle
components, first, design goals were created.
Ergonomics: To encourage the use of the device, it must be comfortable to sit on. The
device should have a backrest, the seat width and height should fall within the standard set in the
design specifications, and the device should allow for use by patients within the height and
weight limits set in the design specifications.
Safety: To ensure the safety of the user, the device must have functioning and easy to
control brakes and steering.
Conform to User Requirements: The device must be adjustable to fit any person within
the height and weight ranges set in the user requirements.
Ease of Control: The device should allow the user to steer and brake with one hand.
Stability: To ensure safety, the device must balance on its own, and require minimal
balance from the patient while they are riding. The device must also fit the standards set in the
tipping analysis.
Cost: The more economical the device is, the more people who will be able to afford it.
Manufacturability: A majority of the components should be available to buy off the
shelf.

55
Pairwise Comparison Chart
To establish the relative importance of the design goals, the group individually filled out pairwise
comparison charts of the design goals (Appendix D), and averaged these values to get a final pairwise
comparison chart (Table 24).
Table 24: Tricycle Component Pairwise Comparison Chart Average
Rank Ordering
From Table 24 the design goals were rank ordered (Table 25).
Table 25: Final Rank-Order of Design Goals for Tricycle Components
Final Rank Order
1 Safety
2 Stability
3 Ease of Control
4 (Tie) Ergonomics
4 (Tie) Conform to User
Req.
6 Cost
7 Manufacturability
Weighting Factors
Next, weighting factors were assigned to the design goals. Again, a range for ranking factors was
established based on whether the design goal was critical, important, or encouraged (Table 26). Based on
the ranges, each design goal was awarded a numerical weighting factor (Table 27).

56
Table 26: Relative Weighting Factors for Tricycle Components
Critical 17-20
Important 11-16
Encouraged 0-10
Table 27: Numerical Weighting Factor for Tricycle Component Design Goals
Critical Safety 20
Stability 18
Important
Ease of Control 16
Conform to User
Requirements 14
Ergonomics 14
Encouraged Cost 10
Manufacturability 8
Safety and stability are the most important factors, and therefore account for the greatest weight.
Ease of control, conform to user requirements, and ergonomics are important design goals, with ease of
control being weighted the highest. Finally, cost and manufacturability are encouraged design goals.
Ranking Criteria
Ranking criteria were also created for the tricycle components (Table 28). Similarly, each design
goal is split into excellent (5), good (4), satisfactory (3), mediocre (2), and unacceptable (1). For each
design goal, the necessary criteria are listed for that design goal to achieve an excellent, good,
satisfactory, mediocre, or unacceptable.

57
Table 28: Ranking Criteria for Tricycle Components
Excellent (5) Good (4) Satisfactory
3)
Mediocre (2) Unacceptable
(1)
Ergonomics
Device
configuration
includes a
backrest. The
seat height and
width fall
within the
stated
requirements.
Frame allows
for a pedaling
range of
motion within
those defined
in the user
requirements.
The seat height
and width fall
within the
stated
requirements.
Frame allows
for a pedaling
range of
motion within
those defined
in the user
requirements.
The seat
height or
width may fall
within the
stated
requirements.
Frame allows
for a pedaling
range of
motion within
those defined
in the user
requirements.
The seat
height and
width do not
fall within the
stated
requirements.
Frame allows
for a pedaling
range of
motion within
those defined
in the user
requirements.
The seat does not
fall within the
stated
requirements.
Frame does not
allow for a
pedaling range of
motion within
those defined in
the user
requirements.
Safety
Meets the
Consumer
Product Safety
Commission
standards on
bicycle safety.
Code of
Federal
Regulations
(CFR) in Title
16, Part 1512.
Does not meet
the Consumer
Product Safety
Commission
standards on
bicycle safety.
Code of Federal
Regulations
(CFR) in Title
16, Part 1512.
Conform to
User Rqmts
Fully
adjustable to
accommodate
any user
height and
weight beyond
the given user
requirements.
Fully
adjustable to
accommodate
any user
height and
weight up to
the given user
requirements.
Does not
accommodate
user height and
weight up the
user
requirements.

58
Excellent (5) Good (4) Satisfactory (3) Mediocre
(2)
Unacceptable
(1)
Stability
The device is
dynamically
stable above
the assumed
maximum
tipping angle
of 27 degrees.
Additionally,
the device
remains stable
while
cornering fast
turns.
The device is
dynamically
stable up to the
assumed
maximum
tipping angle
of 27 degrees.
Additionally,
the device
remains stable
while
cornering fast
turns.
The device is
dynamically
stable up to the
assumed
maximum
tipping angle of
27 degrees;
however, the
device may tip
while cornering
too fast.
The device
may tip
while
cornering
fast turns or
well below
the assumed
maximum
tipping
angle.
The device is
inherently
unstable.
Ease of
Control
The device
allows the user
to both steer
and brake with
one hand.
The device
allows the user
to either steer
or brake with
one hand.
The device
requires the
user to use two
hands to steer.
The device
requires two
hands to
steer or
brake.
Device cannot be
steered, the
brakes cannot be
applied.
Manufactur-
ability
All major
components
can be
purchased
"Commercial
Off the Shelf"
parts with
minimal
modifications.
More than half
the major
components
can be ordered
off the shelf,
manufactured
parts are
simple and can
be machined at
the WPI shop
Some of the
major
components can
be ordered off
the shelf and
parts of simple
to moderate
complexity can
be machined at
the WPI shop.
Some of the
major
components
can be
ordered off
the shelf and
manufacture
d parts are
complex and
may require
outside
machining.
None of the
major
components can
be ordered off
the shelf and are
very complicated
to manufacture.
Cost
The tricycle
costs between
$0-136 USD
The tricycle
costs between
$137-280 USD
The tricycle
costs between
$281-368 USD
The tricycle
costs
between
$369-544
USD
The tricycle
costs more than
$544 USD

59
Decision Matrices
Next, using the weighting factors and the ranking criteria, each member of the group individually
created a decision matrix (Appendix D), and then the values were averaged to create a final decision
matrix (Table 29).
Table 29: Tricycle Component Decision Matrix Average
Based on Table 29, the two best tricycle component combinations are single front wheel, handle
bars, disc brakes; and single front wheel, tiller, and disc brakes. Using the information from Table 16 and
Table 29, the final six full device combinations can be found in Table 30.
Table 30: Final Initial Design Combinations
Front, Handle Bars, Disc Front, Tiller, Disc
Push Pedal 1. (Spring Resistance, Front,
Handle Bars, Disc)
2. (Spring Resistance, Front,
Tiller, Disc)
Push Pedal 3. (Push Pedal, Front, Handle
Bars, Disc)
4. (Push Pedal, Front, Tiller,
Disc)
Spring Resistance 1. (Spring Resistance, Front,
Handle Bars, Disc)
2. (Spring Resistance, Front,
Tiller, Disc)

60
Selection of Final Design
After analyzing the tiller and handlebar designs in more detail, the group decided that the tiller
steering is more suited to a tricycle for a stroke patient. The tiller allows for the user to steer effectively
with one arm, as would be safer for a person affected by hemiparesis. The tiller design also can be more
easily placed in the recumbent frame design without being uncomfortable or out of the reach of the user.
Therefore, the front, tiller, disc brakes design from Table 30 will be paired with the best mechanism
design.
In order to select the best design among the piston, push pedal, and spring resistance design,
propulsive force calculations were carried out to analyze the force input required by the rider for each of
the top three designs. An analysis on the size and complexity of each design was also carried out. With
the information obtained from the detailed analysis of the top three designs, another decision- making
process was completed to determine a final design.
Propulsive Force Calculations
In order to analyze the designs, the forces required by the user to propel the device forward must
be calculated. With these forces, and an assumed gear ratio, the required input torque can be found for
which the user must overcome. From this required input torque, the designs can be individually analyzed
to determine the assistive potential of the device. The essential equations for this analysis are shown in
this section of the report.
Assumptions
The wheels were given an assumed diameter of 0.54m. The cross-sectional area of the rider and
the device perpendicular to the direction of travel was assumed to be 1.5m2. The rolling friction
coefficient between the tires and the road was assumed to be 0.004 while the drag coefficient of the
device and rider moving through air was assumed to be 0.8 (Device moving through static wind, wind
velocity = 10m/s). For the wind resistance, the air was assumed to have a density of 1.225 kg/m3. It was

61
further assumed that the rider would operate the device in the range of 0 m/s to 10 m/s. For all of the
calculations, it was assumed that the rider would accelerate the device from rest to each speed in 5
seconds. The full derivation of this analysis can be found in Appendix E.
Force Calculations
Once the assumptions had been determined, the friction force, acceleration force, and wind forces
were calculated (Figure 27).
Figure 27: Powered Wheel Free Body Diagram
The frictional force is exerted horizontally on the wheels opposite to the direction of travel.
𝐹𝑓𝑟𝑖𝑐 = 𝑓𝑟𝑖𝑐𝑡𝑖𝑜𝑛 𝑐𝑜𝑒𝑓𝑓𝑖𝑐𝑖𝑒𝑛𝑡 ∗ 9.81𝑚
𝑠2∗ (𝑚𝑟𝑖𝑑𝑒𝑟 + 𝑚𝑑𝑒𝑣𝑖𝑐𝑒)
The force of the wind was determined by the following equation:
𝐹𝑤𝑖𝑛𝑑(𝑣) =1
2∗ 𝜌 ∗ 𝑣2 ∗ 𝐶𝐷
Where Fwind is the drag force due as a function of velocity, ρ is the density of air at STP, v is the rider’s
velocity, and CD is the transverse cross sectional area of the rider and device.

62
Since the equation is a function of the velocity, the change in the wind force as the rider
accelerates can be accounted for.
Torque Calculations
The torque at the wheels was calculated by using the total force and the radius of the wheel.
𝑇𝑤ℎ𝑒𝑒𝑙 = (𝐹𝑓𝑟𝑖𝑐 + 𝐹𝑤𝑖𝑛𝑑) ∗𝑑𝑤ℎ𝑒𝑒𝑙
2
With the torque at the wheel determined, it was next necessary to relate the torque at the driven wheels to
the torque at the crank. A standard gear ratio for a bicycle drivetrain is 53:39 (Wikstrom, 2014). The
torque at the wheels was multiplied by this gear ratio to find the torque required at the crank, yielding a
resistive torque of 30 N*m. This value was used in the mechanism analyses.
Angular Velocity Calculations
In order to analyze the mechanisms, the angular velocity was needed in addition to the torque.
The angular velocity (ωwheel) was calculated by dividing the linear velocity (v) of the device by the radius
of the wheels (rwheel). This calculation yielded the angular velocity in radians per second since it
determined the number of full rotations of the wheel needed in order to cover a given distance every
second.
𝜔𝑤ℎ𝑒𝑒𝑙 =2𝜋𝑣
𝑐𝑤ℎ𝑒𝑒𝑙
Where v is the linear velocity of the device and cwheel is the circumference of the driven wheel.
Multiplying this by the sprocket ratio of 52:39 yielded a pedal crank angular velocity of 18120 rad/sec at
a device velocity of 10m/s.
Performance Analysis
For each of the three designs, the analysis was carried out to obtain a plot that demonstrates the
input torque required versus the position in the pedaling cycle.

63
Spring Resistance and Pedal Car Design Analysis
The plots for the input torque versus pedal position for the piston and spring resistance and push
pedal designs can be found in Figure 28 and Figure 29.
Figure 28: Piston Input Torque Required Versus Position in Pedaling Cycle for Spring Constants 100
N/m to 1900 N/m

64
Figure 29: Spring Resistance and Push Pedal Input Torque Required Versus Position in Pedaling Cycle
for Spring Constants 200 N/m to 2000 N/m
The spring acts the same on the spring resistance and the push pedal designs, so the analysis for
these mechanisms is the same. Figure 28 and Figure 29 show the effect of the spring constants varying
from 200-2000 N*m on the required input torque. In order provide a more accurate understanding of how
spring stiffness effects level of assistance, a simulated torque resistance of 30 N*m (as calculated in
Propulsive Force Calculations) was applied to the wheel axis in the opposite direction of travel. The plot
also includes constant lines at -30, 0, and 30 N*m. When selecting a final design, a spring constant that
keeps the magnitude of the curve between these values should be selected. The goal of the mechanism is
to reduce the force required by the weak leg, not make the weak leg do no work at all. Once the curve
passes -30 N*m, the weaker leg would be doing no work. When the curve is 0-30 N*m, the torque
required is reduced, but the weak leg is still doing work.

65
Piston Design Analysis
The piston design (Figure 30) utilizes a simple crank-slider mechanism, in which the pedal crank
is the driving link, to store and use potential energy within a spring. As the strong leg enters its power
cycle during pedaling, it is also compressing a spring connected to the piston slider. This energy is then
used as the weak leg enters its power cycle and extends the spring. This analysis aims to provide a
baseline understanding of how this mechanism works with respect to assisting the weak leg. Additionally,
it studies the effects of different spring constants on providing assistance.
Figure 30: Piston Design
Assumptions
In order to provide a more accurate understanding of how spring stiffness effects level of
assistance, a simulated torque resistance of 30 N*m (as calculated in Propulsive Force Calculations) was
applied to the wheel axis in the opposite direction of travel. The size of each link was chosen to best
Pedal Crank Axis
Wheel Axis (Powered)

66
represent a four-bar linkage that satisfies the Grashof condition and is reasonably sized to fit within a
standard bicycle frame (Figure 31): a = 0.0181m, b = 0.127m, and c = 0m.
Position Calculations
Figure 31 shows the definitions for calculations of the crank-slider mechanism. Solving for d
yields the displacement with respect to a fixed point in space (O2). This fixed point was treated as the
stationary end of the spring. This then allowed for Hooke’s law to be applied when calculating spring
force.
Figure 31: Crank Slider Mechanism Definition (Norton 1999)
All equations in this position analysis were taken as functions of the pedal crank rotation, θ2. θ3 is
expressed as,
𝜃3 = arcsin (𝑎 ∗ sin(𝜃2) − 𝑐
𝑏)
This yields the link length d as a function of θ2 and θ3,
𝑑 = a ∗ cos(𝜃2) − 𝑏 ∗ cos (𝜃3)
The distance (d) of the slider with respect to the crank axis of rotation is shown in Figure 32.

67
Figure 32: Slider Displacement vs Crank Rotation
Force Calculations
The force on the spring can be expressed using the independent variable, k, and the dependent
variable, d, as derived in the position analysis using Hooke’s law:
𝐹𝑠𝑝𝑟𝑖𝑛𝑔 = 𝑘𝑑
The free body diagram of the slider-crank mechanism is shown in Figure 33 and Figure 34.

68
Figure 33: Slider Crank Applied Piston Force (METU, nd.)
Figure 34: Diagram of Slider Crank Mechanism (METU, nd.)
Where the angle between F34 and the horizontal axis is defined as φ,
𝐹14 = 𝐹𝑠𝑝𝑟𝑖𝑛𝑔
−𝜑 = 180 − 𝜃3
Thus the force acting on the two force member, link AB can be defined as,
𝐹43 = 𝐹14 ∗ cos (𝜑)
𝐹23 = −𝐹43
ϕ
Fr

69
The free body diagram at point A is described in Figure 34, where Fr is orthogonal to link OA.
Where,
𝜓 = 90 − 𝜃2 − 𝜑
Thus, the radial force acting on the pedal crank can be expressed as,
𝐹𝑟 = 𝐹32 ∗ cos (𝜓)
Finally, the torque acting on the pedal crank is,
𝑇12 = (𝐹𝑟 ∗ 𝑎) + 𝑇0
Where T0 is the simulated resistance, which occurs from the device’s motion. A plot of experienced
torque versus pedal crank is shown in Figure 35.
Figure 35: Pedal Crank Torque versus Angle (k = 100:2000 N/m)

70
Any value above or below the “neutral” simulated torque is either assisting or resisting the strong
and weak legs respectively. The assistive torque should come close to zero in order to provide maximum
help to the weak leg; however, if this value drops below zero, the pedal will have the tendency to move
the pedal without any input from the weak leg.
Input Force Comparisons
When selecting a final design, it is important to understand how the user must interact with each
concept. For example, it can be seen that the spring designs store mechanical potential energy to assist the
weak leg; however, the amount of force each leg must exert is not immediately clear. Without
investigation, it cannot be known whether the spring stiffness required to achieve a certain level of
assistance consequently forces the strong leg to exert more force than would be acceptable. Throughout
the pedaling cycle, the normal force applied at the pedal is not constant, Table 31 shows the pedal force
scaling factor (F1) for eight discreet points in the cycle. For each of the spring designs, the required
pedaling force was calculated by dividing the resistive torque by the pedal crank radius, and then
multiplying this constant normal force by the corresponding scaling factor to its location in the pedaling
cycle.
Table 31: Pedal Force Scaling Factors (Passive Assistance Pedaling Device MQP, 2014)

71
By scaling the forces to reflect approximately what a rider would experience, curves could be generated
to understand how each mechanism can be used to assist the weak leg during use. The force curves for
the piston and spring resistance designs are shown in Figure 36 and Figure 37.
Figure 36: Piston Design Pedal Forces
Figure 37: Spring Resistance Design Pedal Forces

72
The pedal forces and amount of assistance between the spring designs is comparable. With
further design optimization better assistance levels can be achieved; however, the similarities between
designs would remain. Therefore, a decision must be based on other factors such as design complexity
and manufacturability.
Mechanism Bounding Conditions
The mechanism bounding conditions illustrate the volume through which parts of the mechanisms
must operate. The larger each box is, the more likely it is that the mechanism will interfere with other
parts being added to the device, such as the wheels or the steering mechanism. These boundaries may also
affect the configuration of the device. For example, the push pedal mechanism uses long links, so it will
limit the length of the device to a very specific dimension, thus affecting the adjustability for the riders.
Push Pedal Mechanism
Figure 38 shows the arrangement of the push pedal design. In the figure, the stationary link 1
measures 43 cm. The driving link 2 has a length of 9 cm. The rocker, link 4, has a length of 20 cm. Link 2
reaches its highest position at an angle of π/2 radians, and reaches its largest horizontal extension at an
angle of π radians. Link 4 sweeps between the angles 3.89 and 4.81 radians from the horizontal. Positions
1 and 2 denote the largest vertical and horizontal positions of link 2, respectively. Positions 3 and 4 are
the minimum and maximum angular displacements of link 4, respectively.

73
Figure 38: Boundary Box for the Spring Resistance Mechanism
For link 2, the maximum horizontal and vertical displacements are as follows:
𝑦𝑚𝑎𝑥 = 9 𝑐𝑚 ∗ sin𝜋
2= 9 𝑐𝑚
𝑥𝑚𝑎𝑥 = 9 𝑐𝑚 ∗ cos 𝜋 = −9 𝑐𝑚
For position 3 of link 4:
𝑦 = 20 𝑐𝑚 ∗ sin 3.89 = −14 𝑐𝑚
𝑥 = 20 𝑐𝑚 ∗ cos 3.89 = −15 𝑐𝑚
For position 4 of link 4:
𝑦 = 20 𝑐𝑚 ∗ sin 4.81 = 20 𝑐𝑚
𝑥 = 20 𝑐𝑚 ∗ cos 4.81 = 2 𝑐𝑚
For link 4, position 4 represents the largest horizontal displacement since the link sweeps past the
pivot point. However, largest vertical displacement will occur when the link is at 3π/2 radians. Therefore,
the displacement will be 20 cm.

74
In the x direction, the sum of displacements is 54 cm. In the y direction, the sum of displacements
is 29 cm. In the z direction, the mechanism extends 25 cm symmetrical about the x-y plane. Therefore, the
boundary box for the push pedal design measures 54 cm x 29 cm x 25 cm.
Piston Mechanism
The piston mechanism is shown in Figure 39. For the piston mechanism, the x boundary is 21 cm,
the y boundary is 54 cm, and the z boundary is 6 cm. Therefore, the boundary box for the piston design
measures 21 cm x 54 cm x 6 cm.
Figure 39: Boundary Box for the Piston Mechanism
Spring Resistance Mechanism
Figure 40 shows the front two sprockets of the spring resistance design. The rear sprocket is a
normal rear sprocket of a bicycle drivetrain. Since that area of the design will not require any
modification, it will not be included in the boundary analysis. The two sprockets have the same diameter.
The x dimension will therefore be twice the diameter, 42 cm. The y dimension will be 21 cm. The z

75
dimension will be the thickness of the sprockets, which should be no larger than 2 cm. Therefore, the
boundary box for the spring resistance will be 42 cm x 21 cm x 2 cm. It must be noted that this analysis
does not account for the width of the spring.
Figure 40: Boundary Box for the Spring Resistance Mechanism
Size and Complexity Analysis
One important consideration for the final design selection was the size of each mechanism. As
described in the bounding conditions section, the piston and push pedal mechanisms both added
significant volume to the device. The outer boundary of the piston mechanism measures 21 cm x 54 cm x
6 cm (6,804 cm3), while the boundary of the push pedal mechanism was 54 cm x 29 cm x 25 cm (39,150
cm3). In contrast, the spring resistance mechanism only reaches a boundary of 42 cm x 21 cm x 2 cm
(1,764 cm3). Since the spring resistance mechanism has the smallest boundary, it will be the most
compact and also the easiest mechanism to integrate into the device. The mechanism takes up the least
amount of space, so it will be the least likely to interfere with the addition of parts such as the wheels and
steering mechanisms. The spring resistance design will also require the least amount of modification to an
existing device, thus making it easier to integrate into an existing device.
Another important consideration for the final design selection is the complexity of each
mechanism. The push pedal design requires three links (one of which is irregularly shaped), a custom

76
sprocket, and a spring to be added to the standard drivetrain of a tricycle. The piston design requires a
link, a piston, a cylinder, and a spring to be added to the standard drivetrain of a tricycle. In addition,
these designs will require many of the parts to be machined, which will significantly increase
manufacturing time. In contrast, the spring resistance design only requires the addition of a sprocket, a
spring, and potentially an additional chain, all of which can be purchased and then modified. Thus, the
spring resistance design will have the lowest potential of manufacturing error of the three mechanisms.
Decision Matrix
After the additional analysis, another decision matrix was used to determine the best design. The
previously created ranking criteria for the mechanism were used, and each team member individually
filled out the decision matrix (Appendix F) before an average was taken to determine the best design
(Table 32).
Table 32: Average Decision Matrix for Final Mechanism Design
Criteria
Mechanisms Safety Cost Ergonomics Ease of
Control
Manufactur-
ability
Conform to
User
Requirements
Power
Adjustability
Weighting Factors 18 5 11 10 5 16 35 Total
Piston 5.00 2.75 4.00 3.75 3.00 3.25 4.00 390
Push Pedal 5.00 2.25 4.25 3.25 3.00 3.25 4.00 385
Spring Resistance 5.00 4.00 4.50 3.50 4.00 3.25 4.00 407
Based on the decision matrix, along with the analysis of the force required by the user, the team
moved forward with the spring resistance design.

77
Final Design
After selecting the spring resistance design, it was paired with the single wheel in front,
recumbent design, disc brakes, tiller, platform pedals, and multi-use tires to create a detailed design. A
frame including the tricycle components was modified from an existing product. The unique spring
resistance design was incorporated into the remaining components.
Frame Selection and Modification
When creating the final design, it was determined that using an existing product for the frame
would allow for feasible manufacturing. The majority of recumbent tricycles cost between $1500 and
$3000, which is not feasible for this project. Manufacturing the entire tricycle is also not feasible for this
project due to time and machine space limitations. Therefore, a commercially available tricycle (Figure
41) was purchased to provide the rear portion of the frame and remaining components, combined with a
custom front wheel mechanism (Figure 42). The custom front end will be discussed in more detail in the
following section.
Figure 41: MOBO Triton Pro (Mobo Triton Pro Ultimate Ergonomic Cruiser, 2015)

78
Figure 42: Custom Front End
The MOBO Triton tricycle contains many of the selected remaining design components, but also
requires a few compromises. The MOBO has a single wheel in the front, recumbent design, platform
pedals, and multi-use tires, all of which meet our previous selections. The main difference in the MOBO
design and our selected design is the type of brakes. We selected disc brakes as the preferred type of
brakes for our design, but the MOBO has rim brakes. The primary reason for selecting disc brakes for a
tricycle is because of the large weight increase of a tricycle over a bicycle. However, due to the low to the
ground and lightweight design of the MOBO, it does not have the increased weight of higher end
tricycles. In addition, the MOBO already has the hardware and design necessary for the rim brakes,
allowing for a simple and safe design.
The MOBO also has slightly different steering than the single tiller originally selected for the
design. When examining different types of steering, handlebars and tiller were examined. The MOBO has

79
a unique type of steering that was not examined before choosing the best design. The double tiller has the
same advantage that led to the selection of the single tiller: it can be operated with one hand. Therefore,
using the double tiller of the MOBO design does not significantly alter our design considerations.
Spring Mechanism and Support Structure
The design is a hybrid design, which implements a combination of a commercially available
tricycle and a custom front wheel mechanism. The stock front end that comes on the MOBO Triton pro
couples to the rear end by means of a steel tube that fits inside a steel sleeve on the rear portion of the
frame. The custom front mechanism uses a commercially available bicycle frame welded to a steel tube.
The steel tube will connect to the rear end of the MOBO.
Using an existing bicycle frame allows for use of the existing structure which has the correct
geometry to hold a standard 24-inch bicycle wheel, rear sprocket cassette, front and rear derailleur, and
front crank set with pedals. With the bicycle frame inverted, the front crank set is positioned such that the
user pedals recumbently with respect to the rest of the frame.
The spring resistance mechanism is driven by a secondary sprocket of equal radius with the
lowest gear sprocket in the front crankset. The primary sprocket in the front crankset will be reserved as
the driving sprocket to the front wheel (Figure 43).

80
Figure 43: Chain Profile
Spring
The spring was chosen based on calculations from the preliminary design analysis, which showed
a spring constant of ~2000 N/m as the most viable candidate (Figure 44). However, the design will be
validated for significantly stiffer springs to allow for variance in testing. Geometric constraints and part
availability was also a factor in the selection. Details on the nominal spring are shown in Table 33.
However, a variety of springs will be selected for testing.
Table 33: Spring Data
Century Spring Corp
Part Number 5597
Rate 11lbf/in (1926N/m)
Free Length 7.71in (0.196m)

81
Figure 44: Spring Performance Curves

82
Design Analysis
To determine the feasibility of the detailed design, various analyses were completed on the
components of the tricycle. Analyses were completed on the frame of the tricycle, including stress
analysis, mobility analysis, and Finite Element Analysis. The analysis also included finding the factor of
safety for the components of the tricycle, to ensure each component could withstand the applied forces.
Finally, a stress and fatigue analysis of the bracket supporting the spring-assisted sprocket was completed.
Design Structural Analysis
As part of the design validation process, a detailed structural analysis was conducted on each
critical component to ensure that it will survive normal use. The design was split into two parts: the
support structure and the spring mechanism.
Support Structure
The support structure is defined as the connecting structure between the bicycle frame and the
spring mechanism (Figure 45). It consists of six connecting rods and a coupler plate. The connecting rods
attach at each end using swiveling tie-rod ends. Each tie-rod end has 3 rotational degrees of freedom, as
well as axial adjustment, which gives the structure the flexibility to be attached on the frame even if the
mounting points are imprecisely placed.

83
Figure 45: Support Structure
At each of the three connection points on the coupling plate a shoulder screw is used in
conjunction with a flanged locknut in order to have less play in the structure. A full stack-up typical of all
three connection points is shown in Figure 46.
Figure 46: Typical Coupler Plate Connection Stack-Up

84
Mobility Analysis
The support structure is analogous to a linkage mechanism; however, to be considered a structure
it must have 0 degrees of freedom. In three-dimensional space, the “linkage” has 2 grounded links (one on
each chain-stay on the frame) and 6 other links, each with a two ball joints supporting 3 degrees of
freedom. Finally the support plate itself is treated as a link, bringing the total count to 9 links with 2 being
grounded. Using the Kutzbach Mobility equation:
𝑀 = 6(𝐿 − 𝐺) − 5𝐽1 − 4𝐽2 − 3𝐽3 − 2𝐽4 − 𝐽5 = 6(9 − 2) − (3 ∗ 12) = 6𝐷𝑂𝐹
Although the mobility analysis shows the structure having 6 degrees of freedom, this system can
still be treated as a structure instead of a mechanism because there is an idle DOF about the long axis of
each tie rod. This rotation will not impact the rigidity of the structure but will still be reflected in the
mobility equation.
Static Analysis Methodology
The support structure was analyzed statically in the condition where the forces generated by the
pedals and spring are highest. This condition was determined to be when the spring is fully extended,
where Teffective is at its highest (Figure 47).

85
Figure 47: Secondary Sprocket Section w/ Applied External Spring Load
Using the chosen spring (k = 1900N/m), the max load Fspring was calculated to be ~200N by
applying Hooke’s law and a deflection of 0.105m which was determined using the sprocket geometry:
𝐹 = −𝑘x
However, the applied spring load in the forthcoming analyses was multiplied by a scalar of 5 to
ensure structural integrity up to spring constants of 10000 N/m.

86
Finite Element Model
Due to the complex geometry presented in this analysis, Finite Element methods were used to
validate the structural integrity of the design. The goal of this analysis is to determine the minimum static
safety factor when a remote load of 1000N is applied to the support structure.
The coupler plate geometry was used to create a Finite Element Model (FEM) of the system
(Figure 48). Bolts were reduced in complexity to reduce the element count. The entire system was left as
an assembly to more accurately represent the behavior of the components together. Each part connection
was chosen to most accurately represent the type of physical connection. These connections occur at
points of contact between parts; components that are not supposed to move with respect to each other
were deemed “welded.” For example, the Bottom Bracket Shell (Figure 45) is welded to the coupler
plate, and therefore can be modeled as a rigidly bonded connection.
Figure 48: Geometry Analyzed using FEM

87
FEM Boundary Conditions
The next step in preparing the numerical solution was to apply boundary conditions, or supports
and loads. Following the mobility analysis, each connecting rod was treated as a two-force member;
therefore, each tie-rod end (A, B, C, D, E, and F as shown in Figure 49) was only fixed along its axis.
This was done using “Cylindrical Supports,” which fixes displacement along an axis defined by a
cylinder, in this case the allowed displacement is 0m. The external spring load was applied as a remote
load acting on the interior surface of the bottom bracket shell (Figure 49). A remote load applied to a
body simply takes a force located in space somewhere and finds the resultant forces and moments acting
at the centroid of the body. In this case, the body is symmetrical and the centroid is located in the middle
of the assembly. By applying the load vector remotely, it allowed for the spring force to be directly
applied to the finite element model. Finally, Standard Earth Gravity was applied to factor in for the
weight of the components.
Figure 49: FEM Boundary Conditions

88
Materials
Two different materials were used in the FEM, Low Carbon Steel and Alloy Steel. All of the
machined parts will be made out of AISI 1010, Cold Drawn Sheet, and the purchased fasteners are all
made out of Alloy Steel (AISI 1340). Physical Properties are shown in Table 34.
Table 34: Material Properties
Material AISI 1010, Cold Drawn AISI 1340 Alloy Steel
Density 7.87 g/cm3 7.87 g/cm3
Young’s Modulus 205 GPa 200 GPa
Poisson’s Ratio 0.29 0.29
Tensile Yield Strength 305 MPa 565 MPa
Mesh
The model was meshed using Solid Tetrahedron Elements with automatic sizing per each
component’s surface details (Figure 50).
Figure 50: FEM Mesh

89
Results
After running a Static Structural Analysis using the ANSYS solver, stress, deformation and
reactionary force data were computed. Intuitively, one would expect to see the highest stress at the bolts,
as all of the load is transferred through the three shoulder screws. This is reflected in the Equivalent (von-
Mises) Stress Fringe Plot (Figure 51 and Figure 52) where the peak stresses of 176MPa occur in the bolts
where the bending moments are highest.
Figure 51: Von-Mises Fringe Plot, Bottom View

90
Figure 52: Von-Mises Fringe Plot, B1 Interface (Section A-A)
Factor of Safety
The minimum factor of safety on the support plate with a value of ~1.5 (Figure 53). It is also
noteworthy that the applied load is already five times greater than the spring chosen for the final design,
therefore making the true factor of safety much higher.
Figure 53: Minimum Factor of Safety at B2 Section

91
Spring-Sprocket Connection
The spring is connected to the sprocket by hooking onto a standard bolt. This fastener is fixed
into the sprocket by means of a locknut. For the analysis, the bolt was treated as a cantilevered beam with
a circular cross section equal to the bolt’s minor diameter. The applied Fs was the nominal spring force
multiplied by five to allow for use of stiffer springs if necessary. The geometry described in Figure 54
was simplified to that in Figure 55.
Figure 54: Spring to Sprocket Interface
Figure 55: Cantilevered Beam FBD (Beam Deflection Formulae)

92
The bolt mechanical properties are described in Table 35.
Table 35: Connecting Bolt Properties
3/8-16 Socket Cap Screw
Minor Diameter 0.007544m
Effective Length 0.01905m
Young's Modulus 200GPa
Yield Strength 565MPa
With an applied P of 1000N, the maximum stress occurred in bending with a value of 452MPa at
x = 0. This yields a minimum Factor of Safety of 1.25 for springs rated up to 10000 N/m, which is 5 times
stiffer than the spring expected to be used. Additionally, the maximum deflection of the screw occurred at
x = 0.01905m with a value of δmax = 7.2x10⁻⁵m.
Spring Bracket Analysis
The spring bracket is mounted to the frame on the opposite side to the secondary chain sprocket
in order to avoid interference between the spring and the chain (Figure 56). It provides a rigid anchor
point for the stationary side of the extension spring providing assistance to the rider. The purpose of this
analysis is to determine its safety factor against failing when a spring load of 1000N is applied.

93
Figure 56: Spring Bracket Location
The geometry of the spring bracket was modified (Figure 57) in order to make stress calculations
simpler. The new geometry is simply a right angle cross section with the dimensions as described in
Table 36.
Table 36: Spring Bracket Dimensions
Dimension Value (m)
L 0.0381
a 0.0191
t (thickness) 0.00635
w (width) 0.0762
d (Hole Diameter Typical) 0.00635
The material chosen for the spring bracket was Aluminum 6061-T6 for its high strength to weight
ratio and machinability. The material properties used can be found in Table 37.

94
Table 37: Material Properties (AL 6061-T6)
Property Value
Modulus of Elasticity (E) 71.7 GPa
Tensile Yield Strength (Sy) 276 MPa
Ultimate Tensile Strength (Sut) 310 MPa
Figure 57: Simplified Geometry and Spring Bracket Free Body Diagram
This cross section was then split into two segments, the vertical component (Figure 58) and the
horizontal component (Figure 59). Each was analyzed separately and individually checked for failure.

95
Figure 58: Free Body Diagram of Spring Bracket from Points A to B
Figure 59: Free Body Diagram of Spring Bracket from Points B to C
First, reactions were calculated for segment BC based on the applied input force, the section was
treated as a rigidly supported cantilevered beam. A fretting stress concentration factor of 2 was applied at
point B to model the connection between AB and BC. Next, the input forces for section AB were applied
as the reactions from BC. Section AB was treated as a beam and stress concentration factors due to bolt
holes were calculated. Safety factors were calculated using the distortion-energy theory for ductile

96
materials, which is the ratio of material yield strength and the Von-Mises equivalent stress. The minimum
safety factor was found to occur at the point of attachment to the bicycle frame, and had a value of 1.18
assuming a spring 5 times stiffer than what is expected to be used. The part was also checked for bearing
stress at point A and had safety factor of 8.7. Based on these values, the part was deemed acceptable for
use. A full derivation of the safety factors can be found in Appendix J.
Seat Extender Analysis
The purpose of this analysis is to determine if the force caused by the weight of the rider and the
force caused by the rider pedaling will cause shearing in the bolts or plate or buckling in the plates. The
weight of the rider was set to the maximum weight allowed by the design specifications: 250 pounds. The
force caused by the pedaling was taken at the maximum value that occurs for the strong leg during the
pedaling cycle, and found in the analysis of the spring: 180N. This maximum value occurs when using the
spring with the highest spring constant. The axes used for the analysis are shown in Figure 60.

97
Figure 60: Axis of Orientation for Analysis of Seat Extender
Shearing in Bolts
The free body diagram of the plate is shown in Figure 61. The bolts are holding the seat extender
to the frame that is held stationary. The weight of the rider, Wp, occurs in the center of the x-z plane of
the extender. The force of the pedaling occurs on the pedal, which is at the same height as the hip.

98
Figure 61: Free Body Diagram of the Seat Extender Plate
Px1 = support from bolt one in the x-direction
Py1 = support from bolt one in the y-direction
Px2 = support from bolt two in the x-direction
Py2 = support from bolt two in the y-direction
Wp = weight of the rider
Fx = pedaling force
d1 = x distance between bolt one and bolt two
d2 = x distance between bolt one and the location of the weight of the rider
d3 = y distance between bolt one and the location of the pedaling force at maximum distance
MathCAD was used to solve for the forces acting on the bolts (Figure 62). Note that this is being
treated as a planar system, meaning there are only 3 independent static equations. In order to calculate Px1,
Px2, Py1, and Py2 the deflection in the bolts must be calculated. However, for ease of calculations, it is
assumed that the worst case scenario is present in which all of the force in the x direction is being
supported entirely by one bolt.

99
Figure 62: MathCAD to Solve for Forces Acting on the Bolts
The area over which the shear acts (Figure 63) is in the x-z plane.
Figure 63: Area Over Which the Shear Stress Acts

100
MathCAD was used to determine the shear stresses resulting from the forces acting on the bolts
over the appropriate cross-sectional area (Figure 64).
Figure 64: MathCAD to determine the Shear Stresses Acting on the Bolt
Buckling in the Plates
Safety factors due to buckling were determined using a model to find the eccentric buckling
force. A free body diagram of the simplified geometry for the eccentrically loaded column is shown in
Figure 65.

101
Figure 65: Simplified Free Body Diagram Showing Eccentric Buckling of the Seat Extender
F = the maximum force that can be placed on the extender before buckling occurs
hplate = the length over which the buckling force acts
e = Eccentricity of applied force to column neutral axis
MathCAD was used to find the maximum possible force that would occur before the plates on the
seat extender would buckle. A full derivation of the critical load can be found in Appendix H. The critical
buckling load was found to be 215lbf for each plate, making the safety factor 1.72.
A summary of the factors of safety can be found in (Table 38).

102
Table 38: Summary of Factors of Safety in Seat Extender
Type of Failure Factor of Safety
Shear in Bolts 89
Shear in Plates in x-directions 434
Shear in Plates in z-directions 140
Buckling in Plates 1.72
Based on the analysis, the seat extender will not fail under the weight of the user or force applied
due to pedaling.

103
Manufacturing
With the analysis completed and the parts ordered, the manufacturing process could take place.
The manufacturing began with the rear end of the MOBO Triton being assembled. The next step was to
fabricate the parts which modified the MOBO from its original design, most importantly the front fork,
seat extender, and the plate to hold the spring-sprocket. After the fabrication of these parts, the next step
was to assemble the entire tricycle, which included attaching the fabricated parts to the MOBO, and
adding the additional components, such as the brackets, gear sets, and brakes.
Machined Parts
The use of machined parts was avoided as much as possible in order to minimize the time spent
manufacturing. Machined parts must be analyzed for failure, which adds complexity and time to the
analysis. However, this design needed several parts which could not be ordered, and thus had to be
custom made. The need for a plate to hold the bracket, handlebar extenders, and a custom seat extender to
improve the ergonomics for the rider became apparent.
Spring Support Plate
An important part of the device is the plate which holds the bracket for the spring-sprocket
(Figure 66). Burt Seger, who runs his own small machine shop from his home in Jefferson, MA, assisted
greatly in the manufacturing of this part. This part began as a 3 x 5 x ½ inch block made from 1018 steel.
The process began with drilling the holes in the part to support the bracket shell and shoulder screws.
With these features in place, a fly cutter was used to create the step in the part. Finally, the outside profile
of the part was machined using an end mill.

104
Figure 66: Plate with Tie Rod Ends
Handlebar Extender
The handlebar extenders were machined with further assistance with Burt Seger. A 2-foot length
of 1 ¾ inch diameter 6061 aluminum was purchased. The stock was mounted into a lathe with 1 foot of
the stock protruding into the machining area. The first step was to machine the outside profile, which has
two different diameters (Figure 67). With the outer profile machined, the next step was to bore holes into
each end of the handle. First, the finished surface was cut away from the stock. Then, the handlebar
extender was mounted into a separate lathe and the center holes were drilled. The center hole inside the
wider profile was added in order to attach the extender to the handlebar, while the center hole in the
smaller profile served to reduce the weight of the part. This process was repeated identically for the other
handlebar extender. The rubber grips from the original handlebars were then reattached to the smaller
ends of the handlebar extender.

105
Figure 67: Outside Profile of Handlebar Extender
Welding
An important part of the manufacturing process was the use of welding. The use of welding made
it possible to manufacture parts of the tricycle which would have been difficult to machine. For example,
instead of machining the seat extender out of a block of material, it was made by welding two thin plates
and two c-channels together. This decision reduced both cost and time, since machining the part would
have resulted in a large amount of scrap material. In addition to the seat extender, the fabrication of the
front fork, support plate for the spring sprocket, and connecting screws was all completed with the use of
welding.
Front Fork
An important section of our design is the front fork, which is not only the front wheel of the
tricycle, but where our spring sprocket mechanism is connected. This part of the manufacturing was done
with the assistance of WPI alumnus Scott Guzman. Guzman provided us with access to an arc welder and
assisted us in the cutting and welding of the front fork. In order to weld the necessary parts of the front

106
fork, a fixture was made (Figure 68). The frame allowed the parts to stay in place as they were welded
together. The front fork’s fixture was constructed out of wood, measuring 48 inches long, 24 inches wide,
and 15 inches tall.
Figure 68: Frame with Welding Fixture
It was decided to use the seat and chain stay section of a BMX bike to act as part of the tricycle’s
front fork. An axle grinder was used to cut this section off from the rest of bicycle. To ensure proper
welding, the square and cylindrical tubing were cut with an axle grinder so that they could have direct
contact with BMX seat and pedal frame during the welding. With all parts cleaned and cut, the parts were
then aligned on the fixture. First, the tubing and BMX bike frame were welded together. The threaded
steel screws were then welded onto the chain stay of the BMX bike frame.
Seat Extender
To create this part, one channel piece was first welded on one end of a steel plate (Figure 69).
Next, the second channel piece was welded on the other side of the plate, opposite to the other channel
piece. Finally, the second plate was welded onto the opposite end of the channel pieces.

107
Figure 69: Welding of Plate to Channels
Additional Welding
The support plate and outer shell of the bottom bracket were welded together next. The outer
shell was inserted into the support plate to its correct position, then welded together using the arc welder.
In addition, screws for the spring attachment were welded to the front forks chain stay. The screws closest
to the pedal were later shortened with a Dremel tool so that they do not interfere with the pedal crank.
Once all of the parts had been fabricated and welded, some additional modifications had to be made to the
parts of the tricycle in order to allow for its functionality. These modifications were minor and easy to
perform, so they were performed by hand. The modifications consisted of creating holes in the front fork
assembly for adjustability, cutting the tie rods in order to attach the spring support plate, and painting the
welded tubes to prevent rust.
Originally, the front end of the MOBO Triton was connected to the rear end by screwing a bolt
through a hole in the rear end and any one of ten holes in the front tube. In order to preserve the
adjustability of the length of the tricycle, the same feature was created in the tube of the new front fork.
The holes were drilled into the tube by hand using a power drill. The holes were positioned such that the

108
longest setting would place the back of the seat 39 inches from the center of the crank, and the holes were
each 1.5 inches apart. This positioning is nearly identical to that of the original MOBO front fork.
In order to connect the spring sprocket support plate to the frame, a truss system made of threaded
tie rods was connected to the plate and the front fork using tie rod ends and screws welded to the frame.
The margin of error in the length of the rods was large enough to justify cutting the rods by hand. The tie
rods have 28 threads per inch, allowing for precise adjustability. In order to cut the tie rod ends to the
desired length, a small circular saw was used on a Dremel tool.
Upon completion of the welding process, all of bare metal parts were painted in order to prevent
rust and the loss of structural integrity.
Assembly
The first step of the assembly process was to assemble the rear end of the MOBO. Next, the seat
extender and seat were bolted to the rear end of the MOBO. Then, the tie rod, plate and bracket assembly
was attached to the front fork. Once these steps were completed, the next step was to attach the gear-set,
chain, and spring to the front fork. Finally, the handlebar extenders were attached to the existing
handlebars.
Assembling Rear End of the MOBO Triton
The MOBO was assembled according to the manufacturer’s instructions. The brake was detached
from the front wheel of the MOBO to allow the custom front fork to be attached to the rear end of the
MOBO, and the brake to be reattached to the wheel of the custom front fork.
Attaching Seat Extender and Seat to Rear End
The seat was originally attached to the rear end of the MOBO by bolts which went through holes
in the c-channel under the seat and holes in the tube of the rear end. The seat extender was designed to
mimic this attachment method. Holes were drilled into the c-channel portion of the seat extender.
Aligning the holes in the seat extender to those on the MOBO proved to be very difficult. Instead, holes

109
were drilled into the seat extender without regard to the position of the holes in the MOBO, and the holes
in the seat extender were used as guides to drill new holes in the MOBO frame. Thus, the proper
alignment of the bolts through both the seat extender and the tube on the rear end of the MOBO was
achieved (Figure 70).
Figure 70: Fully Installed Seat Extender
Tie Rod, Plate, and Bracket Shell Assembly
The tie rod ends were bolted to the front fork using the welded screws. The tie rod ends were then
attached on either end of the tie rods. The tie rod ends were then bolted into the plate using spacers and
shoulder screws. Unlike the analysis predicted, the tie rod assembly was not stable, and cross-supports
were eventually added to stabilize the tie rod assembly. Additionally, a problem arose when the chain
between the pedals and the wheel rubbed on the tie rods. In order to prevent this interference from
occurring, changing the geometry of the tie rod assembly was attempted. A longer shoulder screw and
wider spacer were used to bolt the middle tie rod ends to the plate. This adjustment resolved the
interference between the middle tie rod end and the chain by moving the tie rod further out from the
center of the tricycle. However, the longer shoulder screw interfered with the movement of the crank.
Since changing the geometry proved to be problematic, it was decided to move the chain from the
outermost sprocket of the crankset to the innermost sprocket, thus resolving the interference (Figure 71).

110
This solution was not ideal because it changed the kinematics of the drivetrain from those analyzed.
However, it was the fastest and easiest solution to implement.
Figure 71: Chain and Tie Rod Alignment
Attaching Sprockets and Chain
With the plate secured in place, the next step was to attach the sprockets to the assembly. In order
to attach the sprockets, a purchased bottom bracket was used. The bracket is designed to thread into the
end of the shell. However, this task proved to be difficult because the welding process warped the bracket
shell. A measurement using calipers revealed that the bracket was oval, so the bracket was clamped with a
wrench to account for the warping. The presence of this wrench made it much easier to insert the bracket
into the shell (Figure 72).
Figure 72: Bracket Installed into Plate Assembly

111
With the bracket securely installed, the next step was to attach the two sprockets. The sprockets
came as part of two cranksets, which include a base connected to the crank arm. Since the crank arms
were not needed, they were cut away from the base with a hacksaw. The other sprockets were unbolted
from the base, leaving only one sprocket per crankset. The sprocket on the left allowed the spring to be
attached, while the sprocket on the right allowed the driving crankset to be connected to the spring
mechanism. The right spring sprocket was attached to the sprocket on the driving crank which had the
same number of teeth (38) by using an ordinary bicycle chain. The installation of this chain allowed the
tricycle drive train to work properly, by allowing the rider to drive both the forward movement of the
tricycle and the rotation of the spring sprocket by simply pedaling.
Attaching the Spring
In order to attach the spring, an angled piece to attach to the screws welded to the frame was
created by cutting a square tube into an L-shaped bracket with a hacksaw. Holes were drilled into the
piece to allow connection to the frame and the eye bolt. The piece was then bolted to the bike frame, and
an eye bolt was inserted into the top hole in order to attach the spring.
The spring was then connected to the sprocket (Figure 73). A bolt was inserted through a hole in
the sprocket, and attached to the sprocket with a nut. The spring was then attached to the bolt by placing it
between two bolts and two washers (Figure 74).

112
Figure 73: Spring Connected to Frame and Sprocket
Figure 74. Spring Attached to Sprocket
Attaching the Handlebar Extenders
The handlebar extenders were mounted to the original handlebar ends using the hole in the
bottom of the handlebar extender. One of the extenders had a tighter fit, and was thus press-fit onto the
handlebar end. This fit was tight enough to prevent the handlebar extender from being pulled off or

113
rotated. The other extender was not snug on the handlebar end and was therefore fastened to the handlebar
end using a strong epoxy.
Attaching the Brakes
The original brake pads from the front end of the fork were used. A new cable was purchased and
measured along the bike to the proper length to allow for proper braking. The rubber jacket was then cut
to its proper length, to allow about 2 inches of the wire to be exposed from the jacket. The wire was then
inserted into the jacket, and bolted to the attachment point near the brake pads. The wire was then run
along the length of the fork toward the rear end of the bike, and slipped through a slot on the underside of
the rear end which prevents the cable from dragging along the ground when the length of the tricycle is
adjusted. The wire was then properly hooked to the inside of the brake lever, thus allowing the brake pads
to make full contact with the wheel when the brakes are engaged.

114
Testing
With manufacturing completed, the tricycle was ready to be tested. The tricycle was first
inspected to ensure it was safe for the rider. The tricycle then underwent both quantitative testing with
human subjects, and qualitative testing with force plates to ensure the tricycle is suitable for both
recreational and rehabilitative purposes.
Safety and Functionality Testing
The first step of testing the tricycle was to ensure that the tricycle met the Consumer Product
Safety Standards (Appendix A). Among the most notable standards are the needs to remove sharp edges,
securely tighten all fasteners, and eliminate any protrusions from the rider’s space. Upon completion of
the inspection process, the tricycle was deemed safe for use by the test subjects. In addition to ensuring
the tricycle met safety standards, the tricycle was tested by members of this project team to ensure that it
worked properly. A group member was able to ride the tricycle on a flat surface, steer, ride and apply the
brakes both up and down an inclined surface of up to 5°, and apply the brakes on level ground.
Qualitative Testing
An important part of the testing procedure was to determine whether uninitiated users could
easily operate the tricycle. The test subjects were asked to perform the following test procedures, which
were approved by WPI’s Institutional Review Board (IRB). First, the subjects were given a pre-test to
ensure that they were fit enough to ride the tricycle. The main part of the test was divided into two
portions. The first portion of the test was to ride the tricycle on the level ground of WPI’s quadrangle. The
purpose of this test was to give the riders a feel for the pedaling, steering, and braking of the tricycle, as
well as find a rough estimate of the ratio between pedaling forces from each subject. The second portion
of the test was to ensure that people could effectively ride the tricycle up and down a hill, apply the
brakes traveling downhill, and apply the brakes while traveling uphill at various inclines. This test was to

115
be performed with three different spring constants. The complete testing procedures, including the survey
the subjects completed, appear in (Appendix I).
Six subjects completed the first portion of the test on the quadrangle. Only two of the subjects
completed the hill portion of the test due to the time the entire test took (approximately 40 minutes). In
contrast, the flat portion of the test only took 10 minutes. The subjects were all able to ride the tricycle
completely through the test path. However, an ongoing issue with the spring-sprocket chain derailing
prevented the test subjects from judging the difference in pedaling forces. Even without the mechanism
working, the subjects were still able to ride our tricycle like a normal tricycle, and thus were able to judge
all other aspects of the tricycle. The subjects gave generally favorable ratings to the tricycle. A complete
overview of the results can be found in the Results and Analysis of Results sections of this report.
Quantitative Testing
In order to empirically test the amount of assistance delivered to the weak leg, sensors were used
on each pedal to measure actual applied forces. Force sensors consisting of 2 pressure plates and an array
of 3 load cells were attached to each pedal (Figure 75 and Figure 76). From each pedal, wires ran to the
data conditioning circuits and ultimately a computer to record data.
Figure 75: Force Sensor showing Load Cell Array

116
Figure 76: Force Sensor Applied Pressures
The applied foot force is represented as FR and is the result of pressure Pfoot taken at the centroid
of the foot plate. Throughout the test, FR was shown in real time to the test operator, as well as recorded
for future use.
Force Sensor Design
The actual load cells used were “half-bridge” strain gauge load cells (Figure 77). This means they
use two strain gauges in orthogonal directions to complete half of a Wheatstone bridge (Figure 78). When
a force is applied the strain gauges output a change in resistance, which can be converted into a change in
load.
Figure 77: Load Cell Used (Load Sensor – 50kg)

117
Figure 78: Load Cell Internal Wiring
In order to complete the Wheatstone bridge, two reference resistors of known resistance (330k
Ohms) were inserted into the circuit. The output of all 3 load cells were wired together in parallel before
running through an HX711 load cell amplifier board (Figure 79). This Analog to Digital Converter
(ADC) takes the very small change in voltage due to the strain gauges and amplifies it into a digital signal
that can be read by the Arduino UNO microcontroller. Finally, the digital signal is interpreted by the
Arduino software and output as force data that could be saved and plotted.
Figure 79: Load Sensor Wiring Diagram

118
The three wired load cells were then rigidly glued into place between the two aluminum plates.
Each completed force sensor was then secured to each pedal using cable ties. During the test, a data
recorder needed to follow the tricycle with a laptop to record forces. The detailed test procedure can be
found in Appendix J.

119
Results
Qualitative Results
Due to problems with the tricycle, testing with subjects had to be modified. Many of the questions
on the survey pertained to portions of the test related to the spring. Since the spring would not stay on
more than one or two revolutions of the pedal, it was removed for the subject testing. The modified
survey can be found in Appendix K. The test was completed on six riders with heights varying from 5 feet
to 5 feet 9 inches, and weights from 100-160 pounds. The height of women and men ages 50+ are 5.0 and
5.3 cm less than the height of men and women 20-29, respectively (Gharakhanlou et al., 2012).
Therefore, for the purpose of our tricycle, testing on shorter subjects corresponds to the height of riders
that would typically be riding it (elderly). The results from the qualitative subject were positive overall.
For the six test subjects, the average for all questions (excluding question 1) was 4.5/5. The answers to
each question, for each subject, can be seen in Table 39.
Table 39: Subject Testing Results for Each Question on Survey
Subject
Question 1 2 3 4 5 6
What is your experience level riding bicycles? 1 5 4 5 4 4
How easily could the tricycle be adjusted to fit your height? 1 3 5 5 5 5
How comfortable did you find the recumbent pedaling position? 4 4 4 5 5 5
How easy was it to adapt to the pedaling style? 4 5 5 5 5 5
How often did the components of the device intrude into your pedaling space? 3 5 5 5 5 5
How easily was the device to steer? 3 4 5 5 4 4
How easy was the steering technique to learn? 5 4 4 5 5 5
How intuitive was the braking system to operate? 5 5 5 5 5 2
When the brakes were applied, how well did the tricycle stop? 3 5 4 5 5 4
How well did your feet remain on the pedals? 5 5 5 5 5 5
How comfortable was the seat? 4 4 4 5 5 5
How stable did you feel on the tricycle? 4 4 5 5 5 5

120
When the subjects finished testing, they were also asked to comment on the questions. The
comments to each question can be found in Appendix L.
Quantitative Results
Force measurements were taken on each pedal simultaneously while an operator rode the tricycle
along a fixed course. These tests were carried out with three different spring constants: 5.5lbf/in
(963N/m), 11lbf/in (1926N/m), and 15lbf/in (2626N/m). Finally, force data were collected without the
spring mechanism active in order to gain a baseline “control” sample for comparison (Figure 80). The
same operator was used across all tests to maintain consistency with pedal forces so that they may be
compared.
Figure 80: Pedal Force Control, No Spring
In the event of any bias between the two pedal sensors, left and right pedals were compared
separately to their respective control tests. The data presented in Figure 81 and Figure 82 have been
smoothed using a 15 step moving average filter in order to reduce noise and isolate power cycle peaks.
Each figure depicts the isolated data pertaining to the average power stroke of each leg across all three
springs, compared to the average power stroke of the control associated with that leg.
0
5
10
15
20
25
30
35
40
45
50
0 0.1 0.2 0.3 0.4 0.5
Ped
al F
orc
e (l
bf)
Time (sec)
Pedal Force, No Spring
Strong Leg Weak Leg

121
Figure 81: Strong Leg Pedal Forces with three different springs
Figure 82: Weak Leg Pedal Forces with three different springs
0
10
20
30
40
50
60
0 0.05 0.1 0.15 0.2 0.25 0.3 0.35 0.4 0.45 0.5
Ped
al F
orc
e (l
bf)
Time (sec)
Strong Leg Pedal Forces, Power Stroke
Control 15 lbf/in 11 lbf/in 5.5 lbf/in
0
10
20
30
40
50
60
0 0.05 0.1 0.15 0.2 0.25 0.3 0.35 0.4 0.45 0.5
Ped
al F
orc
e (l
bf)
Time (sec)
Weak Leg Pedal Forces, Power Stroke
Control 15 lbf/in 11 lbf/in 5.5 lbf/in

122
There were a number of challenges that arose during force testing, which decreased the overall
quality of the data. For instance, the Arduino Uno board could only be programed to sample every 10ms;
however, the board often got overloaded and slowed down sporadically. Additionally, the precision of the
signal amplification circuits, load cells, and Arduino computer were not sufficient to produce repeatable
results and thus the data may have a large error band. All things considered, the data presented still shows
a clear spike in force during the power stroke of the cycle. Initial observations of the data indicate a lack
of assistance or resistance in the two lighter springs.

123
Analysis of Results
Analysis of Qualitative Results
Since the spring was not attached for the test, the subject testing primarily tested the remaining
components of the tricycle. The average values for the survey questions can be seen in Table 40.
Table 40: Average Survey Scores from 6 Test Subjects
Question (on a scale from 1-5, with 5 being best) 5 Meaning Average
Value
1 What is your experience level riding bicycles? Very
Experienced
4
2 How easily could the tricycle be adjusted to fit your height? Easily 4
3 How comfortable did you find the recumbent pedaling position? Very
Comfortable
4.5
4 How easy was it to adapt to the pedaling style? Very Easy 4.8
5 How often did the components of the device intrude into your
pedaling space?
Never 4.7
6 How easily was the device to steer? Easy 4.2
7 How easy was the steering technique to learn? Easy 4.7
8 How intuitive was the braking system to operate? Very Easy 4.7
9 When the brakes were applied, how well did the tricycle stop? Very Well 4.3
10 How well did your feet remain on the pedals? Very Well 5
11 How comfortable was the seat? Very
Comfortable
4.5
12 How stable did you feel on the tricycle? Very Stable 4.7
The remaining tricycle components that were analyzed before selection included wheel layout,
tires, seat, pedals, steering mechanism, and brakes. Questions 3 and 11 indicate that the selection of 3
wheels, with one in the front allowed the users to feel comfortable and stable riding on a wheel
configuration that they do not typically use. Question 3 also indicates that selecting multi-use tires created
stability without making it too difficult to propel the tricycle. Questions 2 and 10 indicate that the

124
selection of a recumbent seat was comfortable for the rider. Question 9 indicates that the selection of
pedals without clips did not create an issue for the riders. Questions 5 and 6 indicate that the steering was
intuitive and easy to use. Questions 7 and 8 show that the braking system was simple to learn and made
the rider feel safe in stopping when desired.
The comments indicate that the steering, seat, and braking could be slightly improved. The chain
derailment is also clearly a major issue that must be addressed in future designs of the tricycle. The
turning radius was very wide due to the steering design using the two back wheels. The steering design
could be modified to make operating the tricycle safer and easier. The seat was slightly wobbly, so
improvements could be made to the seat extender. Finally, based on the comments, the brakes posed the
biggest issue for riders. Adjusting the tricycle caused the brakes to become loose, an issue that must be
addressed in future iterations of the tricycle. Additionally, the brakes must be tightened so that they
cannot rotate when the rider attempts to apply them.
The results show that the adjustability, comfort, pedaling style, steering, braking, and recumbent
design were all well received. The subject testing indicates that the selections for the remaining design
components led to a successful tricycle design. Together with the force testing, the tests of the tricycle are
an indication of its overall success. With recommendations for the spring mechanism, combined with the
remaining components of the tricycle design tested in the subject testing, the tricycle would well serve its
purpose as a rehabilitative tricycle.
Analysis of Quantitative Results
A control test was conducted to provide a baseline without the spring in order to compare spring
data. As shown in Figure 83, there is clearly a peak in each data set, indicating this was the power stroke
extreme point. All data analyzed will compare these peaks in force during the power stroke. However,
within the power stroke, there is also an observable “valley,” followed by a secondary peak.

125
Figure 83: Peaks and Valleys of Pedal Forces
These drops in pedal forces during the power stroke have been partially attributed to a change in
angle of the pedal with respect to the leg force vector. The force measurement sensors are designed to
only measure forces normal to the pedal and would therefore read lower as the pedal crank reaches the
3π/4 position (Figure 84); however, the change in angle between F and the pedal surface between π/2 and
3π/4 is small enough to only cause slight effects to the force readings. The secondary peaks shown in
Figure 84 may also be affected by the actual biomechanics of the pedaling cycle. Once the crank reaches
the most extreme point away from the body (represented as π in Figure 84), the knee “locks” as the leg
reaches full extension. This “locking” may temporarily cause the leg to push harder on the pedal just
before it enters the recovery phase of the cycle, represented as a secondary peak in the data.

126
Figure 84: Recumbent Pedaling Cycle
The force phasing chart shown in Figure 84 is a modified version of the upright phasing chart
shown in Figure 85. For ease of analysis, the recumbent relative pedaling cycle has been taken as the
upright pedaling cycle rotated 90 degrees. Force vector F represents the applied force by the rider’s leg,
which is broken into its constituent components, Fx and Fy. Finally, Fr represents the resultant force vector
that acts normal to the crank radius. As is assumed in the upright pedaling cycle, these relative forces
reflect a rider using toe clips, which would allow for slight pulling forces during the recovery phase.

127
Figure 85: Upright Relative Pedal Force (Allen, Blasius & Puttre, Pp. 73)
Spring Tests Analysis
Tests were conducted using a variety of spring constants, with the middle stiffness (11lbf/in)
being the spring that was calculated in the preliminary analysis. Table 41 shows the percent deviation
from peak force in the control test for each of the three springs.
Table 41: Pedal Force Deviation from Control, All Spring Constants
Spring Constant Strong Leg Peak
Force
Weak Leg Peak
Force
15lbf/in 27.06% -49.04%
11lbf/in -3.52% 4.18%
5.5lbf/in 2.27% -15.70%
The data shows only slight differences in pedal force on the strong leg for the 5.5lbf/in and
11lbf/in springs, and a difference up to about 16% for the weak leg. Intuitively, the 5.5lbf/in spring should
not provide more assistance to the weak leg than the 11lbf/in spring. This indicates that there is large error

128
in the data. Additionally, the data shows 49% assistance to the weak leg with the 15lbf/in spring;
however, due to large error, this number is skewed and the actual assistance is probably much lower. A
lack of robust data makes it impossible to draw conclusions about the exact assistance provided by the
spring on the manufactured tricycle, although the deviation with the 15lbf/in spring is large enough to
strongly suggest some significant assistance.
Our preliminary calculations showed that the 11lbf/in spring should provide 30% assistance in an
ideal system. Testing showed this was not the case even if error is factored in. This is because our
preliminary calculations estimated a tricycle weight that was much lower than what was manufactured.
Pedal force calculations were performed again to reflect the properties of the actual manufactured
tricycle; Figure 86 shows the updated pedal force graph. These new calculations predict that the 11lbf/in
spring should only actually provide 12.6% assistance to the weak leg in the current tricycle configuration.
With such a large error in test data it cannot be concluded that the 11lbf/in spring provided assistance near
the calculated value.

129
Figure 86: Pedal Force Calculations Updated for Manufactured Tricycle
Additionally, any assistance provided by the weaker springs was effectively eliminated by the
user trying to keep the secondary chain from falling off. As the spring reaches its maximum extension, it
has a tendency to pull the pedals around quickly. This act of pulling quickly often derailed the chain and
forced the data collection to be cut short. In order to compensate, the user had to provide resistance with
their opposite leg, thus applying more force back onto the pedal.

130
Conclusion
Strokes affect 800,000 people annually in the United States and are a common cause of disability
(CDC, 2015). Strokes often result in hemiparesis, or weakness in one side of the body. This condition
prevents a person from pedaling a normal tricycle, which may limit their potential to engage in beneficial
recreational activities, as few devices exist for this purpose. The goal of this project was to design a
rehabilitative adult tricycle to serve as a recreational and therapeutic device for stroke patients. In order to
assist the weak leg, the tricycle was designed to have separate force inputs for each pedal.
Pedaling assistance was achieved through a passive spring mechanism that stores energy from the
strong leg, and uses it to assist the weak leg. The extension spring in the assistance mechanism was
phased with the pedal crank such that it extends on the power stroke of the strong leg, and contracts on
the power stroke of the weak leg. The assistance device was designed to allow pedaling with an even
cadence between each leg, making it easier for a rider to adapt to the pedaling style.
The pedaling assistance mechanism was mounted on a specially designed tricycle frame. For
stability and ease of steering, the tricycle was designed with two wheels in the rear and one in the front.
Through use of a commercially available tricycle for the rear end, the design and manufacturing of the
steering and braking mechanisms was simplified. Modifications to the commercially available tricycle
included raising the seat to the height of a standard wheelchair and extending the handlebars by an equal
amount. Finally, the front end of the tricycle, which included the assistance mechanism, was constructed
using a bicycle frame welded to tubing for attachment to the rear end of the tricycle.
Testing the tricycle indicated that all of the selected components received generally favorable
ratings from the test subjects; however, derailment of the spring assistance chain prevented qualitative
data about the tricycle being obtained from the subjects. In order to validate the assistance calculations,
quantitative data were acquired using pedal force plates. These data showed that with stiffer springs, some
assistance to the weak leg could be achieved.

131
Based on the subject and force testing, the spring mechanism support structure should be
modified to improve the alignment between the sprockets and provide tension to the chain. Once these
modifications are implemented, the mechanism should function as designed and allow the spring
assistance mechanism to assist the weak leg during the pedaling cycle. Overall, testing proved that the
tricycle was a good proof of concept, which could be optimized to serve as an effective adult
rehabilitative tricycle in the future.

132
Recommendations
After the conclusion of the testing process, the following recommendations were made. Future
iterations of the design should implement these recommendations in order to improve the operation of the
tricycle.
Recommendation 1: Support the spring-sprocket mechanism with a solid part and have a tensioner
in order to prevent derailment of the chain.
During testing, the chain on the spring-sprocket mechanism often derailed. This derailment made
it difficult to test the tricycle, since none of the test subjects were able to complete a large portion of the
test with the chain attached to the sprockets. Even the members of this project group, who were much
more experienced riding the tricycle, had difficulty keeping the chain attached during portions of the force
testing procedure.
This derailment was likely due to a combination of two factors: the misalignment of the two
sprockets, and the lack of a method to adjust the tension of the chain. During the testing, it was apparent
that the chain was at a slight angle to one of the sprockets, which would eventually lead to one of the links
failing to engage with the teeth. This issue was often more pronounced with the stiffer springs, as they
would bend the support structure and further misalign the sprockets. Occasionally, the chain would stay
on for longer periods of time, however, this did not occur with any consistency. In order to correct the
misalignment, we recommend making the support structure as one solid machined part instead of as
separate tie rods. The support structure with the tie rods was extremely difficult to adjust and was never
completely stable. A machined part would provide proper stability and alignment to the sprockets.
The lack of a tensioning system for the chain also exacerbated the derailing issue. Even during
the tests where the chain stayed on for a sustained period of time, there was usually slack in the chain. A
tensioner would have corrected this issue. However, the shape of the front fork and the support structure

133
cannot support a standard chain tensioner, and thus a custom tensioner would have to be created to correct
the tensioning problem.
Recommendation 2: Attach the braking system to the rear end instead of the front end, which will
make it easier to adjust the length of the tricycle.
The front fork of the tricycle was made using the rear end of an existing bicycle, and thus already
had brakes fully installed. These brakes were used in the interest of time and ease of manufacturing.
However, the brake handle had to be attached to the handlebar on the rear end of the tricycle. Therefore,
every time the fork had to be repositioned to allow for a user of different height, the brake cable had to be
either lengthened or shortened, which was time-consuming. If the brake pads had instead been installed
on the rear wheels, the cable could have been tensioned independently of the position of the fork with
respect to the rear end of the tricycle. The lack of adjustability may not be a serious problem if the tricycle
were to be used for one patient. However, it should still be preserved because a therapist could purchase
the tricycle for use with multiple patients.
Recommendation 3: Redesign the spring attachment to allow for multiple attachment points and
easier attachment and adjustment of the spring.
The spring is attached to the front fork by connecting the loop at the end of the spring to an eye-
bolt. In order to attach to the spring-sprocket mechanism, the spring is attached to a bolt by placing it
between 2 nuts and 2 washers (Figure 74). Even though it successfully holds the spring, this arrangement
has 2 ways it could potentially be improved. Due to the need to remove the nuts to remove the spring, this
system is time-consuming to adjust. If a loop—such as another eye-bolt—could be connected to the
spring sprocket mechanism, then the spring could be connected by simply hooking it on. This
arrangement would save time, but would likely require great care to ensure that the spring does not wrap
around the eye bolt while the sprocket rotates. One possible way to prevent this wrapping from occurring

134
is to use an attachment bolt with a loop, which pivots with respect to the bolt. The current setup was used
primarily because it prevents the spring from wrapping around the bolt.
Another way this mechanism could be improved is by creating a way to allow the spring to be
pre-loaded. By stretching the spring while the attachment point is at the bottom position of the cycle, the
amount of assistance from the spring could be changed while using the same spring coefficient. This
arrangement would be useful because it would negate the need for multiple springs to change the amount
of assistance to the weak leg. The current mechanism lacks such a feature because the sprocket used to
attach the spring has a very small amount of material in its cross-sectional area, and thus contains a
limited number of attachment points for the bolt (Figure 87). A future iteration of the design should
contain an attachment mechanism which could change the distance of the bolt from the center of rotation,
allowing the spring to be pre-loaded to various amounts.
Figure 87: Attachment of spring to sprocket, detailing limited number of attachment points
Recommendation 4: Redesign the seat extender with a more rigid mounting position.
The seat extender was made using two steel plates and two steel C-channels. Due to the structure
and shapes of the steel parts and how it was designed, the seat extender was not completely rigid when

135
attached to the tricycle’s frame and seat. Due to the thickness of the steel parts, it was difficult to drill the
holes into them. The inner walls of the C-channels were tapered, which made it difficult to keep the drill
bit aligned. In result, some of the holes in the seat extender were misaligned with the tricycle frame’s
holes. When fastening the seat extender with bolts, the C-channels’ tapered sides also made it difficult to
fit additional spacers between the seat and seat extender. Empty spaces were then left between the
fixtures, allowing small movement of the seat extender. A recommendation would be using a CNC
machine when building the seat extender to remove the inner sloped sides of the C-channels. For drilling
the holes, a drill press would ease the ability to drill through steel and reduce the risk of the holes being
misaligned.
Recommendation 5: Move the steering mechanism to the front wheel to allow better control of the
steering mechanism and create a smaller turning radius.
The MOBO Triton-Pro Tricycle has its steering mechanism attached to the back wheels. It uses
two handlebars, one on each side of the tricycle, and a parallel linkage system to turn the wheels.
However, due to its design, the MOBO Triton Pro would not allow turning radii under 6 feet. This
arrangement makes it difficult to make turns in small spaces.
When the seat was raised using the seat extender, the turning handles were extended so that the
user could reach them. However, by increasing the length of the handle, the range of motion when turning
increased as well. This increase caused steering to be more sensitive than in the original MOBO Triton
tricycle. A small change in handlebars’ position would cause significant rotation to the wheels. When the
tricycle was operated during the subject testing, it was difficult to keep the wheels straight, especially at
high speeds.
One recommendation would be to extend the rear wheel axle, allowing the wheels more space to
turn and not collide into the seat and turning handles. Another recommendation is to use a single rotating
handlebar instead of two separate handlebars. Using the same linkage system in the rear, the user can turn
the tricycle with more control since both hands will be gripping only one handlebar.

136
Recommendation 6: Use a more precise data acquisition system to record the pedal forces:
When recording the pedaling forces, the Arduino Uno board would record the forces at 50ms
intervals. However this rate would slow down the longer the tests were. A microcontroller board that can
record samples faster than the Arduino without delay should be used so this phenomenon does not occur.
A National Instrument DAQ box is one alternative to replace the Arduino Uno board (Figure 88). A
LabVIEW program executed with a DAQ box can both accurately record the data and automatically
export it into a data sheet for analysis.
Figure 88: National Instruments X-Series DAQ Box (National Instruments, 2016)
Different hardware can also be used to improve the quality of the test. One of the HX711 analog-
to-digital converters (ADC) had malfunctioned during testing, which made it necessary to purchase
another. In addition, the 50kg load cells used for testing required multiple calibrations before conducting
a test. In some cases, the load cells would not accurately model the pedaling cycle. The 5.5 lbf/in and 11
lbf/in springs did not show much difference between the stronger and weaker legs, and the results for all
the springs showed a margin of error, based on the peak forces between the two legs. More sensitive load
cells should be used for testing to eliminate or reduce the margin of error. The specific load cells

137
purchased for the test were favored since they were inexpensive, but they often made it difficult to
measure accurate data.

138
Works Cited
ADA (2010, September 15). 2010 ADA Standards for Accessible Design. Retrieved September 24, 2015,
from http://www.ada.gov/regs2010/2010ADAStandards/2010ADAstandards.htm
Allen, C., Blasius, A., & Puttre, K. (2014) Passive Assistive Pedaling Device. Worcester Polytechnic
Institute. Retrieved April 21, 2016. Web. < https://www.wpi.edu/Pubs/E-project/Available/E-project-
043014-152036/unrestricted/Passive_Assistive_Pedaling_Device_MQP_Report.pdf> Retrieved
September 18, 2015, from http://www.wpi.edu/Pubs/E-project/Available/E-project-043014-152036/
Alterg. (2015). Anti-Gravity Treadmill. Retrieved 2015, from alterg.com
Amazon. (2015). Pedal Toe Clips. Retrieved 2015, from amazon.com
Art of Triathlon. (2015). Clipless Pedals. Retrieved 2015, from artoftriathlon.com
Aqua Creek Products (2015) Underwater Walker Instructions. Aqua Creek Products
http://www.activenable.com/assets/images/instructions/acc401-underwater-walker-instructions.pdf
ASME. (2015). Limb Load Monitor. Retrieved 2015, from medicaldevices.asme.org
Bicycle Man. (2015). Recumbent Tricycle. Retrieved 2015, from bicycleman.com
Bike Forums. (2015). Adult Tricycle. Retrieved 2015, from bikeforums.net
Bike-Riding-Guide. (2015). Bicycle Brakes. Retrieved 2015, from bike-riding-guide.com
Body Measurements. (2012, November 2). Retrieved September 23, 2015, from
http://www.cdc.gov/nchs/fastats/body-measurements.htm
CDC. (2015). Stroke Fact Sheet. Retrieved March 29, 2016, from
http://www.cdc.gov/dhdsp/data_statistics/fact_sheets/fs_stroke.htm
Chester Cycling. (2015). Coaster Brake. Retrieved 2015, from chestercycling.wordpress.com
Consumer Product Safety Commission. (2015). Bicycle Requirements Business Guidance. Retrieved
2015, from http://www.cpsc.gov/en/Business--Manufacturing/Business-Education/Business-
Guidance/Bicycle-Requirements/
Cornell University. Beam Deflection Formulae. (2015) Retrieved April 21, 2016, from
http://ruina.mae.cornell.edu/Courses/ME4735-2012/Rand4770Vibrations/BeamFormulas.pdf
Coxworth, B. (2011, August 16). Flywheel Bicycle: KERS for pedal-pushers. Retrieved September 3,
2015, from http://www.gizmag.com/flywheel-bicycle-regenerative-braking/19532/
National Stroke Association (2015). Depression. Retrieved September 14, 2015, from
http://www.stroke.org/we-can-help/survivors/stroke-recovery/post-stroke-conditions/emotional/depression

139
Energy Storage Association. (2015). Flywheels. Retrieved 2015, from http://energystorage.org/energy-
storage/technologies/flywheels
Exercise and Depression - Harvard Health. (2009, June 9). Retrieved September 14, 2015, from
http://www.health.harvard.edu/mind-and-mood/exercise-and-depression-report-excerpt
Exercise for Stress and Anxiety | Anxiety and Depression Association of America, ADAA. (n.d.). Retrieved
September 14, 2015, from http://www.adaa.org/living-with-anxiety/managing-anxiety/exercise-stress-and-
anxiety
Figure 1: http://www.bankspower.com/techarticles/show/9-understanding-torque-converters
Fonda, B., & Sarabon, N. (2010). Biomechanics of Cycling. Sport Science Review, 19(1-2), 187-210.
Retrieved September 10, 2015, from http://au4sb9ax7m.search.serialssolutions.com/?ctx_ver=Z39.88-
2004&ctx_enc=info:ofi/enc:UTF-
8&rfr_id=info:sid/summon.serialssolutions.com&rft_val_fmt=info:ofi/fmt:kev:mtx:journal&rft.genre=art
icle&rft.atitle=Biomechanics of Cycling&rft.jtitle=Sport
Gharakhanlou, R. (2012). Anthropometric measures as predictors of cardiovascular disease risk factors in
the urban population of Iran. Arquivos Brasileiros De Cardiologia, 98.
Google Maps. (2016). Map. Retrieved 2016, from maps.google.com
Gordon, N. F. "Physical Activity and Exercise Recommendations for Stroke Survivors: An American
Heart Association Scientific Statement From the Council on Clinical Cardiology, Subcommittee on
Exercise, Cardiac Rehabilitation, and Prevention; the Council on Cardiovascula." Stroke (2004): 1230-
240. Web. 20 Sept. 2015. http://stroke.ahajournals.org/content/35/5/1230.full
H Therapy. (2015). Isokinetic Exercise Machine. Retrieved from htherapy.co.ca
Harris, W. (2015). How CVTs Work. Retrieved September 3, 2015, from
http://auto.howstuffworks.com/cvt.htm
Hell Bent Cycles. (2015). OSS Joystick Style Tiller Steering. Retrieved 2015, from hellbentcycles.com
Hostelshoppe. (2015). HP Velotechnik. Retrieved 2015, from hostelshoppe.com
"How Differentials Work." HowStuffWorks. Web. 20 Sept. 2015.
How a Torque Converer Works. (2015). Retrieved September 18, 2015.
Huston, J., & Johnson, D. (1982). Three Wheel Vehicle Dynamics (SAE Technical Paper 820139). SAE
International.
Kite, Bike, Surf, Rambling. (2015). Bicycle Brake. Retrieved 2015, from
kitesurfbikerambling.wordpress.com
Koesterer, TK. (2015). Center of Gravity and Stability KINESIOLOGY. Retrieved 2015, from
http://users.etown.edu/w/wunderjt/syllabi/Chapter%2014%20REVISED%20FOR%20FYS.pdf
Load Sensor - 50kg. (2015). Retrieved April 21, 2016, from https://www.sparkfun.com/products/10245

140
Lopes, Alexandre, Sandra Alouche, Nils Hakansson, and Moisés Cohen. "ELECTROMYOGRAPHY
DURING PEDALING ON UPRIGHT AND RECUMBENT ERGOMETER." International Journal of
Sports Physical Therapy. Sports Physical Therapy Section. Web. 20 Sept. 2015.
Old Glory Mountain Bike. (2015). Mountain Tire. Retrieved 2015, from oldglorymtb.com
Maxxis. (2015). Multi-Use Tire. Retrieved 2015, from maxxis.com
Mobo Triton Pro Ultimate Ergonomic Cruiser. (2015). Retrieved April 21, 2016, from
http://www.kohls.com/product/prd-1286210/mobo-triton-pro-ultimate-ergonomic-cruiser.jsp
Morgancycle. (2015). Seat Back Rest. Retrieved 2015, from morgancycle.com
Mozaffarian D, Benjamin EJ, Go AS, et al. Heart disease and stroke statistics—2015 update: a report
from the American Heart Association. Circulation. 2015 ;e29-322.
Nice, K. (2000, August 2). How Differentials Work. Retrieved September 3, 2015, from
http://auto.howstuffworks.com/differential.htm
Pande, Reena. (2012). Yoga your way to stroke recovery. Retrieved 2015, from
http://www.reenapande.com/2012/07/29/yoga-your-way-to-stroke-recovery/
Pearlman, A. (n.d.). 2.972 How A Differential Works. Retrieved September 3, 2015, from
http://web.mit.edu/2.972/www/reports/differential/differential.html
Performance Bicycle. (2015). Road Tire. Retrieved 2015, from performancebicycle.com
Pratte, David. (2014). Continuously Variable Transmissions – Rubber Band Gearboxes Be Gone!
Retrieved 2015, from http://www.superstreetonline.com/how-to/transmission-drivetrain/1404-
continuously-variable-transmissions/
Pruitt, A. (2014, February 13). The Biomechanics Of The Pedal Stroke. Retrieved September 18, 2015, from
http://triathlete-europe.competitor.com/2014/02/13/the-biomechanics-of-the-pedal-stroke
Public Health Agency of Canada. (2011). Tracking Heart Disease and Stroke in Canada. Retrieved from
http://www.phac-aspc.gc.ca/publicat/2009/cvd-avc/index-eng.php
Quadracycle. (2015). Quadracycle 4 Wheel Adult Pedal Bicycle. Retrieved 2015, from
quadracyclellc.com
Rehabmart. (2015). Adult Tricycles. Retrieved 2015, from rehabmart.com
Reisman, D., McLean, H., Keller, J., Danks, K., & Bastian, A. (2013, June 28). Result Filters. Retrieved
October 2, 2015.
Rideouttech. (2015). Storm Quest Tactical Bike Saddle. Retrieved 2015, from rideouttech.com

141
Standard Weight Folding Wheelchairs. (2015). Retrieved September 24, 2015, from http://www.phc-
online.com/Standard_Wheelchairs_s/31.htm
Singletrack. (2015). Drum Brakes. Retrieved 2015, from singletrack.com
Target. (2015). Schwinn Adult Meridian 26 Inch Three Wheel Bike. Retrieved 2015, from target.com
The Mountain Bike Encyclopedia. (2015). Platform Pedal. Retrieved 2015, from
themountainbikeencyclopedia.com
Triwg. (2015). Tilt Table. Retrieved 2015, from triwg.com
Tyrx. (2015). Recumbent Tricycle. Retrieved 2015, from tyrx.com
Wikstrom, Matt. (2014). Beyond the big ring: understanding gear ratios and why they matter. Retrieved
2015, from http://cyclingtips.com/2014/08/beyond-the-big-ring-understanding-gear-ratios-and-why-they-
matter/
Woodway. (2015). Split Belt Treadmill. Retrieved 2015, from woodway.com
Wozniak-Timmer, C. (1991). Cycling Biomechanics: A Literature Review. Retrieved September 18,
2015, from http://www.jospt.org/doi/pdfplus/10.2519/jospt.1991.14.3.106

142
Appendix A: Tricycle Safety Standards For the purpose of the project, the team used existing bicycle safety standards from the United States
Consumer Product Safety Commission (CPSC, 2002).
What is the purpose of the requirements for bicycles?
This regulation increases the safety of bicycles by establishing, among other things, requirements
for assembly, braking, protrusions, structural integrity and reflectors. Bicycles that fail any of the
requirements are banned under the Federal Hazardous Substances Act.
Where can I find the requirements for bicycles?
The requirements are in the Code of Federal Regulations (CFR) in Title 16, Part 1512.
What is a bicycle?
A bicycle is defined in §1512.2 as either (1) a two-wheeled vehicle having a rear drive wheel solely
human-powered; or (2) a two- or three-wheeled vehicle with fully operable pedals and an electric motor
of less than 750 watts (1 h.p.), whose maximum speed on a paved level surface, when powered solely by
such a motor while ridden by an operator who weighs 170 pounds, is less than 20 mph.
The bicycle requirements cover two different types of bicycles. Those with a seat that is more than 25
inches above the ground when the seat is adjusted to its highest position must meet all of the
requirements. Sidewalk bicycles – those with a seat height of 25 inches or less – are exempt from some
of the requirements or have other alternative requirements. These exemptions and alternatives are marked
in bold type in this summary. Please consult §1512.2 of the requirements for more information on how to
measure seat height.
Are any bicycles exempt from the requirements?
Yes. Track bicycles designed and intended for use in competition that have tubular tires, a single crank–
towheel ratio, and no freewheeling feature are exempt. So are one-of-a-kind bicycles made to the order of
an individual without assembling stock or production parts.
How are bicycles tested in general?
Assembled bicycles must meet the requirements of the regulation in the condition in which they are
offered for sale. Unassembled or partially assembled bicycles must meet the requirements after assembly
according to the manufacturer’s instructions.

143
Figure 89: Illustration of a Bicycle and its Part
Are there any general requirements that bicycles must meet?
Yes.
(1) Adults of normal intelligence and ability must be able to assemble a bicycle that requires
assembly.
(2) A bicycle may not have unfinished sheared metal edges or other sharp parts that may cut a
rider’s hands or legs. Sheared metal edges must be rolled or finished to remove burrs or
feathering.
(3) When the bicycle is tested for braking (§1512.18(d) and/or (e)) or
road performance (§1512.18(p) or (q)), neither the frame, nor any steering part, wheel, pedal,
crank, or braking system part may show a visible break.
(4) Screws, bolts, and nuts used to fasten parts may not loosen, break, or fail during testing.
(5) Control cables must be routed so that they do not fray from contact with fixed parts of a
bicycle or with the ends of the cable sheaths. The ends of control cables must be capped or
treated so that they do not unravel.
(6) A bicycle may not have any protrusions within the shaded area of Diagram 1. However,
control cables up to ¼ inch thick and cable clamps made of material not thicker than 3/16 inch
may be attached to the top tube.

144
Figure 90: Diagram Demostrating Area on a Bicycle where there can be no Protrusions
What are the requirements for brakes?
Bicycles must have front and rear brakes, or rear brakes only. Sidewalk bikes may not have hand brakes
only. Sidewalk bikes with a seat height of 22 inches or more when adjusted in the lowest position must
have a foot brake. A sidewalk bike with a seat height of less than 22inches need not have any brake as
long as it does not have a freewheeling feature, has a permanent label saying “No brakes”, and has the
same statement on its advertising and shipping cartons. Please refer to §§ 1512.5(e) and 1512.18(f) of the
regulation for more detail on sidewalk bicycle brake performance and labeling.
(1) Hand brakes:
(a) When tested, hand brakes may not break, fail, or have clamps that move or parts that
go out of alignment. To test the brakes, push the hand lever all the way down to the handlebar or
with a force of 100 pounds (lbf) and then load test the bicycle, or rock it back and forth with a
150-pound weight on the seat. §1512.18(d)(2) contains the procedures for loading and rocking
testing.
(b) Hand levers have to be on the handlebars and readily usable. The distance between middle of
a hand lever and the handlebar may be no wider than 3 ½ inches (3 inches for levers on sidewalk
bicycles). Unless a customer specifies otherwise, the hand lever that operates the rear brake must
be on the right handlebar. The lever that operates the front brake must be on the left
handlebar. A lever that operates both brakes may be on either handlebar. Please note that, if a
bicycle has hand lever extensions, all tests are conducted with the extensions in place.

145
(c) A bicycle that only has hand brakes must stop within 15 feet when tested with a 150-
pound rider riding at 15 miles per hour. See §1512.18(d) for more detail on this test.
(d) When the hand lever is pushed down with 10 pounds or less applied 1 inch from the end of the
lever, the brake pads must contact the braking surface on the wheel. Caliper brake pads must be
replaceable and adjustable. Pads must stay in their holders without movement when a 150-pound
rider rocks the bicycle forward and backward. See §1512.18(d)(2) for this test.
(e) Brake assemblies must be securely fastened to the bicycle frame with locking devices such
as lock washers or locknuts, and must not loosen during the rocking
test, §1512.18(d)(2). Brake pad holders must be securely attached to the caliper assemblies.
(2) Foot brakes:
(a) Foot brakes must operate independently of any drive-gear positions or
adjustments. Foot brakes must have a braking force of at least 40 lbf when 70 pounds of force is
applied to the pedal. See§1512.18(e)(2) for the test procedure.
(b) Bicycles with foot brakes must stop within 15 feet when tested with a rider of at least
150 pounds at a speed of 10-mph. See §1512.5(c). A bicycle operated in its highest gear ratio
at 60 pedal crank revolutions per minute that reaches a speed of more than 15 mph must stop in
15 feet when tested at a speed of 15 mph if it has a foot brake only. See §1512.18(e)(3) for the
stopping test procedure.
(c) A foot brake must operate by applying force in the direction opposite to the force that
drives the bicycle forward, unless the brakes are separate from the pedals and apply the
braking force in the same direction as the drive force.
(d) When you hold a torque of 10 ft-lb at each point on the crank at which a rider can apply the
brakes, that point cannot be more than 60 degrees away from the point on the crank at which the
rider can start to pedal forward.
(e) See §1512.18(e)(2) and (f) for tests for foot brakes on sidewalk bicycles.
(3) Foot brake/ hand brake combinations: Bicycles with foot brake/ hand brake combinations must meet
all the requirements for foot brakes listed above. If such a bicycle operated in its highest gear ratio at 60
pedal crank revolutions per minute reaches a speed of more than 15 mph, the bicycle must stop in 15 feet
when tested at a speed of 15 mph using both types of brakes
What are the requirements for steering systems?
(1) The handlebar stem must withstand a force of 450 lbf (225 lbf for sidewalk bicycles) in a forward
direction 45 degrees from the stem centerline when tested according to §1512.18(g). The handlebar stem
must have a permanent mark or circle showing the minimum depth that the stem must be inserted into the
bicycle fork. That mark must be located a distance of at least 2 ½ times the diameter of the stem from the
bottom of the stem, and must not affect the strength or integrity of the stem.
(2) Handlebars should be symmetrical on either side of the stem. The handlebar ends should be no more
than 16 inches above the seat when the seat is in its lowest position and the handlebars are in their highest
position.
(3) The ends of the handlebars must be capped or covered. Grips, plugs, and other devices mounted on
the ends must not come off when a force of 15 lbf is applied. See §1512.18(c) for this test.

146
(4) When the handlebar/stem assembly is twisted with a torque of 35 ft-lb (15 ft-lb for
sidewalk bicycles), it must not move or show any signs of damage. When the handlebars are twisted
with the stem being held firmly, the handlebars must support a force of 100 lbf or absorb no less than 200
inch pounds of energy while bending no more than 3 inches. During this test, the handlebars must be
tight enough so that they do not turn in the handlebar clamp. After the test, they cannot show any visible
sign of breaking. See §1512.18(h) for these tests.
What requirements must pedals meet?
(1) Pedals must have treads on both sides. However, pedals that have a definite side for the rider to use
only have to have a tread on that side. Pedals intended to be used only with toe clips do not have to have
treads as long as the toe clips are firmly attached to the pedals. However, if the clips are optional, the
pedal must have treads.
(2) Bicycle pedals must have reflectors. See §1512.16(e) for this requirement. Sidewalk bicycle pedals
do not have to have reflectors.
What are the requirements for chains and chain guards?
(1) A chain must operate over the sprocket without binding or catching, and must have a tensile strength
of 1800 lbf (1400 lbf for sidewalk bicycles).
(2) Bicycles with a single front and a single rear sprocket must have a chain guard over the top of the
chain and least 90% of the part of the front sprocket that the chain contacts. It must also extend back to
within at least 3.2 inches of the center of the bicycle’s rear axle. The top of the guard from the front
sprocket back to the rear wheel rim must be at least twice as wide as the chain. Past that point, the top of
the guard may taper down until it is ½ inch of the chain width. The guard must prevent a 3 inch long, ⅜
inch diameter rod from catching between the upper junction of the sprocket and the chain when a tester
tries to insert the rod at any direction up to a 45 degree angle from the side of the bicycle that the chain is
on.
(3) Derailleurs must be guarded to prevent the chain from interfering with or stopping the wheel through
improper adjustment or damage.
Are there requirements for tires?
Yes. The manufacturer’s recommended inflation pressure must be molded onto the sidewalls
of inflatable tires in letters at least ⅛ inch high. The tire must stay on the rim when it is inflated to 110%
of the recommended pressure, even when it is tested under a side load of 450 lbf. See §1512.18(j) for
this test. Tires that do not inflate, tubular sew-up tires, and molded wired-on tires do not have to meet any
of these requirements.
What requirements are there for wheels?
A wheel must have all of its spokes and be at least 1/16 inch away from each side of the fork and from
any other part of the frame as the wheel turns. When the wheel is tested with a side load of 450 lbf, the
tire and spokes must stay on the rim. See §1512.18(j) for this test. Sidewalk bikes do not have to meet
the side load requirements.
What requirements must wheel hubs meet?
All bicycles (other than sidewalk bicycles) must meet the following requirements:

147
(1) Each wheel must have a positive locking device that fastens it to the frame. Use the manufacturer’s
recommended torque to tighten threaded locking devices. The locking devices on front wheels (except for
quick-release devices) must not loosen or come off when a tester tries to take them off using a torque of
12.5 ft-lb applied in the direction of removal. Once fastened to the frame, the axle of the rear wheel must
not move when it receives a force of 400 lbf for 30 seconds applied in the direction that removes the
wheel.
(2) Quick-release devices with a lever must be adjustable to allow the lever to be set for tightness. Riders
must be able to clearly see the levers and determine whether the levers are locked or unlocked. When it is
locked, the clamping action of the quick release device must bite into the metal of frame or fork.
(3) Front wheel hubs that do not use a quick release device must have a positive retention feature
that keeps the wheel on when the locking devices are loosened. To test this, release or unscrew
the locking device, and apply a force of 25 lbf to the hub in the same direction as the slots in the
fork. See §1512.18(j)(3) for this test.
Are there strength requirements for the fork and frame?
Yes. Clamp the front fork in the test fixture so it does not move and apply force until the fork bends 2
½ inches. The fork shall have no evidence of fracture. The deflection at a force of 350-in-lbs shall be
no greater than 2½ inches. Also, when the fork is mounted on the bicycle frame, the fork and
frame assembly must withstand a steady force of 200 lbf or an impact force of 350 in-lbs, whichever is
more severe, without breaking, or bending in a manner that would significantly limit the steering angle
over which the front wheel can turn. Please see§1512.18(k)(1) and (2) for the tests for forks and
fork/frame assemblies respectively. These requirements do not apply to sidewalk bicycles.
What are the requirements for seats?
(1) The seat post must have a permanent mark or circle showing the minimum depth that the post must be
inserted into the bicycle frame. That mark must be located a distance of at least two times the diameter of
the seat post from the bottom of the post, and must not affect the strength of the post.
(2) No part of the seat, seat supports, or accessories attached to the seat may be more than 5 inches above
the surface of the seat.
(3) The clamps used to adjust the seat must be able to fasten the seat to the seat post in any position to
which the seat can be adjusted and prevent the seat from moving during normal use. Following testing
(§1512.18(p) or (q)), neither the seat nor seat post may move when subjected to a downward force of 150
lbf (75 lbf for sidewalk bicycles) or a horizontal force of 50 lbf (25 lbf for sidewalk
bicycles). See §1512.18(l) for these tests.
Are there requirements for reflectors?
Yes. To make sure that motorists can see bicycle riders at night, bicycles (other than sidewalk bicycles)
must have a combination of reflectors. Because of the complexity of these requirements, we have not
attempted to include all of the tests and detail in this summary. You should carefully read the provisions
of §1512.16 for more specific information.
Generally, bicycles must have a colorless front reflector, recessed colorless or amber reflectors on
the back and front sides of the pedals, and a red reflector on the rear. They must also have a reflector
mounted on the spokes of each wheel, or reflective front and rear wheel rims or tire
sidewalls. See §1512.18(n) for tests that measure the reflectance value of reflectors.

148
The front and rear reflectors must be mounted so that they do not hit the ground when the bicycle falls
over. The requirements of the regulation also include specific angles for mounting the
reflectors. See §1512.18(m) for tests that apply to front and rear reflectors.
The side reflector on a front wheel must be colorless or amber, and the rear wheel side reflector must
be colorless or red. Reflective material on the sidewall or rim of a tire must go around the entire
circumference, must not peel, scrape, or rub off, and must meet certain reflectance
tests. See §1512.18(o) for these reflectance tests and§1512.18(r) for the abrasion test for reflective rims.
What other requirements must bicycles meet?
(1) A rider weighing at least 150 pounds must ride a bicycle at least 4 miles with the tires inflated
to maximum recommended pressure. The rider must travel five times at a speed of at least 15 miles per
hour over a 100 foot cleated course.
See §1512.18(p) for this test. During these tests, the bicycle must handle, turn and steer in a
stable manner without difficulty, the frame and fork, brakes, and tires must not fail, and the
seat, handlebars, controls, and reflectors must not become loose or misaligned. These requirements do not
apply to sidewalk bicycles.
(2) A sidewalk bicycle loaded with a weight of 30 lb. on the seat and 10 lb. on each handlebar grip must
be dropped (while maintaining an upright position) one foot onto a paved surface three times in the
upright position. Without the weights, the bicycle must be dropped three times on each side in any other
orientation. During these tests, the wheels, frame, seat, handlebars, and fork must not
break. See §1512.18(q) for this test.
(3) A bicycle must be able to tilt 25 degrees to either side with the pedals in their lowest position without
the pedal or any other part of the bicycle (other than tires) hitting the ground.
(4) Bicycles without toe clips must have pedals that are at least 3 ½ inches from the front tire or fender
when the front tire is turned in any direction. See figure 6 of §1512 for more detail about this
requirement.
What requirements are there for instructions and labeling for bicycles?
(1) Every bicycle must have an instruction manual attached to its frame or included in the
bicycle packaging. The manual must include operation and safety instructions, assembly instructions
for complete and proper assembly, and maintenance instructions. See §1512.19 for more detail.
(2) If a bicycle is sold less than fully assembled or adjusted, any advertising material and the outside of
the shipping carton must include a list of tools necessary to assemble and adjust the bicycle and a drawing
showing the minimum length of the leg of a rider for whom the bicycle is appropriate. That length must
allow at least one inch between the top tube and the crotch of the rider when the rider’s feet are on the
ground.
(3) Every bicycle must have a permanent marking or label that shows the name of the manufacturer
or private labeler and that the manufacturer or private labeler can use to identify the month and year the
bicycle was manufactured. If the bicycle is privately labeled, the label must have information that the
private labeler can use to identify the manufacturer of the bicycle.
Where can I find additional information?
For more information on the requirements for bicycles, contact the U.S. Consumer Product Safety
Commission:

149
Office of Compliance (for specific enforcement inquires): e-mail: [email protected]; telephone: (301)
504-7520.
Small Business Ombudsman (for general assistance understanding and complying with CPSC
regulations): e-mail: Please use our Contact Form, which is the best way to get a fast response; telephone:
(888) 531-9070.

150
Appendix B: Remaining Component Pictures
Figure 91: Three Wheel, Single in Rear (Bicycleman, 2015)
Figure 92: Three Wheel, Single in Front (Target, 2015)

151
Figure 93: Four Wheels (Quadracycle, 2015)
Figure 94: Road Tire (Performance Bicycle, 2015)

152
Figure 95: Multi-Use Bike Tire (maxxis.com)
Figure 96: Mountain Tire (Old Glory MTB, 2015)

153
Figure 97: Upright Seat, No Back (Rideouttech, 2015)
Figure 98: Upright Seat with Added Back (Morgancycle, 2015)

154
Figure 99: Once Piece Molded Seat with Back (Hostel Shoppe, 2015)
Figure 100: Handle Bars (Kite, Bike, Surf, Rambling, 2015)

155
Figure 101: Tiller (Hell Bent Cycles, 2015)

156
Figure 102: Platform Pedal (The Mountain Bike Encyclopedia, 2015)
Figure 103: Pedal Toe Clips (Amazon, 2015)

157
Figure 104: Clipless Bike Pedals (Art of Triathlon, 2015)
Figure 105: Upright Design (Bike Forums, 2015)

158
Figure 106: Recumbent Design (Rehabmart, 2015)
Figure 107: Rim Brake (Bike-Riding-Guide, 2015)

159
Figure 108: Drum Brakes (Chester Cycling, 2015) (chestercycling.wordpress.com)
Figure 109: Drum Brakes (Singletracks, 2015)

160
Appendix C: Tipping Analysis
Stability of a tricycle can vary depending on number the wheels it has, where each one is
positioned on the device, and where the center of gravity is located. For a four-wheeled vehicle, as in
Figure 110, the wheel configuration is usually symmetrical from front to back and side to side,
allowing the vehicle to have similar stability characteristics and equal weight distribution all around. For a
tricycle, however, this is not the case.
Figure 110: Drivetrain of a four-wheeled vehicle
A tricycle’s stability depends on various conditions, such as the layout of the wheels and the
location of the center of gravity (CG). There are two types of tricycles, distinguished based on the
placement of the tricycle’s wheels: delta and tadpole. A delta tricycle has one wheel in the front and two
wheels in the rear. A tadpole tricycle, one the other hand, has two wheels in the front and one in the back.
For the center of gravity (CG), the location of it is important to measure due to unequal weight
distribution within the tricycle. This issue is caused by the layout of its wheels (mainly the critical points
of contact of the wheels and the ground).
A bicycle model, as shown in the Figure 111, is modified for the layout of a delta and tadpole
tricycle. For this project, the analysis focuses on a delta tricycle. Due to the placement of the wheels, the
layout is in the shape of a triangle. Each corner represents the critical point of contact between the wheel

161
and ground. The edges of the triangle represent an axis of tipping, with one them seen as a red dotted line
in Figure 111, and the yellow and black circle is the CG.
Figure 111: Bicycle Model of a Delta (left) and a Tadpole (right) Tricycle
Position and Weight of the Center of Gravity
The height of the center of gravity (CG) from the ground is an essential measurement in regards
to the CG’s position. The height can affect how easily the tricycle can tip (or roll) over when making a
turning or riding on a sloped surface. This correlation is due to the height, combined with the CG (which
acts as a mass traveling perpendicular to the height at a certain acceleration), producing a moment about
the axis of tipping. If the height is high enough, the moment could be large enough flip the tricycle.
The position of the center of gravity (CG) of the tricycle is altered when someone is riding it.
This change in position is varied, depending on the size, weight, and pose the rider is in while riding the
tricycle. For most people, the average height of the CG for a male is 57% of their standing height, while
for a female it 55%. Since the CG’s height affects stability, the standing height of 57% will be used.
Based on this percentage, the center of gravity is assumed to be located about the hips. For a person who
is 6.25 feet, or 191 cm (the maximum height allowed to ride the device), the height of the center of
X
Y
X
Y

162
gravity is around 3.56 feet, or 109 cm. However, the user will be sitting on the tricycle, placing the human
body’s CG not far of the tricycle’s CG (Center of Gravity and Stability KINESIOLOGY, 2014).
The CG is altered by weight, so the rider will add an additional load to the tricycle. The
maximum weight a tricycle can support is 250 lbs, or 113 kg. By adding a rider’s weight of 250 lbs (113
kg), with the tricycle’s weight of 44 lbs, (~ 20 kg), the new CG is now 294 lbs (133 kg). It is assumed that
when the masses of the rider and tricycle are combined, height of the new CG is increased by a foot, or
30.5 cm, from the tricycle’s CG. The CG’s position of the tricycle is based off the dimensions of a
MOBO triton tricycle.
Stability from the Front and Rear
For this design, the tricycle is stable when both the front and rear wheels bear a load of more than
zero Newton (or pounds force) during acceleration or braking. If the wheels ever bear no load during
those phases, the wheel(s) on the front or rear axle will lose contact with the ground. If a large enough
acceleration or deceleration is produced, the tricycle could flip over on its front or back. To ensure
stability of the tricycle, the minimum acceleration (amin) when speeding up and braking is needed. These
values depend on the center of gravity’s height (h) from the ground and distance from each wheel axle
(x1, x2). Figure 112 provides a free body diagram of the tricycle. The arrow on the bottom of the figure is
the direction the tricycle is moving at a certain velocity (v). Ff and Fr are the reaction forces on the front
and rear wheels from ground, respectively. The acceleration of gravity is represent as g, and measured as
9.81 m/s2 (or 32.2 ft/s2); m is the combined mass of the tricycle and rider.

163
Figure 112: Free Body Diagram of the Tricycle (Side View)
When accelerating, the minimum acceleration until the front wheel(s) bear no load is based on the center
of gravity’s height from the ground (h), and distance from the rear wheel(s) (x1). This can be expressed
as:
∑ 𝑀𝑟 = 0 = (𝑚𝑔 ∗ 𝑥1) − (𝑚𝑎 ∗ ℎ)
(𝑔 ∗ 𝑥1) = (𝑎 ∗ ℎ)
|𝑎min| = 𝑔 ∗𝑥1
ℎ
Using the values of h and x1, (which are 74.2 cm and 32.3 cm, based off the dimensions of a MOBO
triton-pro tricycle) the minimum acceleration is:
|𝑎min| = 981𝑐𝑚
𝑠2∗
32.3 𝑐𝑚
74.2 𝑐𝑚= 4.27
𝑚
𝑠2
For the minimum deceleration during braking, the same equation is used, only this time the distance from
the front wheel(s) to the center of gravity is used (x2):
|𝑎min| = 𝑔 ∗𝑥2
ℎ= 981
𝑐𝑚
𝑠2∗
𝑥2
74.2 𝑐𝑚

164
For this equation, x2 depends on the wheelbase length, or the length from rear wheel axle to the front
wheel axle (L). For the tricycle design, L is adjustable within a certain range (117 cm to 133 cm),
allowing the tricycle to be used by people with various heights and leg lengths. Unlike x1, x2 changes due
to the change in length L. Figure 113 shows a graph of minimum deceleration during braking based on
the wheelbase length.
Figure 113: Minimum Deceleration during Braking based on Wheelbase Length
For L = 133 cm, amin = 13.4 m/s2, whereas for L = 117 cm, amin = 11.2 m/s2. By determining the
acceleration values during accelerating and braking, the smallest ones out of the two situations will be
considered. In this case, 4.27 m/s2 is the minimum value when accelerating, and 11.2 m/s2 is the minimum
acceleration for braking (Huffman, 2010).
Uphill and Downhill Stability
The stability of the device while traveling up and down hills is an extremely important criterion to
analyze. When traveling up an incline, the contact area of the device, perpendicular to the CG’s direction
of force, decreases, thus making it more likely that the center of gravity will fall outside of the contact
area. Figure 114 shows how contact area changes over incline of the ground. The red dot with the orange

165
outline represents the center of gravity. The green contact area, made by the layout of the wheels, is
presented perpendicular to the direction of CG’s force vector (the blue arrow).
Figure 114: Change of contact area of tricycle by change of surface's incline.
Once the center of gravity falls outside the contact area, the device will tip over, thus making it unsafe for
the rider. Therefore, the stability of our device on hills was carefully analyzed.
Figure 115: Diagram for Tipping Analysis
The side view of the device is shown in Figure 115. The horizontal distance between the front
axle and the center of gravity is x1, while the horizontal distance between the back axle and the center of

166
gravity is x2. The total distance between the two axles is L, The parameter h indicates the vertical distance
between the center of gravity and the ground. x1 and h form a right triangle with an angle of θ1. They are
related by:
tan 𝜃1 =ℎ
𝑥1
For the design, h = 38.9 cm, and x1 = 19.3 cm, therefore:
𝜃1 = tan−1ℎ
𝑥1= tan−1 (
74.2 𝑐𝑚
32.3 𝑐𝑚) = 66.5°
The angle opposite of θ is denoted as ϕ. The sum of these two angles is 90°.
𝜃 + ϕ = 90°
With the equation, ϕ1 can be solved:
66.5° + ϕ1 = 90° → ϕ1 = 23.5°
For finding ϕ2, the length x2 depends on the wheelbase length L:
ϕ2(𝐿) = 90 − (tan−1ℎ
𝑥2) = 90 − tan−1 (
74.2 𝑐𝑚
𝐿 − 32.3 𝑐𝑚)
Figure 116 shows a graph of ϕ2 based on the wheelbase length.
Figure 116: Angle ϕ2 based on Wheelbase Length

167
If the device travels on a hill, and the center of gravity sweeps through an angle greater than ϕ,
the device will begin to tip. Therefore, the device will tip when ridden on an incline above ϕ. The device
will become less stable as h increases, since an increase in h will increase θ and decrease ϕ1 and ϕ2. In
addition, as L decreases, ϕ2 will also decrease, thus making the device less stable going down hills.
However, ϕ1 is 23.5° when h is 74.2 cm. In order to ensure the stability of the tricycle while traveling
uphill and downhill, the tricycle should neither go up an incline that causes ϕ1 to be smaller than 24°, nor
go down an incline that causes ϕ2 to be smaller than 54° (the angle achieved at the maximum value of L ,
133 cm)
If the incline of the hill only tips the device front to back, then the stability will be the same for a
square or a triangular wheelbase, assuming they have the same values of h, L, x1, and x2. However, if the
device is also tipped side to side, or does not travel straight up the hill, then the triangular wheelbase will
be less stable than the square wheelbase. The reason for this difference in stability is explained by the
side-to-side tipping analysis in this chapter.
Stability when Turning on Leveled Ground
To ensure stability of the tricycle on its sides, a clockwise moment about the axis of tipping, for
this case the red dotted line in Figure 117, must be less than zero. Figure 117 provides a free body
diagram of a delta tricycle turning, with the red line being the axis of tipping. At the center of gravity, a
lateral force, depicted as “W*a/g” in Figure 117, is formed, facing the center of the turning curvature,
along its radius (Huston & Johnson, 1982).

168
Figure 117: Free Body Diagram of a Delta Tricycle (Huston & Johnson, 1982)
From Figure 117, the variables are:
L = length from rear to front axle (wheelbase length) = min: 117 cm /max: 133 cm
l1 = length from the center of gravity to the front axle (dependent on L)
l2 = length from the center of gravity to the rear axle = 32.3 cm
b = width of the two-wheel axle = 70.6 cm
g = acceleration of gravity = 9.81 m/s2 = 981 cm/s2
h = height of the center of gravity from the ground = 74.1 cm
m = mass of the rider and tricycle = 133 kg
θ = angle formed by the tipping axis and reference axis (dependent on L)

169
a = lateral acceleration
W = weight of the rider and tricycle
The wheelbase length L and l1 have a maximum and minimum value since they can be changed based on
how much the front piece’s length of the tricycle is adjusted. A moment equation, about the tipping axis,
can be evaluated from the models’ top view. It is assumed that counter clockwise rotation is positive.
∑ 𝑀𝑇𝑇 = [𝑚𝑔 ∗ 𝑙1 ∗ sin(𝜃)] − [𝑊
𝑔𝑎 ∗ ℎ ∗ cos(𝜃)] = 0
The equation can then be simplified as:
𝑎
𝑔=
𝑙1
ℎ∗ tan(𝜃)
The angle θ can also be found using the wheelbase length and half of the two-wheel axle length.
tan(𝜃) =𝑏
2𝐿
By substitution, the tipping condition equation is expressed as:
𝑎
𝑔=
𝑙1𝑏
2ℎ𝐿
During a turn, lateral acceleration can be expressed as:
𝑎 =𝑣2
𝑅
With v being the velocity the tricycle is traveling, and R being the turning radius. By substituting lateral
acceleration with the tipping condition equation, the rollover velocity, or the velocity (as a function of the
turn radius) at which tipping occurs, can be obtained (Huston & Johnson, 1982):
𝑣(𝑅) = √𝑔𝑅𝑏𝑙1
2ℎ𝐿
𝑣(𝑅) = √981 ∗ 𝑅 ∗ 66 ∗ 𝑙1
2 ∗ 43.7 ∗ 𝐿
Figure 118 shows the curve of the maximum rollover velocity, based on the relationship between the
turning radius and velocity at which the tricycle is moving. In dealing with L, both the maximum (vlong)

170
and minimum (vshort) wheelbase length adjustments are used. If the tricycle turned about a small radius,
but with a speed above the rollover velocity curve, the tricycle is at risk of rolling over (Huston &
Johnson, 1982). With this case, the smallest roll-over velocity curve will be taken into account, which is
when the wheelbase length is (117 cm).
Figure 118: Plot of Rollover Velocity when Turning
Stability from the Side when on an Incline
Since the tricycle will be used in recreational environments, it will be common that this device
will be ridden on hills. Depending on the angle of the inclined hill, the location of the center of gravity,
and the tricycle’s dimensions, instability of the tricycle could occur if the user rides the tricycle across a
hill too steep. In Figure 119, a free body diagram of a delta tricycle (positioned in the most adverse
orientation with respect to the slope) can be used to find the maximum angle of incline until instability.
This free body diagram is the same as Figure 117, however, the lateral force due to turning is not
included. Instead, the angle of the slope ϕ is used. It is also assumed that ϕ is independent from the
velocity, therefore making the velocity negligible. This is considered since the tricycle is moving in a
straight path and inclined on its side. (Huston & Johnson, 1982).

171
Figure 119: Free Body Diagram of a Delta Tricycle on an Incline (Huston & Johnson, 1982)
It is important to note that since the wheelbase length L can be adjusted, the angle θ is considered
as a function of L.
𝜃(𝐿) = tan−1 (𝑏
2𝐿)
A moment equation, about the tipping axis, can be evaluated from the model’s top and rear view. It is
assumed that counter clockwise rotation is positive.
∑ 𝑀𝑇𝑇 = − [mg ∗ ℎ ∗ sin(𝜙)] + [𝑚𝑔 ∗ (𝑙1 ∗ sin(𝜃)) ∗ cos(𝜙)] = 0
It is important to note that the direction of force vector from the CG is not aligned with the reference
frame of the inclined surface. Multiplying these forces by cosine and/or sine of θ will allow the alignment
of these forces to the frame. The equation can then be substituted so that the maximum incline slope ϕ can
be found:
∑ 𝑀𝑇𝑇 = − [ℎ ∗ sin(𝜙)] + [(𝑙1 ∗ sin(𝜃)) ∗ cos(𝜙)] = 0
[ℎ ∗ sin(𝜙)] = [(𝑙1 ∗ sin(𝜃)) ∗ cos(𝜙)]
sin(𝜙)
cos(𝜙)∗ ℎ = 𝑙1 ∗ sin(𝜃)
Based on trigonometry, sine divided by cosine equals to tangent:

172
tan(𝜙) =𝑙1 ∗ sin( )
ℎ
𝜙 = tan−1 (𝑙1 ∗ sin(𝜃)
ℎ)
By considering the wheelbase and fixed values:
𝜙(𝐿) = tan−1 (𝑙1 ∗ sin(𝜃(𝐿))
ℎ)
Figure 120 shows the maximum incline angle that the tricycle can ride across and not tip over.
This is based on the relationship between the wheelbase length and angle of the incline.
Figure 120: Maximum Incline Angle until Rollover, based on Wheelbase Length
When the wheelbase length is adjusted to 133 cm, the allowable angle of incline to ride across is 18.1°,
whereas adjusted to 117 cm, it is 17.3°. For stability purposes, the tricycle should not go across a hill with
an angle greater than 17°.
Stability when Turning on an Inclined Slope
Taking into account both the analysis from turning on a flat surface and going across a slope
while inclined on its side, the maximum speed for any slope angle below the maximum slope to avoid
tipping can be determined. Figure 121 shows a Free Body Diagram of the tricycle, taking into account the

173
lateral force when turning and the angle of the incline that the tricycle is turning about. From Figure 121,
the variables are:
L = length from rear to front axle (wheelbase length) = min: 117 cm /max: 133 cm
l1 = length from the center of gravity to the front axle (dependent on L)
l2 = length from the center of gravity to the rear axle = 32.3 cm
b = width of the two-wheel axle = 70.6 cm
g = acceleration of gravity = 9.81 m/s2 = 981 cm/s2
h = height of the center of gravity from the ground = 74.2 cm
θ = angle formed by the tipping axis and reference axis (dependent on L)
a = lateral acceleration
W = weight of the entire tricycle plus the maximum load it can carry (located at the CG)
Figure 121, the lateral force on the tricycle (which comes from Newton’s second law) is shown as
“W*a/g” In order to include lateral force within the tipping moment equation (the moment about the TT
Line in Figure 121), the angle θ must be included.
Figure 121: Free Body Diagram of Tricycle Turning on an Inclined Surface (Huston & Johnson, 1982)
A moment equation, about the tipping axis, can be evaluated from the model’s top and rear view.
It is assumed that counter clockwise rotation is positive and that ϕ = 17° (since ϕ is considered
independent to the change in velocity).

174
∑ 𝑀𝑇𝑇 = − [𝑚𝑔ℎ ∗ 𝑠𝑖𝑛(17°)] + [𝑚𝑔(𝑙1 ∗ 𝑠𝑖𝑛(𝜃))𝑐𝑜𝑠(17°)] − [𝑚𝑎ℎ ∗ 𝑐𝑜𝑠(𝜃)] = 0
−[𝑔 ∗ ℎ ∗ 𝑠𝑖𝑛(17°)] + [𝑔(𝑙1 ∗ (𝑠𝑖𝑛(𝜃))𝑐𝑜𝑠(17°)] − [𝑎 ∗ ℎ ∗ 𝑐𝑜𝑠(𝜃)] = 0
−[𝑔 ∗ ℎ ∗ 𝑠𝑖𝑛(17°)] + [𝑔(𝑙1 ∗ 𝑠𝑖𝑛(𝜃))𝑐𝑜𝑠(17°)] = [𝑎 ∗ ℎ ∗ 𝑐𝑜𝑠(𝜃)]
− (𝑔 𝑠𝑖𝑛(17°)
𝑐𝑜𝑠(𝜃)) + (
𝑔(𝑙1 ∗ 𝑡𝑎𝑛(𝜃))𝑐𝑜𝑠(17°)
ℎ) = 𝑎
The equation for lateral acceleration “a” is:
𝑎 =𝑣2
𝑅
Plugging in the lateral acceleration will determine the maximum velocity that tipping will occur. The
velocity will depend on the wheelbase length (L) and the turning radius (R).
𝑣2
𝑅= −(
𝑔 𝑠𝑖𝑛(17°)
𝑐𝑜𝑠(𝜃)) + (
𝑔(𝑙1 ∗ 𝑡𝑎𝑛(𝜃))𝑐𝑜𝜃(17°)
ℎ)
𝑣(𝑅, 𝐿) = √𝑅 ∗ [−(𝑔 𝑠𝑖𝑛(17°)
𝑐𝑜𝑠(𝜃)) + (
𝑔(𝑙1 ∗ 𝑡𝑎𝑛(𝜃))𝑐𝑜𝑠(17°)
ℎ) ]
𝑣(𝑅, 𝐿) = √𝑅 ∗ 𝑔 ∗ [−(𝑠𝑖𝑛(17°)
𝑐𝑜𝑠(𝜃)) + (
(𝑙1 ∗ 𝑡𝑎𝑛(𝜃))𝑐𝑜𝑠(17°)
ℎ) ]
For L, the maximum (133 cm) and minimum (117 cm) wheelbase lengths will be used. Figure 121 shows
the rollover velocity curve, using both maximum and minimum wheelbase length adjustments. These
curves are based on the turning radius made with the tricycle.

175
Appendix D: Additional Design Considerations for Selection of Best Concepts
Table 42: Eric’s Mechanism Pairwise Comparison Chart
Table 43: Jaime’s Mechanism Pairwise Comparison Chart
Table 44: Nick’s Mechanism Pairwise Comparison Chart

176
Table 45: Henry’s Mechanism Pairwise Comparison Chart
Table 46: Eric’s Power Mechanism Decision Matrix
Table 47: Jaime’s Power Mechanism Decision Matrix

177
Table 48: Nick’s Power Mechanism Decision Matrix
Table 49: Henry’s Mechanism Decision Matrix
Table 50: Eric’s Tricycle Component Pairwise Comparison Chart

178
Table 51: Jaime’s Component Pairwise Comparison Chart
Table 52: Nick’s Component Pairwise Comparison Chart
Table 53: Henry’s Component Pairwise Comparison Chart

179
Table 54: Nick’s Tricycle Component Decision Matrix
Table 55: Henry’s Tricycle Component Decision Matrix

180
Table 56: Jaime’s Tricycle Component Decision Matrix
Table 57:Eric’s Component Decision Matrix

181
Appendix E: Propulsive Force Calculations
In order to analyze the designs, the forces required by the user to propel the device forward must be
calculated. With these forces, and an assumed gear ratio, the required input torque can be found for which
the user must overcome. From this required input torque, the designs can be individually analyzed to
determine the assistive potential of the device. The discussion of this analysis is on Page 60.

182
Appendix F: Additional Design Considerations for Selection of Final Design
Table 58: Henry’s Decision Matrix for Final Mechanism Design
Criteria
Mechanisms Safety Cost Ergonomics
Ease of
Control
Manufactur-
ability
Conform to
User
Requirements
Power
Adjustability
Weighting
Factors 18 5 11 10 5 16 35
Total
Piston 5 3 4 3 3 3 4 382
Push Pedal 5 2 4 3 2 3 4 372
Spring
Resistance 5 4 4 3 4 3 4
392
Table 59: Nick’s Decision Matrix for Final Mechanism Design
Criteria
Mechanisms Safety Cost Ergonomics
Ease of
Control
Manufactur-
ability
Conform to
User
Requirements
Power
Adjustability
Weighting
Factors 18 5 11 10 5 16 35
Total
Piston 5 2 4 4 3 3 4 387
Push Pedal 5 3 4 3 4 3 4 387
Spring
Resistance 5 4 4 3 4 3 4
392

183
Table 60: Jaime’s Decision Matrix for Final Mechanism Design
Table 61: Eric’s Decision Matrix for Final Mechanism Design
Criteria
Mechanisms Safety Cost Ergonomics
Ease of
Control
Manufactur-
ability
Conform to
User
Requirements
Power
Adjustability
Weighting
Factors 18 5 11 10 5 16 35
Total
Piston 5 3 4 3 3 3 4 382
Push Pedal 5 2 5 3 3 3 4 388
Spring
Resistance 5 4 5 3 4 3 4
403
Criteria
Mechanisms Safety Cost Ergonomics
Ease of
Control
Manufactur-
ability
Conform to
User
Requirements
Power
Adjustability
Weighting
Factors 18 5 11 10 5 16 35
Total
Piston 5 3 4 5 3 4 4 418
Push Pedal 5 2 4 4 3 4 4 403
Spring
Resistance 5 4 5 5 4 4 4
439

184
Appendix G: Spring Bracket Analysis
The purpose of this analysis is to determine its safety factor against failing when a spring load of 1000N
is applied. The purpose of this analysis is discussed in detail on Page 92.

185

186

187

188

189
Appendix H: Seat Extender Buckling Analysis Calculations

190

191

192
Appendix I: Qualitative Testing Procedures
Locations:
1. WPI’s Quadrangle (In Red, Figure 122). The test will occur on the paved path along the outside
of the quadrangle. This section of the quadrangle is level, and is not open to vehicular traffic.
Figure 122: Test Path Along the Quadrangle (Google, 2016)
Testing Procedure: The test subjects will be asked to complete the following tasks:
1. Pass a pre-test which will ensure the subject is fit to take part in the study. The pre-test will
consist of the successfully accomplishing the following tasks:
i. Stand on one foot for 5 seconds (to demonstrate balance).
ii. Bend the hip so the thigh is horizontal and the calf is vertical while standing
(with each leg, to demonstrate range of motion).
iii. Walk heel-to-toe for 10 steps (to demonstrate coordination).
iv. Walk normally for 10 steps (to demonstrate strength)
v. Apply the brake on the tricycle while stationary (to ensure the subject can apply
the brake while the tricycle is in motion)
vi. The subjects will also be asked their height and which weight category they fall
into: 100-125, 125-150, 150-175, 150-175, 175-200, 200-225, or 225-250 pounds

193
2. Ride the tricycle through a pre-determined length of the course in a given time. This procedure
will ensure that the subjects can achieve and maintain the desired 5 MPH speed.
3. Ride the tricycle along the test path around WPI’s Quadrangle (a spotter will be at both ends of
the course).
4. Complete a survey detailing the operation of the tricycle (see below).

194
Survey:
On a scale of 1 to 5, please rank how well the tricycle fulfills each category. The specific meaning of 1, 3,
and 5 are provided for each question. After providing a numerical score for each question, please provide
additional comments for why you chose this value.
1. What is your experience level riding bicycles?
Inexperienced Somewhat Experienced Very experienced
1 2 3 4 5
2. How easily could the tricycle be adjusted to fit your height?
Could Not Adjust to My Height Somewhat Difficult Easily
1 2 3 4 5
3. How comfortable did you find the recumbent pedaling position?
Not at All Somewhat Very
1 2 3 4 5
4. How easy was it to adapt to the pedaling style?
Challenging Neutral Easy
Comments:
Comments:
Comments:

195
1 2 3 4 5
5. How often did the components of the device intrude into your pedaling space?
Frequently Occasionally Never
1 2 3 4 5
6. How easy was the device to steer?
Difficult Neutral Easy
1 2 3 4 5
7. How easy was the steering technique to learn?
Difficult Neutral Easy
1 2 3 4 5
8. How intuitive was the braking system to operate?
Comments:
Comments:
Comments:
Comments:

196
Not at All Somewhat Very
1 2 3 4 5
9. When the brakes were applied, how well did the tricycle stop?
Not Well at All Somewhat Well Very Well
1 2 3 4 5
10. How well did your feet remain on the pedals?
Not Well at All Somewhat Well Very Well
1 2 3 4 5
11. How comfortable was the seat?
Not at All Somewhat Very
1 2 3 4 5
Comments:
Comments:
Comments:
Comments:

197
12. How stable did you feel on the tricycle ?
Not at All Somewhat Very
1 2 3 4 5
General Questions:
13. What did you think was the best feature about the tricycle ?
14. What did you think was the worst feature of the tricycle ?
15. Do you have any other comments or suggestions?
Comments:
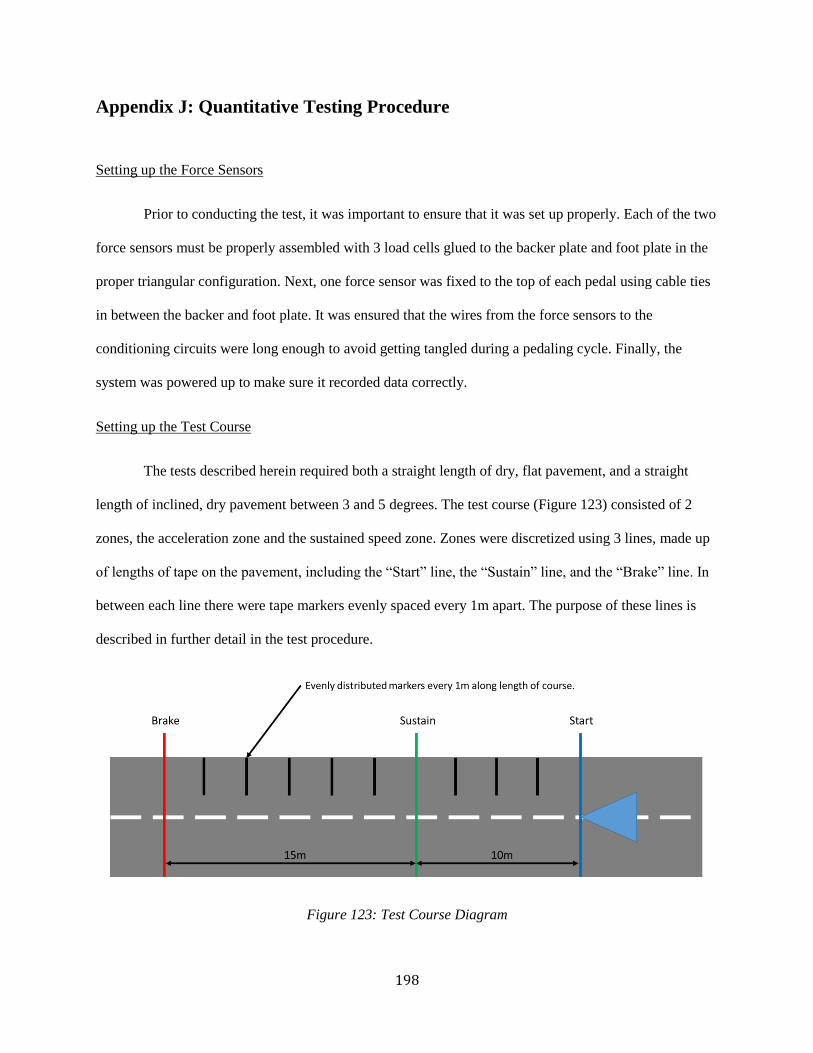
198
Appendix J: Quantitative Testing Procedure
Setting up the Force Sensors
Prior to conducting the test, it was important to ensure that it was set up properly. Each of the two
force sensors must be properly assembled with 3 load cells glued to the backer plate and foot plate in the
proper triangular configuration. Next, one force sensor was fixed to the top of each pedal using cable ties
in between the backer and foot plate. It was ensured that the wires from the force sensors to the
conditioning circuits were long enough to avoid getting tangled during a pedaling cycle. Finally, the
system was powered up to make sure it recorded data correctly.
Setting up the Test Course
The tests described herein required both a straight length of dry, flat pavement, and a straight
length of inclined, dry pavement between 3 and 5 degrees. The test course (Figure 123) consisted of 2
zones, the acceleration zone and the sustained speed zone. Zones were discretized using 3 lines, made up
of lengths of tape on the pavement, including the “Start” line, the “Sustain” line, and the “Brake” line. In
between each line there were tape markers evenly spaced every 1m apart. The purpose of these lines is
described in further detail in the test procedure.
Figure 123: Test Course Diagram

199
Calibration
The load cells used for testing employ strain gauges to determine applied force. This outputs to a
computer as a change in resistance. Values recorded by the computer without proper calibration will not
reflect the actual force applied. However, because strain gauges output change in resistance linearly with
change in strain, only two known applied loads were necessary for calibration. The following steps
outline how the force sensors were calibrated:
1. With the computer constantly displaying the current strain force sensor output, a 10lbf
weight was placed on top of the foot plate whole taking note of the output value.
2. Similarly, a 20lbf weight was placed on the sensor while taking note of the output value.
3. The calibration constants were then adjusted in the weight sensing code with the actual
values output from the two weights.
4. The code was then re-uploaded to the Arduino.
5. The calibration was validated by placing the weights back on the sensor and recording the
output and checked with several other known weights.
Combined Transient and Steady State Testing
The combined transient and steady state test was intended to evaluate the assistance performance
of the tricycle under both “pedaling to accelerate” and “pedaling to sustain” conditions. With data being
recorded for the entire test, the operator accelerated the tricycle from rest to a constant and smooth
pedaling motion, and maintained this for 15m before braking to a stop. The same operator was used for
every test, ensuring they stayed consistent with their pedaling, this allowed the data to still be comparable
even without knowing the exact traveling speed. Using data from the duration of the test it was possible to
determine the transient and steady state force profiles. These curves were then be analyzed for
performance characteristics. This test was first performed on dry, flat pavement and then repeated on dry,
inclined pavement of between 3 and 5 degrees. The following steps outline the procedure for this test:

200
1. The front of the tricycle was positioned on the “Start” line. The front wheel was then lifted,
allowing it to spin freely, and the pedals rotated so they are horizontal and the spring was in its
nominal position.
2. The test operator then sat in the tricycle and a secondary operator was ready to guide any
power/data cables along while the tricycle moved so they did not get tangled.
3. The load sensor system was then powered up.
4. Data recording was started.
5. From rest at the “Start Line” the operator began pedaling up to 1.5m/s, ensuring to reach this
speed by the time the “Sustain” line was reached.
6. Once the “Sustain” line was reached, a constant speed was maintained until the “Brake” line was
reached.
7. The operator broke to a complete stop.
8. Data recording was stopped and the file saved while taking note of the spring used in the test.
9. Steps 1 through 9 were then repeated with all 3 available springs.
Once all data are collected, force curves vs time can be generated for each foot and spring constant.
By comparing the results from one foot to the other, it will be possible to determine the actual assistance
level provided by the spring mechanism.

201
Appendix K: Updated Subject Testing Procedure
Locations:
2. WPI’s Quadrangle (In Red, Figure 124). The test will occur on the paved path along the outside
of the quadrangle. This section of the quadrangle is level, and is not open to vehicular traffic.
Figure 124: Test Path along the Quadrangle (Google, 2016)
Testing Procedure: The test subjects will be asked to complete the following tasks:
5. Pass a pre-test which will ensure the subject is fit to take part in the study. The pre-test will
consist of the successfully accomplishing the following tasks:
i. Stand on one foot for 5 seconds (to demonstrate balance).
ii. Bend the hip so the thigh is horizontal and the calf is vertical while standing
(with each leg, to demonstrate range of motion).
iii. Walk heel-to-toe for 10 steps (to demonstrate coordination).
iv. Walk normally for 10 steps (to demonstrate strength)
v. Apply the brake on the tricycle while stationary (to ensure the subject can apply
the brake while the tricycle is in motion)
vi. The subjects will also be asked their height and which weight category they fall
into: 100-125, 125-150, 150-175, 150-175, 175-200, 200-225, or 225-250 pounds

202
6. Ride the tricycle through a pre-determined length of the course in a given time. This procedure
will ensure that the subjects can achieve and maintain the desired 5 MPH speed.
7. Ride the tricycle along the test path around WPI’s Quadrangle (a spotter will be at both ends of
the course).
8. Complete a survey detailing the operation of the tricycle (see below).

203
Survey:
On a scale of 1 to 5, please rank how well the tricycle fulfills each category. The specific meaning of 1, 3,
and 5 are provided for each question. After providing a numerical score for each question, please provide
additional comments for why you chose this value.
1. What is your experience level riding bicycles?
Inexperienced Somewhat Experienced Very experienced
1 2 3 4 5
2. How easily could the tricycle be adjusted to fit your height?
Could Not Adjust to My Height Somewhat Difficult Easily
1 2 3 4 5
3. How comfortable did you find the recumbent pedaling position?
Not at All Somewhat Very
1 2 3 4 5
4. How easy was it to adapt to the pedaling style?
Challenging Neutral Easy
Comments:
Comments:
Comments:

204
1 2 3 4 5
5. How often did the components of the device intrude into your pedaling space?
Frequently Occasionally Never
1 2 3 4 5
6. How easy was the device to steer?
Difficult Neutral Easy
1 2 3 4 5
7. How easy was the steering technique to learn?
Difficult Neutral Easy
1 2 3 4 5
8. How intuitive was the braking system to operate?
Not at All Somewhat Very
Comments:
Comments:
Comments:
Comments:

205
1 2 3 4 5
9. When the brakes were applied, how well did the tricycle stop?
Not Well at All Somewhat Well Very Well
1 2 3 4 5
10. How well did your feet remain on the pedals?
Not Well at All Somewhat Well Very Well
1 2 3 4 5
11. How comfortable was the seat?
Not at All Somewhat Very
1 2 3 4 5
12. How stable did you feel on the tricycle ?
Not at All Somewhat Very
1 2 3 4 5
Comments:
Comments:
Comments:
Comments:

206
General Questions:
13. What did you think was the best feature about the tricycle ?
14. What did you think was the worst feature of the tricycle ?
15. Do you have any other comments or suggestions?
Comments:

207
Appendix L: Subject Testing Results
Table 62: Subject's Comments to Subject Testing Questions
Question Comments
1 Never learned to ride a bike
I can ride pretty well
2 I have short legs so it worked perfectly without adjustment
adjusting height affected brake cable
3 None
4 It was smooth
5 No obstruction
Toes were slightly touching spring screw
6 Turning radius was wide
Sudden turns at high speeds
7 None
8 Brakes loosened frequently
9 Just needs to be tightened; otherwise perfect
1 sec delay
10 The position of the pedals paired with the position of my seat made it easier
11 Slightly wobbly; otherwise fine
12 can't really fall off a tricycle
as stable as any 3 wheel vehicle can be,
Best Feature
of the
Tricycle
Intuitive to use
Really easy to sit and pedal and it was comfortable
Easy to operate even having never ridden a bike before
Flame graphic
Turned very well, great pedal positioning
Ease of use
Worst Feature
of the
Tricycle
Brakes could have been more responsive
Chain fell off
Chain kept coming off
Wobbly seat
Other
Suggestions:
Responsive brakes
Add a chain guard
Fix the alignment on the sprockets