reimbursement of care for severe trauma under swissdrg
TRANSCRIPT

Zurich Open Repository andArchiveUniversity of ZurichMain LibraryStrickhofstrasse 39CH-8057 Zurichwww.zora.uzh.ch
Year: 2016
Reimbursement of care for severe trauma under SwissDRG
Moos, Rudolf M ; Sprengel, Kai ; Jensen, Kai Oliver ; Jentzsch, Thorsten ; Simmen, Hans-Peter ;Seifert, Burkhardt ; Ciritsis, Bernhard ; Neuhaus, Valentin ; Volbracht, Jörk ; Mehra, Tarun
Abstract: QUESTIONS Treatment of patients with severe injuries is costly, with best results achievedin specialised care centres. However, diagnosis-related group (DRG)-based prospective payment systemshave difficulties in depicting treatment costs for specialised care. We analysed reimbursement of care forsevere trauma in the first 3 years after the introduction of the Swiss DRG reimbursement system (2012-2014). MATERIAL/METHODS The study included all patients with solely basic insurance, hospitaladmission after 01.01.2011 and discharge in 2011 or 2012, who were admitted to the resuscitation roomof the University Hospital of Zurich, aged 16 years and with an injury severity score (ISS) 16 (n =364). Clinical, financial and administrative data were extracted from the electronic medical records. Allcases were grouped into DRGs according to different SwissDRG versions. We considered results to besignificant if p 0.002. RESULTS The mean deficit decreased from 12 065 CHF under SwissDRG 1.0(2012) to 2 902 CHF under SwissDRG 3.0 (2014). The main reason for the reduction of average deficitswas a refinement of the DRG algorithm with a regrouping of 23 cases with an ISS 16 from MDC 01 toDRGs within MDC21A. Predictors of an increased total loss per case could be identified: for example,high total number of surgical interventions, surgeries on multiple anatomical regions or operations onthe pelvis (p 0.002). Psychiatric diagnoses in general were also significant predictors of deficit percase (p<0.001). CONCLUSION The reimbursement for care of severely injured patients needs furtherimprovement. Cost neutral treatment was not possible under the first three versions of SwissDRG.
DOI: https://doi.org/10.4414/smw.2016.14334
Posted at the Zurich Open Repository and Archive, University of ZurichZORA URL: https://doi.org/10.5167/uzh-125925Journal ArticlePublished Version
The following work is licensed under a Creative Commons: Attribution-NonCommercial-NoDerivatives4.0 International (CC BY-NC-ND 4.0) License.
Originally published at:Moos, Rudolf M; Sprengel, Kai; Jensen, Kai Oliver; Jentzsch, Thorsten; Simmen, Hans-Peter; Seifert,Burkhardt; Ciritsis, Bernhard; Neuhaus, Valentin; Volbracht, Jörk; Mehra, Tarun (2016). Reimburse-ment of care for severe trauma under SwissDRG. Swiss Medical Weekly, 146:w14334.DOI: https://doi.org/10.4414/smw.2016.14334

Original article | Published 21 August 2016, doi:10.4414/smw.2016.14334
Cite this as: Swiss Med Wkly. 2016;146:w14334
Reimbursement of care for severe trauma underSwissDRG
Rudolf M Moosa, Kai Sprengelb, Kai Oliver Jensenb, Thorsten Jentzschb, Hans-Peter Simmenb, Burkhardt Seifertc, Bernhard Ciritsisb, Valentin
Neuhausb, Jörk Volbrachta, Tarun Mehraa
a Medical Directorate, University Hospital of Zurich, Switzerlandb Division of Trauma Surgery, University Hospital of Zurich, Switzerlandc Biostatistics Department, Epidemiology, Biostatistics and Prevention Institute, University of Zurich, Switzerland
Summary
QUESTIONS: Treatment of patients with severe injuriesis costly, with best results achieved in specialised carecentres. However, diagnosis-related group (DRG)-basedprospective payment systems have difficulties in depictingtreatment costs for specialised care. We analysed reim-bursement of care for severe trauma in the first 3 years afterthe introduction of the Swiss DRG reimbursement system(2012–2014).MATERIAL/METHODS: The study included all patientswith solely basic insurance, hospital admission after01.01.2011 and discharge in 2011 or 2012, who were ad-mitted to the resuscitation room of the University Hospitalof Zurich, aged ≥16 years and with an injury severity score(ISS) ≥16 (n = 364). Clinical, financial and administrativedata were extracted from the electronic medical records.All cases were grouped into DRGs according to differentSwissDRG versions. We considered results to be signific-ant if p ≤0.002.RESULTS: The mean deficit decreased from 12 065 CHFunder SwissDRG 1.0 (2012) to 2 902 CHF under Swis-sDRG 3.0 (2014). The main reason for the reduction ofaverage deficits was a refinement of the DRG algorithmwith a regrouping of 23 cases with an ISS ≥16 from MDC01 to DRGs within MDC21A. Predictors of an increasedtotal loss per case could be identified: for example, hightotal number of surgical interventions, surgeries on mul-tiple anatomical regions or operations on the pelvis (p≤0.002). Psychiatric diagnoses in general were also signi-ficant predictors of deficit per case (p<0.001).
AbbreviationsCHOP Swiss classification of operations (surgical interventions)DRG diagnosis-related groupICD international classification of diseasesICU intensive care unitISS injury severity scoreLOS length of stayMDC major diagnostic categoryNEMS nine equivalents of nursing manpower use scoreSD standard deviation
CONCLUSION: The reimbursement for care of severelyinjured patients needs further improvement. Cost neutraltreatment was not possible under the first three versions ofSwissDRG.
Key words: cost outliers; earnings; prospective payment
system; SwissDRG; polytrauma; multiple injury; severely
injured patients; hospital reimbursement; injury severity
score; severe trauma
Introduction
Background
Increasing international evidence points towards improvedoutcomes for treatment of severe injuries in specialisedtrauma centres, justifying efforts for regionalisation of care[1–6]. However, treatment in specialised centres is costly[7]. In 2012, Switzerland switched reimbursement for inpa-tient care from mostly day rates to a prospective paymentsystem based on German diagnosis-related groups (DRGs)[8]. Nonetheless, with a population of approximately 8 mil-lion and an estimated incidence of severe trauma rangingfrom 25 to 52 per 100 000 [9, 10], the statistical popula-tion with which the DRGs are calculated in Switzerland issmall. The accurate calculation of reimbursement rates forcases less frequently encountered poses a challenge, suchas in the case of trauma or burn patients [11–13]. Espe-cially patients with multiple injuries are often discussed asbeing underfinanced [7, 14–18]. Some previous investiga-tions even suggest that cost-neutral treatment of severelyinjured patients might not be realistic under a DRG-basedprospective payment system [14, 19]. Since costs are pos-itively correlated with length of stay it has been suggestedthat various problems regarding cost coverage are causedby high outliers [20]. In most of the studies, earnings wereanalysed without knowledge of individual treatment costsper case and if they were known, the treatment costs wereoften estimates based on general assumptions instead ofcalculated individual costs [14, 21–25]. For our study wewere able to provide the individual full-absorption costs forevery single case from our hospital unit accounts. There-
Swiss Medical Weekly · PDF of the online version · www.smw.ch Page 1 of 13
fore, we were able to calculate the financial result for everysingle case, providing the possibility to analyse the revenuestructure and the DRG-selection within our study group un-der the first three catalogue versions of SwissDRG, whichwere valid for the three consecutive years 2012, 2013 and2014, by calculating the simulated DRG-revenues for allcases under the corresponding SwissDRG versions 1.0, 2.0and 3.0. Thus, we were able to focus on the refinement ofthe reimbursement system within the first 3 years after itsintroduction, assuming that severity of injuries, treatmentsand costs stayed the same throughout the years.
DRG and Switzerland
DRG systems categorise hospital cases into clusters which,in terms of resource utilisation and treatment costs, are ex-pected to be similar [13]. Originally developed to allowhospital output measurements [26], DRGs are currentlyused to determine the revenues for inpatient treatments inmany countries around the globe [27, 28]. Technically, therevenue for a certain case is determined by the DRG andits related case mix points multiplied by the base rate of thehospital, as long as the length of stay (LOS) is within thelow and high margins of the ascertained DRG (inlier defini-tion). Therefore, for most DRGs a low and a high trim pointis defined. If the actual LOS is below the low trim point thecase is defined as a low outlier and the case mix points forinliers are reduced by a constant rate for every day belowthe low trim point. If LOS exceeds the high trim point, thecase is accordingly defined as a high outlier and the hos-pital receives additional money for every day the LOS ex-ceeds the defined high trim point of the DRG. Thereforethe revenues within a DRG system are fixed only for inli-ers within these limits. The revenue for a typical DRG ac-cording to LOS can be obtained from the appendix (sup-plementary figure S1). Since the margins for low and highoutliers are variable throughout the catalogue versions thiscan affect the average revenues significantly. Therefore,the quality of DRG depiction and the impact of LOS onrevenues were investigated separately when analysing thecatalogue effects within this study. In addition, certain pro-cedures or medications make cases eligible for supplement-ary payments on top of the revenues described so far, sosupplementary payments were investigated too.
Material and methods
Ethics
Institutional review board approval was obtained from theEthics Committee of the Canton Zurich prior to the start ofthe study (KEK-ZH-Nr. 2014-0231). All patient-based datafrom our centre were anonymised before the analysis.
Inclusion criteria
All patients with solely basic insurance, hospital admissionafter 1 January 2011 and discharge in 2011 or 2012, whowere admitted to the resuscitation room of the UniversityHospital of Zurich, aged 16 years and older with an injuryseverity score (ISS) greater or equal to 16 were included inthis study. With an ISS greater or equal to 16 we followedthe definition of severely injured patients of the German
Society for Trauma Surgery [29]. Three cases with hospitaladmission before 1 January 2011 and discharge in 2012 orlater had to be excluded because cost data could not be ob-tained completely owing to the structure of our database.
Analysed data
The discharges in 2011 and 2012 were classified with dif-ferent SwissDRG groupers. The following grouper ver-sions have been used: batch grouper v1.0 planning version,v2.0 planning version 1 and v3.0 catalogue version forcases discharged in 2011; batch grouper v1.0 billing ver-sion, v2.0 planning version 2 and v3.0 planning version1 for cases discharged in 2012. A base rate of 11 300CHF per case-mix point was assumed. The supplementarypayments (“Zusatzentgelte”) under SwissDRG versions 1.0and 2.0, as well as the supplementary payments for bloodproducts under SwissDRG version 3.0, were taken into ac-count.Data recorded for the trauma register for the “DeutscheGesellschaft für Unfallchirurgie” (DGU: Germany Societyfor Emergency Surgery), administrative data as well as thecoded diagnoses and procedures were analysed. The dia-gnoses were encoded according to the international classi-fication of diseases (ICD) version ICD-10 GM 2010, theprocedures according to the Swiss classification of opera-tions (CHOP) catalogues 2011 and 2012.The cost data were obtained from the internal REKOLE®-based full-absorption cost-unit accounts [30]. The data arebased on the PRISMA formatted data set, as specified bythe Canton of Zurich [31].
Statistics
Diagnostic data were organised into clusters (see appendix,supplementary tables S1a and S1b) and binomially codedfor further statistical analysis (1 = yes, 0 = no). Associationof net profit per case (total DRG revenue per case calcu-lated as the sum of case mix points times base rate plus sup-plementary payments minus total case costs) with nominalvariables was determined with the Mann-Whitney-test. Forcontinuous variables, Spearman’s rank correlation with netper case profit was determined.Statistical analysis was performed using IBM SPSS Statist-ics, version 22 (IBM Corp., Armonk, NY, USA). Assum-ing a general significance level of α = 0.05, we consideredresults to be significant for p ≤0.002 after Bonferroni cor-rection, to maintain the probability of false significancesdue to multiple testing of 24 variables (supplementary tableS2).
Results
Descriptive statistics of the study population
Data of 364 patients were evaluated in this study. Popula-tion characteristics such as age, length of stay (LOS), LOSin intensive care units (ICUs) and others can be obtainedfrom table 1. The overall in-house mortality was 25.8%(3.8% unsuccessful reanimation in resuscitation room,8.5% after restricted comfort therapy owing to declared in-tention, 13.5% albeit standard care). The mean ISS was34.2 points with a median of 27 points, and a range from 16
Original article Swiss Med Wkly. 2016;146:w14334
Swiss Medical Weekly · PDF of the online version · www.smw.ch Page 2 of 13

to 75 points. The mean abbreviated injury score per bodyregion can be obtained from table 2.
Revenue structure
The mean revenue of all cases under SwissDRG 1.0 (casemix points x base rate / number of cases) amounted to57 058 CHF including supplementary payments, the av-erage case cost amounted to 69 123 CHF (standard devi-ation [SD] 86 537 CHF), leading to a theoretical averageloss of 12 065 CHF (SD 43 019 CHF) per case under Swis-sDRG 1.0, which amounted to a total loss of approximately4.4 million CHF (table 3). So if all cases included in ourstudy were discharged in 2012 (SwissDRG Version 1.0),this would have been the real financial loss for our institu-tion caused by the treatment of the severely injured patientsincluded in this study. In order to assess the financial res-ults for the following SwissDRG versions 2.0 and 3.0 (val-id for discharges in 2013 and 2014, respectively) we calcu-lated the corresponding catalogue effects.
Catalogue effects
Catalogue effects affect revenues through changes to DRGdefinitions, grouper algorithms and modifications in thecase-mix points of the SwissDRG catalogue versions fromone year to the next. They are normally expressed as per-centage change of case-mix index from one year to thenext. To analyse this effect, we grouped all cases includedin our study with the corresponding SwissDRG batchgrouper. The ascertained case-mix points were multipliedby the same base rate of 11 300 CHF to determine thetheoretical revenue under the current SwissDRG catalogueversions between 2012 and 2014.As depicted in figure 1, the evolution of the reimbursementof severely injured patients showed a positive trend, thesimulated loss per case reduced. However, even underSwissDRG version 3.0 (2014), a cost-neutral treatment ofseverely injured patients was not achievable (table 4). In-terestingly, the positive catalogue effects were solely dueto regrouping of cases to other DRGs (increase of 188.290case-mix points from SwissDRG version 1.0 to 2.0),whereas the case-mix points of those cases that were not
Figure 1
Average deficit under different SwissDRG catalogue versions.Average deficits were calculated as the mean of diagnosis-relatedgroup (DRG) revenue minus total costs per case. DRG revenuewas determined by multiplying the effective case-mix points of thecase’s DRGs as defined by the different catalogue versions (V1.0,2014; V2.0, 2013; V3.0, 2014) by a base rate of 11 300 CHF.Supplementary payments (“Zusatzentgelte”) were taken intoaccount.
grouped into a different DRG declined by 24.372 case-mixpoints. Similar observations were made between version2.0 and 3.0, although the amount of DRG regroupings wasstrikingly less between 2.0 and 3.0 in comparison with 1.0and 2.0 (68 to 105 regroupings).The average per-case deficit substantially dropped from12 065 CHF under SwissDRG catalogue 1.0 to 2902 CHFunder catalogue version 3.0 (table 3).Since for DRG outliers LOS is driving the revenue side ofthe DRG system also, we analysed the percentage of lowand high outliers in our study group under the three consec-utive DRG versions, as well as the evolution of total case-mix point reductions and supplements due to changingthresholds for outliers. As figure 2 clearly demonstrates,the proportion of low and high outliers was comparablystable for all investigated SwissDRG versions. The vastmajority of the cases are inliers (including DRGs with fixedlength of stay) for all investigated SwissDRG versions.Nevertheless, the total sum of reductions for low outli-ers decreased, especially from SwissDRG 1.0 to 2.0, whilethe total sum of supplements for high outliers decreasedslightly too (table 5). Overall, the proportion of case-mixpoints compared with the total sum of case-mix points thatcould be charged under the different SwissDRG versionsfirst increased slightly from 3.8% to 4.0% between Swis-sDRG 1.0 and 2.0 and then decreased again to 3.5% underSwissDRG version 3.0 (table 5).
Supplementary payments
Supplementary payments were very cautiously introducedunder SwissDRG in 2012, with very few procedures re-ceiving supplementary reimbursement. Originally, theywere developed especially for high-cost services requiredby heterogeneous patients. The English healthcare resourcegroup (HRG) system has developed the concept of “un-bundling”, which separates a set of certain services, suchas chemotherapy, radiotherapy, diagnostic imaging, renaldialysis and high-cost drugs, from the core HRGs [32],which is a similar concept. By separating these services,the economic homogeneity of core DRGs/HRGs shouldbe improved and, at the same time, adequate reimburse-ment through supplementary payments should be guaran-
Figure 2
Proportions of DRG inliers (< Swiss ALOS and > Swiss ALOS),DRGs with fixed LOS and outliers (low and high outlier) accordingto length of stay and definition of low and high trim points for outlierunder SwissDRG Versions 1.0, 2.0 and 3.0 respectively.ALOS = average length of stay; LOS = length of stay
Original article Swiss Med Wkly. 2016;146:w14334
Swiss Medical Weekly · PDF of the online version · www.smw.ch Page 3 of 13

teed [33]. In total, only three patients discharged in 2012 ofthe study group were eligible for supplementary paymentsunder catalogue 1.0 (total of 41 987 CHF). For patients dis-charged in 2011, the corresponding data were not avail-able. As the amount is marginal in comparison with thetotal revenue (less than 0.2%), this imprecision was judgedtolerable. However, the supplementary payments for bloodproducts introduced with the catalogue version 3.0 in 2014have a strong influence on revenue for severely injured pa-tients: in total, 69 cases of the study group were eligible(approximately 19%), totalling 290 466 CHF.
Discriminatory power of SwissDRG
From all cases included in our study, the numbers groupedinto a polytrauma DRG especially designed for severely in-jured cases (major diagnostic category [MDC] 21A = DRGcategory 1) were 135 (37.1%) according to the grouper al-gorithm of SwissDRG version 1.0, 171 (47.0%) cases ac-cording to version 2.0 and 166 (45.6%) according to ver-sion 3.0 (table 4). Fifty-eight (15.9%) cases were classifiedinto pre-MDC or ICU-related DRGs (DRG category 2) ac-cording to SwissDRG 1.0, 52 cases (14.3%) according toSwissDRG 2.0 and 57 (15.7%) cases according to Swis-sDRG 3.0. The remaining 171 (47%) cases according toversion 1.0 and 141 cases according to versions 2.0 and 3.0(38.7%) were grouped into other DRGs (DRG category 3).Therefore, only 53 % of the patients meeting the clinicalcriteria for a severely injured patient (ISS score ≥16) wereclassified appropriately under SwissDRG 1.0 (MDC 21A[polytrauma] or pre-MDC [intensive care DRGs]). UnderSwissDRG 2.0 and 3.0 this number increased to 61.2%.
DRG categories and grouper algorithm
The average deficit of the 135 polytrauma DRGs (DRGcategory 1) amounted to 645 CHF (SD 37 409 CHF) underSwissDRG Version 1.0 as shown in table 3. Cases withinDRG category 2 incurred an average loss of 36 075 CHF(SD 70 387 CHF) and the remaining cases (DRG category3) for an average loss of 13 871 CHF (SD 30 163 CHF).Therefore, only severely injured patients who weregrouped into a specific polytrauma DRG could be treatedwith cost coverage. The main improvement from Swis-sDRG 1.0 to 3.0 was due to a regrouping of cases from
MDC 01 DRGs (neurological DRGs) to MDC 21A DRGs(n = 23). Under version 3.0, the pre-MDC cases still hadthe highest average loss per case. However, severely in-jured cases grouped into MDC 01 DRGs accounted formost of the total loss with 1 055 684 CHF in total and anaverage loss per case of 9 959 CHF (SD 22 142 CHF).Here, the grouper algorithm classified cases with injuriesof the cranium or spine in combination with severe abdom-inal injuries such as lacerations of visceral organs or withother serious injuries into DRGs such as B02D or B61Z,although these DRGs are meant to represent neurosurgicalcases without concomitant injuries.
Predictors for high deficit cases
We identified a number of variables that were significantlycorrelated with the per-case deficit. Cases with a high num-ber of surgical interventions, surgery on multiple anatom-ical regions, the existence of certain injuries, such as frac-tures of the tibia, fibula or pelvis, or certain proceduressuch as open reductions and internal fixations of the tibiashowed an increased loss per case (p ≤0.002) as demon-strated in tables 6 and 7. The total number of surgical op-erations is a stronger predictor of loss than the numberof anatomical regions injured (p = 0.002 vs p = 0.72). Inaddition, in DRG category 3 hours of ICU treatment isalso a better predictor of deficit than the hours of mech-anical ventilation (p >0.001 vs p = 0.003). For cases withDRGs in category 3, a stay in the ICU correlated morestrongly with the deficit than the number of surgical pro-cedures or the number of anatomical regions with surgicalinterventions. In these cases, the nine equivalents of nurs-ing manpower use score (NEMS) and the simplified acutephysiology score for severity of illness (SAPS) were insuf-ficient to classify them into pre-MDC DRGs or into B36B.The presence of psychiatric illnesses in general alsoshowed an increased loss per case (p <0.001). Depressivedisorders showed a tendency to be underfunded as well, al-though the correlation was not significant (p = 0.006). Forthe full detail of all results, please refer to supplements 3and 4.
Table 1: Population characteristics of patients with severe trauma, discharged in 2011 and 2012 (n = 364).
Study population ISS ≥16(n = 364)Mean (Standard deviation) Median (Range)
Age (years) 50.7 (21.6) 49 (16–95)
GCS (n = 253) 9.9 (4.9) 12 (3–15)
ISS 34.2 (18.6) 27 (16–75)
NISS 40.4 (18.1) 34 (16–75)
RISC 26.8 (31.0) 12.6 (1.1–99.9.)
Length of intensive care treatment (days) 7.1 (10.4) 3.0 (0–95)
Duration of mechanical ventilation (h) 93.8 (182.6) 12 (0–1577)
Length of stay (days) 14.2 (15.4) 11 (1–118)
PCCL 2.5 (1.7) 3 (0–4)
Injured body regions 2.5 (1.4) 2 (0–7)
Number of surgical operations 2.2 (3.1) 1 (0–26)
Number of operated body regions 1.5 (1.2) 1 (0–6)
GCS = Glasgow coma score; ISS = injury severity score; NISS = new injury severity score; PCCL = patient clinical complexity level; RISC = revised Injury severityclassification score
Original article Swiss Med Wkly. 2016;146:w14334
Swiss Medical Weekly · PDF of the online version · www.smw.ch Page 4 of 13
Discussion
We completed an analysis of the reimbursement forseverely injured patients, from a healthcare provider per-spective. Like previous investigations from other countries,we also can conclude that treatment at cost coverage fortrauma patients under SwissDRG was not possible for ourcohort when reimbursement tariffs from 2012 to 2014 wereapplied [14, 19]. However, we were able to establish pre-dictors of underfunding in our cohort, based on clusters ofdiagnoses or surgical procedures. Further, since only one
previous Swiss investigation estimating the actual averagetreatment costs for severely injured patients in Switzerlandhas been published, we also wanted to determine the actualcosts of care at a Swiss level 1 trauma centre [34].A benchmarking of our costs to those of other Swiss uni-versity hospitals did not show higher treatment costs fortrauma patients at our centre compared with the referencegroup, as the average costs per case, including all patientswith solely basic insurance coverage, were 0.6% below thebenchmark [35]. Therefore, the deficit is most likely notdue to the cost structure of our centre, but due to a struc-
Table 2: Abbreviated injury score distribution of cases with severe trauma discharged in 2011 and 2012 by injured body region (n = 364).
Study population ISS ≥16(n = 364)Mean (Standard deviation) Median (Range)
AIS Head 3.2 (2.0) 4 (0–6)
AIS Face 0.7 (1.2) 0 (0–4)
AIS Thorax 1.9 (1.8) 3 (0–6)
AIS Abdomen 1.0 (1.5) 0 (0–5)
AIS Extremities 1.5 (1.5) 2 (0–5)
AIS Soft tissue injuries 0.8 (0.9) 1 (0–5)
AIS = abbreviated injury score; ISS = injury severity score
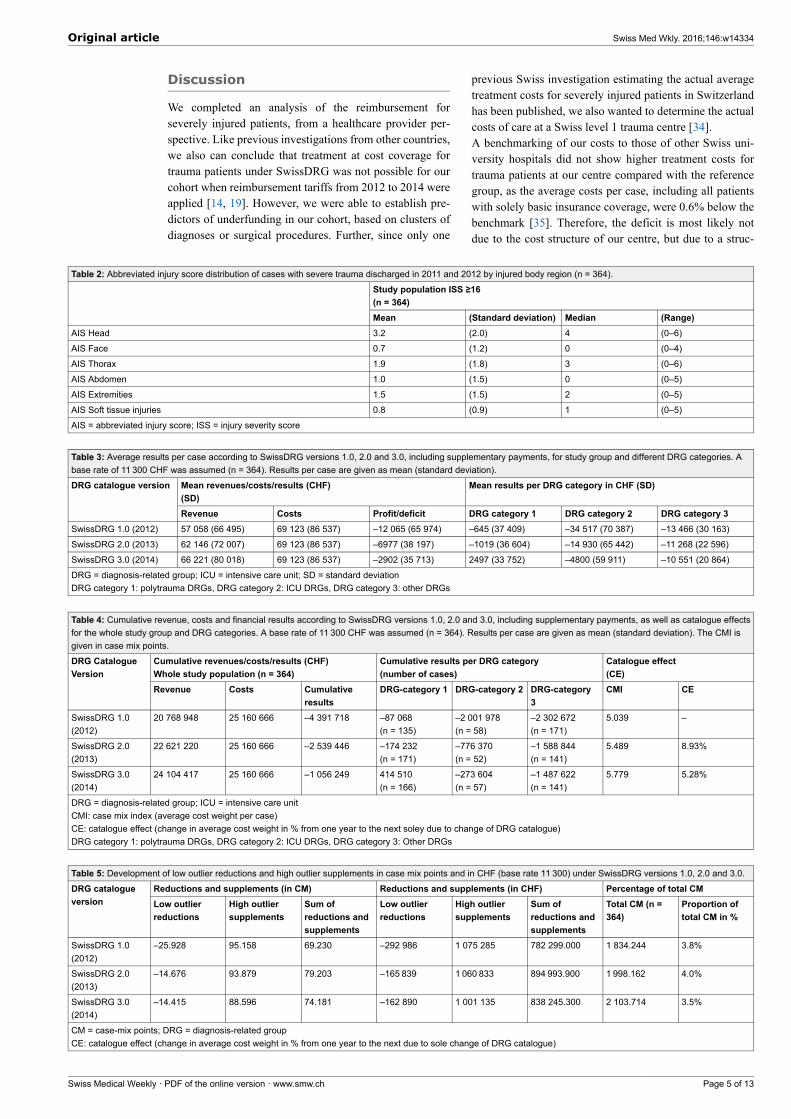
Table 3: Average results per case according to SwissDRG versions 1.0, 2.0 and 3.0, including supplementary payments, for study group and different DRG categories. Abase rate of 11 300 CHF was assumed (n = 364). Results per case are given as mean (standard deviation).
Mean revenues/costs/results (CHF)(SD)
Mean results per DRG category in CHF (SD)DRG catalogue version
Revenue Costs Profit/deficit DRG category 1 DRG category 2 DRG category 3SwissDRG 1.0 (2012) 57 058 (66 495) 69 123 (86 537) –12 065 (65 974) –645 (37 409) –34 517 (70 387) –13 466 (30 163)
SwissDRG 2.0 (2013) 62 146 (72 007) 69 123 (86 537) –6977 (38 197) –1019 (36 604) –14 930 (65 442) –11 268 (22 596)
SwissDRG 3.0 (2014) 66 221 (80 018) 69 123 (86 537) –2902 (35 713) 2497 (33 752) –4800 (59 911) –10 551 (20 864)
DRG = diagnosis-related group; ICU = intensive care unit; SD = standard deviationDRG category 1: polytrauma DRGs, DRG category 2: ICU DRGs, DRG category 3: other DRGs
Table 4: Cumulative revenue, costs and financial results according to SwissDRG versions 1.0, 2.0 and 3.0, including supplementary payments, as well as catalogue effectsfor the whole study group and DRG categories. A base rate of 11 300 CHF was assumed (n = 364). Results per case are given as mean (standard deviation). The CMI isgiven in case mix points.
Cumulative revenues/costs/results (CHF)Whole study population (n = 364)
Cumulative results per DRG category(number of cases)
Catalogue effect(CE)
DRG CatalogueVersion
Revenue Costs Cumulativeresults
DRG-category 1 DRG-category 2 DRG-category3
CMI CE
SwissDRG 1.0(2012)
20 768 948 25 160 666 –4 391 718 –87 068(n = 135)
–2 001 978(n = 58)
–2 302 672(n = 171)
5.039 –
SwissDRG 2.0(2013)
22 621 220 25 160 666 –2 539 446 –174 232(n = 171)
–776 370(n = 52)
–1 588 844(n = 141)
5.489 8.93%
SwissDRG 3.0(2014)
24 104 417 25 160 666 –1 056 249 414 510(n = 166)
–273 604(n = 57)
–1 487 622(n = 141)
5.779 5.28%
DRG = diagnosis-related group; ICU = intensive care unitCMI: case mix index (average cost weight per case)CE: catalogue effect (change in average cost weight in % from one year to the next soley due to change of DRG catalogue)DRG category 1: polytrauma DRGs, DRG category 2: ICU DRGs, DRG category 3: Other DRGs
Table 5: Development of low outlier reductions and high outlier supplements in case mix points and in CHF (base rate 11 300) under SwissDRG versions 1.0, 2.0 and 3.0.
Reductions and supplements (in CM) Reductions and supplements (in CHF) Percentage of total CMDRG catalogueversion Low outlier
reductionsHigh outliersupplements
Sum ofreductions andsupplements
Low outlierreductions
High outliersupplements
Sum ofreductions andsupplements
Total CM (n =364)
Proportion oftotal CM in %
SwissDRG 1.0(2012)
–25.928 95.158 69.230 –292 986 1 075 285 782 299.000 1 834.244 3.8%
SwissDRG 2.0(2013)
–14.676 93.879 79.203 –165 839 1 060 833 894 993.900 1 998.162 4.0%
SwissDRG 3.0(2014)
–14.415 88.596 74.181 –162 890 1 001 135 838 245.300 2 103.714 3.5%
CM = case-mix points; DRG = diagnosis-related groupCE: catalogue effect (change in average cost weight in % from one year to the next due to sole change of DRG catalogue)
Original article Swiss Med Wkly. 2016;146:w14334
Swiss Medical Weekly · PDF of the online version · www.smw.ch Page 5 of 13

tural underfinancing of care of the severely injured underSwissDRG.We demonstrated improvements in the refinancing ofsevere injury care from SwissDRG 1.0 (catalogue of 2012)to 3.0 (catalogue of 2014), due to algorithm rearrange-ments, more case-mix points assigned and new supple-mentary payments for blood products. The results also in-dicated, that changes in thresholds for DRG outlier defin-itions (changes in high trim points and low trim points)cannot explain the improvements that have been achieved.However, even under SwissDRG 3.0, care for 364 patientswith an ISS ≥16 still caused a total loss of approximately1.1 million CHF at a base rate of 11 300 CHF per case-mix point. We would like to underline the fact that the baserate employed for our calculations is high at 11 300 CHF, incomparison with base rates of the majority of other Swisshospitals or cantons. At a base rate of 9 600 CHF per case-mix point, the loss would increase to 5.0 million CHF peryear.The analysis of the DRG subgroups showed that the maindeficit sources were the cases grouped into DRG categories2 (ICU DRGs) and 3 (other, not strictly polytrauma or ICUDRGs) (table 4). The polytrauma DRGs as such (category1) allowed cost-coverage for medical care under Swis-sDRG 3.0.The 141 cases grouped into a DRG in category 3, a ratherinhomogeneous group of cases that were not assigned aspecial DRG for multiply injured patients or ICU-relatedcases, accounted for the majority of the remaining deficitunder SwissDRG 3.0. The average deficit per case did notdecrease markedly between the catalogue versions 1.0 and3.0. The main improvement came from a regrouping of 30cases into a polytrauma DRG. It should, therefore, be pos-sible to further improve the cost coverage of underfinancedsevere-injury care by further fine-tuning the grouper al-gorithm. We identified possible split criteria, which shouldbe analysed by SwissDRG AG and which could possiblybe of use in the further development of the reimbursementsystem. Such variables include the number of surgical in-terventions and the number of operated body regions. Weadvocate the addition of fractures of the lower extremities,especially of the tibia, as well as surgical procedures suchas the stabilisation of pelvic bones in order to separatepolytrauma DRGs in combination with other injuries to al-low for a more accurate grouping of severely injured pa-tients into adequate DRGs. We also strongly recommendthe prioritisation of MDC 21A over MDC 01 in the grouperalgorithm, to improve the classification of severely injuredpatients with spinal cord injuries.We would welcome discussion about the necessity to in-crease the number of available polytrauma DRGs. Perhapsthe introduction of further MDC-21A DRGs for cases withlong intensive care treatment, albeit not sufficient for qual-ifying for a pre-MDC DRG, could be part of the solution.A limitation to this study lies in the fact that it can only hintat the possibility of improvements of SwissDRG and thedefinite improvements need to be made based on the dataof all Swiss hospitals delivering cost data to the SwissDRGAG for calculation purposes.SwissDRG 3.0 uses a complicated DRG algorithm but doesnot take into account the number of surgical sites or the
number of surgical interventions, even though they correl-ate with total treatment costs.Furthermore, cases grouped into B02D, which includespinal cord injuries, were also eligible for classificationinto a polytrauma DRG. However, the grouper algorithmgave preference to the MDC 01 category, so that severelyinjured cases with injuries of the spinal cord were classifiedinto MDC 01 leading to high losses per case. We are con-fident that the predictors identified could be of use as splitcriteria in the future refinement of the accuracy of theDRG reimbursement system for severe trauma care. Weare aware of the fact that the DRG system is not meantto be cost-covering at an individual case level, but sinceonly trauma centres should treat patients with severe in-juries, cost coverage for the selected cohort should be tar-geted. However, there will be no easy solution to the prob-lem as long as the clinical criteria for classifying a patientas a severe trauma case (ISS) are not reflected in the criteriafor DRG selection. Currently, the ISS cannot be coded withICD-10 or CHOP codes. Other alternatives will most likelyalways suffer from some drawbacks of variable impact.
Conclusion
A further refinement of the DRG grouping algorithms issuggested above. In addition, the introduction of furthersupplementary payments for costly implants, medicationand coagulation factors may further improve the reim-bursement system and solve the continuing problems.
Disclosure statement: No financial support and no otherpotential conflict of interest relevant to this article was reported.
Correspondence: Rudolf M. Moos, MD, Ärztliche Direktion,
UniversitätsSpital Zürich, Rämistrasse 100, CH-8091 Zürich,
rudolf.moos[at]usz.ch
References
1 Westhoff J, Hildebrand F, Grotz M, Richter M, Pape HC, Krettek C.Trauma care in Germany. Injury 2003;34:674–83.
2 MacKenzie EJ, Rivara FP, Jurkovich GJ, Nathens AB, Frey KP, Egle-ston BL, et al. A national evaluation of the effect of trauma-center careon mortality. N Engl J Med. 2006;354:366–78.
3 Celso B, Tepas J, Langland-Orban B, Pracht E, Papa L, Lottenberg L,Flint L. A systematic review and meta-analysis comparing outcome ofseverely injured patients treated in trauma centers following the estab-lishment of trauma systems. J Trauma. 2006;60:371–8; discussion 8.
4 Papa L, Langland-Orban B, Kallenborn C, Tepas JJ, 3rd, Lottenberg L,Celso B, Durham R, Flint L. Assessing effectiveness of a mature traumasystem: Association of trauma center presence with lower injury mor-tality rate. J Trauma. 2006;61:261–6; discussion 6–7.
5 Twijnstra MJ, Moons KG, Simmermacher RK, Leenen LP. Regionaltrauma system reduces mortality and changes admission rates: a beforeand after study. Ann Surg. 2010;251:339–43.
6 Morshed S, Knops S, Jurkovich GJ, Wang J, MacKenzie E, RivaraFP. The impact of trauma-center care on mortality and function fol-lowing pelvic ring and acetabular injuries. J Bone Joint Surg Am.2015;97:265–72.
7 Mahlke L, Lefering R, Siebert H, Windolf J, Roeder N, Franz D. De-scription of the severely injured in the DRG system. Is treatment of theseverely injured still affordable? Chirurg. 2013;84:978–86.
8 Fallpauschalen in Schweizer Spitälern – Basisinformationen für Ge-sundheitsfachleute [monograph on the internet]. SwissDRG AG, Bern;
Original article Swiss Med Wkly. 2016;146:w14334
Swiss Medical Weekly · PDF of the online version · www.smw.ch Page 6 of 13
2011. Available from: http://www.swissdrg.org/assets/pdf/Broschuere/Broschuere_SwissDRG_d_A4.pdf
9 Liener UC, Rapp U, Lampl L, Helm M, Richter G, Gaus M, et al. In-cidence of severe injuries. Results of a population-based analysis. Un-fallchirurg. 2004;107:483–90. German.
10 Di Bartolomeo S, Sanson G, Michelutto V, Nardi G, Burba I, Frances-cutti C, et al. Epidemiology of major injury in the population of FriuliVenezia Giulia-Italy. Injury. 2004;35:391–400.
11 W F, H B, N R. Ist eine Kalkulation von seltenen und sehr aufwendigenKrankenhausfällen im G-DRG-System sachgerecht? Krankenhaus.2011;7:680–6.
12 Mehra T, Muller CT, Volbracht J, Seifert B, Moos R. Predictors of HighProfit and High Deficit Outliers under SwissDRG of a Tertiary CareCenter. PLoS One 2015;10: e0140874.
13 Mehra T, Koljonen V, Seifert B, Volbracht J, Giovanoli P, Plock J,Moos RM. Total inpatient treatment costs in patients with severe burns:towards a more accurate reimbursement model. Swiss Med Wkly.2015;145:w14217.
14 Juhra C, Franz D, Roeder N, Vordemvenne T, Raschke MJ. Classi-fication of severely injured patients in the G-DRG System 2008. Un-fallchirurg. 2009;112:525–32. German.
15 Flohe S, Buschmann C, Nabring J, Merguet P, Luetkes P, Lefering R,Nast-Kolb D, Ruchholtz S. Definition of polytrauma in the GermanDRG system 2006. Up to 30% “incorrect classifications”. Un-fallchirurg. 2007;110:651–8. German.
16 Franz D, Schemmann F, Selter DD, Auhuber T, Wirtz DC, Roeder N, etal. Remuneration for Orthopedic and Trauma Surgery in the German anDiagnosis-Related Groups (DRG) System Current Developments andFuture Action. Unfallchirurg. 2013;116:760–6.
17 Franz D, Schemmann F, Roeder N, Mahlke L. Financing of inpatientorthopedics and trauma surgery in the G-DRG system 2010. Un-fallchirurg. 2010;113:682–9.
18 Probst C, Schaefer O, Hildebrand F, Krettek C, Mahlke L. The econom-ic challenges of polytrauma care. Unfallchirurg. 2009;112:975–80.
19 Franz D, Schemmann F, Roeder N, Mahlke L. Financing of inpatientorthopedics and trauma surgery in the G-DRG system 2010. Un-fallchirurg. 2010;113:682–9.
20 Freitas A, Silva-Costa T, Lopes F, Garcia-Lema I, Teixeira-Pinto A,Brazdil P, Costa-Pereira A. Factors influencing hospital high length ofstay outliers. BMC Health Serv Res. 2012;12:265.
21 Obertacke U, Neudeck F, Wihs HJ, Schmit-Neuerburg KP. Emergencycare and treatment costs of polytrauma patients. Langenbecks ArchChir Suppl Kongressbd 1996;113:641–5.
22 Obertacke U, Neudeck F, Wihs HJ, Schmit-Neuerburg KP. Cost analysisof primary care and intensive care treatment of multiple trauma pa-tients. Unfallchirurg. 1997;100:44–9.
23 Wilke MH, Hocherl E, Scherer J, Janke L. Introduction of the newDRG-based reimbursement system in German hospitals – a difficultoperation? Experiences and possible solutions from the viewpoint oftrauma surgery. Unfallchirurg. 2001;104:372–9.
24 Schwermann T, Grotz M, Blanke M, Ruchholtz S, Lefering R, JMVdS, et al. Evaluation of costs incurred for patients with multipletrauma particularly from the perspective of the hospital. Unfallchirurg.2004;107:563–74.
25 Grotz M, Schwermann T, Lefering R, Ruchholtz S, Graf v d Schulen-burg JM, Krettek C, Pape HC. DRG reimbursement for multiple traumapatients – a comparison with the comprehensive hospital costs using theGerman trauma registry. Unfallchirurg. 2004;107:68–75.
26 Fetter RB, Shin Y, Freeman JL, Averill RF, Thompson JD. Case mixdefinition by diagnosis-related groups. Med Care. 1980;18: iii, 1–53.
27 Geissler A, Quentin W, Busse R. Heterogeneity of European DRGsystems and potentials for a common EuroDRG system Comment on“Cholecystectomy and Diagnosis-Related Groups (DRGs): patient clas-sification and hospital reimbursement in 11 European countries”. Int JHealth Policy Manag. 2015;4:319–20.
28 Mathauer I, Wittenbecher F. Hospital payment systems based ondiagnosis-related groups: experiences in low- and middle-income coun-tries. Bull World Health Organ 2013;91:746–56A.
29 Whitebook – Medical Care of the Severely Injured. 2 ed: German Soci-ety for Trauma Surgery (reg. assoc.), Berlin, 2012.
30 REKOLE® Handbuch – Betriebliches Rechnungswesen im Spital[monograph on the internet]. Bern, Switzerland; 2014. Available from:http://www.hplus.ch/de/dienstleistungen/betriebswirtschaft/rechnung-swesen_spital/rekoler_handbuch/
31 Zürich GdK. Handbuch PRISMA Wegleitung zur Erhebung des Patien-tenrecord in der Somatik [monograph on the internet]. 2014. Availablefrom: http://www.gd.zh.ch/dam/gesundheitsdirektion/direktion/the-men/gesundheitsinstitutionen/spitaeler_kliniken/handbuech-er_vorgaben_erhebungsunterlagen/handbuecher_und_vorgaben/prisma/hand-buch_prisma_2.1.pdf.spooler.download.1421054735957.pdf/hand-buch_prisma_2.1.pdf
32 The Casemix Service HRG4, Guide to Unbundling. Leeds: NHS In-formation Centre for Health and Social Care 2009.
33 Diagnosis-Related Groups in Europe. In: Reinhard Busse AG, WilmQuentin, Miriam Wiley, ed. Moving towards transparency, efficiencyand quality in hospitals, 2011.
34 Ganzoni D, Zellweger R, Trentz O. Cost analysis of acute therapy ofpolytrauma patients. Swiss Surg. 2003;9:268–74.
35 Webfeedback 2013 Fallkostendaten 2012 Grouperversion 1.0, 2.0 und3.0 [monograph on the internet]. Bern, Switzerland: SwissDRG AG;2014. Available from: https://apps.swissdrg.org/webfeedback2013_10/users/sign_in
Original article Swiss Med Wkly. 2016;146:w14334
Swiss Medical Weekly · PDF of the online version · www.smw.ch Page 7 of 13

Appendix
Supplementary tables and figure
Figure S1
SwissDRG and revenues according to length of stay (LOS).
Table S1a: Outcome measures and ICD-10 codes (ICD-10 GM-2010).
Cluster ICD-10 codeFractures
Clavicle S42.0, S42.7
Spine S12, S18, S22.0, S22.1, S32.0, S32.82
Pelvis, acetabulum S32.3, S32.5, S32.7, S32.81, S32.83, S32.89, S32.4
Femur S72
Tibia S82.1, S82.2, S82.3, S82.7
Fibula S82.11, S82.21, S82.31, S82.4, S82.6, S82.7, S82.81, S82.82
Foot S92
Upper extremity S42.0, S42.7, S42.1, S42.7, S42.2, S42.3, S42.4, S42.2, S52, S62
Lower extremity S72, S82.0, S82.1, S82.2, S82.3, S82.7, S82.11, S82.21, S82.31, S82.4, S82.6,S82.7, S82.81, S82.82, S92
(Intra-)abdominal injuries including kidneys and bladder
Spleen S36.02, S36.03, S36.04, S36.08
Liver S36.12, S36.13, S36.14, S36.15
Kidney S37.02, S37.03
Bladder S37.22
Small bowel S36.4
Colon S36.5
Psychiatric illnesses
General F*
Depressive disorder F32, F31.3, F31.4, F31.5, F33.0, F33.1, F33.2, F33.3, F33.8, F33.9, F34.1
ICD = international classification of diseases
Original article Swiss Med Wkly. 2016;146:w14334
Swiss Medical Weekly · PDF of the online version · www.smw.ch Page 8 of 13

Table S1b: Swiss classification of operations (CHOP) 2011/2012.
Cluster CHOP codesSurgical procedure
Closed or open reduction and internal fixation
Pelvis Z79.39.29, Z79.19.20
Acetabulum Z79.39.20
Lower limbs Z79.31, Z79.35, Z79.39.40, Z79.36.1, Z79.36.2, Z79.36.3, Z79.36.4, Z79.36.5,Z79.36.6, Z79.36.7, Z79.17, Z79.18, Z79.37, Z79.38
Open reduction and internal fixation tibia Z79.36.1, Z79.36.2, Z79.36.3, Z79.36.4
Table S2: Variables investigated.
1 ISS
2 ICU length of stay (h)
3 Duration of mechanical ventilation (h)
4 NEMS
5 Number of injured body regions
6 Number of surgeries
7 Number of operated body regions
8 Hospital death
9 Surgery lower limbs
10 Surgery thorax
11 Surgery pelvis
12 ORIF tibia
13 Fracture clavicle
14 Fracture femur
15 Fracture spine
16 Fracture pelvis/acetabulum
17 Fracture upper extremity
18 Fracture lower extremity
19 Fracture tibia
20 Fracture fibula
21 Fracture foot
22 Intra-abdominal injury
23 Psychiatric illness
24 Depressive disorder
ICU = intensive care unit; ISS = injury severity score; NEMS = nine equivalents of nursing manpower use score; ORIF = open reduction and internal fixation
Table S3: Univariate analysis of the correlation of predictive factors with average profit/deficit per DRG category for continuous variables. Profit/deficit based on caseweights from SwissDRG catalogue version 3.0, including supplemental payments. Correlation was analysed with Spearman’s rank correlation (ρ).
Total(n = 364)
Category 1:polytrauma DRGs(n = 166)
Category 2:ICU DRGs(n = 57)
Category 3:other DRGs(n = 141)
ρ p-value ρ p-value ρ p-value ρ p-valueISS 0.06 0.25 –0.06 0.46 –0.22 0.11 0.15 0.082
ICU length of stay (h) –0.04 0.47 0.12 0.17 –0.32 0.017 –0.63 <0.001
Duration of mechanicalventilation (h)
0.1 0.051 0.22 0.005 –0.19 0.15 –0.25 0.003
NEMS –0.01 0.86 0.11 0.16 –0.23 0.08 –0.58 <0.001
Number of injured body regions 0.02 0.72 –0.23 0.004 –0.11 0.42 –0.14 0.087
Number of surgical operations –0.16 0.002 –0.24 0.002 –0.31 0.02 –0.33 <0.001
Number of operated bodyregions
–0.06 0.27 –0.18 0.02 –0.06 0.65 –0.26 0.002
DRG = diagnosis-related group; ICU = intensive care unit; ISS = injury severity score; NEMS = nine equivalents of nursing manpower use score
Original article Swiss Med Wkly. 2016;146:w14334
Swiss Medical Weekly · PDF of the online version · www.smw.ch Page 9 of 13

Table S4: Univariate analysis of association of predictive factors with average profit/deficit per DRG category for nominal variables. Profit/deficit based on case weightsfrom SwissDRG catalogue version 3.0, including supplemental payments, given as mean (standard deviation). Association was analysed with the Mann-Whitney test.
Total(n = 364)
Category 1:polytrauma DRGs(n = 166)
Category 2:ICU DRGs(n = 57)
Category 3:Other DRGs(n = 141)
n Mean(SD)
p-value n Mean(SD)
p-value n Mean(SD)
p-value n Mean(SD)
p-value
No 270 –6572(38 877)
118 1737(36 916)
51 –9839(59 708)
101 –14 630(23 157)
Hospitaldeath
Yes 94 4551(22 664)
0.009
48 4365(24 531)
0.72
6 38 035(45 702)
0.045
40 –249(5973)
<0.001
No 319 –1250(30 030)
137 6307(26 124)
52 –1153(52 241)
130 –9253(17 302)
Surgerylower limbs
Yes 45 –21 065(60 438)
0.16
29 –15 503(54 698)
0.077
5 –42 734(116 113)
0.61
11 –25 881(44 180)
0.14
No 227 895(29 063)
75 11 890(26 463)
31 8426(54 125)
121 –7849(16 099)
Surgerythorax
Yes 137 –11 313(43 669)
0.006
91 –5244(37 130)
<0.001
26 –20 569(63 632)
0.055
20 –26 893(35 254)
<0.001
No 329 –2195(31 765)
148 3891(34 266)
46 3298(43 087)
135 –10 739(20 819)
Surgerypelvis
Yes 35 –17 845(60 456)
<0.001
18 –8964(27 345)
0.012
11 –38 667(100 908)
0.004
6 –6312(23 438)
0.94
No 347 –2367(34 558)
156 5624(29 429)
54 –5494(61 449)
137 –10 234(20 985)
ORIF tibia
Yes 17 –30 900(47 798)
0.001
10 –46 282(56 187)
<0.001
3 7693(13 792)
0.80
4 –21 390(13 735)
0.078
No 322 –5607(35 577)
137 691(34 745)
51 –9235(59 014)
134 –10 665(20 966)
Fractureclavicle
Yes 42 10 925(33 681)
0.036
29 11 031(27 535)
0.30
6 32 897(58 891)
0.21
7 –8350(20 181)
0.96
No 335 –2676(31 869)
142 4550(29 472)
54 –850(51 339)
139 –10 768(20 913)
Fracturefemur
Yes 29 –15 521(65 289)
0.64
24 –9647(51 651)
0.37
3 –75 900(150 501)
0.39
2 4566(11 080)
0.20
No 222 –1476(31 937)
80 6447(36 311)
38 266(48 557)
104 –8206(15 315)
Fracturespine
Yes 142 –7177(40 803)
0.84
86 –1177(30 945)
0.57
19 –14 931(78 470)
0.58
37 –17141(31 004)
0.39
No 292 –2312(30 632)
118 5109(32 901)
41 3448(42 310)
133 –10 671(20 896)
Fracturepelvis/acetabulum Yes 72 –9329
(51 332)
0.100
48 –3924(35 290)
0.060
16 –25 937(89 241)
0.007
8 –8549(21 618)
0.90
No 242 –3886(32 911)
92 6346(23 724)
39 –9479(61 011)
111 –10 402(21 910)
Fractureupperextremity Yes 122 –3329
(40 849)
0.84
74 –2288(42 795)
0.014
18 5338(57 827)
0.051
30 –11 099(16 735)
0.86
No 292 –1730(29 289)
122 7648(25 995)
46 –6517(50 088)
124 –9181(17 179)
Fracturelowerextremity Yes 72 –11 687
(54 076)
0.50
44 –11 784(46 753)
0.027
11 2382(93 490)
0.322
17 –20 541(37 677)
0.20
No 341 –1577(31 187)
151 5602(29 776)
53 –887(51 772)
137 –9757(17 437)
Fracture tibia
Yes 23 –35 169(70 052)
0.017
15 –28 757(52 689)
0.002
4 –56 648(129 173)
0.51
4 –37 735(74 270)
0.78
No 335 –1676(30 916)
148 5584(30 080)
52 –2616(50 709)
135 –9274(17 160)
Fracturefibula
Yes 29 –27 076(67 217)
0.035
18 –22 888(49 679)
0.005
5 –27 516(129 451)
0.89
6 –39 272(57 121)
0.21
No 345 –2487(30 554)
161 4216(30 940)
50 –5276(48 272)
134 –9500(17 250)
Fracture foot
Yes 19 –25 716(85 673)
0.35
5 –52 845(68 943)
0.042
7 –1400(120 227)
0.34
7 –30 654(55 361)
0.31
No 309 –2158(32 424)
125 3628(35 164)
49 4301(46 206)
135 –9860(20 032)
Intra-abdominalinjury Yes 55 –12 361
(49 870)
0.14
41 –952(29 152)
0.14
8 –60 542(99 718)
0.026
6 –26 077(33 647)
0.35
Original article Swiss Med Wkly. 2016;146:w14334
Swiss Medical Weekly · PDF of the online version · www.smw.ch Page 10 of 13
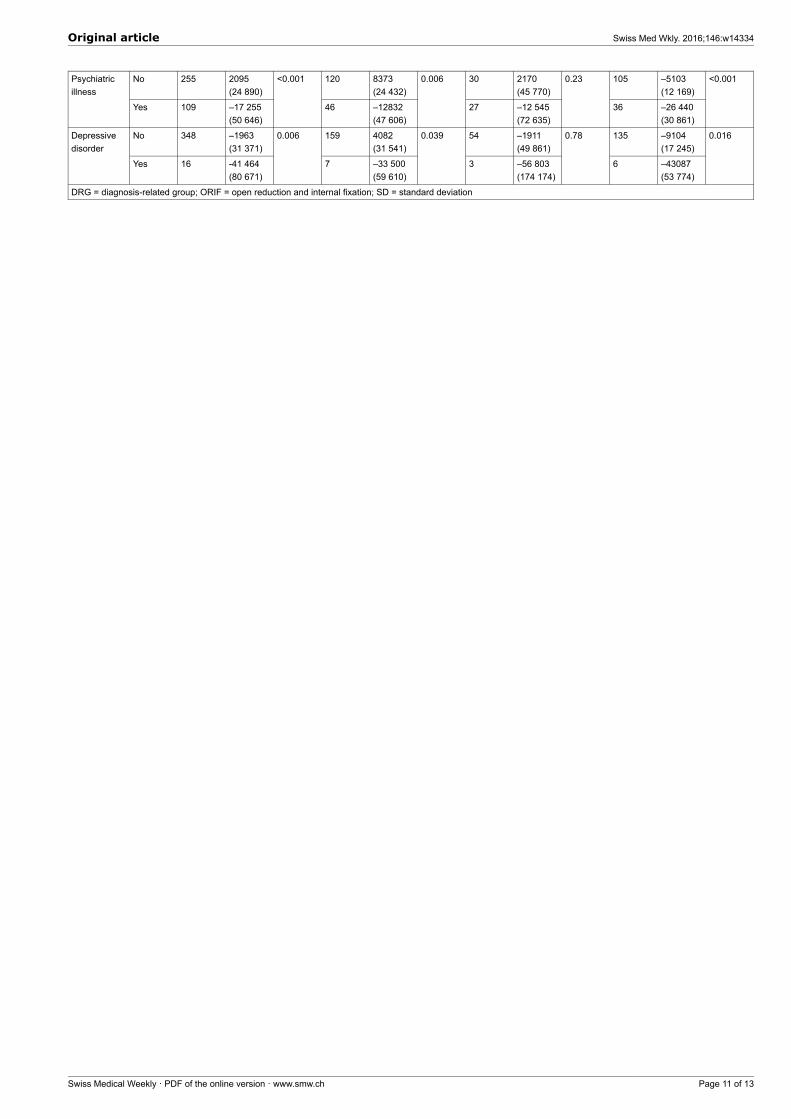
No 255 2095(24 890)
120 8373(24 432)
30 2170(45 770)
105 –5103(12 169)
Psychiatricillness
Yes 109 –17 255(50 646)
<0.001
46 –12832(47 606)
0.006
27 –12 545(72 635)
0.23
36 –26 440(30 861)
<0.001
No 348 –1963(31 371)
159 4082(31 541)
54 –1911(49 861)
135 –9104(17 245)
Depressivedisorder
Yes 16 -41 464(80 671)
0.006
7 –33 500(59 610)
0.039
3 –56 803(174 174)
0.78
6 –43087(53 774)
0.016
DRG = diagnosis-related group; ORIF = open reduction and internal fixation; SD = standard deviation
Original article Swiss Med Wkly. 2016;146:w14334
Swiss Medical Weekly · PDF of the online version · www.smw.ch Page 11 of 13
Figures (large format)
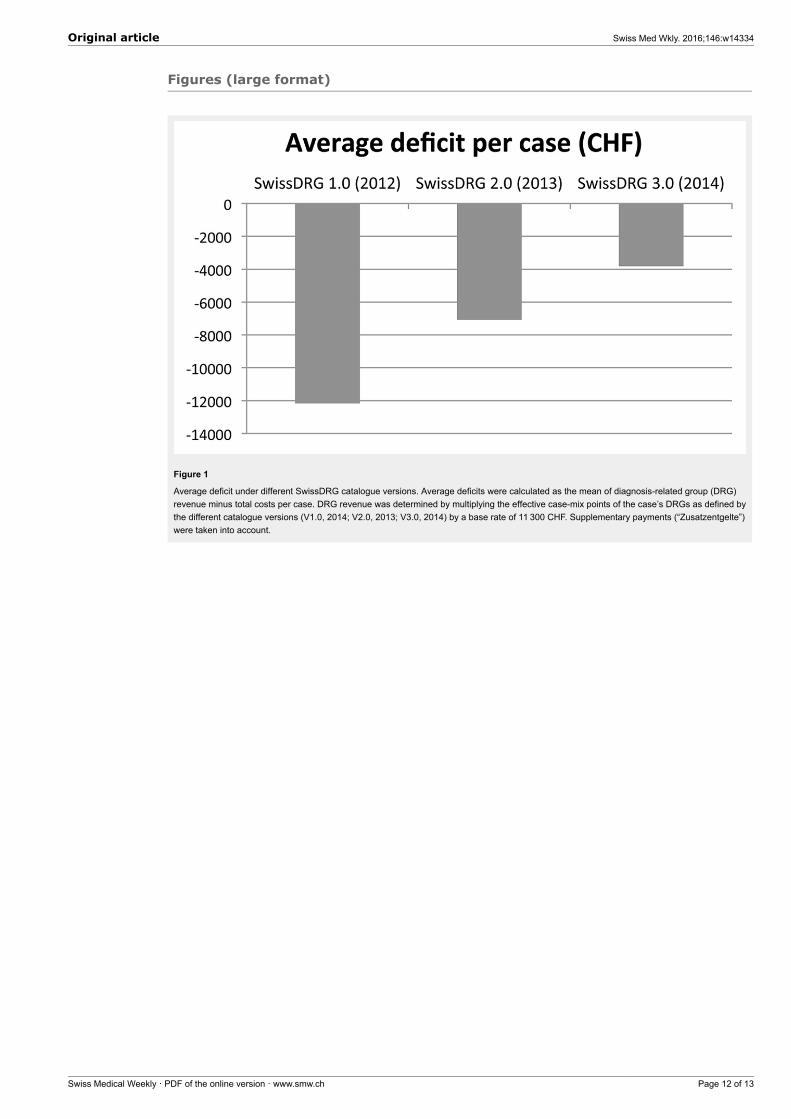
Figure 1
Average deficit under different SwissDRG catalogue versions. Average deficits were calculated as the mean of diagnosis-related group (DRG)revenue minus total costs per case. DRG revenue was determined by multiplying the effective case-mix points of the case’s DRGs as defined bythe different catalogue versions (V1.0, 2014; V2.0, 2013; V3.0, 2014) by a base rate of 11 300 CHF. Supplementary payments (“Zusatzentgelte”)were taken into account.
Original article Swiss Med Wkly. 2016;146:w14334
Swiss Medical Weekly · PDF of the online version · www.smw.ch Page 12 of 13

Figure 2
Proportions of DRG inliers (< Swiss ALOS and > Swiss ALOS), DRGs with fixed LOS and outliers (low and high outlier) according to length ofstay and definition of low and high trim points for outlier under SwissDRG Versions 1.0, 2.0 and 3.0 respectively.ALOS = average length of stay; LOS = length of stay
Original article Swiss Med Wkly. 2016;146:w14334
Swiss Medical Weekly · PDF of the online version · www.smw.ch Page 13 of 13