reinforcement learning for quantitative trading
TRANSCRIPT

Reinforcement Learning forQuantitative Trading
SHUO SUN, Nanyang Technological University, Singapore
RUNDONGWANG, Nanyang Technological University, Singapore
BO AN, Nanyang Technological University, Singapore
Quantitative trading (QT), which refers to the usage of mathematical models and data-driven techniques in analyzing the financialmarket, has been a popular topic in both academia and financial industry since 1970s. In the last decade, reinforcement learning (RL)has garnered significant interest in many domains such as robotics and video games, owing to its outstanding ability on solvingcomplex sequential decision making problems. RL’s impact is pervasive, recently demonstrating its ability to conquer many challengingQT tasks. It is a flourishing research direction to explore RL techniques’ potential on QT tasks. This paper aims at providing acomprehensive survey of research efforts on RL-based methods for QT tasks. More concretely, we devise a taxonomy of RL-basedQT models, along with a comprehensive summary of the state of the art. Finally, we discuss current challenges and propose futureresearch directions in this exciting field.
CCS Concepts: • Information systems → Expert systems.
Additional Key Words and Phrases: reinforcement learning, quantitative finance, survey
ACM Reference Format:Shuo Sun, Rundong Wang, and Bo An. 2021. Reinforcement Learning for Quantitative Trading. 1, 1 (September 2021), 26 pages.https://doi.org/10.1145/1122445.1122456
1 INTRODUCTION
Quantitative trading has been a lasting research area at the intersection of finance and computer science for manydecades. In general, QT research can be divided into two directions. In the finance community, designing theoriesand models to understand and explain the financial market is the main focus. The famous capital asset pricing model(CAPM) [103], Markowitz portfolio theory [82] and Fama & French factor model [35] are a few representative examples.On the other hand, computer scientists apply data-driven ML techniques to analyze financial data [29, 94]. Recently,deep learning becomes an appealing approach owing to not only its stellar performance but also to the attractiveproperty of learning meaningful representations from scratch.
RL is an emerging subfield of ML, which provides a mathematical formulation of learning-based control. With theusage of RL, we can train agents with near-optimal behaviour policy through optimizing task-specific reward functions[112]. In the last decade, we have witnessed many significant artificial intelligence (AI) milestones achieved by RLapproaches in domains such as Go [107], video games [83] and robotics [69]. RL-based methods also have achieved
Authors’ addresses: Shuo Sun, Nanyang Technological University, Singapore, [email protected]; Rundong Wang, Nanyang Technological University,Singapore, [email protected]; Bo An, Nanyang Technological University, Singapore, [email protected].
Permission to make digital or hard copies of all or part of this work for personal or classroom use is granted without fee provided that copies are notmade or distributed for profit or commercial advantage and that copies bear this notice and the full citation on the first page. Copyrights for componentsof this work owned by others than ACM must be honored. Abstracting with credit is permitted. To copy otherwise, or republish, to post on servers or toredistribute to lists, requires prior specific permission and/or a fee. Request permissions from [email protected].© 2021 Association for Computing Machinery.Manuscript submitted to ACM
Manuscript submitted to ACM 1
arX
iv:2
109.
1385
1v1
[cs
.LG
] 2
8 Se
p 20
21

2 Sun et al.
state-of-the-art performance on many QT tasks such as algorithmic trading (AT) [80], portfolio management [123], orderexecution [37] and market making [109]. It is a promising research direction to address QT tasks with RL techniques.
1.1 Why Reinforcement Learning forQuantitative Trading?
In general, the overall objective of QT tasks is to maximize long-term profit under certain risk tolerance. Specifically,algorithmic tradingmakes profit through consistently buying and selling one given financial asset; Portfolio managementtries to maintain a well-balanced portfolio with multiple financial assets; Order execution aims at fulfilling a specifictrading order with minimum execution cost; Market making provides liquidity to the market and makes profit fromthe tiny price spread between buy and sell orders. Traditional QT strategies [57, 87, 95] discover trading opportunitiesbased on heuristic rules. Finance expert knowledge is incorporated to capture the underlying pattern of the financialmarket. However, rule-based methods exhibit poor generalization ability and only perform well in certain marketconditions [27]. Another paradigm is to trade based on financial prediction. In the literature, there are also attemptsusing supervised learning methods such as linear models [3, 9], tree-based models [63, 64] and deep neural networks[28, 101] for financial prediction. Nevertheless, the high volatility and noisy nature of the financial market make itextremely hard to predict future price accurately [34]. In addition, there is an unignorable gap between predictionsignals and profitable trading actions. Thus, the overall performance of prediction-based methods is not satisfying aswell.
To design profitable QT strategies, the advantages of RL methods are four-fold: (i) RL allows training an end-to-end agent, which takes available market information as input state and output trading actions directly. (ii) RL-basedmethods bypass the extremely difficult task to predict future price and optimize overall profit directly. (iii) Task-specificconstraints (e.g., transaction cost and slippage) can be imported into RL objectives easily. (iv) RL methods have thepotential to generalize to any market condition.
1.2 Difference from Existing Surveys
To the best of our knowledge, this survey will be the first comprehensive survey on RL-based QT applications. Althoughthere are some existing works trying to explore the usage of RL techniques in QT tasks, none of them has provided anin-depth taxonomy of existing works, analyzed current challenges of this research field or proposed future directions inthis area. The goal of this survey is to provide a summary of existing RL-based methods for QT applications from bothRL algorithm perspective and application domain perspective, to analyze current status of this field, and to point outfuture research directions.
A number of survey papers on ML in finance have been presented in recent years. For example, Rundo et al. [97]proposed a brief survey on ML for QT. Emerson et al. [33] focused on the trend and applications. Bahrammirzaee[4] introduced many hybrid methods in financial applications. Gai et al. [40] proposed a review of Fintech from bothML and general perspectives. Zhang and Zhou [140] discussed about data mining approaches in Fintech. Chalup andMitschele [17] discussed about kernel methods in financial applications. Agent-based computational finance is thefocus of [115]. There are also many surveys on deep learning for finance. Wong and Selvi [128] covered early works.Sezer et al. [102] was a recent survey paper with a focus on financial time series forecasting. Ozbayoglu et al. [92] madea survey on the development of DL in financial applications. Fischer [39] presented a brief review of RL methods in thefinancial market.
Manuscript submitted to ACM
Reinforcement Learning for Quantitative Trading 3
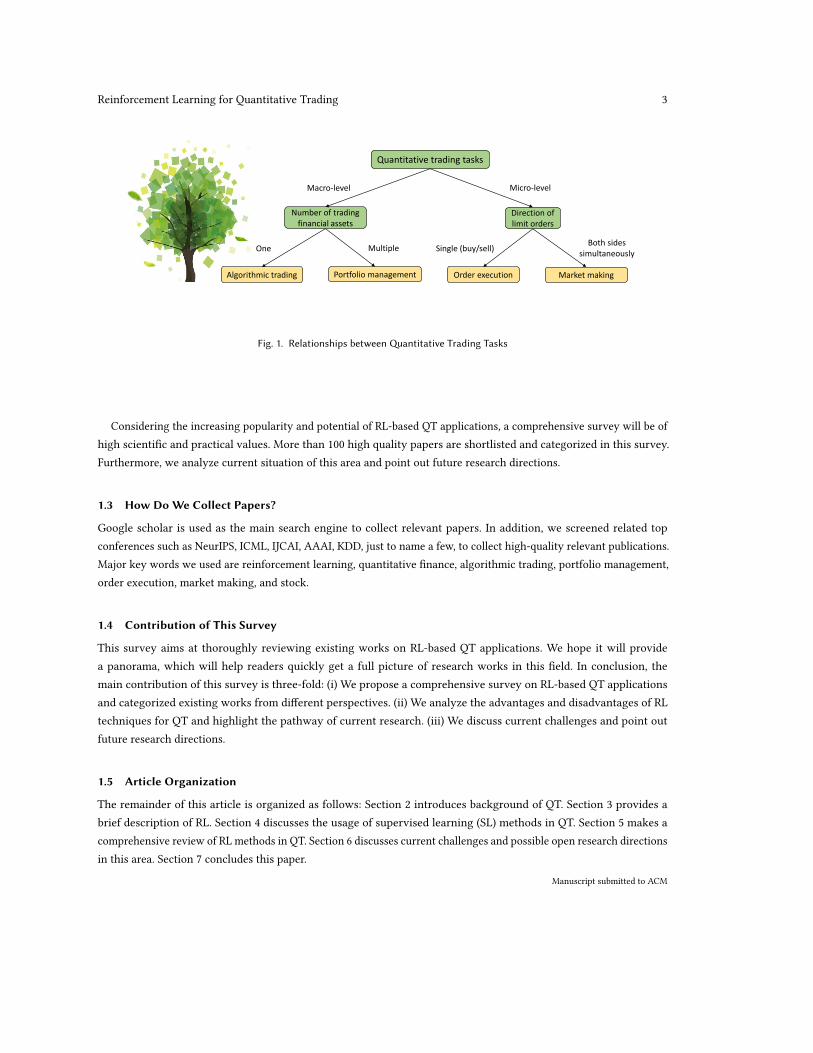
Quantitative trading tasks
Number of trading financial assets
Direction of limit orders
Algorithmic trading Portfolio management Order execution Market making
Macro-level Micro-level
One Multiple Single (buy/sell)Both sides
simultaneously
Fig. 1. Relationships betweenQuantitative Trading Tasks
Considering the increasing popularity and potential of RL-based QT applications, a comprehensive survey will be ofhigh scientific and practical values. More than 100 high quality papers are shortlisted and categorized in this survey.Furthermore, we analyze current situation of this area and point out future research directions.
1.3 How DoWe Collect Papers?
Google scholar is used as the main search engine to collect relevant papers. In addition, we screened related topconferences such as NeurIPS, ICML, IJCAI, AAAI, KDD, just to name a few, to collect high-quality relevant publications.Major key words we used are reinforcement learning, quantitative finance, algorithmic trading, portfolio management,order execution, market making, and stock.
1.4 Contribution of This Survey
This survey aims at thoroughly reviewing existing works on RL-based QT applications. We hope it will providea panorama, which will help readers quickly get a full picture of research works in this field. In conclusion, themain contribution of this survey is three-fold: (i) We propose a comprehensive survey on RL-based QT applicationsand categorized existing works from different perspectives. (ii) We analyze the advantages and disadvantages of RLtechniques for QT and highlight the pathway of current research. (iii) We discuss current challenges and point outfuture research directions.
1.5 Article Organization
The remainder of this article is organized as follows: Section 2 introduces background of QT. Section 3 provides abrief description of RL. Section 4 discusses the usage of supervised learning (SL) methods in QT. Section 5 makes acomprehensive review of RL methods in QT. Section 6 discusses current challenges and possible open research directionsin this area. Section 7 concludes this paper.
Manuscript submitted to ACM

4 Sun et al.
2 QUANTITATIVE TRADING BACKGROUND
Before diving into details of this survey, we introduce background knowledge of QT in this section. Relationshipsbetween different QT tasks are illustrated in Fig. 1. We propose an overview and then introduce mainstream QT tasksin details respectively. A summary of notations is illustrated in Table. 1.
Notation Descriptionℎ length of a holding periodp𝑖 the time series vector of asset 𝑖’s price𝑝𝑖,𝑡 the price of asset 𝑖 at time 𝑡𝑝 ′𝑖,𝑡
the price of asset 𝑖 after a holding period ℎ from time 𝑡𝑝𝑡 the price of a single asset at time 𝑡𝑠𝑡 position of an asset at time 𝑡𝑢𝑖𝑡 trading volume of asset 𝑖 at time 𝑡n the time series vector of net value𝑛𝑡 net value at time 𝑡𝑛′𝑡 net value after a holding period ℎ from time 𝑡𝑤𝑖𝑡 portfolio weight of asset 𝑖 at time 𝑡wt portfolio vector at time 𝑡w′t portfolio vector after a holding period ℎ from time 𝑡
𝑣𝑡 portfolio value at time 𝑡𝑣 ′𝑡 portfolio value after a holding period ℎ from time 𝑡𝑓 𝑖𝑡 transaction fee for asset 𝑖 at time 𝑡b transaction fee rate𝑞 the quantity of a limit order𝑄 total quantity required to be executedr the time series vector of return rate𝑟𝑡 return rate at time 𝑡
Table 1. A Summary of Notations
2.1 Overview
The financial market, an ecosystem involving transactions between businesses and investors, observed a marketcapitalization exceeding $80 trillion globally as of the year 2019.1 For many countries, the financial industry hasbecome a paramount pillar, which spawns the birth of many financial centres. The International Monetary Fund (IMF)categorizes financial centres as follows: international financial centres, such as New York, London and Tokyo; regionalfinancial centres, such as Shanghai, Shenzhen and Sydney; offshore financial centres, such as Hong Kong, Singaporeand Dublin. At the core of financial centres, trading exchanges,where trading activities involving trillions of dollarstake place everyday, are formed. Trading exchanges can be divided as stock exchanges such as NYSE, Nasdaq andEuronext, derivatives exchanges such as CME and cryptocurrency exchanges such as Coinbase and Huobi. Participantsin the financial market can be generally categorized as financial intermediaries (e.g., banks and brokers), issuers (e.g.,companies and governments), institutional investors (e.g., investment managers and hedge funds) and individualinvestors. With the development of electronic trading platform, quantitative trading, which has been demonstrated quite
1https://data.worldbank.org/indicator/CM.MKT.LCAP.CD/
Manuscript submitted to ACM
Reinforcement Learning for Quantitative Trading 5
profitable by many leading trading companies (e.g., Renaissance2, Two Sigma3, Cithadel4, D.E. Shaw5), is becoming adominating trading style in the global financial markets. In 2020, quantitative trading accounts for over 70% and 40%trading volume in developed market (e.g., US and Europe) and emerging market (e.g., China and India) respectively. 6
We introduce some basic QT concepts as follows:
• Financial Asset. A financial asset refers to a liquid asset, which can be converted into cash immediately duringtrading time. Classic financial assets include stocks, futures, bonds, foreign exchanges and cryptocurrencies.
• Holding Period. Holding period ℎ refers to the time period where traders just hold the financial assets withoutany buying or selling actions.
• Asset Price. The price of a financial asset 𝑖 is defined as a time series pi = {pi,1, pi,2, pi,3, ..., pi,t }, where 𝑝𝑖,𝑡denotes the price of asset 𝑖 at time 𝑡 . 𝑝 ′
𝑖,𝑡is the price of asset 𝑖 after a holding period ℎ from time 𝑡 . 𝑝𝑡 is used to
denote the price at time 𝑡 when there is only one financial asset.• OHLC. OHLC is the abbreviation of open price, high price, low price and close price. The candle stick, which isconsisted of OHLC, is widely used to analyze the financial market.
• Volume. Volume is the amount of a financial asset that changes hands. 𝑢𝑖𝑡 is the trading volume of asset 𝑖 attime 𝑡 .
• Technical Indicator. A technical indicator indicates a feature calculated by a formulaic combination of OHLCand volume. Technical indicators are usually designed by finance experts to uncover the underlying pattern ofthe financial market.
• Return Rate. Return rate is the percentage change of capital, where 𝑟𝑡 = (𝑝𝑡+1 − 𝑝𝑡 )/𝑝𝑡 denotes the returnrate at time 𝑡 . The time series of return rate is denoted as r = (𝑟1, 𝑟2, ..., 𝑟𝑡 ).
• Transaction Fee. Transaction fee is the expenses incurred during trading financial assets: 𝑓 𝑖𝑡 = 𝑝𝑖,𝑡 × 𝑢𝑖𝑡 × b ,where b is the transaction fee rate.
• Liquidity. Liquidity refers to the efficiency with which a financial asset can be converted into cash withouthaving an evident impact on its market price. Cash itself is the asset with the most liquidity.
Trading Style Time Frame Holding PeriodPosition trading Long term Months to yearsSwing trading Medium term Days to weeksDay trading Short term Within a trading dayScalping trading Short term Seconds to minutesHigh-frequency trading Extreme short term Milliseconds to seconds
Table 2. A Summary of Algorithmic Trading Styles
2.2 Algorithmic Trading
Algorithmic trading (AT) refers to the process that traders consistently buy and sell one given financial asset to makeprofit. It is widely applied in trading stocks, commodity futures and foreign exchanges. For AT, time is splitted as
2https://www.rentec.com/3https://www.twosigma.com/4https://www.citadel.com/5https://www.deshaw.com/6https://therobusttrader.com/what-percentage-of-trading-is-algorithmic/
Manuscript submitted to ACM

6 Sun et al.
discrete time steps. At the beginning of a trading period, traders are allocated some cash and set net value as 1. Then, ateach time step 𝑡 , traders have the options to buy, hold or sell some amount of shares for changing positions. Net valueand position is used to represent traders’ status at each time step. The objective of AT is to maximize the final net valueat the end of the trading period. Based on trading styles, algorithmic trading is generally divide 5 categories: positiontrading, swing trading, day trading, scalp trading and high-frequency trading. Specifically, position trading involvesholding the financial asset for a long period of time, which is unconcerned with short-term market fluctuations and onlyfocuses on the overarching market trend. Swing trading is a medium-term style that holds financial assets for severaldays or weeks. The goal of swing trading is to spot a trend and then capitalise on dips and peaks that provide entrypoints. Day trading tries to capture the fleeting intraday pattern in the financial market and all positions will be closedat the end of the day to avoid overnight risk. Scalping trading aims at discovering micro-level trading opportunitiesand makes profit by holding financial assets for only a few minutes. High-frequency trading is a type of trading stylecharacterized by high speeds, high turnover rates, and high order-to-trade. A summary of different trading styles isillustrated in Table. 2.
Traditional AT methods discover trading signals based on technical indicators or mathematical models. Buy andHold (BAH) strategy, which invests all capital at the beginning and holds until the end of the trading period, is proposedto reflect the average market condition. Momentum strategies, which assumes the trend of financial assets in the pasthas the tendency to continue in the future, are another well-known AT strategies. Buying-Winner-Selling-Loser [57],Times Series Momentum [87] and Cross Sectional Momentum [18] are three classic momentum strategies. In contrast,mean reversion strategies such as Bollinger bands [12] assume the price of financial assets will finally revert to thelong-term mean. Although traditional methods somehow capture the underlying patterns of the financial market, thesesimple rule-based methods exhibit limited generalization ability among different market conditions. We introduce somebasic AT concepts as follows:
• Position. Position 𝑠𝑡 is the amount of a financial asset owned by traders at time 𝑡 . It represents a long (short)position when 𝑠𝑡 is positive (negative).
• Long Position. Long position makes positive profit when the price of the asset increases. For long tradingactions, which buy a financial asset 𝑖 at time 𝑡 first and then sell it at 𝑡 + 1, the profit is 𝑢𝑖𝑡 (𝑝𝑖,𝑡+1 − 𝑝𝑖,𝑡 ), where 𝑢𝑖𝑡is the buying volume of asset 𝑖 at time 𝑡 .
• Short Position. Short position makes positive profit when the price of the asset decreases. For short tradingactions, which buys a financial asset at time 𝑡 first and then sell it at 𝑡 + 1, the profit is 𝑢𝑖𝑡 (𝑝𝑖,𝑡 − 𝑝𝑖,𝑡+1).
• Net Value. Net value represents a fund’s per share value. It is defined as a time series n = {𝑛1, 𝑛2, ..., 𝑛𝑡 }, where𝑛𝑡 denotes the net value at time 𝑡 . The initial net value is always set to 1.
2.3 Portfolio Management
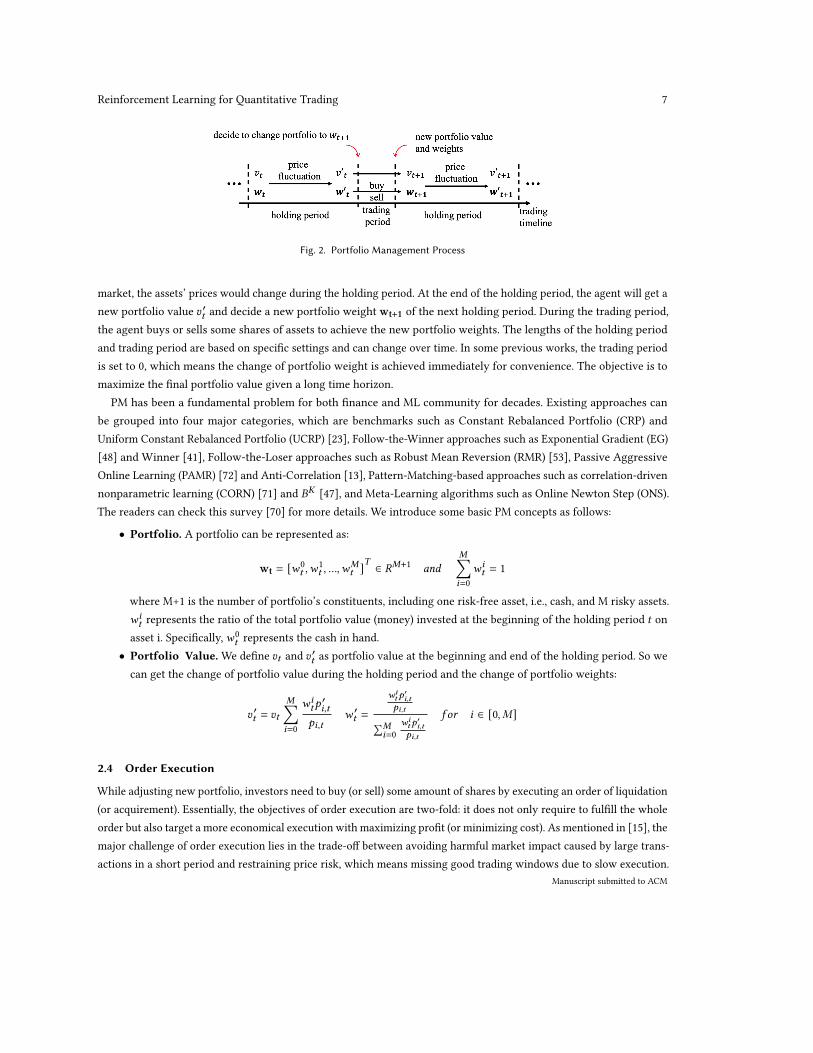
Portfolio management (PM) is a fundamental QT task, where investors hold a number of financial assets and reallocatethem periodically to maximize long-term profit. In the literature, it is also called portfolio optimization, portfolioselection and portfolio allocation. In the real market, portfolio managers work closely with traders, where portfoliomanagers assign a percentage weighting to every stock in the portfolio periodically and traders focus on finishingportfolio reallocation at the favorable price to minimize the trading cost. For PM, time is splitted into two types ofperiods: holding period and trading period as shown in Figure 2. At the beginning of a holding period, the agent holds aportfolio wt consists of pre-selected financial assets with a corresponding portfolio value 𝑣𝑡 . With the fluctuation of theManuscript submitted to ACM
Reinforcement Learning for Quantitative Trading 7
Fig. 2. Portfolio Management Process
market, the assets’ prices would change during the holding period. At the end of the holding period, the agent will get anew portfolio value 𝑣 ′𝑡 and decide a new portfolio weight wt+1 of the next holding period. During the trading period,the agent buys or sells some shares of assets to achieve the new portfolio weights. The lengths of the holding periodand trading period are based on specific settings and can change over time. In some previous works, the trading periodis set to 0, which means the change of portfolio weight is achieved immediately for convenience. The objective is tomaximize the final portfolio value given a long time horizon.
PM has been a fundamental problem for both finance and ML community for decades. Existing approaches canbe grouped into four major categories, which are benchmarks such as Constant Rebalanced Portfolio (CRP) andUniform Constant Rebalanced Portfolio (UCRP) [23], Follow-the-Winner approaches such as Exponential Gradient (EG)[48] and Winner [41], Follow-the-Loser approaches such as Robust Mean Reversion (RMR) [53], Passive AggressiveOnline Learning (PAMR) [72] and Anti-Correlation [13], Pattern-Matching-based approaches such as correlation-drivennonparametric learning (CORN) [71] and 𝐵𝐾 [47], and Meta-Learning algorithms such as Online Newton Step (ONS).The readers can check this survey [70] for more details. We introduce some basic PM concepts as follows:
• Portfolio. A portfolio can be represented as:
wt = [𝑤0𝑡 ,𝑤
1𝑡 , ...,𝑤
𝑀𝑡 ]𝑇 ∈ 𝑅𝑀+1 𝑎𝑛𝑑
𝑀∑︁𝑖=0
𝑤𝑖𝑡 = 1
where M+1 is the number of portfolio’s constituents, including one risk-free asset, i.e., cash, and M risky assets.𝑤𝑖𝑡 represents the ratio of the total portfolio value (money) invested at the beginning of the holding period 𝑡 onasset i. Specifically,𝑤0
𝑡 represents the cash in hand.• Portfolio Value.We define 𝑣𝑡 and 𝑣 ′𝑡 as portfolio value at the beginning and end of the holding period. So wecan get the change of portfolio value during the holding period and the change of portfolio weights:
𝑣 ′𝑡 = 𝑣𝑡
𝑀∑︁𝑖=0
𝑤𝑖𝑡𝑝′𝑖,𝑡
𝑝𝑖,𝑡𝑤 ′𝑡 =
𝑤𝑖𝑡𝑝
′𝑖,𝑡
𝑝𝑖,𝑡∑𝑀𝑖=0
𝑤𝑖𝑡𝑝
′𝑖,𝑡
𝑝𝑖,𝑡
𝑓 𝑜𝑟 𝑖 ∈ [0, 𝑀]
2.4 Order Execution
While adjusting new portfolio, investors need to buy (or sell) some amount of shares by executing an order of liquidation(or acquirement). Essentially, the objectives of order execution are two-fold: it does not only require to fulfill the wholeorder but also target a more economical execution with maximizing profit (or minimizing cost). As mentioned in [15], themajor challenge of order execution lies in the trade-off between avoiding harmful market impact caused by large trans-actions in a short period and restraining price risk, which means missing good trading windows due to slow execution.
Manuscript submitted to ACM
8 Sun et al.
Traditional OE solutions are usually designed based on some stringent assumptions of the market and then derive somemodel-based methods with stochastic control theory. For instance, Time Weighted Average Price (TWAP) evenly splitsthe whole order and execute at each time step with the assumption that the market price follows the Brownianmotion [8].
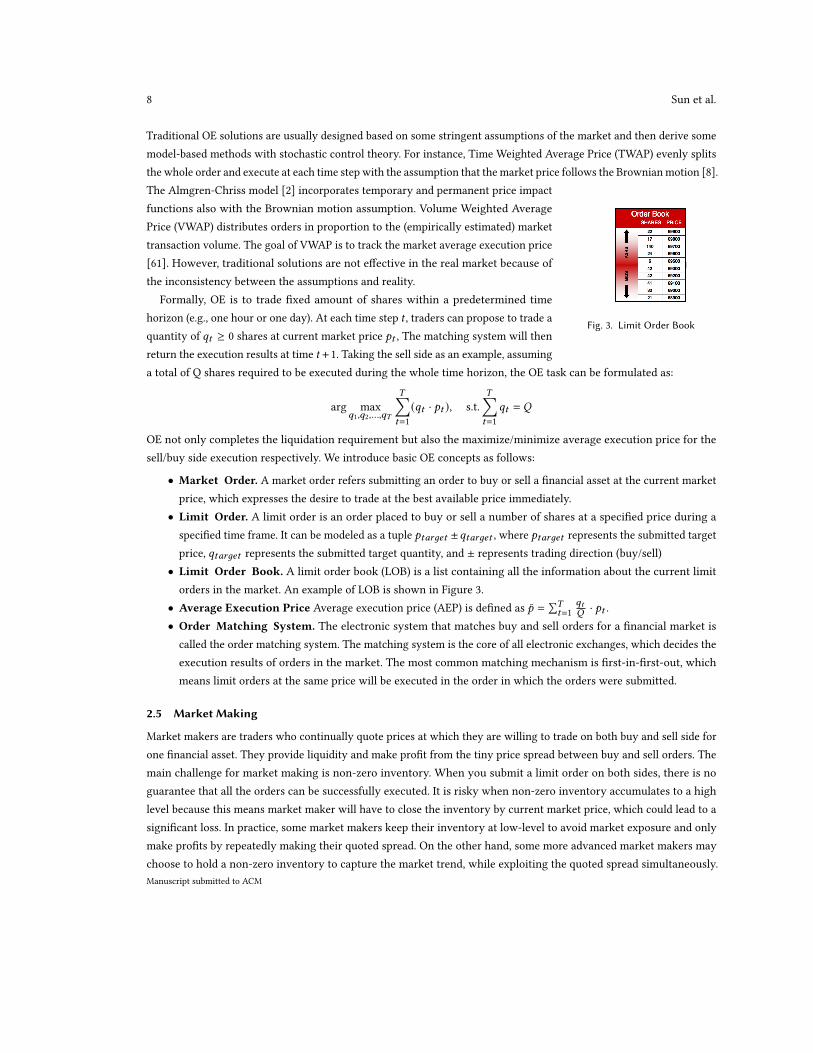
Fig. 3. Limit Order Book
The Almgren-Chriss model [2] incorporates temporary and permanent price impactfunctions also with the Brownian motion assumption. Volume Weighted AveragePrice (VWAP) distributes orders in proportion to the (empirically estimated) markettransaction volume. The goal of VWAP is to track the market average execution price[61]. However, traditional solutions are not effective in the real market because ofthe inconsistency between the assumptions and reality.
Formally, OE is to trade fixed amount of shares within a predetermined timehorizon (e.g., one hour or one day). At each time step 𝑡 , traders can propose to trade aquantity of 𝑞𝑡 ≥ 0 shares at current market price 𝑝𝑡 , The matching system will thenreturn the execution results at time 𝑡 + 1. Taking the sell side as an example, assuminga total of Q shares required to be executed during the whole time horizon, the OE task can be formulated as:
arg max𝑞1,𝑞2,...,𝑞𝑇
𝑇∑︁𝑡=1
(𝑞𝑡 · 𝑝𝑡 ), s.t.𝑇∑︁𝑡=1
𝑞𝑡 = 𝑄
OE not only completes the liquidation requirement but also the maximize/minimize average execution price for thesell/buy side execution respectively. We introduce basic OE concepts as follows:
• Market Order. A market order refers submitting an order to buy or sell a financial asset at the current marketprice, which expresses the desire to trade at the best available price immediately.
• Limit Order. A limit order is an order placed to buy or sell a number of shares at a specified price during aspecified time frame. It can be modeled as a tuple 𝑝𝑡𝑎𝑟𝑔𝑒𝑡 ±𝑞𝑡𝑎𝑟𝑔𝑒𝑡 , where 𝑝𝑡𝑎𝑟𝑔𝑒𝑡 represents the submitted targetprice, 𝑞𝑡𝑎𝑟𝑔𝑒𝑡 represents the submitted target quantity, and ± represents trading direction (buy/sell)
• Limit Order Book. A limit order book (LOB) is a list containing all the information about the current limitorders in the market. An example of LOB is shown in Figure 3.
• Average Execution Price Average execution price (AEP) is defined as 𝑝 =∑𝑇𝑡=1
𝑞𝑡𝑄
· 𝑝𝑡 .• Order Matching System. The electronic system that matches buy and sell orders for a financial market iscalled the order matching system. The matching system is the core of all electronic exchanges, which decides theexecution results of orders in the market. The most common matching mechanism is first-in-first-out, whichmeans limit orders at the same price will be executed in the order in which the orders were submitted.
2.5 Market Making
Market makers are traders who continually quote prices at which they are willing to trade on both buy and sell side forone financial asset. They provide liquidity and make profit from the tiny price spread between buy and sell orders. Themain challenge for market making is non-zero inventory. When you submit a limit order on both sides, there is noguarantee that all the orders can be successfully executed. It is risky when non-zero inventory accumulates to a highlevel because this means market maker will have to close the inventory by current market price, which could lead to asignificant loss. In practice, some market makers keep their inventory at low-level to avoid market exposure and onlymake profits by repeatedly making their quoted spread. On the other hand, some more advanced market makers maychoose to hold a non-zero inventory to capture the market trend, while exploiting the quoted spread simultaneously.Manuscript submitted to ACM

Reinforcement Learning for Quantitative Trading 9
Traditional finance methods consider market making as a stochastic optimal control problem [16]. Agent-based method[43] and RL [109] have also been applied to market making.
2.6 Evaluation Metrics
In this subsection, we discuss common profit metrics, risk metrics and risk-adjusted metrics for evaluation in this field.
2.6.1 Profit Metrics.
• Profit rate (PR). PR is the percent change of net value over time horizon ℎ. The formal definition is:
𝑃𝑅 = (𝑛𝑡+ℎ − 𝑛𝑡 )/𝑛𝑡
• Win rate (WR). WR evaluates the proportion of trading days with positive profit among all trading days.
2.6.2 Risk Metrics.
• Volatility (VOL). VOL is the variance of the return vector r. It is widely used to measure the uncertainty ofreturn rate and reflects the risk level of strategies. The formal definition is:
𝑉𝑂𝐿 = 𝜎 [r]
• Maximum drawdown (MDD). MDD [81] measures the largest decline from the peak in the whole tradingperiod to show the worst case. The formal definition is:
𝑀𝐷𝐷 = max𝜏 ∈(0,𝑡 )
[ max𝑡 ∈(0,𝜏)
𝑛𝑡 − 𝑛𝜏
𝑛𝑡]
• Downside deviation (DD). DD refers to the standard deviation of trade returns that are negative.• Gain-loss ratio (GLR). GLR is a downside risk measure. It represents the relative relationship of trades with apositive return and trades with a negative return. The formula is:
𝐺𝐿𝑅 =E[r|r > 0]E[−r|r < 0]
2.6.3 Risk-adjusted Metrics.
• Sharpe ratio (SR). SR [104] is a risk-adjusted profit measure, which refers to the return per unit of deviation:
𝑆𝑅 =E[r]𝜎 [r]
• Sortino ratio (SoR). SoR is a variant of risk-adjusted profit measure, which applies DD as risk measure:
𝑆𝑜𝑅 =E[r]𝐷𝐷
• Calmar ratio (CR). CR is another variant of risk-adjusted profit measure, which applies MDD as risk measure:
𝐶𝑅 =E[r]𝑀𝐷𝐷
3 OVERVIEW OF REINFORCEMENT LEARNING
RL is a popular subfield of ML that studies complex decision making problems. Sutton and Barto [112] distinguishRL problems by three key characteristics: (i) the problem is closed-loop. (ii) the agent figures out what to do throughtrial-and-error. (iii) actions have an impact on both short term and long term results. The decision maker is called agent
Manuscript submitted to ACM

10 Sun et al.
and the environment is everything else except the agent. At each time step, the agent obtains some observations of theenvironment, which is called state. Later on, the agent takes an action based on the current state. The environment willthen return a reward and a new state to the agent. Formally, an RL problem is typically formulated as a Markov decisionprocess (MDP) in the form of a tuple M = (𝑆,𝐴, 𝑅, 𝑃,𝛾), where 𝑆 is a set of states 𝑠 ∈ 𝑆 , 𝐴 is a set of actions 𝑎 ∈ 𝐴, 𝑅 isthe reward function, 𝑃 is the transition probability, and 𝛾 is the discount factor. The goal of an RL agent is to find apolicy 𝜋 (𝑎 | 𝑠) that takes action 𝑎 ∈ 𝐴 in state 𝑠 ∈ 𝑆 in order to maximize the expected discounted cumulative reward:
max E[𝑅(𝜏)], 𝑤ℎ𝑒𝑟𝑒 𝑅(𝜏) =𝜏∑︁𝑡=0
𝛾𝑡𝑟 (𝑎𝑡 , 𝑠𝑡 ) 𝑎𝑛𝑑 0 ≤ 𝛾 ≤ 1
Sutton and Barto [112] summarise RL’s main components as: (i) policy, which refers to the probability of taking action𝑎 when the agent is in state 𝑠 . From policy perspective, RL algorithms are categorized into on-policy and off-policymethods. The goal of on-policy RL methods is to evaluate or improve the policy, which they are now using to makedecisions. As for off-policy RL methods, they aim at improving or evaluating the policy that is different from the oneused to generate data. (ii) reward: after taking selected actions, the environment sends back a numerical signal rewardto inform the agent how good or bad are the actions selected. (iii) value function, which means the expected return ifthe agent starts in that state 𝑠 or state-action pair (𝑠, 𝑎), and then acts according to a particular policy 𝜋 consistently.Value function tells how good or bad your current position is in the long run. (iv) model, which is an inference aboutthe behaviour of the environment in different states.
Plenty of algorithms have been proposed to solve RL problems. Tabular methods and approximation methods aretwo mainstream directions. For tabular algorithms, a table is used to represent the value function for every actionand state pair. The exact optimal policy can be found through checking the table. Due to the curse of dimensionality,tabular methods only work well when the action and state space is small. Dynamic programming (DP), Monto Carlo(MC) and temporal difference (TD) are a few widely studied tabular methods. Under perfect model of environmentassumption, DP uses a value function to search for good policies. Policy iteration and value iteration are two classic DPalgorithms. MC methods try to learn good policies through sample sequences of states, actions, and reward from theenvironment. For MC methods, the assumption of perfect environment understanding is not required. TD methods area combination of DP and MC methods. While they do not need a model from the environment, they can bootstrap,which is the ability to update estimates based on other estimates. From this family, Q-learning [125] and SARSA [96]are popular algorithms, which belong to off-policy and on-policy methods respectively.
On the other hand, approximation methods try to find a great approximate function with limited computation.Learning to generalize from previous experiences (already seen states) to unseen states is a reasonable direction.Policy gradient methods are popular approximate solutions. REINFORCE [126] and actor-critic [65] are two importantexamples. With the popularity of deep learning, RL researchers use neural networks as function approximator. DRL isthe combination of DL and RL, which lead to great success in many domains [83, 118]. Popular DRL algorithms for QTcommunity include deep Q-network (DQN) [83], deterministic policy gradient (DPG) [108], deep deterministic policygradient (DDPG) [75], proximal policy optimization (PPO) [100]. More details for RL can be found in [112]. Recurrentreinforcement learning (RRL) is another widely used RL approach for QT. "Recurrent" means the previous output is fedinto the model as part of the input here. RRL achieves more stable performance when exposed to noisy data such asfinancial data.
Manuscript submitted to ACM
Reinforcement Learning for Quantitative Trading 11
4 SUPERVISED LEARNING FOR QUANTITATIVE TRADING
Supervised learning techniques have been widely used in the pipeline of QT research. In this section, we propose abrief review of research efforts on supervised learning for QT. We introduce existing works from three perspectives:feature engineering, financial forecasting and enhancing traditional methods with ML.
4.1 Feature Engineering
Discovering a series of high-quality features is the foundation of ML algorithms’ success. In QT, features, which havethe ability to explain and predict future price are also called indicators or alpha factors. Traditionally, alpha factors aredesigned and tested by finance experts based on domain knowledge. However, this way of mining alpha is very costlyand not realistic for individual investors. There are many attempts to automatically discover alpha factors. Alpha101[62] introduced a set of 101 public alpha factors. Autoalpha [142] combined genetic algorithm and principle componentanalysis (PCA) to search for alpha factors with low correlation. ADNN [36] proposed an alpha discovery neural networkframework for mining alpha factors. In general, it is harmful to feed all available features into ML models directly.Feature selection approaches are applied to reduce irrelevant and redundant features in QT applications [68, 117, 139].Another paradigm is to use dimension reduction techniques such as PCA [127] and latent Dirichlet allocation (LDA)[116] to extract meaningful features.
4.2 Financial Forecasting
The usage of supervised learning methods in financial forecasting is pervasive. Researchers formulate return predictionas a regression task and price trend prediction as a classification task. Linear models such as linear regression [9],LASSO [93], elastic net [129] are used for financial prediction. Non-linear models including random forest [64], decisiontree [5], support vector machine (SVM) [54] and LightGBM [111] outperform linear models owing to their ability tolearn non-linear relationships between features. In recent years, deep learning models including multi-layer perceptron(MLP) [28], recurrent neural network (RNN) [101], long short state memory (LSTM) [101], convolutional neural network(CNN) [50] are prevailing owing to its outstanding ability to learn hidden relationship between features.
Besides different ML models, there is also a trend to utilize alternative data for improving prediction performance. Forinstance, economic news [51], frequency of prices [141], social media [134], financial events [30], investment behaviors[21] and weather information [146] have been used as extra information to learn intrinsic pattern of financial assets.Graph neural networks have been introduced to model the relationship between stocks [22, 73, 98, 133]. Hybrid methodsare also proposed to further improve prediction performance [52, 79].
4.3 Enhancing Traditional Methods with ML
Another research direction is to enhance traditional rule-based methods with ML techniques. Lim et al. [76] enhancedtime-series momentum with deep learning. Takeuchi and Lee [114] applied NN to enhance cross section momentum.Chauhan et al. [20] took account uncertainty and look-ahead based on factor models. Alphastock [122] proposed adeep reinforcement attention network to improve the classic buying-winners-and-selling-losers strategy [57]. Gu et al.explore ML techniques’ ability on asset pricing. In [45], an autoencoder architecture was proposed for asset pricing.Compared to pure ML methods, these methods keep the original financial insight and have better explainability.
Even though supervised ML methods achieve great success in financial forecasting with the combination of featureengineering techniques, there is still an unignorable gap between accurate prediction and profitable trading actions. RL
Manuscript submitted to ACM

12 Sun et al.
methods can tackle this obstacle through learning an end-to-end agent, which maps market information into tradingactions directly. In the next section, we will discuss notable RL methods for QT tasks and why they are superior totraditional methods.
Category RL algorithm PublicationQ-learning [7, 42, 49, 56, 67, 77, 88–90, 109, 145]
Value-Based SARSA [19, 25, 109, 110]DQN [24, 58, 91, 123, 138, 144]RRL [26, 27, 31, 84–86, 105, 106, 132]
Policy-Based REINFORCE [123]PG [6, 74, 124, 143, 144]
TRPO [10, 120]DPG [59, 60, 80, 136]PPO [24, 37, 74, 78, 135, 138]
Actor-Critic DDPG [74, 99, 131, 135]SAC [138]A2C [135, 144]
Others Model-based RL [46, 137]Multi-Agent RL [55, 66, 67]
Table 3. Publications Based on Different Reinforcement Learning Algorithms
5 REINFORCEMENT LEARNING FOR QUANTITATIVE TRADING
In this section, we present a comprehensive review of notable RL-based methods for QT. We go through existing worksacross four mainstream QT tasks with a summary table at the end of each subsection.
5.1 Categories of RL-based QT models
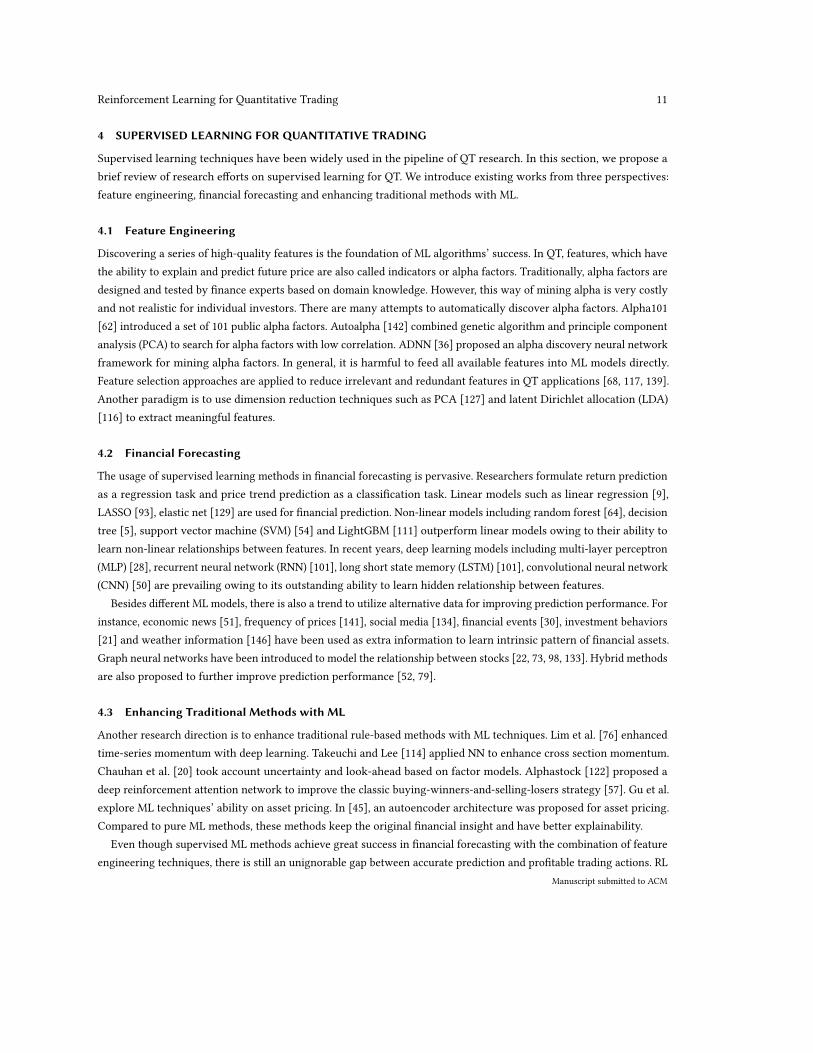
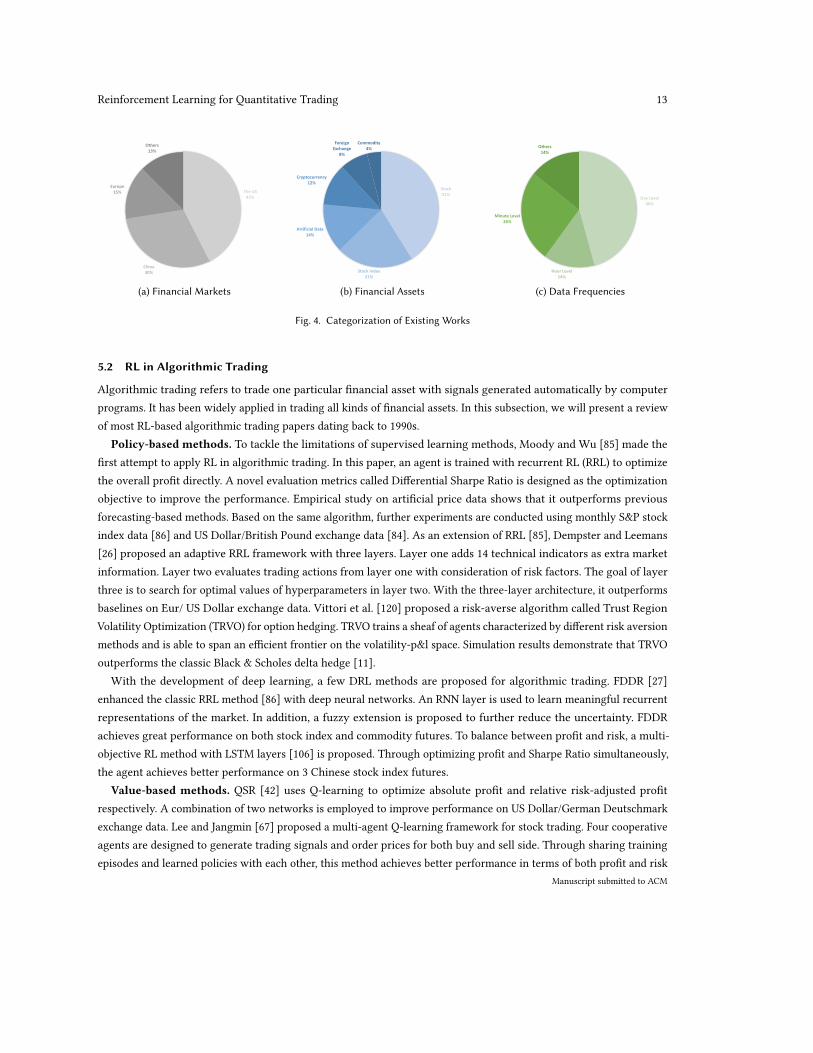
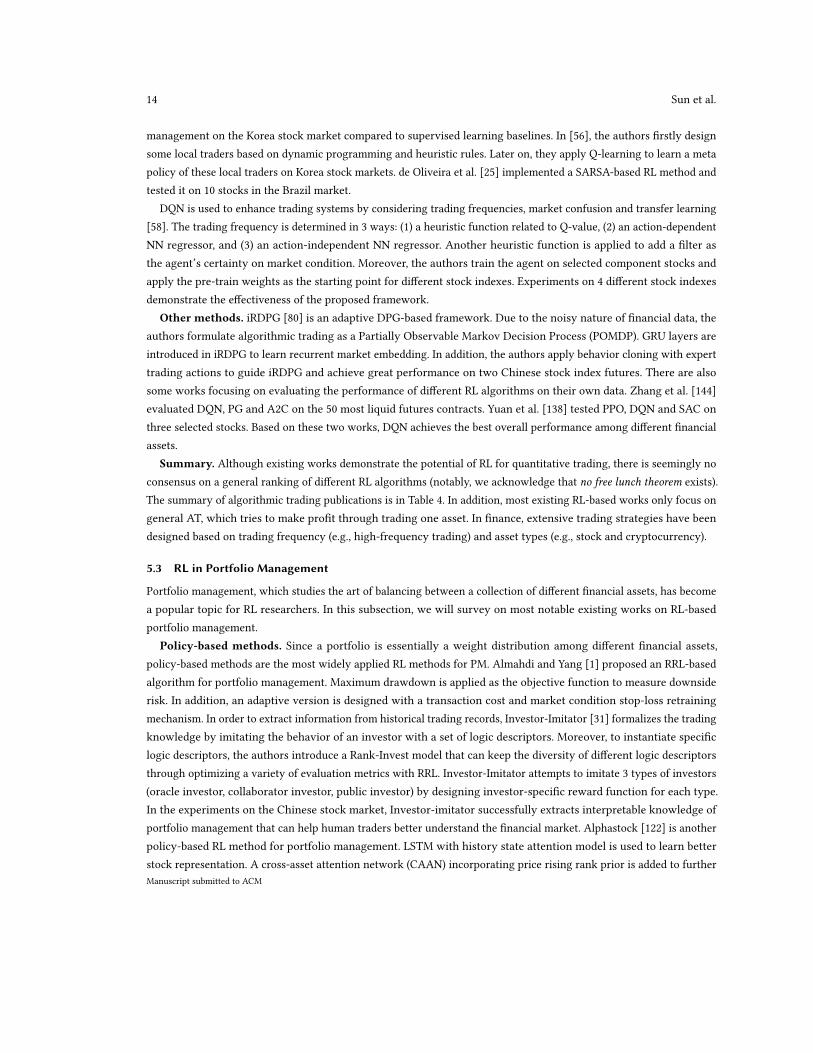
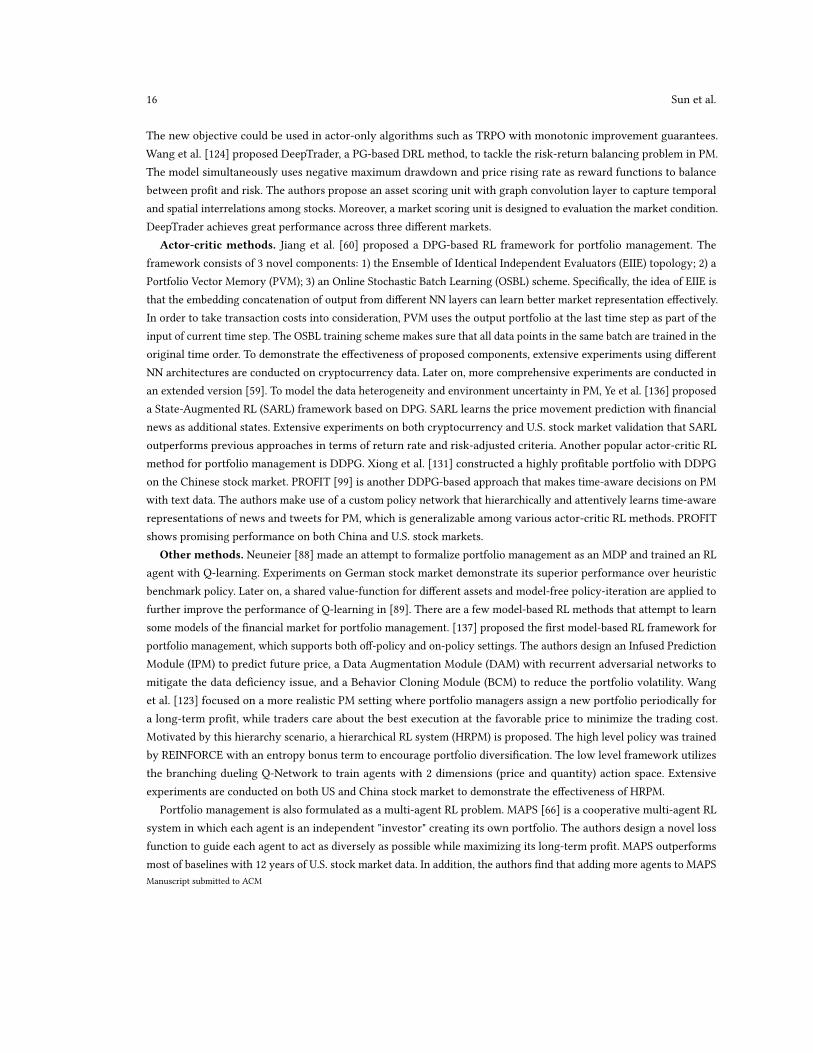
In order to provide a bird-eye’s view of this field, existing works are classified from different perspectives. Table 3summarizes existing works from the RL algorithm perspective. Q-learning and recurrent RL are the most popularRL algorithms for QT. Recent trend indicates DRL methods such as DQN, DDPG and PPO outperform traditional RLmethods. In addition, we use three pie charts to provide taxonomies of existing works based on financial markets,financial assets and data frequencies. The percentage numbers shown in the pie charts are calculated by dividing thenumber of papers belonging to each type with the total number of papers. We classify existing works based on financialmarkets (illustrated in Figure. 4a). The US market is the most studied market in the literature. Chinese market is gettingpopular in recent years. The study of European market is mainly in the early era. We classify existing works basedon financial assets (illustrated in Figure. 4b). Stock data is used for more than 40% of publications. Stock index is thesecond popular additional option. There are also some works focusing on cryptocurrency in recent years. We classifyexisting works based on data frequencies (illustrated in Figure. 4c). About half of papers use day-level data since it iseasy to access. For order execution and market making, fine-grained data (e.g., second-level and minute-level) are oftenused to simulate the micro-level financial market.
Manuscript submitted to ACM
Reinforcement Learning for Quantitative Trading 13
The US42%
China30%
Europe15%
Others13%
(a) Financial Markets
Stock41%
Stock Index21%
Artificial Data14%
Cryptocurrency12%
Foreign Exchange
8%
Commodity4%
(b) Financial Assets
Day Level46%
Hour Level14%
Minute Level26%
Others14%
(c) Data Frequencies
Fig. 4. Categorization of Existing Works
5.2 RL in Algorithmic Trading
Algorithmic trading refers to trade one particular financial asset with signals generated automatically by computerprograms. It has been widely applied in trading all kinds of financial assets. In this subsection, we will present a reviewof most RL-based algorithmic trading papers dating back to 1990s.
Policy-based methods. To tackle the limitations of supervised learning methods, Moody and Wu [85] made thefirst attempt to apply RL in algorithmic trading. In this paper, an agent is trained with recurrent RL (RRL) to optimizethe overall profit directly. A novel evaluation metrics called Differential Sharpe Ratio is designed as the optimizationobjective to improve the performance. Empirical study on artificial price data shows that it outperforms previousforecasting-based methods. Based on the same algorithm, further experiments are conducted using monthly S&P stockindex data [86] and US Dollar/British Pound exchange data [84]. As an extension of RRL [85], Dempster and Leemans[26] proposed an adaptive RRL framework with three layers. Layer one adds 14 technical indicators as extra marketinformation. Layer two evaluates trading actions from layer one with consideration of risk factors. The goal of layerthree is to search for optimal values of hyperparameters in layer two. With the three-layer architecture, it outperformsbaselines on Eur/ US Dollar exchange data. Vittori et al. [120] proposed a risk-averse algorithm called Trust RegionVolatility Optimization (TRVO) for option hedging. TRVO trains a sheaf of agents characterized by different risk aversionmethods and is able to span an efficient frontier on the volatility-p&l space. Simulation results demonstrate that TRVOoutperforms the classic Black & Scholes delta hedge [11].
With the development of deep learning, a few DRL methods are proposed for algorithmic trading. FDDR [27]enhanced the classic RRL method [86] with deep neural networks. An RNN layer is used to learn meaningful recurrentrepresentations of the market. In addition, a fuzzy extension is proposed to further reduce the uncertainty. FDDRachieves great performance on both stock index and commodity futures. To balance between profit and risk, a multi-objective RL method with LSTM layers [106] is proposed. Through optimizing profit and Sharpe Ratio simultaneously,the agent achieves better performance on 3 Chinese stock index futures.
Value-based methods. QSR [42] uses Q-learning to optimize absolute profit and relative risk-adjusted profitrespectively. A combination of two networks is employed to improve performance on US Dollar/German Deutschmarkexchange data. Lee and Jangmin [67] proposed a multi-agent Q-learning framework for stock trading. Four cooperativeagents are designed to generate trading signals and order prices for both buy and sell side. Through sharing trainingepisodes and learned policies with each other, this method achieves better performance in terms of both profit and risk
Manuscript submitted to ACM
14 Sun et al.
management on the Korea stock market compared to supervised learning baselines. In [56], the authors firstly designsome local traders based on dynamic programming and heuristic rules. Later on, they apply Q-learning to learn a metapolicy of these local traders on Korea stock markets. de Oliveira et al. [25] implemented a SARSA-based RL method andtested it on 10 stocks in the Brazil market.
DQN is used to enhance trading systems by considering trading frequencies, market confusion and transfer learning[58]. The trading frequency is determined in 3 ways: (1) a heuristic function related to Q-value, (2) an action-dependentNN regressor, and (3) an action-independent NN regressor. Another heuristic function is applied to add a filter asthe agent’s certainty on market condition. Moreover, the authors train the agent on selected component stocks andapply the pre-train weights as the starting point for different stock indexes. Experiments on 4 different stock indexesdemonstrate the effectiveness of the proposed framework.
Other methods. iRDPG [80] is an adaptive DPG-based framework. Due to the noisy nature of financial data, theauthors formulate algorithmic trading as a Partially Observable Markov Decision Process (POMDP). GRU layers areintroduced in iRDPG to learn recurrent market embedding. In addition, the authors apply behavior cloning with experttrading actions to guide iRDPG and achieve great performance on two Chinese stock index futures. There are alsosome works focusing on evaluating the performance of different RL algorithms on their own data. Zhang et al. [144]evaluated DQN, PG and A2C on the 50 most liquid futures contracts. Yuan et al. [138] tested PPO, DQN and SAC onthree selected stocks. Based on these two works, DQN achieves the best overall performance among different financialassets.
Summary. Although existing works demonstrate the potential of RL for quantitative trading, there is seemingly noconsensus on a general ranking of different RL algorithms (notably, we acknowledge that no free lunch theorem exists).The summary of algorithmic trading publications is in Table 4. In addition, most existing RL-based works only focus ongeneral AT, which tries to make profit through trading one asset. In finance, extensive trading strategies have beendesigned based on trading frequency (e.g., high-frequency trading) and asset types (e.g., stock and cryptocurrency).
5.3 RL in Portfolio Management
Portfolio management, which studies the art of balancing between a collection of different financial assets, has becomea popular topic for RL researchers. In this subsection, we will survey on most notable existing works on RL-basedportfolio management.
Policy-based methods. Since a portfolio is essentially a weight distribution among different financial assets,policy-based methods are the most widely applied RL methods for PM. Almahdi and Yang [1] proposed an RRL-basedalgorithm for portfolio management. Maximum drawdown is applied as the objective function to measure downsiderisk. In addition, an adaptive version is designed with a transaction cost and market condition stop-loss retrainingmechanism. In order to extract information from historical trading records, Investor-Imitator [31] formalizes the tradingknowledge by imitating the behavior of an investor with a set of logic descriptors. Moreover, to instantiate specificlogic descriptors, the authors introduce a Rank-Invest model that can keep the diversity of different logic descriptorsthrough optimizing a variety of evaluation metrics with RRL. Investor-Imitator attempts to imitate 3 types of investors(oracle investor, collaborator investor, public investor) by designing investor-specific reward function for each type.In the experiments on the Chinese stock market, Investor-imitator successfully extracts interpretable knowledge ofportfolio management that can help human traders better understand the financial market. Alphastock [122] is anotherpolicy-based RL method for portfolio management. LSTM with history state attention model is used to learn betterstock representation. A cross-asset attention network (CAAN) incorporating price rising rank prior is added to furtherManuscript submitted to ACM

Reinforcement Learning for Quantitative Trading 15
Reference RL method Data Source Asset Type Market Data frequency[85] RRL - Artificial - -[86] RRL - Stock Index USA 1 Month[42] Q-learning Hand-crafted FX - 1 Day[84] RRL Lagged Return FX - 30 Min[67] Multi-agent RL Hand-crafted Stock Index Korea -[56] Q-learning Hand-crafted Stock Index Korea -
[26] RRL Lagged ReturnTechnical Indicator FX - 1 Min
[7] Q-learning Lagged Return ArtificialStock
-Italy
-1 Day
[27] RRL Price Stock IndexCommodity China 1 Min
[106] RRL Lagged Return Stock Index China 1 Min
[58] DQN Lagged Return Stock Index USA, Hong KongEurope, Korea 1 Day
[25] SARSA OHLC, Technical Indicator Stock Brazil 15 Min[80] DPG OHLC, Technical Indicator Stock Index China 1 Min[120] TRPO Hand-crafted Artificial - -
[144] DQN, PG, A2C Price, Lagged ReturnTechnical Indicators
Stock IndexCommodity - -
[138] PPO, DQN, SAC OHLC Stock China 1 Day
Table 4. Summary of RL for Algorithmic Trading
describe the interrelationships among stocks. Later on, the output of CAAN (winning score of each stock) is feed intoa heuristic portfolio generator to construct the final portfolio. Policy gradient is used to optimize the Sharpe Ratio.Experiments on both U.S. and Chinese stock market show that Alphastock achieves robust performance over differentmarket states. 𝐸𝐼3 [105] is another RRL-based method, which tries to build profitable cryptocurrency portfolios byextracting multi-scale patterns in the financial market. Inspired by the success of Inception networks [113], the authorsdesign a multi-scale temporal feature aggregation convolution framework with two CNN branches to extract short-termand mid-term market embedding and a max pooling branch to extract the highest price information. To bridge the gapbetween the traditional Markowitz portfolio and RL-based methods, Benhamou et al. [6] applied PG with a delayedreward function and showed better performance than the classic Markowitz efficient frontier.
Zhang et al. [143] proposed a cost-sensitive PM framework based on direct policy gradient. To learn more robustmarket representation, a novel two-stream portfolio policy network is designed to extract both price series patternand the relationship between different financial assets. In addition, the authors design a new cost-sensitive rewardfunction to take the trading cost constrain into consideration with theoretically near-optimal guarantee. Finally, theeffectiveness of the cost-sensitive framework is demonstrated on real-world cryptocurrency datasets. Xu et al. [132]proposed a novel relation-aware transformer (RAT) under the classic RRL paradigm. RAT is structurally innovatedto capture both sequential patterns and the inner corrections between financial assets. Specifically, RAT follows anencoder-decoder structure, where the encoder is for sequential feature extraction and the decoder is for decisionmaking. Experiments on 2 cryptocurrency and 1 stock datasets not only show RAT’s superior performance over existingbaselines but also demonstrate that RAT can effectively learn better representation and benefit from leverage operation.Bisi et al. [10] derived a PG theorem with a novel objective function, which exploited the mean-volatility relationship.
Manuscript submitted to ACM
16 Sun et al.
The new objective could be used in actor-only algorithms such as TRPO with monotonic improvement guarantees.Wang et al. [124] proposed DeepTrader, a PG-based DRL method, to tackle the risk-return balancing problem in PM.The model simultaneously uses negative maximum drawdown and price rising rate as reward functions to balancebetween profit and risk. The authors propose an asset scoring unit with graph convolution layer to capture temporaland spatial interrelations among stocks. Moreover, a market scoring unit is designed to evaluation the market condition.DeepTrader achieves great performance across three different markets.
Actor-critic methods. Jiang et al. [60] proposed a DPG-based RL framework for portfolio management. Theframework consists of 3 novel components: 1) the Ensemble of Identical Independent Evaluators (EIIE) topology; 2) aPortfolio Vector Memory (PVM); 3) an Online Stochastic Batch Learning (OSBL) scheme. Specifically, the idea of EIIE isthat the embedding concatenation of output from different NN layers can learn better market representation effectively.In order to take transaction costs into consideration, PVM uses the output portfolio at the last time step as part of theinput of current time step. The OSBL training scheme makes sure that all data points in the same batch are trained in theoriginal time order. To demonstrate the effectiveness of proposed components, extensive experiments using differentNN architectures are conducted on cryptocurrency data. Later on, more comprehensive experiments are conducted inan extended version [59]. To model the data heterogeneity and environment uncertainty in PM, Ye et al. [136] proposeda State-Augmented RL (SARL) framework based on DPG. SARL learns the price movement prediction with financialnews as additional states. Extensive experiments on both cryptocurrency and U.S. stock market validation that SARLoutperforms previous approaches in terms of return rate and risk-adjusted criteria. Another popular actor-critic RLmethod for portfolio management is DDPG. Xiong et al. [131] constructed a highly profitable portfolio with DDPGon the Chinese stock market. PROFIT [99] is another DDPG-based approach that makes time-aware decisions on PMwith text data. The authors make use of a custom policy network that hierarchically and attentively learns time-awarerepresentations of news and tweets for PM, which is generalizable among various actor-critic RL methods. PROFITshows promising performance on both China and U.S. stock markets.
Other methods. Neuneier [88] made an attempt to formalize portfolio management as an MDP and trained an RLagent with Q-learning. Experiments on German stock market demonstrate its superior performance over heuristicbenchmark policy. Later on, a shared value-function for different assets and model-free policy-iteration are applied tofurther improve the performance of Q-learning in [89]. There are a few model-based RL methods that attempt to learnsome models of the financial market for portfolio management. [137] proposed the first model-based RL framework forportfolio management, which supports both off-policy and on-policy settings. The authors design an Infused PredictionModule (IPM) to predict future price, a Data Augmentation Module (DAM) with recurrent adversarial networks tomitigate the data deficiency issue, and a Behavior Cloning Module (BCM) to reduce the portfolio volatility. Wanget al. [123] focused on a more realistic PM setting where portfolio managers assign a new portfolio periodically fora long-term profit, while traders care about the best execution at the favorable price to minimize the trading cost.Motivated by this hierarchy scenario, a hierarchical RL system (HRPM) is proposed. The high level policy was trainedby REINFORCE with an entropy bonus term to encourage portfolio diversification. The low level framework utilizesthe branching dueling Q-Network to train agents with 2 dimensions (price and quantity) action space. Extensiveexperiments are conducted on both US and China stock market to demonstrate the effectiveness of HRPM.
Portfolio management is also formulated as a multi-agent RL problem. MAPS [66] is a cooperative multi-agent RLsystem in which each agent is an independent "investor" creating its own portfolio. The authors design a novel lossfunction to guide each agent to act as diversely as possible while maximizing its long-term profit. MAPS outperformsmost of baselines with 12 years of U.S. stock market data. In addition, the authors find that adding more agents to MAPSManuscript submitted to ACM

Reinforcement Learning for Quantitative Trading 17
can lead to a more diversified portfolio with higher Sharpe Ratio. MSPM [55] is a multi-agent RL framework with amodularized and scalable architecture for PM. MSPM consists of the Evolving Agent Module (EAM) to learn marketembedding with heterogeneous input and the Strategic Agent Module (SAM) to produce profitable portfolios based onthe output of EAM.
Some works compare the profitability of portfolios constructed by different RL algorithms on their own data. Lianget al. [74] compared the performance of DDPG, PPO and PG on Chinese stock market. Yang et al. [135] firstly tested theperformance of PPO, A2C and DDPG on the U.S. stock market. Later on, the authors find that the ensemble strategyof these three algorithms can integrate the best features and shows more robust performance adjusting to differentmarket situations.
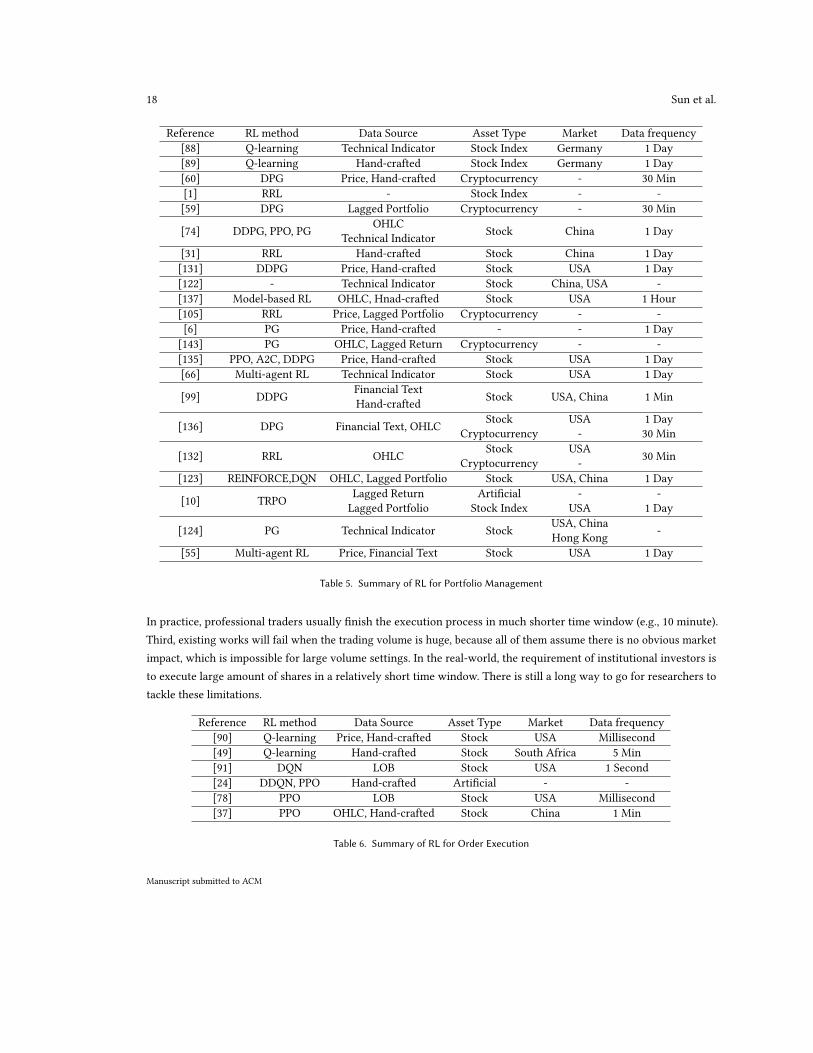
Summary. Since a portfolio is a vector of weights for different financial assets, which naturally corresponds to apolicy, policy-based methods are the most widely-used RL methods for PM. There are also many successful examplesbased on actor-critic algorithms. The summary of portfolio management publications is in Table 5. We point out twoissues of existing methods: (1) Most of them ignore the interrelationship between different financial assets, which isvaluable for human portfolio managers. (2) Existing works construct portfolios from a relative small pool of stocks (e.g.,20 in total). However, the real market contains thousands of stocks and common RL methods are vulnerable when theaction space is very large [32].
5.4 RL in Order Execution
Different from AT and PM, order execution (OE) is a micro-level QT task, which tries to trade a fixed amount of sharesin a given time horizon and minimize the execution cost. In the real financial market, OE is extremely important forinstitutional traders whose trading volume is large enough to have an obvious impact of the market price.
Nevmyvaka et al. [90] proposed the first RL-based method for large-scale order execution. The authors use Q-learningto train the agent with real-world LOB data. With carefully designed state, action and reward function, the Q-learningframework can significantly outperform traditional baselines. Hendricks and Wilcox [49] implemented another Q-learning based RL method on South Africa market by extending the popular Almgren-Chriss model with linear priceimpact. Ning et al. [91] proposed an RL framework using Double DQN and evaluated its performance on 9 different U.S.stocks. Dabérius et al. [24] implemented DDQN, PPO and compared their performance with TWAP.
PPO is another widely used RL method for OE. Lin and Beling [78] proposed an end-to-end PPO-based framework.MLP and LSTM are tested as time dependencies accounting network. The authors design a sparse reward function insteadof previous implementation shortfall (IS) or a shaped reward function, which leads to state-of-the-art performance on 14stocks in the U.S. market. Fang et al. [37] proposed another PPO-based framework to bridge the gap between the noisyyet imperfect market states and the optimal action sequences for OE. The framework leverages a policy distillationmethod with an entropy regularization term in the loss function to guide the student agent toward learning similarpolicy by an oracle teacher with perfect information of the financial market. Moreover, the authors design a normalizedreward function to encourage universal learning among different stocks. Extensive experiments on Chinese stockmarket demonstrate that the proposed method significantly outperforms various baselines with reasonable tradingactions.
We present a summary of existing RL-based order execution publications in Table 6. Although there are a fewsuccessful examples using either Q-learning or PPO on order execution, existing works share a few limitations. First,most of algorithms are only tested on stock data. Their performance on different financial assets (e.g., futures andcryptocurrency) is still unclear. Second, the execution time window (e.g., 1 day) is too long, which makes the task easier.
Manuscript submitted to ACM
18 Sun et al.
Reference RL method Data Source Asset Type Market Data frequency[88] Q-learning Technical Indicator Stock Index Germany 1 Day[89] Q-learning Hand-crafted Stock Index Germany 1 Day[60] DPG Price, Hand-crafted Cryptocurrency - 30 Min[1] RRL - Stock Index - -[59] DPG Lagged Portfolio Cryptocurrency - 30 Min
[74] DDPG, PPO, PG OHLCTechnical Indicator Stock China 1 Day
[31] RRL Hand-crafted Stock China 1 Day[131] DDPG Price, Hand-crafted Stock USA 1 Day[122] - Technical Indicator Stock China, USA -[137] Model-based RL OHLC, Hnad-crafted Stock USA 1 Hour[105] RRL Price, Lagged Portfolio Cryptocurrency - -[6] PG Price, Hand-crafted - - 1 Day[143] PG OHLC, Lagged Return Cryptocurrency - -[135] PPO, A2C, DDPG Price, Hand-crafted Stock USA 1 Day[66] Multi-agent RL Technical Indicator Stock USA 1 Day
[99] DDPG Financial TextHand-crafted Stock USA, China 1 Min
[136] DPG Financial Text, OHLC StockCryptocurrency
USA-
1 Day30 Min
[132] RRL OHLC StockCryptocurrency
USA- 30 Min
[123] REINFORCE,DQN OHLC, Lagged Portfolio Stock USA, China 1 Day
[10] TRPO Lagged ReturnLagged Portfolio
ArtificialStock Index
-USA
-1 Day
[124] PG Technical Indicator Stock USA, ChinaHong Kong -
[55] Multi-agent RL Price, Financial Text Stock USA 1 Day
Table 5. Summary of RL for Portfolio Management
In practice, professional traders usually finish the execution process in much shorter time window (e.g., 10 minute).Third, existing works will fail when the trading volume is huge, because all of them assume there is no obvious marketimpact, which is impossible for large volume settings. In the real-world, the requirement of institutional investors isto execute large amount of shares in a relatively short time window. There is still a long way to go for researchers totackle these limitations.
Reference RL method Data Source Asset Type Market Data frequency[90] Q-learning Price, Hand-crafted Stock USA Millisecond[49] Q-learning Hand-crafted Stock South Africa 5 Min[91] DQN LOB Stock USA 1 Second[24] DDQN, PPO Hand-crafted Artificial - -[78] PPO LOB Stock USA Millisecond[37] PPO OHLC, Hand-crafted Stock China 1 Min
Table 6. Summary of RL for Order Execution
Manuscript submitted to ACM

Reinforcement Learning for Quantitative Trading 19
5.5 RL in Market Making
Market making refers to trading activities that buy and sell one given asset simultaneously at desired price. The goal ofa market maker is to provide liquidity to the market and market profit through the tiny price spread of buy/sell orders.In this subsection, we will discuss existing RL-based methods for market making.
Chan and Shelton [19] made the first attempt to apply RL for market making without any assumption of the market.Simulation showed that the RL method converged on optimal strategies successfully on a few controlled environments.Spooner et al. [109] focused on designing and analyzing temporal-difference (TD) RL methods for market making.The authors firstly build a realistic, data-driven simulator with millisecond LOB data for market making. With anasymmetrically dampened reward function and a linear combination of tile coding as state, both Q-learning and SARSAoutperform previous baselines. Lim and Gorse [77] proposed a Q-learning based algorithm with a novel usage of CARAutility as the terminal reward for market making. Guéant and Manziuk [46] proposed a model-based actor-critic RLalgorithm, which focuses on market making optimization for multiple corporate bonds. Zhong et al. [145] proposed amodel-free and off-policy Q-learning algorithm to develop trading strategy implemented with a simple lookup table. Themethod achieves great performance on event-by-event LOB data confirmed by a professional trading firm. For trainingrobust market making agents, Spooner and Savani [110] introduced a game-theoretic adaptation of the traditionalmathematical market making model. The authors thoroughly investigate the impact of 3 environmental settings withadversarial RL.
Even though market making is a fundamental task in quantitative trading, research on RL-based market making isstill at the early stage. Existing few works simply apply different RL methods on their own data. The summary of orderexecution publications is in Table 7. To fully realize the potential of RL for market making, one major obstacle is thelack of high-fidelity micro-level market simulator. At present, there is still no reasonable way to simulate the ubiquitousmarket impact. This unignorable gap between simulation and real market limits the usage of RL in market making.
Reference RL method Data Source Asset Type Market Data frequency[19] SARSA Hand-crafted Artificial - -[109] Q-learning, SARSA Hand-crafted - - Millisecond[77] Q-learning Hand-crafted Artificial - -[46] Model-based RL Hand-crafted Bond Europe -[145] Q-learning LOB - - Event[110] SARSA Hand-crafted Artificial - -
Table 7. Summary of RL for Market Making
6 OPEN ISSUES AND FUTURE DIRECTIONS
Even though existing works have demonstrated the success of RL methods on QT tasks, this section will point out afew prospective future research directions. Several critical open issues and potential solutions are also elaborated.
6.1 Advanced RL techniques on QT
Most existing works are only straightforward application of classic RL methods on QT tasks. The effectiveness ofmore advanced RL techniques on financial data is not well-explored. We point out a few promising directions in thissubsection.
Manuscript submitted to ACM

20 Sun et al.
First, data scarcity is a major challenge on applying RL for QT tasks. Model-based RL can speed up the training processby learning a model of the financial market [137]. The worst-case (e.g., financial crisis) can be used as a regularizerfor maximizing the accumulated reward. Second, the key objective of QT is to balance between maximizing profitand minimizing risk. Multi-objective RL techniques provide a weapon to balance the trade-off between profit and risk.Training diversified trading policies with different risk tolerance is an interesting direction. Third, graph learning[130] has shown promising results on modeling the ubiquitous relationship between stocks in supervised learning[38, 98]. Combing graph learning with RL for modeling the internal relationship between different stocks or financialmarket is an interesting future direction. Fourth, the severe distribution shift of financial market makes RL-basedmethods exhibit poor generalization ability in new market condition. Meta-RL and transfer learning techniques canhelp improve RL-based QT models’ generalization performance across different financial assets or market. Fifth, forhigh risky decision-making tasks such as QT, we need to explain its actions to human traders as a condition for theirfull acceptance of the algorithm. Hierarchical RL methods decompose the main goal into sub-goals for low-level agents.By learning the optimal subgoals for the low-level agent, the high-level agent forms a representation of the financialmarket that is interpretable by human traders. Sixth, for QT, learning through directly interacting with the real marketis risky and impractical. RL-based QT normally use historical data to learn a policy, which fits in offline RL settings.Offline RL techniques can help to model the distribution shift and risk of financial market while training RL agents.
6.2 Alternative Data and New QT Settings
Intuitively, alternative data can provide extra information to learn better representation of the financial market. Economicnews [51], frequency of prices [141], social media [134], financial events [30] and investment behaviors [21] have beenapplied to improve performance of financial prediction. For RL-based methods, price movement embedding [136] andmarket condition embedding [124] are incorporated as extra information to improve an RL agent’s performance. However,existing works simply concatenate extra features or embedding from multiple data source as market representations,one interesting forward-looking direction is to utilize multi-modality learning techniques to learn more meaningfulrepresentations with both original price and alternative data while training RL agents. Besides alternative data, thereare still some important QT settings unexplored by RL researchers. Intraday trading, high-frequency trading and pairstrading are a few examples. Intraday trading tries to capture price fluctuation patterns within the same trading day;high-frequency trading aims at capturing the fleeting micro-level trading opportunities; Pairs trading focus on analyzingthe relative trend of two highly correlated assets.
6.3 Enhance with auto-ML
Due to the noisy nature of financial data and brittleness of RL methods, the success of RL-based QT models highlyreplies on carefully designed RL components (e.g., reward function) and proper-tuned hyperparameters (e.g., networkarchitecture). As a result, it is still difficult for people without in-depth knowledge of RL such as economists andprofessional traders to design profitable RL-based trading strategies. Auto-ML, which tries to design high-qualityML applications automatically, can enhance the development of RL-based QT from three perspectives: (i) For featureengineering, auto-ML can automatically construct, select and collect meaningful features. (ii) For hyperparametertuning, auto-ML can automatically search for proper hyperparameters such as update rule, learning rate and rewardfunction. (iii) For neural architecture search, auto-ML can automatically search for suitable neural network architecturesfor training RL agents. With the assistance of auto-ML, RL-based QT models can be more usable for people without in
Manuscript submitted to ACM

Reinforcement Learning for Quantitative Trading 21
depth knowledge of RL. We believe that it is a promising research direction to facilitate the development of RL-basedQT models with auto-ML techniques.
6.4 More Realistic Simulation
High-fidelity simulation is the key foundation of RL methods’ success. Although existing works take many practicalconstraints such as transaction fee [119], execution cost [123] and slippage [80] into consideration, current simulationis far from realistic. The ubiquitous market impact, which refers to the effect of one trader’s actions to other traders, isignored. For leading trading firms, their trading volume can account for over 10% of the total volume with a significantimpact of other traders in the market. As a result, simulation with only historical market data is not enough. There aresome research efforts focusing on dealing with the market impact. Spooner et al. [109] tried to take market impact intoconsideration for MM with event-level data. Byrd et al. [14] proposed Aides, an agent-based financial market simulatorto model market impact. Vyetrenko et al. [121] made a survey on current status for market simulation and proposed aseries of stylized metrics to test the quality of simulation. It is a very challenging but important research direction tobuild high-fidelity market simulators.
6.5 The Field Needs More Unified and Harder Evaluation
When a new RL-based QT method is proposed, the authors are expected to compare their methods with SOTA baselineson some financial datasets. At present, the selection of baselines and datasets is seemingly arbitrary, which leads to aninconsistent reporting of revenues. As a result, there is no widely consensus on the general ranking of RL-based methodsfor QT tasks, which makes it extremely challenging to benchmark new RL algorithms in this field. The question is, howdo we solve it? We can borrow some experience from neighbouring ML fields such as computer vision and naturallanguage processing. A suite of standardized evaluation datasets and implementation of SOTA methods could be a goodsolution to this problem. As for evaluation criteria, although most existing works only evaluate RL algorithms withfinancial metrics, it is necessary to test RL algorithms on multiple financial assets across different market to evaluaterobustness and generalization ability. We also note that split of training, validation and test set in most QT papers isquite random. Since there is significant distribution shift among time in the financial market, it is better to split data ona rolling basis. In addition, it is well-known that the performance of RL methods is very sensitive to hyperparameterssuch as learning rate. To provide more reliable evaluation of RL methods, authors should spend roughly the same timeon tuning hyperparameters for both baselines and their own methods. In practice, some authors make much moreeffort on tuning their own methods than baselines, which makes the reported revenue not promising. We urge the QTcommunity to conduct more strict evaluation on new proposed methods. With proper datasets, baseline implementationand evaluation scheme, research on RL-based QT could achieve faster development.
7 CONCLUSION
In this article, we provided a comprehensive review of the most notable works on RL-based QT models. We proposed aclassification scheme for organizing and clustering existing works, and we highlighted a bunch of influential researchprototypes. We also discussed the pros/cons of utilizing RL techniques for QT tasks. In addition, we point out some ofthe most pressing open problems and promising future directions. Both RL and QT are ongoing hot research topics inthe past few decades. There are many newly developing techniques and emerging models each year. We hope thatthis survey can provide readers with a comprehensive understanding of the key aspects of this field, clarify the mostnotable advances, and shed some lights on future research.
Manuscript submitted to ACM
22 Sun et al.
REFERENCES[1] Saud Almahdi and Steve Y Yang. 2017. An adaptive portfolio trading system: A risk-return portfolio optimization using recurrent reinforcement
learning with expected maximum drawdown. Expert Systems with Applications 87 (2017), 267–279.[2] Robert Almgren and Neil Chriss. 2001. Optimal execution of portfolio transactions. Journal of Risk 3 (2001), 5–40.[3] Adebiyi A Ariyo, Adewumi O Adewumi, and Charles K Ayo. 2014. Stock price prediction using the ARIMA model. In Proceedings of the 6th
International Conference on Computer Modelling and Simulation (ICCMS). 106–112.[4] Arash Bahrammirzaee. 2010. A comparative survey of artificial intelligence applications in finance: Artificial neural networks, Expert system and
hybrid intelligent systems. Neural Computing and Applications 19, 8 (2010), 1165–1195.[5] Suryoday Basak, Saibal Kar, Snehanshu Saha, Luckyson Khaidem, and Sudeepa Roy Dey. 2019. Predicting the direction of stock market prices
using tree-based classifiers. The North American Journal of Economics and Finance 47 (2019), 552–567.[6] Eric Benhamou, David Saltiel, Sandrine Ungari, and Abhishek Mukhopadhyay. 2020. Bridging the gap between Markowitz planning and deep
reinforcement learning. arXiv preprint arXiv:2010.09108 (2020).[7] Francesco Bertoluzzo and Marco Corazza. 2012. Testing different reinforcement learning configurations for financial trading: Introduction and
applications. Procedia Economics and Finance 3 (2012), 68–77.[8] Dimitris Bertsimas and Andrew W Lo. 1998. Optimal control of execution costs. Journal of Financial Markets 1, 1 (1998), 1–50.[9] Dinesh Bhuriya, Girish Kaushal, Ashish Sharma, and Upendra Singh. 2017. Stock market predication using a linear regression. In Proceedings of 1st
International Conference of Electronics, Communication and Aerospace Technology (ICECA). 510–513.[10] Lorenzo Bisi, Luca Sabbioni, Edoardo Vittori, Matteo Papini, and Marcello Restelli. 2019. Risk-averse trust region optimization for reward-volatility
reduction. arXiv preprint arXiv:1912.03193 (2019).[11] Fischer Black and Myron Scholes. 1973. The Pricing of Options and Corporate Liabilities. The Journal of Political Economy 81, 3 (1973), 637–654.[12] John Bollinger. 2002. Bollinger on Bollinger Bands. McGraw-Hill New York.[13] Allan Borodin, Ran El-Yaniv, and Vincent Gogan. 2004. Can we learn to beat the best stock. Journal of Artificial Intelligence Research 21 (2004),
579–594.[14] David Byrd, Maria Hybinette, and Tucker Hybinette Balch. 2019. Abides: Towards high-fidelity market simulation for AI research. arXiv preprint
arXiv:1904.12066 (2019).[15] Álvaro Cartea, Sebastian Jaimungal, and José Penalva. 2015. Algorithmic and High-frequency Trading.[16] Álvaro Cartea, Sebastian Jaimungal, and Jason Ricci. 2014. Buy Low, Sell High: A High Frequency Trading Perspective. SIAM Journal on Financial
Mathematics 5, 1 (2014), 415–444.[17] Stephan K. Chalup and Andreas Mitschele. 2008. Kernel Methods in Finance. Chapter 27, 655–687.[18] Louis KC Chan, Narasimhan Jegadeesh, and Josef Lakonishok. 1996. Momentum strategies. The Journal of Finance 51, 5 (1996), 1681–1713.[19] Nicholas Tung Chan and Christian Shelton. 2001. An electronic market-maker. Technical report. (2001).[20] Lakshay Chauhan, John Alberg, and Zachary Lipton. 2020. Uncertainty-aware lookahead factor models for quantitative investing. In Proceedings of
the 37th International Conference on Machine Learning (ICML). 1489–1499.[21] Chi Chen, Li Zhao, Jiang Bian, Chunxiao Xing, and Tie-Yan Liu. 2019. Investment behaviors can tell what inside: Exploring stock intrinsic
properties for stock trend prediction. In Proceedings of the 25th ACM SIGKDD International Conference on Knowledge Discovery & Data Mining(KDD). 2376–2384.
[22] Yingmei Chen, Zhongyu Wei, and Xuanjing Huang. 2018. Incorporating corporation relationship via graph convolutional neural networks forstock price prediction. In Proceedings of the 27th ACM International Conference on Information and Knowledge Management (CIKM). 1655–1658.
[23] Thomas M. Cover. 1991. Universal Portfolios. Mathematical Finance 1, 1 (1991), 1–29.[24] Kevin Dabérius, Elvin Granat, and Patrik Karlsson. 2019. Deep Execution-Value and Policy Based Reinforcement Learning for Trading and Beating
Market Benchmarks. Available at SSRN 3374766 (2019).[25] Renato Arantes de Oliveira, Heitor S Ramos, Daniel Hasan Dalip, and Adriano César Machado Pereira. 2020. A tabular Sarsa-based stock market
agent. In Proceedings of the 1st ACM International Conference on AI in Finance (ICAIF).[26] Michael AH Dempster and Vasco Leemans. 2006. An automated FX trading system using adaptive reinforcement learning. Expert Systems with
Applications 30, 3 (2006), 543–552.[27] Yue Deng, Feng Bao, Youyong Kong, Zhiquan Ren, and Qionghai Dai. 2016. Deep direct reinforcement learning for financial signal representation
and trading. IEEE Transactions on Neural Networks and Learning Systems 28, 3 (2016), 653–664.[28] A Victor Devadoss and T Antony Alphonnse Ligori. 2013. Forecasting of stock prices using multi layer perceptron. International Journal of
Computing Algorithm 2 (2013), 440–449.[29] Xiao Ding, Yue Zhang, Ting Liu, and Junwen Duan. 2015. Deep learning for event-driven stock prediction. In Proceedings of the 24th International
Joint Conference on Artificial Intelligence (IJCAI). 2327–2333.[30] Xiao Ding, Yue Zhang, Ting Liu, and Junwen Duan. 2016. Knowledge-driven event embedding for stock prediction. In Proceedings of the 26th
International Conference on Computational Linguistics. 2133–2142.[31] Yi Ding, Weiqing Liu, Jiang Bian, Daoqiang Zhang, and Tie-Yan Liu. 2018. Investor-imitator: A framework for trading knowledge extraction. In
Proceedings of the 24th ACM SIGKDD International Conference on Knowledge Discovery & Data Mining (KDD). 1310–1319.
Manuscript submitted to ACM
Reinforcement Learning for Quantitative Trading 23
[32] Gabriel Dulac-Arnold, Richard Evans, Hado van Hasselt, Peter Sunehag, Timothy Lillicrap, Jonathan Hunt, Timothy Mann, Theophane Weber,Thomas Degris, and Ben Coppin. 2015. Deep reinforcement learning in large discrete action spaces. arXiv preprint arXiv:1512.07679 (2015).
[33] Sophie Emerson, Ruairí Kennedy, Luke O’Shea, and John O’Brien. 2019. Trends and applications of machine learning in quantitative finance. InProceedigns of the 8th International Conference on Economics and Finance Research (ICEFR).
[34] Eugene F Fama. 2021. Efficient capital markets: A review of theory and empirical work. The Fama Portfolio (2021), 76–121.[35] Eugene F Fama and Kenneth R French. 1993. Common risk factors in the returns on stocks and bonds. Journal of Financial Economics 33, 1 (1993),
3–56.[36] Jie Fang, Shutao Xia, Jianwu Lin, Zhikang Xia, Xiang Liu, and Yong Jiang. 2019. Alpha discovery neural network based on prior knowledge. arXiv
preprint arXiv:1912.11761 (2019).[37] Yuchen Fang, Kan Ren, Weiqing Liu, Dong Zhou, Weinan Zhang, Jiang Bian, Yong Yu, and Tie-Yan Liu. 2021. Universal trading for order execution
with oracle policy distillation. In Proceedings of the 35th AAAI Conference on Artificial Intelligence (AAAI).[38] Fuli Feng, Xiangnan He, Xiang Wang, Cheng Luo, Yiqun Liu, and Tat-Seng Chua. 2019. Temporal relational ranking for stock prediction. ACM
Transactions on Information Systems (TOIS) 37, 2 (2019), 27.[39] Thomas G Fischer. 2018. Reinforcement learning in financial markets: A survey. Technical Report. FAU Discussion Papers in Economics.[40] Keke Gai, Meikang Qiu, and Xiaotong Sun. 2018. A survey on FinTech. Journal of Network and Computer Applications 103 (2018), 262–273.[41] Alexei A Gaivoronski and Fabio Stella. 2000. Stochastic nonstationary optimization for finding universal portfolios. Annals of Operations Research
100, 1 (2000), 165–188.[42] Xiu Gao and Laiwan Chan. 2000. An algorithm for trading and portfolio management using Q-learning and sharpe ratio maximization. In
Proceedings of the 14th International Conference on Neural Information Processing (NIPS). 832–837.[43] Dhananjay K Gode and Shyam Sunder. 1993. Allocative Efficiency of Markets with Zero-intelligence Traders: Market as a Partial Substitute for
Individual Rationality. Journal of Political Economy 101, 1 (1993), 119–137.[44] Shihao Gu, Bryan Kelly, and Dacheng Xiu. 2020. Empirical asset pricing via machine learning. The Review of Financial Studies 33, 5 (2020),
2223–2273.[45] Shihao Gu, Bryan Kelly, and Dacheng Xiu. 2021. Autoencoder asset pricing models. Journal of Econometrics 222, 1 (2021), 429–450.[46] Olivier Guéant and Iuliia Manziuk. 2019. Deep reinforcement learning for market making in corporate bonds: Beating the curse of dimensionality.
Applied Mathematical Finance 26, 5 (2019), 387–452.[47] László Györfi, Gábor Lugosi, and Frederic Udina. 2006. Nonparametric kernel-based sequential investment strategies. Mathematical Finance: An
International Journal of Mathematics, Statistics and Financial Economics 16, 2 (2006), 337–357.[48] David P Helmbold, Robert E Schapire, Yoram Singer, and Manfred K Warmuth. 1998. On-line portfolio selection using multiplicative updates.
Mathematical Finance 8, 4 (1998), 325–347.[49] Dieter Hendricks and Diane Wilcox. 2014. A reinforcement learning extension to the Almgren-Chriss framework for optimal trade execution. In
Proceedings of the IEEE Conference on Computational Intelligence for Financial Engineering & Economics. 457–464.[50] Ehsan Hoseinzade and Saman Haratizadeh. 2019. CNNpred: CNN-based stock market prediction using a diverse set of variables. Expert Systems
with Applications 129 (2019), 273–285.[51] Ziniu Hu, Weiqing Liu, Jiang Bian, Xuanzhe Liu, and Tie-Yan Liu. 2018. Listening to chaotic whispers: A deep learning framework for news-oriented
stock trend prediction. In Proceedings of the 11th ACM International Conference on Web Search and Data Mining (WSDM). 261–269.[52] Chien-Feng Huang. 2012. A hybrid stock selection model using genetic algorithms and support vector regression. Applied Soft Computing 12, 2
(2012), 807–818.[53] Dingjiang Huang, Junlong Zhou, Bin Li, Steven HOI, and Shuigeng Zhou. 2013. Robust median reversion strategy for on-line portfolio selection. In
Proceedings of the 23rd International Joint Conference on Artificial Intelligence (IJCAI). 2006–2012.[54] Wei Huang, Yoshiteru Nakamori, and Shou-Yang Wang. 2005. Forecasting stock market movement direction with support vector machine.
Computers & Operations Research 32, 10 (2005), 2513–2522.[55] Zhenhan Huang and Fumihide Tanaka. 2021. A Modularized and Scalable Multi-Agent Reinforcement Learning-based System for Financial Portfolio
Management. arXiv preprint arXiv:2102.03502 (2021).[56] O Jangmin, Jongwoo Lee, Jae Won Lee, and Byoung-Tak Zhang. 2006. Adaptive stock trading with dynamic asset allocation using reinforcement
learning. Information Sciences 176, 15 (2006), 2121–2147.[57] Narasimhan Jegadeesh and Sheridan Titman. 1993. Returns to buying winners and selling losers: Implications for stock market efficiency. The
Journal of Finance 48, 1 (1993), 65–91.[58] Gyeeun Jeong and Ha Young Kim. 2019. Improving financial trading decisions using deep Q-learning: Predicting the number of shares, action
strategies, and transfer learning. Expert Systems with Applications 117 (2019), 125–138.[59] Zhengyao Jiang and Jinjun Liang. 2017. Cryptocurrency portfolio management with deep reinforcement learning. In 2017 Intelligent Systems
Conference (IntelliSys). 905–913.[60] Zhengyao Jiang, Dixing Xu, and Jinjun Liang. 2017. A deep reinforcement learning framework for the financial portfolio management problem.
arXiv preprint arXiv:1706.10059 (2017).[61] Sham M Kakade, Michael Kearns, Yishay Mansour, and Luis E Ortiz. 2004. Competitive algorithms for VWAP and limit order trading. In Proceedings
of the 5th ACM conference on Electronic Commerce (EC). 189–198.
Manuscript submitted to ACM
24 Sun et al.
[62] Zura Kakushadze. 2016. 101 formulaic alphas. Wilmott 2016, 84 (2016), 72–81.[63] Guolin Ke, Qi Meng, Thomas Finley, Taifeng Wang, Wei Chen, Weidong Ma, Qiwei Ye, and Tie-Yan Liu. 2017. Lightgbm: A highly efficient gradient
boosting decision tree. In Proceedings of the 30th Neural Information Processing Systems. 3146–3154.[64] Luckyson Khaidem, Snehanshu Saha, and Sudeepa Roy Dey. 2016. Predicting the direction of stock market prices using random forest. arXiv
preprint arXiv:1605.00003 (2016).[65] Vijay R Konda and John N Tsitsiklis. 2000. Actor-critic algorithms. Proceedings of the 14th Neural Information Processing Systems (NIPS), 1008–1014.[66] Jinho Lee, Raehyun Kim, Seok-Won Yi, and Jaewoo Kang. 2020. MAPS: Multi-agent reinforcement learning-based portfolio management system.
arXiv preprint arXiv:2007.05402 (2020).[67] Jae Won Lee and O Jangmin. 2002. A multi-agent Q-learning framework for optimizing stock trading systems. In Proceedings of the 13rd International
Conference on Database and Expert Systems Applications (DESA). 153–162.[68] Ming-Chi Lee. 2009. Using support vector machine with a hybrid feature selection method to the stock trend prediction. Expert Systems with
Applications 36, 8 (2009), 10896–10904.[69] Sergey Levine, Chelsea Finn, Trevor Darrell, and Pieter Abbeel. 2016. End-to-end training of deep visuomotor policies. Journal of Machine Learning
Research 17, 1 (2016), 1334–1373.[70] Bin Li and Steven CH Hoi. 2014. Online portfolio selection: A survey. Comput. Surveys 46, 3 (2014), 1–36.[71] Bin Li, Steven CH Hoi, and Vivekanand Gopalkrishnan. 2011. Corn: Correlation-driven nonparametric learning approach for portfolio selection.
ACM Transactions on Intelligent Systems and Technology 2, 3 (2011), 1–29.[72] Bin Li, Peilin Zhao, Steven CH Hoi, and Vivekanand Gopalkrishnan. 2012. PAMR: Passive aggressive mean reversion strategy for portfolio selection.
Machine Learning 87, 2 (2012), 221–258.[73] Wei Li, Ruihan Bao, Keiko Harimoto, Deli Chen, Jingjing Xu, and Qi Su. 2020. Modeling the stock relation with graph network for overnight stock
movement prediction. In Proceedings of the 29th International Joint Conference on Artificial Intelligence (IJCAI). 4541–4547.[74] Zhipeng Liang, Hao Chen, Junhao Zhu, Kangkang Jiang, and Yanran Li. 2018. Adversarial deep reinforcement learning in portfolio management.
arXiv preprint arXiv:1808.09940 (2018).[75] Timothy P Lillicrap, Jonathan J Hunt, Alexander Pritzel, Nicolas Heess, Tom Erez, Yuval Tassa, David Silver, and Daan Wierstra. 2015. Continuous
control with deep reinforcement learning. arXiv preprint arXiv:1509.02971 (2015).[76] Bryan Lim, Stefan Zohren, and Stephen Roberts. 2019. Enhancing time-series momentum strategies using deep neural networks. The Journal of
Financial Data Science 1, 4 (2019), 19–38.[77] Ye-Sheen Lim and Denise Gorse. 2018. Reinforcement learning for high-frequency market making. In Proceedings of the 26th European Symposium
on Artificial Neural Networks, Computational Intelligence and Machine Learning (ESANN).[78] Siyu Lin and Peter A Beling. 2020. An end-to-end optimal trade execution framework based on proximal policy optimization. In Proceedings of the
29th International Joint Conference on Artificial Intelligence (IJCAI). 4548–4554.[79] Guang Liu, Yuzhao Mao, Qi Sun, Hailong Huang, Weiguo Gao, Xuan Li, JianPing Shen, Ruifan Li, and Xiaojie Wang. 2020. Multi-scale two-way
deep neural network for stock trend prediction. In Proceedings of the 29th International Joint Conference on Artificial Intelligence (IJCAI). 4555–4561.[80] Yang Liu, Qi Liu, Hongke Zhao, Zhen Pan, and Chuanren Liu. 2020. Adaptive quantitative trading: An imitative deep reinforcement learning
approach. In Proceedings of the 32nd AAAI Conference on Artificial Intelligence (AAAI). 2128–2135.[81] Malik Magdon-Ismail and Amir F Atiya. 2004. Maximum drawdown. Risk Magazine 17, 10 (2004), 99–102.[82] Harry Markowitz. 1959. Portfolio Selection. Yale University Press New Haven.[83] Volodymyr Mnih, Koray Kavukcuoglu, David Silver, Andrei A Rusu, Joel Veness, Marc G Bellemare, Alex Graves, Martin Riedmiller, Andreas K
Fidjeland, Georg Ostrovski, et al. 2015. Human-level control through deep reinforcement learning. Nature 518, 7540 (2015), 529–533.[84] John Moody and Matthew Saffell. 2001. Learning to trade via direct reinforcement. IEEE Transactions on Neural Networks 12, 4 (2001), 875–889.[85] John Moody and Lizhong Wu. 1997. Optimization of trading systems and portfolios. In Proceedings of the IEEE/IAFE 1997 Computational Intelligence
for Financial Engineering. 300–307.[86] John Moody, Lizhong Wu, Yuansong Liao, and Matthew Saffell. 1998. Performance functions and reinforcement learning for trading systems and
portfolios. Journal of Forecasting 17, 5-6 (1998), 441–470.[87] Tobias J Moskowitz, Yao Hua Ooi, and Lasse Heje Pedersen. 2012. Time series momentum. Journal of Financial Economics 104, 2 (2012), 228–250.[88] Ralph Neuneier. 1996. Optimal asset allocation using adaptive dynamic programming. Proceedings of the 10th Neural Information Processing Systems
(NIPS), 952–958.[89] Ralph Neuneier. 1998. Enhancing Q-learning for optimal asset allocation. In Proceedings of the 12nd Neural Information Processing Systems (NIPS).
936–942.[90] Yuriy Nevmyvaka, Yi Feng, and Michael Kearns. 2006. Reinforcement learning for optimized trade execution. In Proceedings of the 23rd International
Conference on Machine Learning (ICML). 673–680.[91] Brian Ning, Franco Ho Ting Lin, and Sebastian Jaimungal. 2018. Double deep Q-learning for optimal execution. arXiv preprint arXiv:1812.06600
(2018).[92] Ahmet Murat Ozbayoglu, Mehmet Ugur Gudelek, and Omer Berat Sezer. 2020. Deep learning for financial applications: A survey. Applied Soft
Computing (2020), 106384.
Manuscript submitted to ACM

Reinforcement Learning for Quantitative Trading 25
[93] Theodore Panagiotidis, Thanasis Stengos, and Orestis Vravosinos. 2018. On the determinants of bitcoin returns: A LASSO approach. FinanceResearch Letters 27 (2018), 235–240.
[94] Jigar Patel, Sahil Shah, Priyank Thakkar, and Ketan Kotecha. 2015. Predicting stock and stock price index movement using trend deterministic datapreparation and machine learning techniques. Expert Systems with Applications 42, 1 (2015), 259–268.
[95] James M Poterba and Lawrence H Summers. 1988. Mean reversion in stock prices: Evidence and implications. Journal of Financial Economics 22, 1(1988), 27–59.
[96] Gavin A Rummery and Mahesan Niranjan. 1994. On-line Q-learning Using Connectionist Systems. University of Cambridge, Department ofEngineering Cambridge, UK.
[97] Francesco Rundo, Francesca Trenta, Agatino Luigi di Stallo, and Sebastiano Battiato. 2019. Machine learning for quantitative finance applications:A survey. Applied Sciences 9, 24 (2019), 5574.
[98] Ramit Sawhney, Shivam Agarwal, Arnav Wadhwa, and Rajiv Shah. 2021. Exploring the Scale-Free Nature of Stock Markets: Hyperbolic GraphLearning for Algorithmic Trading. In Proceedings of the Web Conference 2021. 11–22.
[99] Ramit Sawhney, Arnav Wadhwa, Shivam Agarwal, and Rajiv Shah. 2021. Quantitative Day Trading from Natural Language using ReinforcementLearning. In Proceedings of the 2021 Conference of the North American Chapter of the Association for Computational Linguistics (NAACL). 4018–4030.
[100] John Schulman, Filip Wolski, Prafulla Dhariwal, Alec Radford, and Oleg Klimov. 2017. Proximal policy optimization algorithms. arXiv preprintarXiv:1707.06347 (2017).
[101] Sreelekshmy Selvin, R Vinayakumar, EA Gopalakrishnan, Vijay Krishna Menon, and KP Soman. 2017. Stock price prediction using LSTM, RNNand CNN-sliding window model. In Proceedings of the 6th International Conference on Advances in Computing, Communications and Informatics(ICACCI). 1643–1647.
[102] Omer Berat Sezer, Mehmet Ugur Gudelek, and Ahmet Murat Ozbayoglu. 2020. Financial time series forecasting with deep learning: A systematicliterature review: 2005–2019. Applied Soft Computing 90 (2020), 106181.
[103] William F Sharpe. 1964. Capital asset prices: A theory of market equilibrium under conditions of risk. The Journal of Finance 19, 3 (1964), 425–442.[104] William F Sharpe. 1994. The sharpe ratio. Journal of Portfolio Management 21, 1 (1994), 49–58.[105] Si Shi, Jianjun Li, Guohui Li, and Peng Pan. 2019. Amulti-scale temporal feature aggregation convolutional neural network for portfolio management.
In Proceedings of the 28th ACM International Conference on Information and Knowledge Management (CIKM). 1613–1622.[106] Weiyu Si, Jinke Li, Peng Ding, and Ruonan Rao. 2017. A multi-objective deep reinforcement learning approach for stock index future’s intraday
trading. In Proceeding of the 10th International Symposium on Computational Intelligence and Design (ISCID). 431–436.[107] David Silver, Aja Huang, Chris J Maddison, Arthur Guez, Laurent Sifre, George Van Den Driessche, Julian Schrittwieser, Ioannis Antonoglou, Veda
Panneershelvam, Marc Lanctot, et al. 2016. Mastering the game of Go with deep neural networks and tree search. Nature 529, 7587 (2016), 484–489.[108] David Silver, Guy Lever, Nicolas Heess, Thomas Degris, Daan Wierstra, and Martin Riedmiller. 2014. Deterministic policy gradient algorithms. In
Proceedings of the 31st International Conference on Machine Learning (ICML). 387–395.[109] Thomas Spooner, John Fearnley, Rahul Savani, and Andreas Koukorinis. 2018. Market making via reinforcement learning. arXiv preprint
arXiv:1804.04216 (2018).[110] Thomas Spooner and Rahul Savani. 2020. Robust market making via adversarial reinforcement learning. arXiv preprint arXiv:2003.01820 (2020).[111] Xiaolei Sun, Mingxi Liu, and Zeqian Sima. 2020. A novel cryptocurrency price trend forecasting model based on LightGBM. Finance Research
Letters 32 (2020), 101084.[112] Richard S Sutton and Andrew G Barto. 2018. Reinforcement Learning: An Introduction. MIT press.[113] Christian Szegedy, Wei Liu, Yangqing Jia, Pierre Sermanet, Scott Reed, Dragomir Anguelov, Dumitru Erhan, Vincent Vanhoucke, and Andrew
Rabinovich. 2015. Going deeper with convolutions. In Proceedings of the IEEE Conference on Computer Vision and Pattern Recognition. 1–9.[114] Lawrence Takeuchi and Yu-Ying Albert Lee. 2013. Applying deep learning to enhance momentum trading strategies in stocks. Technical report.[115] Leigh Tesfatsion and Kenneth L Judd. 2006. Handbook of Computational Economics: Agent-based Computational Economics.[116] Alaa Tharwat, Tarek Gaber, Abdelhameed Ibrahim, and Aboul Ella Hassanien. 2017. Linear discriminant analysis: A detailed tutorial. AI
communications 30, 2 (2017), 169–190.[117] Chih-Fong Tsai and Yu-Chieh Hsiao. 2010. Combining multiple feature selection methods for stock prediction: Union, intersection, and multi-
intersection approaches. Decision Support Systems 50, 1 (2010), 258–269.[118] Oriol Vinyals, Igor Babuschkin, Wojciech M Czarnecki, Michaël Mathieu, Andrew Dudzik, Junyoung Chung, David H Choi, Richard Powell, Timo
Ewalds, Petko Georgiev, et al. 2019. Grandmaster level in StarCraft II using multi-agent reinforcement learning. Nature 575, 7782 (2019), 350–354.[119] Edoardo Vittori, Martino Bernasconi de Luca, Francesco Trovò, and Marcello Restelli. 2020. Dealing with transaction costs in portfolio optimization:
Online gradient descent with momentum. In Proceedings of the 1st ACM International Conference on AI in Finance (ICAIF). 1–8.[120] Edoardo Vittori, Michele Trapletti, and Marcello Restelli. 2020. Option hedging with risk averse reinforcement learning. arXiv preprint
arXiv:2010.12245 (2020).[121] Svitlana Vyetrenko, David Byrd, Nick Petosa, Mahmoud Mahfouz, Danial Dervovic, Manuela Veloso, and Tucker Hybinette Balch. 2019. Get real:
Realism metrics for robust limit order book market simulations. arXiv preprint arXiv:1912.04941 (2019).[122] Jingyuan Wang, Yang Zhang, Ke Tang, Junjie Wu, and Zhang Xiong. 2019. Alphastock: A buying-winners-and-selling-losers investment strategy
using interpretable deep reinforcement attention networks. In Proceedings of the 25th ACM SIGKDD International Conference on Knowledge Discovery& Data Mining (KDD). 1900–1908.
Manuscript submitted to ACM

26 Sun et al.
[123] Rundong Wang, Hongxin Wei, Bo An, Zhouyan Feng, and Jun Yao. 2020. Commission fee is not enough: A hierarchical reinforced framework forportfolio management. arXiv preprint arXiv:2012.12620 (2020).
[124] Zhicheng Wang, Biwei Huang, Shikui Tu, Kun Zhang, and Lei Xu. 2021. DeepTrader: A deep reinforcement learning approach to risk-returnbalanced portfolio management with market conditions embedding. In Proceedings of the 35th AAAI Conference on Artificial Intelligence (AAAI).
[125] Christopher JCH Watkins and Peter Dayan. 1992. Q-learning. Machine Learning 8, 3-4 (1992), 279–292.[126] Ronald J Williams. 1992. Simple statistical gradient-following algorithms for connectionist reinforcement learning. Machine learning 8, 3-4 (1992),
229–256.[127] Svante Wold, Kim Esbensen, and Paul Geladi. 1987. Principal component analysis. Chemometrics and Intelligent Laboratory Systems 2, 1-3 (1987),
37–52.[128] Bo K Wong and Yakup Selvi. 1998. Neural network applications in finance: A review and analysis of literature (1990–1996). Information &
Management 34, 3 (1998), 129–139.[129] Lan Wu and Yuehan Yang. 2014. Nonnegative elastic net and application in index tracking. Appl. Math. Comput. 227 (2014), 541–552.[130] Zonghan Wu, Shirui Pan, Fengwen Chen, Guodong Long, Chengqi Zhang, and S Yu Philip. 2020. A comprehensive survey on graph neural
networks. IEEE Transactions on Neural Networks and Learning Systems 32, 1 (2020), 4–24.[131] Zhuoran Xiong, Xiao-Yang Liu, Shan Zhong, Hongyang Yang, and Anwar Walid. 2018. Practical deep reinforcement learning approach for stock
trading. arXiv preprint arXiv:1811.07522 (2018).[132] Ke Xu, Yifan Zhang, Deheng Ye, Peilin Zhao, and Mingkui Tan. 2020. Relation-Aware Transformer for Portfolio Policy Learning.. In Proceedings of
the 29th International Joint Conference on Artificial Intelligence (IJCAI). 4647–4653.[133] Wentao Xu, Weiqing Liu, Chang Xu, Jiang Bian, Jian Yin, and Tie-Yan Liu. 2021. REST: Relational Event-driven Stock Trend Forecasting. In
Proceedings of the Web Conference 2021. 1–10.[134] Yumo Xu and Shay B Cohen. 2018. Stock movement prediction from tweets and historical prices. In Proceedings of the 56th Annual Meeting of the
Association for Computational Linguistics (ACL). 1970–1979.[135] Hongyang Yang, Xiao-Yang Liu, Shan Zhong, and Anwar Walid. 2020. Deep reinforcement learning for automated stock trading: An ensemble
strategy. Available at SSRN (2020).[136] Yunan Ye, Hengzhi Pei, Boxin Wang, Pin-Yu Chen, Yada Zhu, Ju Xiao, and Bo Li. 2020. Reinforcement-learning based portfolio management with
augmented asset movement prediction states. In Proceedings of the 34th AAAI Conference on Artificial Intelligence (AAAI). 1112–1119.[137] Pengqian Yu, Joon Sern Lee, Ilya Kulyatin, Zekun Shi, and Sakyasingha Dasgupta. 2019. Model-based deep reinforcement learning for dynamic
portfolio optimization. arXiv preprint arXiv:1901.08740 (2019).[138] Yuyu Yuan, Wen Wen, and Jincui Yang. 2020. Using data augmentation based reinforcement learning for daily stock trading. Electronics 9, 9 (2020),
1384.[139] Chuheng Zhang, Yuanqi Li, Xi Chen, Yifei Jin, Pingzhong Tang, and Jian Li. 2020. DoubleEnsemble: A new ensemble method based on sample
reweighting and feature selection for financial data analysis. arXiv preprint arXiv:2010.01265 (2020).[140] Dongsong Zhang and Lina Zhou. 2004. Discovering golden nuggets: Data mining in financial application. IEEE Transactions on Systems, Man, and
Cybernetics, Part C (Applications and Reviews) 34, 4 (2004), 513–522.[141] Liheng Zhang, Charu Aggarwal, and Guo-Jun Qi. 2017. Stock price prediction via discovering multi-frequency trading patterns. In Proceedings of
the 23rd ACM SIGKDD International Conference on Knowledge Discovery & Data Mining (KDD). 2141–2149.[142] Tianping Zhang, Yuanqi Li, Yifei Jin, and Jian Li. 2020. AutoAlpha: An efficient hierarchical evolutionary algorithm for mining alpha factors in
quantitative investment. arXiv preprint arXiv:2002.08245 (2020).[143] Yifan Zhang, Peilin Zhao, Bin Li, Qingyao Wu, Junzhou Huang, and Mingkui Tan. 2020. Cost-sensitive portfolio selection via deep reinforcement
learning. IEEE Transactions on Knowledge and Data Engineering (2020).[144] Zihao Zhang, Stefan Zohren, and Stephen Roberts. 2020. Deep reinforcement learning for trading. The Journal of Financial Data Science 2, 2 (2020),
25–40.[145] Yueyang Zhong, YeeMan Bergstrom, and Amy Ward. 2020. Data-driven market-making via model-free learning. In Proceedings of the 29th
International Joint Conference on Artificial Intelligence (IJCAI). 2327–2333.[146] Dawei Zhou, Lecheng Zheng, Yada Zhu, Jianbo Li, and Jingrui He. 2020. Domain adaptive multi-modality neural attention network for financial
forecasting. In Proceedings of the 29th Web Conference (WWW). 2230–2240.
Manuscript submitted to ACM