reinventing air quality...
TRANSCRIPT

I
REINVENTING AIR QUALITY MONITORING: POTENTIAL OF LOW COST ALTERNATIVE MONITORING METHODS
REINVENTING AIR QUALITY MONITORING
Potential of low cost alternative monitoring methods
Centre for Science and Environment

II

1
Centre for Science and Environment
REINVENTING AIR QUALITY MONITORING
Potential of low cost alternative monitoring methods

2
Writers: Anumita Roychowdhury, Vivek Chattopadhyaya and Shambhavi Shukla
Editor: Souparno Banerjee
Production: Rakesh Shrivastava and Gundhar Das
© 2016 Centre for Science and Environment
This publication is not for sale. Material from this publication can be used, but with acknowledgement.
Published byCentre for Science and Environment41, Tughlakabad Institutional Area, New Delhi 110 062
Phones: 91-11-40616000
Fax: 91-11-29955879
E-mail: [email protected]
Website: www.cseindia.org
We are grateful to Shakti Sustainable Energy Foundation for its support. The Foundation works to strengthen the energy security of India by aiding the design and implementation of policies that support energy efficiency, renewable energy and the adoption of sustainable urban transport solutions. The views expressed and analysis presented in this document do not necessarily represent those of the Foundation and it accepts no liability for the content of this document, or for the consequences of any actions taken on the basis of the information provided.

3
Part 1: Understanding regulatory air quality monitoring in India 7
Monitoringnetworkdecidedaccordingtostatedgoals 7
Qualitycontrolofairqualitymonitoringforcredibleandreliabledata 9
Manualversusautomaticmonitoring 9
Linkairqualitymonitoringwithroutinepublicinformationsystem 10
Buildcapabilityforpollutionforecast 12
Costconsiderationsandinstitutionalcapacity 13
Part 2: What is sensor based alternative air quality monitoring? 16
Wirelesssensornetworks 17
Researchandpublicinterest 17
Globalawarenessinitiatives 21
Regulatoryinterestinalternativemonitoringmethods 22
EuropeanUnionPolicyonmicrosensors 23
UNEPtakeleadinAfrica 24
Experimentsthrowingupquestions 30
Thewayforward 30
Annexure 32
References 34
Contents

4
With national ambient air quality standards in place, it is important to set up the air quality monitoring grid to generate air quality data on a routine basis. This will help assess risks and implement control
measures. While advanced countries including the US, Japan and European nations have evolved advanced monitoring systems, most developing countries of Asia and Africa are still languishing with very basic monitoring or no monitoring at all. Advanced systems are more resource-intensive and need strong and robust infrastructure and technical capacity for quality control of data, operations and dissemination. This is often much beyond the affordability and institutional capacity of cities in the developing world.
This, however, needs to be said with a caveat. Indian cities do not have to wait for monitoring to happen in each and every city to enable action. Mounting evidences on health impacts of air pollution and also diagnostic air quality data that many cities have started to generate are enough to build the case for urgent action. But cities still need plans for rolling out monitoring that will help understand the changing nature of local risk and exposure to refine action.
Out of the 5,000 cities and towns in India, a regulatory monitoring network exists only in 268. Out of these, only 24 cities have some capacity to do real-time monitoring. The rest rely on manual monitoring which is inefficient, vulnerable to weak quality control and results in inordinate delays in data reporting. In fact, the latest published air quality data under the National Ambient Air Quality Programme of the Central Pollution Control Board (CPCB) is for the year 2012. This data makes air quality monitoring irrelevant to public health protection as this does not allow informed and instantaneous response or to calibrate stringency of action to meet clean air targets over time.
Even public opinion and understanding of risk from air quality remains inert and unresponsive if real-time information is not available. This is a serious concern as according to the Global Burden of Disease estimation, air pollution is the fifth largest killer in India. Experience of big cities like Delhi, Mumbai and Kolkata have shown that public opinion can be a catalyst and it can create bottom up pressure to push for change. Real time monitoring of key pollutants and its continuous dissemination is important to inform both policy and public opinion. Most cities are in data vacuum today.
Regulatory monitoring that the CPCB and state pollution control boards (SPCBs) administer are elaborate and expensive systems that are taking a while to get implemented nation-wide. In the best case scenario about 700 cities are expected to have modicum of monitoring over the next five years.
Most cities in India and also in the rest of the developing areas are grappling with the question of how to choose techniques of monitoring that can be deployed quickly and is affordable. The choices swing between very complex and advanced systems to simpler manual techniques. There is a clear trade-off between equipment cost, complexity, reliability and performance. Advance technologies also require institutional capacity for operations and maintenance.
Resource constraints and the availability of skilled personnel are limiting factors in poorer developing cities like India. Advanced systems can provide increasingly refined data and greater temporal resolution of measurement but may be more skill-intensive, require operation support, are more expensive to operate and maintain. Sometime inappropriate, too complex equipment can become failure-prone without proper service back up and result in poor

5
REINVENTING AIR QUALITY MONITORING: POTENTIAL OF LOW COST ALTERNATIVE MONITORING METHODS
network performance affecting data quality. Thus, it can be wasteful. These are the critical questions that the cities have to weigh in today.
While there is strong reason for regulatory air quality monitoring to expand, science has made a new genre of alternative monitoring methods possible. Science has enabled development of a range of monitoring techniques and approaches that can be deployed for broad assessment of cities and regions. There are widely different alternative approaches. At a macro scale there are satellite remote sensing methods that are often operated by the international or national remote sensing agencies. Science is opening up other opportunities. Air quality regulators are leveraging remote sensing and satellite imagery to map out pollution challenge and forecast trends (BOX: Satellite based air quality monitoring). At micro scale there are google maps that allow data collection. These have opened up new approaches and new tools that are used by research bodies.
To this is added yet another interesting area of development that are sensor based low cost monitors that can be deployed in large numbers across urban and rural scape to generate local data. These systems had originated couple of decades ago to assess exposures of women to biomass based cook stoves in indoor situations. These systems have evolved further for outdoor air monitoring. Simplicity of their application and low cost allows these to be used by even general public. This has helped to democratize data in regions where infrastructure is limited or non-existent. It is possible to carry out exposure mapping across micro environment and make that data accessible to people.
These technologies have provoked intense public interest as it is now possible for people to own and monitor the surrounding air and understand the level of actual exposure. This is the emergence of citizens’ science in our cities. This is a powerful tool to connect people with the problem, demystify the smog and demand action.
Along with this technological innovation comes the regulatory question – can these alternative methods have the potential for regulatory monitoring? This curiosity is most compelling in the developing world of Asia and Africa where in most parts regulatory monitoring is virtually non-existent. Several experiments have been initiated to assess the potential of these monitoring systems to help develop baseline data for cities that do not have any data. There are many questions about their efficacy, reliability, durability, how they compare with regulatory monitors. In fact there are so many different types of these devices from very small to reasonably big, from very low cost to moderately expensive, with different dissemination methods through mobile application. Centre for Science and Environment (CSE) has been approached by several vendors and users of low cost sensor based monitors with widely different techniques and application. It is time to explore some of these questions to get clarity and guidance.
There are no clear answers yet. But a deep dive and constant tracking of innovation and validation of these new methods is important to help the developing world to amass data to create a baseline, inform decisions and opinion. It has therefore become necessary to understand how these alternatives monitoring methods are different from the regulatory methods and how do they compare with the regulatory methods? What are the barriers and potential of their use?
6
REINVENTING AIR QUALITY MONITORING: POTENTIAL OF LOW COST ALTERNATIVE MONITORING METHODS
Satellite-based air quality monitoring
Satellite- based monitoring provides information over a larger geographical area. It is mostly done for measuring particulate
matter (PM), SO2 and NOx. The most commonly used instruments for estimating PM are the Moderate Resolution Imaging
Spectrometer (MODIS) and the Multi- angle Imaging Spectro-radiometer (MISR). These instruments are used to retrieve
Aerosol Optical Depth (AOD). The spatial resolution of operational AOD retrievals is typically about 10 km x 10 km for
MODIS and 18 km x 18 km for MISR.
What continues to be a challenge is conversion of the AOD satellite data into ground-based PM 2.5 concentrations. The
factors affecting conversion include ‘surface reflectance variability’, ‘aerosol vertical profile’, ‘aerosol hygroscopy’ and
sampling techniques. AOD is a visibility-based measure over the total column of the atmosphere which is averaged over the
total area, whereas PM2.5 measurement takes physical dry mass measurements done from single ground-based stations.
Satellite technology enables monitoring over remote areas and oceans. It is important to validate the ground-based data
along with satellite measurements for accurate readings. Satellite remote sensing has the potential to overcome the gaps
in data of ground-based monitors by providing wall-to-wall coverage over decadal time scales for important environmental
parameters.
Satellite data retrieved for various pollutants can be aggregated and averaged over time to generate trends of these
pollutants. This data can then be utilised by policymakers to take informed decisions. The satellite-based indicators can help
discover potential sources of pollution by comparing across units. Citizens can use the indicators to take decisions about
their health management. These indicators can summarise various environmental trends and issues.
The National Aeronautics and Space Administration (NASA) of USA has traditionally developed satellite missions to support
scientific research with little regard for long term operational uses. Operational satellites were left to USGS (Landsat)
and NOAA (meteorological satellites). The development of PM2.5 indicators for India had garnered significant attention
when they were released in 2014 in the Environment Protection Indices; this had pointed to the great scope that lay in the
development of satellite-based indicators.
A recent study conducted by NASA has seen an increase in SO2 emissions in Indian cities. Data from the Aura satellite of
NASA says that SO2 emissions from Indian power plants have increased by more than 60 per cent between 2005 and 2012.
India ranks second in the world (after China) in terms of SO2 emissions. However, the data from the CPCB’s 361 ground
monitoring stations indicate a decrease in SO2 concentrations. With most monitors located in urban areas, only 70 stations
conduct monitoring in industrial locations. There is also the Ozone Monitoring Instrument (OMI), which measures ozone
and other pollutants like SO2, NOX etc. It points to an increase in SO2 concentrations from 2005-2012.
7
REINVENTING AIR QUALITY MONITORING: POTENTIAL OF LOW COST ALTERNATIVE MONITORING METHODS
In India, the air quality monitoring strategy has been established by the Central Pollution Control Board (CPCB), the apex monitoring agency in the country. The CPCB has adopted monitoring protocols and rules related to monitoring
network design, selection of pollutants and meteorological factors, quality control and assurance for credible data, data reporting and pubic information system and phase-in plan for real time monitoring. Pollution forecasting is still not part of the official monitoring system, though other scientific bodies including the Pune-based Indian Institute of Tropical Meteorology have developed those capabilities.
The current monitoring system is capable of establishing baseline air quality data in cities. It helps evaluate the status and trends in pollution; it also helps to know if pollution control strategies are working. This also determines environmental exposure and the cleansing potential of the environment through dilution, dispersion, wind movement, dry deposition, precipitation and chemical transformation of the pollutants generated.
Indian cities are dominated by manual monitoring in which quality control and reliable operation is a challenge. Only 24 cities have a capacity to carry out automatic real time monitoring. Manual monitoring often fails to meet the minimum requirement of number of days to be monitored in a year. For instance, to arrive at an annual average in India, at least 104 measurements in a year are necessary. The measurements must be taken twice a week, 24-hourly, at uniform intervals. Sometimes, data has to be rejected as cities fail to meet the basic criteria. Moreover, there are serious challenges related to calibration and quality control of data. Manual monitoring is much less efficient in capturing pollution levels compared to automatic real-time monitors. The assessment of Centre for Science and Environment throws light on how manual monitoring can underestimate particulate levels in Delhi by as much as 28 per cent compared to real-time monitors.
It is advisable that cities that are establishing new monitoring systems should try to garner resources to establish automatic real-time monitoring.
Monitoring network decided according to stated goals There are no universal rules for network design or the number of monitors needed in a city. A large number of criteria govern the decisions -- such as where most people live, the pollutants they are exposed to, the kind of exposure they face in their micro environments, and the need for a daily alert system.
While international guidelines provide the basic criteria for the minimum required number of monitoring stations, there is no universal rule for minimum number of monitoring sites as this would be different for areas with complex terrain or mixed emissions distribution. A monitoring network has to ensure that the measurements taken are adequate and representative of the air quality conditions of the area. Sizing also involves trade-offs on the resources available, distribution of pollutant sources, and local meteorological conditions and topography that affect the dispersion of pollutants. In most guidelines, while values and categories vary, the minimum number of monitoring stations is determined according to population and pollution levels. Guidelines developed by Clean Air for Asia (CAI Asia) for the Asian region recommend
Understanding regulatory air quality monitoring in India

8
REINVENTING AIR QUALITY MONITORING: POTENTIAL OF LOW COST ALTERNATIVE MONITORING METHODS
more monitoring stations in areas with higher levels of pollution. The minimum number of stations is also dependent on the type of pollutant monitored.1
Factors that influence the decision on number of monitoring sites include complicated terrain, different types of sources distributed in the urban area, and the spectrum of emitted pollutants, among others. The network needs to provide sufficient information within available resources.2
In India, the minimum requirement is three monitoring stations. The location is dependent upon the wind rose diagram that gives predominant wind directions and speed. One station must be located upstream of the predominant wind direction, while the other two must be located downstream. More than three stations can also be established depending upon the area of coverage.3 The criteria for setting air quality monitoring stations requires that cities having population between 100,000 to 10,00,000 need at least three stations per city; mega cities (cities with more than 10 million people) need at least nine stations per city; and state capitals and industrial areas/cities each need at least six stations per city.
It is observed that the monitoring coverage of cities from developing countries only achieve the bare minimum, while the coverage for developed countries is more than double the prescribed number. For example, Dhaka in Bangladesh has only three monitoring stations for a population of 14 million, whereas Chiba in Japan has 19 monitoring stations to cover a population of 96,000.4
The Indian protocol for monitoring mandates certain basic requirements. The site should be away from major pollution sources. Distance depends upon the source, its height and its emissions -- the monitoring station should be at least 25 meters away from domestic chimneys etc. The instrument must be located in a place where free flow of air is available and it should not be located in a confined space. Ambient monitoring should be done at a 3-10 metre height. India has a provision for downtown pedestrian exposure stations in congested urban areas. While the average daily travel on the street should exceed 10,000 vehicles, pedestrian monitoring is to be done at three meter height from streets.
Simultaneously, weather or meteorological information is needed as weather has great influence on air quality. It is important to generate meteorological data on temperature, relative humidity, wind speed and direction. Wind direction plays an important role. The monitoring stations should be located in areas that are downwind from the sources. Mixing height data should be collected. Seasonal information is also required.
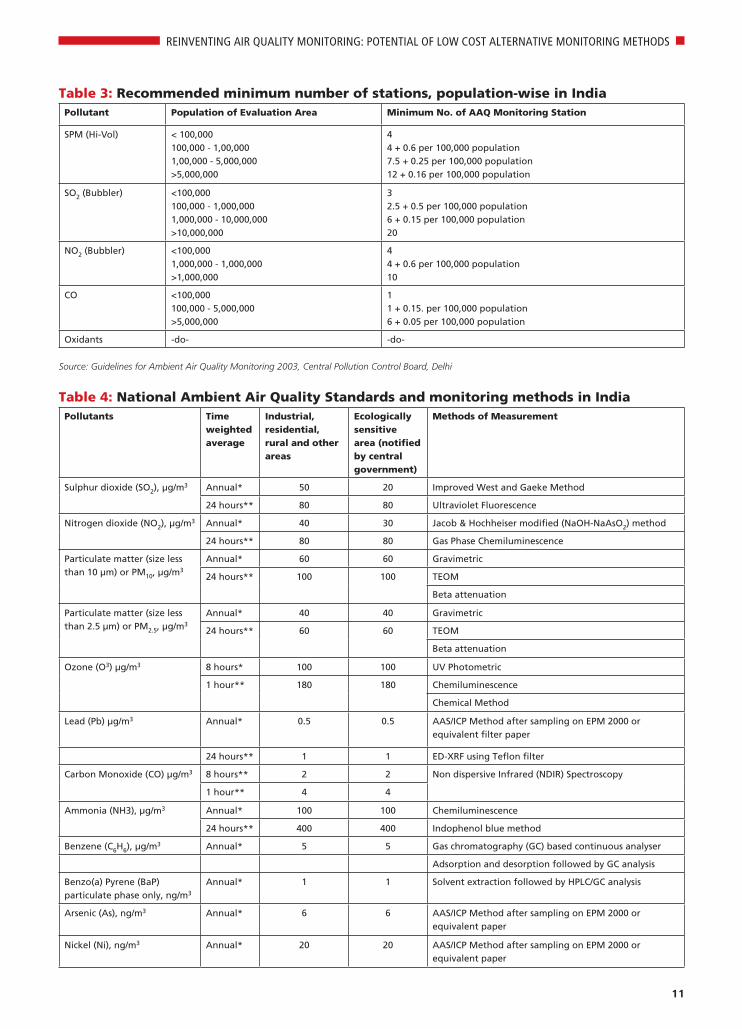
According to the CAI Asia guidelines on air quality monitoring, cities with relatively flat terrain and no heavy industrial areas can have minimal air quality monitoring sites. However, for cities with complicated terrain and many heavy industrial areas, there is a need more monitoring sites. Additional assessments or modeling with basic emissions inventory is recommended to determine whether the recommended minimum number of monitoring sites is adequate5 (see Tables 1: Prescribed number of PM10 sampling points recommended by EU according to pollution levels and population agglomeration; 2: US criteria of PM10 minimum monitoring requirements; 3: Recommended minimum number of stations, population-wise in India; and 4: National Ambient air quality standards and monitoring methods in India).
There are a number of approaches to designing a network and selecting sites. Assessment needs to target both source-oriented monitoring sites (often
9
REINVENTING AIR QUALITY MONITORING: POTENTIAL OF LOW COST ALTERNATIVE MONITORING METHODS
synonymous with worst-case or hot-spot environments) and background locations optimised for quantifying general population exposure. Depending on the pollutants being assessed, data from a wide variety of location types may, therefore, be necessary to build up a reasonably complete picture of ambient exposure patterns.6
Overall, the factors that determine the network design of monitors and site locations include major sources of emissions of pollutants in the area; target receptors and environments; weather and topography; model simulations of dispersion patterns in the area; existing air quality information (such as from screening studies); and data on demography, health and land use.
There are urban planning objectives that are ingrained in setting up air quality monitoring systems. Once the background level of key pollutants are known the agencies can decide where to set up industries, how much a selected area can withstand the emissions without causing damages etc – which essentially means what is the carrying capacity and dilution capability of local meteorological conditions. Town planning also involves the local environmental conditions.
Quality control of air quality monitoring for credible and reliable data Quality control for credible and reliable data is of utmost importance. This would include quality assurance programme for comparability of data from various agencies; quality assurance in laboratory – periodic calibrations, duplicate checks, split samples, spiked samples and the keeping of adequate and neat records; on-site system surveys, independent performance audits, inter-laboratory comparisons and periodic evaluation of internal quality assurance data etc; data handling and presentation; calibration and auditing of equipments and training, infrastructure, skill building, power supply etc.
CPCB has developed protocol for quality assurance. System and instrument audit for operation and performance will be critical. Experience in developing country cities show gamut of challenges – lack of certification of monitoring instruments, lack of standardized methods for calibration, high error levels, poor comparability and repeatability of results, high variability in results are not checked, little control over monitoring environment conditions, lack of spare parts and stand by equipment, and even erratic power supply. All these will have to be addressed and prevented while developing the protocol for monitoring.
The standard operation practices are defined by CPCB. This will have to pay attention to data quality, measurement methods, site selection, instrumentation, network design and location of monitoring, data validation, and capacity building. Adequate size and scope of air quality monitoring system based on population and area size. Several countries have published detailed guidelines to decide number of monitoring stations. For instance, India has published Guidelines for Ambient Air Quality Monitoring in 2003.7
Manual versus automatic monitoring Automatic analyzers can be used to monitor all gases and particulate matter of all size fractions. These are sophisticated analyzers with good quality control and assurance. Instant online real time data generation and dissemination takes place. This also helps in air quality index and early warning system and forecasting and modelling. In case of manual monitoring PM10 and PM2.5 and most gases in particulate matter can be monitored. In gravimetric method, sample processing is done by chemical analysers and for gases, wet analysers

10
REINVENTING AIR QUALITY MONITORING: POTENTIAL OF LOW COST ALTERNATIVE MONITORING METHODS
Table 1: Prescribed number of PM10 sampling points recommended by EU according to pollution levels and population agglomerationPopulation of agglomeration or zone (thousands)
Number of PM10 monitoring stations needed if the pollution level is high
Number of PM10 monitoring stations needed if the pollution level is low
0-249 2 1
250-499 3 2
500-749 3 2
750-999 4 2
1 000-1 499 6 3
1 500-1 999 7 3
2 000-2 749 8 4
2 750-3 749 10 4
3 750-4 749 11 6
4 750-5 999 13 6
≥ 6 000 15 7
Source: 11.6.2008, Official Journal of the European Union, DIRECTIVE 2008/50/EC OF THE EUROPEAN PARLIAMENT AND OF THE COUNCIL of 21 May 2008
on ambient air quality and cleaner air for Europe
http://eur-lex.europa.eu/legal-content/EN/TXT/HTML/?uri=CELEX:32008L0050&from=en#ntr1-L_2008152EN.01002101-E0001
Table 2: US Criteria of PM 10 Minimum Monitoring RequirementsPopulation category High concentration2 Medium concentration3 Low concentration4,5
>1,000,000 6-10 4-8 2-4
500,000-1,000,000 4-8 2-4 1-2
250,000-500,000 3-4 1-2 0-1
100,000-250,000 1-2 0-1 0
Notes: 1. Selection of urban areas and actual numbers of stations per area jointly determined by EPA and the State agency.
2. High concentration areas are those for which ambient PM10 data show ambient concentrations exceeding the PM 10 NAAQS by 20 percent or more.
3. Medium concentration areas are those for which ambient PM10 data show ambient concentrations exceeding 80 percent of the PM 10 NAAQS.
4. Low concentration areas are those for which ambient PM10 data show ambient concentrations less than 80 percent of the PM 10 NAAQS.
5. These minimum monitoring requirements apply in the absence of a design value.
Source: 40 CFR Part 58, Appendix D to Part 58 - Network Design Criteria for Ambient Air Quality Monitoring, USEPA, https://www.law.cornell.edu/cfr/text/40/
part-58/appendix-D
are used. However, challenges pertaining to quality assurance and quality control remain in manual monitoring such as delayed reporting and no instant relay of data etc.
Delhi relays real time air quality data. This is user friendly. One can access the station wise continuous real time hourly update or 24 hour average data. Back data is also available. However, there are maintenance issues.
Link air quality monitoring with routine public information system CPCB has adopted air quality index (AQI) system, a globally established tool to classify the air quality in different categories based on the severity of the problem. The AQI is used to inform people along with health advisories. Along with the AQI health advisories are important and should be framed to indicate expected health outcome at certain level of pollution mainly among the susceptible population and healthy population. Public information system through media, bill boards and other media should be designed for maximum outreach.
11
REINVENTING AIR QUALITY MONITORING: POTENTIAL OF LOW COST ALTERNATIVE MONITORING METHODS
Table 3: Recommended minimum number of stations, population-wise in India Pollutant Population of Evaluation Area Minimum No. of AAQ Monitoring Station
SPM (Hi-Vol) < 100,000 100,000 - 1,00,000 1,00,000 - 5,000,000 >5,000,000
44 + 0.6 per 100,000 population 7.5 + 0.25 per 100,000 population 12 + 0.16 per 100,000 population
SO2 (Bubbler) <100,000 100,000 - 1,000,000 1,000,000 - 10,000,000 >10,000,000
3 2.5 + 0.5 per 100,000 population 6 + 0.15 per 100,000 population 20
NO2 (Bubbler) <100,000 1,000,000 - 1,000,000 >1,000,000
4 4 + 0.6 per 100,000 population 10
CO <100,000 100,000 - 5,000,000 >5,000,000
1 1 + 0.15. per 100,000 population 6 + 0.05 per 100,000 population
Oxidants -do- -do-
Source: Guidelines for Ambient Air Quality Monitoring 2003, Central Pollution Control Board, Delhi
Table 4: National Ambient Air Quality Standards and monitoring methods in IndiaPollutants Time
weighted average
Industrial, residential, rural and other areas
Ecologically sensitive area (notified by central government)
Methods of Measurement
Sulphur dioxide (SO2), μg/m3 Annual* 50 20 Improved West and Gaeke Method
24 hours** 80 80 Ultraviolet Fluorescence
Nitrogen dioxide (NO2), μg/m3 Annual* 40 30 Jacob & Hochheiser modified (NaOH-NaAsO2) method
24 hours** 80 80 Gas Phase Chemiluminescence
Particulate matter (size less than 10 μm) or PM10, μg/m3
Annual* 60 60 Gravimetric
24 hours** 100 100 TEOM
Beta attenuation
Particulate matter (size less than 2.5 μm) or PM2.5, μg/m3
Annual* 40 40 Gravimetric
24 hours**
60
60
TEOM
Beta attenuation
Ozone (O3) μg/m3
8 hours* 100 100 UV Photometric
1 hour** 180 180 Chemiluminescence
Chemical Method
Lead (Pb) μg/m3 Annual* 0.5 0.5 AAS/ICP Method after sampling on EPM 2000 or equivalent filter paper
24 hours** 1 1 ED-XRF using Teflon filter
Carbon Monoxide (CO) μg/m3 8 hours** 2 2 Non dispersive Infrared (NDIR) Spectroscopy 1 hour** 4 4
Ammonia (NH3), μg/m3 Annual* 100 100 Chemiluminescence
24 hours** 400 400 Indophenol blue method
Benzene (C6H6), μg/m3 Annual* 5 5 Gas chromatography (GC) based continuous analyser
Adsorption and desorption followed by GC analysis
Benzo(a) Pyrene (BaP) particulate phase only, ng/m3
Annual* 1 1 Solvent extraction followed by HPLC/GC analysis
Arsenic (As), ng/m3 Annual* 6 6 AAS/ICP Method after sampling on EPM 2000 or equivalent paper
Nickel (Ni), ng/m3 Annual* 20 20 AAS/ICP Method after sampling on EPM 2000 or equivalent paper
12
REINVENTING AIR QUALITY MONITORING: POTENTIAL OF LOW COST ALTERNATIVE MONITORING METHODS
Across the world, governments take action based on the quality of air in their cities on a particular day. This allows for health advisories to the most vulnerable—those who are suffering from respiratory and cardiovascular ailments and asthma—so that they can reduce their exposure. Governments also take emergency action to reduce emissions on high-pollution days. Emergency pollution control measures are taken to bring down the peak pollution levels.
During episodic pollution events, on-line air quality monitoring can be used in warning and alert systems, which use mass media to inform people of the current air quality and, if necessary, to give instructions aimed at reducing excess pollution and minimising exposure. Delhi is the only city so far that has experimented with emergency action of odd and even scheme for cars, temporary closure of schools, power plant, ban on construction and waste burning.
The Supreme Court in its hearing of November 8, 2016 has directed the CPCB to frame graded response measures according to the pollution level in the city. This is expected to catalyse time bound action and also pave way for more sustained ad continuous action to control pollution.
It is therefore important to adopt public information system on daily air quality data based on the AQI and issue health advisory. India has begun to implement this system (see Box: India: National Air Quality Index (NAQI) system). The best practice countries include the US, Mexico, Hong Kong and Beijing, China (see Table 4: Air quality index systems in different countries). Hong Kong’s Air Quality and Health Index (IAQHI) is a unique experiment in Asia where the AQI is linked with hospital data on illness. Hong Kong adopted an Air Quality and Health Index (AQHI) system utilizes health risks derived from local hospital admissions data for air pollution-related illnesses. They use data on illness. The indexes are grouped into five health risk categories with health advice for general public. This informs people of the short-term health risk of air pollution. This is a unique experiment in Asia where the air pollution index is linked with hospital data on illness.
Monitoring ambient air quality also provides important input data for epidemiological studies, which are crucial in establishing associations between health outcomes and concentrations of ambient air pollution.8 Build capability for pollution forecast The AQI will additionally require pollution forecasting capacity so that advance warning can be issued to people. This will also require systems for monitoring of meteorological information.
Cities will need to implement emergency measures when daily pollution levels hit very poor and severe levels. Data on pollution is available from different parts of the city on a real-time basis. Indian cities do not have a forecasting system to issue advance warning. In such cases there is a time lag and the only way to inform people is during the day or the day after. Another approach would be to issue warning if there are two days of severe pollution. This is not a satisfactory solution but there is no alternative as in the current situation people have no information about the dangers of ‘poor’ and ‘severe’ levels of pollution and no emergency steps are taken to deal with the pollution.
Air pollution index and health alert also merit emergency action during smog episodes. Many countries take action based on the level of pollution. For

13
REINVENTING AIR QUALITY MONITORING: POTENTIAL OF LOW COST ALTERNATIVE MONITORING METHODS
example in Beijing if the air quality consistently remains at the worst category according to their air quality index for three consecutive days pollution emergency action is kicked in to arrest and lower the peaking of pollution. Several countries have this system
Cost considerations and institutional capacity Resource availability must be addressed very early in the process of designing a regulatory air quality monitoring network. This is the key determinant in network design that influences numbers of sites, pollutants to be monitored and instrumentation to be selected. A wide range of commitments and costs is likely to be incurred in any air monitoring programme. Before committing resources, plan a survey, assess resource availability, chose the most appropriate equipment and sites for monitoring. Any equipment must be purchased based on its long-term operational or financial sustainability. This will require in-house capability for repair and maintenance or hiring of services, together with routine operation. For equipment operation need budget typically amounting to approximately 10 per cent per year of the initial capital expenditure.
Need resources for quality assurance and control to ensure that its measurements comply fully with programme data quality objectives and are fit for the purpose. Typically, a budget of 20–50 per cent of the total annual operating costs may be appropriate for quality assurance and control, depending on the complexity of the programme and the stringency of its data quality objectives. In practice, the number and distribution of air quality monitoring stations required in any network, the samplers required in a survey, also depend on the area to be covered, the spatial variability of the pollutants being measured and how the data are to be used. The number of sites required depends on: the intended use of the data; area to be covered; spatial variability of pollutants; availability of resources and instruments deployed.9
Estimated costs of setting up air quality monitoring station in India indicates that often it is capital intensive and requires regular provisions for adequate operation and maintenance (O&M) cost. As per the estimates available in India about Rs. 4 to 5 lakh is required for setting up a manual station and Rs. 3.5 lakh per annum for the O&M. In case of a real time monitoring station, the cost could be Rs. 1.1 crore to Rs. 1.5 crore for the station and Rs. 8 lakh for O&M per annum. The O&M cost, which include data checking, validation and transfer to state level pollution control boards and committees are estimated to be 12 to 18 per cent of the capital cost of the real time stations. While the online stations are in selected cities, overall, country wide network in India is limited, India has close to 5,000 cities and towns but monitoring is being done in 247 cities. Only 16 cities have online monitoring systems to generate real time data.
Regulatory air quality monitoring will require adequate capacity building – technical and financial – to operate and maintain the network. Sufficient resources including human and financial resources are available for sustaining operation of air quality monitoring systems. Conventional regulatory monitoring is expensive. If financial support can be augmented certain priorities can be established to design the network. It is not possible or desirable to make a dense grid of monitors in developing cities. Monitoring will have to be strategic.

14
REINVENTING AIR QUALITY MONITORING: POTENTIAL OF LOW COST ALTERNATIVE MONITORING METHODS
Table 5: Air quality index systems in different countriesINDIA (Proposed) PM2.5 USEPA, PM2.5 ONTARIO, CANADA* CHINA EU
AQI PM2.5
24-hr
μgm/m3
AQI PM2.5
(24-hr avg.)
(μgm/m3)
AQI PM2.5
3-hr
μgm/m3
AQI PM2.5
24-hr
(μgm/m3)
AQI PM2.5
(24-hr avg.)
(μgm/m3)
Excellent
(0–50)
0-30 Good
(0–50)
0-15 Low
(1-3)
0-22 Excellent
(0–50)
0-35 Very low
(0-25)
0-10
Acceptable
(51–100)
31-60 Moderate
(51–100)
16-40 Moderate
(4-6)
23-45 Good
(51–100)
36-75 Low
(25-50)
11-20
Moderate
(101–150)
61-90 Unhealthy
for
Sensitive
Groups
(101–150)
41-65 High
(7-10)
46-90 Lightly
Polluted
(101–150)
76-115 Medium
(50-75)
21-30
Poor
(151–200)
91-120 Unhealthy
(151–200)
66-150 Very High
(10+)
>90 Moderately
Polluted
(151–200)
116-150 High
(75-100)
31-60
Very Poor
(201–300)
121-250 Very
Unhealthy
(201-300)
151-250 N/A N/A Heavily
Polluted
(201-300)
151-250 Very High
>100
>60
Severe
(301-500)
>250 Hazardous
(301-500)
251-500 N/A N/A Severely
Polluted
(>300)
>250 N/A N/A

15
REINVENTING AIR QUALITY MONITORING: POTENTIAL OF LOW COST ALTERNATIVE MONITORING METHODS
India: National Air Quality Index (NAQI) system
India’s National Air Quality Index (NAQI) developed by the Central Pollution Control Board was launched by the Union
Ministry of Environment and Forests in October 2014. With reference to the national ambient air quality standards
(NAAQS), NAQI has classified air pollution concentration as good, that is 50 per cent below the standards, and satisfactory
that meets the standards. The higher categories of moderately polluted, poor, very poor and severe are defined according
to the degree of exceedance from the standards (see Table 1: National Air Quality Index and Table 2: Health advisory).
The NAQI also lists the health risks associated with different levels of concentration. For instance, a ‘severe’ classification
means, ‘(the levels) may cause respiratory effects even on healthy people and serious health impacts on people with lung/
heart diseases. The health impacts may be experienced even during light physical activity’. In other words, this quality of air
is severely bad for human health. While the NAQI has broad health advisories it does not detail what urgent measures need
to be taken for people to avoid exposure and what needs to be done to improve levels, something that is done across the
world. When pollution levels are severe, aside from other measures, people are advised not to do heavy outdoor exercise
and to remain indoors as much as possible.
Table: National Air Quality Index AQI category (range) PM10
24-hrPM2.5 24-hr
NO2 24-hr O3 8-hr CO 8-hr (mg/m3)
SO2 24-hr NH3 24-hr Pb 24-hr
Good (0-50) 0-50 0-30 0-40 0-50 0-1.0 0-40 0-200 0-0.5
Satisfactory (51-100) 51-100 31-60 41-80 51-100 1.1-2.0 41-80 201-400 0.5-1.0
Moderately (101-200) 101-250 61-90 81-180 101-168 2.1-10 81-380 401-800 1.1-2.0
Poor (201-300) 251-350 91-120 181-280 169-208 10-17 381-800 801-1,200 2.1-3.0
Very poor (301-400) 351-430 121-250 281-400 209-748* 17-34 801-1,600 1,200-1,800 3.1-3.5
Severe (401-500) 430+ 250+ 400+ 748+* 34+ 1,600+ 1,800+ 3.5+
Note: Breakpoints for AQI Scale 0-500 (units: μg/m3 unless mentioned otherwise)
Table: Health advisory AQI Associated health impacts
Good (0-50) Minimal impact
Satisfactory (51-100) May cause minor breathing discomfort to sensitive people
Moderately (101-200) May cause breathing discomfort to the people with lung disease such as asthma and discomfort to people with heart disease, children and older adults
Poor (201-300) May cause breathing discomfort to the people on prolonged exposure and discomfort to people with heart disease
Very poor (301-400) May cause breathing illness to the people on prolonged exposure. Effect may be more pronounced in people with lung and heart diseases
Severe (401-500) May cause respiratory effects even on healthy people and scrious health impacts on people with lung/heart diseases. The health impacts may be experienced even during light physical activity
Source Ministry of Environment, Forest and Climate Change, Government of India
16
REINVENTING AIR QUALITY MONITORING: POTENTIAL OF LOW COST ALTERNATIVE MONITORING METHODS
What is sensor-based alternative air quality monitoring?
Increasingly policy interest is growing in potential deployment of low cost monitors, especially in remote areas where regulatory monitors cannot be deployed. They allow real time data collection and analysis. The data
can be visualised by a number of mobile and web based applications and is readily available for use by citizens. At present these monitors are being tested and validated in the laboratories and in field for their calibrations, accuracy, precision, data management etc. This technology is growing at an exponential rate. These sensors monitor variety of gases and particles. The technology is getting cheaper and is much more affordable than regulatory monitors. Many inventors are working on a range of application for monitoring and dissemination.
Experts tell us that the sensor based air pollution monitoring has stemmed from multiple areas of electrical engineering. It also leverages wireless sensor networks that allows data to be shared across all web spaces. Sensors are connected to servers to which data is continuously transferred. All sensors consists of a few basic elements: 1) The sensor element that senses the species of interest 2) Transducer that converts the responds for electrical signals 3) Data storage or link to communication device (e.g. microcontroller or cell phone) 4) Source of power (e.g. battery or energy harvesting)
The US Environment Protection Authority (USEPA) broadly classifies usage of monitors in five tiers (Table 6: Classification of low cost monitors by US EPA).. Tier 1 Education and Information: Education applications can use sensors as teaching tools. These determine pollution levels in schools and colleges. It is expected that air pollution monitors are consistent with the trends obtained from regulatory monitoring. This is used for awareness purpose.
Tier 2 Hotspot identification and characterization: Typically mobile or fixed sensors are being used to generate the pollution profile with spatial and temporal resolutions. These monitors can help in determining pollution source. A cluster of sensors can be placed to form a network grid and placed downwind of an Industrial facility or shopping port. A network can also be placed on roads or along a freeway or they can be placed for fence line monitoring of industrial sources. These monitors will make measurements close to a place where level of pollution is very high.
Tier 3 Supplementary Network Monitoring: Air sensors are deployed along with regulatory monitors to complement the data. These monitors fill the spatial gaps. These sensors can be fixed in an urban estate or may be mounted on moving vehicles. These monitors may help in identifying potential pollution sources of interest. These can cost even less than USD 100.
Tier 4 Personal exposure monitoring: these monitors can be coupled with wireless networks or used in combination of mobile applications to aware a person about exposure and health risks. It can also include epidemiological research study to help understand the effects of air pollution on groups of people.
Tier 5 Regulatory Monitoring: It includes monitoring of certain criteria

17
REINVENTING AIR QUALITY MONITORING: POTENTIAL OF LOW COST ALTERNATIVE MONITORING METHODS
pollutants to determine whether an area is complying with the set pollution monitoring regulations. In US regulatory monitoring is performed by air quality agencies according to the code of federal regulations.
Table 6: Classification of low cost monitors by US EPATier Cost range (instrumet only) Anticipated user
Tier V (most sophisticated)
$10-50K Regulations (supplement existing monitoring – ambient and source)
Tier IV $5-10K Regulations (supplement existing monitoring – ambient and source)
Tier III $2-5K Community groups and regulators (supplement existing monitoring – ambient and source)
Tier II $100-2K Community groups
Tier I (more limited)
Less than $100 Citizens (education and personal health purpose)
http://www.epa.gov/research/airscience/docs/roadmap-20130308.pdf
Wireless sensor networksWireless sensor networks (WSNs) provide real time data and communication and can process and gather massive amounts of data. WSN’s have been applied to many fields like agriculture, indoor living and industry. They supplement regulatory process and help take steps towards better management of public health and pollution. These sensors have battery powered nodes, sensors and microcontrollers that accomplish the work of data recording and processing. They have a memory that stores data, transceivers that transmit and receive data. Wireless monitoring networks have a huge potential to form a dynamic, real time and dense monitoring networks. Since these sensors are cheap, they can argument the role of citizens in air pollution monitoring as they are also used for personnel monitoring. The portability and cost effective monitors also allow researchers to study and model the vertical and horizontal patterns of pollutant dispersion.
Studies have demonstrated that instruments work well in real world conditions. The sensor based air monitoring devices allow assessment of spatial variations in exposure which are not accounted by regulatory monitors. The evaluation of sensors in field is still very nascent and does not lend to definitive judgment. Although the trends obtained from sensor based devices for average monthly mean concentrations and daily peaks have a close correlation, the accuracy and linearity of data does not match with the data obtained from regulatory monitors. Scientists are trying to develop instant calibration system to can reduce errors.
Research and public interestResearch interest is growing rapidly in this field. Experts inform that air quality research is a field which requires high spatial and temporal resolutions of the air pollution information. The air pollution maps built by the heavy and static conventional air pollution monitoring systems, lacks in providing such versatile data. Now, researchers can expand their data value by combining the advantages of low-cost portable ambient sensors which helps in understanding the distribution of the air pollutants more efficiently and accurately improving the air quality models. From this, researchers can anticipate real- time dynamic high spatio- temporal data set for better studies.
Alternative monitoring technology is also helping people to learn more about
18
REINVENTING AIR QUALITY MONITORING: POTENTIAL OF LOW COST ALTERNATIVE MONITORING METHODS
air quality in their neighbourhoods and communities. This is empowering communities and individuals to learn more about local air quality where they live, work and play. This is supporting citizen science movement to better understand the impacts of pollutants on public health and reduce exposure. Many of these new sensors are becoming available so that communities can get involved in community science activities
Globally, several agencies are now leveraging this innovation to connect people with air quality to build awareness. This is being linked with widely diverse dissemination methods, through internet, mobile app etc to bring data to common people.
Centre for Science and Environment (CSE) has carried out a unique real-time monitoring exercise during the winter of 2014. A group of prominent citizens of Delhi and asthma patients were assigned a day to carry a portable monitoring machine for 24 hours. The objective was to assess real-time pollution that each person was exposed to in relation to the background ambient levels monitored by the Delhi Pollution Control Committee at the nearest official monitoring station. CSE used a state-of-the-art instrument, TSI DustTrak DRX Aerosol Monitor 8533. It is battery operated; data-logging, light-scattering laser photometer that gives real-time aerosol mass readings. It simultaneously measures all size-segregated mass fraction concentrations corresponding to PM1, PM2.5, and PM10. It uses a sheath air system that isolates the aerosol in the optics chamber to keep the optics clean for improved reliability and low maintenance. It has a heated inlet sample conditioner to reduce the effects of humidity. The monitor is portable and is carried in a padded backpack designed to limit instrument tilt and vibration. A tube is clipped near the breathing zone. The other end of this tube was attached to the inlet of the instrument. The instrument’s zero point is calibrated every time before monitoring using an external zero filter.
This gave a clear insight into exposures of individuals. The 24-hour real-time monitoring trend of individuals was higher but correlated with the trend in ambient background level at the nearest official monitoring station. The real-time exposure of all individuals monitored was highest during the night and early morning. High pollution levels when everyone goes for a morning walk. Even Lutyens’ Delhi, expected to be Delhi’s cleanest and greenest, showed exceptionally high values for particulate matter. (see Graph 1: Comparison of 24 hour average personal exposure of prominent individuals with ambient levels at the nearest DPCC monitoring station).
CSE has also monitored exposure to particulate pollution while travelling by different modes in Delhi. People walking and cycling are highly exposed to air pollution. (see Graph 2: Exposure to PM2.5 by travel mode vis a vis background ambient levels).
The bigger interest was to understand how the levels recorded by this device correlated with the nearest official ambient monitoring stations of the Delhi Pollution Control Committee (DPCC) (see BOX: Co-relation between exposure and ambient pollution levels). When the prominent citizens carried the mobile equipment with them for 24 hours to monitor their exposure levels, CSE collected hourly data from the nearest DPCC monitors for the same period. This showed that while the exposure levels of the individuals was several times higher than the ambient concentration, the curve of trend the background ambient levels was nearly the same. Exposure monitoring was not off track in sensing the overall curve and trend of pollution in the city.

19
REINVENTING AIR QUALITY MONITORING: POTENTIAL OF LOW COST ALTERNATIVE MONITORING METHODS
Detailed studies have also been carried out by the researchers of University of California, Berkeley.
A study was conducted by Joshua Apte in November in 2012 in which he monitored the pollution levels as he travelled in an autorickshaw on the roads of Delhi. A fi xed route from Chittaranjan Park in South Delhi to Connaught Place was followed for about 40 days. This study used a DustTrak for measuring PM10 and PM2.5, and Athelometer to monitor black carbon. A Garmin GPS unit was used to trak latitude and longitude and a HOBO monitor was utilized to measure temperature and relative humidity along the route. This study also used regulatory monitor set up on the top of a building in Chittaranjan Park to
800
700
600
500
400
300
200
100
0Bhure Lal Bhure Lal Harish Ashok B Randeep William Kaushik Bharati Avikal
(PM2.5, (PM2.5, Salve Lall Guleria Bissell Das Gupta Chaturvedi Somvanshi
12-13 Nov) 08-09 Dec) (PM2.5, (PM2.5, (PM2.5, (PM2.5, (PM10, (PM2.5, (PM2.5,
26-27 Nov) 29-30 Nov) 2-3 Dec) 19-20 Nov) 5-6 Nov) 17-19 Nov) 21-22 Nov)
Fixed station Exposure
Co
nce
ntr
atio
n in
mic
rog
ram
me
ped
r cu
bic
met
re
Graph 1: Comparison of 24 hour average personal exposure of prominent individuals with ambient levels at thae nearest DPCC monitoring station
Source: Centre for Science and Environment
1,400
1,200
1,000
800
600
400
200
0
18:3
619
:14
19:5
220
:30
21:0
812
:57
13:3
514
:13
14:5
115
:29
16:0
716
:45
17:2
318
:01
18:3
919
:18
19:5
621
:35
22:1
322
:51
23:2
916
:06
16:4
417
:22
18:0
018
:38
19:1
619
:54
20:3
221
:10
21:4
822
:27
23:0
523
:43
09:2
710
:05
14:2
9
DPCC
PM2.5 exposure
14 Feb (Afternoon>)
15 Feb (Afternoon>)
16 Feb (Morning)
13 Feb (Evening)
Graph 2: Exposure to PM2.5 by travel mode vis a vis background ambient levels
Source: Centre for Science and Environment
20
REINVENTING AIR QUALITY MONITORING: POTENTIAL OF LOW COST ALTERNATIVE MONITORING METHODS
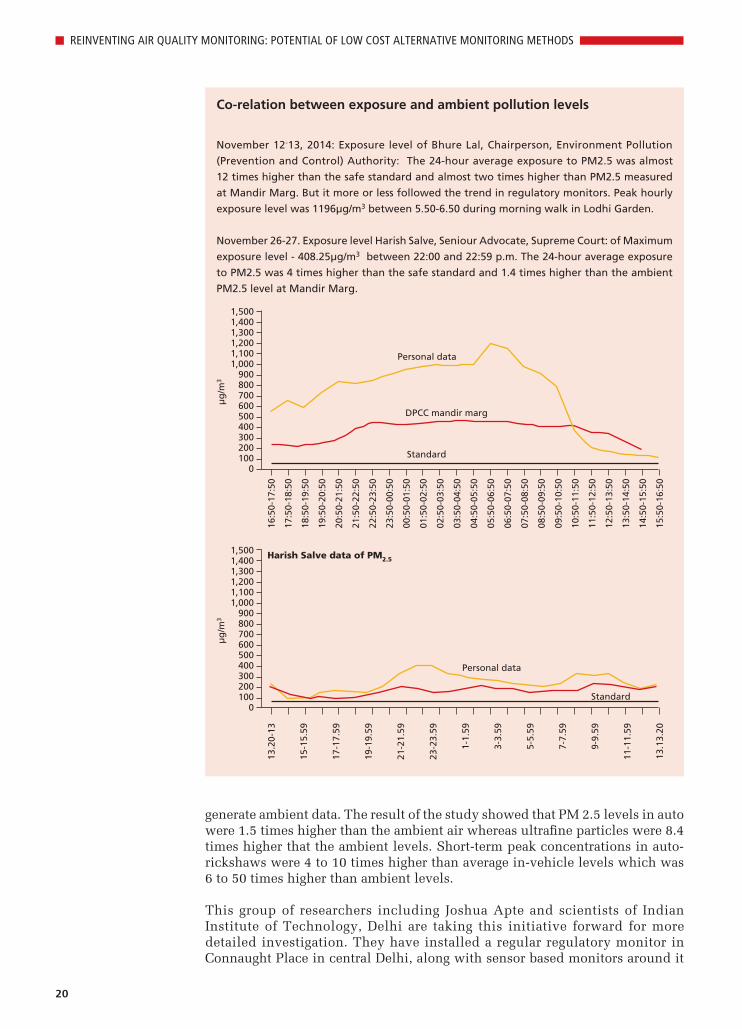
Co-relation between exposure and ambient pollution levels
November 12-13, 2014: Exposure level of Bhure Lal, Chairperson, Environment Pollution
(Prevention and Control) Authority: The 24-hour average exposure to PM2.5 was almost
12 times higher than the safe standard and almost two times higher than PM2.5 measured
at Mandir Marg. But it more or less followed the trend in regulatory monitors. Peak hourly
exposure level was 1196μg/m3 between 5.50-6.50 during morning walk in Lodhi Garden.
November 26-27. Exposure level Harish Salve, Seniour Advocate, Supreme Court: of Maximum
exposure level - 408.25μg/m3 between 22:00 and 22:59 p.m. The 24-hour average exposure
to PM2.5 was 4 times higher than the safe standard and 1.4 times higher than the ambient
PM2.5 level at Mandir Marg.
μg
/m3
Personal data
1,5001,4001,3001,2001,1001,000
900800700600500400300200100
0
DPCC mandir marg
Standard
16:5
0-17
:50
17:5
0-18
:50
18:5
0-19
:50
19:5
0-20
:50
20:5
0-21
:50
21:5
0-22
:50
22:5
0-23
:50
23:5
0-00
:50
00:5
0-01
:50
01:5
0-02
:50
02:5
0-03
:50
03:5
0-04
:50
04:5
0-05
:50
05:5
0-06
:50
06:5
0-07
:50
07:5
0-08
:50
08:5
0-09
:50
09:5
0-10
:50
10:5
0-11
:50
11:5
0-12
:50
12:5
0-13
:50
13:5
0-14
:50
14:5
0-15
:50
15:5
0-16
:50
μg
/m3
Personal data
1,5001,4001,3001,2001,1001,000
900800700600500400300200100
0Standard
13.2
0-13
15-1
5.59
17-1
7.59
19-1
9.59
21-2
1.59
23-2
3.59
1-1.
59
3-3.
59
5-5.
59
7-7.
59
9-9.
59
11-1
1.59
13.1
3.20
Harish Salve data of PM2.5
generate ambient data. The result of the study showed that PM 2.5 levels in auto were 1.5 times higher than the ambient air whereas ultrafine particles were 8.4 times higher that the ambient levels. Short-term peak concentrations in auto-rickshaws were 4 to 10 times higher than average in-vehicle levels which was 6 to 50 times higher than ambient levels.
This group of researchers including Joshua Apte and scientists of Indian Institute of Technology, Delhi are taking this initiative forward for more detailed investigation. They have installed a regular regulatory monitor in Connaught Place in central Delhi, along with sensor based monitors around it

21
REINVENTING AIR QUALITY MONITORING: POTENTIAL OF LOW COST ALTERNATIVE MONITORING METHODS
and are carrying our monitoring for over a year to validate the technology and performance. Results of this study are awaited.
These approaches are important to understand the actual exposures in micro environments. In fact, Report of Steering committee on air pollution and health related Issues’, of the Union ministry of Health and Family Welfare states that it is more important to know how close we are to the pollution source, what are we inhaling, and how much time we spend close to the pollution source than what occurs generally in the air that is influenced by climate and weather. That exposure management is more important from health perspective. Ambient concentrations do not always well represent human exposures is not a good surrogate for total air pollution risk and health outcome.
Thus, this emerging monitoring method has opened up new and widely different opportunities for research, awareness campaign and ways to inform policies for health protection.
Global awareness initiativesA US based organization with support from USEPA held International Air Quality Monitoring Camp for Youth in Thailand during June 2016. Similar air quality monitoring camp called Kids Making Sense International was carried out in Taiwan for school students. Taiwan and the US EPAs are actively promoting the Kids Making Sense International camp, which aims to raise awareness about air quality among students. In the US students in southern California have engaged in hands-on lessons about air pollution, participated in experiments to measure air quality in their community, and present their findings to local policymakers as part of the latest Kids Making Sense (KMS) workshops. The Coalition for Clean Air, with funding from the Harbor Community Benefit Foundation, worked with Sonoma Technology, Inc. (STI) to bring the KMS program to 7th grade students at Richard Henry Dana Middle School in San Pedro, CA, in spring 2016. The six-week program included teacher training and three student workshops. STI scientists first engaged in discussions with the students on the scientific method, air pollution, and air quality monitoring. Dana Middle School plans to continue empowering their students to learn more
Figure 1: Pigeons carry IoT sensors to track air pollution in London

22
REINVENTING AIR QUALITY MONITORING: POTENTIAL OF LOW COST ALTERNATIVE MONITORING METHODS
about air quality though the hands-on KMS program in the next school year.
Plume Labs, the makers of the app AirReport, is doing something a little different to tackle London’s air pollution problem – it’s using IoT and pigeons. The company has begun strapping IoT sensors that incorporate geolocation technology to the backs of pigeons to detect ozone, nitrogen dioxide and other harmful compounds wherever they fly in the city. Londoners are able to receive updates on pollution levels in different areas of the city via the @PigeonAir Twitter account. This is as part of an alliance formed between Plume Labs and the social networking giant.
Start ups have come up in Delhi to generate data. Data intelligence company Social Cops has conducted an experiment with five low-cost GPS-enabled IoT devices that were installed on five auto rickshaws for a month. The idea was to measure PM10 levels every 30 seconds as the autos travelled all over Delhi. Autos, on the other hand, can travel to various corners of the city throughout the day, which gives the ability to collect data from multiple locations and at much lower costs. In the long-term, these startups hope that greater knowledge about the air quality levels in their neighbourhood will lead to community participation in dealing with air pollution at a local and city-wide level.
Regulatory interest in alternative monitoring methodsGlobally, regulatory agencies have started to assess these alternative methods and new techniques. This nascent technology is different from regulatory techniques. Regulatory monitoring system does not use the low cost systems but they are useful to generate indicative air quality information. The regulatory system use air monitoring data adhering to the prescribed procedures followed to ensure and assess quality and consistent measurements nationally.
The regulatory air quality data verification is a complex process and the question is if the lower cost sensors can meet regulatory requirements for data collections. But air quality monitors suitable for regulatory-quality data collections must meet very exacting standards of performance. No lower cost sensors currently meet these strict data quality and performance requirements. But EPA is investing in understanding citizen science opportunities and providing tools to citizens to assist them in their efforts.
Most of the lower cost particulate matter sensors use light scattering as the primary aerosol detection method. A wide variety of factors can influence light scattering and the resulting sensor response. These include the size of the aerosol as well as its composition.
The US Environmental Protection Agency (USEPA) has begun to assess this technique. According to USEPA low-cost, portable air quality sensors could be the next generation of air monitoring. It has begun exploring air quality data from low-cost portable air quality sensors but recognizes that there is a tremendous risk for EPA if the quality of the data that is generated and reported by these sensors is unknown. While regulatory use of these air sensors is likely be limited at best, that is not to say that collecting air monitoring data from sensors is not useful. These monitors may have limitations in accuracy, precision, and durability in comparison to the Federal Reference Methods established by EPA. But the disadvantages could be outweighed by the many advantages of truly low-cost monitors in regards to wider deployment, portability, real-time display, and ease of operation.
23
REINVENTING AIR QUALITY MONITORING: POTENTIAL OF LOW COST ALTERNATIVE MONITORING METHODS
Direct collocation of a light scattering device with a true gravimetric (mass) measurement is one approach EPA researchers and others have employed to establish a calibrated response from low cost sensors (see Table 7: Evaluation of various low cost technologies in USA).
EPA scientists use Federal Reference Methods and Federal Equivalency Methods for accurately and reliably measuring six primary air pollutants in outdoor air and implementation of National Ambient Air Quality Standards (NAAQS). But as air quality management problems become more complex, that would need enhanced air quality and exposure monitoring capabilities. Next generation air measuring research therefore includes the use of air sensors and apps, mobile monitoring devices, passive fenceline monitoring and the use of satellites to monitor air quality. (see BOX: Regulatory initiatives on sensor based technology in the US)
The scientists in California Air Resources Board (CARB) also point out that there is a great deal of interest and activity in this area and the South Coast Air Quality Management District (SCAQMD) in California, and the academic community is taking the lead. This has been driven by the need to understand personal exposures and health studies as done popularized by the US scientists including Kirk Smith of UC Berkeley, Mike Jerrett of UCLA, Michael Brauer of the University of British Columbia, Joshua Apte of the University of Texas at Austin, Ram Ramanathan of Scripps are prominent researchers. They have monitored local exposures to address environmental justice for disadvantaged and other community concerns in the US and for use in detecting non-complying sources.
SCAQMD, California, the air pollution control agency for Orange County and urban Los Angeles, Riverside and San Bernardino counties, has established the Air Quality Sensor Performance Evaluation Center (AQ-SPEC). It is the second most populated urban area in the United States and one of the smoggiest. They are evaluating some of these systems. Sensing the environment: Environmental Sensor Outreach in the Classroom: this program partners Associations of Schools and Programs of Public Health and the US EPA.
USEPA came out with a draft roadmap for Next Generation Air Monitoring in March 2013. They have realised that sensor devices require less support infrastructure than stationary monitors and they are capable of monitoring autonomously. This new technology is cheaper than stationary monitors and provides information on operating process to facility managers and inspectors, promote community engagement and support air pollution studies. In this roadmap USEPA has outlined the goals -- Promotion and development of affordable and near source, and fenceline monitoring devices and sensor based detection system; Supplementing existing air quality monitoring networks through development of low cost and reliable monitoring technology for measuring criteria air pollutants, such as nitrogen dioxide, carbon monoxide, ozone and particulate matter (PM); and Support for developing citizen science efforts to measure air pollution in local areas;
European Union Policy on micro sensorsThe European Union is not using these techniques for regulatory purpose. The European Commission is evaluating these techniques as well and has stated research projects related to micro sensors MACPoll, AIRMONTEC, FP7- ENV.2012.6.5-1 (“air quality monitoring with smart city context”). Better modelling and equations are required to compare the data obtained from sensor

24
REINVENTING AIR QUALITY MONITORING: POTENTIAL OF LOW COST ALTERNATIVE MONITORING METHODS
Table 7: Evaluation of various low cost technologies in USA1
The R2 value if equal to 1 it indicates that a technology is perfectly correlated with regulatory monitoring technique and zero value indicates no correlation. Surprisingly some techniques are close to the regulatory technique results1
Manufacturer
(Model)
Type Pollutants(s) Approximate Cost Time Resolution Sensor vs FRM/FEM
method
Dylos
(DC1100)
Optical PM(0.5-2.5) ~$ 300 1 min R2 ~ 0.65 to 0.85
Shinyei
(PM Evaluation Kit)
Optical PM2.5 ~$ 1,000 1 min R2 ~ 0.80 to 0.90
RTI
(MicroPEM)
Optical PM2.5 ~$ 2,000 10 sec R2 ~ 0.65 to 0.90
HabitatMap
(AirBeam)
Optical PM2.5 ~$ 200 1 min R2 ~ 0.65 to 0.70
Met One
( N e i g h b o u r h o o d
Monitor)
Optical PM2.5 ~$ 1,900 15 min R2 ~ 0.53 to 0.67
Speck Optical PM2.5 ~$ 200 1 min R2 ~ 0
Naneos
(Partector)
Electrical PM (LDSA: Lung-
Deposited Surface
Area)
~$ 7,000 1 min PM1.0: R2 ~ 0.1
PM2.5: R2 ~ 0.2
AethLabs
(microAeth)
Optical BC (Black Carbon) ~$ 6,500 1- 3 0 0
sec
R2 ~ 0.79 to 0.94
Air Quality Egg
(Version 1)
Optical, Metal oxide PM, CO, NO2 and O3 ~$ 200 1 min PM: R2 ~ 0
CO: R2 ~ 0
NO2: R2 ~ 0.40
O3: R2 ~ 0.85
Perkin Elmer
(ELM)
Optical, Metal oxide PM, NO, NO2 and O3 ~$ 5,200 1 min PM: R2 ~ 0
NO: n/a
NO2: R2 ~ 0
O3: R2 ~ 0.89 to 0.96
2B Technologies
(PO3M)
UV absorption (FEM
method)
O3 ~$ 4,500 10 sec R2 ~ 1.0
Aeroqual
(S- 500)
Metal oxide O3 ~$ 500 1 min R2 ~ 0.85
Smart Citizen Kit Metal Oxide CO, NO2 ~$ 200 1 min CO: R2 ~ 0.50 to 0.85
NO2: R2 ~ 0
AQMesh
(v.3.0)
Electrochem CO, NO, NO2, SO2
and O3
~$ 10,000 1- 15 min CO: R2 ~ 0.75 to 0.90
NO: R2 ~ 0.75 to 0.90
NO2: R2 ~ 0
SO2: R2 ~ 0
O3: R2 ~ 0.25 to 0.55
AQMesh
(v.4.0)
Electrochem CO, NO, NO2 and O3 ~$ 10,000 1- 15 min CO: R2 ~ 0.42 to 0.80
NO: R2 ~ 0.0 to 0.44
NO2: R2 ~ 0.0 to 0.46
O3: R2 ~ 0.46 to 0.83
UNI- TEC
(SENS- IT)
Metal oxide CO, NO2 and O3 ~$ 2,200 1 min CO: R2 ~ 0.33 to 0.43
NO2: R2 ~ 0.60 to 0.65
O3: R2 ~ 0.72 to 0.83
Note: The correlation coefficient (R2) is a statistical parameter indicating how well the performance of each sensor compares to that of a Federal Reference or Federal Equivalent Method (FRM and FEM, respectively) instrument. An R2 approaching the value of 1 reflects a near perfect agreement, whereas a value of 0 indicates a complete lack of correlation. All R2 values reported in this table are based either on a 5-min or 1-hr average data. Laboratory evaluations are still pending to confirm field results. An ad- hoc rating system will be developed to summarise the overall performance of these sensors once both field and laboratory data become available.
25
REINVENTING AIR QUALITY MONITORING: POTENTIAL OF LOW COST ALTERNATIVE MONITORING METHODS
based devices with regulatory monitors. Demonstrating the validity of monitors for spatial distributions even for sole informative applications is important. Sensors have to be combined with sophisticated web based application like GPS and GPRS.
UNEP take lead in Africa Technology and Innovation Branch of Division of Early Warning and Assessment at the United Nations Environment Programme (UNEP) has begun to develop a blueprint of low cost sensor kit that can enable developing countries to monitor air quality and estimate the health effects, especially in vulnerable human populations and ecosystems in Africa region.
The UNEP has embarked on a series of partnership with national governments, research institutions and UN and international partners, including World Health Organization (WHO), UN Habitat, World Bank and World Meteorological Organization. They are part of the Global Platform on Air Quality and Health, to develop a framework, information and tools for the monitoring and evaluation of air quality and related health impacts. As part of this, UNEP is designing an affordable national air quality monitoring network based on UNEP Air Quality Units for measuring particulates, key pollutants such as sulphur dioxide, nitrous oxide and ozone (USD 1500/unit), location and temperature, plus calibration units that have an additional set of sensors including for humidity. The overall cost for a typical national network would range from USD 100,000–200,000. This would be in contrast to the current cost of a single typical high-precision instrumented station of USD 250,000.10
The Division of Early Warning Assessment (DEWA) of UNEP thus contracted the development of an affordable, mobile air quality monitoring unit, costing < USD 1500 that can function well in highly polluted climates, as a first step in helping countries, especially in the developing world, to collect reliable air quality data. A network of 50 of the new monitoring units that DEWA envisages will cost USD 75,000 — much less than the cost of the single high quality monitoring station currently available in the market. Data from such a network can be used to generate a map of air quality in a region. Finally, the units can be programmed to ‘talk’ to each other, and calibrate each other, when aligned in the same microenvironment, thus improving the accuracy of the data.11
The UNEP air quality unit is comprised of an Optical Particle Counter PM1, 2.5 and 10 (OPCN2) sampling every 2 seconds, two gas sensors - SOx and NOx (Alpha Sense), a Global Positioning System (GPS) and temperature and humidity sensor, a Texas Beagle Bone data controller. Additional sensors, such as for ozone, and volatile organic compounds (VOCs) can be added according to local needs and conditions. The unit is powered off 12 volts and can be used as a fixed station or mobile unit. The units are GSM enabled and designed to operate as nodes in a network to allow inter-calibration. Due to its rugged design, the UNEP unit can be deployed across different terrains in a country. It can be linked in real-time to meteorological stations, county and national offices via wireless and telecommunication networks or run off-line.
UNEP will publish the blueprint for its air quality monitoring unit as a global public good. This will enable governments and organisations to purchase, assemble or fabricate the units themselves, thereby opening up opportunities for innovation and enterprise development. The data from the network of air quality units will be augmented by relevant satellite data flows and social and health surveys, via the Global Platform on Air Quality and Health, and

26
REINVENTING AIR QUALITY MONITORING: POTENTIAL OF LOW COST ALTERNATIVE MONITORING METHODS
Regulatory initiatives on sensor based technology in the US
In the US the Environment Protection Agency (EPA) has defined and developed short and long term priorities for Next
Generation Air Monitoring (NGAM). The NGAM has defined different applications. These include:
• Classroom purposes – Science, Technology, Engineering, and Mathematics (STEM)
• Education screening to determine if more extensive monitoring is needed personal
• Monitoring community-based monitoring fence line/emission source measurements for Industry and enforcement
officials
• Individualized medicine air pollution research accurate measurement of ambient air and exposures for regulatory
purposes
NGAM is designed for
• Encouraging development of low maintenance, cheap and robust sensors that can collect and detect pollutants at
environmentally relevant concentrations
• Tier I real time monitors (indicative monitor) for ozone, nitrogen dioxide and carbon monoxide.
• Tier III FEM real time monitors for ozone, nitrogen dioxide, sulphur dioxide, carbon monoxide.
• Tier III nitrogen dioxide sensor for the near roadway network.
• Tier III real-time black carbon.
• Tier IV real time butadiene monitor Tier III, fence line sentry system -nonspeciating monitor volatile organic compounds
(VOCs) and /or hazardous air pollutants (HAPs).
• Tier IV benzene real time monitor.
• Evaluation of technology through research and pilot projects, provide guidance on quality of sensors appropriate for
different users, and form a working group focussed on issues related to monitor sensors performance
• Conduct pilot projects with OECA and OAR employing Tier I to Tier IV sensors for criteria pollutants and priority HAPs
• Conduct evaluations of Tier I and II systems for measurement of criteria pollutants at various environmental conditions
using exposure chambers and field studies
• Develop a means of categorizing sensors that indicate the various levels of quality and appropriate uses (e.g., education,
screening, research, supplementing networks, etc.)
• Convene a local, state, federal working group to address issues related to NGAM technology use, quality of data, and
keeping current with new evaluation data about new technologies
Strategy for implementing the use of low cost monitors by developing technology, participation between academia and
research institutions:
The EPA has a number of ongoing and planned activities which address the priorities identified in Section C. For example,
ORD has a research program focused on sustainable and healthy communities that may offer opportunities for outreach
and communication related to new monitoring technologies. Existing and future planned EPA efforts are summarized in
Table
• EPA has distributed citizen science toolkits in March 2013 workshops and participants will develop a template for
information clearing house on air sensors.
• EPA has partnered with Air Force Research Institute/ Wright Brother’s Institute: Interns from both the institutions have
developed innovative solutions like mobile apps etc.
Existing Plans and programs started by EPA for using low cost monitors
• EPA has completed an Open source challenge for a Tier IV monitors which are used to monitor benzene
• EPA SBIR: The small Business innovation Research Program’s current year includes components for lower cost field
grade instruments under $10000 as well new technologies for community based sensing. The annual budget for SBIR
is approximately $ 80000
• ORD National exposure Research laboratory’s Sensor test Chamber: local test chambers are being provided for sensor
developers who want to understand the basic operational procedures of low cost sensor devices
• EPA Star grants: through this programme the EPA funds new air pollution monitoring networks and development of
apps.
• ORD Village green project is developing solar powered tier III to Tier IV sensor devices for measuring PM, black carbon

27
REINVENTING AIR QUALITY MONITORING: POTENTIAL OF LOW COST ALTERNATIVE MONITORING METHODS
Table: Technology Development, Integration and Testing: Existing and Planned EffortsTime Frame Objectives Specific Subobjectives Existing Efforts Potential Future
Efforts
Short Term
Develop autonomous, low maintenance, robust sensors that can detect pollutants at environmentally relevant concentrations
Tier I real time monitors (indicative monitor) for O3, NO2 and CO
1) EPA Open Source Challenges: My Air, My Health2) SBIR emphasis on low cost monitoring technology development
Funding for sensor development
Tier III FEM real time monitors for O3, NO2, SO2, CO
ORD Village Green Project
Tier III nitrogen dioxide sensor for the near roadway network
Tier III real time black carbon
Tier IV real time butadiene monitor
Tier III, fenceline sentry system: non-speciating VOC/ HAP
Tier IV benzene real time monitor Field test potential benzene sensor
Summary tables of major pollutants
Succinct summary table to connect pollutants and levels of detection for sensor developers
Table prepared by OAR (OAQPS & DC) 10/24/12
Make available to public webspaces
Systems, standards, & methods for calibration & validation
Low cost scalable ways to calibrate and validate sensors
ORD Workshop March 2013 Continued development of calibration tools
Technology Evaluations Conduct pilot projects with OECA and OAR employing Tier I to Tier IV sensors for criteria pollutants and priority HAPs
Field study evaluation of Tier I and II systems
Develop categorization of sensors according to levels of Quality and appropriate uses (e.g., education, screening, research, supplementing networks, etc)
Convene a local, state, federal working group to address issues related to NGAM technology
ORD Benzene Field Testing
Drafting application based recommendations for sensor performance criteria
Technology evaluations- research on issues related to sensor performance
Exposure chamber evaluation of Tier I and II systems under a broad range of conditions (temperature, humidity, etc)
ORD Test Sensor Chamber
Reach out and facilitate communication with/ among the sensor community
Create a webpage that facilitates discussion, sharing, interactions and understanding among sensor developers and users
Launched:www.CitizensAir.net(note: not an EPA site).
Share information on new developments in sensor technology and calibration approaches
March 2013 ORD workshop in RTP; other avenues for communication
Facilitate collaboration between technologists and community end users
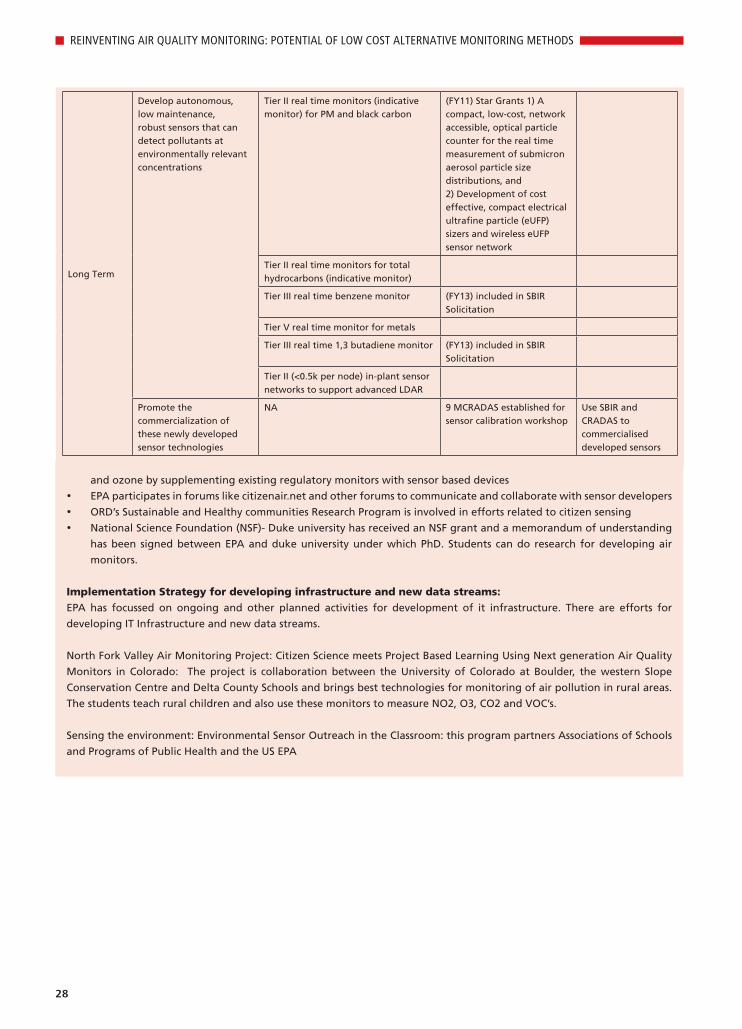
28
REINVENTING AIR QUALITY MONITORING: POTENTIAL OF LOW COST ALTERNATIVE MONITORING METHODS
and ozone by supplementing existing regulatory monitors with sensor based devices
• EPA participates in forums like citizenair.net and other forums to communicate and collaborate with sensor developers
• ORD’s Sustainable and Healthy communities Research Program is involved in efforts related to citizen sensing
• National Science Foundation (NSF)- Duke university has received an NSF grant and a memorandum of understanding
has been signed between EPA and duke university under which PhD. Students can do research for developing air
monitors.
Implementation Strategy for developing infrastructure and new data streams:
EPA has focussed on ongoing and other planned activities for development of it infrastructure. There are efforts for
developing IT Infrastructure and new data streams.
North Fork Valley Air Monitoring Project: Citizen Science meets Project Based Learning Using Next generation Air Quality
Monitors in Colorado: The project is collaboration between the University of Colorado at Boulder, the western Slope
Conservation Centre and Delta County Schools and brings best technologies for monitoring of air pollution in rural areas.
The students teach rural children and also use these monitors to measure NO2, O3, CO2 and VOC’s.
Sensing the environment: Environmental Sensor Outreach in the Classroom: this program partners Associations of Schools
and Programs of Public Health and the US EPA
Long Term
Develop autonomous, low maintenance, robust sensors that can detect pollutants at environmentally relevant concentrations
Tier II real time monitors (indicative monitor) for PM and black carbon
(FY11) Star Grants 1) A compact, low-cost, network accessible, optical particle counter for the real time measurement of submicron aerosol particle size distributions, and2) Development of cost effective, compact electrical ultrafine particle (eUFP) sizers and wireless eUFP sensor network
Tier II real time monitors for total hydrocarbons (indicative monitor)
Tier III real time benzene monitor (FY13) included in SBIR Solicitation
Tier V real time monitor for metals
Tier III real time 1,3 butadiene monitor (FY13) included in SBIR Solicitation
Tier II (<0.5k per node) in-plant sensor networks to support advanced LDAR
Promote the commercialization of these newly developed sensor technologies
NA 9 MCRADAS established for sensor calibration workshop
Use SBIR and CRADAS to commercialised developed sensors

29
REINVENTING AIR QUALITY MONITORING: POTENTIAL OF LOW COST ALTERNATIVE MONITORING METHODS
Implementation Strategies of US EPA
Table: Outreach and Communication Strategies of US EPATime Frame Objectives Specific
SubobjectivesExisting Efforts Potential Future Efforts
Short Term
Address major challenges/ issues associated with NGAM
Address new opportunities associated with NGAM
Establishment of a work group to address issues with advanced monitoring and its impact on regulatory monitoring (Regions, OAR, OECA, State and local monitoring agencies, ORD)
Address privacy issues related to data collection
Establishment of a work group to address privacy (OEI, OGC, OAR, ORD, OECA)
Interpretation of data and implications for health
Develop approaches for assessing and communicating risk (ORD and OAR)
Address how EPA might use citizen collected data
November 2012 interagency Meeting (EPA participation in DTRA- lead effort)
Conduct pilot studies with communities, leveraging existing monitoring efforts
Promote STEM educational efforts
EPA/ Air Force Research institute’s Wright Brother’s institute students are working to develop sensors and apps for air pollution (Tier II)
ORD Village Green Project
Long Term
Develop strategy for evaluation of low-cost sensors.
Helps set expectations for what sensors can reasonably measure
Creation of a sensor evaluation guide to help improve sensor quality and accuracy
Approaches for sharing information on different devices and how to choose appropriate technology
Integrate data streams into publically accessible portals
Develop data visualization tools for mobile sensor data
Integrate real time sensor data into appropriate model: e.g., Community- focused exposure and risk screening tool (CFERST), Air Now, ATLAS, etc
Creation of a citizen monitoring toolkit
Address issues of trust and interest in participating in air pollution sensor activities
Participation in online forums (i.e. CitizenAir.net), Village Green Blog
Pilot projects/ workshops to promote partnerships among communities, scientists, tech developers, local, regional officials
Other outreach approaches
Conduct local community level pilot projects for environmental neighborhood monitoring
Pilot projects to work with communities, scientists, tech developers, local, regional officials
30
REINVENTING AIR QUALITY MONITORING: POTENTIAL OF LOW COST ALTERNATIVE MONITORING METHODS
in the first instance delivered to citizens and communities through mobile and on-line applications in UNEP Live (http://uneplive.unep.org/theme/index/2#.VeBh_vmLEXg) The data from the UNEP air quality units will help provide improved statistics on air quality exposure of vulnerable populations in urban environments and underpin cross-sectoral policy-making decisions in transport, energy and urban planning. The data can also be integrated into UNEP’s National Reporting System, as part of ongoing efforts to improve “SDG readiness”. 12
According to a UNEP representative, UNEP’s low cost air quality monitor costing USD 1,500 can monitor PM10, PM2.5, temperature and humidity. UNEP had initiated work with the low cost monitor in Nairobi and plan to set up an air quality monitoring network. Ten such monitors were to be set up in May in Nairobi. UNEP has partnered with NASA. Measurements are uploaded. UNEP is also setting up these low cost monitors along with NASA weather instruments in schools in the city. All data will be made open source and put up on UNEP Live. UNEP aims to use the University of Nairobi air quality monitoring reference stations to validate their data.
Experiments throwing up questionsExperts are now collating series of technical issues related to performance that need to be addressed. For instance, the sensor devices require frequent calibration and suffer from drift due to temperature and humidity changes. Sensor Drift refers to the deviation of the monitor from the ground truth value. It is affected by changing the sensing surfaces which changes the sensor function that translates analog inputs into digital inputs. Usually mobile sensors suffer from this problem due to continuous impact on the sensing surface by changing temperature and relative humidity. The drift can be significant to make sensors useless. The research needs to be focused on developing hybrid networks and better algorithms. The mobile sensors cannot be frequently calibrated.
There is also sensor Noise. The metal oxide sensors usually contain a significant amount of electrical noise which can be due to drift, cross sensitivity. The cross Sensitivity refers to the sensor responding to the gases other than the target gases. Poor selectivity is one of the main issues with low cost sensors. There readings can be influenced by multiple pollutants, temperature and humidity. Life of sensors are also limited.
These monitors can be calibrated against stationary monitoring facilities. Data from regulatory monitors could be delivered by wireless phone applications, so that performance evaluation of sensor devices could be done against regulatory monitors. It is also important to work upfront to define their performance criteria like operating ranges and detection limits. Regulators examine the potential, applications and issues encountered in these instruments. Studies are being carried out to explain use and specifications of various sensor based devices. The focus is on measures and advices which can be useful in drafting a roadmap or a protocol defining their use, applications, specifications etc.
The way forwardJury is not yet out. Technologies and scientific investigations are still evolving. But both developed and developing countries have interest in these systems. Poorer world is looking at it for its affordability and also its potential to assess risk and exposures and build public and policy awareness. Advance systems are expecting to fill in data gaps on exposures and to do better mapping of

31
REINVENTING AIR QUALITY MONITORING: POTENTIAL OF LOW COST ALTERNATIVE MONITORING METHODS
micro environments to refine strategies supplement the regulatory systems. But common people have begun to own them to know what is happening around them. It is helping to demystify a lot and helping them to connect with the problem.
It could be an opportunity for India to assess how these alternative systems can be used as a complementary system even when it is gearing up to spread the regulatory monitoring system. It is important to follow the learning curve that is emerging globally on these newer approaches and their innovative application. Public health challenge and risk assessment will require more refined and varied monitoring approaches to reduce exposures and risks.
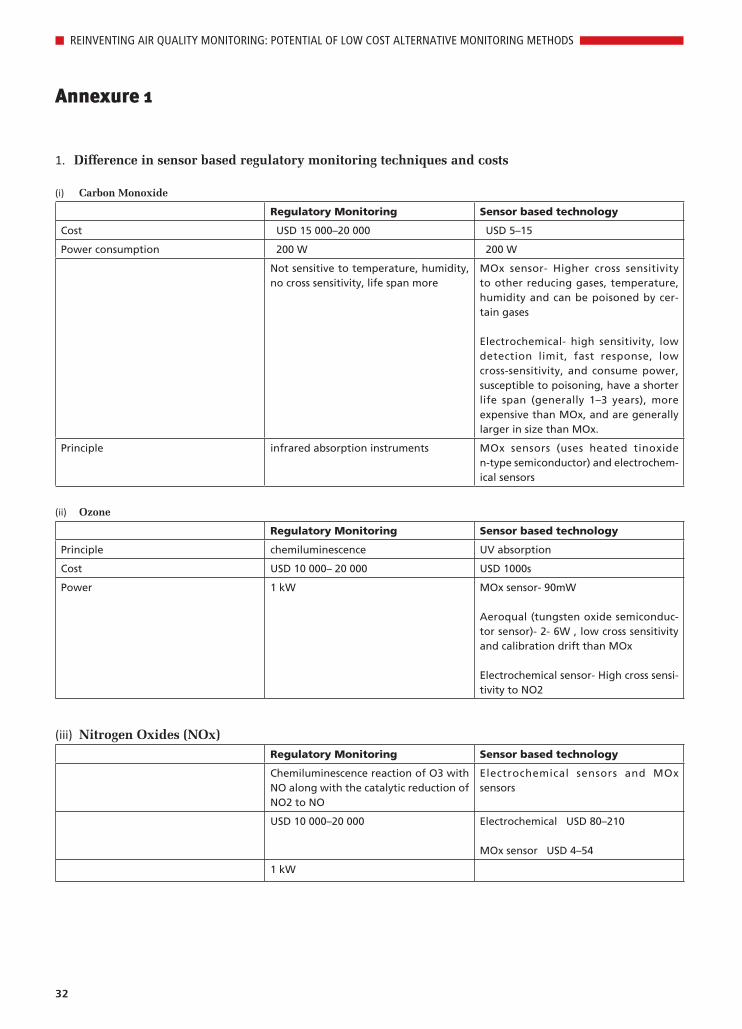
32
REINVENTING AIR QUALITY MONITORING: POTENTIAL OF LOW COST ALTERNATIVE MONITORING METHODS
Annexure 1
1. Difference in sensor based regulatory monitoring techniques and costs
(i) Carbon Monoxide
Regulatory Monitoring Sensor based technology
Cost ∼ USD 15 000–20 000 ∼ USD 5–15
Power consumption ∼ 200 W ∼ 200 W
Not sensitive to temperature, humidity, no cross sensitivity, life span more
MOx sensor- Higher cross sensitivity to other reducing gases, temperature, humidity and can be poisoned by cer-tain gases
Electrochemical- high sensitivity, low detection limit, fast response, low cross-sensitivity, and consume power, susceptible to poisoning, have a shorter life span (generally 1–3 years), more expensive than MOx, and are generally larger in size than MOx.
Principle infrared absorption instruments MOx sensors (uses heated tinoxide n-type semiconductor) and electrochem-ical sensors
(ii) Ozone
Regulatory Monitoring Sensor based technology
Principle chemiluminescence UV absorption
Cost USD 10 000– 20 000 USD 1000s
Power 1 kW MOx sensor- 90mW
Aeroqual (tungsten oxide semiconduc-tor sensor)- 2- 6W , low cross sensitivity and calibration drift than MOx
Electrochemical sensor- High cross sensi-tivity to NO2
(iii) Nitrogen Oxides (NOx)Regulatory Monitoring Sensor based technology
Chemiluminescence reaction of O3 with NO along with the catalytic reduction of NO2 to NO
Electrochemical sensors and MOx sensors
USD 10 000–20 000 Electrochemical ∼ USD 80–210
MOx sensor ∼ USD 4–54
1 kW
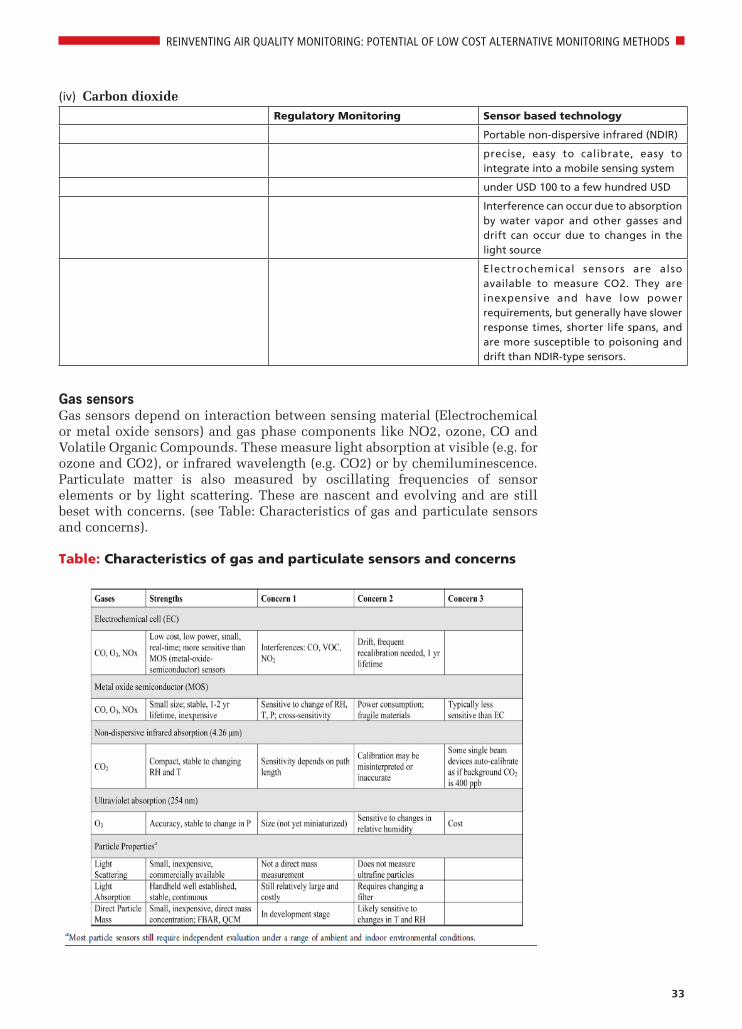
33
REINVENTING AIR QUALITY MONITORING: POTENTIAL OF LOW COST ALTERNATIVE MONITORING METHODS
(iv) Carbon dioxideRegulatory Monitoring Sensor based technology
Portable non-dispersive infrared (NDIR)
precise, easy to calibrate, easy to integrate into a mobile sensing system
under USD 100 to a few hundred USD
Interference can occur due to absorption by water vapor and other gasses and drift can occur due to changes in the light source
Electrochemical sensors are also available to measure CO2. They are inexpensive and have low power requirements, but generally have slower response times, shorter life spans, and are more susceptible to poisoning and drift than NDIR-type sensors.
Gas sensors Gas sensors depend on interaction between sensing material (Electrochemical or metal oxide sensors) and gas phase components like NO2, ozone, CO and Volatile Organic Compounds. These measure light absorption at visible (e.g. for ozone and CO2), or infrared wavelength (e.g. CO2) or by chemiluminescence. Particulate matter is also measured by oscillating frequencies of sensor elements or by light scattering. These are nascent and evolving and are still beset with concerns. (see Table: Characteristics of gas and particulate sensors and concerns).
Table: Characteristics of gas and particulate sensors and concerns

34
REINVENTING AIR QUALITY MONITORING: POTENTIAL OF LOW COST ALTERNATIVE MONITORING METHODS
Dust Trak for particulate monitoringThere are various features and benefits of the DustTrak :• Simultaneously measure size-segregated mass fraction concentrations
corresponding to PM 1 , PM 2.5 , Respirable, PM 10 and Total PM size fractions• STEL alarm setpoint for tracking 15-minute average mass concentrations• Automatic zeroing (with optional zero module) minimizes the effect of zero
drift• Perform in-line gravimetric analysis for custom reference calibrations• Manual and programmable data logging functions• Aerosol concentration range 0.001 to 150 mg/m 3
• Environmental protected and tamper-proof with Environmental Enclosure• Cloud Data Management System for efficient remote monitoring• Heated Inlet Sample Conditioner to reduce humidity effects• Desktop unit Various applications of DustTrak include industrial/
occupational hygiene surveys; indoor air quality investigations; outdoor environmental monitoring; fugitive emissions monitoring; site perimeter monitoring; fenceline monitoring; dust control operations; environmental research studies; baseline trending and screening; remote monitoring; emissions monitoring; aerosol research studies etc.
References
1. 2013, Emily G. Snyder, Timothy H. Watkins, Paul A. Solomon, Eben D. Thoma, Ronald W.
Williams, Gayle S. W. Hagler, David Shelow, David A. Hindin, Vasu J. Kilaru, and Peter W.
Preuss, The Changing Paradigm of Air Pollution, ACS Publications, http://pubs.acs.org/doi/
abs/10.1021/es4022602, As accessed on 18/11/2016
2. 2013, Queensland Government, , Collecting and measuring airborne particles, https://www.
qld.gov.au/environment/pollution/monitoring/air-pollution/oscillating-microbalance/, As
accessed on 19/11/2016
3. TSI, 2016, AIR QUALITY MONITORING, http://www.tsi.com/air-quality-monitoring/, As
accessed on 18/11/2016
4. Aeroqual, 2014, Urban Air Pollution Monitoring, http://www.aeroqual.com/outdoor-air-
quality/urban-air-monitoring, As accessed on 19/11/2016
5. 2011, Kwang Soo Yoo, Gas Sensors for Monitoring Air Pollution, Korea, http://cdn.intechopen.
com/pdfs/18374/InTech-Gas_sensors_for_monitoring_air_pollution.pdf, As accessed on
20/11/2016
6. Marcel Zevenbergen, Sensors for Air Quality, https://www.kivi.nl/uploads/
media/55264396beb61.pdf, As accessed on 20/11/2016
7. 2014, Air Sensor Guidebook, United States Environmental Protection Agency, https://cfpub.
epa.gov/si/si_public_file_download.cfm?p_download_id=519616, As accessed on 19/11/2016
8. 2015, Ron Williams, Air Quality Monitoring and Sensor Technologies, United States
Environmental Protection Agency, https://www.epa.gov/sites/production/files/2015-08/
documents/ron_williams-presentation_4_21.pdf, As accessed on 20/11/2016
9. 2015, Wei Ying Yi, Kin Ming Lo, Terrence Mak, Kwong Sak Leung, Yee Leung and Mei Ling
Meng, A Survey of Wireless Sensor Network Based Air Pollution Monitoring Systems in
Sensor, China, 31392–31427, www.mdpi.com/1424-8220/15/12/29859/pdf, As accessed on
20/11/2016
10. 2015, JULIAN SPECTOR, How Portable Air Sensors Are Changing Pollution Detection,
http://www.citylab.com/weather/2015/08/how-portable-air-sensors-are-changing-pollution-
detection/401147/, As accessed on 21/11/2016
11. 2016, Air pollution monitoring using low-cost sensors, TATA Center, https://tatacenter.mit.
edu/portfolio/air-pollution-sensors/, As accessed on 20/11/2016
12. 2015, Low-Cost Device Can Revolutionize Air Quality Monitoring and Help Countries Prevent
35
REINVENTING AIR QUALITY MONITORING: POTENTIAL OF LOW COST ALTERNATIVE MONITORING METHODS
Deaths from Outdoor Pollution, UNEP NEWS CENTRE, http://www.unep.org/newscentre/
Default.aspx?DocumentID=26840&ArticleID=35403, As accessed on 21/11/2016
13. 2016, Air quality monitoring device & sensors research, Sensing the Air Quality: Research on
Air Quality Sensors, http://aqicn.org/sensor/, As accessed on 20/11/2016
14. 2015, Brian Handwerk, With Wearable Devices That Monitor Air Quality, Scientists Can
Crowdsource Pollution Maps, http://www.smithsonianmag.com/innovation/with-wearable-
devices-that-monitor-air-quality-scientists-can-crowdsource-pollution-maps-180954556/, As
accessed on 20/11/2016
15. Srinivas Devarakonda, Parveen Sevusu, Hongzhang Liu, Ruilin Liu, Liviu Iftode, Badri Nath,
Real-time Air Quality Monitoring Through Mobile Sensing in Metropolitan Areas, https://
www.cs.rutgers.edu/~iftode/UrbComp_2013.pdf, As accessed on 22/11/2016
16. 2016, Alastair Lewis & Peter Edwards, Validate personal air-pollution sensors, http://www.
nature.com/news/validate-personal-air-pollution-sensors-1.20195, As accessed on 20/11/2016
17. 2015, Exposing Delhi’s air pollution, from the back of an autorickshaw, The Hindu, https://
www.mygov.in/sites/default/files/user_comments/Exposing%20Delhi%E2%80%99s%20
air%20pollution,%20from%20the%20back%20of%20an%20autorickshaw%20-%20
The%20Hindu.pdf, As accessed on 22/11/2016
18. 2014, Delhi Clean Air action plan, CSE, New Delhi, http://www.cseindia.org/userfiles/
DelhiCleanAirActionPlan.pdf
19. 2016, Anshul Anand, Air Eye NGA- innovations and invention-Personal Communication
1 http://cleanairasia.org/wp-content/uploads/portal/files/improving_aqmt_in_asia.pdf2 http://cleanairasia.org/wp-content/uploads/portal/files/improving_aqmt_in_asia.pdf3 http://nptel.ac.in/courses/Webcourse-contents/IIT-Delhi/Environmental%20Air%20Pollution/
air%20pollution%20(Civil)/Module-2/1.htm4 http://cleanairasia.org/wp-content/uploads/portal/files/improving_aqmt_in_asia.pdf5 http://cleanairasia.org/wp-content/uploads/portal/files/improving_aqmt_in_asia.pdf6 http://www.euro.who.int/__data/assets/pdf_file/0010/119674/E67902.pdf7 http://www.cpcb.nic.in/newitems/7.pdf8 http://www.euro.who.int/__data/assets/pdf_file/0010/119674/E67902.pdf9 http://www.euro.who.int/__data/assets/pdf_file/0010/119674/E67902.pdf10 http://uneplive.unep.org/media/docs/news_ticker/Air_Quality_Leaflet_Letter_size.pdf11 http://skollcentreblog.org/2016/02/11/air-quality-monitoring-with-the-un-in-kenya/12 http://uneplive.unep.org/media/docs/news_ticker/Air_Quality_Leaflet_Letter_size.pdf

36
REINVENTING AIR QUALITY MONITORING: POTENTIAL OF LOW COST ALTERNATIVE MONITORING METHODS
CentreforScienceandEnvironment41,TughlakabadInstitutionalArea,NewDelhi110062Phones:91-11-40616000Fax:91-11-29955879E-mail:[email protected]:www.cseindia.org