reit funds from operations (ffo) multiple …the-commercial-group.com/uploads/9_reit ffo multiple...
TRANSCRIPT
REIT FUNDS FROM OPERATIONS (FFO) MULTIPLE ANALYSIS
MULTIPLE REGRESSION ANLAYSIS OF ENDOGENOUS INDUSTRY VARIABLES
Prepared for Dr. David Hua in partial fulfillment for a grade in DBA830: Finance Theory and Applications, Doctorate of Business at
Golden Gate University, Summer 2001.
Prepared by
Lawrence A. Souza 195 Lexington Street, Apt. 7
San Francisco, CA 94110 (415) 431-8542
Saturday, August 18, 2000
2
OUTLINE
REIT FUNDS FROM OPERATIONS (FFO) MULTIPLE ANALYSIS
MULTIPLE REGRESSION ANLAYSIS OF ENDOGENOUS INDUSTRY VARIABLES
I. INTRODUCTION II. HISTORY OF REITS
III. REIT CORPORATE STRUCTURE
A. MANAGEMENT STRUCTURE
B. OWNERSHIP STRUCTURE
1. UPREITs 2. Management and Institutional Ownership 3. REIT Qualifications
IV. REIT STOCK VALUATION
A. INTRINSIC VALUE
1. FFO Multiple Approach
a. Funds From Operations (FFO) 2. Net Asset Value Approach 3. Dividend Discount Model Approach
B. RISK AND RETURN CHARACTERISTICS
1. Introduction 2. Property Type Returns 3. Risks and Returns of REIT Stocks 4. Dividends and Earnings 5. Capital Structure 6. New Issues 7. Efficiency and Liquidity 8. Size 9. Macroeconomic Variables

3
V. REIT FFO MULTIPLE ANALYSIS
A. BACKGROUND B. METHODOLOGY
1. Data 2. Variables 3. Research Questions 4. Hypothesizes 5. Multiple Regression 6. R-Square 7.
C. DATA ANALYSIS 1. Descriptive Statistics
D. CORRELATION ANALYSIS E. REGRESSION MODELS
1. Stepwise 2. OLS – Reduced Form 3. OLS – Forecast Model
VI. CONCLUSIONS
VII. REFERENCES
VIII. GLOSSARY
IX. APPENDICIES
4
REIT FUNDS FROM OPERATIONS (FFO) MULTIPLE ANALYSIS
MULTIPLE REGRESSION ANLAYSIS OF ENDOGENOUS INDUSTRY VARIABLES
INTRODUCTION The objective of this analysis is to identify what predictive variables determine REIT Funds from Operations (FFO) multiples. The FFO Multiple Approach to valuing REIT shares is one of the most popular methods use by Wall Street Analysts. Using cross-sectional Multiple Linear Regression (MLS) techniques, and data on the top 50 equity REITs by total market capitalization during 1996/1997, variables showing high statistical significance with FFO multiples were: current and future FFO growth, amount of funds raised since IPO to total market cap, number of post IPO public offerings, current year Cash Available After Distribution (CAD) growth, total debt to market cap, institutional ownership, trading volume to shares outstanding, Earnings Before Interest Depreciation and Amortization (EBIDA) to interest expense, and payout ratio. This report will provide a brief introduction to REITs, ownership and management structures, methods of REIT valuation and their risk and return characteristics, multiple regression analysis and results, and some concluding remarks. HISTORY OF REITS Real Estate Investment Trusts (REITs) were created by Congress in 1960 through the enactment of the Real Estate Investment Trust Act. REITs were invented as a way for small investors to participate in the real estate market, and enable them to diversify their stock and bond portfolios. Since real estate requires high initial capital investment, and is capital intensive operationally, REIT stocks allowed small investors to enter the market through small notional share purchases. To attract capital to the REIT sector, Congress imposed strict requirements on REITs in regards to ownership limits, revenue sources, and payout. REITs are required to payout the majority of their earnings as dividends, providing high income yields to investors. Providing a competitive advantage in the capital markets. If REITs meet all of the guidelines outlined by congress in the 1960 act, they are not required to pay taxes at the corporate level, allowing for higher rates of income distributions. However, since REITs are required to payout the majority of their earnings, it leavings them with minimal amounts of retained earnings for growth. For REITs to grow, they are forced to go to the capital markets for investment finance. REITs have gone through many cycles since there inceptions, and have played a very limited role in real estate investment for more than three decades. Since 1992, however, the REIT marketplace has grown dramatically.
5
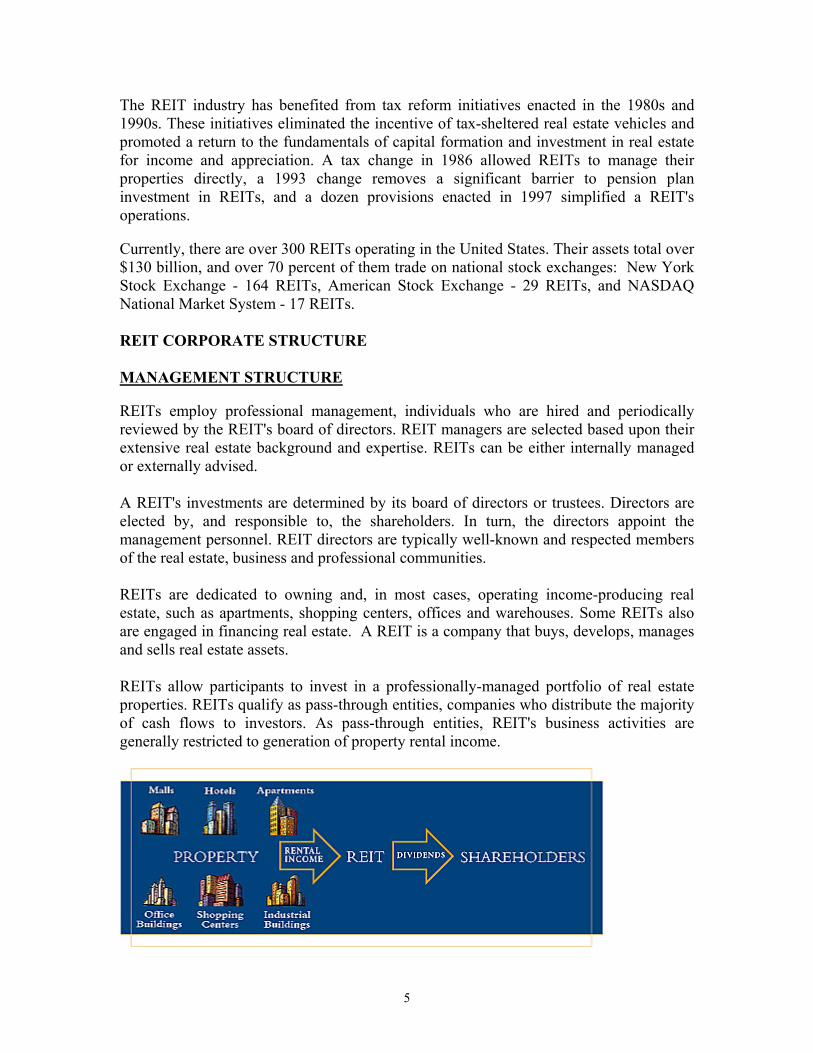
The REIT industry has benefited from tax reform initiatives enacted in the 1980s and 1990s. These initiatives eliminated the incentive of tax-sheltered real estate vehicles and promoted a return to the fundamentals of capital formation and investment in real estate for income and appreciation. A tax change in 1986 allowed REITs to manage their properties directly, a 1993 change removes a significant barrier to pension plan investment in REITs, and a dozen provisions enacted in 1997 simplified a REIT's operations. Currently, there are over 300 REITs operating in the United States. Their assets total over $130 billion, and over 70 percent of them trade on national stock exchanges: New York Stock Exchange - 164 REITs, American Stock Exchange - 29 REITs, and NASDAQ National Market System - 17 REITs. REIT CORPORATE STRUCTURE MANAGEMENT STRUCTURE REITs employ professional management, individuals who are hired and periodically reviewed by the REIT's board of directors. REIT managers are selected based upon their extensive real estate background and expertise. REITs can be either internally managed or externally advised. A REIT's investments are determined by its board of directors or trustees. Directors are elected by, and responsible to, the shareholders. In turn, the directors appoint the management personnel. REIT directors are typically well-known and respected members of the real estate, business and professional communities. REITs are dedicated to owning and, in most cases, operating income-producing real estate, such as apartments, shopping centers, offices and warehouses. Some REITs also are engaged in financing real estate. A REIT is a company that buys, develops, manages and sells real estate assets. REITs allow participants to invest in a professionally-managed portfolio of real estate properties. REITs qualify as pass-through entities, companies who distribute the majority of cash flows to investors. As pass-through entities, REIT's business activities are generally restricted to generation of property rental income.
6
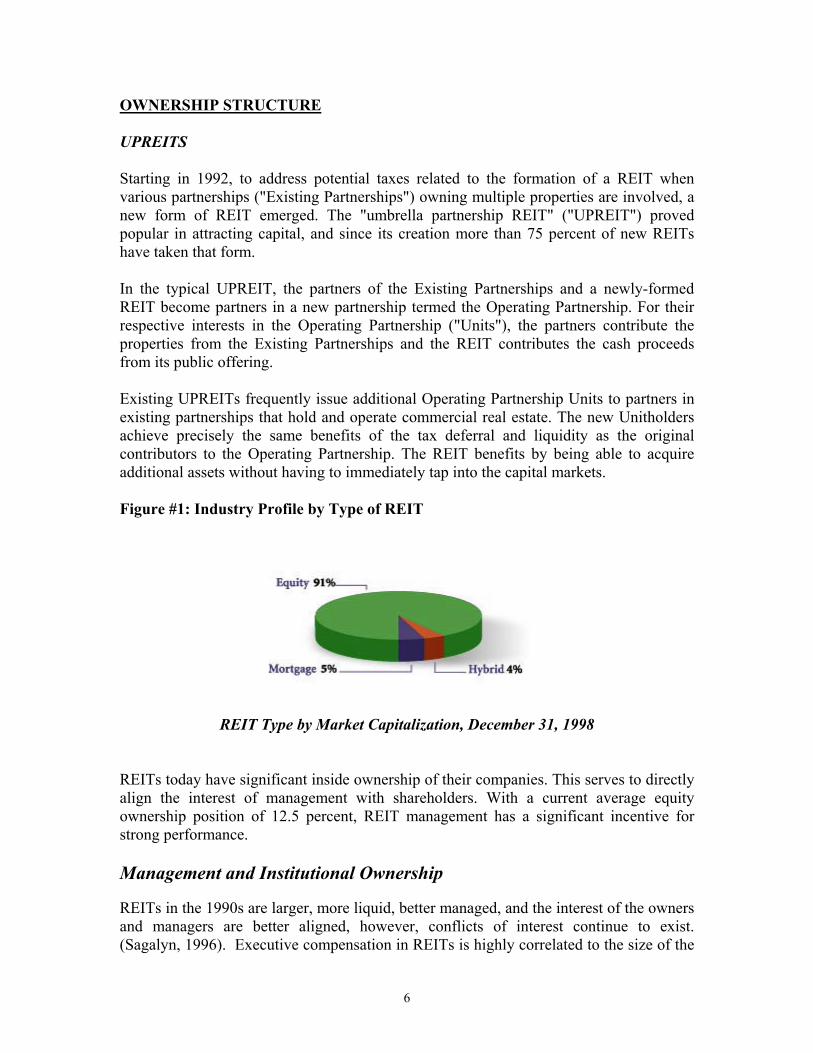
OWNERSHIP STRUCTURE UPREITS Starting in 1992, to address potential taxes related to the formation of a REIT when various partnerships ("Existing Partnerships") owning multiple properties are involved, a new form of REIT emerged. The "umbrella partnership REIT" ("UPREIT") proved popular in attracting capital, and since its creation more than 75 percent of new REITs have taken that form. In the typical UPREIT, the partners of the Existing Partnerships and a newly-formed REIT become partners in a new partnership termed the Operating Partnership. For their respective interests in the Operating Partnership ("Units"), the partners contribute the properties from the Existing Partnerships and the REIT contributes the cash proceeds from its public offering. Existing UPREITs frequently issue additional Operating Partnership Units to partners in existing partnerships that hold and operate commercial real estate. The new Unitholders achieve precisely the same benefits of the tax deferral and liquidity as the original contributors to the Operating Partnership. The REIT benefits by being able to acquire additional assets without having to immediately tap into the capital markets. Figure #1: Industry Profile by Type of REIT
REIT Type by Market Capitalization, December 31, 1998
REITs today have significant inside ownership of their companies. This serves to directly align the interest of management with shareholders. With a current average equity ownership position of 12.5 percent, REIT management has a significant incentive for strong performance. Management and Institutional Ownership REITs in the 1990s are larger, more liquid, better managed, and the interest of the owners and managers are better aligned, however, conflicts of interest continue to exist. (Sagalyn, 1996). Executive compensation in REITs is highly correlated to the size of the
7
REIT, along with percentage of stock owned by senior executives, dollar amount of dividends paid to senior executives, and the number of years since IPO are significant in impacting senior executive compensation (Hardin, 1998). The relationship between ownership structure and the firm’s value is also highly significant. As inside ownership rises above 5%, values start to decline. High levels of outside ownership eventually have a negative impact on REIT valuations (Friday, 1999). The influence of board of director composition and shareholder wealth is measured, increased outside director represention leads to increased value up to a point (Friday, 1998). Institutional investment in REITs increased significantly in 1990, this was highly correlated to increased returns in the REIT market (Chan, 1998). Increased level of institutional ownership leads to a greater degree of monitoring, impacting decisions made by managers. There is a significant, positive, relationship between announcement period abnormal stock returns and institutional ownership. Institutional investors impose further capital market discipline on managers (Peter, 1994). Institutional investors (mutual funds) move in and out of large-capitalization REITs in ways that negatively impact their overall returns. This can be attributed to industry-wide constraints on the availability of hard investment information about REIT real estate portfolios (Graff, 1997). REIT Qualifications In order for a corporation or trust to qualify as a REIT, it must comply with certain provisions within the Internal Revenue Code. As required by the Tax Code, a REIT must:
• Be a corporation, business trust or similar association;
• Be managed by a board of directors or trustees;
• Have shares that are fully transferable;
• Have a minimum of 100 shareholders;
• Have no more than 50 percent of the shares held by five or fewer individuals during the last half of each taxable year;
• Invest at least 75 percent of the total assets in real estate assets;
• Derive at least 75 percent of gross income from rents from real property, or interest on mortgages on real property;
• Pay dividends of at least 95 percent of REIT taxable income.
Source: National Association of Real Estate Investment Trusts.
8
REIT STOCK VALUATION REITs are the same as stocks, only the business is different. Common stocks are ownership shares in manufacturing or service businesses. REITs are engaged in holding real estate assets for rental income, rather than manufactured product income. In both cases, the shareholder is paid what is left over after business expenses, interest/principal, and preferred shareholders' dividends are paid out. Common stockholders are always last in line for distributions, making earnings highly variable. Because common stock returns are so unpredictable, they demand higher expected returns. Equity financing is the highest-cost of capital available, whether for a C corporation or for a REIT. REITs are a bit more like direct investment in real estate, and a bit less like other types of stocks, from the perspectives of diversification and liquidity. Correlations between REITs and the overall stock market have fallen. REITs continue to be less liquid compared to other comparable-size stocks. Institutional investment in REITs continue to grow, but still at levels well below those of comparable stocks (Ghosh, 1996). The difference between REIT stocks and growth stocks, as defined by their P/E ratios and price-to-cash flow ratio, appears to be strongly associated with respective earnings surprises. Analysts generally underestimate EPS of REIT stocks and overestimate the EPS of growth stocks, reflecting the tendency for investors to extrapolate past EPS trends into the future, however, the annual changes in EPS resembles a random walk or mean reversion tendency. REIT stocks generally outperform comparable-size growth stocks on a risk-adjusted basis (Bauman, 1997). INTRINSIC VALUE Like all companies whose stocks are publicly traded, REIT intrinsic share prices are determined by :
• Management quality;
• Anticipated total return from the stock, income return and capital appreciation.
• Current prevailing dividend yield relative to other investments (e.g., bonds, utility stocks);
• Dividend coverage from funds from operations;
• Anticipated growth (or lack thereof) in funds from operations per share; • Underlying asset value of the real estate and/or mortgages, and other assets.
There are three primary methods used by Wall Street analyst’s to value REIT shares: 1) FFO Multiple, Net Asset Value (NAV), and Discounted Cash Flow (DCF). Based on these approaches, an analyst determines the intrinsic value of the firm. If the intrinsic value is higher than the current stock price, a “Buy” recommendation is given; if the intrinsic value is lower than the current stock price, a “Sell” recommendation is given.
9
The purpose of this paper is to not only introduce REITs, but to determine the driving factors behind FFO Multiples for REIT stock valuation. FFO Multiple Approach The FFO Multiple approach to valuing REIT stocks is one of the most popular method s used by Wall Street analysts. The FFO Multiple approach is similar to the P/E Multiple approach used by analysts valuing industrial C corporations. The value of a REIT stock is determined by multiplying the FFO Multiple by FFO Per Share, similar to multiplying the Price-Earnings (P/E) Multiple by Earnings Per Share (EPS) for the company. Determining the value of the stock price is based on arriving at an appropriate FFO Multiple and FFO Per Share for the company.
REIT Stock Value = FFO Multiple x FFO Per Share FFO Multiples are determined by: 1) the company’s historical multiple, 2) future earnings prospects, and 3) peer group and industry multiples. Multiple expansions in an industry sector or for a given firm will drive up REIT stock valuations. Later in this paper we discuss the results from a multiple regression analysis identifying determinants of REIT multiples. Based on this analysis, management can focus on these financial and operating factors to maximize firm value through multiple expansions. Funds From Operations (FFO) NAREIT defines FFO as net income (computed in accordance with generally accepted accounting principles) excluding gains or losses from sales of property or debt restructuring, and adding back depreciation of real estate. Once FFO is calculated for the current period or forecast, it is divide by the number of shares outstanding, or projected number of shares outstanding, to arrive at the FFO per share. Many securities analysts judge a REIT's performance according to its FFO growth. Net Asset Value Approach REIT investors often compare current stock prices to the net asset value (NAV) of a company's shares. Net Asset Value is the per share measure of the market value of a company's net assets. Net Asset Value is calculated by aggregating stabilized Net Operating Income (NOI) or FFO for the entire company divided by an appropriate blended Capitalization (Cap) Rate for the company’s real estate assets. The Cap Rate is a discount factor (opportunity cost of capital) measured in many different ways: 1) Return on Capital + Return of Capital; 2) Weighted Average Cost of Capital (WACC) for the firm; 3) or expected or required rate of income return for the asset after taking into consideration new supply risk, stability and durability of income streams, functional and physical obsolesance, locational factors and other property amenities.
10
REIT Market Value = NAV = Sum Net Operating Income = NOI Blended Cap Rate i
REIT Stock Value = NAV Per Share = Net Asset Value of Firm Number of Shares Outstanding
The more appropriate method of calculating NAV is to determine current or forecast NOI FFO of each property in the portfolio, divide each property by a specific Cap Rate, and aggregate the NAV for each property up to the portfolio level. Once the portfolio NAV is calculated, it is divided by the current or future total number of shares outstanding, to arrive at a NAV per share. At times, the stock price of a REIT may be more or less than its NAV. NAV premiums over the current stock price (Franchise Value) are a reflection of: 1) the company’s superior historical and future earnings capabilities, 2) quality of management, and 3) organizational and operating efficiencies. NAV discounts below the current stock price are reflections of: 1) poor current and future prospects for firm earnings, 2) mistakes in financing (dilution) and operations (investment in poor performing assets), and 3) oversold nature of the REIT capital markets due to negative spread perceptions (IRR – WACC = - SPREAD). Dividend Discount Model Approach The last, more labor intensive, approach to valuing REIT stocks is the standard Dividend Discount Model Approach. The analyst starts will a standard income statement, and supplemental reports provided by the company, to build the cash flow model. Assumptions are put into the model pertaining to variables such as: 1) rental revenue projections for the properties, metro area and submarket by real estate asset class (office, industrial, apartments, retail, etc.); 2) other revenues; 3) vacancy loss factors; 4) discounts or concessions; and 5) expense growth rates by line item. Net Operating Income (NOI/FFO) is determined for each year going out to year ten. In year ten the NOI/FFO is capitalized at a terminal cap rate to arrive at a terminal value for the asset. This principle value along with NOIs per year are discounted back at an appropriate discount rate to arrive at a Present Value for the firm. The Present Value of the firm is divided by the current or future number of shares outstanding to arriving at a present value per share. The appropriate discount rate can be derived through many different methods: 1) require internal rate of return, 2) Weighted Average Cost of Capital, or 3) using various methods of calculating equity cost of capital (CAPM, Risk Premium, etc.).
11
PV REIT Value = Sum [NOI1/(1+R)1+ NOI2/(1+R)2 + ………. NOI10/(1+R)10
+[{NOI10/i}/(1+R)10]]
REIT Stock Value = PV Per Share = Present Value Net Operating Income Number of Shares Outstanding
Note: Other discount methods to arrive at REIT Valuations are: PV Per Share/R or PV Per Share / (i – g)
where PV = the present value of the income streams over the life of the holding period i10 = the terminal cap rate NOI1 = the annual net operating income R = the discount rate g = growth rate of future earnings RISK AND RETURN CHARACTERISTICS Introduction Due to the stable nature of property cash flows, inflation pass-through characteristics of commercial leases, commodity characteristics of space over time, equity aspects imbedded in REIT stocks, and high earnings payout, REIT stock market returns have been moderately-high and relatively stable over the long run.
• From 1975-1999, REITs provided a rate of return of 16.0%. This compares to a return of 17.2% for the S & P 500 Index. It is worth noting that all of the outperformance by the S & P 500 Index occurred during just the last two years.
• From 1975-1997, REITs outperformed the S & P 500 by 18.5% to 16.6%. It is
also worth noting that in 1977 when the S & P 500 Index was down 7.2%, REITs were up 18.0%.
• In 1981, the next year of negative performance by the S & P 500 Index (it fell by
4.9%), REITs were up 6.1%.
• In 1984 and 1992, when the S & P 500 Index rose just 6.3% and 7.7%, REITs returned 21.8% and 28.3%. Of course, there are also periods when the S & P 500 Index outperformed REITs (Cohen & Steirs, 2000).
12
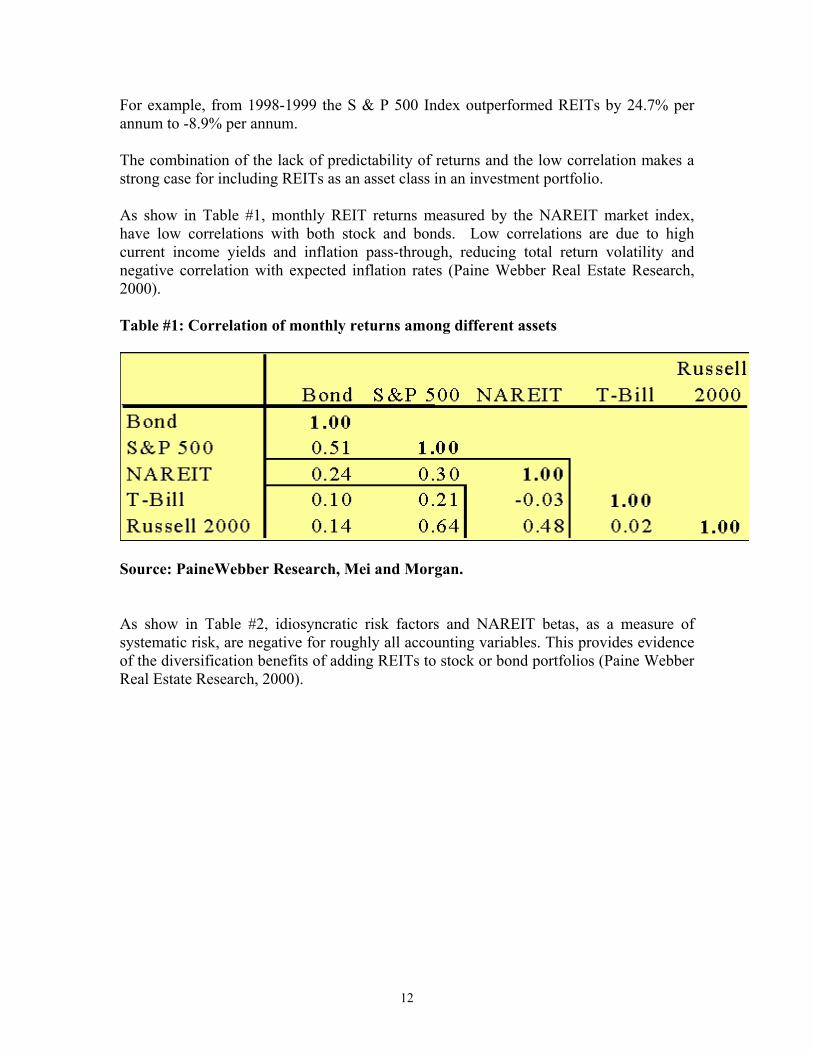
For example, from 1998-1999 the S & P 500 Index outperformed REITs by 24.7% per annum to -8.9% per annum. The combination of the lack of predictability of returns and the low correlation makes a strong case for including REITs as an asset class in an investment portfolio. As show in Table #1, monthly REIT returns measured by the NAREIT market index, have low correlations with both stock and bonds. Low correlations are due to high current income yields and inflation pass-through, reducing total return volatility and negative correlation with expected inflation rates (Paine Webber Real Estate Research, 2000). Table #1: Correlation of monthly returns among different assets
Source: PaineWebber Research, Mei and Morgan. As show in Table #2, idiosyncratic risk factors and NAREIT betas, as a measure of systematic risk, are negative for roughly all accounting variables. This provides evidence of the diversification benefits of adding REITs to stock or bond portfolios (Paine Webber Real Estate Research, 2000).
13
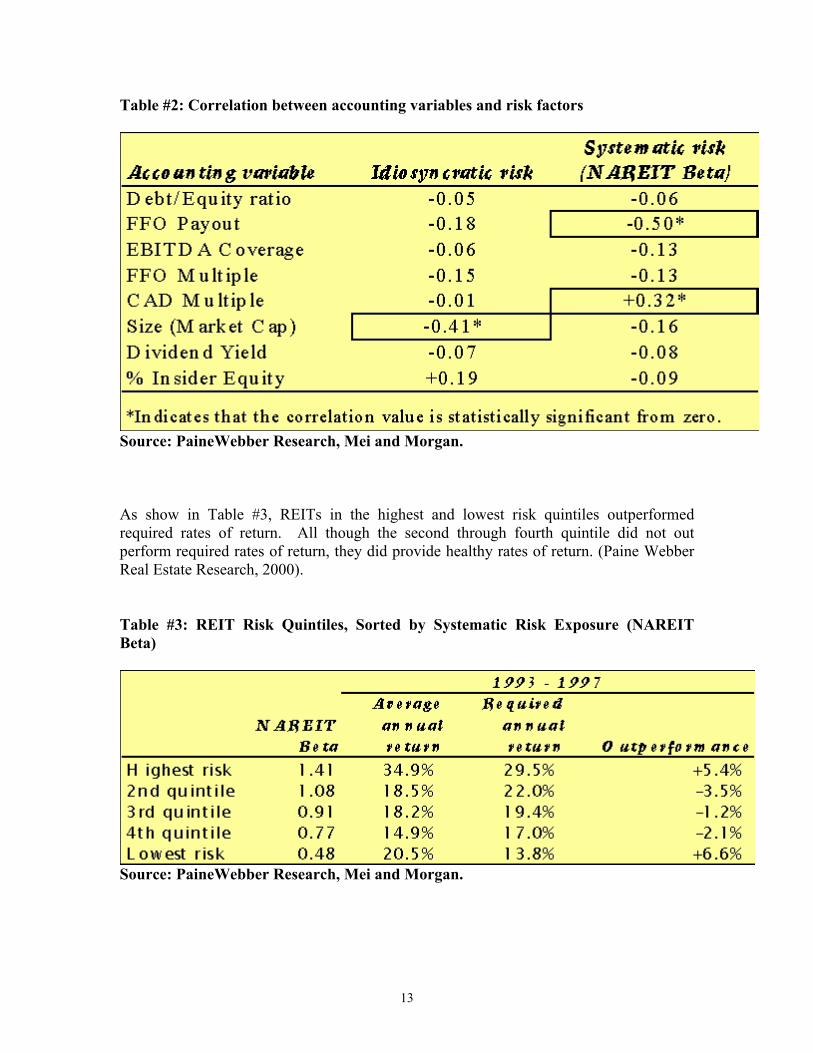
Table #2: Correlation between accounting variables and risk factors
Source: PaineWebber Research, Mei and Morgan. As show in Table #3, REITs in the highest and lowest risk quintiles outperformed required rates of return. All though the second through fourth quintile did not out perform required rates of return, they did provide healthy rates of return. (Paine Webber Real Estate Research, 2000). Table #3: REIT Risk Quintiles, Sorted by Systematic Risk Exposure (NAREIT Beta)
Source: PaineWebber Research, Mei and Morgan.
14
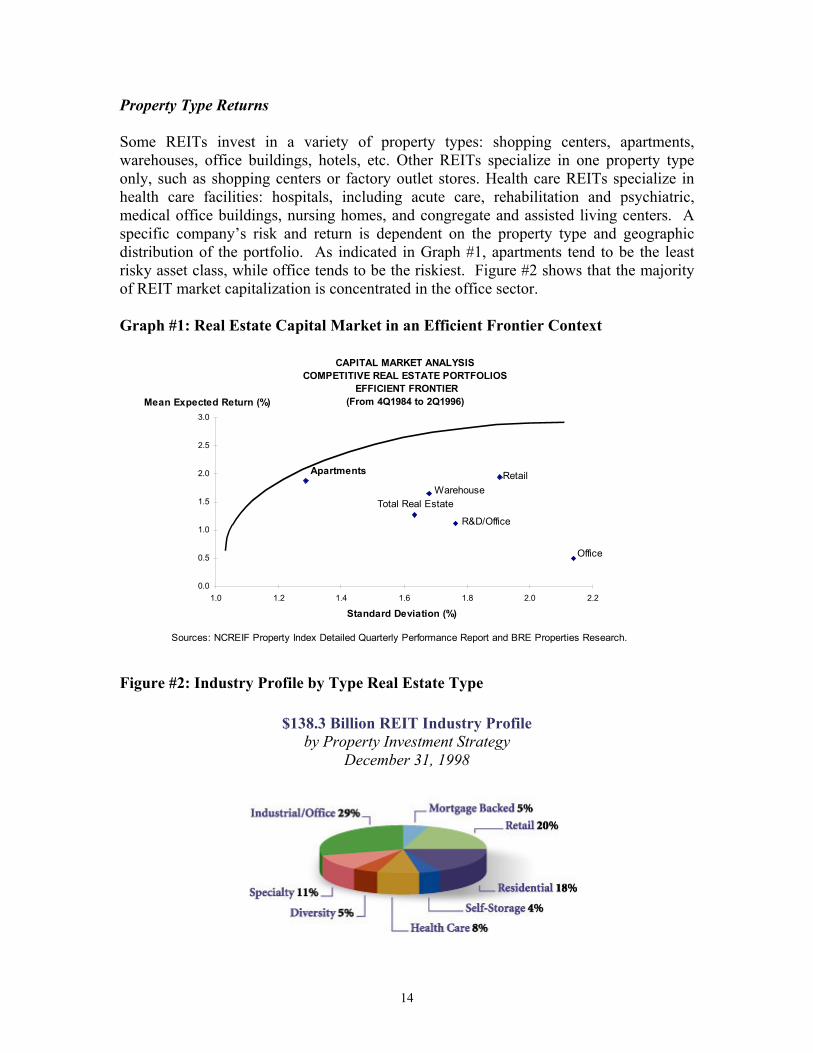
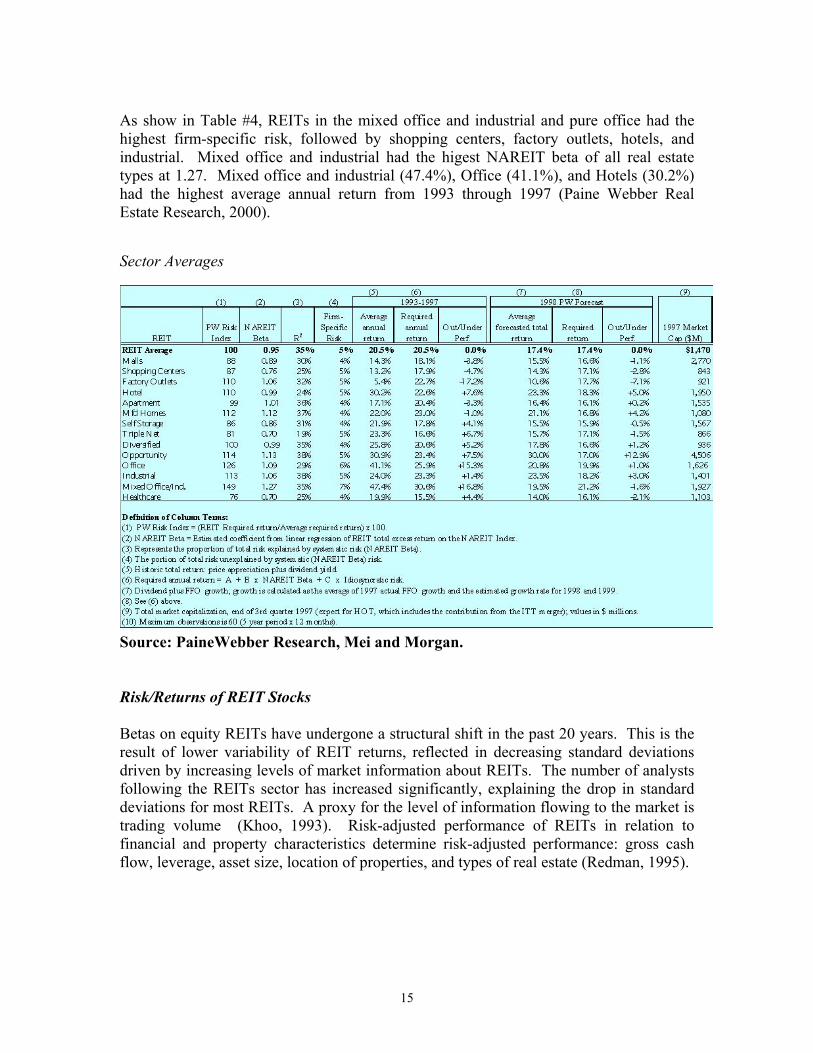
Property Type Returns Some REITs invest in a variety of property types: shopping centers, apartments, warehouses, office buildings, hotels, etc. Other REITs specialize in one property type only, such as shopping centers or factory outlet stores. Health care REITs specialize in health care facilities: hospitals, including acute care, rehabilitation and psychiatric, medical office buildings, nursing homes, and congregate and assisted living centers. A specific company’s risk and return is dependent on the property type and geographic distribution of the portfolio. As indicated in Graph #1, apartments tend to be the least risky asset class, while office tends to be the riskiest. Figure #2 shows that the majority of REIT market capitalization is concentrated in the office sector. Graph #1: Real Estate Capital Market in an Efficient Frontier Context
0.0
0.5
1.0
1.5
2.0
2.5
3.0
1.0 1.2 1.4 1.6 1.8 2.0 2.2
Mean Expected Return (%)
Standard Deviation (%)
CAPITAL MARKET ANALYSISCOMPETITIVE REAL ESTATE PORTFOLIOS
EFFICIENT FRONTIER(From 4Q1984 to 2Q1996)
RetailApartments
Warehouse
R&D/Office
Office
Total Real Estate
Sources: NCREIF Property Index Detailed Quarterly Performance Report and BRE Properties Research.
Figure #2: Industry Profile by Type Real Estate Type
$138.3 Billion REIT Industry Profile by Property Investment Strategy
December 31, 1998
15
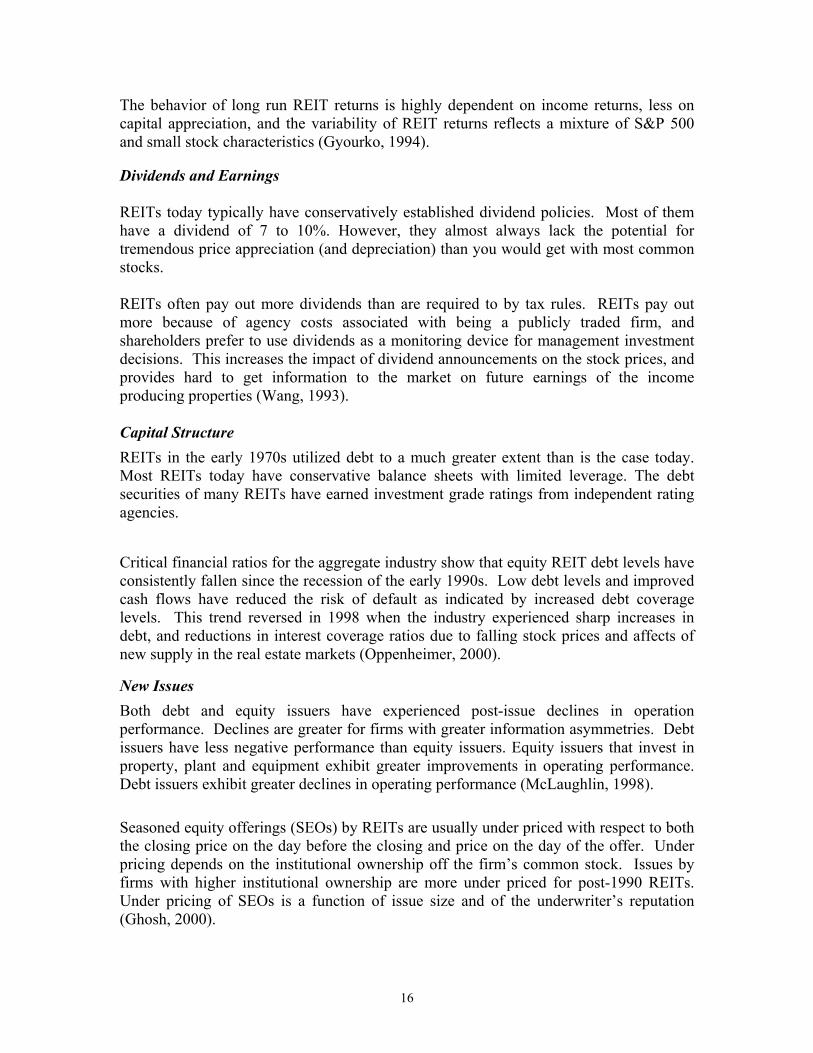
As show in Table #4, REITs in the mixed office and industrial and pure office had the highest firm-specific risk, followed by shopping centers, factory outlets, hotels, and industrial. Mixed office and industrial had the higest NAREIT beta of all real estate types at 1.27. Mixed office and industrial (47.4%), Office (41.1%), and Hotels (30.2%) had the highest average annual return from 1993 through 1997 (Paine Webber Real Estate Research, 2000). Sector Averages
Source: PaineWebber Research, Mei and Morgan. Risk/Returns of REIT Stocks Betas on equity REITs have undergone a structural shift in the past 20 years. This is the result of lower variability of REIT returns, reflected in decreasing standard deviations driven by increasing levels of market information about REITs. The number of analysts following the REITs sector has increased significantly, explaining the drop in standard deviations for most REITs. A proxy for the level of information flowing to the market is trading volume (Khoo, 1993). Risk-adjusted performance of REITs in relation to financial and property characteristics determine risk-adjusted performance: gross cash flow, leverage, asset size, location of properties, and types of real estate (Redman, 1995).
16
The behavior of long run REIT returns is highly dependent on income returns, less on capital appreciation, and the variability of REIT returns reflects a mixture of S&P 500 and small stock characteristics (Gyourko, 1994). Dividends and Earnings REITs today typically have conservatively established dividend policies. Most of them have a dividend of 7 to 10%. However, they almost always lack the potential for tremendous price appreciation (and depreciation) than you would get with most common stocks. REITs often pay out more dividends than are required to by tax rules. REITs pay out more because of agency costs associated with being a publicly traded firm, and shareholders prefer to use dividends as a monitoring device for management investment decisions. This increases the impact of dividend announcements on the stock prices, and provides hard to get information to the market on future earnings of the income producing properties (Wang, 1993). Capital Structure REITs in the early 1970s utilized debt to a much greater extent than is the case today. Most REITs today have conservative balance sheets with limited leverage. The debt securities of many REITs have earned investment grade ratings from independent rating agencies. Critical financial ratios for the aggregate industry show that equity REIT debt levels have consistently fallen since the recession of the early 1990s. Low debt levels and improved cash flows have reduced the risk of default as indicated by increased debt coverage levels. This trend reversed in 1998 when the industry experienced sharp increases in debt, and reductions in interest coverage ratios due to falling stock prices and affects of new supply in the real estate markets (Oppenheimer, 2000).
New Issues Both debt and equity issuers have experienced post-issue declines in operation performance. Declines are greater for firms with greater information asymmetries. Debt issuers have less negative performance than equity issuers. Equity issuers that invest in property, plant and equipment exhibit greater improvements in operating performance. Debt issuers exhibit greater declines in operating performance (McLaughlin, 1998). Seasoned equity offerings (SEOs) by REITs are usually under priced with respect to both the closing price on the day before the closing and price on the day of the offer. Under pricing depends on the institutional ownership off the firm’s common stock. Issues by firms with higher institutional ownership are more under priced for post-1990 REITs. Under pricing of SEOs is a function of issue size and of the underwriter’s reputation (Ghosh, 2000).
17
Efficiency and Liquidity REIT liquidity has increased significantly since 1993. Self-advised and self-managed organizational structures are found to be major factors driving increased REIT liquidity (Clayton, 2000). REIT percentage spreads (spread as a percentage of share price) have narrowed significantly, primarily due to higher share prices, rather than narrower dollar-value spreads. Return variance and share prices, not market capitalization, are found to be the primary determinants of percentage spreads. Liquidity of REITs is similar to non-REIT securities with similar prices and return variance. Percentage spreads are wider for REITs trading on the NASDAQ (Bhasin, 1997). Bid-ask spread differentials between REITs and Non-REITs have been halved between 1991 and 1994. These reductions have benefited investors through reductions in transactions costs, liquidity and level of uncertainty (Below, 1996). Size There is evidence that economies-of-scale exist for REITs. Individual characteristics such as type of management and degree of leverage have a significant impact on the scale economies of REITs, and accounting variables such as property-type and geographic diversification have little impact on scale economies of REITs (Bers, 1997). Large cap REITs account for the greatest proportion of REIT market volatility. Over time, idiosyncratic volatility in the REIT market has increased due to the role of institutional investors in the marketplace, along with greater availability of information about REITs, and their individual characteristics (Clayton, 2000). Although REITs, and the REIT market has grown significantly over the past the years, the strategy that bigger is better may not be better for stockholders. It may be easier and safer for high-quality small to large cap REITs to produce higher earnings per share for their stockholders through development and acquisition, than for mega cap REITs through the mergers and acquisitions of existing firms (Mueller, 1998). Macroeconomic Variables REITs like other financial assets are affected by macroeconomic and monetary factors. One of the benefits for REIT investors is the low or inverse relationship REIT returns have with inflation. This relationship is what mitigates the volatility in REIT returns. REITs are able to provide this benefit based on the CPI adjustment embedded in most commercial leases, percentage of retail sales agreements embedded in retail leases, and the commodity nature of hotel rooms and apartment units Therefore, REITs provide an inflation hedge in the long run. Over the long run, there is a positive-percistant relationship between the general price level and REIT returns (Chatrath, 1998).
18
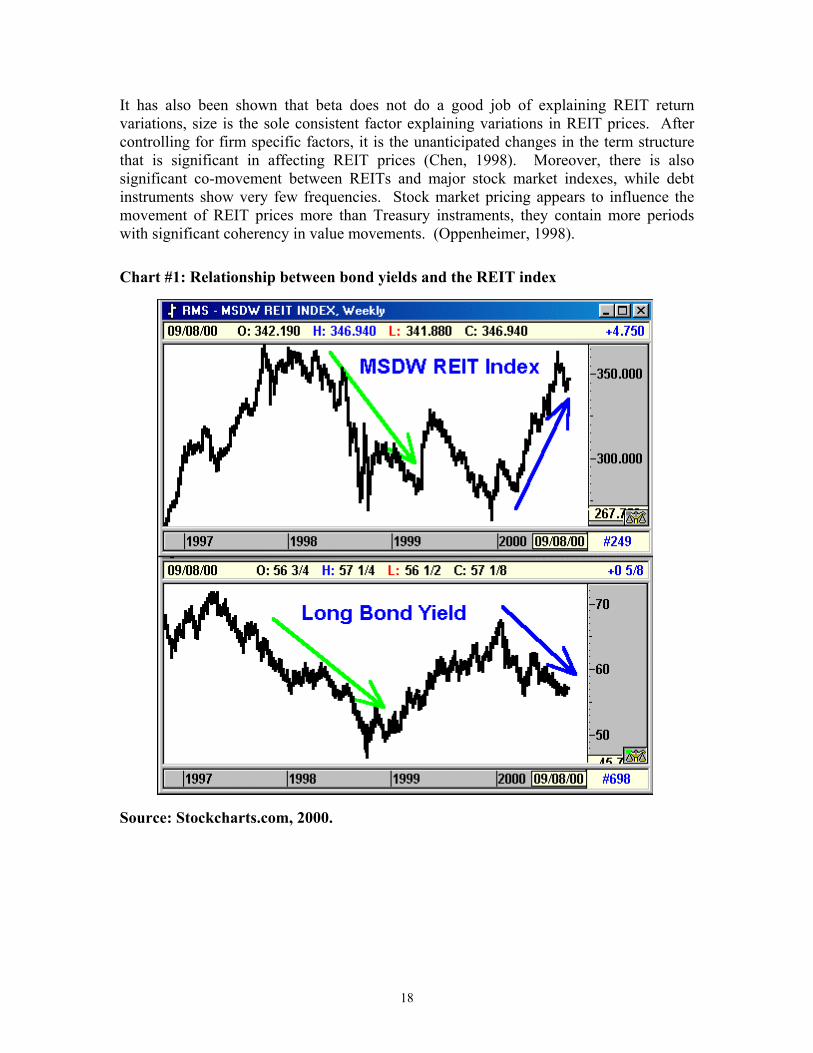
It has also been shown that beta does not do a good job of explaining REIT return variations, size is the sole consistent factor explaining variations in REIT prices. After controlling for firm specific factors, it is the unanticipated changes in the term structure that is significant in affecting REIT prices (Chen, 1998). Moreover, there is also significant co-movement between REITs and major stock market indexes, while debt instruments show very few frequencies. Stock market pricing appears to influence the movement of REIT prices more than Treasury instraments, they contain more periods with significant coherency in value movements. (Oppenheimer, 1998). Chart #1: Relationship between bond yields and the REIT index
Source: Stockcharts.com, 2000.
19
REIT FFO MULTIPLE ANALYSIS BACKGROUND The purpose of this analysis is to investigate driving factors for REIT FFO multiples. The idea is that if REIT management can identify factors that drive REIT FFO multiple expansion, they can increase the value of their stock. After reviewing the literature, there is limited analysis specific to driving factors behind FFO or P/E multiples. There is, however, extensive literature on the determination of stock prices and earnings. This research utilizes existing research on corporate and REIT earnings and stock prices, and utilizes interviews with senior REIT management and Wall Street investment bankers and analysts to determine potential variables that may drive FFO multiples. METHODOLOGY Prior to collecting data, extensive interviews were conducted with REIT industry professional to determine factor that may be significant in driving FFO multiples. Data Sources Data for the analysis was provided by two sources: 1) Dean Witter Reynolds Investment Banking Group, and 2) SNL Securities, Inc. Dean Witter Reynolds provided financial data for the top 50 equity REITs as of 1997 by implied market capitalization, and SNL Securities provided financial data on the top 100 equity REITs by implied market capitalization. Healthcare REITs were excluded from the data due to the large operating business component embedded in its revenue streams. The purpose was to build a sample of REITs that derived the majority of its funds from operations from real estate rental income. Missing Data Missing data was dealt with in two ways: 1) deletion and 2) inserting peer group means. If data was missing from multiple variable categories, and there were no peer group comparables to use to fill the data cell, that firm was eliminated from the data set. If was possible to estimate means from a comparable peer group, the cell was filled with a mean peer group element. With the Dean Witter data, 46 firms were used for the regression analysis.
20
Outliers Outliers were dealt with in three ways: 1) they were left in the dataset; 2) firms that outliers more than two standard deviations from the mean, in more than four variable categories were eliminated; and 3) firms that outliers more than one standard deviation from the mean, in more than five variable categories were eliminated. Most outliers were kept in the Dean Witter data due to limited sample size, but outliers greater than two standard deviations from the mean were eliminated from the SNL Securities dataset. Total number of firms in the SNL dataset ranged from 90 to 110. Variables The variables inventory started out with over 37 financial variables, macroeconomic variables were excluded from the study. Variables screed are considered endogenous to the REIT industry. Variables were categorized by: implied market cap, leverage, stock market activity, size by property variables, profitability, payout ratios, dividend growth, ownership interests, and qualitative measures. After normalizing the data, and eliminating redundancy, 20 variables were identified as having a potential influence on REIT FFO multiples. Variables included in the analysis were: Funds From Operations Multiple (Valuation)
• 97 Funds From Operations (FFO) Multiples (FFO97Ms): 1997 market determined Funds From Operations Multiples per share. FFO multiples are calculated by taking the REITs closing stock price and dividing it by Funds From Operations per share outstanding.
Implied Market Cap (Size)
• Implied Market Cap (IMC): implied market cap is total implied market capitalization, the total value of debt and equity traded in the capital markets.
• Real Estate Assets at Cost (REAAC): real estate assets at cost is the value of all
REIT assets at original cost or book value. Leverage (Bankruptcy Risk)
• Debt-to-Total Market Cap (D/TMC): debt to total market cap is the total value of debt outstanding to total market capitalization.
• Earnings Before Interest Taxes Depreciation and Amortization (EBITDA) to
Total Interest Expense (EBITDA/IE): EBITDA to total interest expense is a measure of debt coverage.
21
Stock Market Activity (Liquidity/Float/Efficiency)
• Average Daily Trading Volume (ADTV): average daily trading volume is the average trading volume per day averaged over a thirty-day period.
• Trading Volume to Total Shares Outstanding (TV/SO): total trading volume to
shares outstanding is the average daily trading volume to total number of shares outstanding.
• Beta (Beta): the beta is the beta coefficient calculated based on the S&P 500 stock index for a one-year period.
• Stock Price Appreciation From 1994 to 1995 (PA9495): Annual change in stock
price from 1994 to 1995.
• Stock Price Appreciation From 1995 to 1996 (PA9596): Annual change in stock price from 1994 to 1995.
• Number of Stock Market Analysts following the Stock (NOAC): number of Wall
Street equity stock analysts coving the REIT stock.. Size by Property Variables (Economies of Scale/Scope)
• Number of Properties in REIT Portfolio (NOPs): number of properties in the REITs portfolio.
• Number of Units in REIT Portfolio to Total Square Feet in Portfolio (NOU/SF):
total number of properties in the REITs to total number of square feet in portfolio.
• Number of States (NOS): total number of states across the U.S. in which the REIT has properties. Measure of geographic diversification.
Profitability (Earnings Momentum)
• FFO Growth 94-95 (FFOG9495): Actual historical funds from operations growth rate from 1994 – 1995 period.
• FFO Growth 95-96 (FFOG9596): Most recent period funds from operations
growth rate from 1995 – 1996 period.
• FFO Growth 96-97 (FFOG9697): Projected future period funds from operations growth rate for the 1996 – 1997 period.
• Cash Available for Distribution (CAD) Growth 1996 – 1997 (CADG9697): Cash
available for distribution to shareholders growth rate for Projected future period funds from operations growth rate for the 1996 – 1997 period.
22
• Funds from Operations Multiple in 1996 (Multiples): Historical FFO multiple in
1996.
• Actual Closing Stock Price on 12/31/1996 (P@123196): Actual closing REIT stock price on 12/31/1996.
Payout Ratios (Dividend Policies)
• 95 FFO Payout (FFO95PO): 1995 historical actual FFO payout ratio.
• 96 FFO Payout (FFO96PO): 1996 current period actual FFO payout ratio.
• 97 FFO Payout (Payout (6): 1997 projected FFO payout ratio.
• 96 CAD Payout (CAD96PO): 1996 current period cash available for distribution ratio.
• 97 CAD Payout (CAD97PO): 1997 current period cash available for distribution
ratio. Dividend Growth (Payout Momentum)
• Div. Gth. 94-95 (DG9495): Historical actual dividend growth in the 1994 – 1995 period.
• Div. Gth. 95-96 (DG9596): Current period dividend growth in the 1995 – 1996
period. Ownership Interests (Agency Relationships)
• Insider Ownership (InsiO): Percentage of shares outstanding held my management insiders.
• Institutional Ownership (InstO): Percentage of shares outstanding held by
institutional investors. Public Offerings (Dilution Probability)
• Number of Post IPO Public Offerings (NPIPOP): Number of post IPO public equity and debt offerings.
• $ Raise Since IPO to Total Market Cap (MRSIPO/MC): Total amount of funds
raised since IPO to total market capitalization.
23
Qualitative Measures (Dummy Variables)
• UPREIT (UPREIT): Identification of the firm as one that was established through an UPREIT structural transaction (1 = Yes, 0 = No).
• Internal Management Structure (IM): Identification of the firm as one that has
internal management, as apposed to one that is administered through a trustee (1 = Yes, 0 = No).
• Development Capabilities (DC): Identification of the firm as one that has internal
development capabilities to growth earnings through development, as apposed to strictly acquisitions (1 = Yes, 0 = No).
• Regional Focus (RFN): Identification of the firm as one that has a regionally
focused acquisition, development and management strategy, as apposed to a firm that is nation in it geographic focus (1 = Yes, 0 = No).
• Senior Unsecured Debt Rating (SUDR): Identification of the firm as one that has
had it senior unsecured debt rated by a national rating agency, as apposed to a firm whose debt has not been rated (1 = Yes, 0 = No).
Correlation analysis and single-linear regression was used to screen data variables for statistical significance and multicollinearity. Research Questions • What factors have an effect on determining FFO multiples for REIT stocks? • Does total implied market capitalization have an effect on FFO multiples?
• Does total debt to market capitalization have an effect on FFO multiples?
• Does interest coverage have an effect on FFO multiples?
• Does trading volumes have an effect on FFO multiples?
• Does future FFO growth projections have an effect on FFO multiples?
• Does degree of insider or institutional ownership have an effect on FFO multiples?
• Do payout ratios have an effect on FFO multiples?
• Do number of post IPOs have an effect on FFO multiples?
24
• Does regionally focused investment strategy have an effect on FFO multiples? • Does amount of funds raised since IPO an effect on FFO multiples?
• Does Cash Available for Distribution have an effect of FFO multiples?
Hypothesizes H1: Implied market capitalization has a positive effect on FFO multiples.
H2: Total debt to market capitalization has a negative effect on FFO multiples.
H3: Interest coverage has a negative effect on FFO multiples.
H4: Trading volumes have a positive effect on FFO multiples.
H5: Future FFO growth projections have a positive effect on FFO multiples.
H6: Insider or institutional ownership has a positive effect on FFO multiples.
H7: Payout ratios have a positive effect on FFO multiples.
H8: Post IPOs have a negative effect on FFO multiples.
H9: Regionally focused investment strategies have a positive effect on FFO multiples.
H10: Amount of funds raised since IPO has a negative effect on FFO multiples.
H11: Cash Available for Distribution has a positive effect of FFO multiples.
Multiple Regression Multiple-variable regression is used to test the significance between dependent and independent variables in an overall model context. Final determination of the forecast model is based on “t”, “F”, “R-square”, etc. diagnostic statistics, and theoretical inference.
R-Squared Correlation analysis is used to determine relationship of the model and variables in predicting the dependent variable. Correlation analysis was also used to screen independent variables and as a diagnostic tool to reduce multicollinearity in the model.
ttti uXXYE +++= 33221)( βββ
25
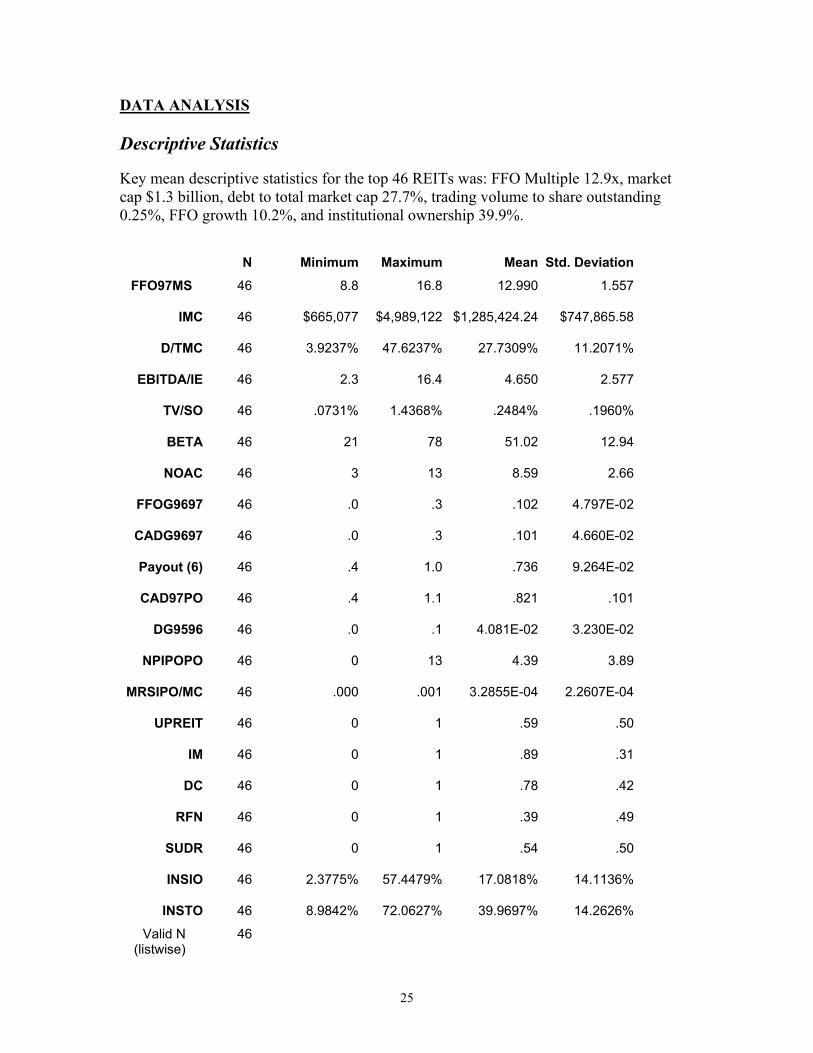
DATA ANALYSIS Descriptive Statistics Key mean descriptive statistics for the top 46 REITs was: FFO Multiple 12.9x, market cap $1.3 billion, debt to total market cap 27.7%, trading volume to share outstanding 0.25%, FFO growth 10.2%, and institutional ownership 39.9%.
N Minimum Maximum Mean Std. DeviationFFO97MS 46 8.8 16.8 12.990 1.557
IMC 46 $665,077 $4,989,122 $1,285,424.24 $747,865.58
D/TMC 46 3.9237% 47.6237% 27.7309% 11.2071%
EBITDA/IE 46 2.3 16.4 4.650 2.577
TV/SO 46 .0731% 1.4368% .2484% .1960%
BETA 46 21 78 51.02 12.94
NOAC 46 3 13 8.59 2.66
FFOG9697 46 .0 .3 .102 4.797E-02
CADG9697 46 .0 .3 .101 4.660E-02
Payout (6) 46 .4 1.0 .736 9.264E-02
CAD97PO 46 .4 1.1 .821 .101
DG9596 46 .0 .1 4.081E-02 3.230E-02
NPIPOPO 46 0 13 4.39 3.89
MRSIPO/MC 46 .000 .001 3.2855E-04 2.2607E-04
UPREIT 46 0 1 .59 .50
IM 46 0 1 .89 .31
DC 46 0 1 .78 .42
RFN 46 0 1 .39 .49
SUDR 46 0 1 .54 .50
INSIO 46 2.3775% 57.4479% 17.0818% 14.1136%
INSTO 46 8.9842% 72.0627% 39.9697% 14.2626%
Valid N (listwise)
46
26
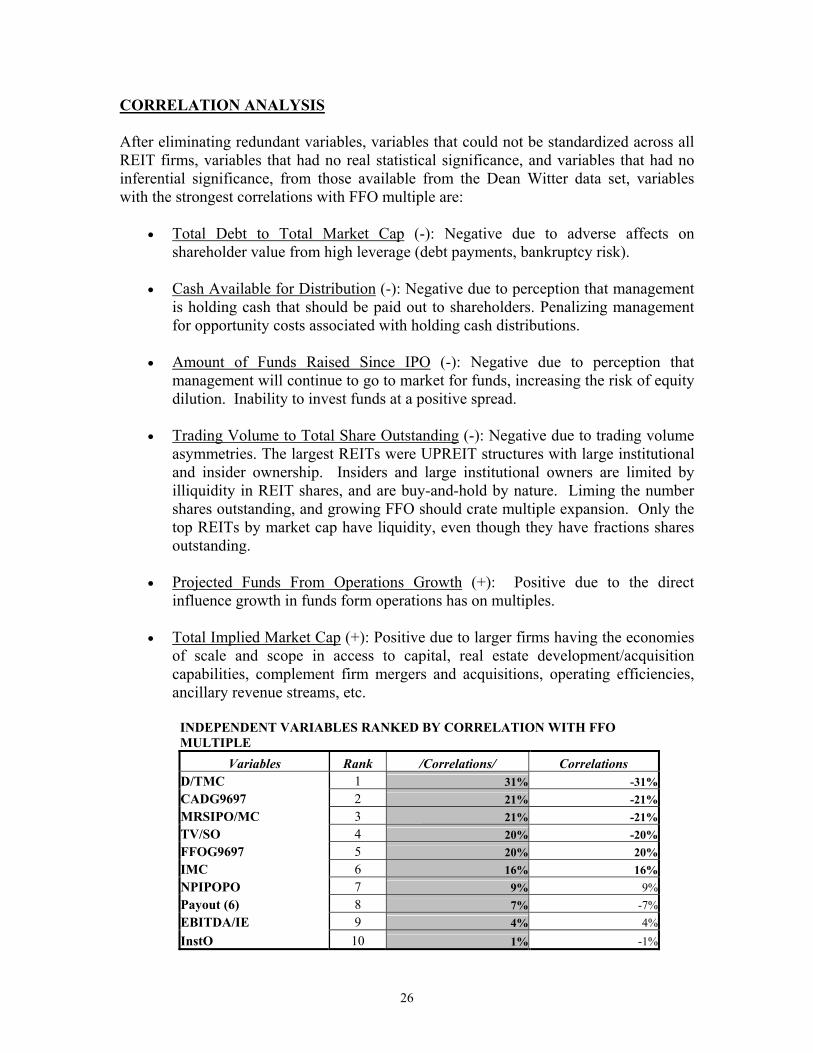
CORRELATION ANALYSIS After eliminating redundant variables, variables that could not be standardized across all REIT firms, variables that had no real statistical significance, and variables that had no inferential significance, from those available from the Dean Witter data set, variables with the strongest correlations with FFO multiple are:
• Total Debt to Total Market Cap (-): Negative due to adverse affects on shareholder value from high leverage (debt payments, bankruptcy risk).
• Cash Available for Distribution (-): Negative due to perception that management
is holding cash that should be paid out to shareholders. Penalizing management for opportunity costs associated with holding cash distributions.
• Amount of Funds Raised Since IPO (-): Negative due to perception that
management will continue to go to market for funds, increasing the risk of equity dilution. Inability to invest funds at a positive spread.
• Trading Volume to Total Share Outstanding (-): Negative due to trading volume
asymmetries. The largest REITs were UPREIT structures with large institutional and insider ownership. Insiders and large institutional owners are limited by illiquidity in REIT shares, and are buy-and-hold by nature. Liming the number shares outstanding, and growing FFO should crate multiple expansion. Only the top REITs by market cap have liquidity, even though they have fractions shares outstanding.
• Projected Funds From Operations Growth (+): Positive due to the direct
influence growth in funds form operations has on multiples.
• Total Implied Market Cap (+): Positive due to larger firms having the economies of scale and scope in access to capital, real estate development/acquisition capabilities, complement firm mergers and acquisitions, operating efficiencies, ancillary revenue streams, etc.
INDEPENDENT VARIABLES RANKED BY CORRELATION WITH FFO MULTIPLE
Variables Rank /Correlations/ Correlations D/TMC 1 31% -31%CADG9697 2 21% -21%MRSIPO/MC 3 21% -21%TV/SO 4 20% -20%FFOG9697 5 20% 20%IMC 6 16% 16%NPIPOPO 7 9% 9%Payout (6) 8 7% -7%EBITDA/IE 9 4% 4%InstO 10 1% -1%
27
Other variables from the full Dean Witter data set that showed moderate correlation with FFO multiples were:
• Development Capabilities (+): Positive due to investor perception that REITs are limited in internal growth capabilities, and will reach a limit in general and administrative cost reduction, leaving new development the primary driver for future FFO growth.
• Dividend Growth (+): Positive due to consistent, and consistently growing
dividends. Retail and institutional investor value REITs on their ability to pay current income yields, and a normal rate of return on capital. Consistency in dividend growth is highly valued.
• Regional Focus (-): Negative due to the perception that REITs regionally focused
are limited in FFO growth potential, are not diversifying their risk across markets, and are potentially becoming overly concentrated by industrial classification (Houston, Oil; Seattle, Aerospace; Bay Area, Technology; Las Vegas, Gambling).
• Beta (-): Negative due to the perception that as REIT betas approximate the
market, they are assuming higher levels of systematic risk. To compensate for higher levels of risk, REITs will have to pay higher expected rates of return on equity. To achieve higher rates of return, REITs will have to take on more debt, or invest in higher yielding, higher risk, and investments.
• UPREIT structure (+): Positive due to the fact that most UPREITs are
professionally-internally managed public corporations. Having internal-professional management allows the firm to be actively managed, taking advantage of real estate and capital market opportunities. Flexibility and innovative investment and operating strategies are not consistent with REITs that are managed by trustees or advisors (principle agency problem, no alignment of interest).
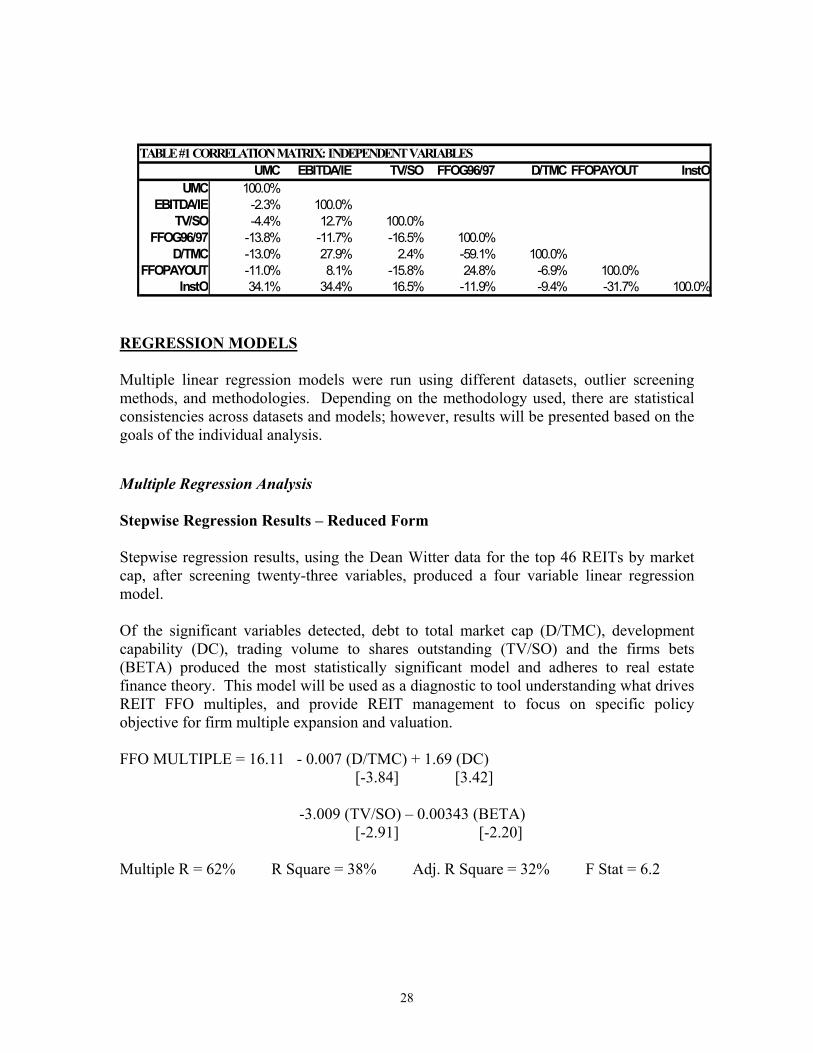
Expanding the correlation analysis to the broader SNL Securities dataset, variable significance was consistent with the Dean Witter data. From the SNL data, the correlation matrix below shows independent variables with low colliniarity with themselves. The regression analysis will show there is significance to the dependent variable.
28
REGRESSION MODELS Multiple linear regression models were run using different datasets, outlier screening methods, and methodologies. Depending on the methodology used, there are statistical consistencies across datasets and models; however, results will be presented based on the goals of the individual analysis. Multiple Regression Analysis Stepwise Regression Results – Reduced Form Stepwise regression results, using the Dean Witter data for the top 46 REITs by market cap, after screening twenty-three variables, produced a four variable linear regression model. Of the significant variables detected, debt to total market cap (D/TMC), development capability (DC), trading volume to shares outstanding (TV/SO) and the firms bets (BETA) produced the most statistically significant model and adheres to real estate finance theory. This model will be used as a diagnostic to tool understanding what drives REIT FFO multiples, and provide REIT management to focus on specific policy objective for firm multiple expansion and valuation. FFO MULTIPLE = 16.11 - 0.007 (D/TMC) + 1.69 (DC) [-3.84] [3.42] -3.009 (TV/SO) – 0.00343 (BETA) [-2.91] [-2.20]
Multiple R = 62% R Square = 38% Adj. R Square = 32% F Stat = 6.2
TABLE #1 CORRELATION MATRIX: INDEPENDENT VARIABLESUMC EBITDA/IE TV/SO FFOG96/97 D/TMC FFOPAYOUT InstO
UMC 100.0%EBITDA/IE -2.3% 100.0%
TV/SO -4.4% 12.7% 100.0%FFOG96/97 -13.8% -11.7% -16.5% 100.0%
D/TMC -13.0% 27.9% 2.4% -59.1% 100.0%FFOPAYOUT -11.0% 8.1% -15.8% 24.8% -6.9% 100.0%
InstO 34.1% 34.4% 16.5% -11.9% -9.4% -31.7% 100.0%
29
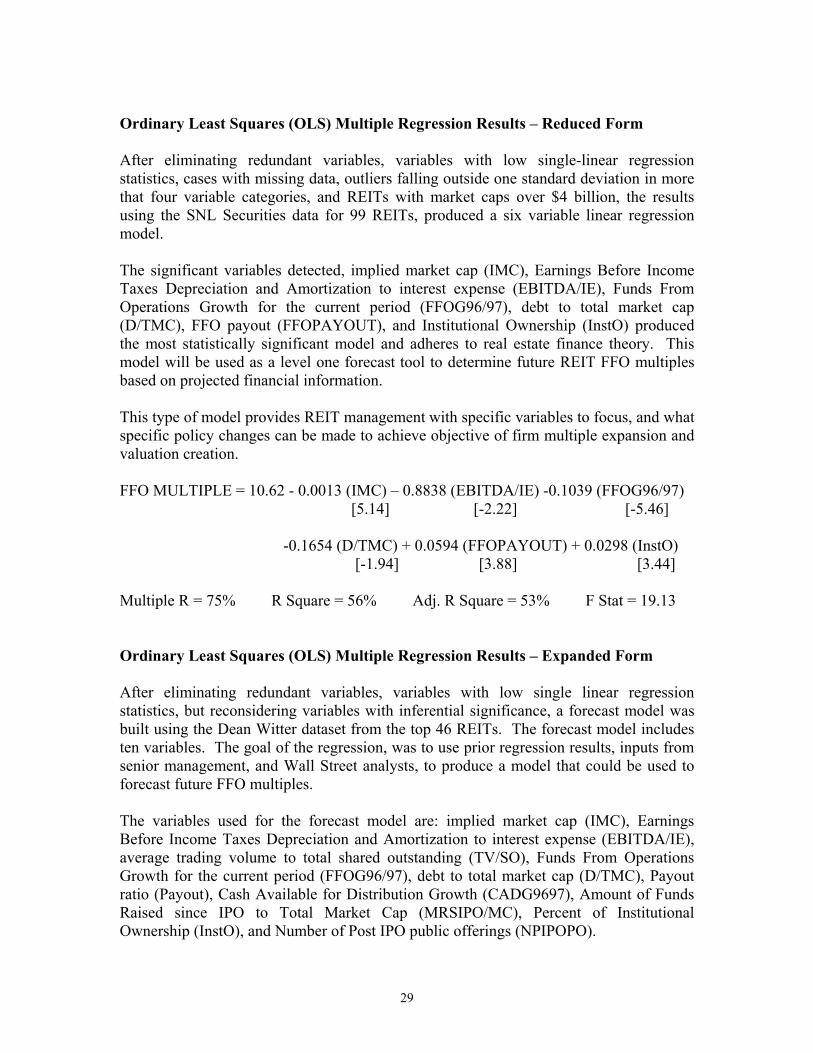
Ordinary Least Squares (OLS) Multiple Regression Results – Reduced Form After eliminating redundant variables, variables with low single-linear regression statistics, cases with missing data, outliers falling outside one standard deviation in more that four variable categories, and REITs with market caps over $4 billion, the results using the SNL Securities data for 99 REITs, produced a six variable linear regression model. The significant variables detected, implied market cap (IMC), Earnings Before Income Taxes Depreciation and Amortization to interest expense (EBITDA/IE), Funds From Operations Growth for the current period (FFOG96/97), debt to total market cap (D/TMC), FFO payout (FFOPAYOUT), and Institutional Ownership (InstO) produced the most statistically significant model and adheres to real estate finance theory. This model will be used as a level one forecast tool to determine future REIT FFO multiples based on projected financial information. This type of model provides REIT management with specific variables to focus, and what specific policy changes can be made to achieve objective of firm multiple expansion and valuation creation. FFO MULTIPLE = 10.62 - 0.0013 (IMC) – 0.8838 (EBITDA/IE) -0.1039 (FFOG96/97) [5.14] [-2.22] [-5.46] -0.1654 (D/TMC) + 0.0594 (FFOPAYOUT) + 0.0298 (InstO) [-1.94] [3.88] [3.44]
Multiple R = 75% R Square = 56% Adj. R Square = 53% F Stat = 19.13 Ordinary Least Squares (OLS) Multiple Regression Results – Expanded Form After eliminating redundant variables, variables with low single linear regression statistics, but reconsidering variables with inferential significance, a forecast model was built using the Dean Witter dataset from the top 46 REITs. The forecast model includes ten variables. The goal of the regression, was to use prior regression results, inputs from senior management, and Wall Street analysts, to produce a model that could be used to forecast future FFO multiples. The variables used for the forecast model are: implied market cap (IMC), Earnings Before Income Taxes Depreciation and Amortization to interest expense (EBITDA/IE), average trading volume to total shared outstanding (TV/SO), Funds From Operations Growth for the current period (FFOG96/97), debt to total market cap (D/TMC), Payout ratio (Payout), Cash Available for Distribution Growth (CADG9697), Amount of Funds Raised since IPO to Total Market Cap (MRSIPO/MC), Percent of Institutional Ownership (InstO), and Number of Post IPO public offerings (NPIPOPO).
30
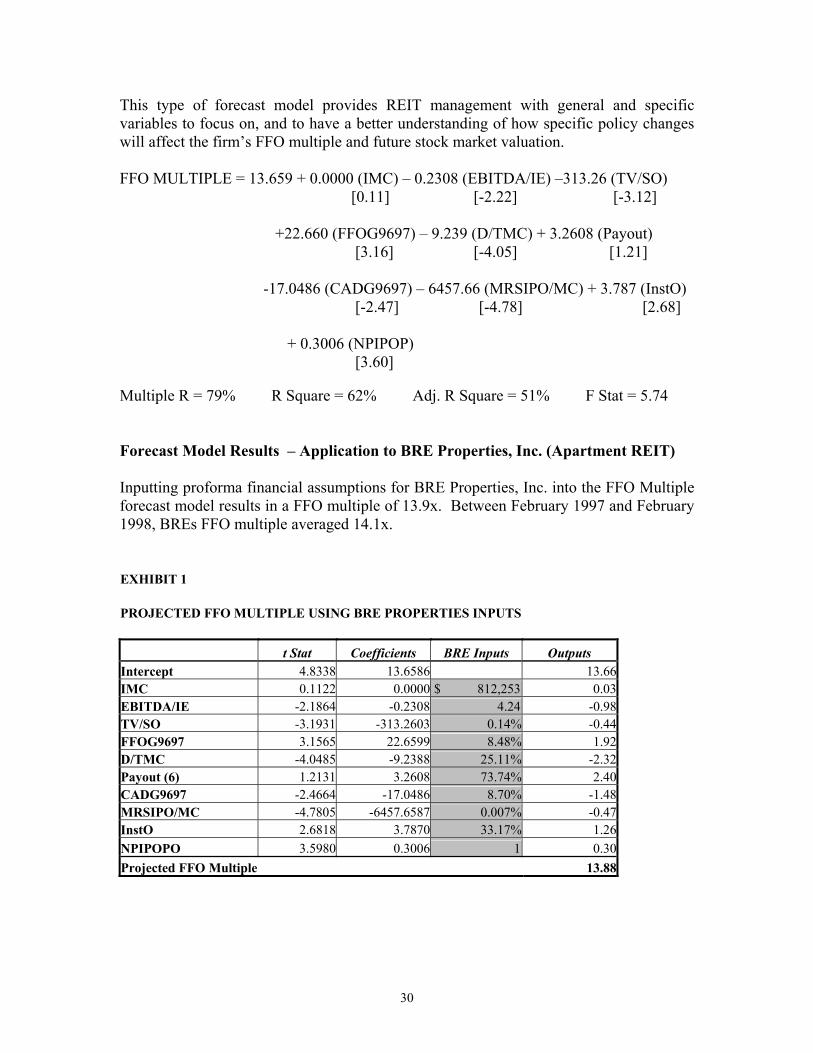
This type of forecast model provides REIT management with general and specific variables to focus on, and to have a better understanding of how specific policy changes will affect the firm’s FFO multiple and future stock market valuation. FFO MULTIPLE = 13.659 + 0.0000 (IMC) – 0.2308 (EBITDA/IE) –313.26 (TV/SO) [0.11] [-2.22] [-3.12] +22.660 (FFOG9697) – 9.239 (D/TMC) + 3.2608 (Payout) [3.16] [-4.05] [1.21]
-17.0486 (CADG9697) – 6457.66 (MRSIPO/MC) + 3.787 (InstO) [-2.47] [-4.78] [2.68]
+ 0.3006 (NPIPOP)
[3.60] Multiple R = 79% R Square = 62% Adj. R Square = 51% F Stat = 5.74 Forecast Model Results – Application to BRE Properties, Inc. (Apartment REIT) Inputting proforma financial assumptions for BRE Properties, Inc. into the FFO Multiple forecast model results in a FFO multiple of 13.9x. Between February 1997 and February 1998, BREs FFO multiple averaged 14.1x. EXHIBIT 1 PROJECTED FFO MULTIPLE USING BRE PROPERTIES INPUTS
t Stat Coefficients BRE Inputs Outputs Intercept 4.8338 13.6586 13.66IMC 0.1122 0.0000 $ 812,253 0.03EBITDA/IE -2.1864 -0.2308 4.24 -0.98TV/SO -3.1931 -313.2603 0.14% -0.44FFOG9697 3.1565 22.6599 8.48% 1.92D/TMC -4.0485 -9.2388 25.11% -2.32Payout (6) 1.2131 3.2608 73.74% 2.40CADG9697 -2.4664 -17.0486 8.70% -1.48MRSIPO/MC -4.7805 -6457.6587 0.007% -0.47InstO 2.6818 3.7870 33.17% 1.26NPIPOPO 3.5980 0.3006 1 0.30Projected FFO Multiple 13.88
31
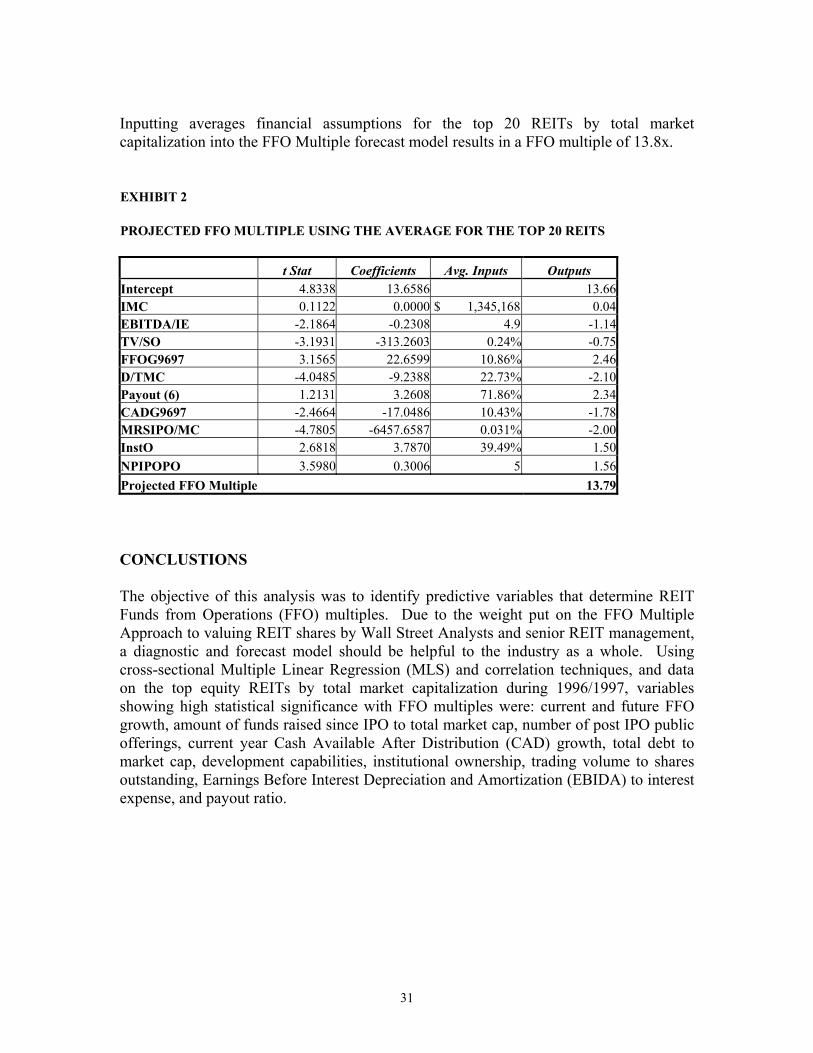
Inputting averages financial assumptions for the top 20 REITs by total market capitalization into the FFO Multiple forecast model results in a FFO multiple of 13.8x. EXHIBIT 2 PROJECTED FFO MULTIPLE USING THE AVERAGE FOR THE TOP 20 REITS
t Stat Coefficients Avg. Inputs Outputs Intercept 4.8338 13.6586 13.66IMC 0.1122 0.0000 $ 1,345,168 0.04EBITDA/IE -2.1864 -0.2308 4.9 -1.14TV/SO -3.1931 -313.2603 0.24% -0.75FFOG9697 3.1565 22.6599 10.86% 2.46D/TMC -4.0485 -9.2388 22.73% -2.10Payout (6) 1.2131 3.2608 71.86% 2.34CADG9697 -2.4664 -17.0486 10.43% -1.78MRSIPO/MC -4.7805 -6457.6587 0.031% -2.00InstO 2.6818 3.7870 39.49% 1.50NPIPOPO 3.5980 0.3006 5 1.56Projected FFO Multiple 13.79 CONCLUSTIONS The objective of this analysis was to identify predictive variables that determine REIT Funds from Operations (FFO) multiples. Due to the weight put on the FFO Multiple Approach to valuing REIT shares by Wall Street Analysts and senior REIT management, a diagnostic and forecast model should be helpful to the industry as a whole. Using cross-sectional Multiple Linear Regression (MLS) and correlation techniques, and data on the top equity REITs by total market capitalization during 1996/1997, variables showing high statistical significance with FFO multiples were: current and future FFO growth, amount of funds raised since IPO to total market cap, number of post IPO public offerings, current year Cash Available After Distribution (CAD) growth, total debt to market cap, development capabilities, institutional ownership, trading volume to shares outstanding, Earnings Before Interest Depreciation and Amortization (EBIDA) to interest expense, and payout ratio.
32
REFERENCES
Anderson, R.I., Lewis, D., & Springer, T.M. (1992), Operating efficiency in real
estate: a critical review of the literature. Journal of Real Estate Literature. 8 (1), 318. Baber, William R., Kim, Jong-Dae, & Kumar, Krishna R. (1999).
On the Use of Intra-Industry Information to Improve Earnings Forecasts. Journal of Business Finance & Accounting. 26 (9/10). 1177.
Bauman, W.S., & Miller, R.E. (1997). Investor expectations and the performance
of value stocks versus growth stocks. Journal of portfolio Management. 23 (3), 57 - 68. Bauman, W.S., & Miller, R.E. (1994, March). Security analyst forecasts and the
earnings yield anomaly. Journal of Business Finance & Accounting. 21 (2), 283 - 293. Behrens, R.J. (1994). Valuation and equity real estate investment trust. The
Appraisal Journal, 62 (1), 150 - 154. Below, S.D., Kiely, J.K., & McIntosh, W. (1996). REIT pricing efficiency; should
investors still be concerned? The Journal of Real Estate Research, 12 (3), 397 - 412. Bers, M., & Springer, T.M. (1997). Economies of scale for real estate investment
trusts. Journal of Real Estate Research. 14 (3), 275 - 290. Best, R.J., & Best, R.W. (2000, Fall), Earnings expectations and the relative
information content of dividend and earnings announcements. Journal of Economics and Finance. 24 (3), 232- 245.
Bhasin, V., Cole, R.A., & Kielly, J.K. (1997), Changes in REIT liquidity 1990 –
1994: evidence from intra-day transactions. Real Economics. 25 (4), 615 - 630. Bhasin, V., Cole, R.A., & Kiely, J.K. (1996, Summer). REIT liquidity and bid-ask
spreads. Real Estate Finance. 24 - 33. Brous, P.A., & Omesh, K. (1994, Spring). The valuation effects of equity issues
and the level of institutional ownership: evidence from analysts’ earnings forecasts. Financial Management. 23 (1), 33 - 53.
Bushee, B.J. (2001). Do Institutional Investors Prefer near-Term Earnings over
Long-Run Value? Contemporary Accounting Research. 18 (2), 207 - 246. Campbell, J.Y., & Shiller, R.J. (1998, Winter). Valuation ratios and the long-run
stock market outlook. Journal of Portfolio Management. 24 (2), 11 - 26.
33
Charitou, A., Club, C., & Andreou, A. (2001), The Effect of Earnings Permanence, Growth, and Firm Size on the Usefulness of Cash Flows and Earnings in Explaining Security Returns: Empirical Evidence for the UK. Journal of Business Finance and Accounting, 28 (5/6), 563 - 594.
Chatrath, A., & Liang, Y. (1998), REITs and inflation: a long-run perspective.
Journal of Real Estate Research. 16 (3), 311 - 325. Chan, S.H., Leung, W.K., & Wang, K. (1998). Institutional investment in REITs:
evidence and implications. Journal of Real Estate Research. 16 (3), 357 - 374. Chen, C. J. P. (2000). Discussion of the effects of earnings management, inside
information, and voluntary disclosure choice on the accuracy of management earnings forecasts. Asia Pacific Journal of Accounting and Economics. 7 (1), 59-63.
Chen, J., & Peiser, R. (1999, Spring). The risk and return characteristics of REITs
– 1993 – 1997. Real Estate Finance. 16 (1), 61 - 59-68. Chen, S.J., Hsieh, C., Vines, T.W., & Chiou, S.N. (1998). Macroeconomic
variables, firm-specific variables and returns to REITs. Journal of Real Estate Research. 16 (3), 269 - 277.
Clayton, J., & MacKinnon, G. (2000, Fall), REIT market maturation and pricing
dynamics. Real Estate Finance. 17 (3), 51 - 62. Clayton, J., & MacKinnon, G. (2000l), Measuring and explaining changes in
REIT liquidity: moving beyond the bid-ask spread. Real Estate Economics. 28 (1), 89 - 115.
Clemente, Holly A. (1990), What wall street sees when it looks at your P/E ratio. Financial Executive. 6 (3), 40 - 50.
Conover, M.C., Friday, H.S., & Howton, S.W. (2000), An analysis of the cross
section of returns for EREITs using a varying-risk beta model. Real Estate Economics. 28 (1), 141 - 163.
Constand, R.L., Freitas, L.P., & Sullivan, M.J. (1991, Winter). Factors affecting
price earnings ratios and market values of Japanese firms. Financial Management. 20 (4), 68 - 72.
Corgel, J.B. (1997). Property-by-property valuation of publicly traded real estate
firms. Journal of Real Estate Research. 14 (1), 77 - 90. Cragg, J.G. (1982), Expectations and the Structure of Share Prices. Chicago:
University of Chicago Press.
34
Cready, W.M. (2001). The Separation Theorem, Investor “Myopia”, and Market Prices: A Discussion of “Do Institutional Investors Prefer Near-Term Earnings over Long-Run Value?”, Contemporary Accounting Research. 18 (2), 247 - 256.
Chung, K.H., & Jo, H. (1996). The impact of security analysts’ monitoring and
marketing functions on the market value of firms. Journal of Financial and Quantitative Analysis. 31 (4), 493 - 512.
Fitzpatrick, B.D. (1994, Fall). Stock prices and microeconomic data. Journal of
Applied Business Research. 10 (4), 69 - 89. Friday, H.S., Howton, S.D., & Shelly, W.H. (2000, Summer). Anomalous
evidence on operating performance following seasoned equity offerings: the case of REITs. Financial Management. 29 (2), 76 - 87.
Friday, H.S., & Sirmans, G.S. (1998). Board of director monitoring and firm
value in REITs. The Journal of Real Estate Research, 16 (3), 411 - 427. Friday, H.S., Sirmans, G.S., & Conover, C.M. (1999). Ownership structure and
the value of the firm: a case of REITs. Journal of Real Estate Research. 17 (1), 71 - 90.
Hardin, W.G. (1998). Executive compensation in EREITs: EREIT size is but one determinant. Journal of Real Estate Research. 16 (3), 401 - 409.
Hansen, R.S., & Claire, C. (1990, July). Corporate earning and financing: and
empirical analysis. The Journal of Business. 63 (3), 347 - 349. Garrigan, R.T., & Persons, J.F.C. (Eds.). (1997). Real estate investment trusts:
structure, analysis and strategy. New York: McGraw-Hill. Gosh, C., Miles, M., & Sirmans, C.F. (1996, Fall), Area REITs stocks?. Real
Estate Finance. 46 – 53. Ghosh, C., Nag, R., & Sirmans, C.F. (2000, Fall), The pricing of seasoned equity
offerings: evidence from REITs. Real Estate Economics. 28 (3), 363 - 384. Glen, Jack, & Herring, Richard (1994). P/E Multiples: Comparative Evidence
for Japan and the United States. Global Finance Journal. 5 (2), 265. Graff, R.A., & Young, M.S. (1997). Institutional investor impact on equity REIT
performance. Real Estate Finance. 14 (3), 31 - 39. Graff, R.A., & Young, M.S. (1997). Serial persistence in equity REIT returns.
The Journal of Real Estate Research. 14 (3), 183 - 219.
35
Guo, H., & Ziebart, D. A. (2000). The effects of earnings management, inside information, and voluntary disclosure choice on the accuracy of management earnings forecasts. Asia Pacific Journal of Accounting and Economics. 7 (1). 33-58.
Gyourko, J., & Siegel, J. (1994). Long-term return characteristics of income-
producing real estate. Real Estate Finance, 11 (1), 14 - 22. Hardin, W.G., & Wolverton, M.L. (1999). Equity REIT property acquisitions: do
apartment REITs pay a premium? The Journal of Real Estate Research, 17 (1/2), 113 - 126.
Hensell, Lesley. REITs Plagued by Increasing Debt Load. Higgins, E.J., & Peterson, D.R. (1998, Winter). The power of one and two sample
t-statistics given event-induced variances increases and nonnormal stock returns: a comparative study. Quarterly Journal of Business and Economics. 37 (1), 27 - 49.
Jennings, Robert H. (1985), Reaction of Financial Analysts to Management
Earnings Forecasts. Charlottesville, VA: Financial Analysts Research Foundation. Jarrett, J. (1990, Fall). Forecasting seasonal time series of corporate earnings: a
note. Decision Sciences. 21 (4), 888 - 892. Johnson, R.R., & Jensen, G.R. (1999). Federal reserve monetary policy and real
estate investment trusts. Real Estate Finance. Spring, 52 - 59. Kalinowski, Joseph S. (2000, Spring). The outlook for United States corporate
earnings. The Journal of Business Forecasting Methods & Systems. 41 – 43. Kim, Chanson, K., Sungsoo, K., & Christos, P. (2001, January), Firm
diversification and earnings volatility: an empirical analysis of U.S. – based MNCs. American Business Review. 19 (1), 26 - 38.
Kuhle, J.L., & Alvayay, J.R. (2000, Oct - Dec), The efficiency of equity REIT
prices. Journal of Real Estate Portfolio Management. 6 (4), 349 - 354. Khoo, T., Hartzell, D., & Hoesli, M., (1993), An investigation of the change in
real estate investment trust betas. Journal of the American Real Estate and Urban Economics Association. 21 (2), 107 - 130.
Kwon, Soo Young, & Kim, Jeong Kuk. (1998). A Study of Factors Affecting the
Accuracy of Earnings Forecasts by Financial Analysts. Korean Social Science Journal. 25 (1), 221.
Liang, Y., Chatrath, A., & McIntosh, W. (1996), Apartment REITs and
Apartment Real Estate. The Journal of Real Estate Research. 11 (3), 277 - 289.
36
Litt, J., Mei, J., & Paine Webber. (1999, Spring). A risk adjusted model for REIT evaluation. Real Estate Finance, 16 (1), 9 - 19.
Liu, C.-S., & Ziebart, D.A (1999). Anomalous security price behavior following
management earnings forecasts. Journal of Empirical Finance. 6 (4), 405. Luttman, S.M., & Silham, P.A. (1993, Fall). An empirical analysis of the value
line earnings predictability index. Journal of Applied Business Research. 9 (4), 104 - 110.
McLaughlin, R., Safieddine, A., & Vasudevan, V.K. (1998, Summer). The
information content of corporate offerings of seasoned securities: an empirical analysis. Financial Management, 27 (2), 31 – 45.
Mest, D. P.; Plummer, E. (2000). Revisions in Analysts' Earnings Forecasts:
Evidence of Non-linear Adaptive Expectations. Journal of Forecasting. 19 (6), 467-484. Mensah, M.O., Nguyen, H.V., & Ryan, H.A. (1996, December). An empirical
analysis of qualitative management earnings forecasts. Journal of Business Finance and Accounting. 23 (9/10).
Mueller, Dennis C. (1986), Profits in the Long Run. Cambridge: Cambridge
University Press. Mueller, G.R., & Laposa, S.P. (1996). REIT returns: a property-type perspective.
Real Estate Finance. 13 (1), 45 - 53. Muller, G.R. (1998). REIT size and earnings growth: Is bigger better, or a new
challenge? Journal of Real Estate Portfolio Management. 4 (2), 149 - 157. Muldavin, S.R. (1998, Fall). Does size matter? Trends in real estate finance and
operations. Real Estate Finance. 15 (3), 7 - 12. Muldavin, S.R. (1997, Summer). Net asset value “premiums.” Real Estate
Finance. 14 (2), 74 - 78. Nastasi, M. (1998). The Effects of Inflation on Stock Prices,
http://www.gbcworld.com/mnastasi.html, Global Business Center, Inc. National Association of Real Estate Investment Trusts (NAREIT). (2000). Nelling, E., & Gyourko, J. (1998). The predictability of equity REIT returns.
The Journal of Real Estate Research. 16 (3), 251 - 268. Nelling, E., & Gyourko, J. (1998) The predictability of equity REIT returns,
Journal of Real Estate Research, 16 (3), 251 - 268.
37
Nutt, Stacey R., Easterwood, John C., & Easterwood, Cintia M. (1999). New
Evidence on Serial Correlation in Analyst Forecast Errors. Financial management, 28 (4), 106.
Oppenheimer, P.H. (2000, July-Sept). An investigation of current debt levels of equity REITs. Journal of Real Estate Portfolio Management. 6 (3), 225 - 237.
Oppenheimer, P., & Grissom, T.V. (1998). Frequency space correlation between
REITs and capital market indices. The Journal of Real Estate Research. 16 (3), 291 - 309.
Paine Webber Real Estate Research.. (2000). REITs Risk Adjustment Model. Peterson, J.D., & Hsieh, C.H. (1997, Summer). Do common risk factors in the
returns on stocks and bonds explain returns on REITs?. Real Estate Economics. 25 (2), 321- 345.
Redmand, A.L., & Manakyan, H. (1995). A multivariate analysis of REIT
performance by financial and real asset portfolio characteristics. Journal of Real Estate Finance and Economics. 10 , 169 - 175.
Sagalyn, L.B. (1996, Summer), Conflicts of interest in the structure of REITs.
Real Estate Finance. 34 - 51. Sanders, A.B. (1996, Spring) A note on the relationship between corporate bonds
and equity REITs. Real Estate Finance. 61 - 63. Seiler, M.J., Webb, J.R., & Myer, F.C. (1999), Are EREITs real estate. Journal of
Real Estate Portfolio Management. 5 (2), 171 - 181. Shelor, R.M., & Anderson, D.C. (1998). The financial performance of REITs
following initial public offerings. The Journal of Real Estate Research. 16 (3), 375 - 387. Slavin, N., Yun, J.K. (2001), Earnings per Share: A Review of the New
Accounting Standard. Journal of Corporate Accounting and Finance. 12 (5), 57 - 72. Sridharan, U.V., & St John, C.H. (1998, Winter). The effects of organizational
stability and leadership structure on firm performance. Journal of Managerial Issues, 10 (4), 469 - 484.
Srivastava, Rajendra K., Shervani, Tasaddaq A., & Fahey, Liam (1998, January).
Market-based assets and shareholder value: a framework for analysis. Journal of Marketing, 62 (1), 2 – 18.
Stickel, S.E. (1990, Autumn). Predicting individual analyst earnings forecasts.
Journal of Accounting Research. 28 (2), 409 - 416. Stockcharts.com (2000). Mailbag: REITs and Rate-of-Change.

38
Terregrossa, S.J. (1999). Combining analysts’ forecasts with causal model
forecasts of earnings growth. Applied Financial Economics. 9 (2), 143. Torto, R. (1998, Sept - Oct). Pricing REITs: The evidence from the beacon
properties purchase. Journal of Property Management, 63 (5), 14 - 18. Van Breda, Michael F. (1981), The prediction of corporate earnings. Ann Arbor,
Mich: UMI Research Press. Vergin, R.C. (1998, First Quarter). An examination of inventory turnover in the
Fortune 500 industrial companies. Production and Inventory Management Journal. 39 (1), 51 - 56.
Williams, P.A., Mayes, G.D., & Park, K. (1996, September). Factors affecting
earnings forecast revisions for the buy-side and sell-side analyst. Accounting Horizons. 10 (3), 112 - 121.
Wang, K., Erickson, J., & Gau, G.W. (1993). Dividend policies and dividend
announcement effects for real estate investment trusts. Journal of the American Real Estate and Urban Economics Association. 21 (2), 185 - 201.
Ye, Jia. (1999). Excess Returns, Stock Splits, and Analyst Earnings Forecasts.
Journal of Portfolio Management. 25 (2), 70. Young, M.S. (2000, Jan - Apr). REIT property – type sector integration. The
Journal of Real Estate Research. 19 (1/2), 3 - 21.
39
GLOSSARY Adjusted Funds From Operations (AFFO)
This term refers to a computation made by analysts and investors to measure a real estate company's cash flow generated by operations. AFFO is usually calculated by subtracting from Funds from Operations (FFO) both (1) normalized recurring expenditures that are capitalized by the REIT and then amortized, but which are necessary to maintain a REIT's properties and its revenue stream (e.g., new carpeting and drapes in apartment units, leasing expenses and tenant improvement allowances) and (2) "straight-lining" of rents. This calculation also is called Cash Available for Distribution (CAD) or Funds Available for Distribution (FAD).
Capitalization Rate
The capitalization rate (or "cap" rate) for a property is determined by dividing the property's net operating income by its purchase price. Generally, high cap rates indicate higher returns and greater perceived risk.
Cash (or Funds) Available for Distribution
Cash (or Funds) available for distribution (CAD or FAD) is a measure of a REIT's ability to generate cash and to distribute dividends to its shareholders. In addition to subtracting from FFO normalized recurring real estate-related expenditures and other non-cash items to obtain AFFO, CAD (or FAD) is usually derived by also subtracting nonrecurring expenditures.
Cost of Capital
The cost to a company, such as a REIT, of raising capital in the form of equity (common or preferred stock) or debt. The cost of equity capital generally is considered to include both the dividend rate as well as the expected equity growth either by higher dividends or growth in stock prices. The cost of debt capital is merely the interest expense on the debt incurred.
DownREIT
A DownREIT is structured much like an UPREIT, but the REIT owns and operates properties other than its interest in a controlled partnership that owns and operates separate properties.
40
EBITDA
Earnings before interest, taxes, depreciation and amortization. This measure is sometimes referred to as Net Operating Income (NOI).
Equitization
The process by which the economic benefits of ownership of a tangible asset, such as real estate, are divided among numerous investors and represented in the form of publicly-traded securities.
Equity Market Cap
The market value of all outstanding common stock of a company.
Equity REIT
A REIT which owns, or has an "equity interest" in, rental real estate (rather than making loans secured by real estate collateral).
Funds From Operations (FFO)
The most commonly accepted and reported measure of REIT operating performance. Equal to a REIT's net income, excluding gains or losses from sales of property or debt restructuring, and adding back real estate depreciation.
Hybrid REIT
A REIT that combines the investment strategies of both equity REITs and mortgage REITs.
Implied Equity Market Cap
The market value of all outstanding common stock of a company plus the value of all UPREIT partnership units as if they were converted into the REIT's stock. It excludes convertible preferred stock, convertible debentures and warrants even though these securities have similar conversion features.
Leverage
The amount of debt in relation to either equity capital or total capital.
Mortgage REIT
A REIT that makes or owns loans and other obligations that are secured by real estate collateral.
41
Net Asset Value (NAV)
The net "market value" of all a company's assets, including but not limited to its properties, after subtracting all its liabilities and obligations.
Positive Spread Investing (PSI)
The ability to raise funds (both equity and debt) at a cost significantly less than the initial returns that can be obtained on real estate transactions.
Real Estate Investment Trust Act of 1960
The federal law that authorized REITs. Its purpose was to allow small investors to pool their investments in real estate in order to get the same benefits as might be obtained by direct ownership, while also diversifying their risks and obtaining professional management.
Real Estate Investment Trust (REIT)
A REIT is a company dedicated to owning, and in most cases, operating income-producing real estate, such as apartments, shopping centers, offices and warehouses. Some REITs also engage in financing real estate.
REIT Modernization Act of 1999
Federal tax law change whose provisions allow a REIT to own up to 100% of stock of a taxable REIT subsidiary that can provide services to REIT tenants and others. The law also changed the minimum distribution requirement from 95 percent to 90 percent of a REIT's taxable income -- consistent with the rules for REITs from 1960 to 1980.
Securitization
Securitization is the process of financing a pool of similar but unrelated financial assets (usually loans or other debt instruments) by issuing to investors security interests representing claims against the cash flow and other economic benefits generated by the pool of assets.
Straight-lining
Real estate companies such as REITs "straight line" rents because generally accepted accounting principles require it. Straight lining averages the tenant's rent payments over the life of the lease.
42
Tax Reform Act of 1986
Federal law that substantially altered the real estate investment landscape by permitting REITs not only to own, but also to operate and manage, most types of income-producing commercial properties. It also stopped real estate "tax shelters" that had attracted capital from investors based on the amount of losses that could be created.
Total Market Cap
The total market value of a REIT's (or other company's) outstanding common stock and indebtedness.
Total Return
A stock's dividend income plus capital appreciation, before taxes and commissions.
UPREIT
In the typical UPREIT, the partners of the Existing Partnerships and a newly-formed REIT become partners in a new partnership termed the Operating Partnership. For their respective interests in the Operating Partnership ("Units"), the partners contribute the properties from the Existing Partnership and the REIT contributes the cash proceeds from its public offering. The REIT typically is the general partner and the majority owner of the Operating Partnership Units. After a period of time (often one year), the partners may enjoy the same liquidity of the REIT shareholders by tendering their Units for either cash or REIT shares (at the option of the REIT or Operating Partnership). This conversion may result in the partners incurring the tax deferred at the UPREIT's formation. The Unitholders may tender their Units over a period of time, thereby spreading out such tax. In addition, when a partner holds the Units until death, the estate tax rules operate in a such a way as to provide that the beneficiaries may tender the Units for cash or REIT shares without paying income taxes. Source: National Association of Real Estate Investment Trusts (NAREIT).