relation of pesticide concentrations to season, streamflow...
TRANSCRIPT

RELATION OF PESTICIDE CONCENTRATIONS TO SEASON, STREAMFLOW, AND LAND USE IN SEVEN NEW JERSEY STREAMS
National Water-QualityAssessment Program
Long Island - New JerseyStudy Unit
74
75
4173
40
39
41
StreamLong Island-New Jersey study-unit boundary
EXPLANATION
0 20 MILES
0 20 KILOMETERS
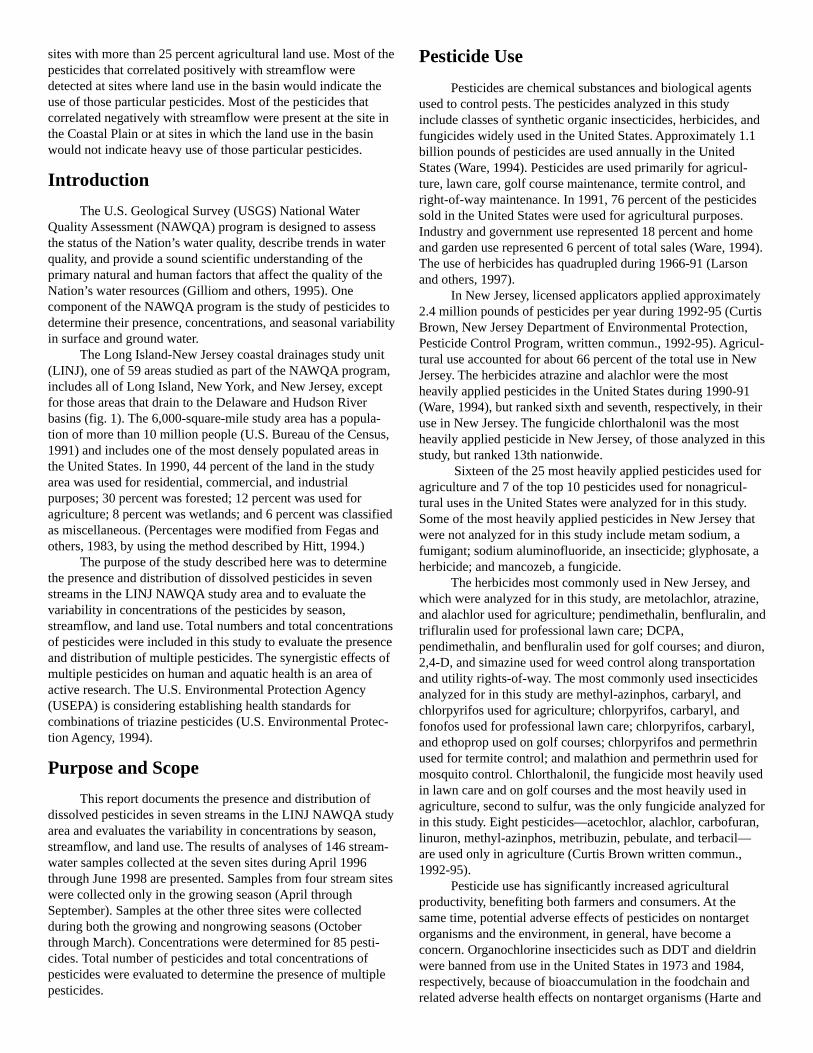
01382000 Passaic River at Two Bridges, N.J.01390500 Saddle River at Ridgewood, N.J.01395000 Neshanic River at Reaville, N.J.01401000 Stony Brook at Princeton, N.J.01403300 Raritan River at Queens Bridge at Bound Brook, N.J.01403900 Bound Brook at Middlesex, N.J.01410784 Great Egg Harbor River near Sicklerville, N.J.
Surface-water sampling site, number, and location:
Figure 1. Locations of seven stream sites sampled for pesticides from April 1996 through June 1998.
Large basin with mixed land use
Small basin with a single, pre-dominant land use
NEW JERSEY
LONG ISLAND
01403900
01390500
01382000
01398000
01401000
01403300
01410784
Abstract
The presence and variability of pesticides in seven NewJersey streams was documented by analyzing 146 samplescollected from the streams from April 1996 through June 1998.The samples were analyzed for 85 pesticides, including 50herbicides, 28 insecticides, and 7 degradation products, atmethod detection limits that ranged from 0.001 to 0.018 µg/L(micrograms per liter). Pesticides were frequently detected;however, concentrations were generally low. The pesticides mostfrequently detected were atrazine, in 97 percent of the samples;prometon, 96 percent; metolachlor, 95 percent; desethyl-atrazine,91 percent; simazine, 88 percent; diazinon, 58 percent; alachlor,56 percent; and carbaryl, 54 percent. Detection frequencies werehighest during the growing season (April-September). At leastone pesticide was detected in all but one of these samples, and49 percent of the samples contained 9 or more pesticides. Thenumbers of pesticides detected at a given site ranged from 13to 29.
Ten pesticides were detected at concentrations thatexceeded established water-quality criteria. Thirty-one ofthese detections were in samples collected during thegrowing season and one during the nongrowingseason. The pesticides that exceeded the U.S. Environ-mental Protection Agency (USEPA) maximum con-taminant level for drinking water were atrazine, whichexceeded 3 µg/L in four samples, and alachlor, 2 µg/L intwo samples. Cyanazine exceeded the USEPA lifetimehealth advisory level (HAL) of 1 µg/L in two samples.These eight detections occurred during runoff shortly afterspring pesticide applications and represent a potential threatto municipal water supplies in the Raritan River basin.Concentrations of chlorpyrifos, chlorthalonil,diazinon, ethyl-parathion, and methyl-azinphosexceeded the chronic life criteria for theprotection of aquatic life (AQCR) in 20samples at four sites during the growing season.Dieldrin was detected in four samples and DDEin two samples at concentrations that exceededNew Jersey Department of EnvironmentalProtection (NJDEP) human health criteria.
Individual and total-pesticide concentrationsand total numbers of pesticides detected in thesamples varied with season and flow conditions.Median and maximum concentrations of mostof the pesticides were highest during runoff in
the growing season. Pesticide concentrations were typicallylower and less variable in the nongrowing season than in thegrowing season, regardless of changes in hydrologic conditions;however, median concentrations of most pesticides were slightlylower during runoff than during base flow. The median total-pesticide concentration and median total number of pesticidesdetected were highest and most variable in runoff samples in thegrowing season. In the nongrowing season, the median total-pesticide concentration was lowest in runoff samples and leastvariable during base-flow conditions. Median total numbers ofpesticides were lowest and least variable in the nongrowingseason during base-flow conditions at most sites.
The highest total-pesticide concentrations were detected insamples from the two small agricultural basins (greater than 25percent of land use is agricultural) during runoff in late springand early summer. In general, insecticides were detected morefrequently and in greater concentrations at urban sites. Concen-trations of agricultural herbicides generally decreased withincreasing flow at the four sites with less than 10 percent
agricultural land use and increased withincreasing flow at the three
U.S. Department of the Interior WRIR 99-4154U.S. Geological Survey November 1999
sites with more than 25 percent agricultural land use. Most of thepesticides that correlated positively with streamflow weredetected at sites where land use in the basin would indicate theuse of those particular pesticides. Most of the pesticides thatcorrelated negatively with streamflow were present at the site inthe Coastal Plain or at sites in which the land use in the basinwould not indicate heavy use of those particular pesticides.
Introduction
The U.S. Geological Survey (USGS) National WaterQuality Assessment (NAWQA) program is designed to assessthe status of the Nation’s water quality, describe trends in waterquality, and provide a sound scientific understanding of theprimary natural and human factors that affect the quality of theNation’s water resources (Gilliom and others, 1995). Onecomponent of the NAWQA program is the study of pesticides todetermine their presence, concentrations, and seasonal variabilityin surface and ground water.
The Long Island-New Jersey coastal drainages study unit(LINJ), one of 59 areas studied as part of the NAWQA program,includes all of Long Island, New York, and New Jersey, exceptfor those areas that drain to the Delaware and Hudson Riverbasins (fig. 1). The 6,000-square-mile study area has a popula-tion of more than 10 million people (U.S. Bureau of the Census,1991) and includes one of the most densely populated areas inthe United States. In 1990, 44 percent of the land in the studyarea was used for residential, commercial, and industrialpurposes; 30 percent was forested; 12 percent was used foragriculture; 8 percent was wetlands; and 6 percent was classifiedas miscellaneous. (Percentages were modified from Fegas andothers, 1983, by using the method described by Hitt, 1994.)
The purpose of the study described here was to determinethe presence and distribution of dissolved pesticides in sevenstreams in the LINJ NAWQA study area and to evaluate thevariability in concentrations of the pesticides by season,streamflow, and land use. Total numbers and total concentrationsof pesticides were included in this study to evaluate the presenceand distribution of multiple pesticides. The synergistic effects ofmultiple pesticides on human and aquatic health is an area ofactive research. The U.S. Environmental Protection Agency(USEPA) is considering establishing health standards forcombinations of triazine pesticides (U.S. Environmental Protec-tion Agency, 1994).
Purpose and Scope
This report documents the presence and distribution ofdissolved pesticides in seven streams in the LINJ NAWQA studyarea and evaluates the variability in concentrations by season,streamflow, and land use. The results of analyses of 146 stream-water samples collected at the seven sites during April 1996through June 1998 are presented. Samples from four stream siteswere collected only in the growing season (April throughSeptember). Samples at the other three sites were collectedduring both the growing and nongrowing seasons (Octoberthrough March). Concentrations were determined for 85 pesti-cides. Total number of pesticides and total concentrations ofpesticides were evaluated to determine the presence of multiplepesticides.
Pesticide Use
Pesticides are chemical substances and biological agentsused to control pests. The pesticides analyzed in this studyinclude classes of synthetic organic insecticides, herbicides, andfungicides widely used in the United States. Approximately 1.1billion pounds of pesticides are used annually in the UnitedStates (Ware, 1994). Pesticides are used primarily for agricul-ture, lawn care, golf course maintenance, termite control, andright-of-way maintenance. In 1991, 76 percent of the pesticidessold in the United States were used for agricultural purposes.Industry and government use represented 18 percent and homeand garden use represented 6 percent of total sales (Ware, 1994).The use of herbicides has quadrupled during 1966-91 (Larsonand others, 1997).
In New Jersey, licensed applicators applied approximately2.4 million pounds of pesticides per year during 1992-95 (CurtisBrown, New Jersey Department of Environmental Protection,Pesticide Control Program, written commun., 1992-95). Agricul-tural use accounted for about 66 percent of the total use in NewJersey. The herbicides atrazine and alachlor were the mostheavily applied pesticides in the United States during 1990-91(Ware, 1994), but ranked sixth and seventh, respectively, in theiruse in New Jersey. The fungicide chlorthalonil was the mostheavily applied pesticide in New Jersey, of those analyzed in thisstudy, but ranked 13th nationwide.
Sixteen of the 25 most heavily applied pesticides used foragriculture and 7 of the top 10 pesticides used for nonagricul-tural uses in the United States were analyzed for in this study.Some of the most heavily applied pesticides in New Jersey thatwere not analyzed for in this study include metam sodium, afumigant; sodium aluminofluoride, an insecticide; glyphosate, aherbicide; and mancozeb, a fungicide.
The herbicides most commonly used in New Jersey, andwhich were analyzed for in this study, are metolachlor, atrazine,and alachlor used for agriculture; pendimethalin, benfluralin, andtrifluralin used for professional lawn care; DCPA,pendimethalin, and benfluralin used for golf courses; and diuron,2,4-D, and simazine used for weed control along transportationand utility rights-of-way. The most commonly used insecticidesanalyzed for in this study are methyl-azinphos, carbaryl, andchlorpyrifos used for agriculture; chlorpyrifos, carbaryl, andfonofos used for professional lawn care; chlorpyrifos, carbaryl,and ethoprop used on golf courses; chlorpyrifos and permethrinused for termite control; and malathion and permethrin used formosquito control. Chlorthalonil, the fungicide most heavily usedin lawn care and on golf courses and the most heavily used inagriculture, second to sulfur, was the only fungicide analyzed forin this study. Eight pesticides—acetochlor, alachlor, carbofuran,linuron, methyl-azinphos, metribuzin, pebulate, and terbacil—are used only in agriculture (Curtis Brown written commun.,1992-95).
Pesticide use has significantly increased agriculturalproductivity, benefiting both farmers and consumers. At thesame time, potential adverse effects of pesticides on nontargetorganisms and the environment, in general, have become aconcern. Organochlorine insecticides such as DDT and dieldrinwere banned from use in the United States in 1973 and 1984,respectively, because of bioaccumulation in the foodchain andrelated adverse health effects on nontarget organisms (Harte and

others, 1991). Some organochlorine insecticides were replacedby less persistent and more water-soluble organophosphate andcarbamate pesticides. The higher solubility of the insecticidesand herbicides currently used reduces the risk of accumulation insediments and the food chain, but increases the risk of wide-spread low levels of dissolved pesticides entering surface- andground-water systems.
Previous Investigations
Two previous investigations of pesticides in surface waterin the study area focused on relatively small areas. A study ofpesticides from agricultural runoff in six New Jersey drainagebasins detected low-level concentrations of 10 of the 21 pesti-cides targeted for analysis (Ivahnenko and Buxton, 1994). Sixdrainage basins used for public-water supply and considered themost susceptible to pesticide contamination were chosen forstudy, including Lower Mine Hill Reservoir, South Branch of theRaritan River, the main branch of the Raritan River, MillstoneRiver, Manasquan River, and Matchaponix Brook. All but LowerMine Hill Reservoir basin lie within the LINJ study unit.Although atrazine and metolachlor were detected in 86 percentof the samples, alachlor in 55 percent, and diazinon in 45percent, only one concentration, in the 28 samples collected,exceeded the U.S. Environmental Protection Agency (USEPA)recommended Lifetime Health Advisory Limit. Atrazine andmetolachlor were detected in the highest concentrations duringstorms.
The second study assessed the vulnerability of publicwater supplies to contamination by 20 pesticides in the Millstoneand Shark River basins (Buxton and Dunne, 1993). In theMillstone River, the 4 pesticides detected in 8 base-flow and 24stormflow samples were atrazine, in 66 percent of samples;simazine, in 47 percent; metolachlor, in 38 percent; and alachlor,in 16 percent. No pesticides were detected in 8 base-flow and 13stormflow samples from Shark River. The method detectionlimit (MDL) for most pesticides analyzed for in these studieswas 0.03 µg/L (micrograms per liter). The MDL’s in the presentstudy ranged from 0.001 to 0.03 µg/L.
A study of pesticide data from 463 surface-water sites inthe Mid-Atlantic region (Ferrari and others, 1997) detected at
least one compound at more than 90 percent of the sites andfrequently detected 16 pesticides, 3 at concentrations greaterthan the USEPA’s maximum contaminant level (MCL).
The LINJ NAWQA project has recently completed twostudies of pesticides in surface water and ground water of NewJersey and Long Island, New York. Water-quality data from a50-site surface-water synoptic network sampled in June 1997were used to compare pesticide concentrations to land use andpesticide application (Reiser and O’Brien, 1998). Medianpesticide concentrations and detection frequencies of somepesticides were related to land use. The 10 most frequentlydetected pesticides in the synoptic study were also the mostfrequently detected in this study. Analysis of samples from anetwork of 72 monitoring wells in southern New Jersey indi-cated that the 5 most frequently detected pesticides in groundwater (Stackelberg and others, 1997) were also the 5 mostfrequently detected in the 50 stream-water samples.
Study Approach
Selection of Sampling Sites and SamplingFrequency
Seven stream sites were chosen to represent the variety ofland uses, physiographic settings, and other drainage-basincharacteristics in the study area (fig. 1; table 1). Five of the sites,all in New Jersey, were chosen to represent water-qualityconditions in small basins (less than 50 mi2) associated withspecific types of land use and physiography. Four of these fivesites are in the Piedmont physiographic province; the Great EggHarbor River site is in the Coastal Plain physiographic province.The Saddle River at Ridgewood site represents a drainage basinthat consists predominantly of suburban residential land. TheBound Brook at Middlesex site represents a largely urbandrainage basin with older residential, commercial, and industrialareas. Agriculture is the dominant land use in the drainage basinrepresenting the Neshanic River at Reaville site. The StonyBrook at Princeton site represents a basin in transition from apredominantly forested and agricultural area to a suburbanresidential area. The Great Egg Harbor River near Sicklervillesite represents a drainage basin with urban land use in the
USGS site nameUSGS site
number
Drainage
area
(mi2)
Number of
samples collectedLand use (in percent)
Schedule
2001
Schedule
2050
Urban
Forest Agriculture OtherResidential
Non-
residential
01382000 361 8 3 32 15 35 3 15
Saddle River at Ridgewood, N.J. 01390500 21.6 9 5 75 11 11 2 1
Neshanic River at Reaville, N.J. 01398000 25.7 7 5 15 4 27 53 1
Stony Brook at Princeton, N.J. 01401000 44.5 8 5 18 5 46 28 3
Raritan River at Queens Bridge at
Bound Brook, N.J.01403300 804 28 25 19 6 35 30 10
Bound Brook at Middlesex, N.J. 01403900 48.4 44 41 50 23 25 1 1
Great Egg Harbor River near Sicklerville, N.J. 01410784 15.1 46 39 24 8 43 10 15
Table 1. Drainage Basin Characteristics and Sampling Frequency [1986 Land-use data from New Jersey Department of Environmental Protection, 1996; USGS, U.S. Geological Survey; mi2, square miles]
Passaic River at Two Bridges, N.J.

Coastal Plain. Samples were collected more frequently at theBound Brook and Great Egg Harbor River sites than at the othersites to investigate the effects of urban land use in relativelysmall basins in the two major physiographic provinces in thestudy area (Piedmont and Coastal Plain).
Two of the sites, Passaic River at Two Bridges and RaritanRiver at Bound Brook, were chosen to represent large drainageareas that integrate the effects of many different types of landuses, physiographic settings (Piedmont, Coastal Plain, and NewEngland), and point-source discharges. No streams on LongIsland were chosen for sampling because surface water on theisland is not used as a source of public supply and becausesamples were collected during synoptic studies (O’Brien andothers, 1998; Reiser and O’Brien, 1998).
Surface water was sampled at fixed intervals for pesticidesat the Bound Brook, Great Egg Harbor River, and Raritan Riversites during April 22, 1996, to June 9, 1998. Additional sampleswere collected during storms. Samples for pesticide analysiswere collected monthly only in the growing season of 1996 andonce in June 1997 at the Passaic River, Saddle River, NeshanicRiver, and Stony Brook sites. The data from these samples areavailable in Reed and others (1997-98) and DeLuca and others(1999).
Field and Laboratory MethodsStream samples were collected in teflon bottles using the
equal-width-increment (EWI) sampling method (Edwards andGlysson, 1988). The samples were split into equal aliquots byusing a teflon cone splitter (Capel and others, 1995). Sampleswere filtered at the site by using baked glass-fiber filters with0.7-millimeter pore diameter to remove suspended particulatematter and were shipped on ice to the USGS National WaterQuality Laboratory (NWQL).
All 146 samples were analyzed for the 47 pesticides listedin laboratory schedule 2001, which includes 25 herbicides, 20insecticides, and two degradation products, (Zaugg and others,1995) as well as nutrients, major ions, suspended sediment,dissolved organic carbon, and suspended organic carbon. Anadditional 41 pesticides listed in laboratory schedule 2050,which includes 25 herbicides, 10 insecticides, 5 degradationproducts, and 1 fungicide (Werner and others, 1996) wereanalyzed for in 119 of the 146 samples. Three pesticides ana-lyzed for are in both schedules, but only concentrations obtainedby using the schedule 2001 method are used in this studybecause this method can detect these pesticides at lower concen-trations. The 41 pesticides from schedule 2050 were analyzed forin 91 of the 119 samples collected during the growing seasonand in all 27 samples from the nongrowing season.
NWQL used C-18 solid-phase extraction (SPE) columns toremove 47 pesticides and metabolites from the filtered watersamples by using schedule 2001 methods. The SPE columnswere eluted with hexane-isopropanol (3:1). The eluant wasevaporated by using a gentle stream of nitrogen. Extracts of theSPE column eluant were analyzed by a capillary-column gas-chromatograph/mass spectrometer operated under a selected-ionmonitoring mode (Zaugg and others, 1995).
NWQL uses a 0.5-gram Carbopak-B graphitized carbon-based SPE cartridge to extract an additional 41 pesticides fromthe filtered water samples designated for schedule 2050 analysis.Two extract fractions, one containing the adsorbed base and
neutral pesticides and the second containing the acidic pesti-cides, were eluted from the SPE cartridge. High performanceliquid chromatography using ultraviolet spectrometry wasperformed on each fraction to detect, identifiy, and quantify the41 compounds (Werner and others, 1996).
The NWQL techniques allow for the accurate detectionand quantification of pesticides at minimum concentrationsranging from 0.001 to 0.018 µg/L for the 47 schedule-2001pesticides and 0.011 to 0.05 µg/L for an additional 41 schedule-2050 pesticides. Results from the laboratory were censored whenconcentrations could not be accurately determined because ofanalytical and other limitations. “Less than” values are reportedwhen a pesticide is either not detected or is not present at aconcentration that can be identified and measured by NWQLanalytical procedures. Estimated values “E” are reported whenthe presence of a compound is certain, but there is decreasedconfidence in accurate quantitation. Four pesticides, azinphos-methyl, carbaryl, carbofuran, and desethylatrazine, were alwaysestimated because of variable quantification performance (Zauggand others, 1995). For statistical purposes, estimated concentra-tions were considered to be the same as non-estimated concen-trations.
Quality AssuranceQuality-assurance samples were collected to evaluate the
reliability and reproducibility of the data. Three types of quality-assurance samples were evaluated—blanks, replicates, andspikes. Results of 12 field-equipment blank samples documentedthat no systematic contamination occurred during sampling andprocessing of the samples. Only 1 of the 12 blank samples had asingle detection of a pesticide (0.004 µg/L of trifluralin).
Seven sets of split replicate samples were used to evaluatethe reproducibility of the analytical techniques. The environmen-tal and replicate samples were collected and processed simulta-neously. Ninety-six percent of the detections occurred in both theenvironmental and replicate samples. Two detections in theenvironmental samples were not found in the paired replicates.One pesticide found in a replicate sample was not found in thepaired environmental sample. The detected concentrations werewithin 0.008 µg/L of the MDL. Differences in concentrationsdetected in both the environmental and replicate samples variedfrom no difference to 20 percent difference. Environmental andreplicate samples with the greatest percentage of difference werethose with the lowest pesticide concentrations and differencesless than or equal to 0.005 µg/L.
Split spiked samples were used to evaluate potential biasand the ability of the analytical technique to recover analytesfrom the water-sample matrix. Six spiked environmental sampleswere analyzed for schedule 2001 pesticides, and five sampleswere analyzed for schedule 2050 pesticides. The mean percentrecoveries for schedule 2001 pesticides ranged from 75 to 150percent, except for carbaryl which had a mean recovery of 213percent. The mean percent recoveries for most of the schedule2050 pesticides detected in this study ranged from 34 to 95percent; however, aldicarb, which degrades rapidly, had a meanpercent recovery of only 7 percent. The degradation products ofaldicarb, aldicarb sulfone and aldicarb sulfoxide, had recoveriesof 14 and 58 percent, respectively. These results indicated thatthe schedule 2050 method provides a very conservative estimateof compound concentrations and detection frequencies.

Three pesticides—carbaryl, carbofuran, and linuron—weremeasured by using both schedule 2001 and schedule 2050methods. These pesticides were detected more frequently by the2001 method, which uses an analytical laboratory technique withlower detection levels. The results from the 2001 method areused in this study.
Statistical MethodsWater samples were categorized by the season and the
hydrologic condition in which they were collected. The growingseason is April through September, and the nongrowing season isOctober through March. All samples were grouped into one oftwo flow categories, base flow or runoff. During base flow, mostof the flow in the stream is contributed by water coming out ofstorage, from lakes, wetlands, and ground-water sources. Asample was considered to be collected during base-flow condi-tions if flow in the stream did not increase by more than 5percent from the previous day and if decreases in flow from theprevious day were less than 15 percent. This is a rather strictdefinition of base flow; with this definition some flow conditionsare considered runoff that would otherwise be considered baseflow when using base-flow separation techniques. A sample wasconsidered to be collected during runoff if the definition of baseflow was not met.
To make unbiased comparisons between pesticides,detection frequencies were computed using (1) all pesticide-concentration data and (2) only those pesticide concentrationsthat exceeded a common threshold of 0.01 µg/L. All pesticideconcentration values were censored to 0.01 µg/L because this isa level higher than the MDL for all but four pesticides. Detec-tions of these pesticides below the MDL is common; therefore,potential bias is minimized. Contingency table analysis was usedto determine whether detection frequencies at a site weredependent on season or flow condition (Helsel and Hirsch,1992). Contingency tables also were used to determine whetherthe number of detections of a pesticide at a site was significantlydifferent among sites. The chi-square test was used to determinesignificance when the number of expected detections in eachcategory was greater than five. The Fischer’s exact test was usedwhen expected detections were less than or equal to five. Asignificance level of 0.05 was used for this study.
The median and 90th percentile concentrations were usedto summarize the data and to make comparisons at each site andamong sites by season, flow, and land use. Total-pesticideconcentrations in each sample were computed by adding theconcentrations of each detected compound and by assigning aconcentration of 0 µg/L to all censored values. The inner quartilerange (IQR) was used to measure the variability of pesticideconcentrations. It measures the range of the central 50 percent ofthe data and is defined as the 75th percentile minus the 25thpercentile (Helsel and Hirsch, 1992). IQR was used instead ofvariance or standard deviation because it is not influenced byoutliers.
One-way analysis of variance (ANOVA) was applied tothe ranks of pesticide concentrations to determine whethermedian concentrations varied among sites by season and flowcondition, and whether concentrations at a single site varied byseasons and flow conditions. The null hypothesis (Ho) states thatmean rank concentrations are equal at each site. The alternatehypothesis states that the mean rank concentration from at least
one site differs from the others. If the null hypothesis is rejected,Tukey’s test was used to determine which pairs of mean rankconcentration were significantly different at the 0.05 level.Tukey’s groups are represented by letters A through C. Sites ingroup A have the highest mean rank concentration, and those ingroups B through C have successively lower rank concentra-tions. Sites containing one or more of the same letters do notdiffer significantly (Helsel and Hirsch, 1992).
Multivariate ANOVA (MANOVA) was applied to ranks ofpesticide concentrations to simultaneously test the significanceof season, flow, and land use as factors contributing to concen-trations and numbers of pesticides. MANOVA also was appliedto ranks of pesticide concentrations to simultaneously test thesignificance of season, flow, and season as a function of flow asfactors contributing to concentrations and numbers of pesticidesat each of the three sites sampled in both seasons.
Relations between instantaneous streamflow and concen-tration were analyzed at each of the sites. Pesticides detected inmore than 50 percent of the samples from a site were analyzedby using tobit regression (Cohn, 1988). The tobit method usescensored data to develop the relation. If censored data accountedfor more than 50 percent of the values at a site, the results arenot considered reliable and are not discussed in this report. Therelation was considered to be significant if the slope of theregression line was different from zero at the 0.05 level ofsignificance. A base-10 logarithm transformation of streamflowwas used to normalize the data before using tobit regression.
Presence and Distribution of Pesticides
Pesticides were detected in 145 of the 146 samplescollected from April 1996 through June 1998. Forty-one of the85 pesticides analyzed for were detected in these samples. Morethan 97 percent of the samples contained at least five pesticides,and 49 percent contained nine or more pesticides. Detectionfrequency and median, 90th percentile, and maximum concentra-tions of detected pesticides from all environmental samplescollected are listed in table 2, along with USEPA MCL’s andother water-quality criteria. The 44 pesticides not detected in anyof the samples are listed in table 3.
Water-Quality Criteria
Water-quality criteria have been established for 33 of the41 pesticides detected (table 2). The USEPA has establishedhuman-health criteria, including MCL’s, health advisory levels(HAL’s) for lifetime exposure, and (or) a risk-specific dose(RSD) for drinking water for 30 of the 41 pesticides detected.The NJDEP has established human health criteria (HHC’s) fordieldrin and DDE. Water-quality criteria for the protection ofaquatic life were established for 21 of the detected pesticides byeither the USEPA, NJDEP, Canadian Council of Resource andEnvironment Ministers, or International Joint Commission ofCanada and the United States.
Ten pesticides, including 6 insecticides, 3 herbicides, and 1fungicide, were detected at concentrations that exceededestablished water-quality criteria. Eight pesticides were detectedat concentrations that exceeded USEPA drinking-water standardsor chronic life criteria for the protection of aquatic life (AQCR),and two pesticides were detected at concentrations that exceeded

Banval, Dianat *0.8 (1) LD LD Bound Brook 200 EPA HAL
Ordram 0.7 (1) LD LDNeshanicRiver --
Roethyl-P, Alkron 0.7 (1) LD LD Bound Brook --
Ramrod, Satecid 0.7 (1) LD LD Bound Brook 90 EPA HAL
Stampede, Wham 0.7 (1) LD LD Raritan River --
Counter, Pilarfox 0.7 (1) LD LD Bound Brook 0.9 EPA HAL
1.4 (2) LD LD Raritan River
0.1 RSD50.000588 NJHHC ( )
Blazer, Tackle 2S *0.8 (1) LD LD Raritan River 10 RSD5
Temik, Ambush *0.8 (1) LD LD Bound Brook7 EPA MCL
Basagran, Benta-zone *0.8 (1) LD LD Stony Brook 200 EPA HAL
Bromax, Urox B *0.8 (1) LD LD Bound Brook 90 EPA HAL
MCPA, Metaxon *2.5 (3) LD LD Bound Brook 10 EPA HAL
Lorex, Linex 2.1 (3) LD LD Stony Brook --
Devrinol 2.1 (3) LD LD Raritan River --
Guthion 1.4 (2) LD LDGreat EggHarbor River
--
Lindane 1.4 (2) LD LD Bound Brook 0.2 EPA MCL
Lexon, Sencor 8.9 (13) LD LD Raritan River 100 EPA HAL
Cythion 8.9 (13) LD LD Bound Brook 200 EPA HAL
Flo-Met, Cotoran *3.4 (4) LD LD Raritan River 90 EPA HAL
Dyfonate, Tycap 3.4 (5) LD LD Bound Brook 10 EPA HAL
Panoram D-31,Octalox
2.7 (4) LD LD Saddle River0.02 RSD50.000135 NJHHC ( )
Prowl, Stomp 15 (22) LD 0.012 Raritan River --
Furandan, Yaltox 13 (19) LD 0.008 Raritan River 40 EPA MCL
Bravo, Exotherm *13 (15) LD 0.007Great EggHarbor River 15 RSD5
Benefin, Balan,Bonalan 12 (18) LD 0.003 Bound Brook --
Harness, Plus 11 (16) LD 0.008 Stony Brook --
DCMU, Karmex *27 (32) LD 0.17 Raritan River 10 EPA HAL
Treflin, Tri-4 26 (38) LD 0.005 Saddle River 5 EPA HAL
Spike, Tebusan 25 (37) LD 0.008 Bound Brook 500 EPA HAL
2,4 D, Lawn-keep,Auqa Kleen *20 (24) LD 0.32 Stony Brook 70 EPA MCL
Bladex, Fortrol 19 (28) LD 0.015 Stony Brook 1 EPA HAL ( )
AAtrex, Crisazina 97 (141) 0.025 0.12 10E Stony Brook 3 EPA MCL ( )
Pramitol, Princep 96 (140) 0.020 0.06 Bound Brook 100 EPA HAL
Dual, Pennant 95 (139) 0.019 0.152 Raritan River 70 EPA HAL 50
91 (133) 0.007E 0.034 Stony Brook --
Aquazine, Princep 88 (129) 0.009 0.024 Stony Brook 4 EPA MCL
D.z.n., Sarolex 58 (84) 0.003 0.063 Bound Brook 0.6 EPA HAL 50
Lasso, Bullet 56 (82) 0.004 0.017 Stony Brook 2 EPA MCL( )
Sevin, Carbamine 54 (79) 0.008 0.157 Bound Brook 700 EPA HAL
Dacthal 36 (53) LD 0.004 Raritan River --
Genpest, Eradex
0.035
0.004
0.004
0.007
0.004
0.013
0.006
0.035
0.016(0.55)
0.014
0.035
0.050(0.17)
0.002
0.003
0.001
0.004
0.004
0.005
0.035
0.008
0.001
0.004
0.003
0.030(0.48)
0.002
0.002
0.020
0.002
0.010
0.035(0.15)
0.004
0.001
0.018
0.002
0.002
0.005
0.002
0.002
0.003
0.002
0.004 31 (45) LD 0.015
0.040
0.017
0.018
0.018
0.005
0.033
0.003E
0.130
0.130
0.070
0.050
0.20
0.62
0.019
0.039E
0.014
0.11
0.078
0.11E
0.054
0.005
0.046
0.064E
0.710E
0.007
4.7
1.2E
0.015
0.075
1.7E
1.9E
0.10
5.2E
0.25E
0.51
0.30
4.7E
1.5E
0.012
0.064 Saddle River 20 EPA HAL
Dicamba
Parathion, Ethyl-
Propachlor
Terbufos
Acifluorfen
Bentazon
Bromocil
4-Chloro-2-meth-ylphenoxy acetic acid
Linuron
Napropamide
Azinphos,Methyl-
HCH, gamma-
Metribuzin
Malathion
Fluometuron
Fonofos
Pendimethalin
Carbofuran
Chlorothalonil
Benfluralin
Acetochlor
Diuron
Trifluralin
Tebuthiuron
2,4-Dichlorophe-noxy acetic acid
Cyanazine
Atrazine
Prometon
Metolachlor
Atrazine, Desethyl(Atrazine metabolite)
Simazine
Diazinon
Alachlor
Carbaryl
DCPA
Chlorpyrifos
Molinate
Propanil
DDE,p,p-
Aldicarb
Dieldrin
2
4
2
4
1
10 CAN
--
0.013 EPA2 ( )
--
--
--
0.000588 NJ ( )
--
1.0 CAN
--
--
2.6 CAN
7 CAN
--
0.01 EPA2 ( )
0.08 EPA2
1.0 CAN
0.1 EPA2
--
--
0.0625 EPA20.0019 NJ ( )
--
1.75 CAN
0.18 CAN ( )
--
--
--
0.1 CAN
1.6 CAN
4 CAN
2 CAN
2 CAN ( )
--
8 CAN
--
10 CAN
0.08 GL ( )
--
--
--
0.041 EPA2 ( )
1
2
1
4
3
4
12
2
Trade nameMDL(µg/L)
Detect-ion freq-uency, %
(#)
Medianconcentra-ion of allsamples(µg/L)
90thpercentile
of allsamples
Maximumconcentrat-ion detected
(µg/L)
Site ofmaximum
concentration
MCL, HAL, orHHC (µg/L), (#in exceedance)
Compound name
Aquatic LifeCritereon
(µg/L)(# inexceedance)
Table 2. Pesticides detected in samples collected from seven streams in New Jersey April 1996 through June 1998[Data containing an E suffix are included in the data set of detected values used for statistical analysis. MDL, Method Detection Limit (values listed in parentheses have an increased detection limit as of Dec. 15, 1997; EPA MCL, drinking-water maximum contaminant level (U.S. Envi-ronmental Protection Agency, 1996); EPA HAL, health-advisory level, 70 kg adult, lifetime (U.S. Environmental Protection Agency, 1996); NJ HHC, New Jersey human health criteria, (New Jersey Department of Environmental Protection, 1998). Water-quality criteria for aquatic life are as follows: EPA, U.S. freshwater chronic criteria for aquatic life (U.S. Environmental Protection Agency, 1995); EPA2, U. S. freshwater chronic aquatic life criteria (U.S. Environmental Protection Agency, 1991); CAN, Canadian water-quality guidelines (Canadian Council of Resource and Environment Ministers, 1991); GL, Great Lakes Water Quality Objective (International Joint Commission Canada and United States, 1977); RSD5, risk-specific dose at level 1X10⁻⁵ (U.S. Environmental Protection Agency, 1996); NJ, New Jersey freshwater water quality criteria (New Jersey Department of Environmental Protection, 1998); µg/L, micrograms per liter; --, criteria do not exist; LD, less than the MDL; E, estimated value; %, percent; #, number; *, compounds analyzed in only 119 of the 146 samples collected (Schedule 2050); Red, number of detections exceeding criteria; Blue, pesticides not currently applied by licensed applicators in New Jersey.

NJDEP HHC’s and (or) AQCR’s. Thirty-two detections insamples collected during April 23, 1996, to August 22, 1996;May 26, 1997 to July 25, 1997; and November 11, 1997,exceeded criteria. There were 10 detections at concentrationsgreater than USEPA and NJDEP human health criteria—MCL’s,HAL’s, and HHC’s— and 22 detections at concentrations greaterthan USEPA and NJDEP AQCR’s (table 2) in the 146 samplescollected. Seven detections of herbicides exceeded the criteriaand 12 detections of the insecticide diazinon exceeded thecriteria; all were present in samples collected during runoffevents. Eight of 10 detections of the other 5 insecticides thatexceeded criteria occurred during base-flow conditions. Two ofthe three detections of the fungicide chlorthalonil that exceededa criterion occurred during base-flow conditions.
Concentrations of atrazine, alachlor, and cyanazineexceeded the USEPA human health criteria in samples collectedduring runoff shortly after spring applications of these pesti-cides; these concentrations represent a potential threat tomunicipal water supplies in the Raritan River basin. Concentra-tions of alachlor, atrazine, and cyanazine exceeded HHC at threesites in the basin. Concentrations of atrazine exceeded theUSEPA’s MCL (3.0 µg/L) in four samples collected duringrunoff in June 1996 and May 1997 from the Neshanic River,Stony Brook, and Raritan River sites. The concentration ofalachlor exceeded the MCL (2.0 µg/L) in one sample collectedduring runoff in June 1996 at the Stony Brook site. Concentra-tions of cyanazine exceeded the HAL (1.0 µg/L) in two samplescollected during runoff in June 1996 and May 1997, one at theStony Brook site and one at the Raritan River site.
Concentrations of chlorpyrifos, chlorthalonil, diazinon,ethyl-parathion, and methyl-azinphos exceeded AQCR’s insamples from four sites. Diazinon exceeded the Great LakesWater Quality Objective (GL) AQCR of 0.08 µg/L in 10 samplescollected during runoff conditions during June and July 1996and 1997, and September 1996 at the Bound Brook site and in 2samples collected during runoff conditions in July 1996 and1997 at the Raritan River site. Chlorthalonil exceeded theCanadian fresh-water chronic aquatic-life criteria of 0.18 µg/L intwo samples collected in July 1997 samples—one during baseflow and one during runoff—at Bound Brook and in one July1997 base-flow sample at Great Egg Harbor River. Chlorpyrifosexceeded the USEPA criteria of 0.041 µg/L in a June base-flowsample at Saddle River and a June runoff sample at BoundBrook. Ethyl-parathion exceeded the EPA AQCR (0.013 µg/L) inan April base-flow sample at Bound Brook. Methyl-azinphosexceeded the EPA AQCR (0.01 µg/L) in a June base-flowsample at Great Egg Harbor River.
Dieldrin was detected in four samples and DDE in twosamples at concentrations that exceeded NJDEP human healthcriteria; because the MDL is greater than the HHC, othersamples also may have exceeded the criteria. Dieldrin concentra-tions exceeded the HHC (0.000135 µg/L) and the AQCR (0.0019µg/L) in four samples collected during base flow during May 30to August 22, 1996, three samples at the Saddle River site andone at the Stony Brook site. DDE concentrations exceeded theHHC (0.0000588 µg/L) in two samples, one collected during thereceding limb of the hydrograph in August 1996 at the RaritanRiver site and one collected during base-flow conditions inNovember 1997 at the Great Egg Harbor River site.
Detection Frequency
Pesticides were detected in 145 of the 146 samplescollected. The only sample without any pesticide detections wasfrom the Great Egg Harbor River and was collected during thereceding limb of the hydrograph in October 1996. Detectionfrequencies were computed using (1) all pesticide-concentrationdata and (2) only those concentrations that exceeded a commonthreshold of 0.01 µg/L in order to make unbiased comparisonsbetween pesticides (fig. 2).
The 41 pesticides detected in the 146 stream samplescollected for this study consist of 26 herbicides, 13 insecticides,1 fungicide, and 1 degradation product. The pesticides mostfrequently detected in the 146 samples were atrazine, in 97percent of the samples; prometon, in 96 percent; metolachlor, in95 percent; desethyl-atrzine, in 91 percent; simazine, in 88
Table 3. Pesticides analyzed for but not detected in stream samples from seven stream sites in New Jersey April 1996 through June 1998[IUPC, International Union of Pure and Applied Chemistry; Blue indi-cates pesticides and degradates of pesticides applied by licensed applic-ators in New Jersey; *, compounds analyzed in only 119 of the 146 samples collected (schedule 2050); MDL, Method Detection Limit (values listed in parentheses have an increased detection limit as of Dec. 15, 1997; µg/L, micrograms per liter; --, no trade name.]
BromoxynilButylate
3-hydrxy-carbofuranChlorambenChlorpyralidDichlobenil2,4-Dichlorophenoxy butyric acidDachthal, MADichlorprop
Diethylanaline
DisulfotonEPTC
EsfenvalerateEthalfluralinEthoprop
MethiocarbMethomyl4-2-Methyl-4-chlorphenoxy
butyric acid
NorflurazonOryzalinOxyamyl
Parathion, Methyl-PebulatePermethrin,cis-Phorate
PicloramPronamidePropargite
Terbacil
Compound name (IUPAC) Trade name MDL(µg/L)
*Aldicarb Sulfone Standak, Aldoxycad 0.016 (0.100)*Aldicarb Sulfoxide -- 0.021* Torch, Buctril 0.035
Genate Plus, Suntan+ 0.002* -- 0.014* Amiben,methyl 0.011 (0.42)* Stringer 0.050* Barrier, Casoron 0.020 (1.20)* 2,4 DB, Butyrac 0.035 (0.24)* -- 0.017* 2,4 DP, Sertux 50 0.032
Metabolite of Alachlor 0.003*Dinitrocresol DNOC, Trifocide 0.035 (0.42)*Dinoseb DNPB, Dinosebe 0.035
Disyston, Solvinex 0.017Eptam, Alirox 0.002
* Asana, Sumi-alpha 0.019Sonalan, Curbit 0.004Mocap, ethoprophos 0.003
*Fenuron Beet-Klean, Fenulon 0.013HCH, alpha- alpha-Lindane, alpha-BHC 0.002* Mesurol, Slug-Geta 0.026* Lannate, Lanox 0.017* MCPB, Tropotox 0.050
*1-Naphthol Alpha Napthol 0.007*Neburon Neburea, Neburyl 0.015* Euitol, Predict 0.024* Surflan, Dirimal 0.019 (0.31)* Vydate, Pratt 0.018
Penncap-M 0.006Tillam, PEBL 0.004Ambush, Astro 0.005Thimet, Rampart 0.002
* Grazon, Tordon 0.035Kerb, Propyzamid 0.003Omite, Ornamite 0.013
*Propham Tuberite 0.035*Propoxur Baygon, Blattanex 0.035*Silvex 2,4,5-TP, Fenoprop 0.021
Counter, Sinbar 0.013Thiobencarb Bolero, Saturn 0.002Triallate Avadex BW, Far-Go 0.001*2,4,5-Trichlorophenoxy acetic acid 2,4,5 T 0.035*Triclopyr Garlon, Grandstand 0.050 (0.25)

percent; diazinon, in 58 percent; alachlor, in 56 percent; andcarbaryl, in 54 percent. Seven of the eight most frequentlydetected pesticides remained the same regardless of the methodused. Prometon replaced atrazine as the most frequently detectedcompound, carbaryl moved from eighth to forth place, anddiuron replaced alachlor in the top eight when a commonthreshold of 0.01 µg/L was used to compute detection frequen-cies. Five of the eight most frequently detected pesticides areherbicides, two are insecticides and one is a degradation productof atrazine. Ten pesticides, including the eight most frequentlydetected, DCPA, and cyanazine, were detected at least once at allseven sites. The Bound Brook site had the most pesticidesdetected (29), and Passaic River at Two Bridges had the least(13).
Relation to SeasonSeasonal variability in detection frequencies of pesticides
was analyzed by comparing results from the growing seasonwith results from the nongrowing season for the Raritan River,Bound Brook, and Great Egg Harbor River sites. The detectionof pesticides in the growing season was significantly higher thanin the nongrowing season at each of the three sites. Detectionfrequencies of 38 of the 41 pesticides detected during this studywere higher at each of the three sites during the growing season.Detection frequencies of most of these pesticides, however, werenot found to be significantly higher in the growing season. Six ofthe eight most frequently detected pesticides were detected atequally high frequencies during both seasons at each of the threesites. None of the 41 pesticides detected had significantly higherfrequencies in the nongrowing season.
Thirty-nine pesticides were detected during the growingseason and 20 pesticides were detected during the nongrowingseason. Twenty-one pesticides were detected only during thegrowing season; however, three of these compounds—dieldrin,
bentazon, and molinate—were detected at sites sampledexclusively during the growing season. Two herbicides—acifluorfen and propanil—were detected only during thenongrowing season and only at the Raritan River site.
Detection frequencies of the eight most frequently detectedpesticides were compared among the seven sites (fig. 3). On thebasis of contingency table analysis, high detection frequencies ofatrazine and prometon at each site were not significantlydifferent between sites. Detections of the other six pesticideswere significantly higher at one or more sites than at the othersites. Detections of three pesticides used in or associated almostexclusively with agricultural practices—metolachlor, desethyl-atrazine, and alachlor—were higher than expected at the threesites located in the basins with greater than 25 percent agricul-tural land use. Carbaryl and diazinon detections were highest atthe four most urbanized sites. The number of simazine detectionswas significantly higher at the Bound Brook and Neshanic Riversites than at the other sites.
Detection frequencies of all but four pesticides werehigher at the seven sites sampled during this study than thosesampled during the June 1997 synoptic study when streams weresampled at or near base-flow conditions (Reiser and O’Brien,1998). DCPA had the same frequency of detection in bothstudies, and dieldrin, linuron, and malathion had higher detectionfrequencies during the synoptic study. Fonofos, gamma-HCH,p,p-DDE, molinate, ethyl-parathion, propachlor, propanil, andterbufos were detected during routine sampling at the seven sitesbut were not detected during the synoptic study sampling.Terbacil and pebulate were detected during the synoptic studybut not during routine sampling at the seven sites.
Relation to Pesticide UseSixty-six of the 85 pesticides analyzed for in this study are
currently used by licensed applicators in New Jersey to control
All Samples
April-September, (growing season)
October-March, (non-growing season)
All samples censored to 0.01 µg/L
April-September, (growing season) censored to 0.01 µg/L
October-March, (nongrowing season) censored to 0.01 µg/L
MDL = Method detection limit
Atrazine Prometon Metolachlor Desethyl-Atrazine Simazine Diazinon Alachlor Carbaryl
PESTICIDE
100
0
10
20
30
40
50
60
70
80
90D
ET
EC
TIO
N F
RE
QU
EN
CY,
IN
PE
RC
EN
T
Figure 2. Pesticides most frequently detected in all samples and in samples collected during growing and nongrowing seasons at seven sites in New Jersey during April 1996 to June 1998.
MDL = 0.001 µg/L MDL = 0.018 µg/L MDL = 0.002 µg/L MDL = 0.002 µg/L MDL = 0.005 µg/L MDL = 0.002 µg/L MDL = 0.002 µg/L MDL = 0.003 µg/L

pests. Thirty-six (55 percent) of these 66 pesticides weredetected in samples collected during this study. An additionalfive pesticides—aldicarb; DDE, p,p-; dieldrin; molinate; andpropanil—were detected but are not presently applied in NewJersey by licensed applicators (N.J. Department of Environmen-tal Protection, 1994).
The pesticides most commonly used are not always themost frequently detected (Reiser and O’Brien, 1998). Atrazine,metolachlor, alachlor, and carbaryl are the only pesticides amongthe eight most frequently detected that are also among the eightmost commonly used in New Jersey. Prometon and simazinewere detected in 96 and 88 percent of the samples, respectively,but ranked 36th and 23d in pounds of active ingredient applied.Diazinon, the seventh most frequently detected pesticide in thestudy, ranked 14th in pounds of active ingredient applied.Diazinon and prometon, however, are active ingredients inproducts used by unlicensed applicators for home and gardenuse.
Physical and chemical properties and application rates ofpesticides affect their detection frequencies in streams. Prometonmay be detected more frequently than expected because of itshigh solubility in water, low soil-adsorption coefficient, and longhalf-life in soil (U.S. Department of Agriculture, 1995). Higherthan expected detection frequencies of simazine, despite its lowsolubility in water and short half-life in soil, might be explainedby its low soil-adsorption coefficient. Larson and others (1995)found a larger percentage of simazine than any other pesticide instreamwater based on the amount of pesticide applied within adrainage basin in five of the nine basins studied within theMississippi River basin. Pendamethalin and chlorpyrifos areamong the four most heavily applied pesticides of those studied(Reiser and O’Brien, 1998); however, detections were minimal,due in part to their low water solubility and high soil-adsorptioncoefficient.
Concentrations
Concentrations of individual pesticide compounds rangedfrom less than 0.001 to 10.0 µg/L. Median concentrations of thepesticides detected ranged from < 0.001 µg/L for dieldrin andazinphos, methyl to 0.025 µg/L for atrazine (table 2) for allsamples collected during this study. The 90th percentile valuesranged from less than the MDL to 0.32 µg/L for 2,4-D (table2).The maximum concentrations of 37 of the 41 pesticidesdetected occurred during the growing season. The maximumconcentrations of 24 of these 37 pesticides occurred duringrunoff conditions. The four pesticides with maximum concentra-tions occurring during the nongrowing season were collectedduring base-flow conditions.
The maximum concentrations of 10 pesticides weredetected in samples collected after a night of heavy rain on June13, 1996—atrazine, 10 µg/L; acetochlor, 4.7 µg/L; desethylatrazine, 0.25 µg/L; alachlor, 4.7 µg/L; 2,4-D, 1.7 µg/L;cyanazine, 1.9 µg/L; and linuron, 0.62 µg/L—at Stony Brook atPrinceton (01401000) and metolachlor, 5.2 µg/L; metribuzin,0.11 µg/L; and pendimethalin, 0.046 µg/L at Raritan River atQueen’s Bridge (01403300).
The maximum concentrations for all but four pesticidesdetected in this study are higher than those detected in the June1997 synoptic study (Reiser and O’Brien, 1998). The fourpesticides—carbofuran, dieldrin, simazine, and tebuthiuron—occurred at maximum concentrations in this study during thesame time of year and same hydrologic conditions, in late Mayand June at or near base-flow conditions. A comparison of theconcentrations of pesticides detected in both studies indicatedthat only dieldrin and tebuthiuron had lower median concentra-tions in this study. All of the dieldrin detections and 80 percentof tebuthiuron detections occurred during base-flow conditions.
Relation to land useThe highest median, 90th percentile, and maximum
concentrations of a particular pesticide typically occurred at asite where land use in the drainage basin upstream from the site
Atrazine Prometon Metolachlor Simazine Diazinon Alachlor Carbaryl0
100
0
20
40
60
80
DE
TE
CT
ION
FR
EQ
UE
NC
Y, IN
PE
RC
EN
T
0.0005
20
0.0010.0020.005
0.010.020.050.10.20.5
125
10
CO
NC
EN
TR
AT
ION
, IN
MIC
RO
-G
RA
MS
PE
R L
ITE
R
EXPLANATION
Passaic River
Saddle River
Neshanic River
Stony Brook
Raritan River
Bound Brook
Great Egg Harbor River
(7) Number of detections
Method De-tection Limit (MDL)
Figure 3. Detection frequencies and measured concentrations of the most frequently detected pesticides in the 146 samples collected by stream site.
All samples censored at lab MDLs
All samples censored at 0.01 (µg/L) micrograms
Atrazine Prometon Metolachlor Desethyl-Atrazine Simazine Diazinon Alachlor Carbaryl
MDL = 0.001 µg/L MDL = 0.018 µg/L MDL = 0.002 µg/L MDL = 0.002 µg/L MDL = 0.005 µg/L MDL = 0.002 µg/L MDL = 0.002 µg/L MDL = 0.003 µg/L
(7)(8)(7)(9)(27)(41)(42) (7)(9)(7)(9)(26)(42)(40) (7)(6)(7)(9)(27)(42)(41) (3)(7)(7)(9)(27)(39)(41) (7)(9)(6)(9)(26)(31)(41) (6)(7)(3)(4)(16)(37)(11) (3)(1)(6)(7)(23)(10)(32) (5)(4)(4)(4)(18)(35)(9)
Desethyl-Atrazine

would indicate the use of that particular pesticide. Five herbi-cides used almost exclusively for agriculture — acetochlor,alachlor, atrazine, cyanazine, and metolachlor — and anotherherbicide — 2,4-D — used for multiple purposes were the onlypesticides with 90th percentile concentrations that exceeded 1.0µg/L. All the detections that exceeded 1.0 µg/L were at the threesites with the most agricultural land use (01398000, 01401000,and 01403300). These same herbicides also showed the largestvariations in concentration with season and flow condition.Concentrations of atrazine in relation to mean daily flow areshown in figure 4. Concentrations varied by more than twoorders of magnitude at the three sites with greater than 25percent agricultural land use. Concentrations of agriculturalherbicides increased as much as 500 percent during springrunoff. The largest inner quartile ranges (IQR’s) observed were
for atrazine and metolachlor at these three sites. Median concen-trations of the insecticides, diazinon and carbaryl, were detectedat significantly higher concentrations at one or more of the mosturbanized sites.
The median concentrations of six herbicides—atrazine,metolachlor, desethyl-atrazine, alachlor, cyanazine andacetochlor—used almost exclusively in agriculture weresignificantly higher at the three sites with greater than 25 percentagricultural land use than the concentrations at the other foursites. The distribution of detected concentrations of four herbi-cides and one insecticide at each site ordered by percent agricul-tural land use is shown in figure 5. Eleven of the 15 pesticidespresent in maximum concentrations at the urban Bound Brooksite are associated primarily with lawn care, rights-of-waymaintenance and mosquito control. Two pesticides are used for
M J J A S O N D J F M A M J J A S O N D J F M A M1996 1997 1998
0.01
10
0.02
0.030.040.050.070.1
0.2
0.30.40.50.7
1
2
3457
AT
RA
ZIN
E C
ON
CE
NT
RA
TIO
N, I
N M
ICR
O-
GR
AM
S P
ER
LIT
ER
100
100,000
200
3004005007001,000
2,000
3,0004,0005,0007,00010,000
20,000
30,00040,00050,00070,000
M J J A S O N D J F M A M J J A S O N D J F M A M1996 1997 1998
0.001
0.1
0.002
0.003
0.0040.005
0.007
0.01
0.02
0.03
0.040.05
0.07
AT
RA
ZIN
E C
ON
CE
NT
RA
TIO
N, I
N M
ICR
O-
GR
AM
S P
ER
LIT
ER
1
10,000
2
5
10
20
50
100
200
500
1,000
2,000
5,000
ME
AN
DA
ILY
FLO
W, I
N C
UB
IC F
EE
T P
ER
SE
CO
ND
EXPLANATION
Mean daily flow
Detection
Non-Detection
M J J A S O N D J F M A M J J A S O N D J F M A M1996 1997 1998DATE
0.001
0.1
0.002
0.003
0.0040.005
0.007
0.01
0.02
0.03
0.040.05
0.07
AT
RA
ZIN
E C
ON
CE
NT
RA
TIO
N, I
N M
ICR
O-
GR
AM
S P
ER
LIT
ER
1
100
2
3
45
7
10
20
30
4050
70
01410784 Great Egg Harbor River at Sicklerville, NJ
Figure 4. Measured atrazine concentrations and mean daily flow at the three sites sampled during growing and nongrowing seasons from April 1996 to June 1998 (Method detection limit is 0.001 micrograms per liter).
01403900 Bound Brook at Middlesex, NJ
01403300 Raritan River at Queens Bridge at Bound Brook, NJMedian by season Growing: 0.079 Nongrowing: 0.028
Median by season Growing: 0.021 Nongrowing: 0.008
Median by season Growing: 0.079 Nongrowing: 0.028

agriculture only; the other two are not applied by licensedapplicators in New Jersey, and their uses are unknown. Watersamples from the urban-residential site on the Saddle Rivercontained the maximum individual and (or) 90th percentileconcentrations of three herbicides associated primarily with lawncare, two insecticides used formerly or presently for termitecontrol, and one insecticide used for mosquito control. Six of thenine pesticides found in maximum concentrations at the StonyBrook site, whose drainage basin is changing from agriculture tourban land use, are used exclusively for agriculture, and theother three are used primarily for agriculture. (Reiser andO’Brien, 1998).
Median and 90th percentile concentrations of the eightmost frequently detected pesticides from each of the seven siteswere evaluated with respect to land use at the sites by using leastsquares linear regression (Ott, 1988). Median concentrations ofmetolachlor, desethyl-atrazine, alachlor and atrazine (adjusted r2
ranged from 0.97 to 0.62) increased significantly as the percent-age of agricultural land increased (fig. 6). In contrast, medianconcentrations of metolachlor and desethyl atrazine decreased
significantly with an increase in percentage of urban land(adjusted r2= 0.59 and 0.46, respectively) and median concentra-tions of metolachlor decreased significantly with an increase inpopulation density. Concentrations of diazinon at the 90thpercentile increased significantly with increased commercial/industrial land use and population density (adjusted r2= 0.81 and0.74 respectively). Concentrations of prometon at the 90thpercentile were also found to increase with an increase incommercial/industrial land use and population density.
The variability of pesticide concentrations as defined bythe IQR was typically greatest at sites in which land use in thedrainage basin upstream from the site is generally associatedwith expected pesticide applications. The IQR of eight herbi-cides and one insecticide associated with agricultural use washighest at either Neshanic River or Raritan River, the two siteswith the most agricultural land use. The IQR’s of six herbicidesused primarily for lawn care or rights-of-way maintenance andof three insecticides used in urban areas were highest at theBound Brook site. The IQR of dieldrin was highest at SaddleRiver, the basin with the highest percentage of urban-residentialland use.
Variation in Pesticide Concentrations
Relation to SeasonPesticides with median concentrations greater than the
MDL were compared by season at each of the three sitessampled throughout the year. Median concentrations of the eightmost frequently detected pesticides were significantly higher inthe growing season than in the nongrowing season at all threesites. Sixteen pesticides had median concentrations greater thanthe MDL in at least one season at one site. Tebuthiuron was theonly pesticide of the 16 with a median concentration greater thanthe MDL in the nongrowing season only and only at the BoundBrook site. Median concentrations of tebuthiron at other siteswere less than the MDL in both seasons.
The median concentrations of the eight most frequently
EXPLANATION
Barren
Wetland
Water
Forest
Urban Com-mercial/Industrial
Urban Resi-dential
Agricultural
0.001
100
0.01
0.1
1
10 ATRAZINE
0.001
100
0.01
0.1
1
10ALACHLOR
0.001
100
0.01
0.1
1
10 METOLACHLOR
0.001
100
0.01
0.1
1
10SIMAZINE
Figure 5. Land use distribution in the drainage basins of the seven streams and concentrations of five of the most frequently detected pesticides in stream samples collected during April 1996 to June 1998.
0.001
100
0.01
0.1
1
10 DIAZINON
0
100
0
50
LAN
D U
SE
, IN
PE
RC
EN
T
NeshanicRiver
RaritanRiver
StonyBrook
Great EggHarbor River
PassaicRiver
SaddleRiver
BoundBrook
CO
NC
EN
TR
AT
ION
, IN
MIC
RO
GR
AM
S P
ER
LIT
ER
550 5 10 15 20 25 30 35 40 45 50
AGRICULTURAL LAND USE, IN PERCENT
0.075
0
0.005
0.010
0.015
0.020
0.025
0.030
0.035
0.040
0.045
0.050
0.055
0.060
0.065
0.070
ME
DIA
N M
ETO
LAC
HLO
R C
ON
CE
NT
RAT
ION
, IN
MIC
RO
GR
AM
S P
ER
LIT
ER
Median Metolachlor concentration
Least-squares regression liney = 0.0012x + 0.0081Adjusted r sq = 0.969p = 0.00004
Figure 6. Relation of median concentration of metolachlor to percent of agricultural land use at each of the seven sites.

0.001
100
0.01
0.1
1
10
ALACHLOR
0.0001
100
0.001
0.01
0.1
1
10
ATRAZINE
0.0001
100
0.001
0.01
0.1
1
10
ATRAZINE,DESETHYL
0.0001
100
0.001
0.01
0.1
1
10
CARBARYL
0.0001
100
0.001
0.01
0.1
1
10
DIAZINON
0.0001
100
0.001
0.01
0.1
1
10
METOLACHLOR
0.0001
100
0.001
0.01
0.1
1
10
PROMETON
0.0001
100
0.001
0.01
0.1
1
10
SIMAZINE
0.01
100
0.1
1
10
TOTAL CONCENTRATION
0138200001390500
0139800001401000
0140330001403900
01410784
TOTAL NUMBER OF COMPOUNDS DETECTED
0
20
0
10
0138200001390500
0139800001401000
0140330001403900
01410784
Figure 7. Distribution of pesticide concentrations in the growing season and results of Tukey’s test at the seven stream sites in New Jersey. [Boxplots consist of a center line (median) splitting a rectangle defined by the 75th and 25th percentiles, whiskers are drawn to 10th and 90th percentiles, circles and asterisks are outliers (Helsel and Hirsch, 1992). Significant differences in mean rank concentration between sites from Tukey’s test: from A, the highest, to C, the lowest].
BC C AB AB AB AC C
AB C C BC AB A C
AB AB AB AB A A B
A A B A A B AB
AB ABC C BC ABC A C BC C A A A B AB
C C A A A B B A AB AB AB A A B
AB B A A A B AB C C A A A BC B
SITE NUMBERS SITE NUMBERS
CO
NC
EN
TR
AT
ION
, IN
MIC
RO
GR
AM
S P
ER
LIT
ER

detected pesticides during the growing season were comparedamong the seven sites. (fig 7). The median concentrations ofatrazine, desethyl atrazine, metolachlor, and alachlor, com-pounds used or associated almost exclusively with agriculturaluse, were significantly higher at the Neshanic River, RaritanRiver, and Stony Brook sites than at the other four sites. Thedrainage basins represented by these sites contain greater than 25percent agricultural land use. The median concentrations ofprometon, carbaryl, and diazinon, pesticides used in urban areas,were significantly higher at the Bound Brook site than at theother sites. The Bound Brook drainage basin contains 73 percenturban land use. Simazine was found to be significantly higher atSaddle River, Raritan River, Passaic River, and Stony Brookthan at the other three sites. The highest median concentrationsappear to be related to mixed land uses at these sites. Simazine isused primarily for agriculture, but also for lawn care and rights-of-way maintenance.
Results of ANOVA and Tukey’s test at the three sitessampled in the nongrowing season were similar to the resultsfrom the growing season. The median concentrations of atrazine,desethyl atrazine, and metolachlor were significantly higher atthe Raritan River site than at the other two sites. Alachlor wassignificantly higher at Raritan River and Great Egg Harbor Riverthan at Bound Brook. Prometon, diazinon and carbaryl weresignificantly higher at Bound Brook than the other two sites. Nosignificant differences in median simazine concentrations weredetermined to exist between the three sites.
The variability of individual pesticide concentrations wasgenerally greater during the growing season than thenongrowing season at each of the three sites (fig. 4). Tebuthiuronwas the only pesticide with a higher IQR in the nongrowingseason at the Bound Brook and Great Egg Harbor River sites.Both atrazine and desethyl atrazine have a higher IQR in thenongrowing season at the Great Egg Harbor River site.
Relation to Flow ConditionSamples collected at base-flow conditions were compared
to those collected during storms. The median concentrations ofthe 8 most frequently detected pesticides in all 70 base-flowsamples were compared by season to those in all 76 runoffsamples collected in this study. ANOVA indicated that themedian concentrations of atrazine, prometon, metolachlor,desethyl-atrazine, diazinon, alachlor, and carbaryl were highestduring runoff conditions in the growing season. The mediansimazine concentration was highest during the growing seasonregardless of flow condition. The lowest median concentrationsof atrazine, prometon, metolachlor, simazine and alachloroccurred during runoff conditions in the nongrowing season.Both desethyl atrazine and diazinon are equally low during base-flow and runoff conditions in the nongrowing season. Mediancarbaryl concentrations are less than the detection limit (<0.003µg/L) during all hydrologic conditions, except during runoffconditions in the growing season when the median concentrationwas 0.045 µg/L.
A comparison between sites of median concentrations ofthe eight most frequently detected compounds indicated that, ingeneral, concentrations were lower during base-flow conditionsthan during runoff conditions at all sites. The three most urban-ized sites had significantly higher median concentrations ofprometon, diazinon, and carbaryl than the other sites regardless
of flow conditions. The only exception was that samples fromthe Saddle River had significantly lower concentrations ofcarbaryl than those from all other sites during base flow. Medianconcentrations of the agricultural herbicides and the metabolitedesethyl atrazine were consistently higher at the three mostagricultural sites than at the other sites during all flow conditionsand seasons. The only exception was the median concentrationof alachlor during base-flow conditions in the growing season,which was higher at the Great Egg Harbor River site than at twoof the three sites with the most agricultural land use. Signifi-cantly higher concentrations of the four pesticides associatedwith agriculture were present in samples from one or more of theagricultural sites than in samples from the other sites during eachflow condition in each season.
Simultaneous comparison to season, streamflow, andland use
Concentrations of pesticides from all samples wereevaluated simultaneously by the predominant land use at eachsite, season, and flow condition using MANOVA. The concen-trations of each of the eight most frequently detected pesticidesvaried as a function of season and land use. Flow condition wassignificant only in predicting variability in concentrations ofdiazinon and carbaryl. Forty-eight percent of the variability ofconcentrations of diazinon and carbaryl was related to season,flow, and land use. Twenty-seven to 59 percent of the variabilityin concentrations of the other six pesticides was related to seasonand land use only. Concentrations of some pesticides weresignificantly higher in runoff during the growing season atspecific sites, but when concentrations from both seasons wereanalyzed, flow became insignificant.
Concentrations of pesticides were evaluated simulta-neously by season, flow condition, and flow condition as afunction of season at each of the three sites with samplescollected during both seasons. At the Raritan River site, 83percent of the variability in the concentrations of simazine wasrelated to flow and season. Twenty-nine to 52 percent of thevariability in carbaryl and prometon concentrations was relatedsignificantly to flow only. Forty-two percent of the variability inatrazine concentrations was attributed to flow as a function ofseason. The other four compounds did not relate significantly toany of the three variables in the model.
At Bound Brook, five of the eight pesticides relatedsignificantly to season only, accounting for 15 to 24 percent ofthe variability in concentration. Diazinon and carbaryl relatedsignificantly to flow and season, accounting for 38 percent ofvariability in concentration. At Great Egg Harbor River diazinonand prometon concentrations were related to season only,accounting for 18 to 21 percent of variability. Flow and seasonaccounted for 38 to 42 percent of the variability in atrazine andsimazine concentrations. Metolachlor was significantly related toseason and flow as a function of season, and desethyl atrazinewas related to flow, accounting for 21 and 18 percent of variabil-ity, respectively.
Total-Pesticide Concentration andNumbers of Pesticides Detected
Total-pesticide concentrations in each sample werecomputed by adding the concentrations of each detected com-

pound and by assigning a concentration of 0 µg/L to all censoredvalues. Total-pesticide concentrations and total numbers ofpesticides in all samples at a site were compared among sites.Total concentrations in a sample ranged from 26.4 µg/L at theStony Brook site during runoff in June 1996 to 0.00 µg/L at theGreat Egg Harbor River site during runoff in October 1997 whenno pesticide concentrations exceeded the detection limit. Thehighest number of pesticides detected (18) were present in foursamples collected during spring runoff; three samples were fromBound Brook and one from Stony Brook. The highest totalconcentrations and numbers of pesticides occurred at each of theseven sites during runoff in the growing season. The smallesttotal concentrations and numbers of pesticides at each sitetypically occurred during runoff events in the nongrowingseason. The number of pesticides detected at each site over the2-year sampling period ranged from 29 at Bound Brook to 13 atPassaic River.
Median total-pesticide concentrations and median totalnumber of pesticides from all 70 base-flow samples werecompared to those from 76 runoff samples, by season. Themedian total-pesticide concentration was highest (0.41 µg/L) inrunoff samples in the growing season and lowest (0.087 µg/L) inthe nongrowing season regardless of flow condition. The mediantotal-pesticide concentrations in base-flow and runoff samplesincreased in the growing season. The median total number ofpesticides was highest (10) in runoff samples in the growingseason and lowest (6) in runoff samples in the nongrowingseason. The median total number of pesticides in base-flow and
runoff samples also increased significantly in the growingseason.
Relation to Season and Flow Condition Total-pesticide concentrations and total numbers of
pesticides at the three sites sampled throughout the year werecompared by seasons using ANOVA. Median total concentra-tions and median total numbers of pesticides were significantlyhigher in the growing season at each of the three sites (p<0.05).A seasonal pattern was observed at each site (fig. 8). The mediantotal-pesticide concentration during the nongrowing season,however, was the same as that during base-flow and runoffconditions at the Raritan River and Bound Brook sites anddecreased slightly during runoff conditions at the Great EggHarbor River site. The median total number of pesticides duringrunoff conditions in the nongrowing season was larger thanduring base flow at the Raritan River site, remained the same atthe Bound Brook site, and was smaller at the Great Egg HarborRiver site.
Total-pesticide concentration and total number of pesti-cides in all samples collected during the growing season werecompared among the seven sites. The median total concentrationand median total number of pesticides were higher during runoffconditions than during base flow at each site during the growingseason (table 4). The median total-pesticide concentration washighest at the Bound Brook site (0.65 µg/L) and smallest at theSaddle River and Great Egg Harbor River sites (0.12 µg/L).Tukey’s test showed that samples from the Bound Brook site
M J J A S O N D J F M A M J J A S O N D J F M A M1996 1997 1998
DATE
0.01
1
0.020.030.040.050.07
0.1
0.20.30.40.50.7
12
0
2
4
6
8
10
M J J A S O N D J F M A M J J A S O N D J F M A M0.01
100
0.02
0.050.10.2
0.512
51020
50
0
20
5
10
15
M J J A S O N D J F M A M J J A S O N D J F M A M1996 1997 1998
0.01
10
0.02
0.05
0.1
0.2
0.5
1
2
5
TO
TAL-
PE
ST
ICID
E C
ON
CE
NT
RA
TIO
N, I
N M
ICR
OG
RA
MS
PE
R L
ITE
R
0
20
5
10
15
TO
TAL
NU
MB
ER
OF
PE
ST
ICID
ES
Figure 8. Total-pesticide concentration and total number of pesticides in all samples collected during April 1996 to June 1998.
01410784 Great Egg Harbor
River at Sicklerville, N.J.
01403300 Raritan River at
Queens bridge at Bound
Brook, N.J.
1996 1997 1998
01403900 Bound Brook at
Middlesex, N.J.
Median by season G NG
Total concentration 0.40 0.15
Total number
Median by season G NG
Total concentration 0.70 0.09
Total number
Median by season G NGTotal concentration 0.15 0.07Total number 7
EXPLANATION
Total pesticide concentration
Total number of pesticides
Growing season
Nongrowing Season
Growing season
Nongrowing Season
6
11 8.5
11 7
G
NG

contained significantly higher total-pesticide concentrations thanthose at other sites, and samples from the Saddle River andGreat Egg Harbor River sites contained significantly lower totalconcentrations. Tukey’s test showed that the median totalnumbers of pesticides at the Bound Brook and Raritan Riversites were significantly higher than those at the other sites andthe total number was significantly lower at the Great Egg HarborRiver site.
Total-pesticide concentration and total number of pesti-cides in all samples collected during the nongrowing seasonwere compared between the three sites. The median totalconcentration at the Raritan River site was significantly greaterthan that at the Bound Brook and Great Egg Harbor River sites.The medians of total numbers of pesticides were not signifi-cantly different between sites.
Variability, as determined by the IQR of observations, intotal-pesticide concentrations and total numbers of pesticidesdetected in samples collected during the growing season wascompared among the seven sites (table 4). Variability in total-pesticide concentrations for all growing season samples washighest at the Raritan River site (1.49 µg/L) and lowest at theGreat Egg Harbor River site (0.05 µg/L). Variability in totalnumbers of pesticides detected in a sample was highest at theNeshanic River site (8) and lowest at the Passaic River, SaddleRiver and Great Egg Harbor River sites (3).
During the nongrowing season, the IQR in total-pesticideconcentration was essentially the same at each site (0.04-0.06
µg/L). The IQR of total numbers of pesticides detected was oneat Bound Brook and three at Raritan River and Great Egg HarborRiver. Variability was substantially lower in the nongrowingseason than in the growing season at the Bound Brook andRaritan River sites, but remained the same at the Great EggHarbor River site. (table 4).
Relation to Flow Condition
Median total-pesticide concentrations of pesticides inbase-flow and runoff samples in the growing and nongrowingseasons were compared among sites. Median total-pesticideconcentrations were highest during runoff in the growing seasonat the Neshanic River site (table 4), the site with the mostagricultural land use, and significantly higher than at the othersites. The second highest total-pesticide concentration was at theBound Brook site, a site with 68 percent urban land use and 24percent commercial/industrial land use. The highest mediantotal-pesticide concentrations at base-flow conditions during thegrowing season ranged from 0.19 to 0.27 µg/L at the BoundBrook, Neshanic River, Raritan River, and Stony Brook sites.The lowest median at Saddle River (0.06 µg/L) was significantlylower than that at all the other sites. Median total concentrationsranged from 0.07 to 0.13 µg/L in the nongrowing season and didnot vary with flow conditions. The Raritan River site had thehighest median concentration, which was significantly higherthan that at the Great Egg Harbor River site.
Median total numbers of pesticides in base-flow and runoff
Station name
Total number of pesticides per sample Total pesticide concentration per sample (µg/L)
Median Inner-quartile range Median Inner-quartile range
Base flow Runoff Base flow Runoff Base flow Runoff Base flow Runoff
Growing Season
Passaic River 7 (N) 1 0 0.11 (AB) 0.28 (AB) 0.07 0.008
Saddle River 8 (N) 2 5.5 0.06 (B) * 0.23 (AB) 0.02 0.21
Neshanic River 6.5 (N) 14 (A) 2 5 0.25 (A) 1.37 (AB) 0.20 9.8
Stony Brook 7.5 (N) 5 12 0.20 (A) 0.43 (AB) 0.89 26
Raritan River 8 (N) 11.5 (A) 2 6.5 0.19 (A) 0.48 (AB) 0.10 2.3
Bound Brook 9 (N) 13.5 (A) 3 4.5 0.27 (A) 0.80 (A) 0.35 1.0
Great EggHarbor River
7 (N) 8 (B) 2.5 2 0.10 (AB) 0.13 (B) 0.04 0.08
Nongrowing Season
Raritan River 7 (N) 10 (A) 2 3 0.13 (A) 0.13 (A) 0.12 0.12
Bound Brook 7 (N) 7 (AB) 0 1 0.09 (AB) 0.09 (AB) 0.03 0.06
Great EggHarbor River
* 8 (N) 6 (B) 1 3 * 0.08 (B) 0.07 (B) 0.006 0.06
Both Seasons
Raritan River 7 (N) * 10 (A) 1 4 0.14 (A) 0.34 (A) 0.08 1.5
Bound Brook 8 (N) 3 6 0.22 (A) 0.74 (A) 0.26 1.2
Great EggHarbor River
7 (N) 7 (B) 2 2 0.09 (B) 0.05 0.07
Table 4. Median total pesticide concentration and total number of pesticides by season and flow condition for each sampling site[Significant differences in mean rank concentration between sites by season, from Tukey’s test: A=highest, AB=middle, B=lowest,N=no significant difference. Significant differences between flow conditions by site: * significantly higher at this flow condition. Innerquartile range is the 25th percentile minus the 75th percentile; Brown indicates value is less during runoff than during base flow; µg/L, micrograms per liter]
10 (AB)
11 (AB)
10 (AB)
* 13 (A)
* 0.11 (B)
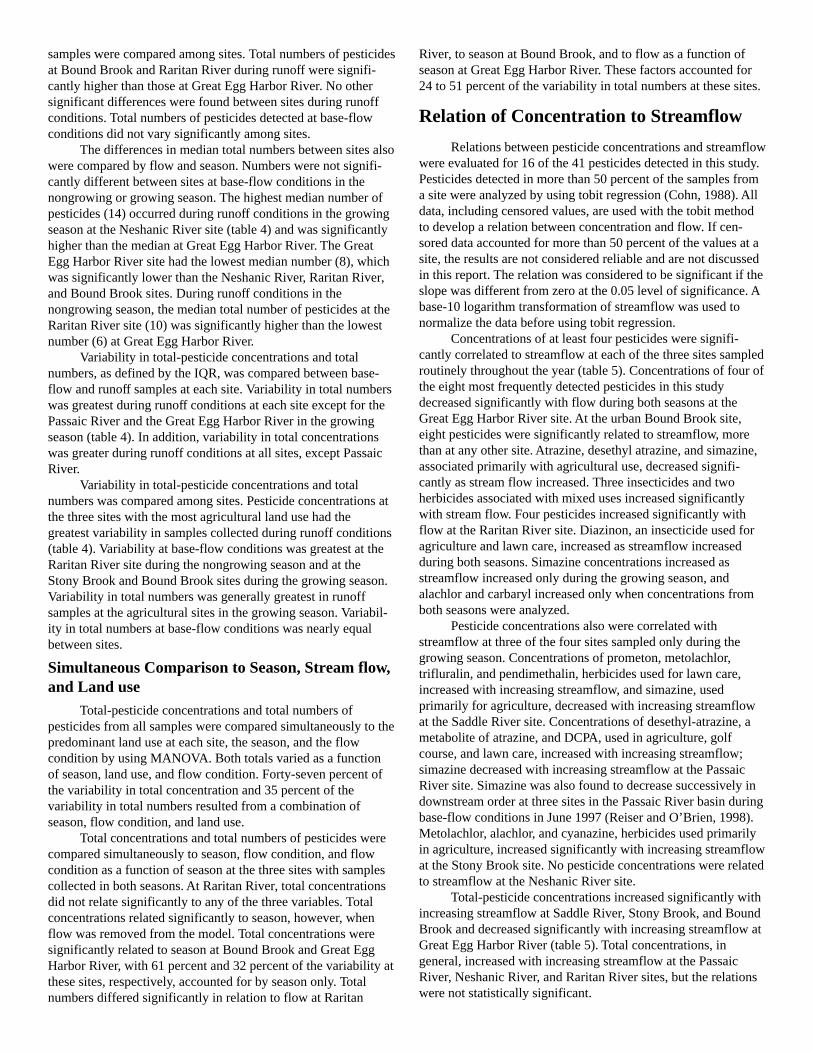
samples were compared among sites. Total numbers of pesticidesat Bound Brook and Raritan River during runoff were signifi-cantly higher than those at Great Egg Harbor River. No othersignificant differences were found between sites during runoffconditions. Total numbers of pesticides detected at base-flowconditions did not vary significantly among sites.
The differences in median total numbers between sites alsowere compared by flow and season. Numbers were not signifi-cantly different between sites at base-flow conditions in thenongrowing or growing season. The highest median number ofpesticides (14) occurred during runoff conditions in the growingseason at the Neshanic River site (table 4) and was significantlyhigher than the median at Great Egg Harbor River. The GreatEgg Harbor River site had the lowest median number (8), whichwas significantly lower than the Neshanic River, Raritan River,and Bound Brook sites. During runoff conditions in thenongrowing season, the median total number of pesticides at theRaritan River site (10) was significantly higher than the lowestnumber (6) at Great Egg Harbor River.
Variability in total-pesticide concentrations and totalnumbers, as defined by the IQR, was compared between base-flow and runoff samples at each site. Variability in total numberswas greatest during runoff conditions at each site except for thePassaic River and the Great Egg Harbor River in the growingseason (table 4). In addition, variability in total concentrationswas greater during runoff conditions at all sites, except PassaicRiver.
Variability in total-pesticide concentrations and totalnumbers was compared among sites. Pesticide concentrations atthe three sites with the most agricultural land use had thegreatest variability in samples collected during runoff conditions(table 4). Variability at base-flow conditions was greatest at theRaritan River site during the nongrowing season and at theStony Brook and Bound Brook sites during the growing season.Variability in total numbers was generally greatest in runoffsamples at the agricultural sites in the growing season. Variabil-ity in total numbers at base-flow conditions was nearly equalbetween sites.
Simultaneous Comparison to Season, Stream flow,and Land use
Total-pesticide concentrations and total numbers ofpesticides from all samples were compared simultaneously to thepredominant land use at each site, the season, and the flowcondition by using MANOVA. Both totals varied as a functionof season, land use, and flow condition. Forty-seven percent ofthe variability in total concentration and 35 percent of thevariability in total numbers resulted from a combination ofseason, flow condition, and land use.
Total concentrations and total numbers of pesticides werecompared simultaneously to season, flow condition, and flowcondition as a function of season at the three sites with samplescollected in both seasons. At Raritan River, total concentrationsdid not relate significantly to any of the three variables. Totalconcentrations related significantly to season, however, whenflow was removed from the model. Total concentrations weresignificantly related to season at Bound Brook and Great EggHarbor River, with 61 percent and 32 percent of the variability atthese sites, respectively, accounted for by season only. Totalnumbers differed significantly in relation to flow at Raritan
River, to season at Bound Brook, and to flow as a function ofseason at Great Egg Harbor River. These factors accounted for24 to 51 percent of the variability in total numbers at these sites.
Relation of Concentration to Streamflow
Relations between pesticide concentrations and streamflowwere evaluated for 16 of the 41 pesticides detected in this study.Pesticides detected in more than 50 percent of the samples froma site were analyzed by using tobit regression (Cohn, 1988). Alldata, including censored values, are used with the tobit methodto develop a relation between concentration and flow. If cen-sored data accounted for more than 50 percent of the values at asite, the results are not considered reliable and are not discussedin this report. The relation was considered to be significant if theslope was different from zero at the 0.05 level of significance. Abase-10 logarithm transformation of streamflow was used tonormalize the data before using tobit regression.
Concentrations of at least four pesticides were signifi-cantly correlated to streamflow at each of the three sites sampledroutinely throughout the year (table 5). Concentrations of four ofthe eight most frequently detected pesticides in this studydecreased significantly with flow during both seasons at theGreat Egg Harbor River site. At the urban Bound Brook site,eight pesticides were significantly related to streamflow, morethan at any other site. Atrazine, desethyl atrazine, and simazine,associated primarily with agricultural use, decreased signifi-cantly as stream flow increased. Three insecticides and twoherbicides associated with mixed uses increased significantlywith stream flow. Four pesticides increased significantly withflow at the Raritan River site. Diazinon, an insecticide used foragriculture and lawn care, increased as streamflow increasedduring both seasons. Simazine concentrations increased asstreamflow increased only during the growing season, andalachlor and carbaryl increased only when concentrations fromboth seasons were analyzed.
Pesticide concentrations also were correlated withstreamflow at three of the four sites sampled only during thegrowing season. Concentrations of prometon, metolachlor,trifluralin, and pendimethalin, herbicides used for lawn care,increased with increasing streamflow, and simazine, usedprimarily for agriculture, decreased with increasing streamflowat the Saddle River site. Concentrations of desethyl-atrazine, ametabolite of atrazine, and DCPA, used in agriculture, golfcourse, and lawn care, increased with increasing streamflow;simazine decreased with increasing streamflow at the PassaicRiver site. Simazine was also found to decrease successively indownstream order at three sites in the Passaic River basin duringbase-flow conditions in June 1997 (Reiser and O’Brien, 1998).Metolachlor, alachlor, and cyanazine, herbicides used primarilyin agriculture, increased significantly with increasing streamflowat the Stony Brook site. No pesticide concentrations were relatedto streamflow at the Neshanic River site.
Total-pesticide concentrations increased significantly withincreasing streamflow at Saddle River, Stony Brook, and BoundBrook and decreased significantly with increasing streamflow atGreat Egg Harbor River (table 5). Total concentrations, ingeneral, increased with increasing streamflow at the PassaicRiver, Neshanic River, and Raritan River sites, but the relationswere not statistically significant.

The numbers of pesticides detected significantly increasedwith streamflow at the Raritan River site and decreased signifi-cantly at the Great Egg Harbor River site. For four of the fiveother sites, numbers of pesticides detected, in general, increasedas streamflow increased, but the relations were not statisticallysignificant.
Summary and Conclusions
Pesticides were frequently detected in water samplescollected from seven New Jersey streams from April 1996through June 1998. Pesticides were present in streams through-out the year, but rarely at concentrations that exceeded estab-lished water-quality criteria. The pesticides most frequentlydetected were atrazine, in 97 percent of the samples; prometon,in 96 percent; metolachlor, in 95 percent; desethyl-atrazine, in 91percent; simazine, in 88 percent; diazinon, in 58 percent;alachlor, in 56 percent; and carbaryl, in 54 percent. More than 97percent of the samples contained at least five pesticides. Twenty-nine pesticides were detected at the highly urbanized BoundBrook site throughout the sampling period, the most detected atany site, and 13 pesticides were detected at the Passaic Riversite, which drains a large basin of mixed land uses, the fewest atany site.
Pesticides were detected more frequently during thegrowing season than during the nongrowing season. Thirty-ninepesticides were detected during the growing season and 20pesticides during the nongrowing season. Twenty-one pesticideswere detected only during the growing season; however, three ofthese—dieldrin, bentazon and molinate—were detected only atsites sampled exclusively in the growing season.
The concentrations of 10 pesticides infrequently exceeded
established water-quality criteria. Thirty-one detections occurredduring the growing season and one during the nongrowingseason. Concentrations of atrazine, alachlor, and cyanazineexceeded the U.S. Environmental Protection Agency humanhealth criteria during runoff shortly after spring applications ofthese pesticides, and represent a potential threat to municipalwater supplies in the Raritan River basin. Concentrations ofchlorpyrifos, chlorthalonil, diazinon, ethyl-parathion, andmethyl-azinphos exceeded chronic life criteria for the protectionof aquatic life (AQCR) at four sites during the growing season.Dieldrin was detected in four samples and DDE in two samplesat concentrations that exceeded New Jersey Department ofEnvironmental Protection (NJDEP) health advisory levels.Dieldrin concentrations also exceeded the NJDEP AQCR.
The highest individual concentrations and highest medianconcentrations of most of the pesticides detected occurred duringrunoff in the growing season, and the lowest typically occurredduring runoff in the nongrowing season. The median concentra-tions of most pesticides at most sites were equally low duringbase flow and runoff in the nongrowing season. Typically,concentrations were least variable during base-flow conditions inthe nongrowing season. All 24 pesticides with the highestconcentrations during runoff were sampled in the growingseason. The four pesticides with highest concentrations duringthe nongrowing season were sampled during base-flowconditions.
Pesticide concentrations were related to land use in thedrainage basin upstream from the sampling site. The highestmedian concentration and the maximum concentration of apesticide were typically found at a site where land use in thedrainage basin upstream from the site is generally associatedwith applications of that pesticide. Herbicides associated with
Pesticide
PassiacRiver
SaddleRiver
NeshanicRiver
StonyBrook
Raritan River Bound Brook Great Egg Harbor River
Growing Growing Growing Growing All GrowingNon-
growing All GrowingNon-
growingAll Growing
Non-growing
Atrazine NSR NSR NSR NSR NSR NSR NSR NSR NSR - 0.09 - 0.42 - 0.16 - 0.98
Prometon NSR + 0.28 NSR NSR NSR NSR NSR NSR NSR NSR - 0.24 - 0.20 - 0.38
Metolachlor NSR + 0.96 NSR + 0.75 NSR NSR NSR NSR NSR NSR NSR + 0.39 NSR
Atrazine, Desethyl + 0.33 NSR NSR NSR NSR NSR NSR NSR NSR - 0.26 - 0.31 - 0.20 - 0.66
Simazine - 0.32 - 0.19 NSR NSR NSR + 0.36 NSR - 0.12 - 0.12 NSR - 0.32 NSR - 0.46
Diazinon NSR NSR --- --- + 1.15 + 1.12 + 1.19 + 0.38 + 0.41 --- NSR --- ---
Alachlor --- --- NSR + 1.27 + 0.59 NSR NSR --- --- --- - 0.52 - 0.42 - 0.72
Carbaryl NSR --- NSR --- + 0.73 NSR --- + 0.50 + 0.46 NSR --- --- ---
DCPA + 0.39 --- --- --- NSR NSR --- + 0.20 + 0.20 --- NSR --- ---
Chlorpyrifos NSR NSR --- --- --- --- --- + 0.23 NSR --- --- --- ---
Diuron --- --- --- --- --- --- --- NSR NSR --- --- --- ---
Trifluralin --- + 0.51 --- --- --- --- --- --- + 0.40 --- --- --- ---
Tebuthiuron --- --- --- --- --- --- --- --- --- NSR --- --- ---
Cyanazine --- --- --- + 1.72 --- NSR --- --- --- --- --- --- ---
Pendimethalin --- + 1.10 --- --- --- --- --- --- --- --- --- --- ---
Acetochlor --- --- NSR --- --- --- --- --- --- --- --- --- ---
Total Concentration NSR + 0.88 NSR + 0.86 NSR NSR NSR NSR + 0.28 NSR - 0.53 - 0.20 NSR
Total Number NSR NSR NSR NSR + 0.15 + 0.15 + 0.16 NSR NSR NSR - 0.22 NSR NSR
Table 5. Tobit regression slopes of significant relations between pesticide concentrations and stream flow, and total numbers ofpesticides and streamflow, April 1996 to June 1998, by season[+, positive regression slope indicates concentration increases with increasing flow; -, negative regression slope indicatesconcentration decreases with increasing flow; NSR, no significant relation at 0.05 level; ---, less than 50 percent detections,therefore, no results given]

agricultural land use, such as atrazine, generally were detected inhigher concentrations than other pesticides, showed the strongestcorrelation to land use, and had the largest variability in concen-tration with season and streamflow. In general, insecticides weredetected more frequently and in greater concentrations at urbansites than at other sites. The highest individual and medianconcentrations of 10 of the 13 insecticides detected were presentin samples from the two sites with the highest urban land use.Ten of the 13 insecticides were detected at the highest frequen-cies at the three most urbanized sites.
Concentrations of 13 pesticides were significantlycorrelated with streamflow at one or more sites. The strongestrelations were (1) concentrations of two herbicides used for lawncare at a suburban site and two herbicides used for agriculture ata site in a small basin with 28 percent agricultural land usecorrelated positively with streamflow during the growing seasonand (2) concentrations of the insecticide diazinon correlatedpositively with streamflow during both seasons at the site thatdrains the large Raritan River basin. Concentrations of fivepesticides, total concentration, and total number of pesticidesdecreased significantly with flow at the Great Egg Harbor Riversite, a mixed land-use site in the Coastal Plain. In general, mostof the pesticides that correlated positively with streamflow weredetected at sites where the predominant land use is associatedwith the use of the detected pesticide. Most of the pesticideswith a negative relation to streamflow were detected at siteswhere the land use in the basin would not indicate use of thedetected pesticide.
The highest total concentrations of pesticides occurredduring runoff in late spring and early summer in small agricul-tural basins (greater than 25 percent agricultural land use). Thesmallest total concentrations and numbers of pesticides at eachsite typically occurred during runoff in the nongrowing season,with the smallest values occurring at the Great Egg Harbor Riverand Bound Brook sites. The highest number of pesticidesdetected in a sample (18) occurred during the growing season atboth Bound Brook and Stony Brook sites. Total-pesticideconcentrations and total number of pesticides generally in-creased as streamflow increased at all sites except Great EggHarbor River. The number of pesticides detected was found toincrease significantly as streamflow increased at the RaritanRiver site and to decrease with increased streamflow at the GreatEgg Harbor River site. Numbers of pesticides generally in-creased with increased streamflow at four of the five other sites;the exception was the Passaic River site.
The median total-pesticide concentrations were highest inrunoff samples in the growing season at all sites and lowest inthe nongrowing season regardless of flow conditions at all sites.The median total number of pesticides was highest in runoffsamples collected in the growing season at all sites and lowest inrunoff samples collected in the nongrowing season at all sites,except the Raritan River site. Variability in total-pesticideconcentrations and total numbers of pesticides was greatestduring runoff in the growing season and least during base-flowconditions in the nongrowing season at most sites.
—Robert G. Reiser
References Cited
Buxton, D.E., and Dunne, Paul, 1993, Water-quality data for theMillstone River at Weston, New Jersey, and the Shark Riverat Remson Mill, New Jersey, March - September 1992: U.S.Geological Survey Open-File Report 93-444, 16 p.
Canadian Council of Resource and Environmental Ministers,1991, Canadian water quality guidelines: Ottawa, Onterio,Environment Canada, Inland Waters Directorate, WaterQuality Branch (updated May 1996), variously paged.
Capel, P.D., Nacionales, F.C., and Larson, S.J., 1995, Precisionof a splitting device for water samples: U.S. GeologicalSurvey Open-File Report 95-293, 6 p.
Cohn, T.A., 1988, Adjusted maximum estimation of the mo-ments of lognormal populations from type 1 censoredsamples: U.S. Geological Survey Open-File Report 88-350,34 p.
DeLuca, M.J., Oden, J.H., Romanok, K.M., and Riskin, M.L.,1999, Water resources data for New Jersey—Water year1998, Volume 3. Water-quality data: U.S. Geological SurveyWater-Data Report NJ-98-3, 450 p.
Edwards, T.K., and Glysson, D.G., 1988, Field methods formeasurement of fluvial sediment: U.S. Geological SurveyOpen-File Report 86-531, 118 p.
Fegeas, R.G., Claire, R.W., Guptill, S.C., Anderson, K.E., andHallam, C.A., 1983. Land use and land cover digital data:U.S. Geological Survey Circular 895-E, 21 p.
Ferrari, M.J., Ator, S.W., Blomquist, J.D., and Drysart, J.E.,1997, Pesticides in surface water of the Mid-Atlantic region,1997: U.S. Geological Survey Water-Resources Investiga-tions Report 97-4280, 12 p.
Gilliom, R.J., Alley, W.M., and Gurtz, M.E., 1995, Design of theNational Water-Quality Assessment Program: Occurrenceand distribution of water-quality conditions: U.S. Geologi-cal Survey Circular 1112, 33p.
Harte, John, Holdren, Cheryl, Schneider, Richard, Shirley,Christine, 1991, Toxics A to Z: A guide to everyday pollu-tion hazards: Berkeley and Los Angeles, Calif., Universityof California Press, 479 p.
Helsel, D.R., and Hirsch, R.M., 1992, Statistical methods inwater resources: New York, Elsevier Science PublishingCompany Inc., 522 p.
Hitt, K.J., 1994, Refining 1970’s land-use data with 1990population data to indicate new residential development:U.S. Geological Survey Water-Resources InvestigationsReport 94 4250, 15 p.
International Joint Commission Canada and United States, 1977,New and revised Great Lakes water quality objectives,Volume II, An IJC report to the governments of the UnitedStates and Canada: Windsor, Ontario, Canada, IJC.
Ivahnenko, Tamara, and Buxton, D.E., 1994, Agriculturalpesticides in six drainage basins used for public watersupply in New Jersey, 1990: U.S. Geological Survey Water-Resources Investigations Report 93-4101, 56 p.
Larson, S.J., Capel, P.D., Goolsby, D.A., Zaugg, S.D., andSandstrom, M.W., 1995, Relations between pesticide useand riverine flux in the Mississippi River basin: Chemo-sphere, v. 31, no. 5, p. 3305-3321.

Larson, S.J., Capel, P.D., and Majewski, M.S., 1997, Pesticidesin surface waters - Distribution, trends, and governingfactors: Chelsea, Michigan, Ann Arbor Press, 373 p.
New Jersey Department of Environmental Protection,1996, NewJersey geographic information system: Trenton, N.J., CD-ROM series 1, v. 2.
_____1998, Surface water quality standards: N.J.A.C. 7:9B:Trenton, N.J., New Jersey Department of EnvironmentalProtection, Office of Environmental Planning, April 1998,122 p.
O’Brien, A.K., Reiser, R.G., and Gylling, Helle, 1998, Volatileorganic compounds in New Jersey and Long Island streams:U.S. Geological Survey Fact Sheet 194-97, 6 p.
Ott, L., 1988, An introduction to statistical methods and dataanalysis: Boston, Mass., PWS-Kent Publishing Company,835 p.
Reed, T.J., Centinaro, G.L., DeLuca, M.J., Hutchinson, J.T., andScudder, Jeffrey, 1997, Water resources data for NewJersey—Water year 1996, Volume 1. Surface-water data:U.S. Geological Survey Water-Data Report NJ-96-1, 562 p.
Reed, T.J., Centinaro, G.L., DeLuca, M.J., and Oden, J.H., 1998,Water resources data for New Jersey—Water year 1997,Volume 1. Surface-water data: U.S. Geological SurveyWater-Data Report NJ-97-1, 608 p.
Reiser, R.G., and O’Brien, A.K., 1998, Occurrence of pesticidesin streams in New Jersey and Long Island, New York, andrelation to land use: U.S. Geological Survey Water-Resources Investigation Report 98-4261, 12 p.
Stackelberg, P.E., Hopple, J.A., and Kaufman, L.J., 1997,Occurrence of nitrate, pesticides, and volatile organiccompounds in the Kirkwood-Cohansey aquifer system,southern New Jersey: U.S. Geological Survey Water-Resources Investigations Report 97-4241, 8 p.
U.S. Bureau of the Census, 1991, Census of population andhousing, 1990: Public Law 94-171 data for New Jersey:Washington, D.C., U.S. Bureau of the Census [machinereadable data files (CD ROM)].
U.S. Department of Agriculture, 1995, ARS Pesticide PropertiesDatabase (Last update: May 1995): U.S.Department ofAgriculture, Agricultural Research Service. (Accessed July1, 1998, on the World Wide Web at URL http://www.arsusda.gov/rsml/ppdb2.html.)
U. S. Environmental Protection Agency, 1991, Water-qualitycriteria summary Office of Water, Office of Science andTech., Health and Ecological Effects Division (poster).
_____1994, Atrazine, simazine, cyanazine; notice of initiation ofspecial review: Federal Register, v.59, p. 60412-60443(Accessed July 8, 1998, on the world wide web at URLhttp://www.epa.gov/fedrgstr/EPA-PEST/1994/November/Day-23/pr-54.html).
_____1995, Guidance for assessing chemical contaminant datafor use in fish advisories: Volume 1, Fish sampling andanalysis, 2d ed.: Office of Water, EPA 823-R-95-007, 436 p.
____ 1996, Drinking water regulations and health advisories:Office of water, EPA 822-B-96-002, Washington, D.C., Oct.,1996, 16 p.
Ware, G.W., 1994, The pesticide book: Fresno, Calif., ThomsonPublications, 386 p.
Werner, S.L., Burkhardt, M.R., and DeRusseau, S.N., 1996,Methods of analysis by the U.S. Geological Survey NationalWater Quality Laboratory—determination of pesticides inwater by Carbopak-B solid-phase extraction and high-performance liquid chromatography: U.S. GeologicalSurvey Open-File Report 96-216, 42 p.
Zaugg, S.D., Sandstrom, M.W., Smith, S.G., and Fehlberg,K.M., 1995, Methods of analysis by the U.S. GeologicalSurvey National Water Quality Laboratory—determinationof pesticides in water by C-18 solid-phase extraction andcapillary-column gas chromatography/mass spectrometrywith selected-ion monitoring: U.S. Geological SurveyOpen-File Report 95-181, 49 p.
Copies of this report can be purchased from:
U.S. Geological SurveyBranch of Information ServicesBox 25286, Building 810Denver, CO 80225-0286
Information about the NAWQA Programcan be obtained from:
LINJNAWQA Project ChiefU.S. Geological SurveyMountain View Office Park810 Bear Tavern Road, Suite 206West Trenton, NJ 08628
On the web: http://wwwrvares.er.usgs.gov/nawqa/ or http://nj.usgs.gov/nawqa/