relations between sweetened beverage consumption and ... · syndrome, type 2 diabetes, poor oral...
TRANSCRIPT

ORIGINAL ARTICLE
Relations between sweetened beverage consumption and individual,interpersonal, and environmental factors: a 6-year longitudinal studyin German children and adolescents
Sven Schneider1 • Jutta Mata2 • Philipp Kadel1,2
Received: 11 February 2020 / Revised: 28 April 2020 / Accepted: 20 May 2020� The Author(s) 2020
AbstractObjectives This study aims to characterize the consumption of sweetened beverages (SB) among young people in Germany
in terms of individual and interpersonal-environmental correlates.
Methods A representative sample of children and adolescents from Germany was assessed twice, 6 years apart (total
longitudinal sample n = 11,691 children and adolescents aged between 0 and 17 years old; weighted). The relations
between individual and interpersonal-environmental factors at baseline with SB intake 6 years later were analysed using
bivariate and multivariate methods.
Results The majority of children and adolescents in Germany consume sweetened beverages weekly, 23% daily. SB
consumption is particularly high in boys and often accompanied by other unhealthy lifestyle behaviours including a high
level of tobacco and media consumption with a concurrent deficiency in fruit and vegetable consumption. Interpersonal
factors associated with higher sweetened beverage consumption include low socio-economic status, tobacco consumption
of parents, and older maternal age.
Conclusions Research on factors that correlate with sweetened beverage consumption is crucial to design effective
interventions. Our findings underline the importance of complex, multi-level interventions to target sweetened beverage
intake and obesity.
Keywords Soft drinks � Soda � Obesity � Individual factors � Interpersonal factors � Environmental factors
Introduction
Effective promotion of healthy eating is central to fighting
the growing global obesity epidemic. Although reverse
causality always needs to be considered, the majority of
primary studies, reviews, and meta-analyses conclude that
sugar-sweetened beverages (SSBs) intake causes excess
weight gain. They suggest that limiting SSB consumption
will significantly reduce the prevalence of obesity, partic-
ularly among children and adolescents (Keller and Bucher
Della Torre 2015). Longitudinal data show that even one
additional serving of SSBs per day is associated with
greater risk of increased BMI among adolescents (Bogart
et al. 2017). This might be because drinking SSBs does not
lead to feelings of satiety, but rather increases hunger
levels and prompts food consumption (Bogart et al. 2017;
Hennessy et al. 2015). In addition to its role in obesity
development, excessive consumption of SSBs has consis-
tently been associated with the development of metabolic
Electronic supplementary material The online version of thisarticle (https://doi.org/10.1007/s00038-020-01397-0) con-tains supplementary material, which is available to autho-rized users.
& Sven Schneider
Jutta Mata
Philipp Kadel
1 Division Head Child and Health, Medical Faculty Mannheim,
Mannheim Institute for Public Health, Social and Preventive
Medicine, Heidelberg University, Ludolf-Krehl-Straße 7-11,
68167 Mannheim, Germany
2 Health Psychology, University of Mannheim,
68161 Mannheim, Germany
123
International Journal of Public Healthhttps://doi.org/10.1007/s00038-020-01397-0(0123456789().,-volV)(0123456789().,- volV)

syndrome, type 2 diabetes, poor oral health (e.g. dental
caries), and the displacement of milk and calcium in the
diet (Garnett et al. 2013; Mazarello Paes et al. 2015).
The World Health Organization has therefore empha-
sized the ‘‘need to evaluate different behavioural-change
approaches to promote the reduction of free sugars intake;
in particular the intake of sugar-sweetened beverages (…)
especially among children’’ (WHO 2015). Because many
unhealthy dietary habits, such as SSB consumption, are
formed during childhood, research on factors that influence
these behaviours in children and adolescents is of utmost
importance (Mazarello Paes et al. 2015). Understanding the
relative importance of factors that correlate with SSB
consumption is an essential prerequisite to identify and
prioritize those with the greatest potential to reduce SSB
consumption (Pettigrew et al. 2015) and to inform effective
intervention development. This is the starting point for our
study. We consider both that nutrition only constitutes one
part of the health-relevant aspects of an individual’s life-
style and that this lifestyle is the result of social contexts
and environments. In this study, we therefore follow
Mazarello Paes et al.’s (Mazarello Paes 2015) suggestion to
split the potential correlates of sweetened beverages con-
sumption into individual and interpersonal-environmental
variables.
This study aims to characterize the consumption of
sweetened beverages among young people in Germany in
terms of individual and interpersonal-environmental cor-
relates. The majority of studies conducted on this topic
tend to be small, non-representative cohorts with a cross-
sectional design (Mazarello Paes et al. 2015). In contrast,
the analysis presented here is based on a large-scale
nationwide representative dataset featuring a longitudinal
design which allowed consideration of correlates at base-
line and of the main outcome 6 years later.
Methods
Data
The following analyses are based on the ‘‘German Health
Interview and Examination Survey for Children and Ado-
lescents’’ (‘‘KiGGS’’). This longitudinal study is the first
official database to generate comprehensive health data for
cohorts between the ages of 0 and 17 in Germany. It was
commissioned as the largest long-term study on children
and adolescents in Germany by the Federal Ministry of
Health and is managed by the Robert Koch Institute, Berlin
(Holling et al. 2012). To guarantee the study’s represen-
tativeness, a stratified multi-stage probability sample was
selected from the official registers at local residents’ reg-
istration offices. The fieldwork for the baseline survey was
carried out in 167 cities and municipalities by trained
survey teams, each consisting of a physician, a key inter-
viewer, an examiner, and a medical laboratory technician.
The data quality and the nationwide representativeness of
the KiGGS study were subjected to intensive internal and
external quality controls (see Kamtsiuris et al. 2007 for
details). For the 0–10 age group, parents reported about
their children (proxy interviews), while for the 11–17 age
group, both parents and adolescents were interviewed. The
KiGGS baseline survey was conducted between May 2003
and May 2006. The baseline comprised a total sample of
17,641 children and adolescents; 68% of all baseline par-
ticipants took part in the follow-up survey, KiGGS Wave 1.
Wave 1 was carried out between June 2009 and June 2012
as standardized telephone interviews.
For the following analyses, we looked at interpersonal-
environmental factors within a total longitudinal sample of
all nw = 11,691 children and adolescents aged between 0
and 17 years old (nw = weighted; unweighted nuw-= 11,677). Of the 11,992 participants that took part in both
the baseline study and Wave 1315 had to be excluded due
to missing data for soft drink consumption. In addition to
this, we also included individual lifestyle in addition to
interpersonal-environmental correlates for a weighted
sample of nw = 5197 participants aged between 11 and
17 years old (nuw = 4114), as individual lifestyle factors
such tobacco or alcohol consumption were only available
from 11 years on.
Measures
Main outcome: In KiGGS wave 1, sweetened beverage
consumption was measured with two items assessing the
current frequency of children’s and adolescents’ con-
sumption and the number of glasses consumed per day or
per week (Mensink et al. 2018). The question on frequency
referred to ‘‘the last few weeks’’ and read ‘‘How often do
you/does your child drink sweetened beverages like cola,
lemonade, ice tea, or malt beer? Sweetened beverages refer
to sugar-sweetened and artificially sweetened beverages’’.
In this article, we have explicitly used the phrase ‘‘sweet-
ened beverages’’ when referring to our own data (in con-
trast to ‘‘SSBs’’ that were explicitly examined in several
studies referred to in Introduction and Discussion). These
questions and our analyses explicitly excluded the con-
sumption of water, milk, fruit, and vegetable juices. The
available ordinal categories were ‘‘daily’’, ‘‘not daily but at
least once a week’’, ‘‘less often than once a week’’, and
‘‘never’’ (Mensink et al. 2018). Depending on the answer to
the frequency question, participants were either asked for
the average number of glasses of sweetened beverages that
they drank per day or per week. It was explained to par-
ticipants that ‘‘a glass’’ represents 200 ml (6.76 oz);
S. Schneider et al.
123

answers such as ‘‘half a glass per day’’ or ‘‘half a glass per
week’’ (i.e. 100 ml/3.38 oz) were also possible. A
dichotomous variable was created from these self-reports,
indicating if participants drank sweetened beverages at
least once a week (dummy value 1) or less often than once
a week (dummy value 0). In addition, a continuous variable
of consumed glasses per day for every child or adolescent
was computed. The continuous variable was set to zero if
participants answered ‘‘never’’ or ‘‘less often than once a
week’’ to the question on consumption frequency.
All potential correlates were recorded as part of the
KiGGS baseline survey; these included age and gender as
individual variables. Health-related lifestyle behaviours
were also assessed. Namely, self-reported smoking (current
consumption: yes vs. no), alcohol consumption (has par-
ticipant ever consumed alcohol: yes vs. no), media con-
sumption (spending time on a computer, a mobile phone, a
games console or a television; categorized into terciles of
usage time), consumption of fruit, cooked vegetables,
salad, and other raw vegetables (assessed using a food
frequency questionnaire, which also referred to ‘‘the last
few weeks’’; the total of 10frequency categories were
grouped together into three categories [\ 3 times a week;
3–4 times a week;[4 times aweek]) and physical activity
(How often is participant physically active in his or her free
time, getting sweaty or out ofbreath; grouped into three
categories [never; 1–2 times a month up to 3–5 times a
week; and daily]).
In addition, interpersonal information (parents’ socio-
economic status, immigration background, number of sib-
lings, age of mother, and parental tobacco consumption)
and environmental information (size of town of residence,
region of residence) were assessed. The socioeconomic
status (SES) of the participant’s parents was defined as
‘‘low’’, ‘‘medium’’, or ‘‘high’’ based on an established and
validated index (Winkler and Stolzenberg 1999). This
multidimensional aggregated index comprises the dimen-
sions of parents’ education (school education and profes-
sional qualifications), income (net household income of all
household members), and occupational status. In accor-
dance with national standards, immigration background
was deduced from the participant’s country of birth and
nationality and country of birth of the participant’s parents
(Schenk et al. 2008). It was also assessed whether children
or adolescents lived together with siblings in the same
household. Participant’s parents were asked if they were
currently smokers. The size of the participant’s town of
residence was determined using official data on political-
administrative municipality sizes. This distinguishes
between rural areas, small towns, medium-sized towns, and
metropolitan areas (Robert-Koch-Institut 2008). Partici-
pants region of residence was assigned to the western
(former West Germany—Federal Republic of Germany) or
the eastern federal states (former East Germany—German
Democratic Republic, including Berlin).
Statistical analyses
We examined longitudinal associations using the individ-
ual and interpersonal-environmental variables from the
baseline study (KiGGS Baseline) and the measures of
sweetened beverage consumption from the follow-up study
(KiGGS Wave 1). Variables were analysed using descrip-
tive, bivariate, and multivariate methods. For the descrip-
tive and bivariate analyses, data were weighted to adjust
for dropout and make the longitudinal sample representa-
tive for the population in terms of gender, age, region, and
migration background (weight made available by the
Robert Koch Institute). Because the mother’s age is more
strongly associated with the consumption of sweetened
beverages than the father’s age, only mother’s age was
included as a predictor in the analyses to avoid collinearity.
Outcome variables of interest were both dichotomous
(sweetened beverage consumption C once a week or not)
and continuous (number of consumed glasses of sweetened
beverages per day). These different variable types were
analysed in separate models, to ensure the robustness of the
analyses. Pearson Chi-Squared tests were used for the
bivariate analyses with the dichotomous outcome variable;
one-way analysis of variance were used with the continu-
ous outcome variable.
For the multivariate analyses, multivariate logistic
regressions with individual and interpersonal-environmen-
tal variables were conducted to analyse associations with
the dichotomous variable. After that we employed general
linear modelling with the continuous measure of sweetened
beverage consumption. Given the categorical nature of our
independent variables, we specified contrasts comparing
the respective category to a reference category for each
variable. We specified four predefined model variants for
both outcome variables: in Model 1, we analysed socio-
cultural variables for the full sample. Models 2–4 com-
prised the subgroup of all adolescents aged eleven or
above, because most behaviour-related variables were not
assessed in younger age groups. The predefined level of
significance was set at p\ 0.05. All analyses were con-
ducted using SPSS version 25.
Results
The KiGGS Wave 1 data show that of all 6–24-year-olds in
Germany, 59% consumed sweetened beverages regularly,
that is, at least once a week, 23% reported daily con-
sumption. On average, all children and adolescents of the
total sample drank 1.12 ± 2.08 glasses per day, which is
Relations between sweetened beverage consumption and individual, interpersonal, and…
123

equal to approximately 224 ml ± 416 ml per day (me-
dian = 0.29 (58 ml), min–max: 0–20 (4 l) glasses per day).
Individual correlates of sweetened beverageconsumption
Soft drink consumption increased with age; particularly
between the ages of 3–7 and 7–11, reaching a plateau later
on. Older and male adolescents consumed a particularly
high volume of sweetened beverages with particularly high
frequency. In terms of individual lifestyle, above average
consumption of sweetened beverages in KiGGS Wave 1
was accompanied by other behaviours that are detrimental
to health such as high consumption of tobacco, alcohol, and
media, as well as insufficient consumption of fruit and
vegetables in the baseline study. Additionally, adolescents
who reported a high level of physical activity drank sig-
nificantly higher volumes of sweetened beverages more
frequently (Table 1).
Interpersonal and environmental correlatesof sweetened beverage consumption
The descriptive analyses identify clearly defined demo-
graphic subgroups with a particularly high level of con-
sumption, for example, adolescents with a low social status
drank high volumes of sweetened beverages particularly
often. Other interpersonal and environmental factors that
also showed bivariate associations with an increased con-
sumption of sweetened beverages were the presence of
siblings in the household, the mother’s age being com-
paratively high, tobacco consumption of one or both par-
ents, and living in a more rural area (Table 2).
Multivariate analyses of sweetened beverageconsumption
The bivariate correlations described above were analysed
from multiple perspectives using regression models. These
analyses showed that most of the independent variables
previously identified as significant correlates of consump-
tion, remained significant after adjusting for potential
confounders. For example, if the consumption of sweet-
ened beverages is operationalized as a dichotomous vari-
able then age, gender, tobacco and media consumption, and
social status remain significant correlates in an adjusted
logistic regression model (Table 3).
A similar picture emerges when general linear mod-
elling is used: in addition to the correlates previously
mentioned as significant, low to moderate consumption of
vegetables, high degree of physical activity, and parental
tobacco consumption are also significantly associated with
sweetened beverage consumption 6 years later (see
supplementary materials for Table 4 and for additional
analyses stratified by age below and above 11years).
Discussion
Drinking sweetened beverages is a normal part of everyday
life for the majority of German children, adolescents, and
post-adolescents—59% of all 6–24-year-olds in Germany
consume sweetened beverages regularly, 23% even daily.
This high level of consumption is often accompanied by
other unhealthy lifestyle behaviours including a high level
of tobacco and media consumption as well as low fruit and
vegetable intake. Older and male adolescents with a low
social status drink a higher than average amount of
sweetened beverages. Just being male is associated with
drinking about 1 more 200 ml glass of sweetened bever-
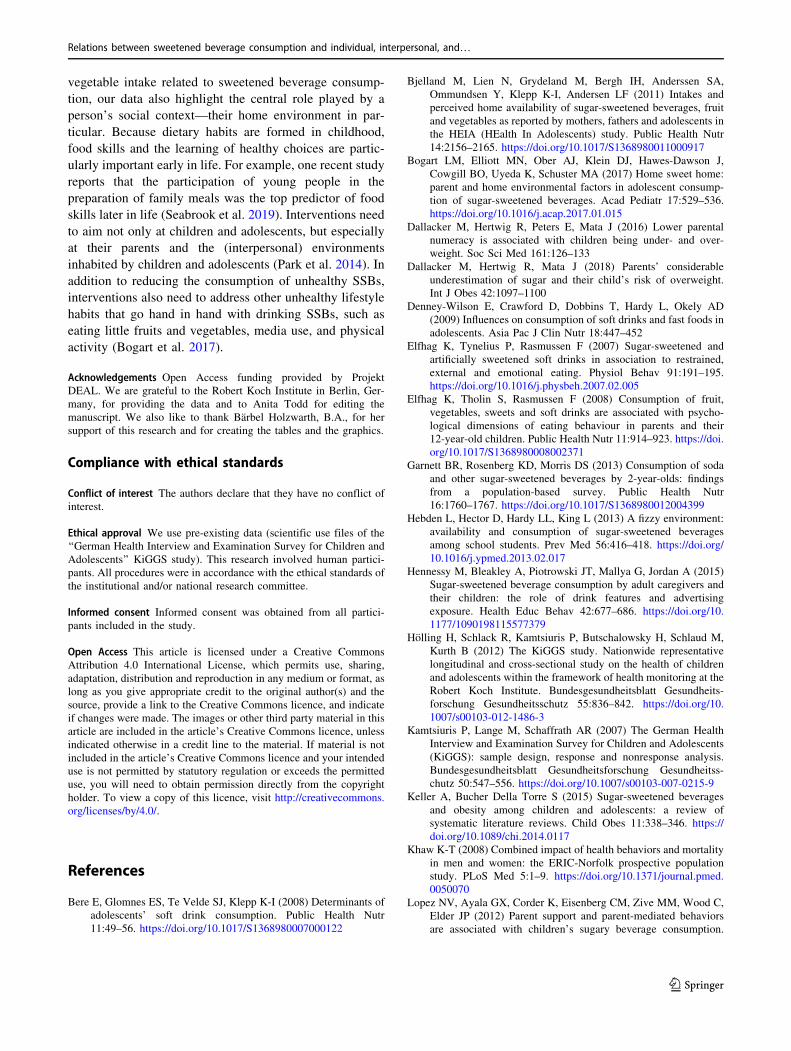
age—per day. Figure 1 provides a synoptic depiction of the
findings on correlates of sweetened beverage consumption.
Principal findings and contribution to the currentstate of research
While a number of our results are in line with previous
findings from other Western countries, they also deliver
important new insights and observations. As previously
reported for other countries, in Germany we have also
found that sweetened beverage consumption increases with
age (Denney-Wilson et al. 2009; Hennessy et al. 2015;
Vereecken et al. 2005). However, our data show a plateau
in late adolescence, while other sources tend to report a
continuous increase until post-adolescence (Bere et al.
2008; Pettigrew et al. 2015; Scully et al. 2017; Van Ansem
et al. 2014). A deciding factor in the higher level of con-
sumption observed in adolescents compared with children
is their increasing autonomy and greater disposable income
(Bere et al. 2008; Pettigrew et al. 2015; Scully et al. 2017;
Van Ansem et al. 2014). Comparable to findings from other
countries, boys in our sample consume sweetened beverage
more frequently and in larger amounts than girls (Bere
et al. 2008; Bjelland et al. 2011; Denney-Wilson et al.
2009; Park et al. 2012, 2013; Scully et al. 2017; Sdrali et al.
2010; Vereecken et al. 2005). Although boys generally
require a higher energy intake than girls, this increased
energy demand is nevertheless best fulfilled with healthy
food. Other reasons discussed for higher levels of SSB
consumption in boys include a lower degree of health
consciousness, less concern with own appearance, and
gender specific socialisation (Vereecken et al. 2005).
This study enters completely new territory by conduct-
ing a comprehensive analysis addressing the ‘‘big four’’
(Khaw 2008) classic characteristics of health-relevant
lifestyle: smoking, alcohol, nutrition, and physical activity.
S. Schneider et al.
123

Table 1 Individual correlates of sweetened beverage consumption in German children and adolescents (nationwide representative KiGGS study,
Germany, 2003–2012)
Correlates n Proportion
(column %)
Sweetened beverage
consumption C once
a week (%)a
p value Sweetened beverage
consumption (200 ml
glasses/day)b
p value
Individual variables
Age at baseline (and mean age
at follow-up [min–max])
p\ 0.001 p\ 0.001
0 to\ 3 years old (AM: 7.1; [6–9]) 1604 13.7 36.2 0.41
3 to\ 7 years old (AM: 10.6; [8–13]) 2447 20.9 52.7 0.65
7 to\ 11 years old (AM: 14.5; [12–17]) 2443 20.9 66.0 1.27
11 to\ 14 years old (AM: 18.1; [16–20] 2037 17.4 67.5 1.47
14–17 years old (AM: 21.6; [19–24]) 3160 27.0 64.5 1.50
Gender p\ 0.001 p\ 0.001
Female 5728 49.0 50.9 0.80
Male 5963 51.0 66.7 1.43
Tobacco consumption p\ 0.001 p\ 0.001
Yes 996 19.3 71.5 2.08
No 4160 80.7 64.1 1.34
Alcohol consumption p = 0.124 p\ 0.001
Yes 3282 63.9 64.8 1.58
No 1854 36.1 67.0 1.31
Media consumption p\ 0.001 p\ 0.001
Low 1645 32.8 57.4 1.13
Medium 1628 32.5 68.4 1.28
High 1743 34.7 71.9 2.01
Fruit consumption p\ 0.001 p\ 0.001
\ 3 times a week 1537 30.7 71.4 1.77
3–4 times a week 903 18.0 68.3 1.57
[ 4 times a week 2564 51.2 60.3 1.22
Consumption of cooked vegetables p = 0.002 p\ 0.001
\ 3 times a week 3523 70.6 66.7 1.54
3–4 times a week 916 18.4 61.8 1.34
[ 4 times a week 552 11.1 60.9 1.00
Consumption of raw vegetables p\ 0.001 p\ 0.001
\ 3 times a week 2348 47.0 67.5 1.72
3–4 times a week 1127 22.5 65.3 1.32
[ 4 times a week 1523 30.5 61.2 1.14
Physical activity p\ 0.001 p\ 0.001
Never 489 9.5 58.6 1.49
1–2 times a month up to 3–5 times a week 3493 68.2 65.2 1.40
Daily 1139 22.2 69.6 1.75
Notes: See Electronic Supplementary Material (ESM) for complete table. Displayed are the bivariate associations of the respective variables with
the dichotomous outcome variable and the continuous outcome variable
The data was weighted with the official longitudinal weight to adjust for dropout and make the longitudinal sample representative for the German
population in terms of gender, age, region, and migration background. Cases are rounded
AM arithmetic meanap values refer to the Pearson Chi-squared testbp values refer to the analyses one-way analysis of variance (ANOVA) which for variables with two categories yields the same result as an
independent samples t test with equal variances assumed. p values refer to the analyses of variance (ANOVA)
Relations between sweetened beverage consumption and individual, interpersonal, and…
123

Previous studies have only addressed individual health-
relevant lifestyle factors related to the consumption of
SSBs. A few studies have reported a positive link between
SSB consumption and tobacco and alcohol consumption
(Park et al. 2012, 2013). Other studies have found a cor-
relation between SSB and media consumption (Mazarello
Paes et al. 2015; Park et al. 2012; Scully et al. 2017).
Individual studies have also observed this behaviour among
primary school children (Lopez et al. 2012; Olafsdottir
et al. 2014) and even in pre-school aged children (Garnett
et al. 2013; Olafsdottir et al. 2014). One particularly
interesting study differentiated television consumption by
weekday and found a particularly strong correlation with
SSB consumption on weekends (Pettigrew et al. 2015).
This could be due to influence of food advertising on
adolescent viewers as well as longer TV exposition times
on weekends, which lead to interruption of physiological
food regulation, e.g. satiety cues (Scully et al. 2017; Ver-
zeletti et al. 2009). For example, snacking while using a
computer is also accompanied by a significant increase in
Table 2 Interpersonal and environmental correlates of sweetened beverage consumption in German children and adolescents (nationwide
representative KiGGS study, Germany, 2003–2012)
Correlates n Proportion
(column %)
Sweetened beverage
consumption C once
a week (%)a
p value Sweetened
beverage
consumption
(glasses/day)b
p value
Interpersonal and environmental variables
Socioeconomic status p\ 0.001 p\ 0.001
Low 3903 33.9 65.9 1.42
Medium 5139 44.7 59.5 1.14
High 2464 21.4 46.4 0.62
Immigration background p\ 0.001 p = 0.031
None 8802 75.5 58.1 1.15
One parent 937 8.0 57.4 0.99
Both parents 1922 16.5 63.8 1.06
Siblings at home p\ 0.001 p = 0.023
None 2466 22.1 54.0 1.04
One or more 8682 77.9 60.5 1.15
Mother’s age p\ 0.001 p\ 0.001
\ 30 years old 1236 10.8 51.1 0.69
C 30 years old 10,257 89.2 59.6 1.17
Tobacco consumption of one or both parents p\ 0.001 p\ 0.001
Yes 5938 51.2 62.5 1.30
No 5660 48.4 55.0 0.94
Size of administrative municipality p = 0.429 p = 0.003
Rural 2129 18.2 60.0 1.26
Small town 3220 27.5 59.1 1.13
Medium-sized town 3405 29.1 57.9 1.10
Metropolitan area 2937 25.1 59.2 1.04
Region of residence p = 0.005 p = 0.016
West (former FRG) 9702 83.0 59.5 1.10
East (former GDR) 1989 17.0 56.1 1.23
Notes: See Electronic Supplementary Material (ESM) for complete table. Displayed are the bivariate associations of the respective variables with
the dichotomous outcome variable and the continuous outcome variable. The data was weighted with the official longitudinal weight to adjust for
dropout and make the longitudinal sample representative for the German population in terms of gender, age, region, and migration background.
Cases are roundedap values refer to the Pearson Chi-squared testbp values refer to the one-way analysis analyses of variance (ANOVA) which for variables with two categories yields the same result as an
independent samples t test with equal variances assumed. p values refer to the analyses of variance (ANOVA)
S. Schneider et al.
123

Table3
LogisticRegressionModelsforsw
eetened
beverageconsumptionin
German
childrenandadolescents
(nationwiderepresentativeKiGGSstudy,Germany,2003–2012)
Correlates
Childrenandadolescents
Adolescents
Whole
cohort
Only
childrenaged
11andover
Model
1Model
2Model
3Model
4
Adjusted
OR[95%
CI]
pvalue
Adjusted
OR[95%
CI]
pvalue
Adjusted
OR[95%
CI]
pvalue
Adjusted
OR[95%
CI]
pvalue
Individualvariables
Age
0to\
3years
old
Reference
3to\
7years
old
2.00
[1.76;2.29]
p\
0.001
7to\
11years
old
3.56
[3.10;4.09]
p\
0.001
11to\
14years
old
3.76
[3.24;4.37]
p\
0.001
Reference
Reference
14–17years
old
3.15
[2.73;3.65]
p\
0.001
0.82
[0.71;0.95]
p=0.007
0.78
[0.66;0.94]
p=0.007
Gender
Fem
ale
Reference
Reference
Reference
Male
2.06
[1.90;2.22]
p\
0.001
3.02
[2.61;3.49]
p\
0.001
2.77
[2.38;3.23]
p\
0.001
Tobacco
consumptiona
Yes
1.34
[1.09;1.64]
p=0.006
1.48
[1.19;1.83]
p\
0.001
No
Reference
Reference
Alcoholconsumptionb
Yes
0.84
[0.73;0.98]
p=0.023
0.98
[0.81;1.17]
p=0.783
No
Reference
Reference
Media
consumption
Low
Reference
Reference
Medium
1.54
[1.31;1.81]
p\
0.001
1.29
[1.09;1.53]
p=0.003
High
1.77
[1.49;2.11]
p\
0.001
1.28
[1.06;1.54]
p=0.010
Fruitconsumption
\3times
aweek
Reference
Reference
3–4times
aweek
1.03
[0.82;1.28]
p=0.829
1.15
[0.91;1.45]
p=0.235
[4times
aweek
0.76
[0.64;0.91]
p=0.002
0.89
[0.74;1.07]
p=0.206
Consumptionofraw
vegetablesc
\3times
aweek
Reference
Reference
3–4times
aweek
0.92
[0.76;1.10]
p=0.345
0.95
[0.79;1.15]
p=0.593
[4times
aweek
0.80
[0.67;0.94]
p=0.007
0.87
[0.73;1.04]
p=0.123
Physicalactivity
Never
Reference
Reference
1–2times
amonth
upto
3–5times
aweek
1.43
[1.12;1.83]
p=0.004
1.12
[0.86;1.44]
p=0.403
Daily
1.89
[1.43;2.50]
p\
0.001
1.27
[0.95;1.71]
p=0.108
Interpersonalandenvironmentalvariables
Socioeconomic
status
Low
Reference
Reference
Reference
Relations between sweetened beverage consumption and individual, interpersonal, and…
123

Table3(continued)
Correlates
Childrenandadolescents
Adolescents
Whole
cohort
Only
childrenaged
11andover
Model
1Model
2Model
3Model
4
Adjusted
OR[95%
CI]
pvalue
Adjusted
OR[95%
CI]
pvalue
Adjusted
OR[95%
CI]
pvalue
Adjusted
OR
[95%
CI]
pvalue
Medium
0.82
[0.74;0.92]
p\
0.001
0.83
[0.69;1.01]
p=0.068
0.86
[0.71;1.05]
p=0.148
High
0.53
[0.47;0.60]
p\
0.001
0.50
[0.41;0.63]
p\
0.001
0.55
[0.44;0.68]
p\
0.001
Tobacco
consumptionofoneorboth
parents
Yes
1.25
[1.15;1.35]
p\
0.001
1.17
[1.01;1.35]
p=0.038
1.09
[0.94;1.26]
p=0.275
No
Reference
Reference
Regionofresidence
West(form
erFRG)
Reference
Reference
Reference
East(form
erGDR,includingBerlin)
0.98
[0.90;1.07]
p=0.706
0.80
[0.68;0.93]
p=0.004
0.78
[0.66;0.92]
p=0.002
N10,981
3589
3589
3589
CoxandSnellR2
0.092
0.083
0.035
0.095
Nagelkerkes
R2
0.123
0.113
0.048
0.129
Notes:Only
significantcorrelates
aredisplayed.See
Electronic
Supplementary
Material(ESM)forcomplete
table.Outcome:
Sweetened
beverageconsumption(asdichotomousvariable:at
leastonce
aweek=1versusnever
orless
often
than
once
aweek=0)
Note
that
self-reported
lifestyle
behaviours
wereonly
available
forchildren11years
andolder
aCurrentconsumption
bHas
childoradolescentever
consumed
alcohol?
cIncludingsalad
S. Schneider et al.
123

SSB consumption (Verzeletti et al. 2009). Findings on the
relationship between SSB consumption and eating fruits
and vegetables are inconsistent (Park et al. 2012; Ranjit
et al. 2010; Scully et al. 2017). In contrast to our German
study population, data from the USA and Greece point to a
negative correlation between SSB consumption and phys-
ical activity (Park et al. 2012; Sdrali et al. 2010).
Eating habits such as SSB consumption do not evolve in
isolation, but within a micro-environment, which is pri-
marily influenced by interpersonal relationships with fam-
ily members, and within a macro-environment (Schneider
et al. 2017; Van Ansem et al. 2014). We have already
explored in detail how, under certain circumstances, these
micro- and macro-environments can result in what is
known as an obesogenic environment (Schneider et al.
2017). The home environment represents an important part
of a person’s micro-environment. Parents are their
children’s nutritional gatekeepers, their knowledge and
choices determine what their children eat (e.g. Dallacker
et al. 2016; 2018). Children have little control over pur-
chases and generally eat the food that is available at home
(Lopez et al. 2012; Elfhag et al. 2008).
One particularly striking finding from our data is that the
consumption of sweetened beverages is about twice as high
for children from low-status families compared to children
from higher status families. This classic social gradient—
usually measured using the socio-economic status of the
parents—has been well documented (Bere et al. 2008;
Garnett et al. 2013; Hebden et al. 2013; Lopez et al. 2012;
Lundeen et al. 2018; Mazarello Paes et al. 2015; Park et al.
2014; Scully et al. 2017; Sdrali et al. 2010; Totland et al.
2013; Van Ansem et al. 2014). Parents could use SSBs as
coping mechanisms for emotional discomfort in their
children. Garnett et al. (2013) suggest another parental
Sweetenedbeverages
consumption
Immigration background
Tobacco consumptionof one or both
parents
Age
Size ofadministrative municipality
Socio-economic
status
Siblings at home
Gender1
Tobacco consumption
Physicalactivity
Media consumption
Alcoholconsumption
Fruitconsumption
Consumptionof raw
vegetables
Consumptionof cookedvegetables
Region ofresidence2
MultivariateBivariate
Positive correlation
Negative correlation
No correlation
Mother‘sage
- -
-
+ + +
+
-
+
+
+
+ +
+
+ +
- -
-
+ +
+ +
+ +
+ -
- -
Fig. 1 Individual and interpersonal-environmental correlates of
sweetened beverage consumption (bivariate and multivariate associ-
ations with the independent variable ‘‘glasses per day’’) among
children and adolescents in Germany. Notes: Associations between
behaviour-related variables and sweetened beverage consumption
refer to the cohort of children aged 11 and over (dark grey circular
area); all other associations refer to the whole cohort (light grey
circular area). See method section for details. If one of the categories
showed a significant contrast to the respective reference category,
significance is displayed. 1Male. 2Former German Democratic
Republic (Nationwide representative KiGGS study, Germany,
2003–2012)
Relations between sweetened beverage consumption and individual, interpersonal, and…
123

motive for this finding, namely that the introduction of
SSBs may be a mechanism for coping with food insecurity
and that SSBs are used as a means to quell behavioural
agitation. Although the argument of limited economic
resources (Vereecken et al. 2005) may play a subjective
role for parents when shopping, de facto, tap water, bottled
carbonated water, non-carbonated mineral water, or other
alternatives such as tea and flavoured calorie-free water are
generally cheaper than SSBs.
Interestingly, it seems that mothers play a more impor-
tant role in SSB consumption than fathers—a stronger
correlation was found between SSB consumption and the
mother’s behaviour than with that of the father (Bjelland
et al. 2011); this finding holds equally true for both, girls
and boys (Elfhag et al. 2008). Furthermore, estimations
regarding the availability of SSBs within the family home
tend to correspond more closely between mother and child
than between father and child, indicating that mothers have
better knowledge than fathers of the food selection actually
available in the home (Totland et al. 2013). Other publi-
cations also emphasize the role of the mother as a role
model (Bjelland et al. 2011; Denney-Wilson et al. 2009) for
their children’s dietary behaviour. A study on regulatory
food parenting has shown that mothers play a greater role in
monitoring, regulating, and controlling their children’s
eating habits than fathers (Melbye et al. 2016). We did not
replicate previous findings in which a higher level of SSB
consumption was observed among the children of younger
mothers (Garnett et al. 2013; Mazarello Paes et al. 2015); on
the contrary, in our data set, having an older mother was
associated with higher consumption. As in previous studies,
our data are also inconclusive with regard to the signifi-
cance of siblings (Mazarello Paes et al. 2015; Park et al.
2014) and the region of residence (Garnett et al. 2013).
Limitations and strengths
When interpreting the KiGGS study, it is important to
consider the definition of sweetened beverages, a potential
social desirability bias, and residual confounding factors.
There is currently no internationally agreed standard
definition for SSBs (Mazarello Paes et al. 2015). As in
most studies, the method we use to operationalize our data
also meant that other drinks such as sweetened milk,
sweetened coffee-based drinks, and sweetened veg-
etable juice were excluded. Likewise, as done in many
comparable studies, we also excluded various types of
sweetened fruit juice and sports drinks. Flavoured sports
beverages usually contain large amounts of added sugar
(Ranjit et al. 2010); however, studies have shown that
adolescent consumers and their parents tend to subjectively
view the health effects of this special type of sweetened
beverage differently than other soft drinks, resulting in
positive associations between consuming sports beverages
and several healthy lifestyle practices (Hennessy et al.
2015; Ranjit et al. 2010).
Unfortunately, the food frequency questionnaire used
here did not allow for the extraction of specific data
regarding the consumption of calorie-reduced drinks (e.g.
low calorie, practically calorie-free, ‘‘diet’’ soft drinks).
However, given that in Germany more than 80% of all soft
drinks consumed by adolescents are classic SSBs (Mensink
et al. 2018), this limitation likely has little impact on our
findings. Furthermore, several of the health risks mentioned
in the Introduction, such as development of metabolic syn-
drome, type 2 diabetes, or the displacement of milk and
calcium in the diet are still equally applicable when sugar-
free versions of soft drinks are consumed. Lastly, prospec-
tive cohort studies have demonstrated a positive correlation
between the consumption of artificial sweeteners and weight
gain. It is proposed that the regular exposure to sweet fla-
vours, regardless of their origin, leads to a persisting pref-
erence for sweet things and thus a preference for high-calorie
food. This is accompanied by the fact that artificial sweet-
eners (e.g. aspartame) also function as appetite stimulants
(Elfhag et al. 2007). It should be mentioned that the role of
artificially sweetened beverages for the development of
obesity is controversially discussed, particularly in industry-
funded studies (e.g. Peters et al. 2014).
With a total of 16 independent variables, we were able to
consider more variables than most other comparable stud-
ies. Nevertheless, a risk remains that the regressions pre-
sented here may be affected by residual confounding factors
from unmeasured but relevant influences. We also tested for
multicollinearity: the highest correlation between the
independent variables (included in Table 3 and in Table 4
(see supplementary materials), models 2–4) was r = .56 and
thus well below common thresholds for multicollinearity.
Finally, as with any epidemiological questionnaire-based
study, typical social desirability bias cannot be completely
eliminated in the reporting of eating habits. The main
strengths of this study are its large, representative sample
size, the extensive quality assurance measures implemented
in the field work, its longitudinal design, and the compre-
hensive consideration of health-relevant lifestyle practices.
Conclusions
Health and health inequalities start to develop very early in
life due to the complex interactions of cumulative risks and
resources at the individual, meso-, and macro-level
(Seabrook and Avison 2012). Sweetened beverages are one
piece of this puzzle. We show that various dimensions of
an unhealthy lifestyle occur accumulatively. Our findings
call for complex, multi-level interventions. Next to the role
of individual risk behaviours such as smoking or low
S. Schneider et al.
123
vegetable intake related to sweetened beverage consump-
tion, our data also highlight the central role played by a
person’s social context—their home environment in par-
ticular. Because dietary habits are formed in childhood,
food skills and the learning of healthy choices are partic-
ularly important early in life. For example, one recent study
reports that the participation of young people in the
preparation of family meals was the top predictor of food
skills later in life (Seabrook et al. 2019). Interventions need
to aim not only at children and adolescents, but especially
at their parents and the (interpersonal) environments
inhabited by children and adolescents (Park et al. 2014). In
addition to reducing the consumption of unhealthy SSBs,
interventions also need to address other unhealthy lifestyle
habits that go hand in hand with drinking SSBs, such as
eating little fruits and vegetables, media use, and physical
activity (Bogart et al. 2017).
Acknowledgements Open Access funding provided by Projekt
DEAL. We are grateful to the Robert Koch Institute in Berlin, Ger-
many, for providing the data and to Anita Todd for editing the
manuscript. We also like to thank Barbel Holzwarth, B.A., for her
support of this research and for creating the tables and the graphics.
Compliance with ethical standards
Conflict of interest The authors declare that they have no conflict of
interest.
Ethical approval We use pre-existing data (scientific use files of the
‘‘German Health Interview and Examination Survey for Children and
Adolescents’’ KiGGS study). This research involved human partici-
pants. All procedures were in accordance with the ethical standards of
the institutional and/or national research committee.
Informed consent Informed consent was obtained from all partici-
pants included in the study.
Open Access This article is licensed under a Creative Commons
Attribution 4.0 International License, which permits use, sharing,
adaptation, distribution and reproduction in any medium or format, as
long as you give appropriate credit to the original author(s) and the
source, provide a link to the Creative Commons licence, and indicate
if changes were made. The images or other third party material in this
article are included in the article’s Creative Commons licence, unless
indicated otherwise in a credit line to the material. If material is not
included in the article’s Creative Commons licence and your intended
use is not permitted by statutory regulation or exceeds the permitted
use, you will need to obtain permission directly from the copyright
holder. To view a copy of this licence, visit http://creativecommons.
org/licenses/by/4.0/.
References
Bere E, Glomnes ES, Te Velde SJ, Klepp K-I (2008) Determinants of
adolescents’ soft drink consumption. Public Health Nutr
11:49–56. https://doi.org/10.1017/S1368980007000122
Bjelland M, Lien N, Grydeland M, Bergh IH, Anderssen SA,
Ommundsen Y, Klepp K-I, Andersen LF (2011) Intakes and
perceived home availability of sugar-sweetened beverages, fruit
and vegetables as reported by mothers, fathers and adolescents in
the HEIA (HEalth In Adolescents) study. Public Health Nutr
14:2156–2165. https://doi.org/10.1017/S1368980011000917
Bogart LM, Elliott MN, Ober AJ, Klein DJ, Hawes-Dawson J,
Cowgill BO, Uyeda K, Schuster MA (2017) Home sweet home:
parent and home environmental factors in adolescent consump-
tion of sugar-sweetened beverages. Acad Pediatr 17:529–536.
https://doi.org/10.1016/j.acap.2017.01.015
Dallacker M, Hertwig R, Peters E, Mata J (2016) Lower parental
numeracy is associated with children being under- and over-
weight. Soc Sci Med 161:126–133
Dallacker M, Hertwig R, Mata J (2018) Parents’ considerable
underestimation of sugar and their child’s risk of overweight.
Int J Obes 42:1097–1100
Denney-Wilson E, Crawford D, Dobbins T, Hardy L, Okely AD
(2009) Influences on consumption of soft drinks and fast foods in
adolescents. Asia Pac J Clin Nutr 18:447–452
Elfhag K, Tynelius P, Rasmussen F (2007) Sugar-sweetened and
artificially sweetened soft drinks in association to restrained,
external and emotional eating. Physiol Behav 91:191–195.
https://doi.org/10.1016/j.physbeh.2007.02.005
Elfhag K, Tholin S, Rasmussen F (2008) Consumption of fruit,
vegetables, sweets and soft drinks are associated with psycho-
logical dimensions of eating behaviour in parents and their
12-year-old children. Public Health Nutr 11:914–923. https://doi.
org/10.1017/S1368980008002371
Garnett BR, Rosenberg KD, Morris DS (2013) Consumption of soda
and other sugar-sweetened beverages by 2-year-olds: findings
from a population-based survey. Public Health Nutr
16:1760–1767. https://doi.org/10.1017/S1368980012004399
Hebden L, Hector D, Hardy LL, King L (2013) A fizzy environment:
availability and consumption of sugar-sweetened beverages
among school students. Prev Med 56:416–418. https://doi.org/
10.1016/j.ypmed.2013.02.017
Hennessy M, Bleakley A, Piotrowski JT, Mallya G, Jordan A (2015)
Sugar-sweetened beverage consumption by adult caregivers and
their children: the role of drink features and advertising
exposure. Health Educ Behav 42:677–686. https://doi.org/10.
1177/1090198115577379
Holling H, Schlack R, Kamtsiuris P, Butschalowsky H, Schlaud M,
Kurth B (2012) The KiGGS study. Nationwide representative
longitudinal and cross-sectional study on the health of children
and adolescents within the framework of health monitoring at the
Robert Koch Institute. Bundesgesundheitsblatt Gesundheits-
forschung Gesundheitsschutz 55:836–842. https://doi.org/10.
1007/s00103-012-1486-3
Kamtsiuris P, Lange M, Schaffrath AR (2007) The German Health
Interview and Examination Survey for Children and Adolescents
(KiGGS): sample design, response and nonresponse analysis.
Bundesgesundheitsblatt Gesundheitsforschung Gesundheitss-
chutz 50:547–556. https://doi.org/10.1007/s00103-007-0215-9
Keller A, Bucher Della Torre S (2015) Sugar-sweetened beverages
and obesity among children and adolescents: a review of
systematic literature reviews. Child Obes 11:338–346. https://
doi.org/10.1089/chi.2014.0117
Khaw K-T (2008) Combined impact of health behaviors and mortality
in men and women: the ERIC-Norfolk prospective population
study. PLoS Med 5:1–9. https://doi.org/10.1371/journal.pmed.
0050070
Lopez NV, Ayala GX, Corder K, Eisenberg CM, Zive MM, Wood C,
Elder JP (2012) Parent support and parent-mediated behaviors
are associated with children’s sugary beverage consumption.
Relations between sweetened beverage consumption and individual, interpersonal, and…
123

J Acad Nutr Diet 112:541–547. https://doi.org/10.1016/j.jand.
2011.11.013
Lundeen EA, Park S, Onufrak S, Cunningham S, Blanck HM (2018)
Adolescent sugar-sweetened beverage intake is associated with
parent intake, not knowledge of health risks. Am J Health
Promot 32:1661–1670. https://doi.org/10.1177/
0890117118763008
Mazarello Paes V, Hesketh K, O’Malley C, Moore H, Summerbell C,
Griffin S, Van Sluijs E, Ong K, Lakshman R (2015) Determi-
nants of sugar-sweetened beverage consumption in young
children: a systematic review. Obes Rev 16:903–913. https://
doi.org/10.1111/obr.12310
Melbye EL, Bergh IH, Hausken SE, Sleddens EF, Glavin K, Lien N,
Bjelland M (2016) Adolescent impulsivity and soft drink
consumption: the role of parental regulation. Appetite
96:432–442. https://doi.org/10.1016/j.appet.2015.09.040
Mensink G, Schienkiewitz A, Rabenberg M, Borrmann A, Richter A,
Haftenberger M (2018) Consumption of sugary soft drinks
among children and adolescents in Germany: results of the cross-
sectional KiGGS Wave 2 study and trends. J Health Monit
3(1):32–39. https://doi.org/10.17886/rki-gbe-2018-007
Olafsdottir S, Eiben G, Prell H, Hense S, Lissner L, Marild S, Reisch
L, Berg C (2014) Young children’s screen habits are associated
with consumption of sweetened beverages independently of
parental norms. Int J Public Health 59:67–75. https://doi.org/10.
1007/s00038-013-0473-2
Park S, Sherry B, Foti K, Blanck HM (2012) Self-reported academic
grades and other correlates of sugar-sweetened soda intake
among US adolescents. J Acad Nutr Diet 112:125–131. https://
doi.org/10.1016/j.jada.2011.08.045
Park S, Blanck HM, Sherry B, Foti K (2013) Problem behavior,
victimization, and soda intake in high school students. Am J
Health Behav 37:414–421. https://doi.org/10.5993/AJHB.37.3.
14
Park S, Pan L, Sherry B, Li R (2014) The association of sugar-
sweetened beverage intake during infancy with sugar-sweetened
beverage intake at 6 years of age. Pediatrics 134:S56–S62.
https://doi.org/10.1542/peds.2014-0646
Peters JC, Wyatt HR, Foster GD, Pan Z, Wojtanowski AC, Vander
Veur SS, Herring SJ, Brill C, Hill JO (2014) The effects of water
and non-nutritive sweetened beverages on weight loss during a
12-week weight loss treatment program. Obesity 22:1415–1421.
https://doi.org/10.1002/oby.20737
Pettigrew S, Jongenelis M, Chapman K, Miller C (2015) Factors
influencing the frequency of children’s consumption of soft
drinks. Appetite 91:393–398. https://doi.org/10.1016/j.appet.
2015.04.080
Ranjit N, Evans MH, Byrd-Williams C, Evans AE, Hoelscher DM
(2010) Dietary and activity correlates of sugar-sweetened
beverage consumption among adolescents. Pediatrics
126:e754–e761. https://doi.org/10.1542/peds.2010-1229
Robert-Koch-Institut (2008) Kinder-und Jugendgesundheitssurvey
2003–2006. Public Use File KiGGS, Berlin
Schenk L, Neuhauser H, Ellert U, Poethko-Muller C, Kleiser C,
Mensink G (2008) Kinder-und Jugendgesundheitssurvey
(KiGGS 2003-2006): Kinder und Jugendliche mit Migrationsh-
intergrund in Deutschland. Robert-Koch-Institut, Berlin
Schneider S, Diehl K, Gorig T, Schilling L, De Bock F, Hoffmann K,
Albrecht M, Sonntag D, Fischer JJB (2017) Contextual influ-
ences on physical activity and eating habits-options for action on
the community level. BMC Public Health 17:760. https://doi.org/
10.1186/s12889-017-4790-x
Scully M, Morley B, Niven P, Crawford D, Pratt IS, Wakefield M
(2017) Factors associated with high consumption of soft drinks
among Australian secondary-school students. Public Health Nutr
20:2340–2348. https://doi.org/10.1017/S1368980017000118
Sdrali D, Anisiadou M, Goussia-Rizou M, Costarelli V (2010)
Adolescents’ soft drinks consumption in family environment: a
case study in Northern Greece. Int J Consum Stud 34:684–690.
https://doi.org/10.1111/j.1470-6431.2010.00925.x
Seabrook JA, Avison WR (2012) Socioeconomic status and cumu-
lative disadvantage processes across the life course: implications
for health outcomes. Can Rev Sociol 49:50–68. https://doi.org/
10.1111/j.1755-618X.2011.01280.x
Seabrook JA, Dworatzek PD, Matthews JI (2019) Predictors of Food
Skills in University Students. Can J Diet Pract Res 80:205–208.
https://doi.org/10.3148/cjdpr-2019-011
Totland TH, Lien N, Bergh IH, Bjelland M, Gebremariam MK, Klepp
K-I, Andersen LF (2013) The relationship between parental
education and adolescents’ soft drink intake from the age of
11–13 years, and possible mediating effects of availability and
accessibility. Br J Nutr 110:926–933. https://doi.org/10.1017/
S0007114512005946
Van Ansem WJ, Van Lenthe FJ, Schrijvers CT, Rodenburg G, Van de
Mheen D (2014) Socio-economic inequalities in children’s snack
consumption and sugar-sweetened beverage consumption: the
contribution of home environmental factors. Br J Nutr
112:467–476. https://doi.org/10.1017/S0007114514001007
Vereecken CA, Inchley J, Subramanian S, Hublet A, Maes L (2005)
The relative influence of individual and contextual socio-
economic status on consumption of fruit and soft drinks among
adolescents in Europe. Eur J Public Health 15:224–232. https://
doi.org/10.1093/eurpub/cki005
Verzeletti C, Maes L, Santinello M, Vereecken CA (2009) Soft drink
consumption in adolescence: associations with food-related
lifestyles and family rules in Belgium Flanders and the Veneto
Region of Italy. Eur J Public Health 20:312–317. https://doi.org/
10.1093/eurpub/ckp150
WHO (2015) Guideline: sugars intake for adults and children. World
Health Organization, Geneva
Winkler J, Stolzenberg H (1999) Der Sozialschichtindex im Bundes-
Gesundheitssurvey. Gesundheitswesen 61:178–183
Publisher’s Note Springer Nature remains neutral with regard to
jurisdictional claims in published maps and institutional affiliations.
S. Schneider et al.
123