relationship between blood lactate and …
TRANSCRIPT

RELATIONSHIP BETWEEN
BLOOD LACTATE AND ELECTROMYOGRAPHY
DURING AEROBIC EXERCISE
by
RONALD LEE SNARR JR.
PHILLIP BISHOP, COMMITTEE CHAIR
MICHAEL R. ESCO, COMMITTEE CO-CHAIR
MICHAEL FEDEWA
RYAN EARLEY
JOHN HIGGINBOTHAM
A DISSERTATION
Submitted in partial fulfillment of the requirements
for the degree of Doctor of Philosophy
in the Department of Kinesiology
in the Graduate School of
The University of Alabama
TUSCALOOSA, ALABAMA
2017

Copyright Ronald Snarr 2017
ALL RIGHTS RESERVED

ii
ABSTRACT
The assessment of lactate threshold (LT) is an important measurement to prescribe
training intensities and monitor chronic adaptations in athletes. A non-invasive method,
electromyography (EMG), has been suggested as an alternative approach to LT testing. Three
experiments determined the ability of EMG incorporated into compression shorts to estimate LT,
effect of exercise on LT and EMG threshold (EMGT), and determined the most appropriate
filtering method of the EMG signal to estimate LT. In the first investigation, participants
performed an incremental exercise test while blood lactate and EMG were measured. EMG
displayed no differences from blood lactate in the ability to predict LT (p = 0.08). EMGT and LT
showed a moderate correlation (r = 0.68, p = 0.01) between the determination of work rates. The
EMGT occurred at the same stage of the incremental test as LT in 11 out of the 13 participants
(85%). No differences were seen between percentage of maximal oxygen consumption or
percentage of maximal heart rate between LT and EMGT. In the second study, the effect of
exercise on LT and EMGT measurement was evaluated. Participants completed two maximal
exercise tests separated by 30-minutes of exercise. Individual agreement demonstrated that pre-
and post-exercise LT occurred at the same work rate in 5 of 10 participants; while pre- and post-
EMGT occurred at the same work rate in 6 of 10 participants. Results indicated no significant
difference between the work rates of the pre-exercise LT and EMGT (0.43), although post-trial
LT was significantly lower than post-trial EMGT (p = 0.007). No difference in test stage were
seen between the pre- and post-exercise EMGT; however, post-trial LT occurred at a lower work
rate as compared to pre-trial LT (p = 0.03). In the final study, four popular methods of EMG

iii
signal transformation were examined in order to determine their effectiveness in estimating LT.
The methods used were root mean square (10- and 60-second epochs), 60- second Smoothing,
and 60-secons peak-amplitude averaging. Results indicated no differences in the ability of any
signal processing variations to predict LT or in relation to %VO2peak at each threshold level. In
conclusion, EMG has been demonstrated to be a viable tool to estimate LT and may provide a
reliable low-cost, non-invasive method of prescribing training intensities based upon EMGT
testing.

iv
DEDICATION
Dedicated to my Mom and the rest of my family and friends who have provided me with
the much needed support throughout my academic career. Thank you for all you have done. I am
truly grateful for you being there for me and I cannot express how appreciative I am of you.

v
LIST OF ABBREVIATIONS
AT anaerobic threshold
ATHOS wearable electromyography compression shorts
Dmax maximal computational distance of two best fit lines
EMG electromyography
EMGT electromyographical threshold
[La] blood lactate concentration
LT lactate threshold
MLSS maximal lactate steady state
RMS root mean square
VO2peak peak oxygen consumption
VL vastus lateralis
VT ventilatory threshold

vi
ACKNOWLEDGEMENTS
There are several people that have contributed to the construction and completion of this
dissertation, and if not for them, this project would not exist. First, I would like to acknowledge
all of the participants who willingly participated in this study. Next, I would like to thank the
most crucial members of my team who contributed their time and knowledge in order to
complete the data collection throughout this entire dissertation. Without their help, this
dissertation would not have been able to be completed. Those two individuals are Ashleigh
Hallmark and Danilo Tolusso. Ashleigh has helped me throughout every project while obtaining
my Ph.D. and without her assistance these projects would not have been completed. I am forever
grateful. I would also like to thank all the undergraduates and graduate students who assisted
with data collection throughout this process: Tyler Williams, Alyssa Delia, Megan McCorkle,
Lindsay Grosz, Kimberly Still, and Ariel Rearick. A faculty member who belongs to a
department outside of kinesiology agreed, without hesitation, to join the dissertation committee
when I requested his assistance was Dr. John Higginbotham. I appreciate your expertise and time
willing to assist me to complete this dissertation. I would also like to thank Dr. Ryan Earley for
agreeing to be a member of this dissertation committee. You have been extremely supportive and
helpful every step along the way. In addition, I would like to thank Dr. Michael Fedewa. Dr.
Fedewa was always willing to share new ideas and contribute time and energy to this project.
Finally, I would like to thank the co-chairs of this dissertation, Dr. Philip Bishop and Dr. Michael
Esco. Dr. Bishop has taught me a great deal about research and exercise physiology. He has
always been willing to help and I have enjoyed working with him over these past couple years.

vii
Dr. Michael Esco, in my opinion, has been the most influential person in my academic career.
Without him, I would not have been able to complete a Ph.D. He was willing to give me a
chance to complete my masters at AUM and has shown me a path I had not considered as a
college professor. He has always been there for me and is the hardest working and positive
person I know and has always encouraged me to be the best I can be. Thank you for being my
mentor.

viii
CONTENTS
ABSTRACT .................................................................................................................................... ii
DEDICATION ............................................................................................................................... iv
LIST OF ABBREVIATIONS ..........................................................................................................v
ACKNOWLEDGEMENTS ........................................................................................................... vi
LIST OF TABLES ...........................................................................................................................x
LIST OF FIGURES ....................................................................................................................... xi
CHAPTER 1 INTRODUCTION .....................................................................................................1
PURPOSES AND HYPOTHESES......................................................................................6
SIGNIFICANCE OF THE DISSERTATION .....................................................................7
REFERENCES ....................................................................................................................8
CHAPTER 2 VALIDITY OF WEARABLE ELECTROMYOGRAPHICAL
COMPRESSION SHORTS TO PREDICT LACTATE THRESHOLD DURING
INCREMENTAL EXERCISE IN HEALTHY PARTICIPANTS ................................................11
ABSTRACT .......................................................................................................................11
INTRODUCTION .............................................................................................................12
METHODS ........................................................................................................................14
RESULTS ..........................................................................................................................18
DISCUSSION ....................................................................................................................21
PRACTICAL APPLICATIONS ........................................................................................25
REFERENCES ..................................................................................................................26

ix
CHAPTER 3 AGREEMENT BETWEEN LACTATE AND ELECTROMYOGRAPHICAL
THRESHOLDS FOLLOWING STEADY-STATE EXERCISE IN UNTRAINED HEALTHY
PARTICIPANTS ...........................................................................................................................29
ABSTRACT .......................................................................................................................29
INTRODUCTION .............................................................................................................30
.
METHODS ........................................................................................................................31
RESULTS ..........................................................................................................................36
DISCUSSION ....................................................................................................................46
PRACTICAL APPLICATIONS ........................................................................................51
REFERENCES ..................................................................................................................52
CHAPTER 4 DETERMINATION OF THE BEST ELECTROMYOGRAPHICAL SIGNAL
ANALYSIS FOR ESTIMATING LACTATE THRESHOLD......................................................55
ABSTRACT .......................................................................................................................55
INTRODUCTION .............................................................................................................56
.
METHODS ........................................................................................................................58
RESULTS ..........................................................................................................................62
DISCUSSION ....................................................................................................................63
PRACTICAL APPLICATIONS ........................................................................................67
REFERENCES ..................................................................................................................67
CHAPTER 5 CONCLUSION........................................................................................................70
APPENDIX ....................................................................................................................................72
x
LIST OF TABLES
Table 2.1. Descriptive statistics of the study participants ..............................................................15
Table 2.2. Individual and group mean ± SD values among the participants for %VO2peak and
%HRmax values at LT (n = 10) .......................................................................................................19
Table 3.1. Individual and group mean ± SD values among the participants for %VO2peak
values at EMGT and LT (n = 10) ...................................................................................................41
Table 3.2. Individual and group mean ± SD values among the participants for %HRmax at
EMGT and LT (n = 10) .................................................................................................................42
Table 3.3. Changes across 30-minute Steady State Aerobic Exercise Bout (n=10) ......................43

xi
LIST OF FIGURES
Figure 2.1. Bland and Altman plots comparing [A] %VO2peak and [B] %HRmax (n = 14). The
middle solid lines indicate the constant error or mean difference. The dashed lines represent
the upper and lower limits of agreement (± 1.96 SD). The dashed-dotted regression lines
represent the trend between the errors of each measurement. There was no significant
correlation in the errors for either %VO2peak (p = 0.10) or %HRmax (p = 0.21) .............................20
Figure 3.1. Bland and Altman plot comparing [A] EMGT-Pre 30 min of aerobic exercise and
LT-Pre %VO2peak; [B] EMGT-Post 30 min of aerobic exercise and LT-Post %VO2peak; and [C]
Differences between pre- and post-exercise EMGT and LT (n = 10). The middle solid lines
indicate the constant error or mean differences. The dashed lines represent the upper and
lower limits of agreement (± 1.96 SD). The dashed-dotted regression lines represent the trend
between the errors of each measurement when bias is present ......................................................44
Figure 3.2. Bland and Altman plot comparing [A] EMGT-Pre 30 min of aerobic exercise and
LT-Pre %HRmax; [B] EMGT-Post 30 min of aerobic exercise and LT-Post %HRmax; and [C]
Differences between pre- and post-exercise EMGT and LT (n = 10). The middle solid lines
indicate the constant error or mean differences. The dashed lines represent the upper and
lower limits of agreement (± 1.96 SD). The dashed-dotted regression lines represent the trend
between the errors of each measurement when bias is present ......................................................45
Figure 4.1. Sample 10-second electromyographical recording for one subject .............................61

1
CHAPTER 1
INTRODUCTION
A long history of research in endurance performance exists, particularly in relation to the
determination of lactate threshold (LT) and its’ ability to predict sporting outcome [Cheng et al.,
1992; Dumke et al., 2006; Candotti et al., 2008; Carey et al., 2008; Green et al., 2014]. Prior to
research into lactate threshold training, it was believed that VO2max was the best indicator for
athletic performance in high-intensity long-duration exercise [Passfield et al., 2000]. However,
the current model for performance prediction argues that among athletes with similar VO2max
levels, an increased capacity to maintain high-intense exercise at near maximal VO2 level in
combination with low blood lactate concentrations ([La]) may be a better determinant of success
[Lucía et al., 2000].
Practitioners often use LT work rates in the field for the purpose of assigning training
intensities for endurance athletes, due to the performance-limiting impact of increasing blood
[La] during long-duration events [Rowlands et al., 2000]. Additionally, LT work rates can
provide an insight into the intensity of the training program; whereas exercise performed at the
level of LT is considered moderate, work rates below are low-intensity, and above are high-
intensity. However, proper assessment of blood [La] and LT work rates requires trained
personnel for handling blood samples, valid testing equipment, and can be costly; therefore
testing is not always a feasible option in the field.
The importance of precise determination of lactate threshold power outputs was
confirmed by Weekes et al (1996). It was determined that well-trained cyclists were unable to

2
maintain intensity levels even slightly above LT (i.e., 15 Watts) for a duration of 30 minutes;
whereas intensities 15 W below could be maintained for periods lasting longer than 30 minutes
[Weekes et al., 1996]. This provides an insight into the sensitivity of workload determined by LT
analysis and necessity of prescribing exercise based upon LT values.
At rest, the process of [La] accumulation and clearance is highly related to an
individuals’ metabolic rate, but not a direct reflection of oxygen availability [Gladden 2004].
However, in working skeletal muscle tissue, blood [La] does not accurately estimate the
metabolic state during exercise; yet an association can be assessed by the relationship between
increases in exercise intensity and [La]. While the accrual of [La] during exercise is a normal
function of cellular metabolism, aerobic exercise performance is typical unaffected as long as
clearance exceeds production of blood lactate [Powers, 2012]. If the accumulation of [La]
progresses, it can efflux from the cell and enter various areas of the body (e.g., Type I muscle
fibers, cardiac tissue, liver, etc.) to be used as an energy source. However, if exercise intensity
continues to increase and blood [La] production rises to a level that exceeds clearance capacity
and [La] inhibitions in motor unit recruitment (i.e., muscular contraction) can occur and disrupt
the ability to continue performance unless intensity is reduced.
Other factors that determine La production and clearance can be dependent upon fiber
recruitment patterns (e.g., Type I versus Type II), mass of the primary musculature involved in
the task, and secondary musculature recruitment [Beneke et al., 2001]. For example, during high-
intensity exercise utilizing a small muscle group as the primary mover, larger muscle groups may
be performing as secondary or assisting movers. In these cases, the lactate shuttle hypothesis
states that the larger, secondary mover may utilize [La] as a fuel source, under the assumption La
production has exceeded clearance in the prime mover, via oxidative metabolism, with the

3
conversion of lactate to pyruvate via lactate dehydrogenase. Observations of blood [La] during
this type of exercise may result in consistent, steady-state values. However, during bouts of
exercise where large muscle groups are the prime mover (e.g., incremental cycling), smaller
muscle groups may not be able to meet the demands of clearance versus the rapid production of
La during high-intensity work [Beneke et al., 2001; Gladden, 2004]. Furthermore, the type of
muscle fiber recruited may have an effect on lactate production as isozymes of lactate
dehydrogenase exist which vary amount aerobic and anaerobic fibers. Within fast-twitch fibers a
form of LDH resides that favors the production of lactate from pyruvate; whereas slow-twitch
fibers contain an isozyme that prefers the breakdown of La to be used as an energy substrate
[Myers et al., 1997].
Additionally, during high-intensity exercise there is an elevation of circulating
catecholamines (i.e., epinephrine and nor-epinephrine) which can indirectly stimulate
phosphorylase, a key regulatory enzyme, responsible for the breakdown of glycogen to be used
for energy production in glycolysis. The increase in glycolysis rate produces an increase in blood
[La], while simultaneously inhibiting fat metabolism via the reduction in substrate availability
[Powers, 2012]. Previous research has demonstrated increases in blood lactate production during
infusion of circulating epinephrine [Stainsby et al., 1985]; while blockage of beta-adrenergic
receptors caused decreases in blood [La] during exercise [Stainsby et al., 1990]. It can also be
hypothesized that during high-intensity activity (e.g., during the latter stages on an incremental
graded exercise test) intra-muscular pressure exceeds that of blood capillary pressure resulting in
their occlusion [Petrofksy et al., 1981]. Blockage of capillaries during the intense activity could
lead to an increase in anaerobic glycolysis and the product of lactic acid; thus promoting a sharp
increase in blood [La] [Petrofsky et al., 1981].

4
Literature has provided many conflicting definitions of lactate threshold (LT). For
example, the exponential method initially described by Lundberg (1986) describes LT as the
point at which blood [La] begins to increase in an exponential manner [Lundberg et al., 1986].
Alternative methods include the rise of blood [La] by 1.0 mmol.L
-1 during incremental exercise,
a 4.0 mmol.L
-1 critical threshold (i.e., onset of blood lactate accumulation), ventilatory threshold
marker (i.e., rise in breathing frequency and the inability to hold conversation during exercise),
or the log-log method by which lactate values begin to deviate upwards from a straight
regression line during incremental work rates [Lundberg et al., 1986; de Sousa et al., 2011].
Additionally, LT is the rate in which cardiovascular exercise can be sustained for long durations
without subsequent increases in VO2max, as well as the marker to indicate the transition from
moderate to heavy exercise intensity. This justifies the examination of the ability of field metrics,
such as EMG, to predict LT and allowing practitioners to prescribe training and competition
intensities based upon individual variations in blood La production.
The OBLA method, 4.0 mmol.L
-1 threshold, has been recently criticized as inaccurate
method to determine intensity thresholds as this does not reflect individual LT variations,
particularly between trained and untrained individuals [McLellan, 1985; Zhou et al., 1997].
Currently there are several computational methods to determine LT (e.g., Dmax, log-log
transformation, 3rd
order polynomials, etc.) which may provide a more objective measure of
calculation. One of these methods, Dmax, has been suggested to allow for a more individualized
approach to predicting LT via analysis of all points along the given curve, as opposed to
observed [La] points during testing [Cheng et al., 1992]. This computational method also
provides a reduction in observer error as no visual determination of LT is required. Zhou and
Weston (1997) determined the reliability of the Dmax method during incremental cycling on two

5
separate occasions with an intra-class correlation coefficient ranging from 0.77 – 0.93.While
multiple methods of LT prediction and testing exist, along with advantages and disadvantages of
each, the Dmax method of calculating LT provides an approach, which can be applied to non-
invasive metrics (i.e., EMG) and field applicable.
While blood [La] is often used to determined threshold workloads, other laboratory
means have also been utilized in order to introduce a non-invasive approach. Such methods
consist of ratings of perceived exertion (RPE) [Fabre et al., 2013], heart rate deflection points
[Carey et al., 2008], expired gas [Cheng et al., 1992], near infrared spectroscopy [Borges et al.,
2016], and electromyography [Candotti et al., 2008]. One such non-invasive method that has
been suggested to determine LT power output levels during incremental exercise is
electromyography. EMG is a method by which the electrical activity within a muscle is recorded
to determine the relative amount of motor units activated in a particular area of the muscle. There
are currently two forms of EMG which captures motor unit action potentials (i.e., intramuscular
and surface). Intramuscular EMG involves the penetration of the skin and muscle to place a fine-
wire electrode to directly capture a specific motor unit deep within the skeletal tissue. Unlike
intramuscular EMG, surface EMG provides a non-invasive method of monitoring the muscle
activation via surface electrodes placed over a general muscular area. Two electrodes are placed,
typically 2 cm apart, over the muscle belly; while a third electrode serves as the ground and
placed over a bony process.
Similar to lactate, EMG during incremental exercise typically contains a positive
exponential break point, termed the EMG threshold (EMGT). Since lactate accumulates during
exercise with increasing intensity (e.g., VO2max testing), the associated increased [H+] may have
an effect on cellular membrane potential [Moritani et al., 1982; Lucía et al., 1999]. This negative

6
effect results in a decreased ability of the muscle to provide the necessary strength of contraction
for a given task. This effect also provides a coinciding increased signaling of additional motor
units to supply adequate energy to maintain performance. Due to the size principle, the types of
motor units to be recruited in times of increasing intensities are Type II (anaerobic) fibers which
can provide a greater twitch rate compared to Type I. Although, exponential rises in lactate and
other metabolic by-products can be expected with this recruitment due to metabolic properties of
Type II muscle fibers [Lucía et al., 1999]. Furthermore, increasing usage of Type II fibers can be
witnessed within the EMG recording with increased amplitudes and right mean frequency shifts
of the signal. This shift from a primarily aerobic (i.e., Type I) to a focus on anaerobic (i.e., Type
II) motor units represents the EMGT. Only recently has the reliability of EMGT been
demonstrated using two incremental cycling bouts separated by 48 hour sessions [MahmutoviĆ
et al., 2016]. Thus, the relationship of LT and EMGT needs further exploration in order to
provide practitioners and athletes a reliable, valid field tool to determine training intensities and
reduce the need for expensive laboratory testing and personnel for lactate testing.
PURPOSES AND HYPOTHESES
The purpose of this dissertation was to examine the various relationships between surface
EMG, blood [La], and LT during aerobic activity. These relationships provide an understanding
of EMG frequency, amplitude, and signal processing in order to determine the acute metabolic
and physiology strain of the lower limb musculature during cardiovascular training. Specific
purposes for each individual study are described below.
Study 1. The purpose of the first study was to determine if surface EMG obtained from
wearable compression shorts could be a valid non-invasive method of estimating lactate

7
threshold during a maximal aerobic-exercise bout. We hypothesized that the EMG would serve
as a useful tool of estimating LT during incremental exercise.
Study 2. The purpose of the second study was to determine the agreement between LT
and EMGT after a bout of steady-state aerobic activity. We hypothesized that LT determined via
blood lactate sampling would differ as blood lactate concentrations would be altered due to the
aerobic trial; whereas EMG would recover immediately and produce a similar workload as
established by the pre-trial EMGT.
Study 3. The purpose of the third study was to examine the best method of LT estimation
during incremental aerobic exercise using various filters and time averaging windows of the
EMG signal. We hypothesized that root mean square (RMS) and smoothing filtering methods
would show no significant differences; whereas average peak amplitude would yield a more
precise estimation of blood [La] compared to RMS and Smoothing. Additionally, we
hypothesized that no differences would exist between time segment epochs.
SIGNIFICANCE OF THE DISSERTATION
This dissertation is important in its determination of the capabilities of EMG to estimate
LT during incremental aerobic exercise. This ability would be useful to athletes and practitioners
as a non-invasive, cost-effective method to monitor the physiological and neuro-motor responses
during cardiovascular training or competition. Study 1 provides an initial perspective on the
ability of wearable EMG to estimate LT power output during incremental aerobic exercise. Study
2 is the first to examine the agreement between EMG and LT after a bout of steady-state aerobic
exercise. Additionally, results provide an insight into motor unit recruitment and lactate
production during a period of fatigue. Study 3 provides a viewpoint as to the best filtering and

8
time averaging method of the EMG signal to predict LT. This was the first investigation to
combine the various means by which EMG is currently used to observe changes in blood [La].
REFERENCES
1. Beneke R, Leithäuser RM, Hütler M. Dependence of the maximal lactate steady state on
the motor pattern of exercise. British Journal of Sports Medicine 2001;35(3): 192-196
2. Borges ND, Driller MW. Wearable lactate threshold predicting device is valid and
reliable in runners. Journal of Strength & Conditioning Research. 2016;30(8):2212-2218
3. Candotti CT, Loss JF, Melo MO, La Torre M, Pasini M, Dutra LA, de Oliveira JLN, de
Oliveira Jr LP. Comparing the lactate and EMG thresholds of recreational cyclists during
incremental pedaling exercise. Canadian Journal of Physiology & Pharmacology
2008;86(5): 272-278
4. Carey DG, Pliego GJ, Raymond RL. A comparison of different heart rate deflection
methods to predict the anaerobic threshold. European Journal of Sport Science 2008;8(5):
315-323
5. Cheng B, Kuipers H, Snyder AC, Keizer HA, Jeukendrup A, Hesselink M. A new
approach for the determination of ventilatory and lactate thresholds. International Journal
Of Sports Medicine 1992;13(7): 518-522
6. de Sousa NMF, Magosso RF, Pereira GB, Leite RD, Arakelian VM, Montagnolli AN,
Perez SA, Baldissera V. The measurement of lactate threshold in resistance exercise: a
comparison of methods. Clinical Physiology & Functional Imaging 2011;31(5): 376-381
7. Dumke CL, Brock DW, Helms BH, Haff GG. Heart rate at lactate threshold and cycling
time trials. Journal of Strength & Conditioning Research 2006;20(3):601-607
8. Fabre N, Mourot L, Zerbini L, Pellegrini B, Bortolan L, Schena F. A Novel Approach for
Lactate Threshold Assessment Based on Rating of Perceived Exertion. International
Journal of Sports Physiology & Performance 2013;8(3): 263-270
9. Gladden LB. Lactate metabolism: a new paradigm for the third millennium." The Journal
Of Physiology 2004;558(1):5-30
10. Green JM, Hornsby JH, Pritchett RC, Pritchett K. Lactate Threshold Comparison in
Anaerobic vs. Aerobic Athletes and Untrained Participants. International Journal of
Exercise Science 2014;7(4): 329-338
11. Lucía A, Hoyos J, Chicharro JL. The slow component of VO2 in professional cyclists.
British Journal of Sports Medicine 2000;34(5): 367-374

9
12. Lucía A, Sánchez O, Carvajal A, Chicharro JL. Analysis of the aerobic-anaerobic
transition in elite cyclists during incremental exercise with the use of electromyography.
British Journal of Sports Medicine 1999;33(3):178-185
13. Lundberg MA, Hughson RL, Weisiger KH, Jones RH, Swanson GD. Computerized
estimation of lactate threshold. Computers And Biomedical Research, An International
Journal 1986;19(5): 481-486
14. MahmutoviĆ S, Sprout EY, Fontaine JC, Buskirk TM, Galen SS, Malek MH. Test–retest
reliability of the electromyographic fatigue threshold for cycle ergometry. Muscle &
nerve 2016;53(5):803-807
15. McLellan T. Ventilatory and plasma lactate response with different exercise protocols: a
comparison of methods. International journal of sports medicine 1985;6(1):30-35
16. Moritani T, Nagata A, Muro M. Electromyographic manifestations of muscular fatigue.
Medicine & Science in Sports & Exercise 1982;14(3):198-202
17. Myers J,Ashley E. Dangerous curves: a perspective on exercise, lactate and the anaerobic
threshold. Chest Journal 1997;111(3):787-795
18. Passfield L,Doust JH. "Changes in cycling efficiency and performance after endurance
exercise. Medicine & Science in Sports & Exercise 2000;32(11):1935-1941
19. Powers SK. Exercise physiology theory and application to fitness and performance. New
York:McGraw-Hill 2012
20. Rowlands D, Downey B. Physiology of triathlon. Exercise and sport science
Philadelphia: Lippincott Williams & Wilkins. 2000;921-922
21. Petrofsky JS, Phillips CA, Sawka MN, Hanpeter D, Stafford D. Blood flow and
metabolism during isometric contractions in cat skeletal muscle. Journal of Applied
Physiology: Respiratory, Environmental & Exercise Physiology 1981;50(3): 493
22. Stainsby WN, Brooks GA. Control of lactic acid metabolism in contracting muscles and
during exercise. Exercise and sport sciences reviews 1990;18(1): 29-64
23. Stainsby WN, Sumners C, Eitzman PD. Effects of catecholamines on lactic acid output
during progressive working contractions. Journal of Applied Physiology 1985;59(6):
1809-1814
24. Weekes S, Davie AJ, Zhou S. Validation of the Dmax method as a predictor of lactate
threshold. Australian Conference of Science and Medicine in Sports. 1996;444-445

10
25. Zhou S, Weston SB. Reliability of using the D-max method to define physiological
responses to incremental exercise testing. Physiological measurement 1997;18(2):145

11
CHAPTER 2
VALIDITY OF WEARABLE ELECTROMYOGRAPHICAL COMPRESSION SHORTS TO
PREDICT LACTATE THRESHOLD DURING INCREMENTAL EXERCISE IN HEALTHY
PARTICIPANTS
ABSTRACT
The purpose of this investigation was to determine if wearable surface electromyographic
(EMG) technology, acquired from compression shorts, can validly estimate the lactate threshold
work rate during incremental cycling. Thirteen adult men (n = 8) and women (n = 5) volunteered
to participate in this study. Participants completed an incremental, maximal test on a cycle
ergometer. Blood lactate was measured every minute, while EMG was recorded throughout the
test at the vastus lateralis. Results demonstrated no significant differences (p = 0.08) between
lactate and electromyographical thresholds. Additionally, no differences existed between EMG
and lactate thresholds for maximal heart rate (p = 0.13, Cohen’s d = 0.43) and percent peak
oxygen consumption (p = 0.64, Cohen’s d = 0.09). Consistent with previous results, EMG
provided a moderate correlation with the prediction of work rates associated with LT (r = 0.68, p
= 0.01). The exponential rise in blood lactate concentration and EMG may be attributed to the
increase in Type II muscle fiber recruitment. Thus, wearable EMG compression gear may
provide a viable field tool for monitoring training intensity and predicting LT work rates.
KEY WORDS: Electromyography; Aerobic Training; Blood Lactate; Cycling

12
INTRODUCTION
Lactate threshold (LT) has been utilized as a predictive measure of performance, due to
its representation of a balance between lactate (La) production and clearance [Yoshida, 1984].
For example, when comparing two athletes possessing the same VO2max, the individual with the
ability to maintain a higher lactate threshold has the greater chance of success during a long-
duration competition [Lucía et al., 2000]. Thus, LT can be seen as an important predictor of
endurance performance and a useful measure in training.
Training at levels at or above LT is useful in increasing cardiovascular endurance, as well
as inducing reduced [La] levels for a given power output [Davis et al., 1979; Yoshida, 1984,
Gollnick et al., 1986]. Therefore, the LT is a key determinant in programming aerobic exercise
intensity. Weekes et al (1996) demonstrated that athletes were unable to maintain even slight
intensities (i.e., 15 Watts) greater than the level of LT for a duration of 30 minutes [Weekes et
al., 1996]. Additionally, training at oxygen uptake levels (i.e., %VO2peak) deemed below LT has
been shown to acquire a typical steady-state response in 2-3 minutes; whereas %VO2peak
intensities above LT have shown a delayed steady-state response and led to early exhaustion of
the individual [Barstow, 1994; Roston, 1987].
Unfortunately, monitoring [La] during exercise is a costly, invasive blood analysis, which
requires either capillary blood samples or an indwelling venous catheter. However,
electromyography is a potential new method of monitoring exercise intensity and may provide a
novel, cost-effective field technique to monitor [La] during endurance training. Surface
electromyography (EMG) is a non-invasive measure of the electrical activity, in microVolts
(µV), of skeletal muscle tissue along with alterations in motor unit recruitment. Preliminary
research indicates EMG can be used as a method of estimating the LT during incremental

13
exercise [Candotti et al., 2008]. As exercise intensity increases, the accumulation and production
of by-products such as La exert a negative effect on skeletal muscle membrane potential leading
to the need for additional motor unit activation [Vaz et al., 1996]. Increased high-threshold fiber
recruitment thereby impacts the amplitude of the EMG signal (i.e., increased µV output) over
time [Vaz et al., 1996; Candotti et al., 2008].
Hypothetically, a relationship exists between the EMG signal and La production.
Increases in the amplitude of the EMG signal depend on changes in motor unit recruitment and
the amount of skeletal tissue recruited [Beneke et al., 2001; Pires, 2006]. Type I muscle fibers
record at low frequencies between 20-125 Hz; whereas type II muscle fibers produce signaling at
125-250 Hz. During incremental exercise, a shift in the recorded signal from low to high
frequencies (i.e., type I, slow-twitch to type II, fast-twitch fibers) is stated to be the EMG
threshold (EMGT). Recent research by Candotti et al. (2008) demonstrated a positive association
(r = 0.87) between EMGT and LT; along with the ability of EMG to determine the work rate at
which LT occurred in recreational cyclists [Candotti et al., 2008]. EMG was sampled over 1-
second averages and EMGT determined by the intersection of two linear regression lines.
However, only one [La] sample was collected per stage during the exercise trials which can
result in a decrease in the sensitivity of LT analysis, and those initial findings have not been
confirmed.
Commercially-available devices are currently able monitor EMG to capture activity of
lower-body musculature via wearable compression shorts with specialized electrodes. However,
the ability of the EMG, via compression gear, to predict lactate threshold has yet to be
investigated. As such, the primary aim of this investigation was to determine if EMG, acquired
from compression shorts, can be a valid method of estimating the lactate threshold power output

14
during incremental exercise. Based upon previous findings [Petrofsky, 1979; Candotti et al.,
2008], it was hypothesized that EMGT and LT would display a strong positive correlation. The
results of this investigation may provide practitioners and athletes with a non-invasive field
method of identifying EMGT and LT during training.
METHODS
Experimental Approach to the Problem
The current study was designed to determine if surface electromyography via a new
commercially-available wearable product could be used as viable source to non-invasively
predict lactate threshold during incremental aerobic exercise. Thirteen participants completed an
incremental exercise test (VO2peak) on a cycle ergometer. Blood lactate was analyzed via
fingertip during each minute of the test, while EMG was recorded from the vastus lateralis
continuously. This study was approved by the university ethics committee.
Participants
Thirteen male and female healthy individuals participated in this study. Descriptive
statistics are displayed in Table 1 for all participants. The sample size was sufficient according to
an a priori power analysis with G Power software (Heinrich-Heine University of Dusseldorf,
Dusseldorf, Germany) which determined 11 participants would be needed to obtain statistical
power at the recommended 0.80 level. Participants recruited met the following criteria: 1)
Between the ages of 18-40; 2) Currently participating in regular moderate-to-vigorous aerobic
training of a minimum of three days per week for at least 30 minutes per session; and 3) Free
from cardiovascular, metabolic, or neurological disorders that would otherwise affect the results
or negatively impact safety.

15
Table 2.1. Descriptive statistics of the study participants
Men (n = 9) Women (n = 4) All (n = 13)
Age (yr) 23.67 ± 5.55 20.75 ± 1.50 22.77 ± 4.80
Height (cm) 175.71 ± 4.16 165.03 ± 8.41 172.42 ± 7.45
Body mass (kg) 85.61 ± 10.05 60.50 ± 6.39 77.88 ± 14.94
HRmax 181.33 ± 13.35 181.5 ± 5.51 181.38 ± 11.24
VO2peak 35.24 ± 5.04 32.38 ± 7.28 34.36 ± 5.67
HRmax = heart rate maximum; VO2peak = peak oxygen consumption
Procedures
Participants were asked to report to the Human Performance Laboratory for one visit.
Upon arrival, participants reviewed and signed an informed consent and medical history
questionnaire. After consent, participants had height and weight measured. Standing height was
measured to the nearest 0.1cm using a stadiometer (SECA 67310, SECA©
, Chino, CA); while
weight was measured to the nearest 0.1 kg (Tanita BWB-800, Tanita©
, Arlington Heights, IL).
Participants then performed an incremental maximal cycling test while blood lactate, heart rate,
and electromyographical signals were measured at the site of the vastus lateralis. Prior to testing
participants were familiarized with all equipment and procedures used in the investigation. All
testing was performed on a manually-braked cycle ergometer (Monark 484 E; Monark©
;
Dalarna, Sweden). Participants were provided an initial warm-up on the cycle ergometer at an
output of 40 W for a period of three minutes. The testing phase began immediately following the
warm-up at a work output of 80 W and increased in increments of 40 W every 3 minutes
thereafter. Cadence was kept at 80 (±5) revolutions per minute. Test termination criteria were: 1)
Subject was no longer able to maintain cadence; or 2) Volitional fatigue.

16
During each stage the following variables were measured: blood lactate, heart rate, VO2,
and EMG activity. Capillary blood samples (25 µL) were taken via finger prick and analyzed
every minute throughout the testing procedures, including rest and warm-up. Lactate
concentrations were analyzed via the Lactate Plus Meter (NOVA Biomedical, Waltham, MA).
Lactate Plus monitors have been shown to have a standard error of the estimate of 0.6 mmol.L
-1
and strong correlation of 0.94 when compared to laboratory measures [Tanner et al., 2010]. A
heart rate monitor (Polar Electro Oy, Kemple, Finland) was placed on the participants’ chest in
order to accurately assess heart rate during the test. A metabolic cart (TrueOne® 2400,
ParvoMedics Inc., Sandy, UT, USA) was used to determine the oxygen uptake at the mouth.
Before each test, the metabolic cart was properly calibrated according to the manufacturer’s
instructions. VO2peak was recorded as the average oxygen consumption, expressed as ml.kg-1.
min-
1, among the last minute of the incremental exercise test.
Surface EMG signals were collected with compression shorts containing built-in surface
electrodes (Athos©
, Mad Apparel, Inc., Redwood City, CA). The compression shorts contain
electrodes that were situated over the vastus lateralis for measurement of the EMG signal.
Preparation for the skin sites included shaving, abrasion, and alcohol cleansing in order to reduce
impedance of EMG signals. Recordings were deemed viable when impedance was below 5 kΩ.
Raw myoelectrical signals were quantified in this product using root mean square (RMS)
transformation along with a signal conversion from analog to digital. EMG signals from the
compression gear were averaged at a 10-second window.

17
LT and EMGT Determination (Dmax Method)
LT and EMGT were determined in each participant via Dmax calculations. Dmax was
defined as the point that yielded the maximal distance from the model fitting [La] and EMG
curve, using a 3rd
order polynomial equation, to the line formed by the lowest and highest [La]
and EMG values taken during the incremental test [Zhou et al., 1997]. The Dmax method has
been previously validated as computational method to provide a reliable training threshold
during incremental exercise. The Dmax point was computed on a custom-written computer
program. The percent of VO2peak (%VO2peak) and percent maximal heart rate (%HRmax) were
recorded at the LT and EMGT to allow for comparisons between each threshold.
Statistical Analysis
The data obtained were analyzed using a software package (SPSS version 22.0, Somers,
NY). Due to the staged, ordinal nature of the incremental test, the level of LT and EMGT were
compared using the Wilcoxon Matched-Pairs Signed-Rank Test. A Spearman’s rank order
correlation was performed to determine the relationship between LT and EMGT. Additionally, a
paired sample T-test was applied to identify any statistically significant %VO2peak and %HRmax at
the EMGT, provided by the compression garment for the vastus lateralis muscle, and LT.
Individual agreement was examined by calculating the number of times EMGT and LT occurred
within the same stage of the maximal exercise test. Significance was set at α = 0.05 for all
statistical analyses.
A Cohen’s d statistic [Cohen, 1992] was calculated as the effect size of the differences
and Hopkin’s scale of magnitude [Hopkins et al., 2009] was used where an effect size of 0-0.2
was considered trivial, 0.2-0.6 was small, 0.6-1.2 was moderate, 1.2-2.0 was large, >2.0 was very

18
large. The procedures of Bland and Altman [Bland et al., 2010] were used to evaluate the 95%
limits of agreement of the EMGT method compared to the LT.
RESULTS
Thresholds in both [La] and EMG were observed in all participants in the investigation.
Individual data, along with means (± SD) for the %VO2peak and %HRmax at the EMGT and LT are
shown in Table 2. The mean blood [La] at the level of LT was 3.6 ± 0.69 mmol.L
-1. There were
no significant differences observed between the work rates obtained through blood [La] or EMG
compression gear (Z = -1.732, p = 0.83). The wearable technology EMGT occurred at the same
stage of the incremental test as the blood lactate threshold in 11 out of the 13 participants
(84.6%). Out of the remaining participants (i.e., 2), EMGT took place one stage higher than LT.
Using the Spearman’s rho correlation, there was a significant moderate correlation found
between LT and EMGT (rs = 0.677, p= 0.01).
In terms of %VO2peak, there were no significant differences between LT and EMGT. Non-
significant (p =0.38), small (Cohen’s d = 0.45) differences were seen between males and females
for %VO2peak at the level of LT. A significant correlation existed between %VO2peak from both
measures (i.e., [La] and EMG) at LT (r = 0.73, p = 0.003). The Bland Altman procedure
suggested that the EMGT displayed a 95% limits of agreement that ranged ± 9.3% around a
constant error of -0.97% of VO2peak (Figure 1A), with the upper and lower limits at 10.3 and -8.4
%, respectively. There was no correlation between the x- and y-axes of the Bland Altman plot
suggesting no proportional bias existed (r = 0.48, p = 0.101).
%HRmax did not differ between the LT (88.8 ± 2.95%) and EMGT (90.4 ± 4.06%) (p =
0.13, Cohen’s d = 0.43). Furthermore, the %HRmax values between LT and EMGT showed a
significant moderate correlation (r = 0.58, p = 0.04). The Bland Altman procedure showed that

19
the EMGT displayed 95% limits of agreement that ranged ±6.6% around a constant error of -
1.5% of HRmax (Figure 1B), with the upper and lower limits at 8.1 and -5.1 %, respectively.
There was no correlation between the x- and y-axes of the Bland Altman plot suggesting no
proportional bias existed (r = 0.37, p = 0.21).
Table 2.2. Individual and group mean ± SD values among the participants
for %VO2peak and %HRmax values at EMGT and LT (n = 13)
Participant EMG%VO2peak LT%VO2peak DIFF EMG%HRmax LT%HRmax DIFF
1 71.67 66.17 5.50 89.93 85.88 3.95
2 72.56 72.56 0.00 88.16 89.74 -1.31
3 76.06 76.97 -0.91 85.25 85.79 -0.54
4 65.88 67.06 -1.18 95.74 92.02 3.72
5 76.04 69.36 6.68 90.34 89.20 1.14
6 74.24 74.10 0.14 91.35 92.43 -1.08
7 78.17 76.30 1.87 92.82 90.26 2.56
8 86.70 83.10 3.60 97.28 88.59 8.69
9 81.13 76.70 4.43 94.95 90.40 4.55
10 69.42 75.84 -6.42 83.24 84.37 -1.13
11 71.16 71.87 -0.62 88.64 86.36 2.28
12 83.37 75.60 7.77 89.33 93.82 -4.49
13 63.50 71.81 -8.31 87.70 86.10 1.60
Mean 75.26 74.65 -0.61 90.36 88.82 -1.53
SD 6.85 5.79 4.76 4.06 2.95 3.36
95% CI 13.5 11.4 9.3 7.9 5.8 6.6
p 0.64 0.13
Cohen’s d 0.09 0.43
DIFF = difference in %VO2peak between EMGT and LT

20
Figure 2.1. Bland and Altman plots comparing [A] %VO2peak and [B] %HRmax (n = 13). The middle solid lines indicate the constant
error or mean difference. The dashed lines represent the upper and lower limits of agreement (± 1.96 SD). The dashed-dotted
regression lines represent the trend between the errors of each measurement. There was no significant correlation in the errors for
either %VO2peak (p = 0.10) or %HRmax (p = 0.21). C
E/B
ias
%H
Rm
ax (
EM
GT –
LT
)
Mean %HRmax [(EMGT + LT)/2] Mean %VO2peak [(EMGT + LT)/2]
CE
/Bia
s %
VO
2pea
k (
EM
GT –
LT
)
[A] [B]

21
DISCUSSION
The purpose of this investigation was to determine if a field-wearable EMG device in
compression shorts was a viable method of estimating LT via changes in the EMG signal.
Consistent with previous results of EMGT [Candotti, 2008], our findings indicate that EMG
predicted the LT during incremental exercise. A key finding was the compression gear showed
no significant differences in determining the LT when analyzed via %VO2peak or %HRmax.
Therefore, wearable EMG technology such as the device analyzed in the study appears to
provide a suitable method for estimating the LT within field settings by simply monitoring HR.
Whereas no other wearable EMG technology has been tested to predict LT, a
compression sleeve, using near infrared LED technology, worn on the calf (i.e., BSX insight) has
recently been shown to provide a reliable method of predicting LT [Borges, 2016]. The wearable
sleeve provided oxygenation levels and measured threshold work rate at a different location (i.e.,
gastrocnemius) than the device of the present study. However, both that study and the present
findings support the notion that non-invasive wearable technology may have the ability to be
useful field measures of training intensities.
In contrast to the current study, Seburn et al. (1992) proposed that EMG was not a viable
option to monitor the anaerobic threshold indicating that several criteria must be satisfied prior to
establishing the relationship between blood [La] and EMG. First, non-linear associates must exist
between work rate and muscle activation; however the data of the current study satisfies this
notion as a curvilinear relationship existed in all participants examined. Secondly, EMG must
respond immediately to the small changes in La production and decrements in pH that occur at
the level of LT. The results of the current study suggest that this association holds true since both
[La] and EMG showed inflection points at the same work rate in 11 of 13 participants tested.

22
These results also confirm the exponential rise in blood [La] during incremental-intensity
exercise, thereby providing a LT level in all individuals examined. As previously stated, the rise
in blood [La] occurs when production exceeds clearance; however, this cannot be simply
explained, as this is a multi-factorial approach. One factor that accounts for this is the decrease in
localized lactate-removal sites available in adjacent, non-working Type I muscle fibers. As the
intensity of exercise increases, additional motor units are signaled for contraction leaving fewer
lactate-removal sites available for the inter- and intra-cellular lactate shuttle process to occur
leading to increased [La][Gladden, 2004; Candotti et al., 2008]. Another important factor in the
production of La is the stimulation of phosphorylase, a key regulatory enzyme in carbohydrate
metabolism. Throughout exercise, both elevations in epinephrine and Ca++
/Calmodulin from
contracting musculature indirectly stimulate phosphorylase to break-down glycogen to be used
during glycolysis to form energy, along with elevated [La] (in times of high-intensity). As the
recruitment of type II fibers occur during high-intensity exercise, less reliance is placed upon
oxidative metabolism, due to the low mitochondrial density of anaerobic muscle fibers leading to
an increase in La production [Powers, 2012]. Furthermore, a redistribution of blood-flow from
lactate clearance sites (e.g., kidneys, non-working skeletal tissue, liver, etc.) that would
otherwise alleviate the accumulation of blood La during high-intensity activity impact the rapid
rise in blood [La] [Candotti et al., 2008].
The EMG signaling also provided a positive breakpoint, EMGT, which is primarily
attributed to the rise in Type II muscle fiber motor unit recruitment during an incremental
exercise bout. It was noted that independent of one’s training status, thresholds can be observed
within the EMG signal [Candotti et al., 2008]. Previous research into shorter cycling bouts (i.e.,
3 minutes) while monitoring muscular activation revealed that there was a linear relationship
23
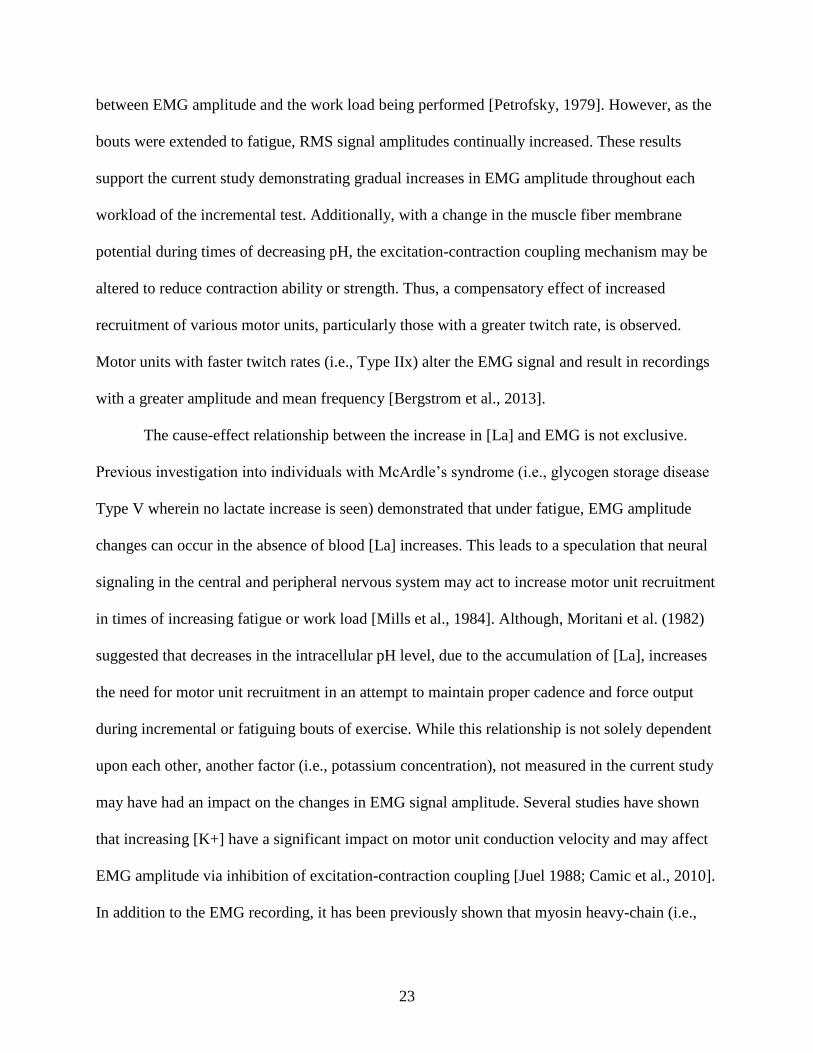
between EMG amplitude and the work load being performed [Petrofsky, 1979]. However, as the
bouts were extended to fatigue, RMS signal amplitudes continually increased. These results
support the current study demonstrating gradual increases in EMG amplitude throughout each
workload of the incremental test. Additionally, with a change in the muscle fiber membrane
potential during times of decreasing pH, the excitation-contraction coupling mechanism may be
altered to reduce contraction ability or strength. Thus, a compensatory effect of increased
recruitment of various motor units, particularly those with a greater twitch rate, is observed.
Motor units with faster twitch rates (i.e., Type IIx) alter the EMG signal and result in recordings
with a greater amplitude and mean frequency [Bergstrom et al., 2013].
The cause-effect relationship between the increase in [La] and EMG is not exclusive.
Previous investigation into individuals with McArdle’s syndrome (i.e., glycogen storage disease
Type V wherein no lactate increase is seen) demonstrated that under fatigue, EMG amplitude
changes can occur in the absence of blood [La] increases. This leads to a speculation that neural
signaling in the central and peripheral nervous system may act to increase motor unit recruitment
in times of increasing fatigue or work load [Mills et al., 1984]. Although, Moritani et al. (1982)
suggested that decreases in the intracellular pH level, due to the accumulation of [La], increases
the need for motor unit recruitment in an attempt to maintain proper cadence and force output
during incremental or fatiguing bouts of exercise. While this relationship is not solely dependent
upon each other, another factor (i.e., potassium concentration), not measured in the current study
may have had an impact on the changes in EMG signal amplitude. Several studies have shown
that increasing [K+] have a significant impact on motor unit conduction velocity and may affect
EMG amplitude via inhibition of excitation-contraction coupling [Juel 1988; Camic et al., 2010].
In addition to the EMG recording, it has been previously shown that myosin heavy-chain (i.e.,

24
percentage of Type I fibers) distribution can be an important determinant of LT and VO2peak
[Farina et al., 2007].
Results of the current study demonstrated that the breakpoint in [La] occurred at a mean
%VO2peak of 74.7%. Previous research has also observed means similar to the current study,
giving values ranging from 66.1% to 80% [Seburn et al., 1992; Farina et al., 2007; Green et al.,
2014]. Whereas no endurance athletes participated in this investigation, Green et al. (2014)
observed no significant differences in the %VO2peak at the level of LT between aerobically and
anaerobically trained individuals [Green et al., 2014]. However, as expected, they observed that
untrained individuals showed significantly lower values of %VO2peak compared to both groups of
trained individuals.
Similar to the current results, Dumke et al. (2006) observed values of 91.0 %HRmax
during an incremental cycling test at the level of LT, almost identical to 90.4% in this
investigation [Dumke et al., 2006]. Additionally, Dumke et al. (2006) demonstrated that trained
cyclists were able to maintain HR values of 90 % and 85 %HRmax during timed trials of 30 and
60 minutes, respectively, on separate occasions. These results reinforce the notion that a field
metric, such as HR, may be used as training tool for intensity in lieu of blood [La] sampling.
Whereas these present results found no significant differences between EMG and LT in
relation to work rate, EMG over predicted thresholds in two individuals. One possible cause of
this occurrence may be the inability of the wearable technology electrodes to conform to the
individual. For instance, differences in limb length of various individuals can alter the placement
of the electrodes in or out of the innervation zone, be located atop a completely different muscle,
or be positioned as to acquire signal acquisition (i.e., cross-talk) from neighboring muscle

25
groups. Therefore, misalignments or maladjustments may have an effect on the ability of the
surface electrodes to provide valid information about the musculature being examined.
This study is not without limitations. First, while the Dmax method has determined to be
reproducible in test-retest studies [Cheng et al., 1992] initial daily resting blood [La]
concentrations may have an impact on the linear slope of the curve by which the polynomial
curve is measured against; thereby giving a false sense of work output or LT [Zhou et al., 1997].
While blood [La] measured at the site of the fingertip does not directly reflect local muscular La
values, it allows for an overall interpretation of the rate and type of cellular metabolism and
accrual of metabolic by-products. Another limitation of monitoring thresholds with EMG is the
training status of the individual. Whereas no trained cyclists were used in this investigation,
previous research indicated that training may impact results. It was noted that trained cyclists
have been shown to produce two significant breakpoints in EMG signaling during incremental
exercise. This occurrence may be attributed to the ability of trained individuals to recruit higher
threshold motor units when intensity approaches near-maximal levels, producing a second
breakpoint in the EMG recording [Lucía et al., 1999].
Although most of the research in EMGT has occurred in cycling, future research should
examine the effectiveness of EMG to predict LT in various cardiovascular modalities (e.g.,
running, arm ergometry, etc.). Additionally, future research may be warranted to determine the
chronic cardiovascular and physiological adaptations garnered from the prescription of training
loads via EMGT.
PRACTICAL APPLICATIONS
The results of this investigation determined that wearable EMG was a valid method of
determining LT work rate. Additionally, no significant differences were seen between the

26
thresholds in EMG and LT expressed as %HRmax or %VO2peak. This finding indicates that
wearable fitness technology may provide valid real-time measures of muscle activation in a
practical and field setting. Practitioners may find this information useful, as monitoring blood
[La] in the field can be impractical, time consuming, and may require trained personnel to handle
blood sampling. Monitoring LT may be an important determinant of the ability of the athlete or
individual to maintain pre-determined exercise intensities for extended durations (i.e., 30 minutes
or more). Therefore, EMG, monitored via specialized compression gear, may provide a viable
option in monitoring training intensity and predicting LT levels due to its ability to provide
feedback in real-time.
REFERENCES
1. Barstow TJ. Characterization of VO2 kinetics during heavy exercise. Medicine and
Science in Sports and Exercise 1994;26(11):1327-1334
2. Beneke R, Leithäuser RM, Hütler M. Dependence of the maximal lactate steady state on
the motor pattern of exercise. British Journal of Sports Medicine 2001;35(3):192-196
3. Bergstrom HC, Housh TJ, Cochrane KC, Jenkins NDM, Lewis Jr RW, Traylor DA,
Zuniga JM, Schmidt RJ, Johnson GO, Cramer JT. An examination of neuromuscular and
metabolic fatigue thresholds. Physiological Measurement 2013;34(10):1253
4. Bland JM, Altman DG. Statistical methods for assessing agreement between two methods
of clinical measurement. International Journal of Nursing Studies 2010;47:931-936
5. Borges ND, Driller MW. Wearable lactate threshold predicting device is valid and
reliable in runners. Journal of Strength & Conditioning Research. 2016;30(8):2212-2218
6. Camic CL, Housh TJ, Johnson GO, Hendrix CR, Zuniga JM, Mielke M, Schmidt, RJ. An
EMG frequency-based test for estimating the neuromuscular fatigue threshold during
cycle ergometry. European journal of applied physiology 2010;108(2):337-345
7. Candotti CT, Loss JF, Melo MO, La Torre M, Pasini M, Dutra LA, de Oliveira JLN, de
Oliveira Jr LP. Comparing the lactate and EMG thresholds of recreational cyclists during
incremental pedaling exercise. Canadian Journal of Physiology & Pharmacology
2008;86(5):272-278

27
8. Cheng B, Kuipers H, Snyder AC, Keizer HA, Jeukendrup A, Hesselink M. A new
approach for the determination of ventilatory and lactate thresholds. International Journal
of Sports Medicine 1992;13(7):518-522
9. Cohen J. Statistical power analysis. Current directions in psychological science
1992;1(3):98-101
10. Davis JA, Frank MH, Whipp BJ, Wasserman K. Anaerobic threshold alterations caused
by endurance training in middle-aged men. Journal of Applied Physiology: Respiratory,
Environmental & Exercise Physiology 1979;46(6):1039-1046
11. Dumke CL, Brock DW, Helms BH, Haff GG. Heart rate at lactate threshold and cycling
time trials. Journal of Strength & Conditioning Research 2006;20(3):601-607
12. Farina D, Ferguson RA, Macaluso A, De Vito G. Correlation of average muscle fiber
conduction velocity measured during cycling exercise with myosin heavy chain
composition, lactate threshold, and VO2max. Journal of Electromyography and
Kinesiology 2007;17(4):393-400
13. Gladden LB. Lactate metabolism: a new paradigm for the third millennium. The Journal
Of Physiology 2004; 558(1):5-30
14. Gollnick PD, Bayly WM, Hodgson DR. Exercise intensity, training, diet, and lactate
concentration in muscle and blood. Medicine and Science in Sports and Exercise
1986;18(3):334-340
15. Green JM, Hornsby JH, Pritchett RC, Pritchett K. Lactate Threshold Comparison in
Anaerobic vs. Aerobic Athletes and Untrained Participants. International Journal of
Exercise Science 2014;7(4): 329-338
16. Hopkins W, Marshall S, Batterham A, Hanin J. Progressive statistics for studies in sports
medicine and exercise science. Medicine & Science in Sports & Exercise 2009;41(1):3
17. Howley ET, Bassett Jr. DR, Welch HG. Criteria for maximal oxygen uptake: review and
commentary. Medicine & Science in Sports & Exercise 1995;27(9):1292-1301
18. Juel C. Muscle action potential propagation velocity changes during activity. Muscle &
nerve 1988;11(7):714-719
19. Lucía A, Hoyos J, Chicharro JL. The slow component of VO2 in professional cyclists."
British Journal of Sports Medicine 2000;34(5):367-374
20. Lucía A, Sánchez O, Carvajal A, Chicharro JL. Analysis of the aerobic-anaerobic
transition in elite cyclists during incremental exercise with the use of electromyography.
British Journal of Sports Medicine 1999;33(3):178-185

28
21. Mills KR, Edwards RHT. Muscle fatigue in myophosphorylase deficiency: power
spectral analysis of the electromyogram. Electroencephalography and Clinical
Neurophysiology 1984;57(4):330-335
22. Petrofsky J. Frequency and amplitude analysis of the EMG during exercise on the bicycle
ergometer. European Journal of Applied Physiology & Occupational Physiology
1979;41(1):1-15
23. Pires F, Silva AEL, Gagliardi JFL, Barros RV, Kiss MA. Characterization of the blood
lactate curve and applicability of the Dmax model in a progressive protocol on treadmill.
Revista Brasiliera de Medicina do Esporte 2006;12(2):61-65
24. Powers K. Exercise physiology theory and application to fitness and performance. New
York: McGraw-Hill, 2012
25. Seburn KL, Sanderson DJ, Belcastro AN, McKenzie DC. Effect of manipulation of
plasma lactate on integrated EMG during cycling. Medicine & Science in Sports &
Exercise 1992;24(8):911-916
26. Tanner RK, Fuller KL, Ross ML. Evaluation of three portable blood lactate analysers:
Lactate Pro, Lactate Scout and Lactate Plus. European journal of applied physiology
2010;109(3):551-559
27. Vaz MA, Zhang YT, Herzog W, Guimaraes ACS, MacIntosh BR.The behavior of rectus
femoris and vastus lateralis during fatigue and recovery: An electromyographic and
vibromyographic study. Electromyography and Clinical Neurophysiology
1996;36(4):221-230
28. Weekes S, Davie AJ, Zhou S. Validation of the Dmax method as a predictor of lactate
threshold. Australian Conference of Science and Medicine in Sports. 1996;444-445
29. Weltman A, Snead D, Stein P, Seip R, Schurrer R, Rutt R,Weltman J. Reliability and
validity of a continuous incremental treadmill protocol for the determination of lactate
threshold, fixed blood lactate concentrations, and VO2max. International Journal of Sports
Medicine 1990;11(1):26-32
30. Yoshida T. Effect of dietary modifications on lactate threshold and onset of blood lactate
accumulation during incremental exercise. European Journal of Applied Physiology &
Occupational Physiology 1984;53(3):200
31. Zhou S, Weston SB Reliability of using the D-max method to define physiological
responses to incremental exercise testing. Physiological measurement 1997;18(2):145

29
CHAPTER 3
AGREEMENT BETWEEN LACTATE AND ELECTROMYOGRAPHICAL THRESHOLDS
FOLLOWING STEADY-STATE EXERCISE IN UNTRAINED HEALTHY PARTICIPANTS
ABSTRACT
The purpose of this investigation was to determine the agreement between
electromyography (EMG) and lactate threshold (LT) after a 30-minute bout of exercise.
Participants (n=11) completed two graded exercise tests (GXT) on a cycle ergometer separated
by 30-minute steady-state exercise. Blood lactate was measured the last 30-seconds of each stage
during each exercise test; while EMG of the vastus lateralis and oxygen consumption (VO2) were
monitored continuously. Individual agreement demonstrated that pre- and post-exercise LT
occurred at the same work rate in 5 of 10 participants; and pre- and post- EMGT occurred at the
same work rate in 6 of 10 participants (1 participant elicited no EMGT during the trials). Pre-
exercise LT and EMGT occurred at the same stage in 3 individuals; while post-exercise LT and
EMGT only occurred at the same work rate in 2 participants. Results showed no mean difference
between work rates for LT or EMG threshold for the pre-GXT; however, LT during the post-
GXT was significantly lower than EMGT (p = 0.007). Post-GXT LT work rates were also
determined to be significantly lower than pre-GXT LT (p = 0.034); whereas no differences
existed in EMG thresholds. The utilization of EMG to estimate LT after a bout of exercise may
not provide a valid metric due to poor individual agreement.
Key Words: Threshold Training; Electromyography; Cycling; Aerobic Training

30
INTRODUCTION
Lactate threshold (LT) training is a form of cardiovascular endurance training that
consists of performing sustained aerobic activity at the speed, power output, or percentage of
VO2max at which blood lactate concentration ([La]) begins a rapid increase above baseline
[Baechle et al., 2000; Yoshida, 1984]. Training at an intensity equal to or above the LT can result
in favorable performance adaptations such as improved aerobic power and lactate clearance
[Baechle et al., 2000; Davis et al., 1979;Gollnick et al., 1986]. In addition, steady-state training
below LT for an extended period can be especially important for peripheral adaptations such as
increased capillary and mitochondrial densities [Powers, 2012]. Though most investigations
focus on the importance of threshold-based training in trained and elite endurance competitors,
LT testing may also have important implications for baseline measures among recreationally
trained healthy participants who are beginning an endurance training program.
Previous investigations using surface electromyography (EMG) to detect muscle fiber
recruitment patterns during graded exercise testing (GXT) have reported a progression in
recruitment of Type II muscle fibers with an increase in work rate [Guffey et al., 2012; Malek et
al., 2006;Travis et al., 2011]. This has been identified as the electromyographical threshold
(EMGT) and defined as the greatest exercise intensity an individual can maintain without an
exponential increase in the amplitude of the EMG signal [MahmutoviĆ et al., 2016]. Because an
increase in EMG amplitude occurs near the LT, the EMGT has been suggested as a non-invasive
surrogate to blood lactate testing [Candotti et al. 2008; Dumke et al., 2006].
Previous investigation into the use of EMGT to predict the LT has shown a significant
positive association during incremental exercise [Candotti et al., 2008]. However, research with
McArdle’s syndrome patients has suggested that the EMGT and LT display an independent

31
relationship and a more coincidental relationship than cause-effect [Mills et al., 1984]. The
results of that research suggest that EMG amplitude and motor unit recruitment during exercise
may be based upon fatigue in the muscle membrane and various ionic concentrations not limited
to blood lactate production [Mills et al., 1984]. Furthermore, the relationship between EMGT and
LT following steady state exercise is unknown. This is an important consideration since the
practical implications of both measures relate to the assumption that the work rate from each
threshold should remain consistent across a steady state bout of exercise, hence their value for
prescribing exercise intensity. However, the metabolic response of a decrease in glycolysis and
increase fatty acid oxidation, and the neuromuscular response of a shift from Type II to Type I
muscle fibers during steady state exercise may not occur at the same time-points [Beneke et al.,
2001].
The purpose of this investigation was to evaluate the agreement between EMGT and LT
after a bout of moderate-intensity, steady-state aerobic exercise in recreationally active
participants. Because of the previous suggestions of a disassociation between EMGT and LT
[Mills et al., 1984], and due to the possible different metabolic and neuromuscular responses to
steady-state exercise [Beneke et al., 2001], it was hypothesized that the agreement between
EMGT and LT would decrease post-exercise.
METHODS
Experimental Approach to the Problem
A repeated measures design was utilized to evaluate if the agreement between surface
electromyography and blood lactate concentrations after a 30-min bout of steady-state aerobic
exercise. Eleven participants completed two graded exercise tests (GXT) on a cycle ergometer
separated by 30-min of steady-state cycling 40 Watts below individual LT between the two tests.

32
Blood lactate was sampled during the last minute of each stage of the GXT’s and every 5
minutes during the steady-state bout. Surface electromyography was recorded continuously
throughout each test and the exercise bout at the vastus lateralis. The EMG signal and the blood
lactate values pre- and post-exercise served as the dependent variables for this investigation.
Participants
Apparently healthy adult males (n = 5; ages = 26.4 ± 4.9 years; weight = 95.3 ± 15.5 kg;
height = 181.7 ± 6.5 cm) and females (n = 6; ages = 23.8 ± 2.2; weight = 67.8 ± 6.9 kg; height =
162.3 ± 3.3 cm) volunteered for participation in this study. A power analysis determined that
approximately 11 participants were needed to obtain statistical power at the 0.80 level.
Participants were recruited with the following criteria: 1) Between the ages of 18-40; 2)
Currently participating in regular moderate-to-vigorous aerobic training of a minimum of three
days per week for at least 30 minutes per session; and 3) Free from cardiovascular, metabolic, or
neurological disorders that would increase health risks. This study was approved by the local
university research ethics committee.
Procedures
Participants reported to the Human Performance Laboratory for one visit. Upon arrival,
participants reviewed and signed an informed consent and medical history questionnaire. After
consent, participants had height, to the nearest 0.1 cm, and weight, to the nearest 0.1 kg, taken.
Participants then performed an incremental maximal cycling test while blood lactate
concentrations ([La]), heart rate (HR), and electromyographical (EMG) signals were measured.
Prior to testing, participants were familiarized with all equipment and procedures used in the
investigation. All testing was performed on a cycle ergometer (Monark 484 E; Monark©
;Dalarna,

33
Sweden). Participants were provided an initial warm-up on the cycle ergometer at an output of
40 W for a period of three minutes. The testing phase began at a work output of 80 W and
increased in increments of 40 W every 3 minutes thereafter. Cadence was kept at a pedaling rate
of 80 (± 5) revolutions per minute. Test termination criteria consisted of: 1) Participant was no
longer able to maintain cadence; or 2) Participant fatigue.
During each stage the following variables were measured: blood lactate, ratings of
perceived exertion, heart rate, oxygen consumption (VO2), and EMG activity. Capillary blood
samples (25 µL) were taken via finger prick and analyzed the last 45 seconds of every stage
throughout the testing procedures, including rest and warm-up. Lactate was analyzed using a
single-blood-droplet device (Lactate Plus, NOVA Biomedical, Waltham, MA). This lactate
monitor has been shown to have a standard error of the estimate of 0.6 mmol.L
-1 and correlation
of 0.94 when compared to criterion laboratory measures [Tanner et al., 2010].
A heart rate monitor (Polar Electro Oy, Kemple, Finland) was also placed on the
participants’ chest in order to accurately assess heart rate during the test. A metabolic cart
(ParvoMedics Inc., Sandy, UT, USA) was used to determine peak oxygen uptake (VO2peak).
Before each test, calibration of the metabolic cart, according to the manufacturer’s instructions,
was performed. VO2peak was recorded as the average oxygen consumption, expressed as ml.kg-
1.min
-1, the last minute of the GXT. Once the LT examination was completed, participants were
given a 15-minute rest period before completing a 30-min cycling bout. This bout was performed
on a cycle ergometer at the power output level one stage (i.e., 40 W) below the individual’s LT
at a sustained cadence of 80 revolutions per minute. This level of intensity was chosen to prevent
any increase of blood [La] above LT during the exercise bout. During the cycling bout, blood
[La] was assessed every 5 minutes; and EMG collected continuously.

34
EMG signals were collected with an electronic signal acquisition system, (MP-150
Physiograph, BIOPAC System, Inc., Goleta, CA). Disposable surface electrodes (Ag/AgCl) for
the vastus lateralis were placed on the right side of the body 2/3 the distance between the anterior
superior iliac spine and the lateral portion of the patella, spaced 2 cm apart and in the direction of
the muscle fibers. A ground electrode was placed on the right anterior superior iliac spine. In
order to reduce impedance of the EMG signal, skin preparation included shaving, abrasion, and
alcohol cleansing.
Recordings below an impedance of 5 kΩ were deemed viable. Data were analyzed using
software (Acqknowledge 4.2 BIOPAC System, Inc., Goleta, CA). All EMG signals were
converted from analog to digital and raw myoelectrical signals were transformed using root
mean square (RMS) calculations. All EMG signals were averaged with 10-second RMS
windows consistent with previous research [Candotti et al., 2008, Green et al., 2014;
Mahmutovic et al., 2016]. A bandpass filter of 20- to 400-Hz cutoff frequency, fourth-order
Butterworth filter, and sampling rates of 2 kHz were used to filter the signal. The EMG signal
was averaged at 10-second windows throughout the maximal exercise tests and plotted to
determine the EMGT using the procedures explained below. For the 30-minute exercise bout, the
EMG signals acquired was averaged, using RMS transformation, at one-minute epochs
surrounding the time point at which blood [La] is measured (i.e., 30 seconds pre- and 30 post-
blood draws).
LT and EMGT Determination (Dmax Method)
In order to determine LT and EMGT, Dmax calculations were utilized. Researchers used
a 3rd
order polynomial curve, for both EMG and La, and determined Dmax to be the point that

35
provided the greatest distance to the binomial regression line formed by the lowest and highest
[La] and EMG values taken during the incremental test. The method of Dmax was previously
validated to provide reliable thresholds during incremental exercise [Zhou et al., 1997]. This
method of assessment is able to provide a more objective measure of the LT and EMGT as
compared to more subjective, fixed [La] models (e.g., 4.0 mmol.L
-1 threshold) and visual
inspection. Additionally, Dmax allows for each individual lactate value for every subject to be
equally considered for LT determination. The Dmax point was computed on a custom-written
computer program. Additionally, percent of VO2peak (%VO2peak) and percent maximal heart rate
(%HRmax) were recorded at both the point of LT and EMGT to allow for comparisons. The LT
and EMGT at baseline and following the steady state exercise bout were labeled as LT-Pre and
EMGT-Pre, respectively, and LT-Post and EMGT-Post, respectively
Statistical Analysis
The data were analyzed using SPSS version 22.0. Due to the staged, ordinal nature of the
incremental test (i.e., each stage differing by 40 Watts), the power output at the threshold levels
were compared using the Wilcoxon Matched-Pairs Signed-Rank Test. A repeated measures
analysis of variance (ANOVA) was performed to determine if differences existed between the
pre- and post-exercise thresholds when expressed as %VO2peak and %HRmax. Cohen’s d statistic
[Cohen, 1992] was calculated as the effect size of the differences in %VO2peak and %HRmax.
Hopkin’s scale of magnitude [Hopkins et al., 2009] was used where an effect size of 0-0.2 was
considered trivial, 0.2-0.6 was small, 0.6-1.2 was moderate, 1.2-2.0 was large, >2.0 was very
large. Pearson-product moment correlations were used to determine the relationships between the
LT and EMGT in %VO2peak and %HRmax. Intraclass correlation coefficients (ICC) were
calculated to determine the relationship between pre- versus post-exercise LT and between pre-

36
versus post-exercise EMGT when expressed as %VO2peak and %HRmax. ICC values less than 0.5
were determined to be poor, values between 0.5 and 0.75 were moderate, between 0.75 and 0.9
were good, and greater than 0.9 were deemed excellent [Hopkins, 2002]. The work stage at
which LT and EMGT occurred was noted and corresponding cases were counted to provide
individual agreement for each measure comparison. Statistical significance was set at α = 0.05.
RESULTS
Individual data, means (± SD), p-values, and effect sizes for all threshold values,
expressed in %VO2peak and %HRmax are shown in Table 3.1 and Table 3.2, respectively. The
mean pre- and post- 30 minute exercise GXT VO2peak in males were determined to be 34.9 ± 9.6
ml.kg
-1.min
-1 and 32.5 ± 10.3 ml
.kg
-1.min
-1, respectively; while female values were 31.9 ± 2.4
ml.kg
-1.min
-1 (pre) and 30.8 ± 3.3 ml
.kg
-1.min
-1 (post). Mean HRmax pre- and post-30 minute
exercise GXT for males were 182 ± 12 beats per minute and 177 ± 15 beats per minute,
respectively; while females were 178 ± 10 beats per minute (pre) and 175 ± 15 beats per minute
(post). EMG thresholds were seen in 10 of 11 participants examined. Thus, the statistical
comparisons represent a sample size of 10. For the 30-minute steady state bout, all means (± SD)
for each 5 minute assessment ([La], EMG, %VO2peak, %HRmax, and respiratory exchange ratio
(RER)) are displayed in Table 3.3. The only significant mean difference was seen in the last 5-
minute period of blood [La] sampling (i.e., minute 30) compared to all other previous time
points. When comparing the pre- (33.3 ± 6.5 ml.kg
-1.min
-1) versus post- (31.6 ± 6.9 ml
.kg
-1.min
-1)
mean VO2peak values, a significant difference was found (p = 0.016, Cohen’s d= 0.26); whereas
no significant differences existed in HRmax during the two incremental tests (HRmax-Pre = 179.9
± 10.6 beats.min
-1, HRmax-Post = 176.1 ± 14.1 beats
.min
-1, p = 0.3, Cohen’s d = 0.3). Time to

37
fatigue was demonstrated to be significantly different between the two incremental cycling tests
(GXT at Pre = 14.2 ± 4.15 min, GXT at Post = 9.7 ± 4.0 min, p < 0.001, Cohen’s d = 1.11).
LT: Pre- Versus Post-Steady-State-Exercise
Resting [La] values prior to the pre- (1.55 ± 0.49 mmol.L
-1) and post- (3.44 ± 2.04
mmol.L
-1) GXTs were found to be significantly different (p = 0.09, Cohen’s d = 1.27). No
significant mean differences were seen in [La] values at the LT during the pre- (3.56 ±
0.84mmol.L
-1) versus post- (3.50 ±1.99 mmol
.L
-1) GXTs.
When LT-Pre (128 ± 45 Watts) and LT-Post (104 ± 43 Watts) were expressed as Watts,
there was a significant difference (Z = -2.12, p = 0.03). LT-Pre and LT-Post occurred during the
same stage of the GXT in 5 out of the 10 participants (50%). LT-Post occurred one stage below
LT-Pre in 4 participants, and two stages below LT-Pre in 1 individual. There were no significant
mean differences between LT-Pre compared to LT-Post when represented as %VO2peak (p = 0.19;
Cohen’s d = 0.75) (Table 3.1), with ICC procedures showing poor reliability (ICC = -0.36; 95%
CI = -3.32 to 0.637; p = 0.69). When LT was expressed as %HRmax, there were no significant
mean differences seen between the pre- (81± 8%HRmax) and post-exercise (82 ± 4 %HRmax)
values (p = 0.74, Cohen’s d = 0.17) but the ICC procedures resulted poor reliability (ICC = -
0.74; 95% CI = -13.64 to 0.62; p = 0.76).
EMGT: Pre- Versus Post-Steady-State-Exercise
No significant mean differences existed in work rates, expressed in watts, pre- (140 ± 28
Watts) and post- (136 ± 47 Watts) exercise bout threshold level when determined by EMG (p =
0.76; Cohen’s d = 0.1). EMGT-Pre and EMGT-Post occurred during the same stage of the GXT

38
in 6 out of 10 participants (60%). Out of the remaining participants (i.e., 4), EMGT-Post took
place at one stage higher in 2 individuals and one stage lower in the remaining 2 individuals.
There was no significant mean difference in relation to for EMGT-Pre when compared to EMGT-
Post when expressed as %VO2peak (p = 0.13; Cohen’s d = 0.37) with good reliability (ICC = 0.84,
95% CI = 0.38 to 0.96, p = 0.004). However, a significant difference existed between the pre-
(74 ± 11 %) and post-EMGT values when expressed as %HRmax (83 ± 7%) (p = 0.04, Cohen’s d
= 0.87), with good reliability (ICC was 0.85, 95% CI = 0.44 to 0.96, p = 0.004).
Comparison between LT and EMGT: Pre-Steady-State Exercise
When LT-Pre and EMGT-Pre were expressed as Watts, no significant mean difference
existed (LT-Pre = 128 ± 45 Watts, EMGT-Pre = 140 ± 28 Watts, Z = -0.791, p = 0.429). LT-Pre
and EMGT-Pre occurred at the same stage in 3 individuals (30%). EMGT-Pre took place one
stage higher than LT-Pre in 5 participants (50%) and one stage lower in 2 individuals (20%).
When the threshold were expressed as %VO2peak, no mean differences were observed between
LT-Pre and EMGT-Pre (p = 0.46; Cohen’s d = 0.40) (Table 3.1). However, Pearson product-
moment correlations showed that the relationship between the pre-exercise threshold values to be
non-significant (r = -0.32; p = 0.36). The Bland Altman procedures suggested that EMGT-Pre
compared to LT-Pre displayed 95% limits of agreement that ranged ± 26.05 %VO2peak around a
constant error of -3.28% (Figure 3.1A), with the upper and lower limits at 29.3 and -22.7
%VO2peak, respectively. Furthermore, there was no significant trend in the errors suggesting no
proportional difference existed (r = -0.31, p = 0.39, Figure 3.1).
When the LT and EMGT at pre-exercise were expressed as %HRmax, no significant
differences existed (p = 0.25; Cohen’s d = 0.48) (Table 3.2), yet the Pearson-product moment

39
correlation between the two threshold values was non-significant (r = 0.23; p = 0.52). The Bland
Altman procedures suggested that the %HRmax expressed EMGT-Pre, compared to the LT-Pre,
displayed 95% limits of agreement that ranged ± 20 %HRmax around a constant error of -4
%HRmax (Figure 3.2A), with the upper and lower limits at 24 and -16 %HRmax , respectively.
Furthermore, there was no significant trend in the errors suggesting no proportional difference
existed (r = -0.04, p = 0.92).
Comparison between LT and EMGT: Post-Steady-State Exercise
When LT-Post (104 ± 43 Watts) and EMGT-Post (136 ± 47 Watts) were expressed in
Watts, a significant difference was observed (Z = -2.71, p = 0.01). LT-Post and EMGT-Post
occurred at the same stage in 2 individuals (20%). EMGT-Post took place one stage higher than
LT-Post in the remaining 8 participants (80%). When thresholds were expressed as %VO2peak a
significant mean difference existed LT-Post and EMGT-Post (p = 0.004; Cohen’s d = 0.71)
(Table 3.1); however, Pearson product-moment correlations showed the relationship between the
post-exercise threshold values to be non-significant (r = 0.02; p = 0.95). The Bland Altman
procedures suggested that EMGT-Post displayed 95% limits of agreement that ranged ± 18
%VO2peak around a constant error of -11 %VO2peak (Figure 3.1B), with upper and lower limits of
29 and -7 %VO2peak, respectively. Additionally, a significant trend was present in the errors
suggesting proportional bias (r = 0.79, p = 0.01). This indicated that EMGT-Post had a tendency
to overpredict LT, expressed as %VO2peak, after a bout of exercise. When the LT and EMGT
post-exercise were expressed as %HRmax, no significant mean differences existed (p = 0.11;
Cohen’s d = 0.69) (Table 3.2), yet the Pearson-product moment correlation between the two
threshold values was non-significant (r = 0.35; p = 0.32). The Bland Altman procedures

40
suggested that the %HRmax expressed EMGT-Post, compared to the LT-Post, displayed 95%
limits of agreement that ranged ± 17 %HRmax around a constant error of -5 %HRmax (Figure
3.2A), with the upper and lower limits at 22 and -12 %HRmax, respectively. Furthermore, there
was a significant trend in the errors suggesting proportional difference (r = 0.72, p = 0.02).

41
Table 3.1. Individual and group mean ± SD values among the participants for %VO2peak values at EMGT and LT (n =10)
Participant EMGT_Pre(%VO2peak)
LT-PRE (%VO2peak)
DIFF (%VO2peak)
EMGT_Post (%VO2peak)
LT-POST (%VO2peak)
DIFF (%VO2peak)
∆EMGT
(%VO2peak) ∆LT
(%VO2peak) DIFF
(%VO2peak)
1 65 63 2 79 64 15 -14 -1 -13
2 81 73 8 86 68 18 -5 5 -10
3 64 74 -10 63 63 0 1 11 -10
4 67 62 5 64 68 -4 3 -6 9
5 78 51 27 85 65 20 -7 -14 7
6 84 62 22 82 65 17 2 -3 5
7 73 73 0 74 64 10 -1 9 -10
8 66 80 -14 65 64 0 1 16 -15
9 72 70 2 80 57 23 -8 13 -21
10 72 82 -10 76 62 14 -4 20 -24
Mean 72 69 3 75 64 11 -3 5 -8
SD 7 9 13 9 3 9 6 11 11
95% CI 14 18 26 18 6 18 12 22 22
p 0.46 0.004 0.06
Cohen’s d 0.40 0.71 0.90
Abbreviation: EMGT = electromyographical threshold; LT = lactate threshold; DIFF = difference in %VO2peak between EMGT and LT;
∆ = Change in %VO2peak from Pre- to Post-30 minutes of aerobic exercise

42
Table 3.2. Individual and group mean ± SD values among the participants for %HRmax at EMGT and LT (n = 10)
Participant EMGT_Pre
(%HRmax) LT-PRE (%HRmax)
DIFF (%HRmax)
EMGT_Post (%HRmax)
LT-POST (%HRmax)
DIFF (%HRmax)
∆EMGT
(%HRmax) ∆LT
(%HRmax) DIFF
(%HRmax)
1 69 70 -1 66 80 -14 3 -10 13
2 94 81 13 91 81 10 3 0 3
3 84 84 0 82 82 0 2 2 0
4 76 73 3 92 92 0 -16 -19 3
5 91 67 24 93 80 13 -2 -13 11
6 93 80 13 91 82 9 2 -2 4
7 90 90 0 93 82 11 -3 8 -11
8 81 87 -6 78 78 0 3 9 -6
9 88 84 4 95 82 13 -7 2 -9
10 82 92 -10 86 79 7 -4 13 -17
Mean 85 81 4 87 82 5 -2 -1 0
SD 8 8 10 9 4 8 6 10 10
95% CI 16 16 20 18 8 16 12 20 20
p 0.25 0.11 0.76
Cohen’s d 0.48 0.69 0.11
Abbreviation: EMGT = electromyographical threshold; LT = lactate threshold; DIFF = difference in %HRmax between EMGT and LT;
∆ = Change in %HRmax from Pre- to Post-30 minutes of aerobic exercise

43
Table 3.3. Changes across 30-minute Steady State Aerobic Exercise Bout (n=10)
Abbreviation: [La] = blood lactate concentration; EMG = electromyography of vastus lateralis;
%VO2peak = percentage of maximal oxygen consumption; %HRmax = percentage of maximal heart rate;
RER = respiratory exchange ratio
*Significantly lower than all other time periods (p < 0.05)
Mean ± SD
[La] EMG %VO2peak %HRmax RER
5 min 5.1 ± 2.2 0.1262 ± 0.31 61 ± 9 80 ± 4 0.87 ± 0.09
10 min 4.6 ± 2.3 0.1245 ± 0.30 58 ± 8 81 ± 6 0.89 ± 0.07
15 min 5.1 ± 2.9 0.1237 ± 0.31 61 ± 10 80 ± 7 0.89 ± 0.06
20 min 4.4 ± 2.6 0.1155 ± 0.29 56 ± 11 79 ± 7 0.87 ± 0.05
25 min 4.0 ± 2.5 0.1159 ± 0.29 59 ± 9 80 ± 9 0.87 ± 0.06
30 min 3.4 ± 2.3* 0.1115 ± 0.27 57 ± 10 81 ± 9 0.86 ± 0.04

44
C
E/B
ias
%V
O2
pea
k (
EM
GT –
LT
)
CE
/Bia
s %
VO
2pea
k (
EM
GT –
LT
)
Mean %VO2peak [(EMGT+ LT)/2] [A] Mean %VO2peak [(EMGT+ LT)/2] [B]
Figure 3.1. Bland and Altman plot comparing [A] EMGT-Pre 30 min of aerobic exercise and LT-Pre %VO2peak; and [B] EMGT-
Post 30 min of aerobic exercise and LT-Post %VO2peak. The middle solid lines indicate the constant error or mean differences. The
dashed lines represent the upper and lower limits of agreement (± 1.96 SD). The dashed-dotted regression lines represent the trend
between the errors of each measurement when bias is present.
Agreement of Pre- Agreement of Post-

45
CE
/Bia
s %
HR
max
(E
MG
T –
LT
)
Mean %HRmax [(EMGT+
LT)/2] [A]
CE
/Bia
s %
HR
max
(E
MG
T –
LT
)
Mean %HRmax [(EMGT+ LT)/2] [B]
Figure 3.2. Bland and Altman plot comparing [A] EMGT-Pre 30 min of aerobic exercise and LT-Pre %HRmax; and [B] EMGT-
Post 30 min of aerobic exercise and LT-Post %HRmax. The middle solid lines indicate the constant error or mean differences.
The dashed lines represent the upper and lower limits of agreement (± 1.96 SD). The dashed-dotted regression lines represent
the trend between the errors of each measurement when bias is present.
Agreement of Pre- Agreement of Post-

46
DISCUSSION
Because of the relationship between the recruitment of type II muscle fibers and blood
lactate accumulation, the EMGT has been suggested as a non-invasive estimate of the LT.
Research is needed to examine the agreement between the EMGT and the LT at baseline and
after a steady state bout of aerobic exercise where a temporal disassociation between lactate
concentration and muscle fiber type selection may occur, hence the purpose of the current
investigation. The results showed that the LT and EMGT occurred between the range of 64% to
80% of peak work rate, which is consistent with previous research [Demello et al., 1987; Farina,
Ferguson et al., 2007; Green et al., 2014; Seburn et al., 1992]. However, the results indicated that
LT-Pre and LT-Post were significantly different depending on the specific metric for work rate.
For instance, the LT occurred at a lower power output during the post-GXT, yet there were no
mean differences between the LT-Pre and LT-Post when expressed as %VO2peak and %HRmax.
The ICC procedures suggested poor (ICC = -0.74 and -0.36, respectively) reliability, indicating
differing patterns of individual variance between the LTs of the pre- versus post-GXT. The
results between EMGT-Pre and EMGT-Post indicated a stronger ICC indicating a better degree of
reliability when expressed as %VO2peak and %HRmax. Additionally, no significant mean
differences were found when the pre- and post-EMGT was represented as Watts or %VO2peak.
When comparing the EMGT and LT at the pre-steady-state-exercise time-points, no significant
mean differences were found between the two thresholds when represented as any of the three
work rate values. However, when comparing the post-steady-state-exercise time-points, the LT
provided significantly lower work rate values expressed as Watts and %VO2peak. Furthermore,
the Pearson-product correlation procedures showed no significant relationships between EMGT
and LT at either pre- or post-time points. The Bland-Altman procedures also displayed a wide

47
range of individual differences between the two threshold markers. In addition, a proportional
difference was found in the post-steady-state values, indicating that the EMGT provided a
significant trend to over-estimate the LT with higher threshold values.
Furthermore, the individual agreement between pre- and post-GXT indicated that the LT
occurred during the same stage in 5 out of the 10 participants; while EMGT occurred in the same
stage for 6 of the 10 individuals. Post-GXT LT took place one stage below pre-GXT in 4 of the
remaining participants and two stages below in one participant. Whereas, post-GXT EMGT
occurred in one stage above pre-GXT EMGT in 2 individuals and one stage below in the
remaining two participants. Additionally, individual agreement demonstrated that pre-GXT LT
and EMGT occurred at the same stage in 3 individuals (30%). The pre-GXT EMGT took place
one stage higher than LT in 5 participants (50%) and one stage lower in 2 individuals (20%). For
the post-GXT individual agreement, LT and EMGT was observed at the same work rate for only
2 individuals (20%) with EMGT occurring one stage higher than LT in the remaining 8
individuals. Collectively, the results of the study suggest that poor individual agreement existed
between EMGT and LT before and after 30 minutes of steady state aerobic exercise. Further, it
appears that the EMGT was a more reliable measure across the 30-minute steady state bout of
exercise than the LT.
The study also demonstrated that observed VO2peak in the post-GXT was significantly
lower compared to pre-GXT. Because the sample examined consisted of untrained cyclists, the
30-minute steady state protocol may have induced volitional fatigue at a lower work rate in the
post-GXT leading to a reduction in pedaling cadence (criteria for termination).The investigators
observed consistent RPE values (data not provided) between the last stages of the GXTs despite
VO2peak being significantly lower during the 2nd
test. Therefore, the decreased VO2peak in the post-

48
GXT may have been due to the subjects perceiving a maximal-level of exertion at lower oxygen
consumption. Furthermore, because LT occurred at a lower work rate (when evaluated as Watts)
following 30 minutes of steady state exercise, anaerobic metabolism may have predominated
earlier during the 2nd
GXT. An earlier onset of predominating anaerobic metabolism may have
also lead to a higher heart rate at a given oxygen cost [Powers, 2012], which may explain the
lower VO2peak in post-GXT compared to pre-GXT, despite no differences in HRmax.
EMGT can be defined as the greatest exercise intensity an individual can maintain without
an exponential increase in the amplitude of the EMG signal [MahmutoviĆ et al., 2016].
Previously, the EMG response to a GXT has been considered to be related to the response in
blood lactate, hence the purported validity of EMGT serving as a less invasive measure than LT.
Whereas previous research in the relationship between [La] and EMG exhibited a relationship
that may be construed as cause-effect [Candotti et al., 2008], an alternative approach may be
indicative of a revolving cascade of events leading to both increases in both [La] and EMG
signal amplitude during exercise. During incrementally increasing exercise a greater reliance on
anaerobic metabolism occurs, initiating a rise in blood [La] due to the breakdown of glycogen in
working skeletal muscle [Powers, 2012]. A rise in La production is accompanied by an increase
in H+ ions as a by-product of anaerobic glycolysis; thereby further decreasing blood pH [Powers,
2012]. The exponential rise in [La] is associated with an increase in motor unit recruitment,
which is displayed as an increase in EMG amplitude. The concurrent increase in H+ ion
concentration activates group III and IV muscle afferents which inhibits α-motor neurons and
decreases signal conduction to the working muscle [Amann, 2012; Amann et al., 2015].
While the physiological response to increasing exercise intensity between [La] and EMG
signaling appear to be associated, their interaction may not be cause-effect. For instance, blood

49
[La] has been observed to gradually decrease over time during long-term, steady state training,
mainly due to a decrease in glycogen content [Dumke et al., 2006]. However, Briscoe et al.
(2014) demonstrated no change in EMG amplitude during 40 minutes of steady state exercise at
or below the EMGT. The current study also demonstrated a significant reduction in [La] during
the 30-minute steady-state bout; yet no significant change in EMG signal amplitude occurred.
Furthermore, the post-GXT LT was significantly lower than the pre-GXT LT, yet no difference
in the EMGT was found.
To extend the latter point in the previous paragraph, the current study indicated poor
individual agreement between the two threshold markers, which supports the postulation that the
EMG and [La] response are not a cause-effect relationship [Mills et al., 1984]. For instance,
Mills and Edwards (1984) demonstrated that EMG and motor unit recruitment were not affected
by the accumulation of blood [La] and did not play a role in muscular fatigue in patients with
McArdle’s Syndrome [Mills et al., 1984]. It was suggested that potential increases in potassium
ion concentration induce greater fatigability of muscular membrane excitation, increasing motor
unit recruitment. Similarly, additional research by Juel (1988) suggested that an increase in
potassium concentration, which occurs independent of an increase in [La], decreased motor unit
conduction velocity thereby increasing EMG amplitude [Juel, 1988]. Furthermore, Seburn et al.
(1992) demonstrated no relationship between EMG and [La] during an incremental cycling test
after a bout of exercise with the intent to increase blood [La] [Seburn et al., 1992], which was
similar to the current findings since elevated resting [La] levels were seen before initiating the
post-GXT. Further consistent with Seburn et al. (1992), the current results showed decreases in
blood [La] during increasing post-GXT work rates following a pre-elevation in [La]. The
decreases in blood [La] may be attributed to work rates below the level of LT in the early stages

50
of the incremental test. The clearance of [La] can be optimally observed at 30-40 %VO2peak
[Powers, 2012], which may have been the cause of early clearance from an elevated blood [La]
at the onset of the post-GXT. Previous examination of [La] recovery suggests a longer duration
to return to resting levels (i.e., minutes to hours) compared to EMG amplitude signal recovery,
which has been suggested to recover immediately after an exercise bout [Komi 1984; Petrofsky,
1979]. Results of the current study also showed no significant differences in work rates between
EMGT-Pre and EMGT-Post. This leads to the speculation that EMG maintains its relationship
with changes in incremental exercise and associated increases in amplitude signaling
independent of pH and [La].
The disconnection between LT and EMGT does not implicitly imply that each of these
markers is not regarded as equally important for the purposes of training considerations. The use
of LT to prescribe training intensities may be useful and can based upon the metabolic demands
of the given task (e.g., aerobic versus anaerobic); whereas EMGT may have a greater application
in the monitoring of motor unit recruitment and muscle fiber type utilization. Further research is
needed to determine the specific importance of each threshold marker in regards to exercise
prescription.
This study is not without limitations. One such limitation was that the population
examined was limited to untrained cyclists between the ages of 18 and 40 years. Trained
endurance athletes may have demonstrated a larger decrease in [La] removal during the 30-
minute steady-state bout as compared to an untrained population [Barak et al., 2011; Martin et
al., 1998]. This larger difference in clearance rate may have decreased [La] closer to resting
values; thereby affecting the relationship between LT and EMGT during the post-GXT.
Nevertheless, the purpose of this study was to examine the agreement between the two

51
thresholds pre- and post-exercise in recreationally trained individuals. Second, the protocol used
for the GXT used a 40 Watt increase between stages to determine the LT and EMGT. Though the
protocol has been used in previous investigations [Candotti et al., 2008], a smaller incremental
increase in work rate (e.g., 20 Watts) may be a more practical method of LT and EMGT
determination in untrained participants as large incremental increases may have led to quicker
fatigue in participants during the post-exercise GXT that are unaccustomed to higher intensity
work rates. Additionally, the current study was performed upon a cycle ergometer, the results
thus may not be extrapolated to different modalities of cardiovascular training as EMG patterns
and [La] may differ during various GXT protocols. Therefore, future research should examine
the agreement of EMGT and LT within various modalities (e.g., running, arm ergometry,
rowing).
PRACTICAL APPLICATIONS
Monitoring blood [La] levels has importance in endurance training and is typically
performed in a laboratory setting. The capacity to accurately determine LT in the field is an
important tool for research as well as prescribing training intensity, monitoring changes in
performance, or examining physiological adaptations as a result of LT training. The use of EMG
has been recently shown to provide a non-invasive way of capturing work rates and thresholds
comparable to LT testing and may provide a reliable field metric for practitioners and athletes.
The results of this investigation determined that EMGT accurately assessed LT, when expressed
as Watts, %VO2peak, and %HRmax. However, after a bout of steady-state exercise, a disassociation
was observed between LT and EMGT, displaying significant differences in both Watts and
%VO2peak. The results also indicated poor reliability in the ability to repeat LT after a bout of
52
cycling. These findings indicate that the recovery of the EMG signal may occur immediately and
thus repeatable after training or day-to-day; while blood [La] may require additional recovery
time to repeat LT testing. Practitioners should take note that both while LT and EMGT testing
may display similar properties during maximal exercise testing, they are not interchangeable.
Therefore, further research is needed to determine the ability of these two metrics (LT and
EMGT) to prescribe training intensities and various applications in the field.
REFERENCES
1. Amann M. Significance of Group III and IV muscle afferents for the endurance exercising
human. Clinical and Experimental Pharmacology and Physiology 2012;39(9):831-835
2. Amann M, Sidhu SK, Weavil JC, Mangum TS, Venturelli M. Autonomic responses to
exercise: group III/IV muscle afferents and fatigue. Autonomic Neuroscience 2015;188:19-
23
3. Baechle TR, Earle RW. Essentials of strength training and conditioning 2nd ed. Champaign,
IL: Human Kinetics 2000
4. Barak OF, Ovcin ZB, Jakovljevic DG, Lozanov-Crvenkovic Z, Brodie DA, Grujic NG. Heart
rate recovery after submaximal exercise in four different recovery protocols in male athletes
and non-athletes. Journal of Sports Science & Medicine 2011;10(2):369-375
5. Beneke R, Leithäuser RM, Hütler M. Dependence of the maximal lactate steady state on the
motor pattern of exercise. British Journal of Sports Medicine 2001;35(3):192-196
6. Candotti CT, Loss JF, Melo MO, La Torre M, Pasini M, Dutra LA, de Oliveira JLN, de
Oliveira Jr LP. Comparing the lactate and EMG thresholds of recreational cyclists during
incremental pedaling exercise. Canadian Journal of Physiology & Pharmacology
2008;86(5):272-278
7. Cohen J. Statistical power analysis. Current directions in psychological science 1992;1(3):98-
101
8. Davis JA, Frank MH, Whipp BJ, Wasserman K. Anaerobic threshold alterations caused by
endurance training in middle-aged men. Journal of Applied Physiology: Respiratory,
Environmental & Exercise Physiology 1979;46(6):1039

53
9. DemelloJJ, Cureton KJ, Boineau RE, Singh MM. Ratings of perceived exertion at the lactate
threshold in trained and untrained men and women. Medicine & Science in Sports& Exercise
1987;19(4):354-362
10. Dumke CL, Brock DW, Helms BH, Haff GG. Heart rate at lactate threshold and cycling time
trials. Journal of Strength & Conditioning Research 2006;120(3):601-607
11. Farina D, Ferguson RA, Macaluso A, De Vito G. Correlation of average muscle fiber
conduction velocity measured during cycling exercise with myosin heavy chain composition,
lactate threshold, and VO2max. Journal of Electromyography and Kinesiology
2007;17(4):393-400
12. Gollnick PD, Bayly WM, Hodgson DR. Exercise intensity, training, diet, and lactate
concentration in muscle and blood. Medicine and Science in Sports and Exercise
1986;18(3):334-340
13. Green JM, Hornsby JH, Pritchett RC, Pritchett K. Lactate Threshold Comparison in
Anaerobic vs. Aerobic Athletes and Untrained Participants. International Journal of Exercise
Science 2014;7(4):329-338
14. Guffey DR, Gervasi BJ, Maes AA, Malek MH. Estimating electromyographic and heart rate
fatigue thresholds from a single treadmill test. Muscle and Nerve 2012;46(4):577-581
15. Hopkins W, Marshall S, Batterham A, Hanin J. Progressive statistics for studies in sports
medicine and exercise science. Medicine& Science in Sports & Exercise 2009;41(1):3
16. Hopkins WG. A scale of magnitudes for effect statistics.A New View of Statistics.
newstats.org/effectmag.html 2002
17. Juel C. Muscle action potential propagation velocity changes during activity. Muscle & nerve
1988;11(7): 714-719
18. Komi PV. Fatigue and recovery of neuromuscular function. Physiological Chemistry of
Training and Detraining 1984;187-201
19. MahmutoviĆ S, Sprout EY, Fontaine JC, Buskirk TM, Galen SS, Malek MH. Test–retest
reliability of the electromyographic fatigue threshold for cycle ergometry. Muscle & nerve
2016;53(5):803-807
20. Malek MH, Coburn JW, Weir JP, Beck TW, Housh TJ. The effects of innervation zone on
electromyographic amplitude and mean power frequency during incremental cycle
ergometry. Journal of Neuroscience Methods 2006;155:126-133
21. Martin NA, Zoeller RF, Robertson RJ, Lephart SM. The comparative effects of sports
massage, active recovery, and rest in promoting blood lactate clearance after supramaximal
leg exercise. Journal of Athletic Training 1998;33(1): 30

54
22. Mills KR, Edwards RHT. Muscle fatigue in myophosphorylase deficiency: power spectral
analysis of the electromyogram. Electroencephalography and Clinical Neurophysiology
1984;57(4):330-335
23. Petrofsky J. Frequency and amplitude analysis of the EMG during exercise on the bicycle
ergometer. European Journal of Applied Physiology & Occupational Physiology
1979;41(1):1
24. Powers KS. Exercise physiology theory and application to fitness and performanceNew
York: McGrawHill 2012
25. Seburn KL, Sanderson DJ, Belcastro AN, McKenzie DC. Effect of manipulation of plasma
lactate on integrated EMG during cycling. Medicine & Science in Sports & Exercise
1992;24(8):911-916
26. Tanner RK, Fuller KL, Ross ML. Evaluation of three portable blood lactate analysers:
Lactate Pro, Lactate Scout and Lactate Plus.European journal of applied physiology
2010;109(3):551-559
27. Travis LA, Arthmire SJ, Baig AM, Malek MH, Goldberg A. Intersession reliability of the
electromyographic signal during incremental cycle ergometry: Quadriceps femoris. Muscle
and Nerve 2011;44(6):937-946
28. Yoshida T. Effect of dietary modifications on lactate threshold and onset of blood lactate
accumulation during incremental exercise. European Journal of Applied Physiology &
Occupational Physiology 1984;53(3):200-205
29. Zhou S, Weston SB. Reliability of using the D-max method to define physiological responses
to incremental exercise testing. Physiological measurement 1997;18(2):145

55
CHAPTER 4
COMPARSION OF ELECTROMYOGRAPHICAL SIGNAL ANALYSES FOR ESTIMATING
LACTATE THRESHOLD
ABSTRACT
Currently, no published research exists comparing filtering methods of
electromyographical (EMG) analyses to estimate lactate threshold (LT). The purpose of this
investigation was to evaluate and compare EMG transformations and time windows to predict
LT. Participants (n=14) completed an incremental, maximal exercise test on a cycle ergometer
until exhaustion. Blood lactate was measured every minute, while electromyography was
recorded continuously at the vastus lateralis. EMG signaling was then transformed and filtered
using two time-segment windows (i.e., 10 and 60 seconds), as well as three signal conversions
(i.e., root mean square, smoothing, and peak amplitude averaging). Results indicated no mean
differences between the EMG thresholds, for any of the filtering methods, when compared to the
LT criterion. Moderate correlations were seen when comparing each of the EMG filters to LT
ranging from 0.69 – 0.79. Root mean square and Smoothing filters accurately indicated LT in 10
out of 14 participants; whereas peak amplitude averaging indicated LT for 11 out of 14
participants. EMG may be a useful tool to estimate the work rate associated with LT. Averaging
EMG over a minute of time and continual 10-second recordings demonstrate comparable
readings and allow an easier application of EMG threshold in the field.
Key Words: Aerobic Training, Blood Lactate, Threshold Training

56
INTRODUCTION
Continual changes in blood lactate concentrations ([La]) during incremental exercise
often make accurate analysis of lactate threshold (LT) challenging in laboratory and field
settings. Most lactate analyses require laboratory equipment, trained personnel, as well as
drawing and handling of blood. Additionally, various methods are utilized to determine a precise,
individualized LT, particularly with the use of mathematical algorithms (e.g., Dmax, log-log
transformations, regression modeling, etc.) [de Sousa et al., 2011; Stanula et al., 2013]. As a
result, simpler methods of prediction have been used to estimate [La] during incremental aerobic
activity (e.g., electromyography (EMG)). By monitoring muscle activity via EMG, practitioners
may be able to pinpoint the transition between slow-twitch (i.e., aerobic) and fast-twitch (i.e.,
anaerobic) muscle fiber recruitment. This transition is stated to be the EMG threshold (EMGT).
The relationship between LT and EMGT has been previously investigated and has demonstrated
no significant difference in work output [Candotti et al., 2008]. Reliability of the EMG signal to
produce a similar threshold on two separate occasions has also been demonstrated [MahmutoviĆ,
et al., 2016]; thereby increasing the value of a non-invasive field tool to provide thresholds
which practitioners may use to prescribe training intensities.
The averaging of time windows (i.e., segments) has been used as a method of
determining the EMGT [Candotti et al., 2008; Guffey et al., 2012]. For instance, Candotti et al.
(2008) used a sampling average of 1-second RMS values to determine the correlation coefficient
between EMG and blood [La] during incremental cycling exercise. Results indicated a positive,
significant association (r = 0.83) [Candotti et al., 2008]. Ten-second averages of the EMG during
incremental testing have also been used to pinpoint the EMGT with similar results (r = 0.73 –

57
0.83) [Jürimäe et al., 2007] further demonstrating a practical use of an EMG signal to provide
indication of the shift of aerobic to anaerobic metabolism during physical activity.
Despite the non-invasive nature of EMG, understanding raw signaling transformations is
an important step in monitoring muscular activation. Raw EMG signaling presents an
unprocessed amplification of the summation of motor unit action potentials as they reach the
skin. Additionally, raw signaling oscillates between the positive and negative poles of the
electrodes, which prohibit segment averaging as the positive and negative amplitudes would
cancel out and equal zero. Therefore, signal filtering and transformation of raw EMG is needed
to provide a valid interpretation. Common methods of filtering are root mean square (RMS),
integral averaging (Smoothing), and mean peak (maximal amplitude averaging).
Previous investigation into the prediction of the LT via the EMGT is limited. However,
several studies have examined the various methods by which to process the raw EMG signals
(e.g., Dmax, log-log, 3rd
order polynomials), but no study has yet to determine the most
appropriate filtering method (i.e., root mean square, smoothing, mean peak) or compared time-
window segments (i.e., 10- or 60-second averaging) of the EMG signals to estimate blood [La]
activity during incremental exercise. Thus, the purpose of this investigation was to evaluate and
compare various EMG transformations and time window segments to predict LT activity. It was
hypothesized that maximal amplitude averages would have a stronger association with the
estimation of blood [La] versus root mean square or smoothing signal filtering. Additionally it
was hypothesized that no differences would exist between 10- or 60-second window averaging
segments of the EMG recording.

58
METHODS
Experimental Approach to the Problem
A single-visit, multiple measurement was utilized to determine which filtering and
averaging method of the raw surface electromyography signal would best predict lactate
threshold during incremental exercise. Fourteen participants completed a maximal incremental
exercise test during one visit to the lab. During the trial, blood lactate was sampled every minute
via finger prick, while surface electromyography was continuously recorded from the vastus
lateralis. The raw electromyography signal was transformed using three filtering and averaging
methods (i.e., root mean square, smoothing, and mean peak). Each filtered signal was averaged
over 10 and 60 seconds throughout the entire test and used to predict lactate threshold via
inflection point calculations (i.e., Dmax).
Participants
Fourteen males (n = 9; ages = 23.67 ± 5.55 years; height = 175.71 ± 4.16 cm; weight =
85.61 ± 10.05 kg) and females (n = 5; ages = 20.80 ± 1.30; height = 163.12 ± 8.44; weight =
57.76 ± 8.25 kg) volunteered to participate in this study. A power analysis determined that
approximately 11 participants would be needed to obtain statistical power at the Beta=0.80 level.
Participants recruited met the following criteria: 1) Between the ages of 18-40; 2) Currently
participating in regular moderate-to-vigorous aerobic training of a minimum of three days per
week for at least 30 minutes per session; and 3) Free from cardiovascular, metabolic, or
neurological disorders that would otherwise affect the results or negatively impact safety. This
study was approved by the university ethics committee.

59
Procedures
Participants were asked to report to the Human Performance Laboratory for one visit.
Upon arrival, participants completed and signed an informed consent and medical history
questionnaire. After consent, participants had height and weight measurements taken. Standing
height was measured to the nearest 0.1cm using a stadiometer (SECA 67310, SECA©
, Chino,
CA); while weight was measured to the nearest 0.1 kg (Tanita BWB-800, Tanita©
, Arlington
Heights, IL). All eligible participants performed an incremental maximal cycling test while blood
lactate, heart rate, and electromyographical signals were measured. Prior to testing, participants
were familiarized with all equipment and procedures used in the investigation. All testing was
performed on a cycle ergometer (Monark 484 E; Monark©
; Dalarna, Sweden). For the cycling
protocol, participants began with an initial three-minute warm-up on the cycle ergometer at an
output of 40 Watts (W). Following the warm-up the testing phase began at a work output of 80
W and increased in increments of 40 W every 3 minutes thereafter. Cadence was kept at 80 (±5)
revolutions per minute. Test termination criteria were determined to be: 1) Participant was no
longer able to maintain cadence; or 2) Volitional fatigue.
During each stage, the following variables were measured: blood lactate, heart rate, VO2,
and EMG activity. Capillary blood samples (25 µL) were taken via finger prick and analyzed the
last 45 seconds of each stage throughout the testing procedures, including rest and warm-up.
Lactate was analyzed via the Lactate Plus (NOVA Biomedical, Waltham, MA). The Lactate Plus
monitor has been demonstrated to have a standard error of the estimate of 0.6 mmol.L
-1with a
0.94 correlation when compared to laboratory measures [Tanner et al., 2010]. A heart rate
monitor (Polar Electro Oy, Kemple, Finland) was also placed on the participant’s chest to assess
heart rate during the test. A metabolic cart (TrueOne® 2400, ParvoMedics Inc., Sandy, UT,

60
USA) was used to determine oxygen consumption. The metabolic cart was properly calibrated
according to the manufacturer’s instructions before each test. Peak oxygen consumption
(VO2peak) was recorded as the average oxygen consumption, expressed as ml.kg-1.min-1
, among
the last minute of the incremental exercise test.
Surface EMG signals were collected with an electronic signal acquisition system, (MP-
150 Physiograph, BIOPAC System, Inc., Goleta, CA). Disposable surface electrodes (Ag/AgCl)
for were placed on the right vastus lateralis 2/3 the distance between the anterior superior iliac
spine and the lateral portion of the patella, spaced 2 cm apart and in the direction of the muscle
fibers. A ground electrode was placed on the right anterior superior iliac spine. Preparation for
the skin sites included shaving, abrasion, and alcohol cleansing in order to reduce impedance of
EMG signals. Recordings were deemed viable when impedance test measurement was below 5
kΩ.
Data were analyzed using software (Acknowledge 4.2 BIOPAC System, Inc., Goleta,
CA). Raw myoelectrical signals were quantified by using the root mean square (RMS) as well as
processed using a moving average of 300 samples per second (i.e., Smoothing) and maximal
amplitude averaging. Prior to smoothing and PK averaging, the raw signal was rectified to
provide the absolute values of the sample. Sampling rates of 2 kHz were used to record EMG
along with a 20- to 400-Hz cutoff frequency bandpass filter and a fourth-order Butterworth filter.
All signals were converted from analog to digital. All filtering methods of the EMG signal were
average over 60-second epochs and compared to the criterion of 10-second RMS (RMS-10). A
sample 10-second electromyographical recording during a portion of the maximal exercise test,
for one subject, is provided in Figure 1.

61
Figure 4.1. Sample 10-second electromyographical recording for one subject
LT and EMGT Determination (Dmax Method)
LT and EMGT were determined in each participant via Dmax calculations. Dmax was
defined as the point of maximal distance from a 3rd
order polynomial equation, utilizing the [La]
and EMG curves, to the line formed by the lowest and highest [La] and EMG values taken
during the incremental test. The Dmax method has been validated as a reliable computational
method to provide training thresholds during incremental exercise testing [Zhou et al., 1997].
The Dmax model of LT assessment is able to provide a more individualized approach and
identification; whereas fixed concentration models (e.g., visual inspection, 4.0 mmol.L
-1
threshold, etc.) may be subjective in nature and prone to bias. Additionally, Dmax allows for
each individual lactate value for every participant to be equally considered for LT determination.
The Dmax point was computed on a custom-written computer program. The percent of VO2peak
(%VO2peak) and percent maximal heart rate (%HRmax) were recorded at all threshold levels to
allow for comparisons.

62
Statistical Analysis
Statistical analysis was performed using a software package (SPSS Version 22.0; SPSS
Inc., Chicago, IL). Due to the staged, ordinal nature of the incremental test, the various methods
of EMG filtering (RMS-10, RMS-60, Smoothing, and PK) were compared to the criterion (i.e.,
LT) using the Wilcoxon Matched-Pairs Signed-Rank Test. Spearman’s rank order correlation
was performed to determine the relationship between LT and each of the various EMG filtering
methods. The work stage at which LT and EMGT occurred for each filtering and time epoch
method was noted and corresponding cases were counted to provide individual agreement for
each measure comparison.
RESULTS
LT and EMG thresholds were observed in all participants and used in data analysis. The
Wilcoxon Signed-Rank test demonstrated no differences among RMS-10 (Z = -0.816, p = 0.41),
RMS-60 (Z = -1.0, p = 0.32), Smoothing (Z = -1.0, p = 0.32), or PK (Z = -0.577, p = 0.56) when
compared to the threshold criterion using blood [La]. Spearman’s rho determined significant
correlations between LT and RMS-10 (rs = 0.69, p= 0.006), RMS-60 (rs= 0.79, p = 0.001),
Smoothing (rs = 0.79, p = 0.001), and PK (rs = 0.78, p = 0.001). Additionally, the results
indicated that LT was accurately determined by RMS-10, RMS-60, and Smoothing for 10 out of
14 participants (i.e., 71 %); whereas PK predicted LT in 11 out of the 14 (i.e., 79%) participants.
For the 4 participants that were not accurately assessed by RMS-10, RMS-60, and Smoothing,
EMG underestimated LT in 3 individuals and over-estimated in 1 individual. In terms of PK,
results indicated an underestimation in 2 individuals and 1 over-estimate in the ability of EMG to
predict LT.

63
DISCUSSION
The purpose of this investigation was to evaluate practical filtering methods of the raw
EMG signal in order to best estimate lactate threshold during an incremental exercise bout. The
study also tested the difference between a 10-second average of the EMG signal versus 60
seconds. No significant differences were seen for any of the EMG filtering and time averaging
methods when compared to LT. The results of this investigation supported previous work
establishing EMG as a viable means of predicting LT during incremental exercise [Candotti et
al., 2008; de Sousa et al., 2011; MahmutoviĆ et al., 2016]. However, differences existed between
the EMG measures to estimate the stage at which LT occurred. PK predicted LT the greatest
amount of times (79%) compared to RMS-10, RMS-60, and Smoothing, which predicted LT 10
out of 14 times (71%). Each of the EMG filtering methods over-estimated LT in the same
participant by one stage; however, RMS-10, RMS-60, and Smoothing under-estimated LT by
one stage in three individuals compared to two underestimations by PK.
Mahmutovic et al. (2016) demonstrated that the EMGT was reproducible after a period of
48 hours using EMG averaged at 10-second RMS epochs during the end of each stage
throughout a maximal aerobic test. Researchers found an excellent reliability with an ICC of 0.85
[MahmutoviĆ et al., 2016]. While Dmax was not used for signal processing, a common method
of linear regression was performed, which found no difference in work rate during an
incremental cycling test [de Sousa et al., 2011]. Additionally, Zuniga et al. (2013) demonstrated
no significant differences, using the V-slope mathematical procedure, when examining anaerobic
thresholds using 20-second epoch RMS EMG signaling compared to ventilatory and lactate
thresholds. It was observed that EMG amplitude increased during times when the ability to
produce force or power during an incremental treadmill test was reduced [Zuniga et al., 2013].

64
Whereas EMG was able to estimate the threshold level of lactate in the current study;
previous results have seen inconsistent outcomes. The differences seen within studies
demonstrating the ability or inability of EMG to estimate the aerobic/anaerobic transition may
reside within the computational methods used to analyze the EMG signal. For instance, Seburn et
al., (1992) observed a linear response to an incremental cycle exam while recording integrated
EMG averaged for 60-seconds increments throughout the test [Seburn et al., 1992]. This may be
possibly explained by the use of well-trained cyclists and smaller incremental increases (i.e.,
23.5 watts) between stages as compared to the current study using untrained cyclists and a 40-
watt increase for each stage. By utilizing a smaller increment between stages and well trained
cyclists, the increase in motor unit recruitment to produce changes in the amplitude of the EMG
signal may have not been sufficient to produce an exponential relationship. Taylor and Bronks
(1994) also demonstrated significant differences between LT and EMGT while using integrated
EMG using an incremental treadmill test. However, the analysis used to determine EMGT was a
visual inspection of researcher-determined regression lines to determine a breakpoint in the
signal [Taylor et al., 1994]. Visual inspection of the breakpoints in either LT or EMGT would
result in a more subjective determination, may exclude smaller breakpoints in the data for
analysis, and be more prone to bias.
In terms of the filtering methods used within the current study, RMS provided an
additional filtering option of the raw EMG signal through a process involving the initial squaring
all values, summing those squares, dividing by the number of observations in the signal,
followed by the square root to obtain the reported values [Criswell et al., 2011]. This is the most
common method of EMG filtering, due to its transition of the signal from analog to digital and its
propensity to provide less distortion of the signal [Criswell et al., 2011].

65
Integral averaging, or Smoothing, is often referred to as a running average of the EMG
signal. For instance, if the smoothing filter is running at 50 samples per second, the first 50
points of raw data are averaged and then plotted. This filtering method reduces the variability of
the signal by decreasing the probability of spontaneous artifact or variability in the recording.
The current study utilized a running average of 300 samples per second. Using a longer averaged
segment window diminishes the variance in amplitude estimation as compared to RMS, which is
simply a digital conversion of the raw signal [Clancy et al., 2001]. However, the results showed
no significant mean differences between RMS and Smoothing filters when estimating LT work
rate. This signifies that with an overall estimation of a theoretical threshold level either filter may
be used; however for more precise measurements of single dynamic movements or with the use
of biofeedback a closer examination of the signal may be necessary.
Traditionally, there are challenges present while working with EMG recording: 1) the
stochastic nature of the EMG amplitude; 2) the inability of EMG to directly represent muscular
tension or force; and 3) “cross talk”. First, during times of low intensity and rest, the variation in
EMG signal amplitude and frequency is minimal; however during progressively increasing
workloads and fatigue large variations in motor unit and muscle fiber type recruitments exist
creating unpredictability in the EMG signal. This is often characterized by a decrease in
frequency and subsequent increase in amplitude [Dimitrova et al., 2003]. While EMG is not a
viable source to directly measure force of the muscle contraction, the rise in EMG is typically
associated with times of progressively intensive exercise is the recruitment of Type II muscle
fibers. This breakpoint in EMG is often stated to be the time at which a large increase in the
recruitment of motor units occurs [Candotti et al., 2008; Zuniga et al., 2010]. This threshold can
mistakenly be indicated as the initial recruitment in Type II fibers; however, Type II fibers may

66
contribute to early onset of muscular contraction, but not show signs of fatigue during this time.
Therefore, no indication of a breakpoint may exist in the amplitude or frequency of the EMG
recording. Third, “cross talk” between muscle groups within surface electromyography is
inevitable, but may be reduced utilizing proper electrode placement and smaller electrode
spacing (e.g., 2 cm). Since amplitude is a function of time and is defined as the standard
deviation of the EMG signal between muscle fibers, any additional variation in the signal from
another muscle group may alter the amplitude [Clancy et al., 2001]. While “cross talk” cannot be
eliminated, any possible cross-over may affect EMG amplitude and in this case contribute to the
exponential rise in the processed EMG.
Furthermore, Briscoe et al. (2014), using linear regression, determined that the amplitude
of the EMG signal was more important than measuring frequency in order to determine EMGT.
Researchers also determined the importance of prescribing training intensities based upon
muscle activation patterns as participants were asked to perform exercise bouts at 70%, 100%,
and 130% of EMGT. It was determined that individuals were able to pedal at both 70% and
100% for extended durations (i.e., >40 minutes); however, participants were unable to maintain
the 130% intensity for a period greater than 12 minutes [Briscoe et al., 2014]. This represents the
importance of amplitude based averaging when assessing EMG.
The use of surface EMG to estimate the work rate of LT has been shown to be a valid
method; however, limitations may exist with the practically of this method in a laboratory or
field-based setting. Surface EMG is affected by many factors that may distort or result in
recordings that cannot be examined or interpreted properly. One such major limiting factor is
weak conductors and insulators that may reduce the strength or block surface EMG signaling
(i.e., skin and adipose tissue). Therefore, a key determinant of signal strength will vary

67
depending on the subcutaneous fat thickness of the individual being examined (i.e., a less
subcutaneous fat will result in less signal impedance and vice versa).
The current study was performed on a cycle ergometer and may not extrapolate to
incremental treadmill testing. Dynamic variations exist in the patterns recording via EMG
through the vastus lateralis and may provide a difference when estimating LT. Lastly, the current
study did not use trained cyclists for the study sample. Stanula et al. (2013) suggested that
athletes who devoted a greater portion of their training time to aerobic endurance showed greater
reliability between various mathematical methods of LT analysis (e.g., 4mmol.L
-1, log-log, Dmax,
etc.) compared to anaerobic athletes. It may be that trained cyclists’ would yield more consistent
results than our sample.
PRACTICAL APPLICATIONS
The use of EMG to predict [La] in the field is a convenient tool for practitioners due to its
non-invasive nature as opposed to blood sampling. Additionally, when utilizing EMG to monitor
intensity levels, signal transformation from raw capturing is a key component in understanding
muscle activation and motor unit recruitment. All tested filtering methods, including RMS,
smoothing, and peak amplitude averaging calculations provided valid filter options to monitor
muscular activation to estimate blood [La] threshold during cycling. In particular, endurance and
aerobic athletes may benefit from the ability to monitor threshold work rates established by EMG
in order to properly prescribe training intensities.
REFERENCES
1. Briscoe M, Forgach M, Trifan E, Malek M. Validating the EMGFT from a single incremental
cycling test. International journal of sports medicine 2014;35(7):566-570
2. Candotti CT, Loss JF, Melo MO, La Torre M, Pasini M, Dutra LA, de Oliveira JLN, de
Oliveira Jr LP. Comparing the lactate and EMG thresholds of recreational cyclists during

68
incremental pedaling exercise. Canadian Journal of Physiology & Pharmacology
2008;86(5):272-278
3. Clancy EA, Bouchard S, Rancourt D. Estimation and application of EMG amplitude during
dynamic contractions. IEEE Engineering in Medicine and Biology 2001;20(6):47-54
4. Criswell E, Cram JR. Cram's introduction to surface electromyography. Sudbury, MA: Jones
and Bartlett 2011
5. de Sousa NMF, Magosso RF, Pereira GB, Leite RD, Arakelian VM, Montagnolli AN, Perez
SA, Baldissera V. The measurement of lactate threshold in resistance exercise: a comparison
of methods. Clinical Physiology & Functional Imaging 2011;31(5):376-381
6. Dimitrova N, Dimitrov G. Interpretation of EMG changes with fatigue: facts, pitfalls, and
fallacies. Journal of Electromyography and Kinesiology 2003;13(1):13-36
7. Guffey DR, Gervasi BJ, Maes AA, Malek MH. Estimating electromyographic and heart rate
fatigue thresholds from a single treadmill test. Muscle and Nerve 2012;46(4):577-581
8. Hopkins W, Marshall S, Batterham A, Hanin J. Progressive statistics for studies in sports
medicine and exercise science. Medicine & Science in Sports & Exercise 2009;41(1):3
9. Howley ET, Bassett, Jr. DR, Welch HG. Criteria for maximal oxygen uptake: review and
commentary. Medicine & Science in Sports & Exercise 1995;27(9):1292-1301
10. Jürimäe J, von Duvillard SP, Mäestu J, Cicchella A, Purge P, Ruosi S, Jürimäe T, Hamra J.
Aerobic–anaerobic transition intensity measured via EMG signals in athletes with different
physical activity patterns. European Journal of Applied Physiology 2007;101(3):341-346
11. MahmutoviĆ S, Sprout EY, Fontaine JC, Buskirk TM, Galen SS, Malek MH. Test–retest
reliability of the electromyographic fatigue threshold for cycle ergometry. Muscle & nerve
2016;53(5):803-807
12. Seburn KL, Sanderson DJ, Belcastro AN, McKenzie DC. Effect of manipulation of plasma
lactate on integrated EMG during cycling. Medicine & Science in Sports & Exercise
1992;24(8):911-916
13. Stanula A, Gabrys T, Szmatlan-Gabrys U, Roczniok R, Maszczyk A, Pietraszewski P.
Calculating lactate anaerobic thresholds in sports involving different endurance preparation.
Journal of Exercise Science & Fitness 2013;11:12-18
14. Tanner RK, Fuller KL, Ross ML. Evaluation of three portable blood lactate analysers:
Lactate Pro, Lactate Scout and Lactate Plus. European journal of applied physiology
2010;109(3):551-559

69
15. Taylor A, Bronks R. Electromyographic correlates of the transition from aerobic to anaerobic
metabolism in treadmill running. European journal of applied physiology and occupational
physiology 1994;69(6):508-515
16. Weltman A, Snead D, Stein P, Seip R, Schurrer R, Rutt R, Weltman J. Reliability and
validity of a continuous incremental treadmill protocol for the determination of lactate
threshold, fixed blood lactate concentrations, and VO2max. International Journal of Sports
Medicine 1990;11(1):26-32
17. Zhou S, Weston SB. Reliability of using the D-max method to define physiological responses
to incremental exercise testing. Physiological measurement 1997;18(2):145
18. Zuniga JM, Housh TJ, Camic CL, Hendrix CR, Schmidt RJ, Mielke M, Johnson CO. A
Mechanomyographic Fatigue Threshold Test for Cycling. International Journal of Sports
Medicine 2010;31(9): 636- 643
19. Zuniga JM, Malek MH. Electromyographic responses of the superficial quadriceps femoris
muscles during incremental treadmill running. Muscle & Nerve 2013;48(6):938-944

70
CHAPTER 5
CONCLUSION
Previous studies of the relationship between blood lactate and electromyography have
demonstrated inconsistent results. Additionally, wearable EMG technology has yet to be
examined to determine its’ ability to provide a valid estimation of LT. This series of studies
answered useful research questions by providing insight on the use of commercially-available
EMG compression gear, the effect of aerobic exercise on LT and EMGT testing, as well as, the
various methods by which EMG is filtered and averaged to provide a more practical approach to
monitoring EMG in the field.
The first study compared LT with EMG threshold of the vastus lateralis monitored with
wearable compression shorts. No significant differences in work rate existed between LT and
EMGT during a bout of maximal incremental cycling. Additionally, no differences existed in
%VO2max or %HRmax at the work output level associated with LT and EMGT. There were also a
strong correlation between power output between [La] and EMG (rs = 0.68, p = 0.01). EMGT
occurred at the same stage of the incremental test as LT in 11 of the 13 participants. These
findings suggest that wearable EMG technology may be a viable field tool for the use of
monitoring and predicting LT levels. Practitioners may find this information useful to prescribe
training intensities for athletes to increase cardiovascular and muscular endurance.
The second study examined the agreement between LT and EMGT after a bout of steady-
state aerobic exercise. Consistent with previous results, the relationship between LT and EMGT
pre-exercise bout was found to have no significant difference in terms of power output. Post-

71
exercise there was a significant difference in work rate LT and EMGT (Z = -2.71, p = 0.007).
However, individual agreement demonstrated that pre- and post-exercise LT occurred at the
same work rate in 5 of 10 participants; while pre- and post- EMGT occurred at the same work
rate in 6 of 10 participants. Additionally, LT and EMGT demonstrated poor individual agreement
(i.e., pre-exercise = 30% versus post-exercise = 20%); further demonstrating that EMG and [La]
may not be a causal-effect relationship as previously suggested. Thus, future research is needed
to determine the application of each metric for training and exercise prescription purposes.
The third study inspected various filtering methods of the EMG signal and determined
their ability to monitor LT during an incremental exercise test. The results demonstrated no
significant differences in the various methods used to transform the raw EMG signal (i.e., root
mean square, smoothing, and peak amplitude averaging). Furthermore, no differences existed in
the work rate or %VO2max established at the threshold level for both lactate and EMG. Thus, the
three popular transformation filtering methods of the raw EMG signal were each able to predict
the work rate level associated with the laboratory method of lactate threshold testing.
The collective finds of this dissertation support the use of EMG as a potential field tool to
monitor and predict LT training levels in a rested state. Furthermore, wearable EMG technology
may be an inexpensive, non-invasive method for the testing of athletes and individuals as
opposed to laboratory measures. However, future studies might seek to determine the validity
and reliability of EMG fatigue thresholds for the use of setting training intensities.

72
APPENDIX