relationship between family income and obesity among
TRANSCRIPT
Walden UniversityScholarWorks
Walden Dissertations and Doctoral Studies Walden Dissertations and Doctoral StudiesCollection
2016
Relationship Between Family Income and ObesityAmong African American AdultsCharles Dadzie BoisonWalden University
Follow this and additional works at: https://scholarworks.waldenu.edu/dissertations
Part of the Public Health Education and Promotion Commons
This Dissertation is brought to you for free and open access by the Walden Dissertations and Doctoral Studies Collection at ScholarWorks. It has beenaccepted for inclusion in Walden Dissertations and Doctoral Studies by an authorized administrator of ScholarWorks. For more information, pleasecontact [email protected].

Walden University
College of Health Sciences
This is to certify that the doctoral dissertation by
Charles Boison
has been found to be complete and satisfactory in all respects,
and that any and all revisions required by
the review committee have been made.
Review Committee
Dr. Raymond Panas, Committee Chairperson, Public Health Faculty
Dr. Mary Mays, Committee Member, Public Health Faculty
Dr. Earla White, University Reviewer, Public Health Faculty
Chief Academic Officer
Eric Riedel, Ph.D.
Walden University
2016
Abstract
Relationship Between Family Income and Obesity Among
African American Adults
by
Charles D. Boison
MS, Troy State University, 2001
BS, University of Science and Technology, Kumasi, Ghana, 1993
Dissertation Submitted in Partial Fulfillment
of the Requirements for the Degree of
Doctor of Philosophy
Public Health
Walden University
February 2016
Abstract
Obesity is a chronic disease that is caused by a number of factors such as diet, genetics,
physical inactivity, and poor dietary habits. This research focused on how income affects
obesity among a target population in the African American community in Durham, North
Carolina (NC). It has been noted that chronic diseases that are diet-related, for example,
obesity, diabetes, hypertension, and high cholesterol, affect African Americans
disproportionately, especially those who earn low income. Some studies have also
reported that those who make higher income have higher rates of obesity. This
inconsistency and gap in the literature prompted research on this topic. Therefore, the
purpose of this research was to study the relationship between family income and obesity
among African Americans. The study sought to address the key factors that contribute to
low family income among African Americans in Durham, NC and the ways in those key
factors contribute to obesity among African Americans in Durham, NC. This study
implored a qualitative approach by using an individual interview method to glean the
lived experiences of participants in Durham, NC. Thirty participants were interviewed
and themes from the interviews were analyzed. The health belief model was chosen as
the theoretical framework for this study to understand the data and explain beliefs,
attitudes, and health behaviors. Key results indicated that low family income contributes
to obesity. The study contributes to social change by recommending that policy makers
advocate for an increase in national minimum wage, encourage educational approaches to
prevent obesity, promote good eating habits, and promote adequate physical activity
among African Americans.

Relationship Between Family Income and Obesity Among
African American Adults
by
Charles D. Boison
MS, Troy State University, 2001
BS, University of Science and Technology, Kumasi, Ghana, 1993
Dissertation Submitted in Partial Fulfillment
of the Requirements for the Degree of
Doctor of Philosophy
Public Health
Walden University
February 2016

Dedication
To God be the glory for the great things He has done. Without the favor, grace,
and wisdom of God, this work would not have been accomplished. He deserves the
dedication of this achievement. I also give out a shout out of dedication to my wife,
Lydia, whose constant support and encouragement helped me through this academic
journey. Special mention goes to my kids, Davina, Janelle, and Joelle, for their patience
and understanding while their daddy spent hours working on this project during times
that they needed his attention.

Acknowledgments
This academic achievement has been a seemingly long journey. Like any journey,
which starts with small steps, there have been many individuals who have greatly
contributed to my success. I am grateful to the Almighty God for the opportunity and
strength given me to accomplish my goal. I am grateful to my family: Lydia, my wife,
and our three children for their patience and support. I thank my mother-in law mama,
Sophia, for helping with my kids while I took time to work on this project.
I want to sincerely thank my Chair, Dr. Raymond Panas, for his supportive
guidance, direction, and providing the necessary reviews and corrections that helped
shape this work. I am also very grateful to my committee member, Dr. Mary Mays, for
her commendable role in helping to accomplish this work. My gratitude also goes to Dr.
Earla White, my University Research Reviewer, for the remarkable role she played in this
work. I am also grateful to Dan Fleischhacker, Dissertation Editor, for ensuring the form
and style of my dissertation conformed to standards. My gratitude also goes to the senior
pastors of JCCI, Chapel of Victory, NC, for their prayers and encouragement. I am also
grateful to Dr. John Nwankwo, Dr. Babatunde Oloyede, Dr. Frances Obikunle, and Mr.
Yaw Owusu for their friendship, resourcefulness, and encouragement while pursuing this
academic journey. To all friends, other family members, and my research participants,
whose contributions helped me attain this academic achievement, I am very grateful.
Finally, I am indebted to my late parents, Hannah and Samuel Boison, who
instilled in me the utmost desire for education and taught me that the fear of God and
education are requisites for great success in life.

i
Table of Contents
List of Tables .......................................................................................................................v
List of Figures .................................................................................................................... vi
Chapter 1: Introduction to the Study ....................................................................................1
Introduction ....................................................................................................................1
Background ....................................................................................................................2
Basic Information about Durham............................................................................ 5
Problem Statement .........................................................................................................7
Purpose of the Study ......................................................................................................9
Research Questions ........................................................................................................9
Theoretical Framework ................................................................................................11
Nature of the Study ......................................................................................................12
Possible Types and Sources of Information or Data ............................................. 14
Other Information ........................................................................................................15
Operational Definitions ................................................................................................15
Assumptions .................................................................................................................16
Scope and Delimitation ................................................................................................17
Limitations ...................................................................................................................17
Significance..................................................................................................................18
Summary ......................................................................................................................19
Chapter 2: Literature Review .............................................................................................21
Introduction ..................................................................................................................21

ii
Literature Search Strategy............................................................................................22
Background ..................................................................................................................22
History of Obesity ........................................................................................................23
Income and Obesity .....................................................................................................25
Social and Economic Well-Being of North Carolinians ..............................................38
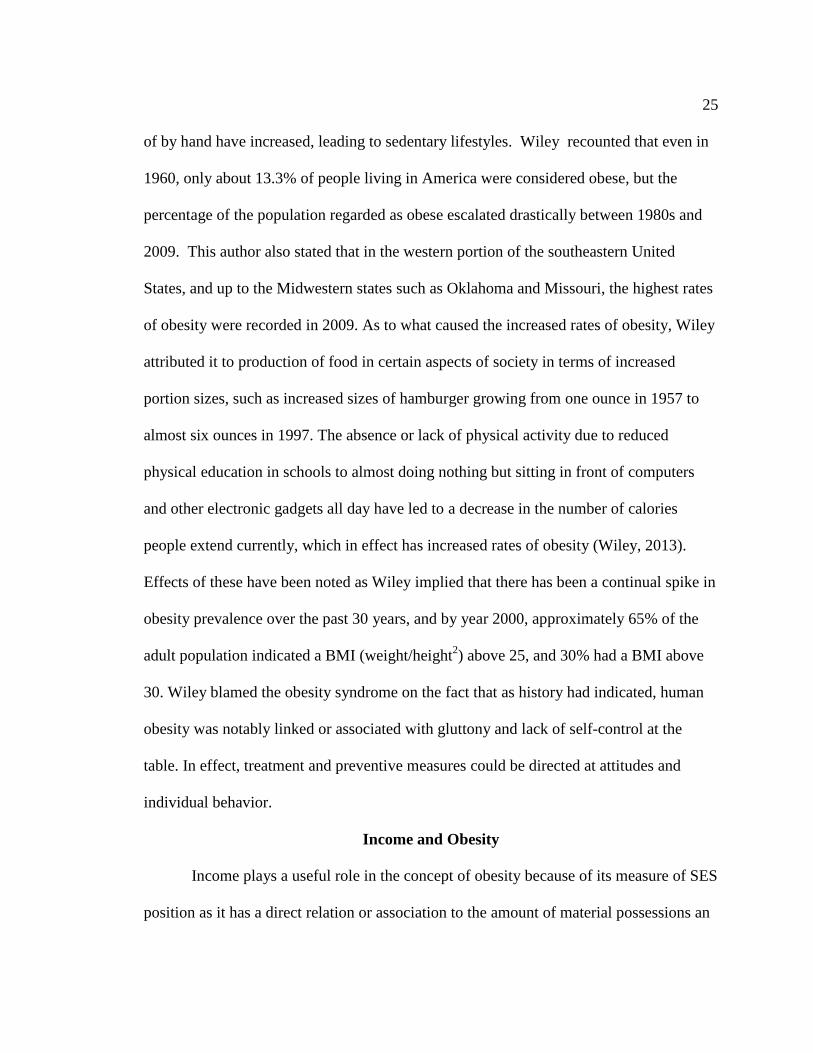
Adult Obesity in North Carolina ..................................................................................41
Theoretical Framework ................................................................................................44
Health Belief Model and Obesity ................................................................................46
Relationship to the Proposed Study ...................................................................... 47
Methodological Approach ...........................................................................................49
Phenomenology..................................................................................................... 49
Summary ......................................................................................................................52
Chapter 3: Research Method ..............................................................................................53
Introduction ..................................................................................................................53
Research Design and Rationale ...................................................................................53
Role of the Researcher .................................................................................................54
Research Questions ......................................................................................................55
Methodology ................................................................................................................56
Participant Selection Logic ................................................................................... 57
Procedures for Recruitment and Participation ...................................................... 58
Informed Consent and Data Collection................................................................. 58
Instrumentation ..................................................................................................... 59

iii
Exiting the Study................................................................................................... 60
Data Analysis Plan ................................................................................................ 60
Threats to Validity .......................................................................................................61
Ethical Procedures .......................................................................................................64
Access to Participants ........................................................................................... 64
Treatment of Participants ...................................................................................... 65
Justification for Incentives .................................................................................... 66
Summary ......................................................................................................................66
Chapter 4: Results ..............................................................................................................67
Introduction ..................................................................................................................67
Recruitment ..................................................................................................................67
Participant Profile ................................................................................................. 69
Data Collection ............................................................................................................73
Data Analysis ...............................................................................................................74
Evidence of Trustworthiness........................................................................................75
Demographic Information ..................................................................................... 77
Results of Themes Identified .......................................................................................82
Summary of Notable Results/Findings ............................................................... 105
Summary ....................................................................................................................109
Chapter 5: Discussion, Recommendations, and Conclusions ..........................................111
Introduction ................................................................................................................111
Interpretations ..................................................................................................... 113
iv
Comparison of Research Findings to Literature Review ...........................................132
Theoretical Considerations ........................................................................................135
Health Belief Model and Obesity ..............................................................................138
Relationship to the Proposed Study .................................................................... 139
Limitation of the Study ..............................................................................................140
Recommendations ......................................................................................................141
Implication of Social Change.....................................................................................143
Conclusion .................................................................................................................145
References ........................................................................................................................149
Appendix A: Sample Letter to Participant .......................................................................156
Appendix B: Format of Interview ....................................................................................157
Appendix C: Consent Form .............................................................................................159

v
List of Tables
Table 1. Selected Demographic Characteristics of 30 African American Study
Population…………………………………………………………………………..78
Table 2. Selected Demographic Features of 30 African American Study Population
Formatting……………………………………….………………………………….79
Table 3. Table of Participants with Reference to BMI, Overweight, and Obesity………81
Table 4. Types of Popular Food Eaten by Participants….……………………………….88
Table 5. Number of Servings of Salad Per Day………….………………………………93
Table 6. Number of Times Exercised in a Week………………………………………...96
Table 7. Duration of Exercise in any Session……………………………………………98
Table 8. Availability of Equipment or Ability to Exercise……………………………..100
Table 9. Regularity/Frequency of Seeing Provider for Routine or as Needed
Check-Up………………………………………………………………………....101
Table 10. Last Time Participants Checked Their Cholesterol.………………………....102
Table 11. Participants’ Notification of Being Overweight or Obese…………………..104

vi
List of Figures
Figure 1. BMI trends of North Carolina adults (1990-2008)..…………………………..41
Figure 2. Percentage of adults and overweight/obesity………………………................42
Figure 3. Diagram of health belief model……………………………………….............48
Figure 4. NVivo’s thematic diagram of factors contributing to obesity..………………109

1
Chapter 1: Introduction to the Study
Introduction
Obesity is a chronic disease that has been a health issue for both developed and
developing countries (Dinsa, Goryakin, Fumagalli, & Suhrcka, 2012). Dinsa et al. (2012)
have noted that among countries that are regarded as developed, obesity is a condition
that is considered to affect people who are of lower socioeconomic status (SES)
compared to those with a higher SES. As far as developing countries are concerned,
Dinsa et al. implied that there is a debate that continues on whether the effects of obesity
are more on the poor or the rich. A study by Sobal and Stunkard (2007) showed that a
positive relationship exists between SES and obesity among people in developing
countries. In other words, obesity seemed to be a predominant health problem among the
richer or more affluent people in such countries. McLaren (2007) compared obesity
among developed and developing countries with the use of the human development index
(HDI). The application of the HDI focuses on the level of socioeconomic development of
any country as it combines three notable indicators: income per capita, literacy rate, and
life expectancy (McLaren, 2007). The World Bank defines low- and middle-income
countries as those with per capita income at a maximum of US$12,275 (Dinsa et al.,
2012). This study focused on obesity as it relates to the United States, a developed
country, and in particular, Durham, North Carolina (NC), as it grapples with obesity and
its health effects.
The income earned by African Americans has contributed to what type of food
they eat and the kind of lifestyle they live (Schneider, 2011). For the purpose of this

2
study, family income is the total money or financial resources generated by the same
household for its upkeep, payment of bills, and taking care of other responsibilities. This
includes compensations from wages, social security, child support, food stamps (welfare),
pensions, capital gains, and dividends. These have had a direct effect on their health
status, especially in the aspect of obesity. The target population for this study was located
in Durham, NC. This community was chosen because of its concentration of African
Americans living in the area. The problems that have led to this study focus around three
major issues: (a) family income contribution to obesity, (b) obesity as a health issue, and
(c) a gap in literature that suggests that this study is needed.
In 2011, African Americans constituted 38% of the population living in Durham,
and 22% of the entire North Carolina population (U.S. Census Bureau, 2013). Poor
nutrition, which could be a result of low family income among African Americans in
comparison with other races/ethnicities, contributes to obesity (Samani-Radia &
McCarthy, 2011). Berkman and Kawachi (2000) have also noted that low educational
status among African Americans leads to low family income, which leads to obesity by
virtue of the type of foods African Americans purchase and consume.
Background
The effects of income on obesity have been noted in studies that have compared
measures of growth and the percentage of body fat in children from two contrasting
backgrounds as far as income is concerned (Samani-Radia & McCarthy, 2011). In their
cross-sectional study, Samani-Radia and McCarthy (2011) noted that children from
families with lower income were significantly shorter and much heavier with a higher

3
body mass index (BMI) compared to those of the same age, but from families with higher
family income. The study showed that the prevalence of being overweight/obesity was
greater among children from lower income families based on percent body fat
(overweight/obese). The authors noted that regardless of the assessment tool that was
used, overweight/obese children as a group were significantly shorter for their age group
when compared with children of normal weight/normal fat status.
The results from the study by Samani-Radia and McCarthy (2011) confirmed the
influence of income on obesity prevalence. However, according to these researchers, the
reason why BMI tends to function variably along group divisions of income is not clear,
but a shorter height-for-age for those categorized as lower income earners might be one
explanation. These observations or findings prompt important questions that pertain to
the causes and consequences of obesity among children who come from a background of
lower income.
In a qualitative study performed by Bragg, Tucker, Kaye, and Desmond (2009),
they found that being overweight and obesity among adolescents and adults has increased
significantly in the United States. According to the researchers, since 2006, more than
17.1% of adolescents between 12 - 19 years were considered overweight and more than
33% were considered obese (Bragg et al., 2009). African Americans and Hispanics are
disproportionately affected as minority populations with obesity and these racial groups
have shown higher rates of obesity (Bragg et al., 2009). The study noted that low-income
African American and Hispanic youth are affected disproportionately by most of the

4
health problems that can possibly be prevented through the engagement of health
promotions (Bragg et al., 2009).
In NC, it has been documented that the highest income group has the highest
percentage of people at healthy weight and the lowest income bracket show the highest
percentage of obesity (The North Carolina Behavior Risk Surveillance System [NC-
BRFSS], 2008). In 2005, 36.7% of African Americans, Non-Hispanic adults in NC were
considered to be obese (NC-BRFSS, 2008). Among Caucasian children (generally),
obesity is noted to decline as parental income and education increases (NC-BRFSS,
2008). However, different patterns have been shown to occur among children who come
from different minority groups. Troiano and Flegal (1998) found that among 12- to 17-
year-old non Hispanic Caucasian children, obesity rates declined for boys and girls with
increases in family income. They also noted that, “By contrast, among African
Americans and Hispanics, girls’ obesity rates increase with income; boys’ rates show no
consistent pattern” (Troiano & Flegal, 1998, p. 497). It is this inconsistency and gap that
makes the pursuit of my research very significant.
The disparity in income and obesity assumes unpredictability as related in a study
by Gordon-Larsen, Adair, and Popkin (2003), who asserted that maintaining adolescents
in the same environments and altering only family income and parental education
produced a limited effect on the disparities in the prevalence of obesity. Therefore,
increasing family income without substantial difference in the environment or residential
location did not improve or narrow the disparity. Other factors that should be considered
are contextual, biological, environmental, and socio-economic factors (Gordon-Larsen et
5
al., 2003). Interestingly, increased family income helps to control some of these factors
and could lead to decreased obesity (Gordon-Larsen et al., 2003).
Basic Information about Durham
Durham is a fast growing city situated near the center of NC. The importance of
the location of this city in reference to the background is the proportion of African
Americans living there and how income affects their obesity. The city is between Wake,
Orange, and Chatham counties and makes up the majority of Durham County. It has
107.37 square miles of land area and 0.91 square miles of water area. As of 2010,
Durham’s total population was 228,330, and this is an increase of 22.08% from the 2000
census (NC-BRFSS, 2008). Its population growth rate is known to be higher than that of
the state average rate of 18.46%, and also higher than the national average rate of 9.71%
(NC-BRFSS, 2008). The median household income was $46,972 as of 2006 - 2010 and
has grown by 14.12% since 2000 (NC-BRFSS, 2008). The growth rate of income was
known to be higher than the state rate of 10.57% and was lower than the national average
rate of 19.17% (NC- BRFSS, 2008). The median house value was $176,000 as of 2006 -
2010 and has since grown by 40.05% since 2000 (NC-BRFSS, 2008). The growth in
home values is lower than the state average rate of 42.38% and is lower than the national
average rate of 50.42% (NC- BRFSS, 2008). The NC-BRSSS (2008) further gave the
population breakdown as follows: Caucasian - 96,932; African American - 93,517;
Hispanic - 32,459; Asian American- 11,574; Native (American Indian, Alaska Native,
Hawaiian Native, etc.) - 1,327. The population of African Americans was 40.96%, which
is very close to that of whites (42.45%).
6
The social and economic well-being of Durham is reflected in the general state of
NC. For instance, the State Center for Health Statistics and Office of Minority Health and
Health Disparities (2010) noted that the percentage of African Americans families in NC
who live below the federal poverty level ($21,834 annual income for a family of four) in
2008 was 21.3%, compared to 6.7% for Caucasians. The report also stated that of the
families that have a single female householder, 37% of African American families lived
in poverty compared to 24.5% of the families headed by single Caucasian females. The
unemployment rate for African Americans was also double that of Caucasians (11% vs.
5.4%) in 2008. Low income, low educational level, and unemployment were all noted as
associated with higher rate of health problems (North Carolina Center for Health
Statistics and Office of Minority Health and Disparities, 2010).
The United States Department of Agriculture (USDA; 2014) noted that the adult
obesity rate in Durham is 30.3%, and this is about the same as the average in the United
States. The USDA (2014) also noted that the population of Durham is now 273,292; the
poverty rate is 18.4% and child poverty is 24.2%. The USDA (2014) reported that a
grocery store to every 1000 people in Durham is 0.18% and 27% of the total population
has low access to grocery stores. In terms of stores per 1000 people, available
convenience stores constitute 0.43%, specialized stores constitute 0.04%, Supplemental
Nutrition Assistant Program (SNAP)-authorized stores constitute 0.71%, and Women,
Infants, and Children (WIC)-authorized stores constitute 0.2% (USDA, 2014). In terms of
the percentage of population in Durham with low access to grocery stores, residents with
low income comprise 6.2%, children with low access comprise 6.5%, and that of seniors

7
with low access comprise 2.9% (USDA, 2014). Representative sampling details of
educational attainment of the community and the average income of African Americans
living in the target population were obtained and analyzed during the interview process.
The family income of African Americans of the target population, which has some
significance to the status of obesity, was the focus of this research.
Problem Statement
The Centers for Disease Control and Prevention (CDC, 2013) noted that in 2008,
medical costs associated with obesity were estimated at $147 billion, with medical costs
for obese people being $1,429 higher than those with normal weight. In general, two-
thirds of NC adults were found to be overweight or obese using their BMI (North
Carolina Behavior Risk Factor Surveillance System, 2008). According to Schneider
(2011), obesity is usually defined in terms of BMI, which is calculated by dividing an
individual’s height in meters by the square of his or her weight in kilograms (p. 262). The
CDC has agreed on a definition of overweight as having a BMI between 25 and 29.9 and
obesity as having a BMI of 30 or greater. The CDC noted that obesity is higher among
non-Hispanic African American and Mexican-American men who earn higher incomes
than those who earn lower incomes. The age-adjusted rate of obesity for non-Hispanic
African Americans was 47.8% according to the CDC. The report also stated that women
who earn higher income are less likely to be obese than those of lower income (CDC,
2013). The former assertion is in contrast to statement made by Berkman and Kawachi
(2000) that African Americans earn lower family income, and therefore, are subject to
higher obesity rates. There is some gap in the literature that needs to be studied to

8
ascertain the relationship that exists between family income and obesity. This gap was the
main focus of this study and the inconsistency in the literature as far as the relationship
between family income and obesity is concerned was addressed. The interplay of location
and race/ethnicity might have some bearing on this study because among NC adults:
22.6% of Caucasian, non-Hispanic adults; 36.7% of African American, non-Hispanic
adults; 33.5% of American Indian, non-Hispanic adults; 14.3% of non-Hispanic adults of
other races, and 22.1% of Latino/Hispanic adults were obese (North Carolina State
Center for Health Statistics, 2007). However, the rates were different in a state such as
Oklahoma, where Weedn, Ang, Zeman, and Darden (2012) found that the lowest rate of
overweight and obesity was noted in African American children (14.1% and 10.9%,
respectively; P < .0001). When overweight and obese categories were combined,
American Indians had the highest rate at 36.1%, whereas African American children had
the lowest rate at 25.1% (P < .0001) (Weedn et al., 2012). These contrasting statistics
prompted my research on the disparity among race/ethnicity and contributed to a gap in
literature as far as the relationship between family income and obesity is concerned. The
findings from this study helped to fill this gap and added some meaning to the statement
made by Novick et al. (2008) that the disparity in family income is a contributing factor
to health status. Because Durham, NC has a high population of African Americans, the
findings from this study provided some reasons why African Americans earn lower
income, how these could be used to provide solutions to earn higher income, or how they
can live a better lifestyle with their incomes. The responses from these face-to-face
interviews will help agencies, organizations, and physicians to provide better information

9
to help the target population create better lifestyles. This could ultimately lead to a social
change among residents of Durham, NC.
Purpose of the Study
The purpose of this research was to provide a qualitative insight into the
relationship that might exist between income earned by African American families in
Durham, NC and how this contributes to obesity. A number of quantitative studies have
been conducted to assess obesity as an independent variable, but few delve into the life
experiences of individuals and families in the context of income. Although some
qualitative studies have been done with respect to obesity and other factors (Mendez et
al., 2004), a focus on Durham, NC appears to lack detailed qualitative studies. Therefore,
this study sought to study the factors that lead to low income earned by African
Americans and how these in turn lead to obesity among the chosen target population.
As envisaged, responses to the interviews conducted helped to answer the
research questions. The responses also helped to bridge the gap in literature and could
provide social change such as finding ways to eat healthy meals even with lower income,
exercising at recommended times to reduce obesity, and staying healthy at all times.
Research Questions
The research questions that were focused on in this study are the following:
Research Question 1: What are the key factors that contribute to low family
income among African Americans in Durham, NC?
Research Question 2: How do these key factors contribute to obesity among
African Americans in Durham, NC?

10
These questions are important and worth studying because responses to them
indicated that more income would make a difference in what African Americans in
Durham eat, and the amenities that are available to them by virtue of their income and
economic status. The responses also led to some findings that irrespective of income
earned, this ethnic group might be prone to this chronic disease through other factors
such as genetics or environmental factors such as lack of amenities and equipment for
physical activities. The dwelling locations of the target population and other factors that
lead to increased obesity were central to the formulation of questions to participants.
These questions helped to address the current issues associated with low income earned
by African Americans that have contributed to their obesity. In essence, responses to the
main research questions of this study played a major role in finding out if in actuality the
income earned by families under consideration contribute to obesity or the income earned
plays no significant role in this chronic disease. Moreover, these questions led to the
factors that contribute to low family income that ultimately contributes to obesity. For
instance, are African Americans who live in low income neighborhoods obese because
they lack the means to perform the required physical activities? Are they obese because
they lack access to good nutrition, or can they live on low income in a poor neighborhood
and still maintain a healthy lifestyle? This study also revealed the factors that hinder the
target population from earning enough family income, which ultimately affects how they
live, what they eat, and how these lead to obesity.

11
Theoretical Framework
The philosophical worldview that seemed appropriate for this research is that of
social constructivism. This worldview is based on the assumption that individuals desire
and so seek an understanding of the world in which they live and work (Creswell, 2009).
They would also gravitate towards finding subjective meanings and experiences that are
directed towards certain objects (Creswell, 2009). This implies that although individuals
may or may not have control over causes of obesity, they would attempt to find these
causes and look for remedies or solutions to them.
Based on the philosophical worldview described above, the selected appropriate
theory applicable to this research was the health belief model (HBM). The HBM was
chosen because of its ability to explain various health behaviors (Mckenzie, Neiger, &
Thackeray, 2009). The HBM is recorded as one of the most frequently used theories in
the application of health behaviors. It is a value-expectancy theory that was developed
during the 1950s by psychologists in an attempt to explain why people would use or not
use available health services (Mckenzie et al., 2009). According to Mckenzie et al.
(2009), the HBM stands on three pillars of hypotheses, which are:
1. The existence of sufficient motivation (health concern) to make health issues
salient or relevant;
2. The belief that one is susceptible (vulnerable) to a serious health problem or to
the sequelae of that illness or condition. This is often termed perceived threat, and

12
3. The belief that following a particular health recommendation would be
beneficial in reducing the perceived threat, and at a subjectively acceptable cost.
(p.171)
According to Schneider (2011), the HBM is a model that helps to explain how
people’s behavior is affected by their own beliefs. Schneider pointed out that for
individuals to change their behavior towards certain behaviors there must be a belief in a
personal threat. This means the individual must be susceptible to some condition or
threat. Schneider also implied that for people to overcome a behavior, they should have a
belief in response efficacy, meaning that there is something they can do to alleviate or
eliminate the source of the threat.
By linking the concepts provided by Mckenzie et al. (2009) and that of Schneider
(2011), this research identified behavioral sources in response to the research questions
that underline this study. The key factors that contribute to low family income among
African Americans in Durham, NC (target population), and how the low income
contributes to obesity was explained by the HBM. The HBM helped to explain the threat
posed to the target population, how the target population feels threatened by this, and the
efficacy they display to counteract this situation. The methodological approach in the use
of the HBM model was that of phenomenology. This is discussed briefly in the Nature of
the Study section that follows.
Nature of the Study
This research focused on obesity with relation to how it is affected by family
income. This research was qualitative. Qualitative research is known to have five major

13
qualities, which are as follows: (1) it is naturalistic, (2) the data produced is descriptive,
(3) there is the display of concern, (4) the process is inductive, and (5) it has a goal as its
meaning (Crosby, DiClemente, & Salazar, 2006).
With qualitative strategies being more useful with natural occurring and
contextual situations rather than controlled situations that use the quantitative approach
(Rudestam & Newton, 2007); the social constructivist approach is more appropriate to
this study. This naturalistic approach enabled the collection of data in a natural setting of
the participants’ home. Quite often individuals may want to guard their privacy,
especially when it comes to the income they make and what type of foods they can afford
or eat and also how their income determines where they live. However, the communities
these people lived in and the income they earned determined the data that were obtained.
Qualitative research more often uses descriptive data, which can take several
forms (Crosby et al., 2006). This could be words, pictures, charts, records, and narratives.
It is possible to integrate a bit of numerical data in terms of income, although qualitative
research is not often represented in numerical terms (Crosby et al., 2006). Because this
study focused on the reasons people do what they do or are, using the process-focused
approach of qualitative research seemed most appropriate.
The inductive nature of qualitative research has an advantage over quantitative,
stemming from the fact that it is better achieved through observations that could
constitute a theory. As Crosby et al. (2006) has noted about this type of inquiry, the
observations made could lead to a pattern of gathering data and then their interpretation.

14
As far as qualitative research is concerned, Rudestam and Newton (2007) have given
very illustrative reasons for the choice of this approach, which align with my objectives.
For instance, phenomenology uses the identification of locating participants who have
actually experienced the phenomenon. Inequalities in status quo and economic status
among African Americans are a canker that is breaking the morale of many an African
American (Berkman & Kawachi, 2000). Rudestam and Newton’s discussion of the
instrumentation (measures) in qualitative study is very unique and applicable to my
study. According to them, the observer plays an important role in the instrumentation
process. Therefore, improvement in human observation is very critical for reliability and
validity in this qualitative research. Rudestam and Newton noted that interviewing is a
tool of qualitative studies, in which the researcher can get very close to the participants.
The method of gathering data, which might lead to high fidelity and high structure by
way of open-ended interviews (Rudestam & Newton, 2007), is an appealing quality of
qualitative research.
Possible Types and Sources of Information or Data
As mentioned earlier, interviews were conducted to collect my data. Open-ended
interviews were used. This included face-to-face interviews, which provided very useful
demographic information and other information pertinent to this study. Based on a review
of previous research studies, common interview questions, which captured responses to
answer my research questions, were crafted to serve as a guide (see Appendix C).
Upon approval of Walden University’s Institutional Review Board (IRB) and
participants’ consent, data were collected from participants that focused on basic

15
demographics, which related participants’ income to the type of resources they can
afford. Other pertinent information that was relevant to this study was obtained from the
participants directly in the form of interviews. For instance, information from women
who participate in the Women, Infant, and Children’s (WIC) program as well as
dependence on government subsidies were used to obtain some information as to how
their socioeconomic status contributes to obesity. I targeted a population sample size of
30 with participants aged between 18 - 65 years.
Other Information
It was envisioned that the results from this research will influence social change
in Durham and the nation as a whole. Although several factors lead to obesity, the role of
family income was focused on in this study, and the analysis and conclusion made might
help individuals and families in Durham control or curb obesity with the income they
make or what they can do with their income to prevent this chronic disease. The
information could also help physicians, providers, politicians, and lawmakers to address
the needs of their patients, clients, and citizens to live a better life.
Operational Definitions
Obesity: A chronic disease whereby excess body fat tends to accumulate in the
body of a person to the extent of having a negative effect on him or her, which leads to
reduced life expectancy, increased health problems, and often death (Wiley, 2013).
Body mass index (BMI): A measurement of an individual’s overweight or obese
status. It is obtained by dividing the individual’s weight by the square of his/her height.

16
Overweight is regarded as a BMI between 25 and 29.9 kg/m2 and obesity as a BMI of 30
kg/m2 or greater (CDC, 2007).
Family income: The total money or financial resources generated by the same
household for its upkeep, payment of bills, and taking care of other responsibilities. This
includes compensations from wages, social security, child support, food stamps (welfare),
pensions, capital gains, and dividends (CDC, 2013).
Coding: A process by which materials are organized into chunks or segments of
text so that a general meaning of the segments is developed (Creswell, 2009).
Phenomenological study or research: A qualitative study in which the researcher
seeks to study and identifies human experiences (essence) concerning the phenomenon as
real experiences described by the participants being interviewed in a defined study
(Creswell, 2009).
Informed consent forms: Forms requesting participants to partake in a study.
Participants sign this form to acknowledge that their rights have been explained to them,
and that their rights will be protected during collection of data (Creswell, 2009), and the
duration of the study.
Assumptions
The willingness of some participants to declare their true family income seemed a
challenge. I assumed some participants exaggerated their incomes higher or lower than
they earn annually. Unless medical records are verified (which was beyond the scope of
this study), it is possible weights, heights, and other demographic information of some
participants might have been guessed or incorrectly reported. I assumed participants may

17
not have revealed their true eating habits or what types of food establishments they
patronized most, but tried to answer as honestly as they could. Because the selected
participants were only a representation of the population, outcomes may not be a true
generalization. Due to the sensitive nature of African Americans to obesity, responses to
questions asked may not have received the accuracy expected. However, I assumed that
most participants provided honest and true answers to questions asked.
Scope and Delimitation
This study addressed the relationship between obesity and family income. As a
qualitative inquiry, it dealt with inductive rather than deductive inquiry. The boundary set
was within Durham, NC, thus the outcome would be a generalization of what pertains to
the target population of African Americans living in Durham, NC. Populations of other
races and ethnicities were excluded from the study. The conceptual framework used
focused on phenomenology.
Limitations
This study’s findings were limited to interpretation (qualitative) rather than
quantitative analysis. The lived experiences of the participants were the focus and not the
quantity of participants in the target population. Participants for the study included only
those who willingly agreed and signed the informed consent forms. Therefore,
participatory bias might have affected the outcome of the study (Creswell, 2009).
Selection bias (Creswell, 2009) could also play a major role in this study because as
mentioned earlier, the interviewing of participants was based on people who were willing
to participate in the study by virtue of providing or signing the consent forms. Those who

18
refused, and therefore, were excluded might have different opinions or answers to the
questions asked. A potent way of addressing or minimizing biases in this study was to
encourage maximum participation by educating the target population to understand the
reasons for this study, the anonymity of responses to participants, and how its findings
could create social change for them.
Significance
This study might reveal some importance or significance because on a national
level, Berkman and Kawachi (2000) have demonstrated that Caucasians earn more
income than African Americans and their SES is also higher, respectively. The obesity
rate is inversely proportional to income (Berkman & Kawachi, 2000; Samani-Radia &
McCarthy, 2011). The contributing factors that could make low-income families prone to
obesity have been summarized by the North Carolina Behavior Risk Factor Surveillance
System (2008):
1. Because of low income, families may excessively consume lower cost foods
that have relatively higher levels of calories per dollar;
2. In order to have more food (quantity) low-income families’ sacrifice
quality food in order to meet their resources or stretch whatever they have;
and
3. Many a mother or parent sacrifices their own food or nutritional needs to feed
their children, but when food becomes available, they may eat voraciously to
try to make up for what they had lost. (para 3)
19
The income earned by individuals or families determines what they eat, where
they live, and what amenities are available to them that might motivate them to perform
the required physical activity or engage in other activities that ultimately reduce their
obesity (Berkman & Kawachi, 2000; Samani-Radia & McCarthy, 2011). Acheampong
and Halderman (2013) have noted that one of the most notable barriers to consuming
healthy diets by African Americans is the cost of healthy foods. They recommended that
this variable must be addressed when obesity and poor dietary consumption among low-
income minority groups are being addressed. Results from this study could be used to
modify and create a positive social change that is geared towards reducing obesity and
living a better lifestyle.
Summary
Obesity continues to be a chronic disease in the United States. The percentage of
individuals who are obese continues to be a health issue to themselves and the nation in
general (CDC, 2011). Obesity- related conditions such as heart disease, stroke, type 2
diabetes, and some types of cancers have great economic burden on the country. It is a
concern to note that two-thirds of North Carolina adults are obese (North Carolina
Behavior Risk Factor Surveillance System, 2008). In Chapter 1, I focused on the problem
statement, significance, background, basic information about the target population of this
research, the framework underlining this study, the research questions governing the
study, and the nature of study involved in this research. In Chapter 2, I will focus on the
literature review and how this study fits into a pattern that would impact a social change.
In Chapter 2, I also discuss the literature strategy search used, history of obesity, income

20
and obesity, adult obesity in North Carolina, the theoretical framework, and the health
belief model and its relationship to the proposed study.

21
Chapter 2: Literature Review
Introduction
The purpose of this qualitative study was to find the relationship between family
income and obesity among African Americans residing in Durham, NC. Obesity is a
chronic condition in the United States that has contributed to cardiovascular and other
related diseases including heart attack (Schneider, 2011). The World Health Organization
(WHO; 2008) reported that there were about 1.6 billion overweight adults aged 15 and
above and at least over 400 million were obese worldwide in 2005. Low, Chin, and
Deurenberg-Yap (2009) pointed out that obesity is a contributing factor of chronic
diseases, which includes diabetes mellitus, stroke, cardiovascular disease, and some types
of cancers. WHO (as cited by Low et al., 2009) also stated that obesity is quite a serious
public health issue that is growing within countries with low or middle income.
According to Schneider (2011), Americans are getting fatter due to the ease of
acquiring and eating unhealthy food and lack of adequate exercise. The inability to eat
healthy foods has been attributed to factors such as lifestyle, attitudes, and low family
income. The title of this research originated from a quest to have an in-depth
understanding of how this relationship plays out. This study focuses on obesity and how
the low family income earned by African Americans has contributed to it. It employs a
qualitative approach, which seeks to find the relationship between the low family income
earned by African Americans in Durham, NC and how it leads to obesity.
Many studies have been done in the past that considered obesity as a dependent
variable and how it related to other independent variables. For instance, in their

22
descriptive study, Acheampong and Halderman (2012) studied obesity in relation to
nutritional knowledge, attitudes, and beliefs associated with obesity among low-income
Hispanic and African American women caretakers. The most common barrier to
consuming a healthy diet found from their study was the cost of healthy foods
(Acheampong & Halderman (2012). The authors recommended that this variable must be
addressed when obesity and poor dietary consumption among low-income minority
groups are being addressed (Acheampong & Halderman, 2012). It is envisioned that this
research will help to bridge the gap in literature concerning how income affects obesity
among African Americans and how it ultimately impacts society with a social change.
Literature Search Strategy
In this chapter, I review the literature on related topics that pertain to obesity and
how it is affected by income. Journals, books, and articles from various database sources
were reviewed. The key search strategy that I mostly used was the Thoreau multiple
database search. Other notable databases that were searched to extract relevant sources
for this literature review included PubMed, Medline, Google Scholar, and Academic
Search Premier. The key words used for this search included: obesity, income, African
Americans, ethnography, phenomenology, and Body Mass Index (BMI). These terms were
searched individually and in various combinations to identify key articles for this
literature review.
Background
The foundation of this research rests on the contrasting evidence of support that
relates to how obesity is affected by income. The CDC (2013) among others, published
23
literature stating that among non-Hispanic African American and Mexican-American
men, those who make higher incomes have a higher likelihood of becoming more obese
than those who make low income. The report also stated that higher income women are
less likely to be obese than those who earn low income. A sharp contrast to this statement
was made by Berkman and Kawachi (2000), who asserted that African Americans earn
lower family income, and therefore, are subject to higher obesity rates. It is these
contrasting findings that set my research into motion to ascertain the actual or existing
relationship between income and obesity.
History of Obesity
In tracking the global epidemic of obesity, Caballero (2007) recounted that
obesity arose out of human race’s struggle to overcome the scarcity of food, disease, and
a hostile environment. According to Caballero, the need to increase the average body size
became an important factor during the onset of the industrial revolution as a social and
political factor by the great powers. Caballero noted that the economic and military
powers of countries were essentially dependent on the physique and strength of their
young generations, out of which they recruited their work force and soldiers. This fact
translated into the idea that more food had to be consumed to maintain the required body
mass and height. The distribution of the population’s BMI was moved from that of
underweight range towards a normal range. This gave a useful and important impact on a
desired or expected survival rate and productivity that seemed to play a central role
towards the economic development of industrialized societies (Caballero, 2007).

24
According to Caballero (2007), historical records from developing countries
showed that the height and weight did increase progressively, especially during the 19th
century. Populations from well to do countries began to approach their genetic potential
for longitudinal growth during the 20th century as they began to acquire proportionally
more weight than height, which resulted in the increase in average BMI (Caballero,
2007). The human race then reached a kind of historical landmark by the year 2000,
during which for the first time in the evolution of man, the number of adults who had
excess weight exceeded the number of those who were underweight (Caballero, 2007).
Today, excess adipose tissue/body weight is widely known as one of the leading health
issues or threats throughout most countries around the world and also considered a major
risk factor for type 2 diabetes, cardiovascular disease, and hypertension (Caballero,
2007).
According to Wiley (2013), obesity is defined as weighing at least 20% more than
what an adult should weigh or having a BMI of 30 or more, though not accurate for
everyone. Being fat was regarded as a sign of wealth and health prior to the 1990s, in that
it was an indication that people possessed the resources to obtain ample amounts of food
(Wiley, 2013). However, in the 1990s and 2000s, obesity was considered more or less a
pointer of current and future health problems (Wiley, 2013). Wiley also attributed the
intensity of obesity in modern times to the fact that compared to previous centuries,
relatively intense labor just for living everyday has reduced. According to Wiley, this is
due to technology and resources and the ease for acquiring food has increased while the
cooking of food from the scratch, walking to places, and things done by machines instead
25
of by hand have increased, leading to sedentary lifestyles. Wiley recounted that even in
1960, only about 13.3% of people living in America were considered obese, but the
percentage of the population regarded as obese escalated drastically between 1980s and
2009. This author also stated that in the western portion of the southeastern United
States, and up to the Midwestern states such as Oklahoma and Missouri, the highest rates
of obesity were recorded in 2009. As to what caused the increased rates of obesity, Wiley
attributed it to production of food in certain aspects of society in terms of increased
portion sizes, such as increased sizes of hamburger growing from one ounce in 1957 to
almost six ounces in 1997. The absence or lack of physical activity due to reduced
physical education in schools to almost doing nothing but sitting in front of computers
and other electronic gadgets all day have led to a decrease in the number of calories
people extend currently, which in effect has increased rates of obesity (Wiley, 2013).
Effects of these have been noted as Wiley implied that there has been a continual spike in
obesity prevalence over the past 30 years, and by year 2000, approximately 65% of the
adult population indicated a BMI (weight/height2) above 25, and 30% had a BMI above
30. Wiley blamed the obesity syndrome on the fact that as history had indicated, human
obesity was notably linked or associated with gluttony and lack of self-control at the
table. In effect, treatment and preventive measures could be directed at attitudes and
individual behavior.
Income and Obesity
Income plays a useful role in the concept of obesity because of its measure of SES
position as it has a direct relation or association to the amount of material possessions an
26
individual or family has. The income a family makes determines what kind of health or
health insurance they can afford because money has influence on these human
requirements (Berkman & Kawachi, 2000). According to Berkman and Kawachi (2000),
adequate amounts of money possessed by an individual or family has important
implication due to the range of effects money has on health in terms of quality, type,
opportunities for cultural, recreational, and physical activities, the availability or absence
of influx of fast food restaurants, and supermarkets.
Employing data from the Health and Retirement Study, Smith and Flowers (2009)
showed that African American and Hispanics’ households possess less wealth at almost
every income level. According to Smith and Flowers, on the average, African Americans
earn 27 cents to a dollar of wealth compared to that of a middle-aged Caucasian’s
household. Even in the category of incomes for households that have income at the top
quintile, African Americans are noted to have 56% less the net worth, while Hispanics
households’ was 67% less net worth than Caucasian households (Smith & Flowers,
2009).
The gap in literature leading to the importance of this research was how income is
related to obesity among African Americans, with the target population residing in
Durham, NC. Earlier ecological studies revealed an association between income,
inequality, and poor health status (Subramanian & Kawachi, 2004). It is now widely
known and accepted that lack of adequate income (poverty) poses a risk factor towards
premature mortality and an increase in morbidity (Subramanian & Kawachi, 2004).
Although there are several measures available for quantifying income inequality within
27
any society or community, the most frequently used is the Gini coefficient of income
distribution at the U.S. state level (Subramanian & Kawachi, 2004). Subramanian and
Kawachi noted that “Algebraically, the Gini coefficient is defined as half of the
arithmetic average of the absolute differences between all pairs of incomes in a
population, the total then being normalized on mean income” (Subramanian & Kawachi,
2004, p. 78). The explanation given is that assuming incomes in a population are
completely and equally distributed, the Gini value will be 0, and if for instance, one
person happens to have all the income (maximum inequality), the Gini will be 1.0
(Subramanian & Kawachi, 2004).
Lifestyle changes, such as increased sedentarism and the increasing consumption
of fats and refined carbohydrates, have been noted to be fueling the epidemic of obesity
(Mendez et al., 2004). In a cross-sectional population-based study in Jamaica, Mendez et
al. (2004) found that income was strongly and positively associated with obesity in men.
In women, they found that obesity levels were high even among the very poor, and the
income gradient was noted to be more moderate. Their study used 847 men and 1249
women aged 25-74 years, who were recruited randomly from a periurban area in 1993-
1998. Melendez et al. stated in their introductory preamble that in the past, studies that
had been done in developing countries generally had shown higher levels of obesity
among the upper SES groups, which suggested that such changes to lifestyles were
mainly adopted and introduced in relatively economically richer groups. However, recent
studies among several middle-income countries have reported notable increases in
obesity in low-SES groups, reducing the effect of the SES-obesity association (Melendez

28
et al., 2004). The recommendation of Melendez et al. was that studies should be
conducted in other middle-income countries to assess the extent of increasing obesity in
low-income groups. The study by Melendez et al. showed some contrasts to findings by
Berkman and Kawachi (2000), who mentioned that African Americans earn low incomes
and are subject to higher obesity rates.
Wang and Beydoun (2007) noted that within the past 30 years, the United States
has experienced a considerable rise in the prevalence of obesity, which has contributed to
a public health crisis. According to Wang and Beydoun, there has been an increasing
body of evidence that has reported tremendous disparities among population groups and
the on-going changes that are associated with patterns that include the epidemic of
obesity in the United States. In their quantitative meta-analytical study, they found that
obesity was related to gender, age, socioeconomic, racial/ethnic, and geographical
characteristics. They indicated that overall, the less educated persons (those who had less
than high school education) had a prevalence of obesity that was higher than their
counterparts, except African American women. African American women with less than
a high school education were reported to have the lowest prevalence of obesity as
compared to those who had seemingly higher educational attainments (Wang & Beydoun,
2007).
The study by Wang and Beydoun (2007) also found that obesity prevalence in the
low SES group among White men decreased during 1988-1994 and 1999-2002, while
within the same time frame, the prevalence of obesity, there was a considerable higher
rate increase among low SES Black men in comparison with other SES groups. As far as

29
Black women were concerned, obesity was found to be rapidly in the higher-SES and
medium-SES groups as compared with the low-SES groups between 1976-1980 and
1999-2002 (Wang & Beydoun, 2007). In their discussion and conclusion, Wang and
Beydoun indicated that health study had shown that low income, lower-SES and minority
population groups including Blacks had less access to facilities that provided physical
activities, “which in turn was associated with decreased physical activity and increased
overweight” (p. 24). Wang and Beydoun advocated for policy makers and public health
workers to be mindful of racial/ethnic differences that could have effects on individual’s
health behaviors and status of body weight.
The CDC has reported that African Americans and Hispanics had a 51% and 21%
greater prevalence of obesity, respectively, than Caucasians (Acheampong & Halderman,
2013). The US Census Bureau (2008) has noted that the two largest minority groups in
the US are African Americans and Hispanics. They estimated that 40.8 million (13.1%)
of the total populations are African Americans and 52 million (40.8%) are Hispanics (US
Census Bureau, 2011). In their descriptive study on nutrition, knowledge, attitudes,
beliefs, and self-efficacy among low-income African Americans and Hispanic women,
Acheampong and Halderman (2013) found that low income, low SES plays a significant
role among minorities and immigrants. Low SES was noted to correlate to poor health,
which could possibly lead to cardiovascular diseases and other obesity-related illnesses
among African Americans and Hispanics (Acheampong & Halderman, 2013). I found
this study by Acheampong and Halderman playing a critical role in the literature review,

30
but what was not mentioned was what the authors regarded as a low income for
minorities.
St. Rose and Wilson (2009) reported that persons living with chronic diseases in
the United States were approximately 90 million, and this constitutes 70% of American
deaths. The researchers noted that although these types of conditions affect all racial
groups, African Americans are the ones who suffer most from these diseases. In a
descriptive exploratory design study with 150 African American households from one
city and one county in southeastern Virginia, St. Rose and Wilson noted that income was
inversely correlated with diseases such as diabetes and obesity. They also found that
education was inversely correlated with stroke and alcohol consumption, but positively
correlated with physical activity, healthy insurance and routine checkup. St. Rose and
Wilson’s study was an indication that the prevalence of obesity among non-Hispanic
black women aged 40-59 was higher (53%) compared to non-Hispanic White women
(39%); among older women, 60 years and older, the prevailing percentages on non-
Hispanic black women and non-Hispanic men known to be obese were 61% and 32%
respectively (St. Rose & Wilson, 2009). The study also noted that in Virginia, in 2000,
African Americans had a lower median household income ($36,885) than Whites
($59,494). Again in the same year, the median household income for African Americans
in Southeastern Virginia was $35,629 as compared to $47,352 for Whites (US Census
Bureau, 2003). In terms of education in Virginia, in 2000, close to 18.6% of African
Americans had <12 years of education compared to 9.5% of white. It was estimated that

31
18% or 281,668 African Americans aged 25 years and more had <12 years of education
as compared to 9.3% or 636,140 of Caucasians (US Census Bureau, 2003).
St. Rose and Wilson (2009) also mentioned that socio-economic status is an
important factor as far as the development of chronic diseases is concerned. They
mentioned the two leading indicators of socio-economic factors as income and education,
but they did say, however, that these variables are not “uniformly correlated” (St. Rose &
Wilson, 2009, p. 156). St Rose and Wilson indicated that researchers have studied the
important role of income and education patterning to the development of chronic diseases
such as obesity and found that there is a relationship that exists. Further research into the
SES has provided evidence to the effect that low income and education are linked with
poor diets, smoking, use of alcohol, and physical inability. St Rose and Wilson placed
relevance to their study as well as clinical practice by noting that recognizing the various
groups of people at risk for chronic diseases such as obesity, could help to alert health
professionals when establishing and implementing community-based interventions
geared towards the promotion of healthy diet and nutrition and consequently decreasing
the number of people with hypertension and other chronic diseases.
Obesity continues to be a significant problem in the United States as reported by
Gary, Gross, Browne, and LaVeist (2006). Gary et al. (2006) noted that national data
pinpointed a 61% increase in the prevalence of obesity from 1991-2000, and this chronic
disease, which has been identified as a precursor to several chronic diseases is “probably
the strongest risk factor for type 2 diabetes” (p. 253). Comparing to white counterparts,
Gary et al. reported that as a result of obesity, African Americans are disproportionately

32
affected by the burden of type 2 diabetes. In a cross-sectional study that used a population
size of 406 young adults (primarily African American) graduating students from an
urban historically Black university located in the mid-Atlantic region in the spring of
2003, Gary et al. (2006) did a wellness study of baseline correlates of overweight among
African Americans. Correlates of overweight or obesity (BMI ≥ 25) were calculated with
logistic regression models, stratified by gender in order to determine odds ratio for socio-
demographic, weight-related, and health status variables with overweight/obesity. Among
their findings, Gary et al. reported that there was an apparent trend that showed that those
in higher SES groups had lower overweight compared to the group with lower SES (p.
262). Gary et al. implied that those with higher family income had lower
overweight/obesity status. The finding also showed that participants whose fathers were
college graduates were less likely to be overweight than those whose fathers did not
graduate from college (OR = 0.38, p < 0.05). The study also reported that females who
had indicated that their family had experienced family economic hardships when they
were growing up were more likely to be overweight (OR = 2.19, p < 0.01) than those
who did not experience such family hardship. In their discussion, the researchers noted
that those who were married, had children and classified as belonging to lower SES
groups seemed to be more overweight. This also supported the argument that family
income had an effect on overweight/obesity. Arfken (1996) agreed that obesity has a high
prevalence among African Americans and low-income families, but he said very little
was known about the perception of overweight among African Americans living in inner
cities.

33
Schneider (2011) emphasized that the intake of fruits and vegetables was hardly
patronized by people of lower income, especially African Americans. In spite of a
growing body of literature that has revealed the benefits of diets high in fruits and
vegetables, it has been noted that most African Americans eat lesser than the
recommended amount of such foods. Lucan, Barg, Karasz, Palmer, and Long (2012) also
reported that diseases such as obesity, high cholesterol, and hypertension, which had their
origin from bad eating habits affect African Americans disproportionately, especially,
those with low income. According to Lucan et al. (2012), part of the issue could be diets
that were low in fruits and vegetables but high in refined carbohydrates. In support of this
notion Robinson (2008) mentioned that those who are the least likely to meet the
guidelines established by USDA in terms of daily servings of vegetables and fruits are
non-Hispanic Blacks and people with lower incomes. According to Robinson descriptive
studies, dietary behaviors among African Americans could be traced to a complex array
of personal, cultural, and environmental factors. As one of the five levels of influence
categorized by the socio-ecological model, Robinson asserted that such useful framework
for achieving a better understanding of the multiple factors and also barriers that have
effect on dietary behaviors can be useful when creating strategies and guidance for
developing the appropriate cultural interventions for African Americans.
The effect of lower income on the prevalence of obesity has also been studied and
was related to the presence of fast food restaurants (FFR) in close proximity to African
American consumers. In a longitudinal cohort study in Houston, Texas that was
published in the American Journal of Public Health, Reitzel et al. (2013) reported that

34
FFR density in the distances of 0.5, 1, and 2 miles was positively associated with
increased BMI among subjects who had lower incomes (p ≤ 0.025) and their results
supported the fact that African Americans living in that proximity with lower income had
their BMI affected. Reitzel et al. were really concerned with the growing rate of obesity
in the United States by stating that health care cost for Americans who are growing in
waistlines is quite substantial and is expected to hit $860 billion by 2030. Also of
particularly concern noted by these researchers was the fact that compared to other
racial/ethnic groups, African Americans are showing the highest prevalence of obesity.
The rationale behind the FFR syndrome is that the increasing availability of low-cost,
calorie-dense consumables obtained from FFR is one of the major factors that were
attributed to the nation’s upward trend of BMI (Reitzel et al., 2013). A few studies have
reported that African Americans are liable to consume fast food if it is available, and this
tends to be possible because these FFR are clustered in the neighborhoods of African
Americans, no wonder high quantities of fast food consumed has been associated with
higher BMI/obesity (Reitzel et al., 2013). However, Reitzel et al. did mention that several
studies that examined the associations between the clustering of fast food and BMI
revealed findings of the association of FFR with BMI or obesity status as being mixed.
Thus some studies supported a positive association while others cited null results (Reitzel
et al., 2013). Future or additional studies with more diverse African Americans are
expected along this line to bridge the gap in earlier reported results from literature.
An additional research that sought to examine the effect of social contexts of
neighborhood suggested that low SES status could likely contribute to low levels of

35
physical activity, which correlated with obesity, but such an association was inconclusive
(Dulin-Keita, Thind, Affuso, & Baskin, 2013). As argued by Dulin-Keita et al. (2013),
some studies had indicated that neighborhood level economic status was inversely
associated with obesity while others did not find any significant associations. The
findings by Dulin-Keita et al. show that more research is required to bridge the gap that
exist between income level and obesity. As far as the features of neighborhood are
concerned, Dulin-Keita et al. implied that the features of a neighborhood could contribute
to the decrease in physical activity and therefore obesity among African Americans rises
to higher levels. The researchers further stated that African Americans are more likely to
dwell in low-income urban areas that showcase more built environment barriers like poor
housing stock, sidewalks, street design and a greater traffic density within the
neighborhoods. Their findings were based on a cross-sectional study that examined the
social and cultural factors that influence African American parents and adolescent’s
participation in physical activity from the Birmingham, Alabama metropolitan area with a
predominant African American population (73.4%). This location indicated 32.7% of
families had incomes below the poverty level (Dulin-Keita et al., 2013). The researchers
proposed that community-based interventions to decrease obesity among African
Americans should focus on devoting attention to both neighborhood perceptions and
physical activity, which have some association with income levels.
Economic considerations were reviewed in terms of what individuals or family
members were purchasing for consumption due to their income and its contribution
towards obesity. In a qualitative research that interviewed 33 African American

36
participants ranging from 18 to 81 years from Philadelphia, Pennsylvania. Lucan et al.
(2012) found that some participants (nine) considered fresh fruits and vegetables as being
too expensive. Some participants also reported that the places that offered free food to
overcome financial barriers only gave out canned foods (not fresh produce). There were
only four women who mentioned that food produce could be affordable if people knew
how to shop around or well for the best deal. Thirteen of the participants remarked that
with fast foods they could get more for their money. Others regarded better meal as an
illusion; fast foods would eat up your money. Ten participants admitted to buying and
eating fast foods based on their cravings and considered themselves as being “junk
foodaholics” (Lucan et al., 2012, p. 700). The underlining factor for this study is the fact
that the constraints on income or financial status compelled some African Americans to
move towards less expensive and unhealthy foods instead of shopping for healthier foods
such as vegetables and fruits, which could be equally less expensive. In the
aforementioned study, in which Lucan et al. published “Perceived Influences on Diet
Among Urban, Low Income African Americans,” it was noted that economic influences
played a major role on what African Americans purchase and consume. The study was
consistent with other studies with similar findings as noted by the researchers. The
researchers noted that financial assistance programs mentioned by the participants helped
to encourage fruit and vegetable consumption. According to the researchers, their
limitation was the fact that their method allowed them to only examine participants who
reported spontaneously on certain influences and not those who would endorse such
influences if they were prompted. Lucan et al. concluded that, “diet-related diseases such

37
as obesity, diabetes, hypertension, and high cholesterol disproportionately affect African
Americans, particularly those having low income” (p. 700). The recommendations given
by the researchers from this study align with most studies and that is a suggestion for
potential strategies that would improve diet among urban, low-income African
Americans.
Bartholomew, Miller, Ciccolo, Atwood, and Gottlieb (2008) performed a quasi-
experimental study to buttress the findings by Lucan et al. (2012). In their study that
sought to “evaluate the Walk Texas! Clinical Counseling Guide for Nutrition,”
Bartholomew et al. (2008, p. 297) found that eating five to nine servings of fruits and
vegetables daily could lead to reduction of the risk of cancer, obesity and cardiovascular
diseases. A total of 433 women were recruited for this study. The study employed a
method of using a pre-test post-test quasi-experimental design with intervention as well
as comparison clinics that were matched for ethnicity and size by the researchers. The
study revealed that SES seems to be a strong predictor of fruits and vegetable
consumption, as well as morbidity and mortality. They reported that participants in low
income groups did not meet the recommended national servings of five servings per day
(Bartholomew et al., 2008).
Commenting on the results of their quantitative study on race, obesity, and the
puzzle of gender specificity, Burke and Heiland (2008) argued that there have been
notable black-white gaps in the mean female BMI and obesity risk after education and
incomes measures have been incorporated to the model of analysis. However, the
researchers did say that the estimated gaps seem to narrow somewhat when such controls

38
are included. In agreement with their predictions, Burke and Heiland noted that estimates
showed that women who had postsecondary education have lower BMI and a lower
prevalence of obesity than women who did not finish high school. The study also
indicated that across the data sets and models, women who were in households that
garnered high income (incomes that was 3.5 times the poverty level) had a significantly
lower BMI and a correspondingly lower likelihood of becoming obese as compared to
their counterparts from a family with lowest-income (Burke & Heiland, 2008). They
concluded that the differences in educational level and household income between black
women and white women do contribute, but did not fully account for the differences in
BMI and obesity between the groups. With regards to results for men, Burke and Heiland
noted that in the baseline specifications; age, age-squared, and race, there were no
significant differences in either mean BMI or the risk of obesity among white men and
black men. This contrasts other studies that show differences between these groups as far
as income and obesity is concerned. As a recommendation, Burke and Heiland proposed
that initiatives of new policies should override racial tensions that are related to ideals of
beauty and rather seek to focus on health. They also mentioned that seeking to improve
black women’s status, and especially promoting more equality in the expectations of
domestic responsibilities could lead to a better self-care and advancement among black
women (Burke & Heiland, 2008).
Social and Economic Well-Being of North Carolinians
The Office of Minority Health and Health Disparities and State Center for Health
Statistics, North Carolina Department of Health and Human Services has a useful tool

39
called Racial and Ethnic Health Disparities in North Carolina. This tool gives its report
card showing the leading health indicators for broad racial and ethnic population groups
for North Carolina (Office of Minority Health and Health Disparities and State Center for
Health Statistics, 2010). It supports data for health indicators and assigns a grade (letter)
that ranks the health status of those groups under consideration. One of the functions of
this report card is to measure and help monitor the State’s progress towards the
elimination of health status gaps between racial and ethnic minorities and the white
population (North Carolina Division of Public Health, State Center for Health Statistics,
2008). The source stated that according to America’s Health Rankings, North Carolina
ranked 37th in the United States in 2009. Some of the indicators have been included in
the following summary:
In 2004, the percentage of adult African American families, who were living
below the federal poverty level in North Carolina, was 25.2% and 7.5% for Caucasians.
When these were updated in 2008, the rates were 31.3% and 6.7% for African Americans
and Caucasians respectively (U.S. Census Bureau, 2004; 2008). The percentage of single
parents for African Americans and Caucasians in 2004 was 54.8% and 17.2 %
respectively. In 2008, the updated percentages were 52.8% and 17.8% in the same order
(U.S. Census Bureau, 2004; 2008).
In 2004, the median family income for African Americans was $30,463 and
$52,991 for Caucasians. When updated in 2008, the median family income for African
Americans in 2008 was $37,897 and that of Caucasians was $64,879 (U.S. Census

40
Bureau, 2004; 2008). All indicators used showed that African Americans were trailing
Caucasians in economic incentives and well-being.
Using the percentage of families not owning their own home, in 2004, it was
noted that the percent of Africans not owning a home was 46.1% and that of Caucasians
was 24.2%. In 2008, the percentage was 50.7% and 24.2% for African Americans and
Caucasians respectively (U.S. Census Bureau, 2004; 2008).
In terms of dropouts that affect the educational attainment and eventually the
income made by individuals and families, it was reported that in 2005-2006, the dropout
rates for African Americans was 5.6% and 4.4% for Caucasians. In 2007-2008, the
dropout rate was 6.0% and 4.3% for African Americans and Caucasians respectively
(North Carolina State Board of Education, 2008). In 2002 and 2003, the percentage of
adult African Americans who did not eat five or more fruits and vegetables a day was
81.1% and that for Caucasians was 74.5%. In 2005 and 2007, the rates were 82.2% and
77.9% for African Americans and Caucasians respectively (U.S. Census Bureau, 2008).
In 2003-2005, the percentage of African Americans adults 18 and older who were
overweight or obese (BMI > 25kg/m2) was 73.8% and 59.8% for Caucasians. In 2006-
2008, the percentages were 74.9% and 62.3% for African Americans and Caucasians
repetitively (U.S. Census Bureau, 2008). In regards to meeting the Healthy People 2010’s
goal of at most 20% of no leisure physical activity, the report mentioned that in 2003-
2005, the percentage of adult African Americans was 31.5% and 21.7% for Caucasians.
In 2006-2008, the percentages were 29.4% and 21.3 % for African Americans and
Caucasians respectively (U.S. Census Bureau, 2008).
41
Figure 1. BMI trends of North Carolina adults (1990-2008). Reproduced from
www.schs.state.nc/SCHS/brfss. Copyright 2008 by State Center of Health Statistics, NC:
Department of Health and Human Services.
Adult Obesity in North Carolina
It has been estimated that over 65.7% of North Carolinians are overweight or
obese. As reported by the North Carolina Behavioral Risk Factor Surveillance System
(NC-BRFSS), State Center for Health Statistics (2008), over 56% failed to meet the
recommendation for engaging in physical activity: national recommendation has been set
as moderate physical activity for 30 or more minutes per day, 5 or more days per week or
vigorous physical activity for 20 or more minutes per day, 3 or more days per week (NC-
BRFSS, 2008).

42
Figure 2. Percentage of adults and overweight/obesity. Reproduced from
www.schs.state.nc/SCHS/brfss. Copyright 2008 by State Center of Health Statistics, NC:
Department of Health and Human Services.
It was also noted that more than 78% of adults in NC did not meet the
recommended servings of five fruits or vegetables per day. There was an increase in the
percentage of obese adults in NC as the percentage doubled from almost 13% in 1990 to
28% of the population as at 2007, and consistently remaining a little higher than that of
the national average (North Carolina Department of Health and Human Services, 2007).
The factors that have contributed to the epidemic of obesity in NC include the absence of
adequate physical activity and poor eating habits. The combination of these two factors
has been noted as the second leading preventable cause of mortality in the state. These
two factors have also been known to lead to or an increase in risk of heart disease, some

43
types of cancer, diabetes, high blood pressure, stroke, and obesity (North Carolina State
Center for Health Statistics, 2002).
The NC-BRFSS (2008) reported that during 1990 and 2008, there was a decline in
adult’s healthy weight by about 17.1% and during the same time period, adult North
Carolinians rose by about 5.5% with the percentage of population increasing by 15.9%.
The source also mentioned that the percentage of the adults healthy weight somewhat
declined by just 14.2% between 1990 and 2000. The reported average annual decline was
1.5% and there was little to no decline during the late 1990s. However, this has declined
by almost 19.2% from 2000 to 2004, with 5.2% as annual average decline rate. The NC-
BRFSS also reported that almost two-thirds of adults in NC (65.7%) showed obese status
based on their 2008 BMI results.
NC-BRFSS also reported that in 2008, overweight and obesity among men were
higher than that of women in 2008. The report indicated a percentage of 72% for men and
60% for women. In terms of age group, 73% of adults between 55 and 64 years of age
were overweight or obese as compared to 51% of those in the age bracket of 18-24 years.
67% of those in age group 65-74 were overweight or obese while those of age group 75
and older accounted for only 56%.
In terms of income and obesity, the NC-BRFSS (2008) reported that adults with
the highest income had the highest percentage of persons at a healthy weight, and on the
other hand, those who were in the lowest income bracket had the highest percentage of
people who were obese. For instance the percentage of those who were overweight and
obese and whose household income was less than $15,000 in 2008 was 70%. Using the

44
same comparison, 63% of people whose household income was more than $75,000 were
noted to be overweight or obese (NC-BRFSS, 2008).
An interesting finding about income, educational status, and environment showed
other health disparities play a larger role in obesity. For example, according to Gordon-
Larsen et al. (2003), additional studies showed that SES impacts have led to other health
disparities playing a larger and clearer role. He mentioned that a 2003 study found that
when adolescents were kept within the same environments but changes or improvements
were made only on family income and parental education, there was only a limited effect
observed on the disparities in obesity prevalence. Gordon-Larsen et al. (2003) noted that
an automatic assumption cannot be made that to the effect that the benefits of increased
SES, which was found among Caucasian adults, will in a way transfer to other gender-
age-ethnic groups. The conclusion these researchers made was that such findings
suggested that policies and efforts meant to reduce obesity disparities that exist among
ethnic groups should look extensively broader than income and education and consider
some other factors that includes environmental, biological, contextual, and socio-cultural
factors.
Theoretical Framework
The HBM was chosen because of its ability to explain various health behaviors
(Mckenzie, Neiger, & Thackeray, 2009). The HBM is recorded as one of the most
frequently utilized theory in the application of health behaviors. It is a value-expectancy
theory that was developed during the 1950s by psychologists in attempt to explain the
reason why people would use or not use available health services (Mckenzie et al., 2009).
45
According to Mckenzie et al. (2009), the HBM stands on three pillars of
hypotheses, which are:
1. The existence of sufficient motivation (health concern) to make health issues
salient or relevant;
2. The belief that one is susceptible (vulnerable) to a serious health problem or to
the sequelae of that illness or condition. This is often termed perceived threat,
and:
3. The belief that following a particular health recommendation would be
beneficial in reducing the perceived threat, and at a subjectively acceptable
cost. (p.171)
On the subject of HBM, Schneider (2011) added that the HBM is a model that
helps to explain how people’s behavior is affected by their own beliefs. Schneider
pointed out that for individuals to change their behavior towards something there must be
a belief in personal threat. This means the individual must be susceptible to some
condition or threat. Schneider also implied that for people to overcome a behavior, they
should have a belief in response efficacy, meaning that there is something they can do to
alleviate or eliminate the source of threat.
By linking the concepts provided by Mckenzie et al. (2009) and that of Schneider
(2011), this research identified behavioral sources in response to the research questions
that underline this study. The key factors that contribute to low family income among
African Americans in Durham, NC (target population), and how the low income
contributes to obesity might be explained by the HBM. The HBM helped to explain the

46
threat posed to the target population, how the target population might be threatened by
this, and the efficacy they could display to counteract this situation.
Health Belief Model and Obesity
The HBM is considered one of the oldest social cognition models (Ozden, 2011).
According to Ozden (2011), one of the astute goals of the HBM is to predict if
individuals will choose to be engaged in an action that will serve to reduce their
perceived threat in order to reduce the chances of long term effect or death. The HBM
thus addresses how health is affected by beliefs, and how decision processes lead to
behavioral changes (Ozden, 2011). Ozden mentioned that there are two main types of
beliefs that influence people towards taking preventive actions. These are: (a) Beliefs that
are related to people’s readiness to take action, and (b) beliefs that are related to
modifying factors that either facilitate or inhibit an individual’s action (p. 533). Ozden’s
study showed the development of a scale based on the HBM, which provided a positive
valid and reliable evaluation of obese people’s beliefs and attitudes as far as obesity was
concerned. This is an indication that when it comes to obesity, an individual’s beliefs and
attitude play a major role.
Daddario (2007) also emphasized that the HBM is one of the appropriate models
that helps individuals with beliefs and behavior change. She intimated that obesity is one
of America’s most serious epidemics. She mentioned that behavior change models, such
as HBM are very important for prevention of weight gain and ultimately a goal for living
healthier lives. Daddario indicated that the HBM expatiates and seeks to address the
effects of the beliefs that focus on health and decisions made by people that eventually
47
lead to behavioral changes. This can be extrapolated to the decisions that individuals or
families make on how their eating habits and the income they make can ultimately affect
how obese they become.
Sapp and Weng (2007) evaluated a number of psychosocial models or theories
involved in behavior change in regards to nutrition and obesity. They concluded that
concluded that among models such as the theory of planned behavior and transtheoretical
model, the HBM is the most appropriate model because it has received very considerable
attention and support in research since its development. Moreover, the HBM gives
interpretation more with proactive behavior change approach rather than the avoidance of
disease prevention (Sapp & Weng, 2007).
Relationship to the Proposed Study
Obesity poses a major threat to public health (Daddario, 2007). Although obesity
and overweight were once considered as only a problem among countries with high
income, they are now higher among low-and middle-income countries, especially those
in the urban areas (Ozden, 2011). The fact that obesity is a precursor to diabetes and
cardiovascular disease; it makes the disease a national issue. The effects of the obesity
among African Americans are quite an alarming one (Daddario, 2007).
In a study that focused on literacy, knowledge, health beliefs about obesity and
low income African American women with the HBM as the framework, Wilson et al.
(2008) showed that low-income is a contributing factor to obesity among African
American women and this is also consistent with the attributes of the HBM. Their study
showed a semblance to previous studies that indicate that the HBM seeks to explain and

48
also predicts health behaviors with a highlight on attitudes and beliefs of the consumers.
Wilson et al.’s study proved that the ability and readiness of consumers to take action
about their life’s situation are governed by factors such as knowledge of perceived
susceptibility threat, perceived benefit of the strategies needed to improve their situation
or to promote their health, and any cues that eventually motivate them to take action.
These factors as depicted in the study by Wilson et al. find their origin in the HBM. Thus,
the aim of using the HBM is that knowledge will bring the needed change (Schiavo,
2007) so that the target population will be empowered with knowledge of attaining higher
levels of education, which would ensure better employment, obtaining higher income,
changing their eating habits, and ultimately decreasing the prevalence of obesity. The
figure below demonstrates the HBM in relation to perceived threat and individuals’
beliefs and behavior.
Figure 3. Diagram of the Health Belief Model. Retrieved from
http://www.med.uottawa.ca/sim/data/BehaviorChange_e.htm. Copyright 2009 by
L’ Universite canadienne, Canada’s University.
49
Methodological Approach
The methodological approach for this study was based on phenomenology.
According to Moustakas (as cited by Creswell, 2009), there has been elaborate discussion
on philosophical tenets and the procedures of the phenomenological method in qualitative
research (p. 13). Creswell’s study provides a clear insight on phenomenology.
Phenomenology
Creswell (2009) defines phenomenological research as “a strategy of inquiry in
which the researcher identifies the essence of human experiences about phenomenon as
described by participants” (p. 13). According to Creswell, the ability to understand the
lived experiences of participants or a group of people is a mark of phenomenology as an
attribute of philosophy as well as a method. Such procedures, according to Creswell,
involve a study of some aspects of the subjects or participants through prolonged and
extensive engagement with a goal to develop a pattern and relationship of meaningful
relevance. Creswell affirmed that in such a phenomenon and method, the researcher
places his/her own experiences aside in order to be objective and to, understand the views
of participants of any study.
Phenomenology has also been defined as, “a low-hovering, in-dwelling,
meditative philosophy that glories in the concreteness of person-world relations and
accords lived experience, with all its indeterminacy and ambiguity, primacy over the
known (Gee, Loewenthal, & Cayne, 2013, p. 2). By this definition, Gee et al. (2013)
implied that the consciousness of a person is most often geared towards some object in or
about the world and somehow conscious of something within the life world. Gee et al.
50
implied that consciousness was intentional and the implication was that perceptions have
meaning . One of the important attributes of phenomenology as Gee et al. analyzed their
case on phenomenology and reverie is reduction, and the first of this reductions is
bracketing, which is placing aside our judgments, assumptions, and theories and thereby
giving the participants the opportunity to give their own experiences while the researcher
gains knowledge from that without his or her opinion (Gee et al., 2013). The use of
phenomenology as a methodological approach is important to my research because as I
interviewed participants for this study, every effort was made to incorporate and, desist
from including my own opinion or influencing participants to report anything but their
own experiences. Delgado (2013) did state that the final interpretation of such meaning
can be well executed with phenomenological approach or tactics whether it is descriptive
or interpretative.
With regards to qualitative research and application of phenomenology, Delgado
(2013) mentioned that usually qualitative methods are used in the “context of
psychological science for classification tasks, for discovery, and for the study of the
individual interpretation of meaning” (p. 228). Therefore, phenomenology played a
useful part in this study. Phenomenology is derived from philosophy and has been known
to provide a framework as a research method (Roberts, 2013).
According to Roberts (2013), phenomenology has its basis in humanistic research
paradigm and takes a qualitative approach. Denscombe (as cited by Roberts, 2013) stated
that the focus and goal of phenomenological enquiry is to describe the lived experiences
of people, mentioning that only those who have actually experienced phenomena can

51
relate them to the outside world. Roberts (2013) pointed out that as a philosophical
method of inquiry; phenomenology was originated by German philosopher Edmund
Husserl (1859-1938), who is regarded as the founder of phenomenological movement.
Phenomenology plays a vital role in research because it is a rigorous science that finds
truth in lived experience and serves to provide insights from the perspective of those who
have actually lived the experience and can detail such experiences in a particular time of
their lives (Roberts, 2013). Because phenomenology describes first person accounts of
described experiences through interviews, which then becomes transcribed for analyzing
its themes and meanings and therefore enabling such experiences to be well understood
(Roberts, 2013). A phenomenological approach was very useful in incorporating into this
qualitative study. Roberts mentioned that other notable personalities who have made
phenomenology prominent were Gabriel Marcel (1889-1973), Jean Paul Sartre (1905-
1980), and Maurice Merleau-Ponty (1908-1961). In similitude to Gee et al. (2013),
Roberts also noted bracketing as an attribute of phenomenology, which seeks to suspend
the researcher’s own influence, ideas, beliefs, preconceived notions, and any prejudices
that could influence the respondents’ experiences and thereby skew any interpretation.
In a research approach, Roberts (2013) pointed out that the use of small sample
size is appropriate as this allows for focusing on the individuals’ experiences, while a
large size could overwhelm the research with a burden of data. In terms of data
collection, Roberts advised that the type of interviews that would favor this kind of
research is the semi-structured, which was Robert’s main method of collecting data.
Roberts concluded that interpretative phenomenological analysis is a potent research tool
52
that provides participants’ perspective experiences through subjective exploration, and
this provides in-depth and richer understanding of an event or phenomenon. The
inclusion of this methodology added substance to this study on the relationship between
family income and obesity among African Americans within this target population.
Summary
This chapter recognized the gap that this study sought to fill. The literature review
looked at the background of obesity as it relates to income. My search covered multiple
search terms and databases including PubMed, Medline, and Google Scholar. The chapter
also gave some insight into the history of obesity, how income plays a role in obesity, and
the theoretical framework governing the study. With regards to the theoretical
framework, Chapter 2 provided studies that used the HBM as a framework or model and
how this model fits into this research study. The chapter also discussed phenomenology
as the methodology appropriate for this study. The review of literature in Chapter 2
provided the essential tool needed for the research method, which includes the research
questions and the design needed for this study. This is the focus of the Chapter 3 of this
dissertation. Chapter 3 will also discuss how participants were recruited, collection of
data, instrumentation, ethical procedures, and threats to validity.

53
Chapter 3: Research Method
Introduction
The focus of this qualitative research was to explore the relationship between
family income and obesity among African Americans in Durham, NC. Using the
phenomenological approach, I explored the effects of earned family income on my target
population as far as obesity is concerned. A number of studies have demonstrated that
family income plays a role in the kind of foods people consume, the communities they
live in, and the type of physical activity they engage in, which ultimately affect their
health in terms of obesity. For example, Berkman and Kawachi (2000) reported that
because African Americans earn a low income, they are subject to higher obesity rates
than Caucasians. The CDC (2013) has also reported that among non-Hispanic African
American and Mexican-American men, those who earn higher incomes are more likely to
be obese than those who make lower incomes. The CDC also reported that higher income
women are less likely to be obese than low-income women. The gap noted in these
studies prompted my research on this topic. This chapter will discuss the research design
and rationale, the role of the researcher, proposed methodology, credibility, and issues of
trustworthiness for the proposed study.
Research Design and Rationale
The research design is the strategy a researcher chooses for answering research
questions in any study, and the research questions serve to direct the type of design that is
chosen (Crosby, DiClemente, & Salazar, 2006). As stated in the introduction above, a
qualitative research was conducted to explore the relationship between family income
54
and obesity among African Americans in Durham, NC. Empiricism, which is a
committed way of acquiring or obtaining knowledge through a means based on
experience (Rudestam & Newton, 2007), was used in this study. This is in contrast to
rationalism, which is derived from a sense of thought and reason (Rudestam & Newton,
2007). Because the perceptions and experiences of the participants were the sole
observation of this study and not any prejudices of the researcher, empiricism rather than
rationalism was the prime emphasis.
A qualitative approach was chosen because this type of inquiry or method
focuses on understanding participants’ experiences from a practical point of view as they
live it (Rudestam & Newton, 2007). The goal of this study was to report the findings as
obtained and not subject them to any manipulation of variables as expected in
quantitative studies. The rich experience of interviewing participants one-on-one in the
field that can be accomplished in a qualitative manner, for example using an open-ended
questions instead of closed-ended ones (Creswell, 2009) was also one of the reasons for
choosing a qualitative over a quantitative approach. Moreover, the ability to analyze data
obtained from the field inductively rather than deductively contributed to my choice of a
qualitative approach.
Role of the Researcher
As the researcher, my role was the individual primarily responsible for gathering
the participants, engaging in interviews, and collecting other forms of data and
documents to obtain all the necessary information needed for analysis. As the primary
researcher, it was my role to gain entry into the research site, and so all ethical concerns

55
that needed to be addressed were taken into consideration. It was my responsibility to
provide statements about any past experiences that could provide background data
(Creswell, 2009) through which my participants could well understand the title of my
research and how I would interpret the phenomenon being experienced by the them. It
was also my role as the researcher to provide confidentiality for my participants and
assure them that the information they provided would be kept in safe hands. It was also
my responsibility as researcher to make the participants aware of the necessary steps that
were taken to obtain permission from the IRB in order to protect the human rights of the
participants (Creswell, 2009). In this study, I served as an observer as well as an
interviewer. To avoid bias in collection of data, I used locations that were inhabited by
African Americans of low income, middle class income earners, and high class income
earners. The definitions of these income levels were based on the categories made by the
U. S. Census Bureau (2012). According to this category, lower income earners make an
annual income of $23,050 for a family of four. Middle class income is considered as
annual income between $32,500 and $60,000, while the higher income group is regarded
as an annual income of $100,000 or more. It was my prerogative that there was no
relationship between the participants and the researcher. This prevented any bias,
personal, or ethical issues (Creswell, 2009). The criteria were based on zip codes that
have the reputation of classifying the kind of people with well-known SES. This was
facilitated by the use of census maps.
Research Questions
As previously stated in Chapter 1, the research questions for this study are:

56
Research Question 1: What are the key factors that contribute to low family
income among African Americans in Durham, NC?
Research Question 2: How do these key factors contribute to obesity among
African Americans in Durham, NC?
It was envisaged that responses to these questions will help to find a relationship
that exists between family income and obesity among the African Americans in the target
community. According to Creswell (2009), inquirers tend to state their research questions
and not objectives during a qualitative study. The research questions, according to
Creswell, often take on two forms, which are the central and associated subquestions. In
terms of phenomenology, research questions may be broadly stated without giving
specific reference to the existing literature (Creswell, 2009). Moustakas (as cited by
Creswell, 2009) suggested that it is in order for researchers to ask participants what they
experienced and the contextual nature in which participants experience any phenomenon
within the study. The advice recommended by Creswell was employed in this research
study to obtain the maximum data for analysis.
Methodology
The methodological approach for this study was that of phenomenology. As
indicated in Chapter 2, phenomenological studies have the ability to understand the lived
experiences of participants or a group of people. This feature about phenomenology is an
attribute of philosophy as well as a method (Creswell, 2009).

57
Participant Selection Logic
The target population for this study was African Americans living in Durham,
NC. The target sample size was n = 30 adults ranging in age from 18 years and above.
Mason (2010) argued that qualitative studies tend to be smaller in number than
quantitative studies. Mason stated that a point of diminishing return sets in with
qualitative sampling when more data or participants interviewed do not necessarily mean
more information. Therefore, the samples should be large enough to ensure that all the
perceptions needed for analysis are covered, but at the same time not too large to be
repetitive and superfluous (Mason, 2010). Although I expected to attain saturation for
obtaining data/interview responses, I decided to interview the entire 30 participants, a
size that was not too small, nor too overwhelming. This enabled me to obtain a sample
size representative of the perception of participants. Sample size was of the essence
because according to Smith, Flowers, and Larkin (2009), a smaller size is used in
qualitative studies to focus on individual experiences, while a larger size can overwhelm
the researcher. Participants were sampled to cover income brackets of low income,
middle class income, and high class income earners. Various zip codes notable for these
differences were visited as the sites for the study. Ten participants from each of these
income classes were interviewed. This range also prevented sampling bias (Creswell,
2009). Because phenomenology was involved in this study, identifying and locating
participants who had actually experienced this phenomenon (Rudestam & Newton,
2007), how income affects obesity, were of paramount importance. According to
Rudestam and Newton (2007), “phenomenological study usually uses sampling, which is

58
idiographic and focuses on the individual or case study in order to understand the full
complexity of the individual’s experience” (p. 106).
Procedures for Recruitment and Participation
Upon approval by IRB, I visited the designated target location and notified the
potential participants of the intention of this study. The sampling consisted of participants
18 years and above who were gainfully employed either part time, full time, or receive
some form of financial compensation. The recruitment was conducted over a 2-month
period. The target sites comprised of community subdivisions and apartments likely to
consist of the three classes of income levels stated earlier. I gave the participants a
briefing on the criteria of selection and inclusion of this study and notified them they
were under no obligation to start or continue this study if they did not wish to do so. The
recruitment included both genders and a good representation of age groups with stable
employment status or reliable source of compensation.
The criteria for selection of participants were based on:
1. Participant must be 18 years or above.
2. Participant must sign the informed consent form.
3. Participant must be living in Durham, NC during the study period.
4. Participant must be willing to declare his/her family income.
Informed Consent and Data Collection
As the primary researcher, I provided participants with a consent form, which
indicated or had a proof of approval for this study. A formal introduction was made to
participants to include my IRB approval number (03-09-15-0157453) and the ethical

59
issues governing the study. Those who indicated their willingness to participate in the
study were noted upon receiving their consent forms. These were the participants whom I
provided the various data collection methods for the study. The IRB informed consent
form included my contact information for any questioning by participants during the data
collection period. The participants were notified that it might be necessary to audio-tape
/record certain conversations of data collection for effective analysis.
Upon receipt of acknowledgement and approval of consent forms, I provided the
participants with interview questions designed to collect demographic data, which
included, but was not limited to age, race, gender, marital status, educational attainment,
employment status (part time or full time), income earned bracket, height, and weight (for
calculation of BMI).
Instrumentation
The data collection instrument and source included observation, interviews, and
audio-taping. The interview questions served as guide that enabled me to obtain
responses that helped answer the research questions of this study. These questions were
based on common questions asked by previous researchers on similar topics. The
observational aspect of this form of data collection entailed taking field notes about the
behavior and activities of the participants (Creswell, 2009). With this approach, personal
observations were made about participants and notes were recorded without participating
in any formal active process.
I used a face-to-face approach to interview my participants. I employed a
telephone conversation in a few instances where some pertinent information was needed
60
to clarify a previously interviewed participant’s responses. The interview method used
open-ended questions, which warranted participants’ own responses and thereby, limited
researcher influenced responses. Other forms of gathering information such as video-
taping or photographing were avoided. Data from consented participants were collected
for analysis in this study.
Exiting the Study
I informed participants that they could exit the study anytime they wanted without
any adverse consequences. With the provision of my contact information, I assured
participants to contact me for any questioning or summary of the findings. There was no
need for any debriefing in this study.
Data Analysis Plan
Gregg (2008) has noted that the first strategy that leads to a successful analysis is
to proceed with an analytical strategy ahead of time. A well-planned and careful
execution of analysis is very essential for a field investigation (Gregg, 2008). Based on
my line of study, I used the NVivo 10 software and Microsoft Word to analyze the
collected data. My strategy for data analysis followed the steps provided by Creswell
(2009), which included obtaining raw data, organizing and preparing the data for
analysis, reading through all the data, coding the data either through hand or computer,
setting the themes and description, interrelating the themes with my theoretical
perspective (for this study, HBM), interpreting the meaning of the descriptions, and
validating the accuracy of the information obtained (p. 178).

61
Creswell (2009) stated that it is a good practice to perform data collection and the
analysis simultaneously in qualitative research. According to Creswell, the objective of
this analysis is to identify and describe any pattern and themes from the participants’
perspective, and thereafter, make an attempt to understand and give explanations to such
observed patterns and themes. The approach I took was to have a field notebook for
recording interviews and have a tape recorder for audio recording as permitted by
participants. The data collected were linked to the research questions to help answer the
relationship that existed between family income and obesity among the target population.
The data were then organized categorically in chronological manner for review and
coding. Any taped recording session was transcribed verbatim and along with field notes
were reviewed and analyzed. All paper data collected have been kept anonymous and
confidential and will be destroyed after 5 years. All electronic data will also be deleted
from all computers used for this study after the same time frame.
Threats to Validity
Crosby et al. (2006) defined validity as the “the degree to which a survey item and
its response alternatives measures the phenomenon they are supposed to measure” (p.
261). In other words it is the ability or extent to which selected variables in any study
measure the constructs that are intended to be measured. For example my study desires to
find out if family income has any relationship with obesity. The ability to measure that
was a reflection of the validity of the study. Creswell (2009) commented that qualitative
validity implies that a researcher checks and takes careful note of the accuracy of the
findings by employing the needed procedures.

62
Internal validity relates the ability or extent to which a researcher is able to obtain
clear, causal conclusions from his or her study (Crosby et al., 2006). According to Crosby
et al. (2006), a basic requirement of internal validity is its consistency in implementing
the study protocols involved in the study, such as the sampling procedures that will be
used, assignment of participants, and where and when the assessments will occur. Crosby
et al. noted that there are seven common threats to validity, which are: history,
maturation, testing, instrumentation, statistical regression, selection bias, and mortality
(p. 89).
The appropriate measures needed to combat threats to internal validity included
the use of triangulation (Creswell, 2009). The way I achieved that for my study was to
triangulate the different data sources of information I collected and examined the
evidence from them to create a coherent justification of the underlying themes. Another
strategy to establish credibility or internal validity was to conduct a member checking; to
determine the accuracy of what I gathered by going back to the participants and ensuring
that what I recorded and what they meant agreed. Another strategy I used to ensure
credibility of my study was to clarify any bias that could be brought to the study
(Creswell, 2009). It was imperative that I commented on how the interpretation of my
findings was based on my gender, race, history, culture, or my socioeconomic
background (Creswell, 2009).
Another strategy used to establish credibility (internal validity) was the use of
peer review and external auditor (Creswell, 2009). Because an external auditor was not
involved or familiar with my study, he provided objective view of my project and
63
assessment. The need to have such a person review how accurate the transcriptions are
made, the framing of questions, and the analysis of data went a long way to provide
credibility to my study. In addition, having prolonged and appropriate contact with
participants in the form of prolonged time in the field for interviewing created an
environment of in-depth understanding about the phenomenon within which the study
was built, and this enhanced knowledge about the participants and thereby enhanced
credibility.
External validity refers to the extent in which a researcher is able to generalize the
findings of a study to the population of individuals who exhibit similar characteristics
that are represented in the research sample (Crosby et al., 2006). One of the most
important and critical determinants of external validity is the sampling procedure used
(Crosby et al., 2006). Transferability can be established in this study by a careful
selection of participants. Therefore my choice of 30 participants for this qualitative study
was based on obtaining a range of responses that will enable me answer the research
questions for the study and thereby find a correlation or relationship that exists between
family income and obesity among the African Americans in Durham, NC.
Whereas validity checks for the accuracy of a research findings, reliability
functions to show that the researcher is consistent with having the same answer, or the
responses are consistent across the constructs whenever the measure is used (Creswell,
2009; Crosby et al., 2006). To ensure reliability in my study, I implemented a consistent
approach in gathering or collecting my data for analysis. My goal in this study was to
have measures that are valid and also reliable.

64
Ethical Procedures
Protecting the participants in this study was paramount in order to prevent the
identity and harm to them. Crosby et al. (2006) noted that ethical conduct ought to be
intrinsic to any health promotion research. It therefore incumbent upon me to conduct this
study in a manner that would not jeopardize the identity, integrity, and privacy of the
participants involved. The core ethical principles involved in research; respect for
persons, beneficence, and justice (Crosby et al., 2006) were applied to this study.
Although this study was not funded by federal funds, federal regulations, 45 CFR 46,
which incorporates special protection for vulnerable populations was applied and adhered
to.
The participants for this study, who were required to be 18 years and above, were
informed that they were not under any obligation to start or continue with the study, but
were free to decline or exit at any time. There was no harm suffered by any participant.
The participants had been informed earlier via consent form that should there be any of
such nature, they would be referred to the nearest local service for counseling and
provided with any form of assistance.
Access to Participants
Approved IRB documents from Walden University were made known to the
participants, who I asked to complete a consent form that was protected. A copy of IRB’s
approval letter has been provided as Appendix C. Research responses such as files,
audiotapes, transcripts, and any pertinent patient records used were coded so that data is
de-identified. This ensured privacy of participants. I transcribed the individual interview

65
responses and coded them. These coded responses were known only to me as the
investigator. This was kept under lock file. Information that clearly identified participants
were removed from the transcripts before the validation was completed. Copies of
consent form and confidentiality statement are included in Appendix C.
Treatment of Participants
The following procedures were followed to inform participants prior to collection,
analyzing, and validation of data:
Residents in the target population were contacted and briefed about the study and
sought their permission to include them in my study.
Letters were given to participants to request their inclusion in the study (Appendix
A).
I scheduled meeting with interested participants and provided them with
information on IRB approval and letter indicating the nature of the study.
During the first meeting, participants were enlightened on the nature of study, and
asked to sign consent form if they were willing. This first meeting also involved
participants’ answering some questions- background and ended with a scheduling
of the formal interview session.
Documentation of responses (field notes) and transcription of audiotapes were
done verbatim as noted by participants.
A second meeting was scheduled and this was used to review all responses
documented and provided by participants and to ensure validation of participants’
agreement to what they responded to (their experiences).

66
Participants who agreed to complete the study were given a $5 gift card at the end
of the review of all responses for accuracy.
Justification for Incentives
As a reward to participants who completed this study, they were given an
incentive of a $5 gift card for enduring interview/meetings as scheduled. It is believed
that this amount is not too much as to be coercive to induce the participant into the
project (Creswell, 2009). This was not an alternative for paying them for their responses,
but a form of appreciation for their time and willingness to partake of a study that would
eventually provide a social change for them and generations of offspring to come.
Summary
Chapter 3 of this proposal explored the strategies and steps that were used to
develop and write the qualitative procedure for obtaining data for analysis. The chapter
also discussed essential elements of the study which included: introduction of the chapter,
the research design, role of the researcher, research questions, and methodology. Chapter
3 also discussed participants’ logic, procedure for recruitment and participation, informed
consent, instrumentation, how participants exited the study, data analysis plan, threats to
validity, ethical procedures, access to the participants, treatment of participants, and
justification for use of incentives.

67
Chapter 4: Results
Introduction
The income earned by individuals and families could have a direct or indirect
effect on their health. One of the areas of health under consideration is that of how
income plays a role in contributing to obesity among African Americans. In recent years,
an increase in minimum wage has been a topic of debate as well as a quest to advance
such a national plea. This chapter garners all the responses I received from interviews
conducted with the study’s 30 participants. NVivo 10 software was used to organize their
responses into themes that were coded for analysis. The interview guide questions
(Appendix B) were carefully posed to glean the responses that helped answer the research
questions of this study.
As stated in Chapters 1and 3, the research questions that guided this study were:
Research Question 1: What are the key factors that contribute to low family
income among African Americans in Durham, NC?
Research Question 2: How do these key factors contribute to obesity among
African Americans in Durham, NC?
The purpose of these questions were to find out the determining factors that played a key
role in determining why African Americans earn a low family income and how these
factors interact to contribute to obesity among them.
Recruitment
After receiving approval from Walden IRB, I proceeded to recruit my
participants. Ten participants were chosen and interviewed from each of the three zip
68
codes denoting different income levels for a total of 30 participants. Only those who met
the criteria of being 18 years and above and also either gainfully employed or receiving
some form of income from the federal government were included in the study. All
participants were given the opportunity to select a location that was suitable for
interviews to be conducted. Some of them opted to be interviewed in their living room
and others were comfortable with private spaces in front of their homes. In all of the
settings for the interviews, I ensured that their privacy was not violated and that they
were comfortable in such locations to provide responses to the best of their knowledge.
I approached the participants with a door-to-door approach, whereby I knocked on
doors of potential participants and requested their permission and approval to recruit
them for my study. I approached other participants in the public spaces of their apartment
buildings or subdivisions. After introducing myself and purpose of my study, I gave all
participants a copy of my “Letter to Participants” (Appendix A) for them to review and
express their willingness or otherwise not participate in the study. Some of them agreed
to participate after reading the sample letter and then I gave them the “Informed Consent
Form” (Appendix C) for them to sign after which I began the interview. Others needed
time to read over the sample letter and gave me a specific day and time to come back for
their consent and interviews. All these were consonant with my proposal prior to IRB
approval. The demographic information of all participants was coded using NVivo 10
software.

69
Participant Profile
The participants consisted of 17 females and 13 males. I had a few potential
participants who declined to participate because they thought their information would be
made public. In the end, I had 30 participants who were willing and agreed to be
interviewed. I assured them that their responses will be kept confidential and their
identity would not be known because of their responses. With that assurance they agreed
to participate. Below is a profile summary and a short biography of each of the
participants:
Participant Number 1 is a 36-year-old female, who is single, has a household
income of $70,000-100,000, lives in the 27703 zip code, and has a master’s
degree as the highest education obtained.
Participant Number 2 is a 28-year-old female, who is single, has a household
income of $120,000, lives in the 27713 zip code, and is currently in medical
school as the highest education obtained.
Participant Number 3 is a 56-year-old male, who is married, has a household
income of $40,000-50,000, lives in the 27713 zip code, and has a bachelor’s
degree as the highest education obtained.
Participant Number 4 is a 32-year-old female, who is married, has a household
income of $80,000 lives in the 27713 zip code, and has a bachelor’s degree as the
highest education obtained.
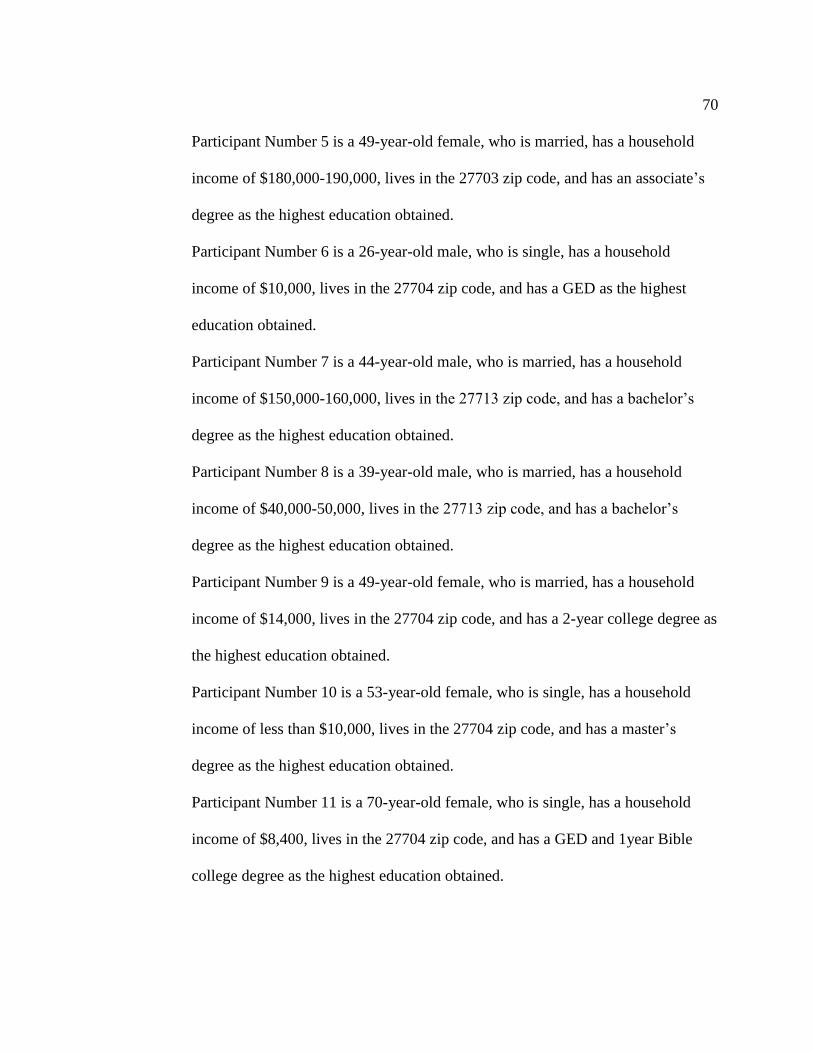
70
Participant Number 5 is a 49-year-old female, who is married, has a household
income of $180,000-190,000, lives in the 27703 zip code, and has an associate’s
degree as the highest education obtained.
Participant Number 6 is a 26-year-old male, who is single, has a household
income of $10,000, lives in the 27704 zip code, and has a GED as the highest
education obtained.
Participant Number 7 is a 44-year-old male, who is married, has a household
income of $150,000-160,000, lives in the 27713 zip code, and has a bachelor’s
degree as the highest education obtained.
Participant Number 8 is a 39-year-old male, who is married, has a household
income of $40,000-50,000, lives in the 27713 zip code, and has a bachelor’s
degree as the highest education obtained.
Participant Number 9 is a 49-year-old female, who is married, has a household
income of $14,000, lives in the 27704 zip code, and has a 2-year college degree as
the highest education obtained.
Participant Number 10 is a 53-year-old female, who is single, has a household
income of less than $10,000, lives in the 27704 zip code, and has a master’s
degree as the highest education obtained.
Participant Number 11 is a 70-year-old female, who is single, has a household
income of $8,400, lives in the 27704 zip code, and has a GED and 1year Bible
college degree as the highest education obtained.

71
Participant Number 12 is a 35-year-old female, who is married, has a household
income of more than $50,000, lives in the 27713 zip code, and has a pharmacy
doctorate’s degree as the highest education obtained.
Participant Number 13 is a 48-year-old female, who is single, has a household
income of $9,600, lives at the 27704 zip code, and has a GED as highest
education obtained.
Participant Number 14 is a 35-year-old female, who is single, has a household
income of less than $10,000, lives in the 27704 zip code, and 11th grade of high
school was the highest education obtained.
Participant Number 15 is a 32-year-old female, who is married, has a household
income of $10,000, lives in the 27704 zip code, and ninth grade was the highest
education obtained.
Participant Number 16 is a 50-year-old female, who is married, has a household
income of $20,000, lives in the 27704 zip code, and 12th grade was the highest
education obtained.
Participant Number 17 is a 23-year-old male, who is currently engaged, has a
household income of $170,000, lives in the 27703 zip code, and has a bachelor’s
degree as the highest education obtained.
Participant Number 18 is a 27-year-old female, who is single, has a household
income of $90,000, lives in the 27713 zip code, and has a college degree as the
highest education obtained.

72
Participant Number 19 is a 66-year-old male, who is married, has a household
income of $90,000-100,000, lives in the 27703 zip code, and has a master’s
degree as the highest education obtained.
Participant Number 20 is a 31-year-old female, who is married, has a household
income of $30,000-40,000, lives in the 27704 zip code, and has college degree
and certificate in broadcasting as the highest education obtained.
Participant Number 21 is a 37-year-old male, who is engaged, has a household
income of $10,000-20,000, lives in the 27704 zip code, and has a high
school/GED diploma as the highest education obtained.
Participant Number 22 is a 35-year-old female, who is married, has a household
income of $50,000-60,000, lives in the 27703 zip code, and has a nursing
bachelor’s degree as the highest education obtained.
Participant Number 23 is a 36-year-old male, who is married, has a household
income of $110,000, lives in the 27703 zip code, and has a bachelor’s degree in
biology as the highest education obtained.
Participant Number 24 is a 41-year-old male, who is married, has a household
income of $120,000-150,000, lives in the 27703 zip code, and has a bachelor’s
degree as the highest education obtained.
Participant Number 25 is a 26-year-old male, who is single, has a household
income of more than $30,000, lives in the 27703 zip code, and has a bachelor’s
degree as the highest education obtained.

73
Participant Number 26 is a 49-year-old male, who is married, has a household
income of more than $60,000, lives in the 27713 zip code, and has a bachelor’s
and associate degrees as the highest education obtained.
Participant Number 27 is a 50-year-old male, who is married, has a household
income of more than $50,000, lives in the 27703 zip code, and has a bachelor’s
degree and other professional courses in nursing as the highest education
obtained.
Participant Number 28 is a 26-year-old male, who is single (cohabitation), has a
household income of $30,000-50,000, lives in the 27713 zip code, and has a
master’s degree as the highest education obtained.
Participant Number 29 is a 46-year-old female, who is single, has a household
income of $30,000-40,000, lives in the 27713 zip code, and has a bachelor’s
degree as the highest education obtained.
Participant Number 30 is a 43-year-old female, who is married, has a household
income of $170,000-180,000, lives in the 27703 zip code, and has two bachelor’s
degrees as the highest education obtained.
Data Collection
My goal for data collection was to interview 30 participants. A few potential
participants declined to participate for fear of having their identity revealed. Most of them
preferred to be interviewed in their home. A few preferred the process taking place in
front of their houses. I interviewed each of the participants with 31 open-ended questions
(Appendix B), which I designed to serve as an interview guide. These questions were
74
designed to help answer the research questions of this study. The questions were also
formulated to glean the lived experiences of the participants. The questions also helped to
obtain core themes, which were coded into nodes for analysis.
I interviewed my first participant on March 12, 2015, and the last one was
interviewed on April 23, 2015. The guiding questions for the interview were quite short
and did not require elaborate or lengthy responses. Coupled with some participants not
being comfortable with recording the process, I interviewed most of them by writing their
responses verbatim and asking for repeated responses when part of their responses were
not captured. For those who did not mind the use of recorders, I recorded their responses
as well as noting down whatever they said. I noted the date on which each participant was
interviewed. Interview time for each participant was between 30 minutes and 1 hour.
Apart from the verbal responses given by participants, I also observed their facial
expression as well as body language. Each participant was assigned a number to conceal
their actual identity. I went over the answers of each participant and used member
checking process to validate their responses. During the validation of their responses,
each was then given $5 gift card for their time. All transcripts and tools used for
interviews were stored and locked in a safe in my home office.
Data Analysis
My data analysis began with the initial task of transcribing all the audio
recordings and typing all responses from participants into organized data in Microsoft
Word. I read through the data carefully, paying attention to responses that had the health
belief model as the background. Using the NVivo 10 software, I coded the responses into

75
nodes and then did a classification of all the nodes. Interview responses from all 30
participants were imported into the software for analysis. The coding process led to
formulation of 15 themes that would enable me answer the research questions of this
study. I applied Moustakas’s (1994) method of phenomenological approach, which
makes use of significant responses, statements, generating meanings, and what
Moustakas refers to as, essence description (as noted by Creswell, 2009). Using
Creswell’s (2009) approach of data transcription, I transcribed the raw materials (audio
and field notes), organized and prepared the data for analysis, read through all data,
coded the data into themes, compiled interrelated the themes, and interpreted the
meanings of the themes and descriptions. The themes were made of responses from the
guiding questions that had direct relation to answering the two research questions that
govern this research. The NVivo 10 software enabled me do all these in addition to
grouping responses that were similar or different. The details of interviews with the 30
participants were all noted verbatim for thematic analysis.
Evidence of Trustworthiness
Validity is one of the major strengths of qualitative research (Creswell, 2009).
According to Creswell (2009), validity hinges on finding out whether the findings from a
study are accurate from the viewpoint of the researcher, participant, or the readers. This
leads to trustworthiness or credibility of a research. To ensure credibility of this study, I
incorporated validity strategies. Some of the strategies were to ensure the participants
provided accurate responses as best as they could. After the transcription of the
interviews, I reviewed the responses with the participants to ensure I captured exactly

76
what they meant. I used member checking to verify the accuracy of my findings. Another
strategy I used to ensure credibility of my study was to clarify any bias that could be
brought to the study. Because this study is subject to internal and external threats, the
study cannot be generalized outside the three zip codes covered. However, due to the
characteristics noted from the findings, the study could be extrapolated to similar target
populations and expect similar results to be obtained.
Transferability was established in this study by a careful selection of participants.
My choice of 30 participants for this qualitative study was based on obtaining a range of
responses that will enable me to address the research questions for the study and thereby
find a correlation or relationship that exists between family income and obesity among
the African Americans in Durham, NC. The sample size chosen was not too small to
incur bias, neither was it too large to produce any overwhelming effect. The study could
be extended to a larger population by future researchers.
Dependability is a measure of how stable or consistent a study’s inquiry processes
can be (Crosby et al., 2006). To ensure dependability, I made sure I did not do anything
careless or make any mistake while conceptualizing my study, collecting data,
interpreting the findings, and reporting the results. The logic of recruiting and
interviewing participants were clearly presented and consistent among the participants.
The confirmability of my study was made possible by having a sample size that
supported the findings. By having an external auditor to review the findings and
interpretation of the results, an adequate audit trail was maintained and confirmability

77
ensured. The results obtained support confirmability and consistent with finding of some
previous research.
Demographic Information
Table 1 represents selected demographic information of the participants. This
depicts their ages, gender, height, and weight. These parameters were included because
they have a direct bearing on the imputation of BMI, which is an essential figure for the
expression of obesity as related to this study. The youngest age (years) was 26,
characterized by Participants 6 and 28. The oldest participant was 70 (Participant 11).
There were 17 females and 13 males who volunteered for this study. The females
outnumbered the males because most females were open to respond to interviews than
were most men. The heights of the participants ranged from 60 inches (5 ft.) to 74 inches
(6 ft. 2 in). These were Participants 1 and 17 respectively. The weights also ranged from
119 pounds (Participant 1) through 332 pounds (Participant 13). The measurements were
all self-reported by participants. It was not the intent of this study to measure the
participants of their height, weight, or other parameters, but for them to provide as part of
their lived experiences and as much honest as possible. The participants therefore
provided responses as best as they could recall. Only a few participants had to pause and
remember the figures that appeared on their scale as they weighed themselves or when
they visited their provider. When it came to sensitive questions, such as asking about age
and the income families earned, I observed by facial expressions that a few were
skeptical to give their exact ages. On the whole most participants provided responses to
the best of their abilities. Some of the strategies I used were to keep the interviewing
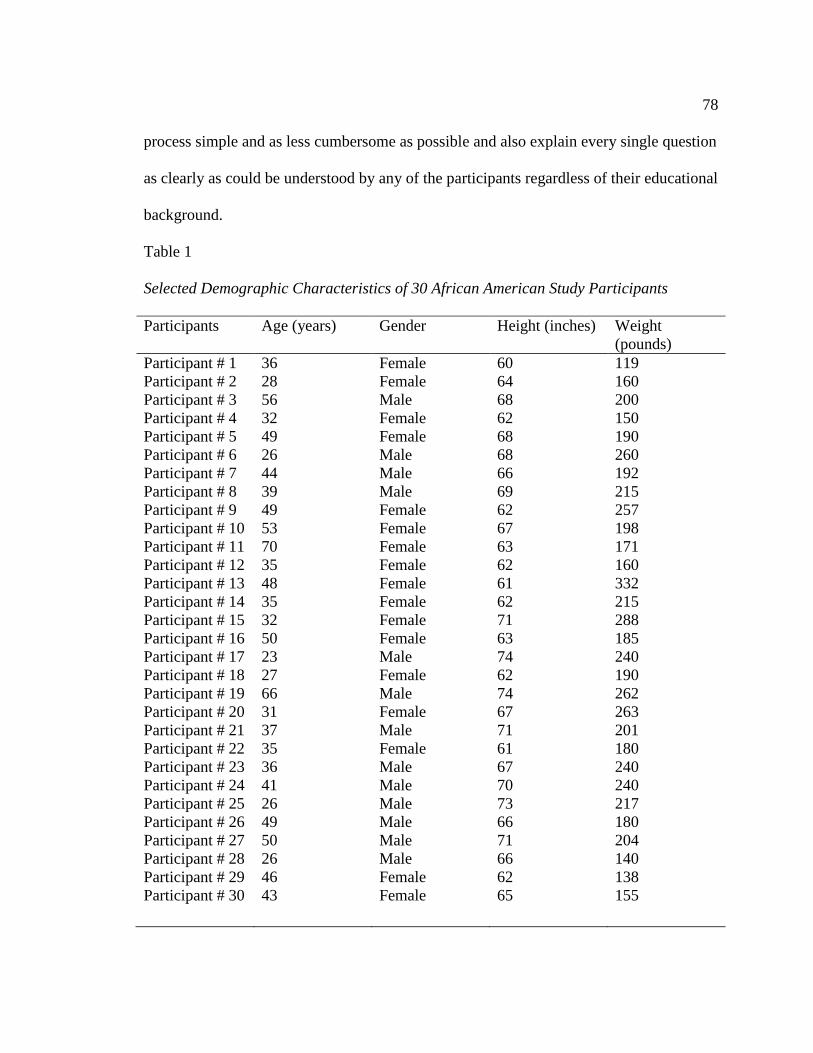
78
process simple and as less cumbersome as possible and also explain every single question
as clearly as could be understood by any of the participants regardless of their educational
background.
Table 1
Selected Demographic Characteristics of 30 African American Study Participants
Participants Age (years)
Gender Height (inches) Weight
(pounds)
Participant # 1 36 Female 60 119
Participant # 2 28 Female 64 160
Participant # 3 56 Male 68 200
Participant # 4
Participant # 5
Participant # 6
Participant # 7
Participant # 8
Participant # 9
Participant # 10
Participant # 11
Participant # 12
Participant # 13
Participant # 14
Participant # 15
Participant # 16
Participant # 17
Participant # 18
Participant # 19
Participant # 20
Participant # 21
Participant # 22
Participant # 23
Participant # 24
Participant # 25
Participant # 26
Participant # 27
Participant # 28
Participant # 29
Participant # 30
32
49
26
44
39
49
53
70
35
48
35
32
50
23
27
66
31
37
35
36
41
26
49
50
26
46
43
Female
Female
Male
Male
Male
Female
Female
Female
Female
Female
Female
Female
Female
Male
Female
Male
Female
Male
Female
Male
Male
Male
Male
Male
Male
Female
Female
62
68
68
66
69
62
67
63
62
61
62
71
63
74
62
74
67
71
61
67
70
73
66
71
66
62
65
150
190
260
192
215
257
198
171
160
332
215
288
185
240
190
262
263
201
180
240
240
217
180
204
140
138
155

79
Table 2 is a summary of other selected demographic data on the 30 participants
interviewed.
Table 2
Selected Demographic Features of 30 African American Study Participants
Participants BMI
Zip code Marital status Income ($)
Participant # 1 23 27703 Single 70,000-80,000
Participant # 2 28 27713 Single 120,000
Participant # 3 30 27713 Married 40,000-50,000
Participant # 4
Participant # 5
Participant # 6
Participant # 7
Participant # 8
Participant # 9
Participant # 10
Participant # 11
Participant # 12
Participant # 13
Participant # 14
Participant # 15
Participant # 16
Participant # 17
Participant # 18
Participant # 19
Participant # 20
Participant # 21
Participant # 22
Participant # 23
Participant # 24
Participant # 25
Participant # 26
Participant # 27
Participant # 28
Participant # 29
Participant # 30
27
29
40
31
32
47
31
30
29
63
39
40
33
31
35
34
41
28
34
38
34
29
29
28
23
25
26
27713
27703
27704
27713
27713
27704
27704
27704
27713
27704
27704
27704
27704
27703
27713
27703
27704
27704
27703
27703
27703
27703
27713
27703
27713
27713
27703
Married
Married
Single
Married
Married
Single
Single
Single
Married
Single
Single
Single
Married
Engaged
Single
Married
Married
Engaged
Married
Married
Married
Single
Married
Married
Single
Single
Married
80,000
180,000-190,000
10,000
150,000-160,000
40,000-50,000
14,000
<10,000
<10,000
50,000-60,000
<10,000
<10,000
10,000
20,000
170,000
90,000
90,000-100,000
30,000-40,000
10,000-20,000
50,000-60,000
110,000
120,000-150,000
30,000-40,000
60,000-70,000
50,000-60,000
30,000-40,000
30,000-40,000
170,000-180,000

80
The parameters indicated on Table 2 are BMI, zip code of where participants reside, their
marital status, and the income each family makes annually. BMI is a measure of an
individual’s body fat and is based on height and weight (U.S. Department of Human
Services, 2015). The BMI was computed using a calculation that used the participants’
height and weight. The formula for computing BMI in adults (recommended by CDC,
2013) is: weight (lb) / [height (in)] 2 x 703. For example, for a person who weighs 170
pounds and is 65 inches tall, the formula is [170 ÷ (65)2] x 703 = 28.2863. This is then
rounded to a whole number as a BMI of 28. Using the computation formula described
above, the BMI for Participant 1 was 23 (the lowest) and that of participant 13 was 63
(the highest). Table 2 also depicts the zip code of the participants interviewed. There
were three zip codes from which the participants were recruited and interviewed from.
These are: 27703, 27704, and 27713. Each of these zip codes is postulated to house
participants categorized or estimated to have varying income earned annually. Ten
participants were interviewed from each of the zip codes. Table 2 also shows the marital
status of the participants. They were married, single, or engaged to be married soon. The
marital status was important to this study because income levels were different among
singles and that of those who were engaged or married. Income levels of these
participants were also included in Table 2. A few of them knew precisely how much
income ($) their family made (example is Participant 2), while others gave a range of
income, such as between $30,000 and 40,000. Example is Participant numbers 20, 25, 28,
and 29.

81
Table 3 provides data on the participants and their BMI results that indicate whether each
of them falls within the definition of overweight, obesity, or normal.
Table 3
Participants BMI, Overweight, and Obesity status
Participants BMI
Overweight Obese Normal
Participant # 1 23 No No Yes
Participant # 2 28 Yes No No
Participant # 3 30 Yes Yes No
Participant # 4
Participant # 5
Participant # 6
Participant # 7
Participant # 8
Participant # 9
Participant # 10
Participant # 11
Participant # 12
Participant # 13
Participant # 14
Participant # 15
Participant # 16
Participant # 17
Participant # 18
Participant # 19
Participant # 20
Participant # 21
Participant # 22
Participant # 23
Participant # 24
Participant # 25
Participant # 26
Participant # 27
Participant # 28
Participant # 29
Participant # 30
27
29
40
31
32
47
31
30
29
63
39
40
33
31
35
34
41
28
34
38
34
29
29
28
23
25
26
Yes
Yes
Yes
Yes
Yes
Yes
Yes
Yes
Yes
Yes
Yes
Yes
Yes
Yes
Yes
Yes
Yes
Yes
Yes
Yes
Yes
Yes
Yes
Yes
No
Yes
Yes
No
No
Yes
Yes
Yes
Yes
Yes
Yes
No
Yes
Yes
Yes
Yes
Yes
Yes
Yes
Yes
No
Yes
Yes
Yes
No
No
No
No
No
No
No
No
No
No
No
No
No
No
No
No
No
No
No
No
No
No
No
No
No
No
No
No
No
No
Yes
No
No

82
Remington, Brownson, and Wegner (2010) have classified obesity into three classes:
Class 1- BMI 30.0- 34.9; Class 2- BMI 35.0-39.9; and Class 3 (referred to as extreme
obesity) - BMI greater than or equal to 40 (p. 269). From Table 3, only two participants
(6.7%) can be categorized as normal by BMI standards (Participants 1 and 28). The rest
are all either overweight or obese. Twenty eight of the 30 participants (93.3%) were
within the overweight status. Eighteen of the 30 participants (60%) were noted to be
obese. This is more than half of the total participants interviewed. With reference to BMI
values and obesity, it can be observed from Table 3 that Participants 3, 6 through 11, 13
through 20, and 22 through 24 were all in the obesity bracket.
Results of Themes Identified
The purpose of this study was to find out relationship between family income and
obesity. The research questions sought to answer the factors that lead to low family
income and how these key factors contribute to obesity among African Americans. There
were 15 major themes that stood out after conducting the interviews and analyzed by
NVivo 10 software. I categorized these themes into two groups to answer the two
research questions. The first group sought to respond to or provide answers to the key
factors that contribute to earning low family income among African Americans. The
thematic categories 1 through 4 gleaned from the participants were notable for answering
Research Question 1 of this study. The rest of the themes play significant role in
answering Research Question 2 of this research. This second group relates to how these
key factors contribute to obesity among the target group. The themes are represented in
the following results /findings.

83
Thematic Category 1: Reasons for not earning enough income
Table 2 shows the family income earned by each of the participants interviewed.
The range of income is from less than $10,000 to $190,000 per year. The lowest income
earned in the group shows an amount of less than $10,000 a year. This is characterized by
Participants 10, 11, 13, and 14.
The first thematic category was to find the reasons for participants not earning
enough family income. Participant 1 mentioned that she makes quite an okay income,
thus was not applicable to her. Participant 2 stated that, “Well, I need to graduate and
then I can make more.” Participant 3 stated that the reason why he was not making
enough money was because “Time is the issue. Not enough time.” Participant 4 and 5
answered that it did not pertain to them. Participant 6 responded that, “I am not working
now. I am looking for a job. It is hard getting a job. I could make more money with better
education.” Participant 7 noted that, “I do not have enough time to work more or make
more money.” Participant 8 remarked that, “Because employers do not want to pay more.
I need advancement in life.” Participant 9 also mentioned that, “I am partly disabled, but I
am a Certified Nurse Assistant (CNA).” Participant 10 noted that, “I lost my job. I am
now taking care of kids. Although I have a master’s degree, I don’t have a job now. I am
looking for a job.” Other reasons given by participants not making enough money
included being retired and not finding a job; asking for a pay cut to reduce working
hours; being disabled, health reasons and as such could not work enough hours.
Participant 15 mentioned that she did not have a high school diploma and that limited
how much she could earn by way of income. Participant 16 and 17 noted that they are yet
84
to graduate from college. Participant 21 mentioned that, “I don’t have any training or
education. I don’t have the right diploma.” Participant 26 mentioned that, “My income is
driven by the market forces. I work in the clientele business. The higher the demand of
my services, the more income I make. I need some certification in logistics.”
Thematic Category 2: Highest grade of education attained
The second thematic category I focused on was to find out how participants’ level
of education contributed to their earning of low family income. Participant 1 has a
masters’ degree and gainfully employed by the federal government. She believes her
level of education has landed her a good job. Participant 2 is in medical school and hopes
to get a good paying job after graduation. Participant 3 said, “I have a bachelor’s in
Nursing.” She is using her nursing degree to work as a nurse. Participant 4 has a
bachelor’s degree and Participant 5 mentioned that, “Associate degree for myself. My
husband is an attorney.” This family made the highest income among those interviewed.
Participant 6 had a GED. Participants 7 and 8 had bachelor’s degrees. Participant 9 had a
2-year college degree. Participant 10 has a master’s degree while participant 11 has a
grade 12 and 1 year bible college. Participant 13 has a doctorate degree and participant 14
only finished grade 11. Participants 15 and 16 finished grades 9 and 12 respectively.
Participant 17 mentioned that, “I have a bachelor’s degree (3 and half years).”
Participants 18 and 19 have college degree and master’s degree respectively. Participant
20 mentioned having some college and a certificate in broadcasting. Participant 21 has a
high school diploma while participant 22 has a college degree in nursing. Participant 23
has a bachelor’s degree in biology and participant 24 said he has a college degree and his

85
wife has a master’s degree. Participant 25 has a college degree while participant 26 has
bachelor’s degree and an associate degree. Participant 27 said that, “I am a graduate with
a bachelor’s degree and some professional courses in nursing.” Participant 28 also
mentioned that, “I will graduate with a master’s degree next week.” Participant 29 noted
that, “I have a bachelor’s in nursing” and participant 30 mentioned that she has 2
bachelor’s degrees.
Thematic Category 3: Satisfaction about income earned by family
The third category of themes focused on whether the participants were satisfied
with the income they earn yearly or if there were any barriers that prevented them from
making more money. This category sought to find out if participants were happy with the
income they earn or if they desire to make more. Responding to this thematic category on
the barriers for making more money, the following comments were noted. Ten of 30
participants (33.3%) responded that they were okay with the income their family makes a
year. These were Participants 1, 2, 3, 4, 5, 19, 24, 25, 29, and 30. Although Participants 1,
3, and 25 mentioned that they were happy with how much they earned, they did also state
that they would want to make more money. The rest of the participants responded that
they were not happy with how much their family earned a year. For example, Participant
23 indicated that he was not satisfied with how much he makes and the barrier is that, “…
my income is driven by the market forces.” Participant 27 also mentioned that, “No. I
want to go to the next level. I am not satisfied by what I make now.”
Thematic Category 4: Current enrollment in any academic program
The fourth thematic category was based on whether the participants were in any

86
academic program that will ultimately give them better opportunities for earning more
income sooner or later. The academic program under consideration is whether
participants are undergoing any vocational training or any academic curricula that has the
potential of increasing income for the participants’ family upon graduation. In responding
to whether they were enrolled in any type of academic program, 19 participants (63.3%)
said “No” indicating that they were not enrolled in any academic or vocational programs.
These were Participants 1, 3, 4, 5, 6, 7, 8, 11, 12, 13, 18, 19, 20, 21, 23, 24, 26, 29, and
30. Eleven of the participants (36.7%) said “yes” implying they were enrolled in some
academic program. This is characterized by Participants 2, 9, 10, 14, 15, 16, 17, 22, 25,
27, and 28. The comments and responses made by participants enrolled in some academic
program were:
“Yes. I am taking nursing class at Duke University.”
“Yes. I am taking nursing classes.”
“I am currently pursuing my GED. It is in progress.”
“Yes I am taking some CNA courses on line.”
“Yes I am in medical school now.”
“I am currently in medical school.”
“Yes. I am ready to graduate Medical Surgical School.”
“Yes, I am a full time student.”
“I am now in school, taking nursing– related courses.”
“Yes finishing my master’s.”
“I am currently taking a health care class.”

87
Thematic Category 5: Popular foods consumed at home.
Thematic Category 5 as depicted in Table 4 focused on asking the participants
about the popular foods they consumed on regular basis. All the participants have various
food they mentioned as being the most popular they consume at home. They range from
flavored water to fried potatoes. Participant 1 mentioned that most of the food she
consumes is “salad, chicken, salmon, baked fish, potatoes, rice, banana and cereal.”
Participant 2 indicated that her family consumes chicken, rice, sandwiches, and salad.
Participant 3 responded that “rice, pounded yam, beans, fried potatoes, fish, beef,
chicken, and bread” was the popular food that his family ate quite often. Participant 4
noted that most of the food they ate was chicken, pizza, and pasta. Participant 5 said the
type of foods her family enjoyed was “African food, meat, fish, rice, carrots, apple okra,
and spinach.” Participant 6 had this to say: “fruits, vegetables, and organic chicken” is
what his family eats most often. Participant 7 noted that, “fruits, vegetables, and organic
chicken.” Participant 8 and 9 said “home cooked meal, fish, and spinach, yam, and pasta”
and “chicken, meat, starch, and vegetables respectively.” Participant 10 indicated that
“fruits, chicken, fish, pasta, rice, and potatoes” was their main foods. Participant 11
responded that the food often eaten in her household is mainly “chicken, hot dogs,
hamburger, cake, green vegetables, and milk.” Participant 12 responded that rice, beans,
pasta, veggies, and eggs while Participant 13 said her family enjoys stake, crab legs,
chicken, broccoli, collards and green beans.

88
Table 4
Types of popular food eaten by participants
Participants Types of popular food eaten by family
Participant # 1 Salad, chicken, salmon, baked fish, potatoes, rice, banana , and
cereal
Participant # 2 Chicken, rice, sandwiches, and salad.
Participant # 3
Rice, pounded yam, beans, fried potatoes, fish, beef, chicken,
and bread.
Participant # 4
Participant # 5
Participant # 6
Participant # 7
Participant # 8
Participant # 9
Participant # 10
Participant # 11
Participant # 12
Participant # 13
Participant # 14
Participant # 15
Participant # 16
Participant # 17
Participant # 18
Participant # 19
Participant # 20
Participant # 21
Participant # 22
Participant # 23
Participant # 24
Participant # 25
Participant # 26
Participant # 27
Participant # 28
Participant # 29
Participant # 30
Chicken, pizza, and pasta.
African food, meat, fish, rice, carrots, apple okra, and spinach.
Fruits, vegetables, and organic chicken.
We eat rice, fish, vegetables, and chicken.
Home cooked meal, fish, spinach, yam, and pasta.
Chicken, meat, starch, and vegetables.
Fruits, chicken, fish, pasta, rice, and potatoes.
Chicken, hot dogs, hamburger, cake, green vegetables, and milk.
Rice, beans, pasta, veggies, and eggs.
Stake, crab legs, chicken, broccoli, collards and green beans.
Fried chicken, macaroni, gravy, and broccoli.
I am on diet now. We eat junk and unhealthy food and some
baked fish.
Chicken, fries.
Mostly organic food and rarely any meat.
Pasta, fish, juice.
Rice, plantain, beans, and vegetables.
Fries, potatoes, chicken, fish, pork, beef, and vegetables.
Fried food, (a lot), chicken, pork chops, fish, spaghetti and
Hamburger.
Pizza, rice, chicken, and Jamaican food.
Fish, chicken, whole wheat, water, fruit, and juice.
Chicken, cereal, oatmeal, salad.
Vegetables, water, flavor in water.
Vegetables.
Mostly African foods, for example rice, yams, and fufu. We eat
American foods if we can’t get any African food.
Junk food, chicken, and chocolate cake.
Cashew nuts, chicken breast. I don’t eat that much. Sometimes
all I eat is cashew and go to sleep.
Rice, stew, chicken, fish, oatmeal, and cereal.

89
Participant 14 mentioned that the majority of food eaten in her household is fried
chicken, macaroni, gravy, and broccoli. Participant 15 indicated that “I am on diet now.
We eat junk and unhealthy food and some baked fish.” The responses from other
participants have been recorded in Table 4. Most of the foods reported by participants
have similar trend and few differences. For instance, Participant 25 mentioned
vegetables, water, and flavor in water as the main food often eaten. Participant 26 also
mentioned vegetables as the main food his family enjoys.
Thematic Category 6: Preference of eating in fast food restaurants (FFR) or choosing
to cook at home
The sixth thematic category that I focused on was to find out if the participants
preferred eating at fast food restaurants or chose to cook meals at home. Of the 30
participants interviewed, only 1(3.3%) indicated that she prefers eating at the FFR
because she hates to clean after cooking (Participant 18). The rest of the participants
(96.7%) responded that they prefer cooking at home than eating at FFR joints.
Participants 2, 9, and 28 noted that although they preferred cooking at home, they often
patronized FFR (responses are recorded as shown in Table 4). Some of the responses
given by the participants were:
Participant 1: “I prefer cooking.” Participant 2 indicated that, “I prefer cooking. I
am often lazy so might patronize FFR.” Asked if he preferred cooking at home versus
eating at a FFR, Participant 3 also responded that, “No. I prefer cooking.” Participant 26
expressed vehemently that, “I prefer to cook at home. That way you know what goes
inside the food.”
90
Some of the contrasting responses to this question came from Participant 18, who
mentioned that, “I prefer eating outside because I hate cleaning after cooking.”
Participant 28 also noted that, “I prefer eating out in restaurants. My fiancée likes to cook
at home.” Few of the participants preferred both cooking at home and often eating at
FFRs. For instance Participant 2 stated that although she prefers cooking her own meals,
because of laziness, she sometimes visits the FFR. Participant 21 also had this to say: “It
depends. Sometimes we cook and other times we eat out.” Participant 27 also expressed
that, “I like cooking unless when we are unable.”
Thematic Category 7: Living near FFR
The seventh thematic category sought to find out if living near a FFR influenced
how much the participants patronized the food there instead of cooking at home.
Responding to the question of if they lived near a FFR, 5 of 30 participants (16.7%)
answered that they did not live near a FFR. These were participants 18, 23, 25, 27, and
30. The remaining 25 participants (83.3%) indicated that they lived near FFRs.
Participant 1 was very precise and mentioned that she lived 20 minutes from a FFR.
Participant 2 also mentioned that, “Yes, a walking distance.”
Thematic Category 8: Dependence of choice of food on income
The thematic category centered on how the participants shopped and ate particular
types of food based on the income they earn. When participants were asked : “Is your
choice of food and how you shop for food related to the amount of money you earn,” 11
participants (36.7%) responded “No” indicating that how much they earn did not directly

91
affect what foods they shopped for or ate. These were Participants 1, 2, 3, 7, 8, 19, 20, 22
23, 27, and 29. Some of the responses are:
Participant 1 stated, “No. My spending is based on my budget.” Participants 2, 3,
7, 8, 19, 20, 22, and 23 only mentioned “no” without much explanation. Participant 27
noted that:
No. This is because whether I make more money or not, we will still like African
food or the food we love to eat. I do believe that income has effect on lifestyle or
what people buy because those who make less struggle and end up overeating due
to stress. Some work two jobs to make ends meet or meet the cost of living. This
ends in buying and eating junk food and no time to exercise too. I think more
money and more time lead to better lifestyle.
Participant 29 also mentioned that, “No. It does not matter to me. I will eat the same way
regardless.” Contrary to the preceding comments, 19 participants (63.3%) answered
“Yes” indicating that the income they earn has effect on how they shop for food. These
are represented by participants 4, 5, 6, 9, 10, 11, 12, 13, 14, 15, 16, 17, 18, 21, 24, 25, 26,
28, and 30. Some of the responses are:
Participant 6 mentioned that, “Yes, it does because it determines what we can
afford and what we cannot.” Participant 10 indicated that, “Yes. Our income or how
much we get determines what we can afford.” Participant 11 responded in this manner:
“Yes it is. Because we ultimately can afford only what we have. Our budget is fixed.”
Participant 14 responded that, “Yes very much so. I believe how much people make
affect or can contribute to obesity.” Participant 15 also noted that, “Yes it does. The more
92
I can make the better choices I can make.” Participant 16 responded that, “Yes it is very
much related.” Participants 17 and 18 both indicated that, “Yes it does.” Participant 21
responded that, “Yes. The more one makes, the better the lifestyle.” Participant 26
responded that:
Yes. If you make more, you eat better. You are limited by the income you make.
Most affordable things are not healthy. What is healthy is expensive. If I can’t
afford it, I will only eat Burger King. When you have the means, you eat to satisfy
and nourish your body. Many people eat quantity and not quality.
Participant 28 also had this to say:
Yes it does. We are on a budget, so we can only afford what our income allows. It
is necessary to eat better if you can afford it. Sometimes I go to the groceries and
there is something I wish to buy, but I ask myself if I can afford it. So income
affects what you buy and can play a role in obesity.
Participant 30 concluded with the response on the theme by saying that, “Yes because
you can buy more fruits and vegetables if you make more money.”
Thematic Category 9: Number of servings of salads per day
The 9th category focused on how many servings of salad participants made part
of their daily meals. Thus finding out how much servings of salad my participants
consumed was the next thematic category to be considered. As shown in Table 5, almost
all the participants mentioned that their family made serving of salads part of their daily
meal. The least consumption was once a week as mentioned by Participants 11 and 21.

93
The most consumed by any family among the participants was 7 or 8 a day as indicated
by participant 17. Participant 1 indicated having one serving of salad a day.
Table 5
Number of Servings of Salad per day
Participants Number of servings of salad per week
Participant # 1 1 serving a day.
Participant # 2 2 to 3 times a day
Participant # 3
Participant # 4
Apple, banana, and this is like once in a while.
1 a day.
Participant # 5
Participant # 6
Participant # 7
Participant # 8
Participant # 9
Participant # 10
Participant # 11
Participant # 12
Participant # 13
Participant # 14
Participant # 15
Participant # 16
Participant # 17
Participant # 18
Participant # 19
Participant # 20
Participant # 21
Participant # 22
Participant # 23
Participant # 24
Participant # 25
Participant # 26
Participant # 27
Participant # 28
Participant # 29
Participant # 30
Mostly apples, banana, papaya, baby spring, and organic baby
Lettuce.
2 to 3 a day.
2 to 3 times a day.
I am personally cautious of my health so I eat salad servings
about 3 times a week.
3 times a week.
2 servings a day.
Once a week.
0-1 a day.
Once a day.
Once a day.
Every day, about 2 times a day.
3 times a day.
7 or 8 a day.
Once a day.
2 times a day.
I have a minimum of 1 per day.
Once a week.
Every day. We eat fruits and salad once or twice a day.
3 to 4 a day.
Twice a day.
2 to 3 a day.
3 times a day.
2 to 3 times daily.
0 to 2 times a day.
Once a week.
1 serving a day.

94
Participant 2 indicated 2 to 3 times a day while Participant 3 observed that, “Apple,
banana, and this is like once in a while.” Asked about the details of what each family
eats or consumes on daily basis, Participant 5 also noted that, “Mostly apples, banana,
papaya, baby spring, and organic baby lettuce. Participant 8 related her health to
consumption of fruits and salads and said that, “I am personally cautious of my health so
I eat salad servings about 3 times a week. Other responses made by participants in
reference to the Thematic Category 9 can be found in Table 5.
Thematic Category 10: Feelings of overweight or obese
The 10th category centered on how the participants felt in relation to being
overweight or obese. Quite a number of the participants interviewed were not sure of
their BMI values. A number of them did not have regular medical checkups and so could
not easily mention their BMI results. The goal of Thematic Category 10 was to find out if
the participants felt overweight or obese. Therefore, by expressing their opinions about
how they felt, the participants might have an idea if they needed to do something about
their BMI values.
From the responses to the question as to whether the participants felt overweight
or obese, 12 (40%) responded that they did not feel overweight or obese. These were
Participants 1, 4, 5, 8, 11, 16, 17, 21, 25, 26, 28 and 30. Participant 11 indicated that she
had lost about ten pounds. The other 60% responded that they felt overweight or obese.
For example, Participant 2 responded that she felt a little overweight. Participant 3
indicated that going by the BMI scale, he was overweight. Participant 6 responded, “Yes,
I feel overweight.” Participant 7 stated, “Yes, I do feel overweight.” Participants 9, 10,

95
12, 13, 14, 15, and 18 were all included in participants who indicated that they felt obese.
Participant 12 noted that she was not obese but overweight, and Participant 24 mentioned
that though he felt he was obese, he had more muscles by indicating that, “Yes I do,
though I have more muscles.”
Thematic Category 11: Number of times exercised in a week
The 11th Thematic Category sought to find out the frequency and duration of
physical activity performed by the participants. As shown in Table 6, three participants
(10%); 10, 13, and 28 responded that they did not engage in any physical activity. The
rest (90%) responded that they were involved in some of physical activity. This varies
from performances such as once a week through seven days a week (every day) as noted
by Participants 2, 19, and 29. Participant 22 indicated she engages in physical activity for
30 minutes, but she did not indicate how many times she does that weekly. Participant 1
noted that she exercises five times a week, while Participant 3 mentioned 3 to 4 times a
week. Participant 4 indicated she exercises four times a week. Participants 7 and 8 both
indicated that they did some form of physical activity three times a week. Participant 11
noted that, “Not that much, I only walk a few times a week.” Participant 16 showed me
her muscles and bragged that she exercises five days a week. Participant 21 considered
playing with kids once a week as his form of exercise. Participant 27 indicated that due to
the nature of his work, he walks once or twice every day. Table 6 shows the responses
made by participants on this theme.

96
Table 6
Number of times exercised in a week
Participants Number of times exercised in a week
Participant # 1 I exercise 5 days a week.
Participant # 2 Every day.
Participant # 3
Participant # 4
About 3 to 4 times a week.
Once a week.
Participant # 5
Participant # 6
Participant # 7
Participant # 8
Participant # 9
Participant # 10
Participant # 11
Participant # 12
Participant # 13
Participant # 14
Participant # 15
Participant # 16
Participant # 17
Participant # 18
Participant # 19
Participant # 20
Participant # 21
Participant # 22
Participant # 23
Participant # 24
Participant # 25
Participant # 26
Participant # 27
Participant # 28
Participant # 29
Participant # 30
Sometimes 2 to 3 times a week.
I exercise once a day.
3 times a week.
3 times a week.
Once a week.
None. I don’t exercise.
Not much. I only walk a few times a week.
I exercise 3 times a week.
None.
4 times a week.
Once a week.
5 days a week (shows her muscles).
2 to 4 times.
3 times a week.
Every day.
Once a week.
Once or twice a week playing with kids.
30 minutes.
2 to 3 times.
5 times.
5 days a week.
Every day. I walk several times on my job.
Sometimes twice or once due to my work schedule.
I will say zero. Except I do a little walking
each day or sometimes.
I exercise every day.
1 or 2 times.
Table 7 represents the length of time participants engaged in any form of physical
activity. This includes activities such as walking, jogging, swimming, biking, and other

97
activities that participants thought would keep them fit. Participants 10 and 13, who
responded to not engaging in any physical activity, did not have any duration of activity
to report. The rest of the participants reported duration of some activity close to the
national recommendation of performing physical activity of at least 30 minutes in any
session per day. For instance, Participants 3, 9, 15, 17, 20, 21, 24, 25, 26, and 27 all
mentioned that they did exercise for 60 minutes or more during their workout session. A
few participants also stated that they exercised for less than 30 minutes. Participant 29
indicated that by the nature of his work, it took him seven minutes to drive to work and
same time back, but during his working time, he walks all day in delivering and picking
up products for his clients. Participant 11 noted that because of her age (70 years), she
could only walk for three minutes a day.
Thematic Category 12: Availability of equipment or ability to exercise
Thematic Category 12 focused on finding out from the participants whether they
had any form of equipment that motivate them to engage in any form or exercise or the
availability of walking trails. As shown on Table 8, 16 participants (53.3%) responded
that they did not have any equipment in their neighborhood that enabled them to engage
in any form of physical activity. On the other hand, 14 participants (46.7%) responded
that they have some form of equipment that enabled them to engage in some form of
physical activity. The responses of the 14 participants who indicated they had some form
of equipment for engaging in physical activities are as follows: Participant 1 indicated
that she has some form of equipment in her house. Participant 3 noted that he has a
Treadmill and some dumb bells. Participants 4 also mentioned that she has a treadmill.

98
Table 7
Duration of exercise in any session
Participants Duration of exercise in any session
Participant # 1 I exercise 30- 40 minutes per session.
Participant # 2 30 minutes.
Participant # 3
Participant # 4
60 minutes.
I do exercise for 30 minutes.
Participant # 5
Participant # 6
Participant # 7
Participant # 8
Participant # 9
Participant # 10
Participant # 11
Participant # 12
Participant # 13
Participant # 14
Participant # 15
Participant # 16
Participant # 17
Participant # 18
Participant # 19
Participant # 20
Participant # 21
Participant # 22
Participant # 23
Participant # 24
Participant # 25
Participant # 26
Participant # 27
Participant # 28
Participant # 29
Participant # 30
About 30 minutes or less, sometimes 20 minutes.
About 30 minutes.
30 minutes.
A minimum of 30-45 minutes.
60 minutes.
None.
About 3 minutes.
About 20 to 30 minutes.
None.
I exercise for 30 minutes.
60 minutes.
30 minutes.
90 minutes.
30 minutes.
30 minutes.
I exercise for 2 hours. I go to the gym.
About 60 minutes.
30 minutes.
60-120 minutes.
30-60 minutes.
60 minutes.
60 minutes.
Usually 45 to 60 minutes.
I walk for about 10 to 12 minutes-once a week.
I walk all day. It takes me seven minutes to drive
to work and seven to get home. But in between
I walk all day at work.
30 minutes.
Participant 5 responded in this manner, “Yes. I have treadmill, abdominal exercise
99
equipment and shaking dumbbells.” Participant 12 responded thus, “Yes. We have a
tennis court and a pool.” Participant 24 noted that, “I have a gym close by.” Participant
27 also had this to say: “Yes I have a few equipments in my house, but not the
subdivision.” Participant 28 stated that, “Yes I do have jump rope and resistance band,”
while Participant 30 indicated that, “Yes. There is a gym in my neighborhood.” Other
participants’ responses are represented on Table 8.
Thematic Category 13: Regularity/frequency of seeing provider for routine or as needed
check-up
Thematic Category 13 was critical because participants responded to the
frequency or otherwise of visiting their providers, having routine check-up to include
testing for their cholesterol levels, and therefore knowing what to do to control the effects
of unhealthy results. Almost all participants, except Participant 6 had some form of
regular visits to their providers. As indicated on Table 9, Participant 9 mentioned that, “I
don’t have any doctor appointments. I don’t have any doctor now.” Unlike Participant 6,
the rest of the participants have a somewhat regular or routine check-up with their
providers. It can also be noted that a few of the participants have a monthly schedule of
appointments. For instance, participants 1 and 14 have monthly visits with their
providers. Participant 5 indicated that she saw her provider as and needed; probably
annually. Her last visit was in September 2014. A majority of the participants have a
yearly schedule of visits to their providers. Participants 2, 3, 4, 7, 8, 12, 15, 16, 22, 23,
24, 26, 27, 29, and 30 all mentioned having a yearly schedule.

100
Table 8
Availability of equipment or ability to exercise
Participants Availability or ability to engage in physical activity
Participant # 1 Yes, in my house.
Participant # 2 No.
Participant # 3
Participant # 4
Yes. Treadmill and dumbbells.
Yes, I have a treadmill.
Participant # 5
Participant # 6
Participant # 7
Participant # 8
Participant # 9
Participant # 10
Participant # 11
Participant # 12
Participant # 13
Participant # 14
Participant # 15
Participant # 16
Participant # 17
Participant # 18
Participant # 19
Participant # 20
Participant # 21
Participant # 22
Participant # 23
Participant # 24
Participant # 25
Participant # 26
Participant # 27
Participant # 28
Participant # 29
Participant # 30
Yes. I have treadmill, abdominal exercises equipment,
and shaking dumbbells.
No. There is nothing in this apartment complex.
Yes.
No.
No.
No.
No.
Yes. We have a tennis court and a pool.
No, none in this complex.
No, we don’t have any in this apartment complex.
No, not here.
No.
Yes.
Yes, I have some equipment at home.
Yes.
No.
No.
No.
Yes.
I have a Gym close by.
No.
No.
Yes I have a few equipments in my house,
but not the subdivision.
Yes I do have jump rope and resistance band.
No.
Yes. There is a gym in my neighborhood.

101
Table 9
Regularity/frequency of seeing provider for routine or as needed check-up
Participants Regularity/frequency of having routine/needed check-up
Participant # 1 At least once a month
Participant # 2 Annually.
Participant # 3
Participant # 4
Annually.
Annually.
Participant # 5
Participant # 6
Participant # 7
Participant # 8
Participant # 9
Participant # 10
Participant # 11
Participant # 12
Participant # 13
Participant # 14
Participant # 15
Participant # 16
Participant # 17
Participant # 18
Participant # 19
Participant # 20
Participant # 21
Participant # 22
Participant # 23
Participant # 24
Participant # 25
Participant # 26
Participant # 27
Participant # 28
Participant # 29
Participant # 30
As when needed; probably annually. My last
was in September 2014.
I don’t have any doctor appointments. I don’t
have any doctor now.
Annually or when needed.
I see my provider annually and for blood work.
Annually. I have a hip replacement.
I have not done that in 2 years.
I do that every 2 to 3 months.
Annually.
A lot, twice a month.
Once a month.
Once a year.
I do annually.
2 times a year.
Twice a year.
Every 3 months.
Every 2 months.
Twice a year.
Once a year.
Once a year.
Annually.
Twice annually.
Annually or when needed.
I do annually.
Hmm, I don’t. My last checkup was about 2 years ago.
Annually.
I do annually.
Thematic Category 14: Last time participants checked their cholesterol
The underlying theme in Category 13 has a direct relation with that of 14.

102
Category 14 sought to find out from the participants the last time they had cholesterol
check or if they knew their cholesterol results. This is recorded on table 10.
Table 10
Last time participants checked their cholesterol
Participants Last time participants checked their cholesterol results
Participant # 1 January 2015.
Participant # 2 About 6 months ago.
Participant # 3
Participant # 4
I don’t remember.
October 2014.
Participant # 5
Participant # 6
Participant # 7
Participant # 8
Participant # 9
Participant # 10
Participant # 11
Participant # 12
Participant # 13
Participant # 14
Participant # 15
Participant # 16
Participant # 17
Participant # 18
Participant # 19
Participant # 20
Participant # 21
Participant # 22
Participant # 23
Participant # 24
Participant # 25
Participant # 26
Participant # 27
Participant # 28
Participant # 29
Participant # 30
Last year. My last was in September 2014.
About 3 years ago.
Last year.
About a week and a half to 2 weeks ago.
Last year.
That was 2 years ago.
2 months ago.
Hmm, about 2 years ago.
Two months ago.
3 months ago.
I had one 2 years ago.
About 3 weeks ago.
Not yet.
Er… that was January 2015.
3 weeks ago.
2 months ago.
Never. I have not had one.
Last year.
2 years ago.
Last year.
Never.
Last year. I take it whenever I go for my physical.
Within the last 3 months.
A year ago.
My last check was last year…in June 2014.
About a week ago for my annual physicals.

103
As noted on Table 10, four participants (13.3%) responded to indicate that they have not
had any cholesterol check or did not remember when they had one. These are Participants
3, 17, 21, and 25. They responded in this manner respectively: “I don’t remember.” “Not
yet.” “Never. I have not had one yet,” and “never.” The other 86.7% had a fair idea of
when they did their last cholesterol check. Participant 1 indicated that she had just done
one in January 2015. Participant 2 also noted having done her last one about six months
ago. The latest cholesterol checks were recorded by participants 8 and 30, who
acknowledged that they had done theirs “about a week and a half to 2 weeks ago,” and
“about a week ago for my annual physicals.” The maximum interval of cholesterol
checks was noted by Participant 6 who said her last check was “about 3 years ago.” Table
10 represents all the responses made by the 30 participants on this theme.
Thematic Category 15: Information from participants’ provider on being overweight or
obese
Thematic Category 15 focused on asking participants if their providers mentioned
to them about their being overweight or obese. Responses to this question showed that 11
of the 30 participants (36.7%) indicated that they have not been told of being overweight
or obese. These were participants 1, 2, 4, 11, 15, 16, 17, 21, 26, 28, 29. However, the
other 19 participants (63.3%) mentioned that they have been informed by their providers
of either being overweight or obese. Participant 3 indicated that based on the BMI value,
his provider informed him that he was overweight and obese. In regards to being told of
being overweight or obese, Participant 5 responded that her provider alerted her to lose
10 pounds. Participant 8 also indicated that he was told three years ago. Participant 12

104
mentioned that she had been told of being overweight. Participant 23 and 25 indicated
they had been told of being overweight, while Participant 30 responded that, “yes a little
overweight.”
Table 11
Participants’ notification of being overweight or obese
Participants Notified by Provider about being overweight or obese
Participant # 1 No.
Participant # 2 No.
Participant # 3
Participant # 4
Yes based on my BMI.
No.
Participant # 5
Participant # 6
Participant # 7
Participant # 8
Participant # 9
Participant # 10
Participant # 11
Participant # 12
Participant # 13
Participant # 14
Participant # 15
Participant # 16
Participant # 17
Participant # 18
Participant # 19
Participant # 20
Participant # 21
Participant # 22
Participant # 23
Participant # 24
Participant # 25
Participant # 26
Participant # 27
Participant # 28
Participant # 29
Participant # 30
Yes. I was told to lose 10 pounds.
Yes.
Yes.
Yes, about 3 years ago.
Yes.
Yes.
No.
I was told of overweight.
Yes.
Yes.
No.
No.
No.
Yes I have been told that.
Yes, overweight.
Yes, obese.
No.
Yes.
Yes overweight.
Yes.
That I am overweight.
No.
Yes.
No.
No.
Yes a little overweight.
s
105
The respective responses by participants on Thematic Category 15 are shown on Table
11. Table 11 depicts responses on notification from participants’ providers whether they
are obese or overweight.
Summary of Notable Results/Findings
Responses given by all 30 participants interviewed have some variances or
similarities on the themes of the guiding interview questions. The first few themes
focused on questions that fed into answering the first research question. The remaining
themes contributed to answering the second research question of this study.
The responses indicated that the lowest income earned by any family ranged from
less than $10,000 to the family who earned the highest between $180,000 and $190,000.
The ages of the participants span from 23, the youngest through 70, the oldest. There
were 17 females and 13 males.
The reasons why some participants were not making enough income; with some
participants making less than $10,000 (participants 10, 11, 13, and 14) are due to various
reasons. Some were cited as not having a good paying job or only receiving subsidies or
Welfare checks from the U.S. government. The lowest education attained by the
participants was recorded as grade nine. Most of the participants with low education were
also noted in particular zip codes such as those interviewed from 27704. The highest
education recorded was a doctorate as well as few in medical school. As far as being
satisfied with the income each family earned, a third of participants indicated that they
were satisfied or okay with how much they earned. The remaining fraction expressed that
106
they were not content with what they earn, and as such would like to upgrade their lives
to earn more.
Enrolment in any academic program is an investment that could eventually help
participants to earn more income by obtaining better employment or engaging in lucrative
business. Asked if these participants are enrolled in some academic program, 19
responded that they were not enrolled in any program. However, 11 indicated that they
were enrolled in some kind of program that will ultimately improve their working life to
lead them to earning more income.
The popular or most common foods consumed by participants showed a variety of
sources. A few indicated they did eat a lot of junk food, mostly unhealthy foods
purchased from FFR. Most of the responses alluded to the fact that healthy foods were
being consumed in other homes. Most of the participants indicated the desire to eat a lot
of vegetables.
The preference of eating in FFR was one of the thematic category that had
responses skewed to one side. Of the 30 participants, only one indicated that she prefers
eating in a FFR because she just hates to clean up after cooking. The remaining
participants responded without reservation that they preferred cooking at home. However,
of those who preferred cooking their own meals, Participants 2, 9, 28, quipped that every
now and then, they preferred eating out at FFRs.
The preference of eating quite often at a FFR may be influenced by how close
participants live near a FFR. 5 of the 30 participants (16.7%) responded that they did not

107
live near a FFR. 83.3% of the participants confirmed that they lived near a FFR. Some
mentioned they lived just a walking distance away.
As far as dependence of food consumed on the income earned, 11of the
participants noted that what they purchased for consumption did not depend on how
much they earned. For instance Participant 1 indicated that her spending was not
influenced by her income, but rather it depended on her budget. Participant 29 noted that
it did not matter because “... I will eat the same way regardless.” However, 19
participants (63.3%) agreed that the income they earned played a role on how they
shopped for food or what they consumed. For instance Participant 6 mentioned that “Yes,
it does because it determines what we can afford and what we cannot.”
In regards to number of servings of salads per day, almost all participants
responded that salad was an important aspect of their meals. Participant 17 indicated that
his family consumed about seven to eight servings of salad each day. The least
consumption of salads and vegetables was once a week as mentioned by Participants 11
and 21.
When asked whether they felt overweight or obese, 10 participants (33.3%)
responded that they did not feel overweight or obese. Contrary, the other 20 participants
(66.7%) indicated that they either felt overweight or obese. For example, Participant 3
indicated that going by the BMI scale, he was overweight.
The availability of equipment and other resources such as walking trails can have
great effect on how individuals or families exercise. This is also related to how long they
exercise in each session. Three participants (10, 13, and 28) indicated that they were not

108
involved in any form of exercise. The 27 other participants mentioned they were involved
in some form of exercise. With regards to availability of presence of some equipment or
resources to exercise, 16 participants (53.3%) responded that they did not have any
equipment in their neighborhood that enabled them to engage in any form of physical
activity. However, 14 participants (46.7%) responded that they have some form of
equipment that enabled them to engage in some form of physical activity.
The regularity of visiting clinicians or providers for routine checkup or as needed
treatment is a good way for patients to have their cholesterol levels and other health
parameters known to avert any impending health issues. With the exception of Participant
6, all other participants had some form of regular or routine doctor visits. On the issue of
when they had their last cholesterol checks, three participants (10%) notably Participants
3, 27, and 21mentioned that they have not had any cholesterol checks or do not
remember. Contrary, the remaining 90% had some idea of when they last had the levels
checked.
Being notified by a provider that one is overweight or obese based on objective or
quite often subjective information could go a long way to help individuals stay healthy.
When asked about whether they have been cautioned by their providers about being more
than the recommended BMI as indication of obesity, was met with several results. 11 of
the 30 participants (36.7%) indicated that they have not been told of being overweight or
obese. On the other hand, 19 participants responded that they have been informed by their
providers about being overweight or obese.

109
Summary
The purpose of this qualitative study was to find relationship between family
income and obesity. The approval of the study by Walden IRB enabled me recruit 30
participants for this phenomenological study. This chapter outlined the participants’
profile and the data collection method. All participants were interviewed after signing the
consent form and copies were given to them to keep.
I performed my data analysis using the NVivo 10 software. I identified the
various themes based on nodes and classification, which were made feasible with the use
of the NVivo software. Figure 4 depicts summary of NVivo’s themes on obesity.
Figure 4. NVivo’s thematic diagram of factors contributing to obesity
The chapter also outlined the demographic features of the participants by using
participant numbers that prevented disclosure of their identity. The chapter identified the
income participants’ family earn, what they eat, where they live, how often they exercise,
and how all these might be related to obesity. The results of the various themes were

110
analyzed and this will progress into Chapter 5 for discussion of the findings and results
recorded in Chapter 4.
The research questions for this study were: (1) what are the key factors that
contribute to low family income among African Americans in Durham, NC and (2) how
do these key factors contribute to obesity among African Americans in Durham, NC? The
themes analyzed in Chapter 4 showed that Thematic Categories 1 through 4 answered
Research Question 1. Thematic Categories 5 through 15 also fit into answering Research
Question 2 (as discussed in Summary of Notable Results/Findings). Chapter 5 will
address how the themes identified relate to the health belief model. In addition, Chapter 5
will discuss the interpretation of results, implication for social change, provide
recommendations for future studies, and conclusion.

111
Chapter 5: Discussion, Recommendations, and Conclusions
Introduction
The purpose of this research was to provide qualitative insight into the
relationship that might exist between income earned by African American families in
Durham, NC and how this contributes to obesity. A number of quantitative studies have
been conducted to assess obesity as an independent variable, but few delve into the life
experiences of individuals and families in the context of income. Although some
qualitative studies have been done with respect to obesity and other factors (Mendez et
al., 2004), a focus on Durham, NC appeared to lack detailed qualitative studies.
Therefore, this study sought to study the factors that lead to low income earned by
African Americans and how these in turn lead to obesity among the chosen target
population.
A study on the changes in family income status and the development of
overweight and obesity from 2 to 15-year olds has provided evidence that remaining in
low-income and moving into low-income increases risk for adolescent overweight and
obesity (Demment, Haas, & Olson, 2014). The relationship between childhood and
adolescent obesity has been expressed by Schneider (2011), who indicated that children
and adolescents who are overweight or obese could likely become overweight or obese
adults. These findings show that the income earned by families has great effect and
impact in contributing to obesity. This has caused many a political aspirants and some
government officials to request an increase in the minimum hourly wage. It is the
relationship between family income and obesity that this study sought to achieve.

112
The target population for this study was African Americans living in three
separate zip codes characterized by different levels of income earned by the families.
Thirty participants were interviewed over a 2-month period. The responses gathered from
the interviews have been represented in tables and described in Chapter 4. The results
indicated that the income earned by families of varied income has an effect on where they
can afford to live, what they can afford to eat, and how often they can engage in any
physical activity, all of which could potentially lead to obesity. Chapter 5 discusses the
interpretation of the results recorded in the preceding chapter; how the themes identified
relate to the theoretical model, HBM; implications for social change; recommendations
for future studies; and the conclusions.
This study employed a phenomenological approach to understand the lived
experiences of the participants. This method was chosen for this qualitative research
because of its ability to give participants the opportunity to relate their first-hand lived
experiences. The methodology was aligned to the HBM in ways that could help
participants, and African Americans in general, find ways to achieve more with little
income earned.
The findings from the interviews indicated that the annual family income earned
by participants varies across the three different zip codes. Those within the same zip code
had annual incomes that had small differences between them, while the difference
between different zip codes representing different levels (low, middle, and higher) had
disparities. The difference in income levels also contributed to where participants in each
income level chose to live, and this also had a reflection on how they were affected by
113
obesity. Whereas some participants’ income affected their household spending and, for
that matter, what food they could eat often, a few were not bothered or influenced by how
much they earned because they wanted to eat what they desired to eat irrespective of their
earning. The themes identified from the responses to the interviews showed some factors
that contributed to low family income among the participants and how these factors
contributed to obesity.
Interpretations
The intent of this study was to determine if a relationship might exist between
family income earned and obesity. The research problem, the purpose of the study, the
significance, and literature review were discussed in previous chapters. This study found
that a lack of education was one of the factors that led to low family income. This has an
effect on which zip codes participants chose to live, the kind of food they ate, the
availability of or the means to engage in physical exercise, and how this ultimately
affected their health status as far as obesity is concerned. The employment status and
locations of where participants lived were of significant consideration in interpreting the
findings of this study.
Lack of Earning Enough Family Income
The study showed that family income from most of the participants living in the
apartments in zip code 27704 was very low. A few of them were not gainfully employed
and only lived on government subsidy or support. Most of them earned less than $10,000
a year (Participants 10, 11, 13, and 14). The only housing they could afford was the area
tagged as the “projects.” This contributed to the type of food they ate most of the time

114
and the inability to engage in the recommended physical activity. This was also reflected
in their BMI results being more than the normal and leaning on the obese side. According
to literature, the median household income for Durham, the city governing the target
population was $46,972 as of 2006 - 2010 and has grown by 14.12% since 2000 (NC-
BRFSS, 2008).
The State Center for Health Statistics and Office of Minority Health and Health
Disparities (2010) noted that the percentage of African Americans families in NC who
live below the federal poverty level ($21,834 annual income for a family of four) in 2008
was 21.3%, compared to 6.7% for Caucasians. These findings from previous studies
agree with the findings in my study about the low income earned by some African
Americans. Most of the participants that earned a higher family income lived in better
neighborhoods, in the 27713 and 27703 zip codes. Their educational level was high and
they did understand the relevance of living a holistic life that incorporates a better
lifestyle for better health. The highest income gleaned from this study was in the range of
$180,000-190,000 (Participant 5). The ability to earn higher income and the ability to
engage in adequate physical activity contributed to the noted BMI. This is consistent with
some literature that stated that those who make a higher income have reduced obesity
(Berkman & Kawachi, 2000). It must be pointed out that a few participants (7, 19, and
24) lived in very good neighborhoods with very good family income, but had a seemingly
high BMI. This could be attributed to certain factors, such as genetic predisposition and
other factors beyond the scope of this study. It is also of interest to know that increasing
family income without substantial difference to change the environment or residential

115
location did not improve or narrow the disparity. Other factors that should be considered
are contextual, biological, environmental, and socio-economic factors (Gordon-Larsen et
al., 2003). Interestingly, increased family income helps to control some of these factors
and could lead to decreased obesity (Gordon-Larsen et al., 2003).
Highest Grade of Education Attained
The highest level of educational attainment was provided by participants as a
factor that contributed to low income among African Americans. Few participants had
reached the doctoral level, while others barely completed the sixth grade. The findings
indicated that having a lower education played a role in what type of employment the
participants were engaged in. This also affected the type of living conditions they could
afford. Participants living in low income zones were noted to have the lowest income.
There were no equipment to use for physical activity in such neighborhoods and quite a
large portion of the participants in this group had a high BMI. On the average,
participants with higher education had higher income and were found living in good
neighborhoods, and most of them had access to means or equipment needed to engage in
physical activities. The BMI values for educated participants were on the average lower
than those with lower educational status. The lack of attaining a higher education was a
factor to earning low income, and this gave support to my first research question as one
of the key factors that contribute to low family income.
Satisfaction About Income Earned by Family
Earning a low income and not desiring to strive for better opportunities to make
more could be regarded as complacency. This theme was of importance because a
116
participant’s lack of striving to better his or her life or just being complacent with a low
income could be a reason for earning low income or not making enough to change his/her
status quo. This study had some responses that led to findings that helped to answer this
question.
The findings from this study portrayed that 10 of the 30 (33.3%) participants
responded that they were okay with the income their family makes a year. Participants 1,
2, 3, 4, 5, 19, 24, 25, 29, and 30 alluded to this fact. The rest of the participants responded
that they were not happy with how much their family earned a year. Although
Participants 1, 3, and 25 mentioned that they were happy with how much they earned,
they did also state that they would want to make more money. Over 65% of participants
were not satisfied with how much they earn a year and would want to make more. This in
essence could increase their earning potential and provide a better lifestyle. This also
indicated that a lack of passion to advance oneself in life, and being complacent with a
low income could contribute to an eventual lifestyle that could contribute to obesity. This
theme is one of the factors that helped to answer Research Question 1.
Current Enrollment in Any Academic Program
The fourth Thematic Category focused on whether the participants were enrolled
in any academic program that had the potential of ultimately giving them better
opportunities for earning more income sooner or later. The academic program under
consideration for this category was whether participants are undergoing any vocational
training or any academic curricula that had the potential of increasing income for the

117
participants’ family upon graduation. The responses provided by participants played a
critical role in answering whether participants were enrolled in any academic programs.
The responses from the participants indicated that 19 of 30 (63.3%) said, “no,”
indicating that they were not enrolled in any academic or vocational programs. These
were Participants 1, 3, 4, 5, 6, 7, 8, 11, 12, 13, 18, 19, 20, 21, 23, 24, 26, 29, and 30. 11 of
the participants (36.7%) said, “yes,” implying they were enrolled in some academic
program. This is characterized by Participants 2, 9, 10, 14, 15, 16, 17, 22, 25, 27, and 28.
A few of the participants were enrolled in programs that had the potential of earning
more income, such as medical school, nursing school, and masters in other health care
professions. Going by the predictive pattern of low educational level that offers low
paying jobs and also low status quo (Berkman & Kawachi, 2000), this theme posed a
problem that could lead to obesity, and therefore, helped to answer Research Question 1.
The other themes that ran through the responses by the participants are geared towards
answering the second research question of this study.
Popular Foods Consumed at Home
The types of food mostly consumed by a family could be a result of how much the
family earns. The popular foods reported by all participants were similar in category such
as flavored water, broccoli, rice, fried potatoes, and steak. For instance, Participant 1
mentioned that most of the food she consumed was “salad, chicken, salmon, baked fish,
potatoes, rice, bananas, and cereal.” Observing Participant 1’s weight (119 pounds) and
height (60 inches) and that she was making an annual income of $70,000- 80,000, it can

118
be deduced that what she eats has not led her to be obese. Although she mentioned that
her spending is based on her budget, she watches what she consumes on daily basis.
Participant 2 indicated that her family consumed chicken, rice, sandwiches, and
salad. Participant 3 mentioned that “rice, pounded yam, beans, fried potatoes, fish, beef,
chicken, and bread” were the most popular foods that his family ate quite often.
Participant 4 noted that most of the food they ate were chicken, pizza, and pasta.
Participant 15 indicated that “I am on diet now. We eat junk and unhealthy food and
some baked fish.” Analysis of the foods consumed by participants show that most of
them were carbohydrates and high calorie intake foods. With income being a factor in the
choice of food purchased and consumed, participants living in zip codes and who earned
low income focused more on quantity than quality. This finding agreed with Berkman
and Kawachi (2000), who emphasized that the income people earn can have a direct
effect on their lifestyle and how they eat.
The theme of the most popular foods consumed by participants is one of the key
factors that answers Research Question 2. The key factors that contribute to low family
income (Research Question 1) ultimately have a contributing effect on obesity among the
target population. In effect, Research Question 1 had a contributing effect on Research
Question 2.
Preference of Eating in Fast Food Restaurants (FFR) or Choosing to Cook at Home
The sixth thematic category that I focused on was to find out if the participants
preferred eating at fast food restaurants or chose to cook meals at home. This is an
important factor because eating in fast foods instead of cooking homemade meals is a

119
contributing factor to obesity (Schneider, 2011). Of the 30 participants interviewed, only
1(3.3%) indicated that she preferred eating at the FFR because she hates to clean after
cooking (Participant 18). The rest of the participants (96.7%) responded that they
preferred cooking at home than eating at FFR joints. Participants 2, 9, and 28 noted that
although they preferred cooking at home, they often patronized FFR (as illustrated in
Table 4).
By observing the body language and responses of the participants, those who
lived in the zip codes of 27704 and 27713 referred to fast foods such as McDonald’s and
Burger King. Living close to such restaurants where a meal may not cost so much, but is
unhealthy in nature are mostly consumed by people of low income status. Participants
who live in zip codes known to be a richer neighborhood hardly have the aforementioned
restaurants around them. Interestingly enough, because these participants can afford to
pay higher, they do patronize other seemingly expensive restaurants and end up
consuming food that may be healthy or unhealthy for them. As noted by Sobal and
Stunkard (2007), some studies have also reported that those who make higher income
have higher rates of obesity. Asked about the preference of cooking at home or
consuming fast foods, most of the participants preferred cooking at home. However, there
is still the likelihood of patronizing fast foods, which in some cases may be more than in
moderation and therefore an obesity contributing factor.
Dependence of Choice of Food on Income
There was a diverse response from all participants when it came to the question
whether the food they chose to shop for and consume depended on how much income

120
they make annually. Eleven participants (36.7%) responded in the negative implying that
how much they earn did not directly affect what foods they shopped for or ate. These
were Participants 1, 2, 3, 7, 8, 19, 20, 22 23, 27, and 29. Some of the responses given
were:
Participant 1 stated, “No. My spending is based on my budget.” Participants 2, 3,
7, 8, 19, 20, 22, and 23 only mentioned “no” without much explanation. Participant 27
noted that his family’s choice of food did not depend on the income they earn. According
to him, it was because whether he makes more money or not, his family will still like
African food or the food we love to eat. He emphasized that “I do believe that income has
effect on lifestyle or what people buy because those who make less struggle and end up
overeating due to stress.” He added that some work two jobs to make ends meet or meet
the cost of living. “This ends in buying and eating junk food and no time to exercise too. I
think more money and more time lead to better lifestyle,” he noted. Participant 29 also
mentioned that it did not matter to her because she will shop the same way regardless of
her income.
Contrary to the preceding comments, 19 participants (63.3%) answered “Yes”
indicating that the income they earn has effect on how they shop for food. These are
represented by Participants 4, 5, 6, 9, 10, 11, 12, 13, 14, 15, 16, 17, 18, 21, 24, 25, 26, 28,
and 30. Some of the responses are:
Participant 6 mentioned that, “Yes, it does because it determines what we can
afford and what we cannot.” Participant 10 indicated that, “Yes. Our income or how
much we get determines what we can afford.” Participant 11 responded in this manner:

121
“Yes it is, because we ultimately can afford only what we have. Our budget is fixed.”
Participant 14 responded that, “Yes very much so.” She believes that how much people
make affect or can contribute to obesity.” Participant 15 also affirmed these responses by
saying that, “Yes it does. The more I can make the better choices I can make.”
Participants 16, 17, and 18 all agreed in a similar vein by indicating that the two were
related because how much a family earns determines how they shop for the foods they
consume. Participant 21 responded that, “Yes. The more one makes, the better the
lifestyle.” Participant 26 elaborated further by saying that:
Yes. If you make more, you eat better. You are limited by the income you make.
Most affordable things are not healthy. What is healthy is expensive. If I can’t
afford it, I will only eat Burger King. When you have the means, you eat to satisfy
and nourish your body. Many people eat quantity and not quality.”
Participant 28 also had this to say:
Yes it does. We are on a budget, so we can only afford what our income allows. It
is necessary to eat better if you can afford it. Sometimes I go to the groceries and
there is something I wish to buy, but I ask myself if I can afford it. So income
affects what you buy and can play a role in obesity.
Participant 30’s response summed up all the “yes” responses on the theme by concluding
that, “Yes because you can buy more fruits and vegetables if you make more money.”
The responses of the participants who indicated that income affected how their family
shopped and consumed food outweighed those who indicated that their choice of food
was not depended on how much thy earn. The ratio was 63.3%:36.7%. It suggests that the

122
income a family makes has an influence on what types of food they “are forced” to buy
due to lack of the available funds. This is supported by Berkman and Kawachi (2000),
who reported that the income people earn can have a direct effect on their lifetime and
how they eat. Therefore this factor helped to answer the second research question.
Number of Servings of Salads Per Day
Acheampong and Halderman (2012) studied obesity in relation to nutritional
knowledge, attitudes, and beliefs associated with obesity among low-income Hispanic
and African American women caretakers. The most common barrier found from their
study was that consuming a healthy diet was the cost of healthy foods. The cost of foods
has driven many a family to sacrifice quality for quantity. The issue of serving salads as
part of the daily chores is not consistent among families. This was noted while gathering
responses from my participants in terms of the number of servings of salad each family
consumes on daily or weekly basis. This is an important factor because research has
shown that consuming meals greater in proportion of carbohydrates without vegetables or
salads is one of the contributing factors to obesity.
When asked about how many servings of salads participants consume per day,
almost all the participants mentioned that their family made serving of salads part of their
daily meal. This is an area of limitation where it is possible for participants to exaggerate
on their responses. The least consumption was once a week as mentioned by Participants
11 and 21. The most consumed by any family among the participants was seven or eight
a day as indicated by Participant 17. Participant 1 indicated having one serving of salad a
day. Participant 2 indicated two to three times a day while Participant 3 observed that,

123
“Apple, banana, and this is like once in a while.” With regards to this guiding question,
Participant 5 also noted that, “Mostly apples, banana, papaya, baby spring, and organic
baby lettuce.”
Responses provided on the dependence of what choice of food to purchase on
income earned does not correlate with the responses provided by most of the participants
who responded that salads and vegetables were a significant aspect of their meals. With
Participant 30 mentioning that the more one makes, the more he or she can afford to buy
vegetables and salads, it stands to reason that not many people actually consume as much
vegetables and salads as they claim to do. This confirms what Schneider (2011) observed,
by saying that salads play a nutritional role in curbing obesity. Schneider noted that the
intake of fruits and vegetables were hardly patronized by people of lower income,
especially African Americans. Schneider emphasized that in spite of a growing body of
literature that has revealed the benefits of diets high in fruits and vegetables, it has been
noted that most African Americans eat lesser than the recommended amount of such
foods.
Although Schneider (2011) has affirmed that eating well and in right constituents
is controlled by income, this study did not isolate what literature says because almost all
the obese among the participants claim they consume salads and vegetables. It might be
assumed that people who feel obese or conscious of their condition are now taking a
better approach of eating well, which includes having salads and vegetables as part of
their meals. Therefore if one feels obese or he or she has been notified by a
provider/physician to do something about their situation that can prompt a strategy to

124
improve lifestyle by eating the recommended amount of food and including vegetables
that are likely to be helpful.
Number of Times Exercised in a Week
The number of times as well as the duration of engaging in physical activities has
been noted to help eliminate or control obesity. The Framingham study (Schneider, 2011)
reported that the likelihood of dying from cardiovascular disease was highest for those
who exercised the least or less physically active. Schneider indicated that those who are
engaged in vigorous activities spanning three or more hours per week are less likely to
die early. Schneider further mentioned that a major cause of obesity is unhealthy eating
habits in combination with lack of adequate physical activity (p. 267). The advice
Schneider offered was that the most effective way of losing weight or staying healthy is
to combine dieting and physical activity.
From Table 6, three (10%) participants; 10, 13, and 28 responded that they did not
engage in any physical activity. The rest (90%) responded that they were involved in
some physical activity. This varies from performances such as once a week through seven
days a week (every day) as noted by Participants 2, 19, and 29.
Table 7 represents the length of time participants engaged in any form of physical
activity. This includes activities such as walking, jogging, swimming, biking, and other
activities that participants thought would keep them fit. Participants 10 and 13, who
responded to not engaging in any physical activity, did not have any duration of activity
to report. The demographics of these two participants are indicators of obesity. For
instance, both of them live in the 27704 zip code (which covers the area where this target

125
population of an apartment community is located) that has families making very low
income. Participant 10 has a BMI of 31; she makes an annual income of less than
$10,000, and weighs 198 pounds. Participant 13 has a BMI of 63, makes an annual
income of less than $10,000 annually, and weighs 332 pounds. The rest of the
participants reported some duration of some activity close to the national
recommendation of performing physical activity of at least 30 minutes in any session per
day.
These observations agree with previous studies that those who make less income
tend to live in areas that are deprived of amenities that promote healthy living such as
gymnasia, walking trails, swimming pools, and other provisions that enhance physical
activities. Because some participants were not engaged in any physical activity or
performing below the recommended duration, it can be deduced that lack of physical
activity or not meeting the recommended duration of routine exercise is a contributing
factor to obesity.
Availability of Equipment or Ability to Exercise
Lack of engaging in physical activity can be traced to factors such as the
unavailability of equipment to be used or lack of attitude to exercise. Lack of physical
activity is known to contribute to chronic diseases including obesity (Schneider, 2011).
The presence or availability of equipment to exercise or the ability to exercise in certain
forms has a direct effect on the health of individuals. For instance the recommendation
and endorsement in the U.S surgeon general’s report concerning physical activity and
health showed that a minimum standard of 150 kilocalories of energy per day of light to a

126
moderate activity is encouraged (Schneider, 2011). The report indicated that this can be
achieved by walking briskly for about 30 minutes or by running about 10 minutes every
mile for 15 minutes, or by performing other activities that lead to burning of calories
(Schneider, 2011).
Using the availability of equipment or ability to exercise in some form as a theme
and a factor of obesity, Table 8 showed that 16 participants (53.3%) responded that they
did not have any equipment in their neighborhood that enabled them to engage in any
form of physical activity. However, 14 participants (46.7%) responded that they have
some form of equipment that enabled them to engage in some form of physical activity.
Therefore those who had a means to engage in any physical activity were less than those
had none. The responses of the 14 participants who indicated they had some form of
equipment for engaging in physical activities are hereafter discussed.
Participant 1 indicated that she has some form of equipment in her house that she
exercises with. Participant 3 noted that he has a treadmill and dumbbells. Participants 4
also mentioned that she has a treadmill. Participant 5 responded she has a treadmill and
abdominal exercise equipment, and shaking dumbbells.” Participant 12 responded thus,
“Yes. We have a tennis court and a pool.” Participant 24 noted that, “I have a Gym close
by.” Participant 27 also had this to say: “Yes I have a few equipments in my house, but
not the subdivision.” Participant 28 stated that, “Yes I do have jump rope and resistance
band,” while Participant 30 indicated that, “Yes. There is a gym in my neighborhood.”
Ironically, residents of the 27704 zip code had no form of equipment to exercise.
They had no trails for walking and were not motivated to engage in much walking
127
exercise except a few. Their income level also supposedly did not allow them to register
at commercial gymnasia to go work out. It implies that communities that had residences
with affluent people or very pricy communities made certain amenities available to
encourage engaging in some form of physical activity. Therefore the availability of
exercising equipment or some form of walking trails, and swimming pools are factors
that motivate physical activity. The lack thereof of the aforementioned could be
contributing factors for obesity.
Regularity/Frequency of Seeing Provider for Routine or as Needed Check-Up
The ability to see one’s health care provider on routine basis as noted in Thematic
Category 13 was critical to this study because it is a parameter to measure how often
participants go for medical check-up and for that matter whether they knew what was
going on in their bodies. Prevention plays a very significant way of avoiding some
diseases (Aschengrau, 2009). Thus the ability of a person to know his or her laboratory
results can go a long way to help adopt some measures that ensure a healthy life style.
Participants were asked to respond to the frequency or otherwise of visiting their
providers, having routine check-up to include testing for their cholesterol levels, and
therefore knowing what to do to control the effects of unhealthy results. The results
showed that almost all participants, except Participant 6 had some form of regular visits
to their providers. As indicated on Table 9, Participant 9 stated that, “I don’t have any
doctor appointments. I don’t have any doctor now.” She implied that she does not go for
any routine check-up. Unlike Participant 6, the rest of the participants have a somewhat
regular or routine check-up with their providers. It can also be noted that a few of the
128
participants have a monthly schedule of appointments. For instance, participants 1 and 14
have monthly visits with their providers. Participant 5 indicated that she saw her provider
as and needed; probably annually. Her last visit was in September 2014. Quite a number
of the participants have a yearly schedule of visits to their providers. Participants 2, 3, 4,
7, 8, 12, 15, 16, 22, 23, 24, 26, 27, 29, and 30 all mentioned having a yearly schedule.
The responses to this question shows that having a regular visit to one’s physician
or having regular check-ups such as cholesterol, weight, and glucose levels are very vital
for preventing chronic disease. Most of the participants mentioned this theme as an
important factor. My observations as far as relating family income and where participants
reside are that living on low income has a debilitating effect on the type of healthcare
received. Most of the low income earners live on government subsidy as well as
healthcare system, where it is likely that the quality of healthcare is less compared to
those who make more money and can easily choose their healthcare providers. It can be
deduced that regularity of seeing one’s health provider is a critical element that helps to
diagnose eminent diseases early at the onset and also help to prevent subsequent ones.
Lack of this initiative is a factor that may contribute to obesity.
Last Time Participants Checked Their Cholesterol
The ability to check one’s cholesterol level and deciding to tailor meals consumed
to it is a healthy lifestyle that can help to reduce obesity among many an African
American. This is because the ability to visit one’s provider on a regular basis would help
to have a yearly cholesterol check, which could help in detecting any abnormalities of
results. According to Remington et al. (2010), multiple longitudinal studies have

129
demonstrated elevated cholesterol in serum is a major risk factor that causes
atherosclerosis and coronary heart disease (p. 363). The participants were asked the last
time each had gone for a cholesterol check. Some could easily mention without guessing,
while others scratched their hairs to remember when that happened.
Table 10 shows that four participants (13.3%) responded to indicate that they
have not had any cholesterol check or did not remember when they had one. These are
Participants 3, 17, 21, and 25. They responded in this manner respectively: “I don’t
remember.” “Not yet.” “Never. I have not had one yet,” and “never.” The other 86.7%
had a fair idea of when they did their last cholesterol check. Participant 1 indicated that
she had just done one in January 2015. Participant 2 also noted having done her last one
about 6 months ago. The latest cholesterol checks were recorded by Participants 8 and 30,
who acknowledged that they had done theirs “about a week and a half to 2 weeks ago,”
and “about a week ago for my annual physicals” respectively. The maximum interval of
cholesterol checks was noted by Participant 6 who said her last check was “about 3 years
ago.”
The responses of participants who seem to be regular on checking their
cholesterol levels (86.7%) was more than those who had no idea when they did it or have
not had one in years. It stands to reason that most of the participants regarded the
cholesterol check-up an important factor in planning what they need to eat in terms of
affordability. It is an assumption that though some of the participants know their
cholesterol levels as being high yet, have no way of controlling it due to the fact that they
might not have the ability to consume healthy food as a result of low income. It could

130
also be that irrespective of the income some participants make, for instance, Participant
27 indicated the same food or choice of food would be consumed because that is what his
family enjoys eating. The issue then becomes one of attitude and lifestyle, much of which
could be explained by the HBM. Therefore knowing your cholesterol level is a factor that
could help to make informed decisions about cutting down on some fatty foods or
engaging more in physical activities that promote good health.
Information from Participants’ Provider on Being Overweight or Obese
The final theme for consideration in this study was to find out if the participants
had been notified by their healthcare providers whether they were “normal,” overweight
or obese. According to CDC (2013), BMI has a direct relationship with obesity in that the
higher the BMI, the most likely an individual could be categorized as obese. The BMI
ranges also categorize individuals in being obese or overweight. The BMI categories
have been defined by CDC (2013) as underweight (< 18.5), normal weight (18.5-24.9),
overweight (25-29.9), and obesity (30 or greater). It is a fact that not being aware of one’s
health status could have some negative impact on an individual. Because this study
focused on income and obesity, the main focus for analysis was solely on the data on
obesity.
Thematic Category 15 focused on asking participants if their health providers had
ever discussed or mentioned to them about their being overweight or obese. The
responses to this question showed that 11 of the 30 participants (36.7%) indicated that
they have not been told of being overweight or obese. These were Participants 1, 2, 4, 11,
15, 16, 17, 21, 26, 28, and 29. However, the other 19 participants (63.3%) mentioned that

131
they have been informed by their providers of either being overweight or obese.
Participant 3 indicated that based on the BMI value, his provider had informed him that
he was overweight and obese. Participant 5 also responded that her provider had alerted
her to lose 10 pounds. Participant 8 also indicated that he was told three years ago.
Participant 12 mentioned that she had been told of being overweight. Participant 23 and
25 indicated they had been told of being overweight, while Participant 30 responded that,
“yes a little overweight.” The responses affirmed that regular “doctor” visits have the
tendency of alerting patients any inherent medical problems or issues that need elective
or immediate attention (Schneider, 2011). From these responses, a physicians’
intervention or advice could go a long way to help patients manage their lifestyle. From
this statement, it holds water to say that participants who know their obese status might
be reliably informed by their providers to initiate the process of adopting strategies that
would help them curb their health situation. To have 36.7% indicate that they have not
been informed by their providers about being overweight or obese could mean that they
are in the normal weight range, they do not have regular check-ups, or their providers
have not had a counseling session with them.
The perceptions that an individual have about his/herself or from others
concerning obesity could be a factor that drives him/her to desire a change for better
healthy living. This agrees with the statement by Remington et al. (2010) that obesity
affects how a person feels about himself or herself, and more so, how others perceive
them and this can ultimately lead to low self-esteem in association with obesity.
Therefore being notified by a health provider that one is obese is the beginning of the
132
process of “healing.” Those who never visit their providers to be informed stand the
chance of missing out on important information that alerts patients of any inherent
medical problems or issues that need elective or immediate attention (Schneider, 2011). It
could be implied that a physicians’ intervention or advice could go a long way to help
patients manage their lifestyle. Lack of this provider-to-patient communication pathway
is one of the reasons that could spur obesity if one is prone to it.
Comparison of Research Findings to Literature Review
The findings from this studied were weighed and compared with literature
reviewed in Chapter 2. Some of the findings confirmed that inability to eat healthy foods
has been attributed to factors such as lifestyle, attitudes, and low family income
(Schneider, 2011). Some responses from participants indicated that due to low income the
families make, they did not have too much choice and could only afford cheaper foods
which were not healthy. This is also confirmed by literature as reported by Acheampong
and Halderman (2012), who mentioned that the most common barrier found among low
income earners was the fact that consuming a healthy diet was the cost of healthy foods.
As far as the relationship between income and obesity is concerned, the CDC
(2013) among others, published literature stating that among non-Hispanic African
American and Mexican-American men, those who make higher incomes have a higher
likelihood in becoming more obese than those who make low income. Findings from my
study showed that both a few of the participants who live the zip code known to be more
affluent exhibited such results. This is because some of the participants who live in the
27703 zip codes (high income families) showed results of obesity. For instance

133
Participants 23 and 24 live in this zip code. They make family incomes of $110,000 and
over $120,000 respectively. They also have a BMI of 38 and 34 respectively. This agreed
with the CDC (2013)’s report. However, it could be inferred that those who make lower
family incomes showed increased obesity, and this was consistent with Berkman and
Kawachi’s (2000) statement that African Americans who make lower income are subject
to higher obesity rates.
In terms of lack of physical activity, which contributes to obesity, Wiley (2013)
indicated that the absence or lack of physical activity due to reduced physical education
in schools to almost doing nothing but rather sitting in front of computers and other
electronic gadgets all day have led to decrease in the number of calories people extend
currently, which in effect have increased rates of obesity. In the light of the study by
Wiley, my study found that participants living in low income areas did not have adequate
means to resources such as gymnasium, swimming pool, and safe walking trails that
promote engaging in the recommended physical activity. Wang and Beydoun (2007) also
indicated that health study had shown that low income, lower-SES and minority
population groups African Americans had less access to facilities that provided physical
activities, “which in turn was associated with decreased physical activity and increased
overweight” (p. 24). Therefore, my study confirms results obtained from literature.
Moreover, Smith and Flowers (2009) showed that African Americans and Hispanics’
households possess less wealth at almost every income level. According to Smith and
Flowers, on the average, African Americans earn 27 cents to a dollar of wealth compared
to that of a middle-aged Caucasians household. Even in the category of incomes for

134
households that have income at the top quintile, African Americans are noted to have
56% less the net worth, while Hispanics households’ was 67% less net worth than white
households (Smith & Flowers, 2009).
In terms of attainment of higher education or the lack thereof in affecting obesity,
Wang and Beydoun (2007) noted that within the past 30 years, the United States has
experienced a considerable rise in the prevalence of obesity, which has contributed to a
public health crisis. According to Wang and Beydoun, there has been an increasing body
of evidence that has reported tremendous disparities among population groups and the
on-going changes that are associated with patterns that include the epidemic of obesity in
the United States. They indicated that overall, the less educated persons (those who had
less than high school education) had a prevalence of obesity that was higher than their
counterparts, except African American women. African American women with less than
high school education were reported to have lowest prevalence of obesity as compared to
those who had seemingly higher educational attainments (Wang & Beydoun, 2007). This
information from literature confirms my findings because most of the participants in the
low income group lack higher education- most did not get any higher than the 12th grade.
In their descriptive study on nutrition, knowledge, attitudes, beliefs, and self-
efficacy among low-income African Americans and Hispanic women, Acheampong and
Halderman (2013) found that low income, low SES plays a significant role among
minorities and immigrants. Low SES was noted to correlate to poor health, which could
possibly lead to cardiovascular diseases and other obesity-related illnesses among African
Americans and Hispanics (Acheampong & Halderman, 2013). This report agrees with my
135
findings in that the participants with the highest BMI were from the zip code with lowest
family income. Participants 9 and 13 recorded the highest BMI of 47 and 63 respectively.
In terms of the consumption of fruits and vegetables, Schneider (2011)
emphasized that the intake of fruits and vegetables was hardly patronized by people of
lower income, especially African Americans. In spite of a growing body of literature that
has revealed the benefits of diets high in fruits and vegetables, it has been noted that most
African Americans eat lesser than the recommended amount of such foods. Most of the
participants interviewed indicated that eating fruits and vegetables was part of their eating
habits. Participants 17 indicated that his family consumed about seven to eight servings a
day. This this finding did not confirm literature as noted by Schneider (2011).
As far as consumption of fast foods and the distances lived in proximity to FFR,
Reitzel et al. (2013) reported that FFR density in the distances of half a mile, one mile,
and two miles was positively associated with increased BMI among subjects who had
lower incomes (p ≤ 0.025) and their results supported the fact that African Americans
living in that proximity with lower income had their BMI affected. Twenty-five
participants indicated that they lived in close proximity to FFR. One participant, who
lived in the low income zip code, remarked that she lived only a few minutes’ walk from
a FFR. It is a possibility that living near a FFR may influence or increase obesity among
the consumers.
Theoretical Considerations
As provided in Chapter 2, the theoretical model that was chosen for this study was
the HBM. This was chosen because of its ability to explain various health behaviors

136
(Mckenzie, Neiger, & Thackeray, 2009). The HBM is recorded as one of the most
frequently used theory in the application of health behaviors. It is a value-expectancy
theory that was developed during the 1950s by psychologists in attempt to explain the
reason why people would use or not use available health services (Mckenzie et al., 2009).
According to Mckenzie et al. (2009), the HBM stands on three pillars of
hypotheses, which are:
1. The existence of sufficient motivation (health concern) to make health issues
salient or relevant;
2. The belief that one is susceptible (vulnerable) to a serious health problem or to
the sequelae of that illness or condition. This is often termed perceived threat,
and:
3. The belief that following a particular health recommendation would be
beneficial in reducing the perceived threat and at a subjectively acceptable
cost (p.171).
With reference to the HBM, Schneider (2011) also mentioned that it is a model
that helps to explain how people’s behavior is affected by their own beliefs. Schneider
pointed out that for individuals to change their behavior towards something there must be
a belief in personal threat. This means the individual must be susceptible to some
condition or threat, which is low income and obesity. Schneider also implied that for
people to overcome a behavior, they should have a belief in response efficacy, meaning
that there is something they can do to alleviate or eliminate the source of threat.
Reflecting on this research and the responses recorded, participants and for that matter

137
African Americans must be aware that embarking on certain life changes such as
attaining a higher education, obtaining a better job, making more income, eating the right
balanced diet and engaging in the recommended amount of physical activity would help
to curb or eliminate obesity.
By linking the concepts provided by Mckenzie et al. (2009) and that of Schneider
(2011), this research identified behavioral sources in response to the research questions
that underline this study. In my study, I found that some African Americans have low
academic attainment. Some do not have a high school diploma. Although they can earn
more money, circumstances and excuses might have limited them in obtaining better jobs
due to low education. It was also found that some are complacent with what they earn
and have no motivation to seek better opportunities although several abound in this
country. Responses to other questions used as guide showed that some of the participants
feel threatened or vulnerable to the situation they face such that their health status could
lead to a severe chronic disease. However, there is the belief that following a particular
health recommendation would be beneficial in reducing the perceived threat and at a
subjectively acceptable cost that they can handle. Thus the key factors that contribute to
low family income among African Americans in Durham, NC (target population), and
how the low income contributes to obesity were explained by the HBM. The HBM
helped to explain the threat posed to the target population, how the target population
might be threatened by this, and the efficacy or solution they could adopt and display to
counteract this situation.

138
Health Belief Model and Obesity
Ozden (2011) wrote that the HBM is considered one of the oldest social cognition
models (Ozden, 2011). Ozden postulated that one of the astute goals of the HBM is to
predict if individuals will choose to be engaged in an action that will serve to reduce their
perceived threat in order to reduce the chances of long term effect or death. The HBM
has been known to address how health is affected by beliefs, and how decision processes
lead to behavioral changes (Ozden, 2011). For instance if a participant feels overweight
or obese, that feeling jeopardize him/her to have inferiority complex and shun away from
other people. The individual could conclude that there is nothing that could salvage
his/her condition. That complex could either make the individual decide to stay in that
state or might be motivated to find strategies to overcome this belief. This may include
adopting a regime of physical activities, eating right, and visiting a healthcare provider
for help.
Ozden (2011) mentioned that there are two main types of beliefs that influence
people towards taking preventive actions. These are: (a) Beliefs that are related to
people’s readiness to take action, and (b) beliefs that are related to modifying factors that
either facilitate or inhibit an individual’s action (p. 533). Beliefs such as “African
Americans always make low income, do not obtain good employment, destined to make
low income, do not live in good neighborhoods, or they cannot lose weight” (Ozden,
2011, p. 533) could be overcome by the right attitude and practically acting to change
one’s lifestyle. This is consistent with Ozden’s study that showed the development of a
scale based on the HBM, which provided a positive valid and reliable evaluation of obese

139
people’s beliefs and attitudes as far as obesity was concerned. It therefore stands to
reason that when it comes to obesity, an individual’s beliefs and attitude play a major
role.
In support of Ozden’s (2011) study, Daddario (2007) also noted that the HBM is
one of the appropriate models that helps individuals with beliefs and behavior change.
She intimated that obesity is one of America’s most serious epidemics. She mentioned
that behavior change models, such as HBM are very important for prevention of weight
gain and ultimately a goal for living healthier lives. The themes analyzed from this study
indicate that the HBM expatiates and seeks to address the effects of the beliefs that focus
on health and decisions made by people that eventually lead to behavioral changes. This
can be extrapolated to the decisions that individuals or families make on how their eating
habits, lifestyle, and the income they make can ultimately affect how obese they become.
Relationship to the Proposed Study
The results obtained from this study agree with reviewed literature that obesity
poses a major threat to public health (Daddario, 2007). Obesity and being overweight,
which were once considered as only a problem among countries with high income, are
now higher among low-and middle-income countries, especially those in the urban areas
(Ozden, 2011). The fact that obesity is a precursor to diabetes and cardiovascular disease
makes the disease a national issue. The effects of the obesity among African Americans
are quite an alarming one (Daddario, 2007).
The aim of using the HBM is that knowledge will bring the needed change
(Schiavo, 2007) so that the target population will be empowered with knowledge of
140
attaining higher levels of education, which would ensure better employment, obtaining
higher income, changing their eating habits, and ultimately decreasing the prevalence of
obesity. These are rooted in Wilson et al.’s (2008) study that proved that the ability and
readiness of consumers to take action about their life’s situation are governed by factors
such as knowledge of perceived susceptibility threat, perceived benefit of the strategies
needed to improve their situation or to promote their health, and any cues that eventually
motivate them to take action.
Limitation of the Study
This study was limited to 30 African Americans who were recruited from three
zip codes in Durham, NC. The minimum age for qualification to participate in the study
was 18 years. Therefore the results obtained cannot be generalized to all African
Americans in the United States or to other races. The study was also limited to a
qualitative type of design and phenomenology was the approach used to complete this
study. A face-to-face approach of interviewing the participants was used to obtain
responses of their lived experiences. The integrity of the responses could only be
measured by the honesty of the participants. No assumptions were taken into
consideration as far as the responses provided by the participants. The validity of
responses and data collected were all based on the code of ethics and honesty. With the
size of the participants used, the study was limited by such number and it is likely
responses from other people not interviewed could have led to different results. Because
the participants responded to some questions relying on memory, recollection bias to
141
providing accurate family income earned annually and other demographics might have
occurred.
Recommendations
My recommendations based on the findings from my study come in the form of a
clarion call to action. Based on the income that most African Americans make, it is
recommended policy makers will consider raising the national minimum wage across the
board. This has been a debate that has come up before Congress, but effective measures
are yet to be implemented.
It is also my recommendation that healthcare practitioners, health educators,
public officers, researchers, and those involved in providing quality healthcare to the
populace should consider using the interpretation and findings of this study to craft better
programs that would benefit the target population and the nation as a whole. The findings
from my study showed that families that earn low income often cannot afford to live in
neighborhoods or localities that have adequate amenities that encourage physical
activities such as gymnasia, safe walking trails, swimming pools, and other resources that
promote healthy lifestyle. Such neighborhoods are often built without consideration for
recreational amenities and provision for equipment and walking trails for residents to use.
It is therefore a recommendation that future building codes should include provision of
areas designed for residents to use for physical activities. Future research could also
expand on whether the presence of amenities and resources available in any locality
enhances physical activities that help to reduce obesity among African Americans.

142
The findings from my study also showed that majority of participants are not
enrolled in any academic program. Some have only high school diploma, while others
lack that. Thus the creation of vocational courses and programs that can enhance the
skills of these group of people will go a long way to change their lifestyle by enabling
them earn more income upon graduation. The notion that African Americans do not attain
higher education or do not obtain employment should be erased from the minds of
African Americans.
It is also my recommendation that African Americans would desist from
consuming too much fast foods. The fact that one lives near a FFR does not imply eating
from there every day. It is mostly rooted in discipline and an attitude to do right.
Literature reviewed on this study reveal that increasing the serving sizes of salads can be
helpful and healthy for the body. It is recommended that healthcare providers will help
their patients make this a daily habit. Healthcare providers should also stress the need for
African Americans to be engaged in the recommended amount of physical exercise.
Walking for three minutes as one participant mentioned is not enough to uproot obesity.
The ability to see family healthcare provider is also a habit that African Americans must
do more. This has the ability to detect any signs of a possible “threat” before they become
unmanageable. It is recommended that any unusual body weight, changes in the body
from unforeseen causes must be reported to a healthcare provider immediately. It is also
recommended that African Americans act on any counseling or advice given by their
healthcare providers, especially as pertains to obesity. When people learn to take care of
little problems, the bigger ones will take care of themselves. The scope of this study was

143
limited to three zip codes. Future researchers can expand the target population and find
out how other zip codes play a role in determining the outcome. Future researchers may
also embark on studying the disparity between Caucasians and African Americans living
in the same selected zip codes.
Implication of Social Change
The goal of social change is to produce a transformation that leads to a positive
outcome or change in lifestyle. This can be in the form of individual, family, community,
or the nation as a whole. The social change implication of my study is that the findings
will lead to a positive social change among African Americans and all ethnicities as a
whole. The core of this social change is that participants, whose responses led to these
findings, would be able to apply the principles and the theoretical model to make their
lives better. It is envisaged that African Americans who are prone to making low income
because of low education would be motivated to seek educational opportunities that will
enable them obtain good paying jobs. Because good and higher education has been
known to foster good paying jobs, African Americans who pursue this goal will
ultimately be making enough money to live in places with better amenities that includes
recreational activities and a means to be actively involved in physical activities. The
presence of exercising equipment will be a motivating factor for families to exercise
frequently and for longer duration.
Social change is also geared at arming African Americans with knowledge that
would remind them about the need to eat healthy food that entails a preference to eating
home-cooked meals rather than the food from fast food restaurants. This knowledge will
144
also transcend African Americans horizon of knowing that although choice of what to
shop for and consume depends on family income, skillful decisions can made to the
effect that salads and vegetables can be cheaper than other unhealthy foods if shopped
correctly.
The social change arising from this study is that policy makers would be mindful
of the fact that since the minimum wage is detrimental to the survival of families in that
bracket, some negotiations can be reached to increase such minimum wage to help
families live better. It is envisaged that health providers would make it a matter of
concern and urgency to educate their patients about the need to regularly partake in
medical check-ups and physical examinations. These regular events have the ability to
detect early signs of obesity that lead to chronic diseases. For instance, yearly check-ups
would enable laboratorians and physicians know when a patient’s cholesterol result
begins to rise, or when increased body weights become a problem.
The findings from this study have shown that obesity is affected by the income
families make. Some previous studies have proven that people who make higher income
have greater propensity of having higher obesity rates, whereas other studies have also
demonstrated that those who make lower income, for example African American have
higher obesity rates. My study found a consistency with previous studies indicating that
African Americans make low income and that contributes to their higher obesity rates.
Therefore the use of the HBM can benefit families by their knowledge of the possible
threat that might stand before them and the strategy they have to adopt to defeat such a
145
threat. With knowledge producing good attitudes, the target population will be
empowered to make changes to their lifestyle.
Conclusion
Obesity is a chronic disease that is caused by a number of factors such as diet,
genetics, physical inactivity, and poor dietary habits. This qualitative research focused on
how income affects obesity among a target population in the African American
community in Durham, NC. The sample size for this study was 30. The gap in literature
that prompted this study stemmed from two important previous research findings. The
CDC (2011) reported that those who make higher income have higher rates of obesity.
Berkman and Kawachi (2000) did mention that African Americans earn very low income
and thus subject to higher rates of obesity. Other studies of concern to obesity included
the study by Wang and Beydoun (2007) ,who found that obesity prevalence in the low
SES group among Caucasian men decreased during 1988-1994 and 1999-2002, while
within the same time frame, the prevalence of obesity showed a considerable higher rate
increase among low SES African American men in comparison with other SES groups.
The theoretical framework for this study was the health belief model and
phenomenology as the methodology that helped to capture the lived experiences of the
participants. The responses from the participants were coded and analyzed as themes,
which became the pillars that helped to answer the two research questions of this study.
The findings from this study agreed with majority of previous studies that indicate that
African American families make low income and this affects them disproportionately as
far as where to live, what to eat, and the kind of job opportunities opened to them. This
146
study found that some African Americans live only on government subsidies such as
housing and welfare checks for subsistence living. Most of the areas they live do not
boast of equipment for engaging in physical activities or safe walking trails. These have
contributed to an ethnic population that is overweight or experiencing obesity. The study
also revealed how the BMI values might be related to the participants’ annual income and
the zip codes in which they live. The results were also a reflection of how the income
earned and the zip codes these participants live contribute to obesity and subsequently
their health.
Some of the recommendations that if acted upon could bring a positive social
change include policy and law makers advocating for an increase in the national
minimum income wage to help African Americans make a better living. Healthcare
providers could intensify their counseling to their affected patients of overweight or
obesity to engage in rigorous health consciousness that involves eating the right balanced
diet, exercise more based on national recommendation, and for individuals and families
to strive to increase their academic attainment by enrolling in other academic programs
that would give them vocational and skills to earn better employment opportunities.
This study was limited to 30 participants in one city of a state and so findings are
but a mirror image of what might exist on larger scale, but not entirely representative of
the entire country. However, the application of the recommendations could be applied
throughout the United States to bring about a positive social change. This means that the
study can be extrapolated beyond the target population by future researchers.
147
Obesity has been a public health problem and certainly an epidemic worldwide
(Chan & Woo, 2010). There is a plethora of studies that have shown that obesity and
overweight are major causes of co-morbidities such as type II diabetes, cardiovascular
diseases, various cancers, and other health related problems that have led to morbidity
and mortality (Chan and Woo, 2010). The WHO (2009) reported that there would be
over 700 million obese people worldwide in 2015. This comes with a relative health care
cost. Therefore a positive social change recommended through the findings of my
research will save individuals, families, and the government huge amounts of healthcare
cost. A positive social change in the lives of African Americans would enable them to
take good care of themselves in the form of engaging in the recommended amount of
physical activity. As African Americans get empowered through educational attainments
and obtaining better paying jobs, they would be in a position to create better living
conditions for themselves. Therefore a positive social change will challenge African
Americans to increase their efforts in engaging in regular physical activity, make
informed decisions on consumption of high dietary intake of fiber instead of high intake
of energy-dense foods, and endeavor to live in homes and school environments that
promote healthy choices of food for the entire family.
There have been numerous epidemiological studies that have demonstrated the
relationship between obesity and the range of chronic diseases associated. Using a public
health approach to create population-based strategies for the prevention of excessive
overweight and obesity would go a long way to save lives that are lost through obesity
related diseases. These strategies should target changes in personal lifestyles,

148
environmental, and socioeconomic factors. A strategic implementation of these policies
will help in producing a positive social change among African Americans, and the nation
as a whole. Prevention and measures of reducing overweight and obesity seem to depend
to a large extent on the lifestyle of individuals and the changes that could be made. Thus
future research should focus on motivational factors that lead to encouraging and
empowering individuals to work towards behavioral changes.
The social change implication for public health epidemiology associated with
behavioral and policy changes would among many include a dramatic reduction of
overweight and obesity rates, decreased health care cost. Moreover, chronic diseases
caused by obesity would be reduced or controlled, individuals who are subject to low
self-esteem due to obesity would regain their confidence and live fulfilling lives, and the
millions of dollars spent on obesity related diseases could be appropriated for other
beneficial ventures.

149
References
Acheampong, I., & Halderman, C. (2013). Are nutrition knowledge, attitudes, and beliefs
associated with obesity among low-income Hispanic and African American
Women caretakers? Journal of Obesity, 2013(2013), 1-8. doi:
10.1155/2013/123901
Arfken, C. L. (1996). Obesity in inner city-African Americans. Ethnicity and Health,
1(4), 317-326. doi: 10.1080/13557858.1996.9961801
Bartholomew, J. B., Miller, B. M., Ciccolo, J. T., Atwood, R., & Gottlieb, N. H. (2008).
Walk Texas 5-a-day intervention for women, infant, and children (WIC) clients.
A quasi-experimental study. Journal of Community Health, 33, 297-303. doi:
10.1007/s10900-008-9103-y
Berkman, L. F., & Kawachi, I. (2000). Social epidemiology. New York, NY: Oxford
University Press.
Bragg, M. A., Tucker, C. M., Kaye, L. B., & Desmond, F. (2009). Motivators of and
barriers to engaging in physical activity: Perspectives of low-income culturally
diverse adolescents and adults. American Journal of Health Education, 40(3),
146-154. doi: 10.1080/19325037.2009.10599089
Burke, M., & Heiland, F. (2008). Race, obesity, and the puzzle of gender specificity.
Working Paper Series, 8(8), 1-102. Retrieved from
http://ehis.ebscohost.com.ezp.waldenulibrary.org/eds/pdfviewer/pdfviewer?sid=0
2183f14-a36c-4bbe-8b39-cde32b7ea4cd%40sessionmgr4003&vid=3&hid=4205
Caballero, B. (2007). The global epidemic of obesity: An overview. Epidemiology

150
Review, 29(1), 1-5. doi: 10.1093/epirev/mxm012
Centers for Disease Control and Prevention. (2013). Overweight and obesity. Retrieved
from http://www.cd.gov/obesity/data/adult.html
Chan, R. S., & Woo, J. (2010). Prevention of overweight and obesity: How effective is
the current public health approach. International Journal of Environmental
Research and Public Health. 7(3), 765-783. doi: 10.3390/ijerph7030765
Creswell, J. W. (2009). Research design. Qualitative, quantitative, and mixed methods
approaches. Los Angeles, CA: Sage Publications Inc.
Crosby, R. A., DiClemente, R. J., & Salazar, L.F. (2006). Research methods in health
promotion. San Francisco, CA: Jossey- Bass.
Daddario, D. K. (2007). A review of the use of the health belief model for weight
management. MEDSURG Nursing, 16(6), 363-366.
Delgado, A. N. (2013). Why include a phenomenological analysis in a research course?
Psicotherma, 25(2), 227-231. Retrieved from
http://ehis.ebscohost.com.ezp.waldenulibrary.org/eds/pdfviewer/pdfviewer?sid=8
cace358-fcb4-4d3f-b9c0-8597dd5b41ab%40sessionmgr4001&vid=8&hid=4102
Demment, M. M., Haas, J. D., & Olson, C. M. (2014). Changes in family income status
and the development of overweight and obesity from 2 to 15 years: A longitudinal
study. BMC Public Health, 14, 417. doi: 10.1186/1471-2458-14-417
Dulia-Keita, A. Thind, H. K., Affuso, O., & Baskin, M. L. (2013). The associations of
perceived neighborhood disorder and physical activity with obesity among
African American adolescents. BMC Public Health, 13, 440. doi: 10.1186/1471-
151
2458-13-440
Gary, T. L., Gross, S. M., Browne, D. C. & LaVeist, T. A. (2006). The college health and
wellness study: Baseline correlates of overweight among African Americans.
Journal of Urban Health, 83(2), 253-265. doi: 10.1007/s11524-005-9026-1
Gee, J., Loewenthal, D., & Cayne, J. (2013). Phenomenological research. The case of
empirical phenomenological analysis and the possibility of reverie. Counseling
Psychological Review, 28(3), 2-61.
Gordon-Larsen, P. (2003). The relationship of ethnicity, socioeconomic factors, and
overweight in U.S. adolescents. Obesity Research, 11(4), 597. doi:
10.1038/oby.2003.20
Gregg, M. (2008). Field epidemiology (3rd ed.). New York, NY: Oxford University
Press, Inc.
Kumanyika, S., Whitt-Glover, M. C., Gary, T., Prewitt, T. E., Odoms-Young, A. M., &
Samuel-Hodge, C. D. (2007). Expanding the obesity research paradigm to reach
to African American communities. PubMed Central, 4(4), A112. Retrieved from
http://www.ncbi.nlm.nih.gov/pmc/articles/PMC2099277/
Low, S., Chin, M. C., & Deurenberg-Yap, M. (2009). Review on epidemic obesity.
Annals Academy of Medicine. 38(1), 57-60.
Lucan, S. C., Barg, F. K., Karasz, A., Palmer, C. S., & Long, J. A. (2012). Perceived
influences on diet among urban, low-income African Americans. American
Journal of Health Behavior, 36(5), 700-710. doi: 10.5993/ajhb.36.5.12
Mason, M. (2010). Sample size and saturation in PhD studies using qualitative

152
interviews. Forum: Qualitative Social Research, 11(3), Art. 8. Retrieved from
http://www.qualitative-research.net/index.php/fqs/article/view/1428/3027
Mendez, M. A., Cooper, A. L., Wilks, R., Bennett, F., & Forrester, T. (2004). Higher
income is more strongly associated with obesity than with obesity-related
metabolic disorders in Jamaican adults. International Journal of Obesity, 28, 543-
550. doi:10.1038/sj.ijo.0802584
Moustakas, C. (1994). Phenomenological research methods. Thousand Oaks, CA: Sage
Publication.
North Carolina Behavioral Risk Factor Surveillance System Survey, NC. State Center of
Health Statistics, NC: Department of Health and Human Services. (2007, 2008).
The burden of obesity in North Carolina. Retrieved from
www.schs.state.nc.us/SCHS/brfss
North Carolina Center for Health Statistics and Office of Minority Health and Disparities.
(2010). North Carolina minority health facts: African Americans. Retrieved from
http://www.schs.state.nc.us/SCHS/pdf/AfricanAmer_FS_WEB_080210.pdf
North Carolina State Board of Education, Department of Public Instruction, Program
Monitoring and Support. (2008). Dropout reports: 2005-06 & 2007-08. Retrieved
from www.ncpublicschools.org/dropout/reports.
Novick, L., Morrow, C. B., & Mays, G. (2008). Public health administration. Principles
for population-based management. Sudbury, MA: Jones and Bartlett Publishers.
Office of Minority Health and Health Disparities and State Center for Health Statistics.
(2010). Racial and ethnic health disparities in North Carolina. Retrieved from
153
http://www.eatsmartmovemorenc.com/Data/Texts/NC-Health-Disparities-Report-
Card_2010.pdf
Ozden, D. (2011). Development and evaluation of health belief model scale in obesity.
TAF Preventive Medicine Bulletin, 10(5), 533-542. doi:
10.5455/pmb.20110118022318
QSR NVivo 10 Software. (2014). Doncaster, Australia: QSR International Pty. Ltd.
Reitzel, L. R., Regan, S. D., Strong, L. L., Wetter, D. W., & Mcneill, L. H. (2013).
Density and proximity of fast food restaurants and body mass index among
African Americans. American Journal of Public Health,104(1), 110-116. doi:
10.2105/ajph.2012.301140
Roberts, T. (2013). Understanding the research methodology of interpretative
phenomenological analysis. British Journal of Midwifery, 21(3), 215-218. doi:
10.12968/bjom.2013.21.3.215
Robinson, T. (2008). Applying the socio-economic model to improving fruit and
vegetable intake among low-income African Americans. Journal of Community
Health, 33(6), 395-406. doi: 10.1007/s10900-008-9109-5
Rudestam, K. E., & Newton, R. R. (2007). Surviving your dissertation (3rd ed.). Los
Angeles, CA: Sage Publications.
Samani-Radia, D., & McCarthy, H. D. (2011). Comparison of children’s body fatness
between two contrasting income groups; contribution of height difference.
International Journal of Obesity, 35(1), 128-133. doi: 10.1038/ijo.2010.116
154
Sapp, S.G., & Weng, C. (2007). Examination of the health belief -model to predict the
dietary quality and body mass of adults. International Journal of Consumer
Studies, 32, 189-194. doi: 10.1111/j.1470-6431.2006.00500.x
Schneider, M-J. (2011). Introduction to public health (3rd ed.). Sudbury, MA: Jones and
Bartlett Publishers.
Smith, J. A., Flowers, P., & Larkin, M. (2009). Interpretative phenomenological
analysis: Theory, method, and research. London, England: Sage Publications Ltd.
Sobal, J. (2008). Group dieting, the stigma of obesity, and overweight adolescents.
Retrieved from http://www.tandfonline.com/doi/abs/10.1300/j002v07n01_04
St. Rose, M., & Wilson, R. (2009). Chronic diseases among African Americans in
southeastern Virginia: A pilot study. Norfolk, VA: Blackwell Publishing. doi:
10.1111/j.1752-9824.2009.01016.x
Subramanian, S.V., & Kawachi, I. (2004). Income inequality and health: What have we
learned so far? Epidemiology Review, 26, 78-91. doi: 10.1093/epirev/mxh003
Troiano, R. P., & Flegal, K. M. (1998). Overweight children and adolescents:
Description, epidemiology, and demographics. Pediatrics, 101(3), 497-504.
U. S. Census Bureau (2003). Socio-economic contrast charts: Census 2000 summary file
3-sample data. Retrieved from
http://www.fairdata2000.com/SF3/contrast_charts/index.html
U. S. Census Bureau (2008). American community survey, 2004 and 2008 summary
tables. Retrieved from http://factfinder.census.gov/home/saff/main.html/_lang=en

155
U. S. Census Bureau (2011). National and state population estimates. Retrieved from
http://www.census.gov/#.
U. S. Census Bureau (2012). Where do you fall in the American economic class system?
Retrieved from http://money.usnews.com/money/personal-
finance/articles/2012/09/13/where-do-you-fall-in-the-american-economic-class-
system.
U. S. Census Bureau. (2013). Measuring America- people, places, and our economy.
Durham, NC. Retrieved from
http://quickfacts.census.gov/qfd/states/37/37063.html
Wang, Y., & Beydoun, M. A. (2007). The obesity epidemic in the United States-gender,
age, socio-economic, racial/ethnic, and geographical characteristics: A systematic
review and meta-regression analysis. Epidemiologic Reviews, 29, 6-28. doi:
10.1093/epirev/mxm007
Weedn, A. E., Ang, S. C., Zeman, C. L., & Darden, P. M. ( 2012). Obesity prevalence in
low- income preschool children in Oklahoma. Retrieved from
http://web.ebscohost.com.ezp.waldenulibrary.org/ehost/pdfviewer/pdfviewer?sid=
aa5aca4a-60b3-4fa8-b10c-15a44daa45ee%40sessionmgr110&vid=4&hid=112.
Wiley, A. (2013). Obesity history in America. Retrieved from www.livestrong.com
World Health Organization (2008). Fact sheet: Obesity and overweight. Retrieved from
http://www.who.int/mediacentre/factsheets/fs311/en/print.html
World Health Organization (2009). Fact sheet: Obesity and overweight. Retrieved from
http://www.who.int/mediacentre/factsheets/fs311/en/print.html

156
Appendix A: Sample Letter to Participant
Date:
Dear (Participant),
My name is Charles Boison. I am a doctoral student at Walden University, and currently
involved in a dissertation research addressing the relationship between family income and
obesity among African Americans. This study is being performed as a partial fulfillment
of the requirements for my Ph.D. degree in Public Health at Walden University under the
supervision of Dr. Raymond Panas.
Your assistance in contributing to this study will provide useful information on this topic.
I am seeking individuals who are 18 years of age or above and of African American
descent. If you agree to participate, you will be involved in one (1) interview to answer
questions on the topic and a follow-up to review your responses, each of which will take
approximately 30 minutes. You will also be asked to complete a background
questionnaire on some demographics such as height, weight, age, and annual family
income.
I have included my contact phone number in this letter. I would welcome any phone call
from you to discuss any questions that may be of concern to you or needs clarification in
this study. You may also reach me via email at XXXXXXXXXX.
Sincerely,
Charles Boison
Doctoral Candidate
Walden University
XXXXXXXXX

157
Appendix B: Format of Interview
Date: __________________________
Place: _______________________
Interviewer: _______________________________________________
Interviewee: __________________________________________________
1. Are you 18 years and older?
2. What is your age?
3. What is your gender?
4. What is your height and weight?
5. What is your zip code?
6. How many people are in this household?
7. Are you married or single?
8. Are you currently employed?
9. How many people in your household earn income?
10. What is the range of your family income, example, <10,000; 10,000-20,000
11. Do you rent or own your home?
12. What foods do you eat most of the time?
13. Do you live near a Fast Food Restaurant (FFR)?
14. Do you prefer eating in a FFR than cooking your own meal?
15. Is your choice of food and how you shop for food related to the amount of money
you earn?

158
16. How many servings of salad or fresh produce do you eat a day?
17. Are you satisfied with the income you make annually?
18. If not, what are the reasons why you do not make as much as you would like?
19. What is your highest grade of school education?
20. Are you currently attending some academic program to better your life or income?
21. Do you feel overweight or obese?
22. How many times a week do you exercise?
23. How long do you exercise in one session?
24. What forms of exercise do you engage in?
25. Do you have any form of equipment or resources for exercising in your residential
area?
26. How often do you visit your doctor for checkup?
27. When was the last time you had a cholesterol check?
28. What was your last cholesterol result?
39. Has your doctor ever told you that you have high cholesterol?
30. Has your doctor ever mentioned to you that you are overweight or obese?
31. Has your doctor told you that you have high blood pressure or any chronic disease?

159
Appendix C: Consent Form
Informed Consent Form to Participate in Research
Relationship between Family Income and Obesity among African Americans
Walden University
You are being invited to participate in a research that seeks to evaluate the relationship
between family income and obesity among African Americans in Durham, NC. You are
qualified to be a participant in this study because of the fact that you are an African
American and you live in the area designated for this study. Please take some time to read
this letter and if you have any questions, you may ask before proceeding to act on this
invitation to participate in the study. The study is being conducted by Charles Boison,
Doctoral Candidate at Walden University.
Background Information:
This study is being conducted to find out whether the income earned by African
American families contributes to obesity. Your personal experiences as far as how much
income your family earns, where you live, and the resources available to you will be
helpful to this study.
Procedures:
If you are willing to participate in this study, you will be involved in one interview and
one follow up to review responses in a location that is convenient, private, and safe for
you. Interviews will last about 30 minutes for each session. In order not to miss any or
misrepresent your responses, the interview may be audio recorded.
Participation in this study is strictly voluntary. You are free to exit the study at any time if
you choose not to continue. Although your contribution to this study will greatly lead to a
positive social change, you are not obligated to continue should you feel the need to
withdraw.
Risks and Benefits of Being in the Study:
This study has the potential of providing a social change in how income and lived
experiences may be related to obesity. It is anticipated that there will be minimal or no
risks associated with participating in this study. You may seek clarification on any
question that is not clear before answering it. Please contact your primary care physician,
or you may contact the Durham, NC hotline if you have additional questions or concerns.
Compensation:
No form of coercion is involved in this study. There will be a $5 gift card for your time
and willingness to participate in this study.

160
Confidentiality:
All records pertaining to this study will be locked and kept private. No report in this
study will identify participants involved in the study and all information will be kept
confidential. All data will be used only for the purpose of this study. Research records
will be filed and kept in a securely locked cabinet. Access will be made possible only to
the researcher. Data obtained for study will be safely locked and analyzed. It will be kept
for minimum of 5 years and thereafter destroyed. Audio recordings will be transcribed for
the study and maintained for 5 years after which they will be destroyed. Audio recordings
will be destroyed upon completion of dissertation or graduation.
Contacts and Questions:
The research is being conducted by Charles Boison. The researcher’s Chairperson or
advisor is Dr. Raymond Panas of Walden University. If you have questions later, you
may contact Charles Boison at (XXX) XXX XXXX. The Research Participant Advocate
at Walden University is Dr. Leilani Endicott. You may contact her at 1-800-925-3368
ext. 3121210 or email at [email protected] should you have questions about this study or
your participation. Walden University’s approval number for this study is 03-09-15-
0157453 and it expires March 8, 2016. The researcher will send you a copy of this form.
Statement of Consent:
I have read and understand the above information. All questions have been explained to
me. I consent to participate in the study.
Printed Name of Participant
__________________________________________
Signature Date
__________________________________________ _______________
Signature of Investigator Date
_________________________________________ _______________