relationship between type a behavior pattern and mental
TRANSCRIPT

Journal of Applied Psychology1991, Vol. 76. No. 2, 276-290
Copyright 1991 by (he American Psychological Association Inc.0021-9010/91/S100
Relationship Between Type A Behavior Pattern and Mental and PhysicalSymptoms: A Comparison of Global and Component Measures
Jeffrey R. Edwards and A. J. Baglioni, Jr.Darden Graduate School of Business Administration
University of Virginia
Although the Type A behavior pattern (TABP) is typically considered a set of distinct components,
most studies of TABP have used global measures, which collapse several components into a single
index. These measures are inherently multidimensional and, as such, contain several conceptual
and methodological problems. In this study, data from 240 executives were used to compare global
and component TABP measures as predictors of mental and physical symptoms. Global measures
included the Bortner scale, the Framingham scale, and the Jenkins Activity Survey Component
measures were constructed by recombining items from the global measures on the basis of results
from previous confirmatory factor analyses (Edwards, Baglioni, & Cooper, 1990). Results indicate
that the component measures were superior to the global measures in terms of number of relation-
ships detected, interpretability, and total explanatory power. Implications for research and practice
are discussed.
Over the past 30 years, an enormous amount of research hasbeen focused on the role of the Type A behavior pattern (TABP)in the development of psychological and physical illness. TABPis denned as a set of interrelated behaviors reflecting impa-tience, time urgency, competitiveness, achievement striving, ag-gressiveness, and hostility (Friedman & Rosenman, 1974;Glass, 1977; Jenkins, Zyzanski, & Rosenman, 1979). Thoughsomewhat mixed, available evidence suggests that TABP is as-sociated with increased illness, particularly coronary heart dis-ease (CHD) (Booth-Kewley & Friedman, 1987; Matthews,1988).
Although TABP is typically conceptualized in terms of sev-eral distinct components, most empirical TABP research hasemployed global TABP measures, which reflect some mixtureof these components (e.g., Bortner, 1969; Haynes, Levine,Scotch, Feinleib, & Kannel, 1978; Jenkins et al, 1979; Rosen-man, 1978). Because they collapse multiple components into asingle index, these measures are inherently multidimensionaland, as such, are prone to several conceptual and methodologi-cal problems. For example, the overall interpretation of thesemeasures is confounded because it is impossible to determinethe relative contribution of different components to the overallscale score (cf. Burt, 1976; Gerbing & Anderson, 1988; Wolins,
This research was supported in part by the Darden Graduate Busi-
ness School Foundation. We gratefully acknowledge the DardenSchool Executive Program staff for their cooperation, Carol Steele Le-
May for her assistance in data base management, Mary Darnell for her
administrative assistance, JamesSteiger for his statistical consultation,
Norm Bonn for his data analysis assistance, Art Weltman for providing
access to the physical health data, and two anonymous reviewers forcomments on an earlier draft of this article.
Correspondence concerning this article should be addressed to Jef-
frey R. Edwards, Darden Graduate School of Business Administra-
tion, University of Virginia, P.O. Box 6550, Charlottesville, Virginia22906-6550.
1982). Furthermore, these measures conceal relationships asso-ciated with specific TABP components, some of which arestronger predictors of CHD than others (Booth-Kewley &Friedman, 1987; Matthews, 1988). Finally, these measures vio-late assumptions of widely used statistical techniques derivedfrom classical measurement theory, such as reliability estima-tion (Hattie, 1985; Novick & Lewis, 1967; Nunnally, 1978), andfail to meet necessary conditions for construct validity (Gerb-ing & Anderson, 1988). Despite these drawbacks, the vast ma-jority of empirical TABP research is based on global measuresof TABP, with little mention of the problems associated withtheir inherent multidimensionality.
The purpose of this study was to compare the utility of globaland component measures of TABP. We used the Bortner scale(Bortner, 1969), the Framingham scale (Haynes et al, 1978),and the Jenkins Activity Survey (JAS; Jenkins et al,, 1979) asglobal measures of TABE Following the procedure of Edwards,Baglioni, and Cooper (1990a), we recombined items from thesemeasures to construct two sets of TABP component measures,one drawing from each global measure separately, and anotherdrawing from all global measures collectively. We then com-pared these measures as predictors of mental and physicalsymptoms, using number of relationships detected, interpret-ability, and total explanatory power as criteria.
Global and Component Measures of TABP:A Summary of the Evidence
Empirical TABP research has relied almost exclusively onglobal measures. This is exemplified by three major prospectivestudies of TABP and CHD initiated in the 1960s and 1970s(French-Belgian Collaborative Group, 1982; Haynes, Feinleib,& Kannel, 1980; Rosenman et al, 1975), in which the Struc-tured Interview (SI; Rosenman, 1978), the Bortner scale(Bortner, 1969), the Framingham scale (Haynes et al., 1978), theJAS (Jenkins et al, 1979), or some combination thereof were
276
COMPARING GLOBAL AND COMPONENT TYPE A MEASURES 277
used. These studies demonstrated modest but significant rela-tionships between global TABP and the prevalence and inci-dence of CHD, though the relationships were somewhat depen-dent on age, gender, length of follow-up, and type of CHD.More recent evidence challenges the conclusiveness of thesefindings, indicating that the relationship between self-reportmeasures of global TABP and CHD is limited primarily tocross-sectional studies, whereas the relationship for the SI isevident in both cross-sectional and prospective studies (Booth-Kewley & Friedman, 1987; Matthews, 1988).
Though component measures of TABP have been used in fewstudies, the results of several studies suggest that certain compo-nents exhibit stronger relationships with CHD than others.Most of these studies have been focused on speed, job involve-ment, and competitive drive, perhaps because of the availabilityof scales within the JAS that purportedly measure these compo-nents (Jenkins et al, 1979). Cross-sectional studies in whichthese scales have been used have found significant relationshipsfor speed and competitive drive, but prospective studies havefailed to detect these relationships (Booth-Kewley & Friedman,1987; Matthews, 1988). In several studies, measures of anger,hostility, and aggression have been incorporated, for example,the Spielberger State-Trait Anger Inventory (Spielberger et al.,1985), the anger scales from the Framingham study (Haynes etal., 1978), the Cook-Medley Hostility Inventory (Cook & Med-ley, 1954), the potential hostility rating derived from the SI(Dembroski, 1978), and the Hostility and Aggression scalesfrom the Buss-Durkee Inventory (Buss & Durkee, 1957). Over-all, the results of these studies suggest cross-sectional relation-ships with CHD for anger and hostility and a prospective rela-tionship for hostility (Booth-Kewley & Friedman, 1987; Mat-thews, 1988).
In summary, evidence linking global TABP and CHD is in-consistent for self-report measures but fairly robust for the SI.Evidence regarding TABP components is somewhat inconclu-sive, though a growing number of studies implicate hostility as acritical component in the prediction of CHD. The inconsistentresults obtained for global self-report TABP measures are proba-bly due, in part, to the inherent weaknesses of global measures,particularly their ambiguous interpretation and their tendencyto conceal relationships associated with specific components.Though the SI also measures global TABP, it diners from self-report global measures because it contains a strong hostilitycomponent (Matthews, 1983). Evidence suggests that this com-ponent is largely responsible for the association between the SIand CHD (Dembroski, MacDougall, Shields, Petitto, & Lu-shene, 1978; Dielman et al., 1987; Matthews, Glass, Rosenman,& Bortner, 1977). Unfortunately, relationships associated withcomponents contained within self-report measures of globalTABP have been examined in very few studies. Though the JASscales have been widely used as component TABP measures,recent evidence suggests that these scales are, in fact, multidi-mensional, and are therefore prone to the same problems asglobal TABP measures (Begley & Boyd, 1985; Edwards et al,1990a; Shipper, Kramer, Reif, & Lewis, 1986). Furthermore,only a limited number of components have been examined inmost studies, typically some subset of speed, job involvement,competitive drive, and hostility. In the present study, we ex-
tended existing research by constructing unidimensional mea-sures of 15 TABP components obtained from the Bortner scale,the Framingham scale, and the JAS and by evaluating the utilityof these measures as predictors of mental and physical symp-toms.
Method
Sample
The sample consisted of 756 executives who attended a 6-week sum-mer executive program from 1983 to 1989 at a major graduate business
school in the eastern United States. During the program, each execu-
tive received a survey containing the Bortner scale, the Framingham
scale, the JAS, and various measures of stress, coping, and mental and
physical symptoms. Each executive was also invited to participate in a
physiological screening in which serum cholesterol, blood pressure,
and heart rate were measured. A total of 404 executives returned com-
pleted surveys, and of these, 254 provided complete physiological data.
Because of the small proportion of female respondents (5.5%) and po-tential gender differences on the physiological measures, only male
respondents were retained for analysis, resulting in a final sample size
of 240. Respondents constituting this sample represented 11 principal
industries (finance, electronics, petroleum, automotive, banking, con-
sumer goods, food, insurance, telecommunications, textiles, utilities)
and held administrative, financial, sales, production, technical, and
general managerial positions. Respondents ranged in age from 30 to62, with an average age of 44, and averaged 19 years of joh experience.
In terms of age, years of job experience, or any of the self-report mea-
sures, the final sample did not differ from respondents who did not
provide complete physiological data.
The sample used in this study overlapped somewhat with a sample of
352 executives used in a previous study of the psychometric properties
of the Bortner scale, the Framingham scale, and the JAS (Edwards et
al., 1990a). The present sample differs, however, because 165 respon-dents who were either female or who did not provide complete physio-
logical data were dropped and because 53 new respondent! from the
1989 class were added. This overlap does not detract from the relevance
of the present study because Edwards et al. (1990a) focused exclusively
on the psychometric properties of the Bortner scale, the Framingham
scale, and the JAS, whereas we used the findings of Edwards et al.
(1990a) to explore the relationship between these measures and indices
of mental and physical health. Therefore, the present study was de-signed as an extension rather than a replication of Edwards et al.'s
(1990a) study.
Measures
Measures of TABP included the Bortner scale (Bortner, 1969), the
Framingham scale (Haynes et al., 1978), and the JAS (Jenkins et al.,
1979). The Bortner scale was modified in two minor ways. First, theoriginal response format, consisting of a straight line that respondents
marked at the appropriate location, was replaced with an 11-point nu-
merical response format, centered at zero and ascending to 5 in both
directions (cf. Cooper & Marshall, 1979). Second, the anchor satisfiedwith job on Item 14 was replaced with unambitious, which more clearly
represented the polar opposite of ambitious and eliminated respon-dents' potential confusion (Cooper & Marshall, 1979). The original
104tem Framingham scale was used (Haynes et al., 1978). Form C of
the JAS was used (Jenkins et al, 1979); this is currently the most widely
used version among adults.Items from the Bortner scale, the Framingham scale, and the JAS
were used to construct global and component measures of TABP.
278 JEFFREY R. EDWARDS AND A. J. BAGLIONI, JR.
Global measures were obtained by combining items from each mea-
sure according to the original recommended procedures. For the
Bortner scale, this involved reversing Items 1, 3, 4, 6, 8, 9, and 10 and
summing all 14 items (Bortner, 1969). For the Framingham scale, this
involved dividing the first 5 items by a constant (thereby converting all
items to the same scale) and summing all 10 items. For the JAS (Jenkins
et al., 1979), this involved recoding and summing subsets of the original
52 items to obtain the 2 l-item TABP scale (JAS-AB), the 21-item
Speed/Impatience scale (JAS-S), the 24-item Job Involvement scale
(JAS-J), and the 20-item Hard-Driving/Competitive scale (JAS-H).
Because the JAS-S, JAS-J, and JAS-H each contain multiple dimen-
sions (Edwards et al, 1990a), we considered them global measures for
the present investigation, but at a somewhat more specific level than
the Bortner scale, the Framingham scale, and the JAS-AB.
Component measures were constructed according to recommenda-
tions presented by Edwards et al. (1990a), who used confirmatory fac-
tor analysis to identify unidimensional subsets of items within the
Bortner scale, the Framingham scale, and the JAS. Two sets of scales
were constructed. First, separate sets of subscales were constructed for
the Bortner, Framingham, and JAS scales by recombining their respec-
tive items. This procedure yielded two subscales each for the Bortner,
Framingham, JAS-AB, and JAS-H, three subscales for the JAS-J, and
four subscales for the JAS-S. Taken together, these subscales measured
six TABP components: speed/impatience, hard-driving/competitive,
time pressure, anger/temper, job involvement, and job responsibility.
Next, items from the Bortner scale, the Framingham scale, and the
original 52-item JAS were combined to construct scales measuring 15
different TABP components. Like the subscales created separately for
the Bortner scale, the Framingham scale, and the JAS, these scales
measured hard-driving/competitive, time pressure, anger/temper, job
involvement, and job responsibility. However, these scales differ be-cause speed and impatience were separated into two measures, sepa-
rate measures of hard-driving and competitive were added, and mea-
sures of six additional components were provided, including doing
many things at once, punctuality, eating fast, putting words in the
mouths of others, ambition, and the desire to acquire titles and creden-
tials (for further details, see Edwards et al, 1990a). Thus, in the present
study we used 6 global TABP measures, 15 component measures con-
structed separately for the Bortner scale, the Framingham scale, andthe JAS, and 15 component measures constructed by combining itemsfrom the Bortner scale, the Framingham scale, and the JAS.
Two aspects of the procedures used to construct the separate and
combined component measures require elaboration. First, the JAS
coding procedure assigns predetermined values to missing responses.We used these values for the global and separate component measures
but not for the combined component measures, for which we used a
simple interval coding scheme. As a result, in analyses of the global and
separate component measures we used all 240 respondents, whereas inanalyses of the combined component measures we omitted 16 respon-
dents who did not provide complete data for the original 52-item JAS,
resulting in a sample size of 224. Second, the scoring procedure for the
JAS assigns 25 of the original 52 items to more than one scale. As aresult, the separate component measures constructed from a given JAS
scale often share items with measures of the same component con-structed from other JAS scales. Despite this overlap, the separate com-
ponent measures were useful for the purposes of this study in that they
allowed comparisons of global and component measures separately foreach JAS scale. This overlap is avoided by the combined component
measures, for which we used the original 52 JAS items rather than the86 receded items of the four JAS scales.
Outcome measures included serum cholesterol, blood pressure,heart rate, and self-reported anxiety, depression, somatic symptoms,
and angina. The decision to focus on outcomes other than clinical
manifestations of CHD was guided by three considerations. First, the
vast majority of our sample was asymptomatic, having never experi-
enced a major coronary event (myocardial infarction or angina pec-
toris). Second, recent evidence suggests that the relationship between
TABP and CH D is mediated by increased sympathetic and corticoste-
roid activity, which in turn influences traditional CHD risk factors,
such as blood pressure and serum cholesterol (Williams, 1989). This
suggests that the common practice of statistically controlling for CHD
risk factors in TABP investigations should be replaced with an explicit
examination of the relationship between TABP and CHD risk factors.Third, we included in the present investigation measures of TABP
components that have received little empirical attention. Therefore,
including a broad array of outcome measures provided an opportunity
to detect relationships not evident in previous TABP research.
Serum cholesterol was assayed from a fasting blood sample, with
total cholesterol fractionalized into high density lipoprotein (HDL),
low density lipoprotein (LDL), and very low density lipoprotein
(VLDL). Blood pressure and heart rate were measured duringa restingperiod prior to a treadmill endurance test. Anxiety, depression, and
somatic symptoms were measured with the corresponding 8-item sub-
scales from the Crown-Crisp Experiential Index (CCEI; Crown &
Crisp, 1966). These subscales have been validated against clinical diag-
noses (Crisp, Ralph, McGuinness, & Harris, 1978) and have demon-
strated adequate reliability (Alderman, Mackay, Lucas, Spry, & Bell,
1983). Self-reported angina was measured with a 7-item scale devel-
oped specifically for this study. Respondents rated the degree of chestpain and pressure experienced while walking, climbing stairs, resting,
after meals, and during periods of anger and upset. These items were
developed through consultation with coronary specialists, who used
similar questions to assess angina symptoms among patients.
Analysis
The primary analyses were multivariate multiple regressions
(MMRs; Dwyer, 1983; Wilkinson, 1988). MMR isanalogous to multi-
variate analysis of variance (MANOVA) in that it provides a joint test
for the prediction of multiple dependent variables, taking the correla-
tions among these variables into account. However, unlike M ANOVA,
MMR readily incorporates either categorical or continuous variables
as predictors.Three sets of analyses were conducted. First, the relationships be-
tween the global TABP measures and the outcome measures were ex-
amined. These analyses allowed comparisons with previous research
and provided a necessary benchmark for comparing results obtained
with the component measures. The second analysis replaced the global
TABP measures with the 15 component measures constructed sepa-
rately for the Bortner scale, the Framingham scale, and the JAS, and thethird analysis replaced these measures with the 15 component mea-
sures constructed by combining items from the Bortner scale, the Fra-
mingham scale, and the JAS. Increments in explanatory power pro-
vided by the component measures over the global measures were ana-lyzed with hierarchical MMR. Unless otherwise stated, two-tailed
tests of significance were used for all analyses.
Results
Reliability and Intercorrelation of Outcome Measures
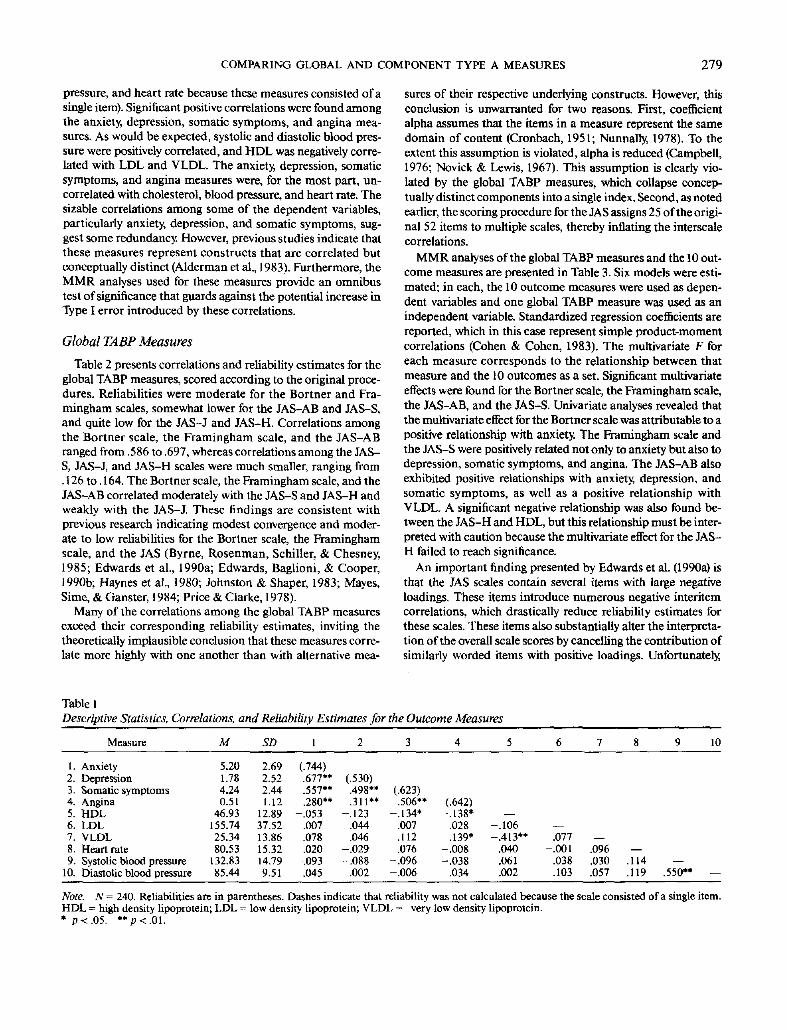
Reliability estimates (Cronbach's alpha) and intercorrelationsof the outcome measures are presented in Table 1. The reliabil-ity of the anxiety scale was fairly high, whereas the reliabilitiesof the depression, somatic symptoms, and angina scales weremodest (reliabilities are not reported for cholesterol, blood
COMPARING GLOBAL AND COMPONENT TYPE A MEASURES 279
pressure, and heart rate because these measures consisted of a
single item). Significant positive correlations were found among
the anxiety, depression, somatic symptoms, and angina mea-
sures. As would be expected, systolic and diastolic blood pres-
sure were positively correlated, and HDL was negatively corre-
lated with LDL and VLDL. The anxiety, depression, somatic
symptoms, and angina measures were, for the most part, un-
correlated with cholesterol, blood pressure, and heart rate. The
sizable correlations among some of the dependent variables,
particularly anxiety, depression, and somatic symptoms, sug-
gest some redundancy. However, previous studies indicate that
these measures represent constructs that are correlated but
conceptually distinct (Alderman et al, 1983). Furthermore, the
MMR analyses used for these measures provide an omnibus
test of significance that guards against the potential increase inType I error introduced by these correlations.
Global TABP Measures
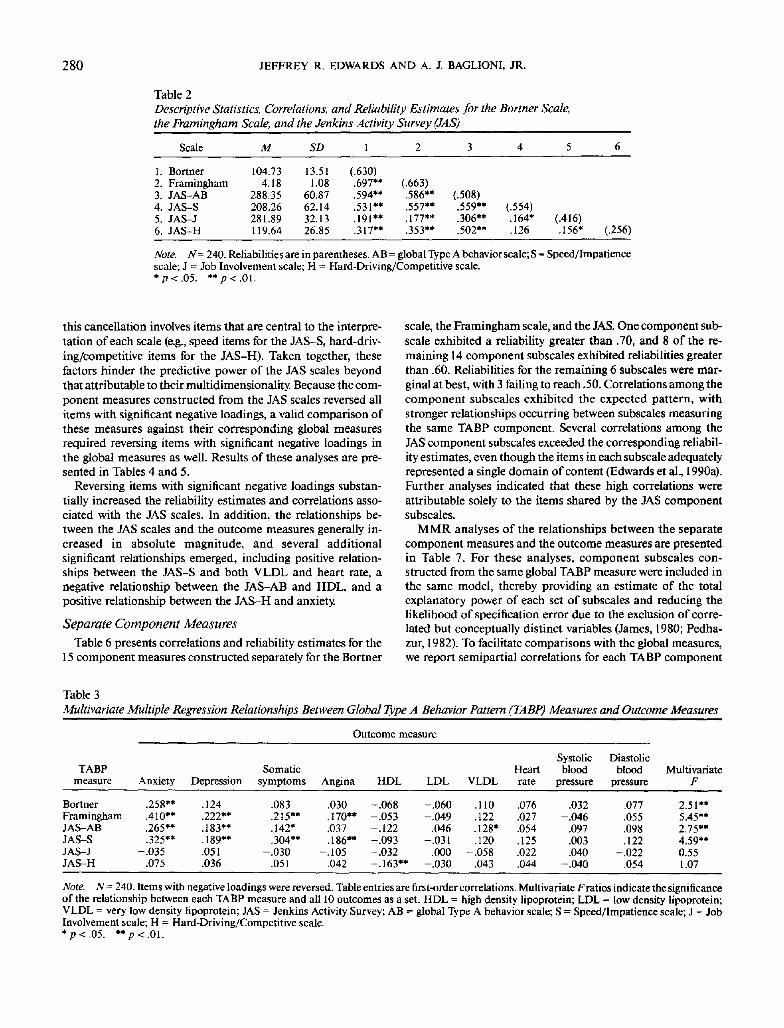
Table 2 presents correlations and reliability estimates for the
global TABP measures, scored according to the original proce-
dures. Reliabilities were moderate for the Bortner and Fra-
mingham scales, somewhat lower for the JAS-AB and JAS-S,
and quite low for the JAS-J and JAS-H. Correlations among
the Bortner scale, the Framingham scale, and the JAS-AB
ranged from .586 to .697, whereas correlations among the JAS-
S, JAS-J, and JAS-H scales were much smaller, ranging from
. 126 to. 164. The Bortner scale, the Framingham scale, and the
JAS-AB correlated moderately with the JAS-S and JAS-H and
weakly with the JAS-J. These findings are consistent with
previous research indicating modest convergence and moder-
ate to low reliabilities for the Bortner scale, the Framingham
scale, and the JAS (Byrne, Rosenman, Schiller, & Chesney,
1985; Edwards et al, 1990a; Edwards, Baglioni, & Cooper,
1990b; Haynes et al., 1980; Johnston & Shaper, 1983; Mayes,
Sime, & Ganster, 1984; Price & Clarke, 1978).
Many of the correlations among the global TABP measures
exceed their corresponding reliability estimates, inviting the
theoretically implausible conclusion that these measures corre-
late more highly with one another than with alternative mea-
sures of their respective underlying constructs. However, this
conclusion is unwarranted for two reasons. First, coefficient
alpha assumes that the items in a measure represent the same
domain of content (Cronbach, 1951; Nunnally, 1978). To the
extent this assumption is violated, alpha is reduced (Campbell,
1976; Novick & Lewis, 1967). This assumption is clearly vio-
lated by the global TABP measures, which collapse concep-
tually distinct components into a single index. Second, as noted
earlier, the scoring procedure for the JAS assigns 25 of the origi-
nal 52 items to multiple scales, thereby inflating the interscale
correlations.
MMR analyses of the global TABP measures and the 10 out-
come measures are presented in Table 3. Six models were esti-
mated; in each, the 10 outcome measures were used as depen-
dent variables and one global TABP measure was used as an
independent variable. Standardized regression coefficients are
reported, which in this case represent simple product-moment
correlations (Cohen & Cohen, 1983). The multivariate F for
each measure corresponds to the relationship between that
measure and the 10 outcomes as a set. Significant multivariate
effects were found for the Bortner scale, the Framingham scale,
the JAS-AB, and the JAS-S. Univariate analyses revealed that
the multivariate effect for the Bortner scale was attributable to a
positive relationship with anxiety. The Framingham scale and
the JAS-S were positively related not only to anxiety but also to
depression, somatic symptoms, and angina. The JAS-AB also
exhibited positive relationships with anxiety, depression, and
somatic symptoms, as well as a positive relationship with
VLDL. A significant negative relationship was also found be-
tween the JAS-H and HDL, but this relationship must be inter-
preted with caution because the multivariate effect for the JAS-
H failed to reach significance.
An important finding presented by Edwards et al. (1990a) is
that the JAS scales contain several items with large negative
loadings. These items introduce numerous negative interitem
correlations, which drastically reduce reliability estimates for
these scales. These items also substantially alter the interpreta-
tion of the overall scale scores by cancelling the contribution of
similarly worded items with positive loadings. Unfortunately,
Table 1
Descriptive Statistics, Correlations, and Reliability Estimates for the Outcome Measures
Measure M
1.2.3.4.5.6.7.
8.9.
10.
AnxietyDepressionSomatic symptomsAnginaHDLLDLVLDLHeart rateSystolic blood pressureDiastolic blood pressure
5.201.784.240.51
46.93155.7425.3480.53
132.8385.44
2.692.522.441.12
12.8937.5213.8615.3214.799.51
(.744).677".557".280**
-.053.007.078.020
-.093.045
(.530).498".311**
-.123.044.046
-.029-.088
.002
(.623).506"
-.134*.007.112.076
-.096-.006
(.642)-.138'
.028
.139*-.008-.038
.034
—-.106-.413"
.040
.061
.002
—.077
-.001.038.103
—.096 —.030 .114 —.057 .119 .550" —
Note, N= 240. Reliabilities are in parentheses. Dashes indicate that reliability was not calculated because the scale consisted of a single item.HDL = high density lipoprotein; LDL = low density lipoprotein; VLDL = very low density lipoprotein.* p<.05. **p<.01.
280 JEFFREY R. EDWARDS AND A. J. BAGLIONI, JR.
Table 2
Descriptive Statistics, Correlations, and Reliability Estimates for the Banner Scale,
the Framingham Scale, and the Jenkins Activity Survey (JAS)
Scale M SD 1 3
1. Bortner 104.732. Framingham 4.183. JAS-AB4. JAS-S5. JAS-J6. JAS-H
288.35208.26281.89119.64
13.511.08
60.8762.1432.1326.85
(.630).697**.594**.531".191**.317**
(.663).586**.557**.177**.353**
(.508).559**.306**.502**
(.554).164*.126
(.416).156* (.256)
Note. N=2W. Reliabilities are in parentheses. AB = global Type A behavior scale; S = Speed/Impatiencescale; J = Job Involvement scale; H = Hard-Driving/Competitive scale.*p<.05. **p<.0l.
this cancellation involves items that are central to the interpre-
tation of each scale (e.g., speed items for the JAS-S, hard-driv-
ing/competitive items for the JAS-H). Taken together, these
factors hinder the predictive power of the JAS scales beyond
that attributable to their multidimensionality. Because the com-
ponent measures constructed from the JAS scales reversed all
items with significant negative loadings, a valid comparison of
these measures against their corresponding global measures
required reversing items with significant negative loadings in
the global measures as well. Results of these analyses are pre-
sented in Tables 4 and 5.
Reversing items with significant negative loadings substan-
tially increased the reliability estimates and correlations asso-
ciated with the JAS scales. In addition, the relationships be-
tween the JAS scales and the outcome measures generally in-
creased in absolute magnitude, and several additional
significant relationships emerged, including positive relation-
ships between the JAS-S and both VLDL and heart rate, a
negative relationship between the JAS-AB and HDL, and a
positive relationship between the JAS-H and anxiety.
Separate Component Measures
Table 6 presents correlations and reliability estimates for the
15 component measures constructed separately for the Bortner
scale, the Framingham scale, and the JAS. One component sub-
scale exhibited a reliability greater than .70, and 8 of the re-
maining 14 component subscales exhibited reliabilities greater
than .60. Reliabilities for the remaining 6 subscales were mar-
ginal at best, with 3 failing to reach .50. Correlations among the
component subscales exhibited the expected pattern, with
stronger relationships occurring between subscales measuring
the same TABP component. Several correlations among the
JAS component subscales exceeded the corresponding reliabil-
ity estimates, even though the items in each subscale adequately
represented a single domain of content (Edwards et al, 1990a).
Further analyses indicated that these high correlations were
attributable solely to the items shared by the JAS component
subscales.
MMR analyses of the relationships between the separate
component measures and the outcome measures are presented
in Table 7. For these analyses, component subscales con-
structed from the same global TABP measure were included in
the same model, thereby providing an estimate of the total
explanatory power of each set of subscales and reducing the
likelihood of specification error due to the exclusion of corre-
lated but conceptually distinct variables (James, 1980; Pedha-
zur, 1982). To facilitate comparisons with the global measures,
we report semipartial correlations for each TABP component
Table 3
Multivariate Multiple Regression Relationships Between Global Type A Behavior Pattern (TABP) Measures and Outcome Measures
Outcome measure
TABPmeasure
BortnerFraminghamJAS-ABJAS-SJAS-JJAS-H
Anxiety
.258**
.410**
.265**
.325**-.035
.075
Depression
.124
.222**
.183**
.189**
.051
.036
Somaticsymptoms
.083
.215**
.142*
.304**-.030
.051
Angina
.030
.170**
.037
.186™-.105
.042
HDL
-.068-.053-.122-.093-.032-.163**
LDL
-.060-.049
.046-.031
.000-.030
VLDL
.110
.122
.128*
.120-.058
.043
Heartrate
.076
.027
.054
.125
.022
.044
Systolicblood
pressure
.032-.046
.097
.003
.040-.040
Diastolicblood
pressure
.077
.055
.098
.122-.022
.054
MultivariateF
2.51"5.45**2.75"4.59**0.551.07
Note. A'= 240. Items with negative loadings were reversed. Table entries are first-order correlations. Multivariate F ratios indicate the significanceof the relationship between each TABP measure and all 10 outcomes as a set. HDL = high density lipoprotein; LDL = low density lipoprotein;VLDL = very low density lipoprotein; JAS = Jenkins Activity Survey; AB = global Type A behavior scale; S = Speed/Impatience scale; J = JobInvolvement scale; H = Hard-Driving/Competitive scale.*p<.05. **/)<.01.

COMPARING GLOBAL AND COMPONENT TYPE A MEASURES 281
Table 4
Descriptive Statistics, Correlations, and Reliability Estimates for the Banner Scale,
the Framingham Scale, and the Jenkins Activity Survey (JAS)
Scale M SD 1
1. Bortner 104.732. Framingham 4.183. JAS-AB4. JAS-S5. JAS-J6. JAS-H
350.04309.17364.30143.38
13.511.08
71.1875.6936.6430.64
(.630).697.635.656.305.481
(.663).659.695.308.504
(.653).802.430.635
(.716).359.474
(.438).304 (.564)
Note. N = 240. Items with negative loadings were reversed. Reliabilities are in parentheses. All correla-tions are significant at p < .01. AB = global Type A behavior scale; S = Speed/Impatience scale; J = JobInvolvement scale; H = Hard-Driving/Competitive scale.
and multiple correlations for the combined effect of each set of
components. Significant multivariate effects were found for
component subscales obtained from the Bortner scale, the Fra-
mingham scale, and the JAS-AB, JAS-S, and JAS-H. Inspec-
tion of separate component subscales revealed significant ef-
fects for the Bortner speed/impatience and hard-driving/com-
petitive subscales, the Framingham time pressure subscale, the
JAS-AB speed/impatience subscale, and the JAS-S speed/im-
patience and time pressure subscales. With few exceptions, the
speed/impatience and time pressure subscales were positively
related to anxiety, depression, somatic symptoms, and angina.
The Bortner hard-driving/competitive subscale was negatively
related to somatic symptoms and positively related to VLDL.
However, the five other hard-driving/competitive subscales did
not exhibit these relationships, perhaps suggesting that the
Bortner subscale reflects some unique aspect of this compo-
nent. The anger/temper subscales from the JAS-S and JAS-H
were positively related to anxiety, somatic symptoms, and (in
one case) depression, and the JAS-H hard-driving/competitive
subscale was negatively related to HDL, but the multivariate
effects for these subscales failed to reach significance.
Comparing these results with those obtained for the global
measures (after reversing items with negative loadings) revealed
several important findings. For example, although the Bortner
scale was related only to anxiety, the Bortner component sub-
scales were also related to depression, somatic symptoms, and
VLDL. In several cases, these subscales exhibited opposite rela-
tionships with outcome measures, suggesting one reason why
these relationships were not detected for the original Bortner
scale. The Bortner subscales also exhibited suppressor effects
such that the absolute magnitude of the coefficient linking each
subscale to a given outcome increased with the inclusion of the
other subscale (Cohen & Cohen, 1983).
Analyses of the Framingham scale revealed that relationships
involving the original Framingham scale were primarily attrib-
utable to its time pressure component. However, these relation-
ships were somewhat weaker for the Framingham subscales
than for the original Framingham, primarily because several
items that were highly correlated with these outcomes (i.e., eat-
ing fast, preoccupation with work, and dissatisfaction with job
performance) were excluded from the component subscales.
The Framingham subscales also exhibited opposite relation-
ships with diastolic blood pressure, relationships that were con-
cealed within the original Framingham scale.
Analyses for the JAS-AB revealed that the relationships be-
tween the original JAS-AB and anxiety, depression, and so-
matic symptoms were attributable to its speed/impatience com-
ponent. In addition, a relationship emerged between the speed/
impatience subscale and angina. However, relationships with
HDL and VLDL were no longer significant, primarily because
Table 5
Multivariate Multiple Regression Relationships Between Jenkins Activity Survey (JAS) Scales and Outcome Measures
Outcome measure
Scale
JAS-ABJAS-SJAS-JJAS-H
Anxiety
.271**
.377**
.021
.181**
Depression
.199**
.220**-.003
.111
Somaticsymptoms
.189**
.298**
.003
.108
Angina
.089
.138*-.085
.044
HDL
-.140*-.092-.071-.146*
LDL
.031-.019
.029-.025
VLDL
.143*
.145*-.035
.055
Heartrate
.074
.143*
.038
.056
Systolicblood
pressure
.063
.003
.042-.023
Diastolicblood
pressure
.096
.087-.039
.058
MultivariateF
2.84**5.38**0.781.52
Note. N = 240. Items with negative loadings were reversed. Table entries are first-order correlations. Multivariate F ratios indicate the significanceof the relationship between each TABP measure and all 10 outcomes at a set. HDL = high density lipoprotein; LDL = low density lipoprotein;VLDL = very low density lipoprotein; AB = global Type A behavior scale; S = Speed/Impatience scale; J = Job Involvement scale; H = Hard-Driv-ing/Competitive scale.*p<.05. **p<.01.

282 JEFFREY R. EDWARDS AND A. J. BAGLIONI, JR.
.—, # *
^ *? ~
* *
r^ vi O O\ ON
p p — (N oo
.....
— ON — — ( N O O — ' ( N ( N' ' ' ' ' ' ' ' '* .*
^ — i(N — < CN m O
tt 4 4 -B * * * * » *
,# * * # * * * * * »oo (N-H u-»oo r— >o o ON m~r~ do — o "/ir-oom r~^^ prlT*; "r^1* "r}r*)rs!r'i — '
..........
o o o < N * — ^-
C V i)
p
"ta, uLH BO~ C
jj ^"« I'
I*" u
jaS sw
o -
g ' > .,
' "
« 8 •- -
several items that were correlated with these outcomes (i£., do-ing many things at once, deadlines at work, and temper) wereexcluded from the subscales. Separating the JAS-S into its fourcomponent subscales revealed that its relationships with anxi-ety, somatic symptoms, and angina were attributable to itsspeed/impatience and time pressure components, whereas itsrelationship with depression was attributable to the anger/temper component. Though the relationships for VLDL andheart rate were slightly larger for the JAS-S subscales than forthe original JAS-S, they were no longer significant, primarilybecause the subscale model included three more predictors butprovided little additional explanatory power. Finally, separatingthe JAS-H into subscales revealed that its relationship withanxiety was attributable to the anger/temper component,whereas its relationship with HDL was attributable to the hard-driving/competitive component. The anger/temper componentalso exhibited positive relationships with depression and so-matic symptoms. Though the results for the JAS-J subscalesdiffered slightly from those obtained for the original JAS-J,multivariate effects for these measures remained nonsignifi-cant.
To determine whether the separate component measuresprovided additional explanatory power over the global mea-
sures, we conducted a series of hierarchical MMR analyses,testing the variance explained by the separate component mea-sures after controlling for their respective global measures. Itmay seem unlikely that these analyses could yield significanteffects, given that the items in the separate component mea-sures are already included in their respective global measures.Our rationale for these analyses was that each global measureimplicitly constrains the regression coefficients on its constitu-ent items to be equal. Component measures relax this con-straint somewhat, such that the coefficients are equal within theset of items constituting each component measure but maydiffer across sets. If the coefficients on the component measuresare equal to the coefficient on the global measure, then thecomponent measures will explain no additional variance afterthe global measure is controlled. However, if the coefficients onthe component measures differ from the coefficient on theglobal measure, then the component measures will explain ad-ditional variance after the global measure is controlled. Notethat, for these analyses, the effects of items excluded from thecomponent measures remain in the global measure and, hence,are held constant.
Results for these analyses are presented in Table 8. We reportadjusted multiple correlations, thereby controlling for the num-ber of predictors included in each model. An omnibus test isalso reported, comparing all 15 separate component measuresto all six global measures. The omnibus test was significant,indicating that the 15 separate component measures explainedadditional variance after controlling for all six global measures.Analyses for separate sets of global and component measuresrevealed significant incremental effects for the Bortner and Fra-mingham scales, though the effect for the JAS-AB also ap-proached significance (p < .065). Overall, these analyses indi-cated that, when the excluded items are held constant, the ex-planatory power of the separate component measures issomewhat larger than that of the global measures. However,

COMPARING GLOBAL AND COMPONENT TYPE A MEASURES 283
Table 7
Multivariate Multiple Regression Relationships Between Separate Component Type A Behavior
Pattern (TABP) Measures and Outcome Measures
Outcome measure
TABP measure
Bortner subscalesHard-driving/
competitiveSpeed/impatience
Framingham subscalesHard-driving/
competitiveTime pressure
JAS-AB subscalesSpeed/impatienceHard-driving/
competitiveJAS-S subscales
Speed/impatienceHard-driving/
competitiveAnger/temperTime pressure
JAS-J subscalesHard-driving/
competitiveJob involvementJob responsibility
JAS-H subscalesHard-driving/
competitiveAnger/temper
Anxiety
.373"
-.078.367»*
.349"*
.067
.324**
.301**
.268**
.086
.390**
.239**
-.055.141*.169**.074
.032
.040-.054
.276**
.100
.225**
Depression
.255"
-.097.255**
.200**
-.016.198**
.184*
.138*
.095
.228*
.113
-.036.132*.078.044
-.008.035.025.196**
.107
.133*
Somaticsymptoms
.261**
-.152*.254*
.164*
.012
.158*
.265**
.264**
-.027.352".239"
-.115.116.141*.099
-.046.027
-.082.210"
.024
.196"
Angina
.138
-.095.128*
.163*
.000
.160*
.165*
.165*
-.019.261".164"
-.114.033.151*.149
-.095-.046-.082
.074
.035
.055
HDL
.117
-.109.000
.074
-.061-.031
.119-.031
-.108.148
-.015
-.048-.023-.111
.086
-.084.006
-.007.170*
-.165*.000
LDL
.078
-.072.000
.040
-.015-.034
.129-.096
.103
.095-.077
.054
.034-.002
.124
-.019-.032
.121
.004
.002-.004
VLDL
.217"
.203**-.005
.081
.071
.025
.149
.071
.116
.172
.067
.093
.010
.069
.142
.106
.013-.100
.062
.057
.009
Heartrate
.085
-.017.084
.039
-.010-.035
.102
.079
.049
.146
.085
.012
.058
.045
.075
.055
.039-.004
.115
.037
.097
Systolicblood
pressure
.056
.056-.025
.130
.060-.125
.087
.082
.014
.121
.052
.032
.000-.114
.164
.113
.084
.038
.017
-.015.011
Diastolicblood
pressure
.128
-.066.126
.200*
.155*-.153*
.116
.107
.025
.178
.110
.043
.046-.125
.099
.075
.051-.011
.062
.029
.047
MultivariateF
3.29**
2.53"4.38"
2.54"
1.023.95"
2.36"3.39"
1.211.96"3.00"
0.860.792.06*0.97
1.140.401.121.63*
1.101.76
Note. N = 240. Table entries are semipartial correlations for each subscale and multiple correlations for each set of subscales. Multivariate /"ratiosindicate the significance of the relationship between each subscale (or set of subscales) and all 10 outcomes asa set. HDL = high density lipoprotein;LDL = low density lipoprotein; VLDL = very low density lipoprotein; JAS •= Jenkins Activity Survey; AB = global Type A behavior scale; S =Speed/Impatience scale; J = Job Involvement scale; H = Hard-Driving/Competitive scale.*p<.Q5 **p<.0\.
these analyses also revealed that, in some cases, the global mea-
sures explained additional variance after their respective com-
ponent measures were controlled. This was particularly evident
for the Framingham scale; the global measure explained addi-
tional variance in anxiety, depression, somatic symptoms, and
angina. Though these effects seem to provide support for the
global measure, we must emphasize that, after the separate com-
ponent measures were controlled, the coefficient for the global
measure simply reflected the influence of the excluded items.
Hence, these results indicate that, though some of the excluded
items did not convincingly represent TABP components, they
were nonetheless correlated with the outcome measures used.
Combined Component Measures
In Table 9, we present correlations and reliability estimates
for the 15 component scales constructed by combining items
from the Bortner scale, the Framingham scale, and the JAS.
Three component scales exhibited reliabilities greater than .70,
and 8 of the remaining scales exhibited reliabilities greater than
.60. Reliabilities for the remaining 4 scales were rather low, with
3 failing to reach .50. Overall, the highest correlations were
between the hard-driving/competitive component scale and
the three component scales reflecting similar but more specific
content (ambition, competitiveness, hard-driving). Similarly,
the speed component scale was positively related to the eating
fast, words in the mouths of others, and impatience component
scales. The time pressure, job involvement, and anger/temper
component scales exhibited several significant correlations
with other component scales, particularly the hard-driving,
ambition, hard-driving/competitive, and speed component
scales. Note that, because these scales shared no items, none of
their intercorrelations exceeded the corresponding reliability
estimates.We also conducted MMR analyses of the relationships be-
tween the combined component measures and the outcome

284 JEFFREY R. EDWARDS AND A. J. BAGLION1, JR.
Table 8
Comparison of Global Type A Behavior Pattern (TABP) Measures and Separate Component TABP Measures
TABPmeasure
Bortner scaleGlobalComponentGlobal and component
Framingham scaleGlobalComponentGlobal and component
JAS-ABGlobalComponentGlobal and component
JAS-SGlobalComponentGlobal and component
JAS-JGlobalComponentGlobal and component
JAS-HGlobalComponentGlobal and component
All global measuresAll separate component
measuresAll global and separate
component measures
Anxiety
.249
.363
.359'
.406
.338
.473"
.266
.288
.300"
.377
.366
.390
.000
.000
.000
.173
.261
.253"
.424
.461
.504"
Depression
.105
.239
.235'
.212
.179
.290"
.192
.161
.184
.214
.190
.212
.000
.000
.000
.095
.173
.182"
.217
.274
.329"
Somaticsymptoms
.055
.245
.239'
.205
.138
.239"
.179
.249
.286'
.293
.330
.327"
.000
.000
.000
.089
.190
.179'
.326
.354
.371
Angina
.000
.105
.084
.158
.134
.190
.063
.138
.122
.122
.228
.293"
.055
.100
.077
.000
.000
.000
.184
.261
.316'
HDL
.000
.071
.063
.000
.000
.000
.122
.077
.110
.063
.071
.063
.032
.000
.000
.130
.145
.126
.100
.000
.000
LDL
.000
.000
.000
.000
.000
.000
.000
.089
.063
.000
.000
.000
.000
.055
.000
.000
.000
.000
.000
.000
.000
VLDL
.089
.197
.228"
.105
.000
.095
.130
.118
.100
.130
.114
.095
.000
.089
.095
.000
.000
.000
.000
.169
.195
Heartrate
.045
.000
.000
.000
.000
.084
.032
.045
.032
.126
.071
.032
.000
.000
.000
.000
.071
.045
.110
.000
.000
Systolicblood
pressure
.000
.000
.000
.000
.095
.071
.000
.000
.000
.000
.000
.000
.000
.122
.155"
.000
.000
.000
.077
.149
.126
Diastolicblood
pressure
.045
.089
.084
.000
.179
.192'
.071
.071
.045
.055
.122
.114
.000
.000
.126
.000
.000
.000
.000
.180
.182
Note. N= 240. Table entries are adjusted multiple correlations. HDL= high density lipoprotein; LDL = low density lipoprotein; VLDL = very lowdensity lipoprotein; JAS = Jenkins Activity Scale; AB = global Type A behavior scale; S - Speed/Impatience scale; J = Job Involvement scale; H -Hard-Driving/Competitive scale.* For this outcome, the set of component measures explained additional variance after the respective global measure was controlled (p < .05).
measures, using all 15 scales as predictors (see Table 10). The
overall effect for the model was significant, which was primar-
ily attributable to significant effects for the eating fast, hard-
driving, speed, and time pressure component scales and to a
marginally significant effect for the competitive component
scale. Inspection of individual coefficients revealed that the eat-
ing fast component scale was positively related to angina and
VLDL. In contrast, the speed component scale was negatively
related to VLDL and positively related to anxiety and depres-
sion. The time pressure component scale was positively related
to anxiety as well as to somatic symptoms and angina, but it was
negatively related to diastolic blood pressure. The hard-driving
component scale was negatively related to somatic symptoms,
and the competitive component scale was negatively related to
anxiety, HDL, and LDL. Overall, the combined component
measures explained the greatest proportion of variance for anxi-
ety, depression, somatic symptoms, angina, HDL, and diastolic
blood pressure.
Comparing these results with those obtained for the global
measures (after reversing items with negative loadings) and the
separate component measures revealed several important find-
ings. For example, the relationship between somatic symptoms
and the speed/impatience components contained within the
Bortner, JAS-AB, and JAS-S scales was apparently attributable
to hurrying the speech of others. In contrast, the relationship
between angina and the speed/impatience components was at-
tributable to eating fast, and the relationships between anxiety
and depression and the speed/impatience component scales
were due to a general speed factor. Furthermore, after control-
ling for components associated with speed, impatience pro-
vided no unique explanatory power.
The negative relationship between HDL and the hard-driv-
ing/competitive component subscale of the JAS-H was appar-
ently attributable to the ambition and competitive components.
However, the relationship between VLDL and the hard-driv-
ing/competitive component subscale of the Bortner scale was
not evident in the associated component measures. Further
analyses revealed that, individually, the hard-driving, competi-
tive, and hard-driving/competitive measures were each posi-
tively related to VLDL, and that, as a set, these measures were
marginally related to VLDL after the remaining combined com-
ponent measures were controlled (p < .09). Hence, the absence

COMPARING GLOBAL AND COMPONENT TYPE A MEASURES 285
•I
I
1
I
x_>1
CDNO
^Sm r-^
^*X *
OO rn m ON ONoo r-i —
+
"-^
^— , # #
1 i 2 Sg
— • TJ- m CN oo><^ (N TT m —w-i ^- o NO oo
—•o r- ON — —u"t ^ ^f 'O ON
tN — (N ~- —
8 1§ |
Doin
g m
an
y t
hin
gs
at
Punctu
ali
tyE
ati
ng
fas
tP
utt
ing
word
s in
th
e T
of
oth
ers
Imp
atie
nce
-r-ir^^r ^
o7NO
OC OOr- r-j
* *r?o ON
wi&lioo oo O fnNO m -5 rf
=>S,Uo,3 m — $ o
* * * * *^* ^" [*•• ^ "ftO CH wi (N >^t fN
fN •— < o -^ f~~ ooO (N "*1 ON — (N^-H o <N fo ^- r-J
t-f-L!?-^
* » * *<N O OO 'i- NO •*
f N O ^^0 M «
#
0 O O O O —
1 1 I I
l ^ o o O N c l tm oo oo VI — o
oo fN NO r- m
\o rn «~v o rr- •—_ _
-2:^^°-m — (Ni^i t» r^
'S
Am
bit
ion
Com
peti
tiveness
Hard
-dri
vin
gS
pee
dH
ard
-dri
vi n
g/c
om
pet
iT
ime p
ress
ure
NO i^ ad o^ o — •
QOr-}
r- CN
" rf^r*^ fN
R = °
<o rj — H (N
#
(N ( i «ri r-)
r|loo|j
«N ^0 (N
# ** *
^3CJ2:n T o —
1
ii o-^^ 2 —
(N — OO 00UO (N i/~i
— r*~i O —
* * *
(St *O ON
* #
NO TT O f*l
-- rn O O
* *
I
^ ^ ^ ^r^ (N oo <No r-i o (N
1
*
O O O —1 1 15 * *fN OO ^ >0
NO (N — «OO-. r^ TJ- rNoo t*~ sj- r^~
O r-; ON ood od r^ — •
^•1e
Job
in
vo
lvem
en
tA
nger/
tem
per
Job
res
ponsi
bil
ity
Des
ire f
or
titl
es/c
redei
r-i ro •* >X
s
1
fi
C
1s
I oo! v
fN $
I I
^ V
g,0-
of significant relationships between these measures and VLDLreflects the lack of unique explanatory power for each measureafter the other measures and other correlates of VLDL (e.g,eating fast) were controlled.
Relationships involving the time pressure components of theFramingham scale and the JAS-S were reflected in the com-bined time pressure component measure. In contrast, relation-ships between the anger/temper component subscales of theJAS-S and JAS-H and the outcomes of anxiety, depression, andsomatic symptoms did not emerge. However, these relation-ships were evident when the anger/temper component measurewas analyzed separately, suggesting that its explanatory powerhad been diminished by the inclusion of other components.
To examine the increase in explanatory power provided bythe combined component measures, we again used hierarchicalMMR, testing the increment in variance explained by the com-bined component measures after controlling for either the sixglobal measures or the 15 separate component measures (seeTable 11). Both comparisons yielded significant results, reflect-ing greater explained variance than the global measures for fouroutcomes and greaterexplained variance than the separate com-ponent measures for two outcomes. However, two caveats re-garding these results should be noted.
First, when used with the combined component measures,the hierarchical procedure cannot be interpreted in the samemanner as before. With the separate component measures, thisprocedure indicated the increase in variance explained by thesemeasures when the excluded items were held constant. Thisinterpretation was possible because the separate componentmeasures consisted of subsets of the items constituting theglobal measure. This is not the case with the combined compo-nent measures, in which items were combined across differentglobal measures and which were based on the original 52 JASitems rather than the 86 recoded items constituting the four JASscales. Hence, these results simply indicate that the combinedcomponent measures explained additional variance beyondthat explained by either the global or separate component mea-sures.
Second, after the combined component measures were con-trolled, the global measures explained additional variance inseveral outcomes. As before, this reflects the influence of theitems excluded from the combined component measures, someof which were correlated with the outcome measures.
Discussion
The results of this study indicate that component TABP mea-sures provide three major advantages over global measures.First, whereas the global measures exhibited very few signifi-cant relationships with outcomes, component measures basedon the same items exhibited many significant relationships. Thiswas particularly true for the Bortner and Framingham scales,which contained components that exhibited opposite relation-ships with outcomes. Second, significant relationships obtainedfor component measures were more readily interpretable inthat, unlike global measures, they more convincingly repre-sented a single, unidimensional construct. For example, therelationships observed for the original Framingham scale can-

286 JEFFREY R. EDWARDS AND A. J. BAGLION1, JR.
Table 10
Multivariate Multiple Regression Relationships Between Combined Component Type A Behavior
Pattern (TABP) Measures and Outcome Measures
Outcome measures
TABPmeasure
All component measuresDoing many things at oncePunctualityEating fastPutting words in the
mouths of othersImpatienceAmbitionCompetitiveHard-drivingSpeedHard-d riving/competitiveTime pressureJob involvementAnger/temperJob responsibilityDesire for titles/credentials
Anxiety
.518"
.023
.110-.016
.075
.013
.035-.131*-.035
.195**-.020
.179**
.041
.083-.071-.013
Depression
.346*
.104
.082-.010
-.007-.030-.025-.060-.020
.182*'-.022
.085-.002
.060
.016
.006
Somaticsymptoms
.428**
.090
.056
.109
.150*-.029-.035-.069-.180**
.068
.018
.165**
.037
.062
.046
.042
Angina
.344*-.007
.051
.172"
.090-.054-.008-.051-.033-.105-.050
.229"-.121
.069
.030
.010
HDL
.342*-.155*
.074-.020
-.031-.008-.181**-.132*
.109
.085
.044-.084
.067
.004-.000
.060
LDL
.269
.060-.014
.000
-.066-.014-.041-.135*-.084
.054
.180**-.071
.028
.031
.098-.028
VLDL
.315-.017
.031
.141*
-.040.092.016.080.060
-.128*.054.000.080
-.059-.076-.099
Heartrate
.219
.030
.041
.117
.029
.045-.006-.076-.011-.062
.015-.041
.071
.070
.005-.043
Systolicblood
pressure
.271-.085
.041-.057
.119
.066
.024
.044
.058
.023
.011-.119-.055-.073
.104
.032
Diastolicblood
pressure
.332*
.015-.043
.070
.095
.180"
.084-.012-.079-.073
.066-.152*-.060
.008
.045-.042
MultipleF
1.69"1.510.882.04*
1.591.131.511.752.22*3.01"1.212.87"1.290.69
.96
.53
Note. N = 224. Table entries are semipartial correlations for each component scale and multiple correlations for each set of component scales.Multivariate F ratios indicate the significance of the relationship between each component scale (or set of scales) and all 10 outcomes as a set.*^<.05. **/><. 01.
not be unambiguously attributed to hard-driving/competitive-
ness, time pressure, or some combination thereof. In contrast,
results for the component measures derived from the Fra-
mingharn scale indicate that these relationships are attributable
almost entirely to time pressure. Similarly, separating the JAS-S
into its constituent components revealed that its relationships
with the outcome measures could be attributed not only to
speed/impatience but also to anger/temper and time pressure.
Third, the component measures provided additional explana-
tory power over the global measures. These results were ob-
tained even though the separate and combined component
measures contained only 58 and 56 items, respectively, rather
than the 110 items in the global measures. The combined com-
ponent measures also provided increases in explanatory power
over the separate component measures, but these gains were
notably smaller than those obtained over the global measures.
Hence, the major increases in explanatory power were attribut-
able to the use of either the separate or combined component
measures, with only minor increases obtained by using the
combined component measures instead of the separate compo-
Table 11
Comparison of Global Type A Behavior Pattern (TABP) Measures, Separate Component TABP
Measures, and Combined Component TABP Measures
Systolic DiastolicSomatic Heart blood blood
TABP measure Anxiety Depression symptoms Angina HDL LDL VLDL rate pressure pressure
All global measuresAll separate component measuresAll combined component measuresAll global and combined
component measuresAll separate and combined
component measures
.424
.454
.468
.522"
.499"
.217
.277
.247
.297
.279
.326
.352
.358
.386'
.362
.184
.276
.244
.295"
.305
.100
.000
.240
.286'
.249"
.000
.000
.101
.158
.141
.000
.071
.197
.179
.182
.110
.000
.000
.000
.000
.077
.145
.107
.055
.161
.000
.179
.225
.190
.239
Note. N= 224. Tableentries are adjusted multiple correlations. HDL - high density lipoprotein; LDL = low density lipoprotein; VLDL = very lowdensity lipoprotein.*For this outcome, the 15 combined component measures explained additional variance after the six global measures were controlled (p <.05). b For this outcome, the 15 combined component measures explained additional variance after the 15 separate component measures werecontrolled (p<.05).

COMPARING GLOBAL AND COMPONENT TYPE A MEASURES 287
nent measures. However, some of the items excluded from theseparate and combined component measures were related tothe outcome measures used. Because these items do not con-vincingly represent TABP components (Edwards et al., 1990a),these results apparently represent factors outside the domain ofTABP. Hence, given the number of relationships detected, theirinterpretability, and the total explanatory power, the compo-nent TABP measures used in this study seem generally superiorto the corresponding global measures.
The implications of this study for TABP research follow di-rectly from the conclusions stated above. First, separating exist-ing global measures into their constituent components may re-veal previously undetected relationships. For example, the rela-tionship between global TABP measures and serum cholesterolis often weak and inconsistent, particularly for self-report mea-sures (e.g., Caplan, Cobb, French, Harrison, & Pinneau, 1980;Haynes et al, 1978; Shekelle, Schoenberger, & Stamler, 1976;Shipper et al, 1986). The present study suggests that compo-nents reflecting ambition, drive, and competitiveness may ex-hibit negative relationships with HDL and, to a lesser extent,positive relationships with VLDL, both of which would in-crease CHD risk. Unfortunately, it difficult to evaluate the bio-logical plausibility of these effects because of the paucity ofstudies examining the psychological correlates of cholesterol,particularly HDL, LDL, and VLDL (van Doornen & Orlebeke,1982). Previous research has also failed to demonstrate a con-sistent relationship between TABP and either blood pressure orheart rate (Myrtek & Greenlee, 1984). Although blood pressureand heart rate were unrelated to global TABP in the presentstudy, diastolic blood pressure was positively related to impa-tience and negatively related to time pressure. However, assum-ing that impatience and time pressure may each produce sus-tained sympathetic arousal, it follows that both componentsought to exhibit positive relationships with diastolic blood pres-sure. Further research incorporating measures of these mediat-ing mechanisms is needed to clarify this apparent anomaly.
The relationship between global TABP and depression hasalso been inconsistent, with some researchers finding a positiverelationship (Chesney, Black, Chadwick, & Rosenman, 1981;Dearborn & Hastings, 1987), others finding a negative relation-ship (Burke & Weir, 1980), and others finding no relationship
(Brief, Rude, & Rabinowitz, 1983; Caplan et al, 1980). Thisinconsistency may be due to the confounding of speed withhard-driving/competitiveness which exhibited opposite rela-tionships with depression in the present study. Though theweak negative relationship for hard-driving/competitiveness isconsistent with previous research demonstrating motivationaldeficits associated with depression, the positive relationship forspeed is inconsistent with previous research (Garber, Miller, &Abramson, 1980). Perhaps this relationship reflects the pursuitof unattainable goals, which may generate accelerated but mis-directed behavior, a sense of time pressure, and ultimately de-pression. Again, further research is needed to clarify these pro-cesses and resolve these inconsistencies.
A second implication of the present study is that, when globalTABP measures are separated into their constituent compo-nents, existing relationships involving TABP may be clarified.For example, self-report measures of TABP are often related to
anxiety (Chesney et al, 1981; Frew & Bruning, 1987; Haynes etal, 1978; Matteson & Ivancevich, 1982; Somes, Garrity, &Marx, 1981). The present study suggests that this relationship isprimarily attributable to components reflecting speed and timepressure. This finding is consistent with previous research,which indicates a positive association between anxiety and activ-ity levels (Garber et al, 1980). Similarly, global TABP has exhib-ited a modest relationship with angina (Booth-Kewley & Fried-man, 1987). Our results implicate eating fast and time pressureas primary contributing components. These results are consis-tent with earlier research demonstrating a positive associationbetween workload and angina (Jenkins, 1971) in that excessiveworkload may create a sense of time pressure and require ahastening of certain activities (eg., eating), which may stimulatesustained sympathetic arousal and, ultimately, promote the de-velopment of CHD. Other relationships involving global TABPmay be similarly clarified by reanalysis after the separation ofglobal measures into their constituent components.
A third implication is that global TABP measures probablyunderestimate the true effect of TABP on symptomatology. Re-cent meta-analyses indicate that global TABP measures rarelyexplain more than 2% of the variance in disease outcomes(Booth-Kewley & Friedman, 1987). This is consistent with theadjusted squared multiple correlations obtained in the presentstudy, which indicated that the six global TABP measures ex-plained an average of 1.59% of the variance in outcomes. Incontrast, analogous results for each set of separate componentmeasures indicated that they explained an average of 2.21 % ofthe variance in outcomes. Similarly, when all six global TABPmeasures were used in a single model, adjusted squared multi-ple correlations indicated an average of 3.95% explained vari-ance in outcomes. However, analogous results for the compo-nent measures indicated that, when used in a single model, the15 separate component measures explained an average of 5.41 %of the variance in the outcomes, and the combined componentmeasures explained an average of 6.36% of the variance in theoutcomes. Taken together, these results indicate that the use ofcomponent TABP measures may increase the proportion ofexplained variance in health outcomes by approximately 50%.
The results of this study also suggest several practical impli-cations. First, interventions to modify TABP behavior shouldavoid attempts to simultaneously alter all TABP componentsand instead target specific TABP components, depending onthe desired outcome (cf. Roskies, 1980). For example, mentalhealth interventions may require changes in components asso-ciated with speed, whereas CHD risk (e.g, cholesterol) interven-tions may require changes in components associated with com-petitive drive. Second, the improvements in mental and physi-cal health resulting from TABP interventions may be greaterthan initially believed. This follows directly from the apparentunderestimation of the effects of TABP on health, as evidencedby the increased explanatory power associated with componentmeasures. Though these increases were modest in absolutemagnitude, it should be emphasized that they were achieved bysimply recombining items from existing measures. Given thepotential health consequences of TABP, it seems that the mini-mal cost and effort entailed by the use of component measuresare easily justified. Of course, these implications are very tenta-
288 JEFFREY R. EDWARDS AND A. J. BAGUONI, JR.
live, in that they presume causal relationships between TABPcomponents and outcomes and generalizability of these resultsto other samples, neither of which can be verified with our data.Further research is clearly needed to replicate the componentrelationships found in the present study and to demonstratecausal relationships between these components and outcomesof interest.
Several limitations of the present study should be noted.First, we relied on cross-sectional data which, as notedpreviously, makes it impossible to rule out alternative causalexplanations for the observed relationships. For relationshipsinvolving physiological outcomes, reverse causality is unlikely,though it is certainly possible that both TABP and physiologicaloutcomes are influenced by some third variable, such as stressor maladaptive coping. However, for relationships involving psy-chological outcomes, reverse causality is much more plausible.For example, trait anxiety may generate impatient and hurriedbehaviors, and chronic depression may inhibit competitive andambitious behaviors. Our view is that these relationships areprobably bidirectional, with TABP and mental health exertingmutual effects on one another. Research in which both TABPand various outcomes are repeatedly measured over time, mayhelp clarify the nature of these relationships.
A second limitation concerns the quality and comprehensi-veness of the TABP component measures used. These mea-sures often exhibited rather modest reliabilities and, as a set,did not operationalize certain important TABP components,most notably hostility. These deficits emerged primarily be-cause the component measures used in this study were con-structed post hoc with items from widely used self-report globalmeasures. Though this strategy provided results that are readilycomparable with existing TABP research, it does not guaranteemeasures with adequate psychometric properties. For futureresearch, measures need to be developed that convincingly oper-ationalize relevant TABP components and demonstrate ade-quate reliability, validity, and unidimensionality.
A third limitation is the simplistic causal structure underly-ing the analyses of the TABP components. This is best exempli-fied in the analysis of the 15 combined component measures,which focused only on the direct effects of these components,leaving the 105 correlations among the components unana-lyzed. As a result, simple correlations between these compo-nents and outcomes, many of which were significant, could notbe fully decomposed. It is quite likely that correlations amongthe TABP components may involve causal relationships. Forexample, a hard-driving and competitive approach to work mayresult in setting unreasonably high goals, which may increaseperceived time pressure and accelerate work behaviors. Unfor-tunately, available research provides little information regard-ing the effects of TABP components on one another, making itdifficult to specify more complex causal structures. In futureresearch, causal relationships among TABP components shouldbe identified, thereby providing the necessary basis for clarify-ing the total effects of TABP components.
A fourth limitation is that several of the dependent variablesand all of the independent variables were based on self-reportmeasures. This strategy introduces common method variance,which may have inflated the correlations among these mea-
sures. However, this bias does not aifect the comparison be-tween global and component measures, for which method ofmeasurement was held constant. Furthermore, differences be-tween the global and component measures were found for bothself-report and physiological dependent variables, suggestingthat the obtained results were not contingent on method ofmeasurement.
A final limitation was the use of a single nonrepresentativesample of 240 respondents. Although this sample represents avariety of job and industry types, it was obtained by conve-nience sampling and, hence, does not permit generalizations tothe larger population of working adults. In addition, despite theuse of multivariate procedures to guard against Type I error, alarge number of statistical tests were conducted on a sample ofmoderate size. Because additional samples were not availablefor cross-validation, the results of this study must be consideredtruly exploratory. Furthermore, some of the results reported,such as the suppression effects found for the Bortner subscales,often do not survive cross-validation and, therefore, must beconsidered tentative. Additional research using large representa-tive samples is clearly needed to verify the results obtained inthis study.
In conclusion, the present study demonstrates several majoradvantages of component over global measures of TABP. There-fore, we suggest that global TABP measures should be aban-doned in favor of component measures. If necessary, these mea-sures may be constructed by recombining items from existingglobal measures. However, a far superior strategy would be todevelop new TABP component measures by carefully definingthe components of interest, constructing items that convinc-ingly represent their corresponding content domains, and ver-ifying the psychometric properties and hypothesized underly-ing structure of the resulting measures. The use of such mea-sures in empirical research ought to greatly enhanceunderstanding of the effects of TABP on mental and physicalsymptomatology.
References
Alderman, K. J., Mackay, C. J., Lucas, E. G, Spry, W B., & Bell, B.
(1983). Factor analysis and reliability of the Crown-Crisp Experien-
tial Index (CCEI). British Journal of Medical Psychology, 56. 329-
345.
Begley, T. M, & Boyd, D. P. (1985). The relationship of the Jenkins
Activity Survey to Type A behavior among business executives. Jour-nal of Vocational Behavior, 27, 316-328.
Booth-Kewley, S, & Friedman, H. S. (1987). Psychological predictorsof heart disease: A quantitative review. Psychological Bulletin, 101,343-362.
Bortner, R. W (1969). A short rating scale as a potential measure of
Pattern A behavior. Journal of Chronic Diseases, 22, 87-91.
Brief, A. P., Rude, D. E., & Rabinowitz, S. (1983). The impact of Type A
behavior pattern on subjective work load and depression. Journal ofOccupational Behavior, 4,157-164.
Burke, R. J., & Weir, T. (1980). The Type A experience: Occupational
and life demands, satisfaction, and well-being. Journal of HumanStress. 6(4), 28-38.
Burt, R. S. (1976). Interpretational confounding of unobserved vari-
ables in structural equation models. Sociological Methods and Re-search, 5, 3-52.

COMPARING GLOBAL AND COMPONENT TYPE A MEASURES 289
Buss, A. H., & Durkee, A. (1957). An inventory for assessing different
kinds of hostility. Journal of Consulting Psychology, 21, 343-349.
Byrne, D G, Rosenman, R. H, Schiller, E, & Chesney, J. A. (1985).
Consistency and variation among instruments purporting to mea-
sure the Type A behavior pattern. Psychosomatic Medicine, 47,242-
261.
Campbell, J. P. (1976). Psychometric theory. In M. D. Dunnette (Ed),
Handbook of industrial and organizational psychology (pp. 185-222).
Chicago: Rand McNally.
Caplan, R. D, Cobb, S, French, J. R. P., Jr., Harrison, R. V, & Pinneau,
S. R. (1980). Jobdemands and worker health: Main effects and occupa-tional differences. Ann Arbor, MI: Institute for Social Research.
Chesney, J. A., Black, G. W, Chadwick, J. H., & Rosenman, R. H.
(1981). Psychological correlates of the Type A behavior pattern.Journal of Behavioral Medicine, 4, 217-229.
Cohen, J., & Cohen, P. (1983). Applied multiple regression/correlation
analysis for the behavioral sciences (2nd ed.). Hillsdale, NJ: Erlbaum.
Cook, W W, & Medley, D. M. (1954). Proposed Hostility and Phari-
saic-Virtue scales for the MMPI. Journal of Applied Psychology, 38,414-418.
Cooper, C. L., & Marshall, J. (1979). Executives under pressure: A psy-
chological study. New York: Praeger.
Crisp, A. H., Ralph, P. C., McGuinness, B., & Harris, G. (1978). Psy-
choneurotic profiles in the adult population. British Journal of Medi-
cal Psychology, 51, 293-301.
Cronbach, L. J. (1951). Coefficient alpha and the internal structure oftests. Psychomelrika, 16, 297-334.
Crown, S, & Crisp, A. H. (1966). A short clinical diagnostic self-rating
scale for psychoneurotic patients. British Journal of Psychiatry, 112,
917-923.
Dearborn, J. J., & Hastings, J. E. (1987). Type A personality as a media-
tor of stress and strain in employed women. Journal of Human
Stress, 13(2), 53-60.
Dembroski, T. M. (1978). Reliability and validity of procedures used toassess coronary prone behavior. In T. Dembroski, M. Feinleib, S. G.
Haynes, & J. L. Weiss (Eds.), Coronary prone behavior (pp. 95-106).
New York: Springer-Verlag.
Dembroski, T. M., MacDougall, J. M., Shields, J. L., Petitto, J., & Lu-
shene, R. (1978). Components of the Type A coronary-prone behav-ior pattern and cardiovascular responses to psychomotor perfor-
mance challenge. Journal of Behavioral Medicine, 1,159-176.
Dielman, T. E., Butchart, A. T., Moss, G. E, Harrison, R. V, Harlan,
W R., & Horvath, W J, (1987). Psychometric properties of compo-
nent and global measures of structured interview assessed Type A
behavior in a population sample. Psychosomatic Medicine, 49,458-
469.
Dwyer, J. H. (1983). Statistical models for the social and behavioral
sciences. New \brk: Oxford University Press.
Edwards, J. R, Baglioni, A. J., & Cooper, C. L. (1990a). Examining the
relationships among self-report measures of Type A behavior pat-
tern: The effects of dimensionality, measurement error, and differ-
ences in underlying constructs. Journal of Applied Psychology, 75,
440-454.
Edwards, J. R., Baglioni, A. J., & Cooper, C. L. (1990b). The psychomet-
ric properties of the Bortner Type A scale. British Journal ofPsychol-
ogy, 81, 315-333.
French-Belgian Collaborative Group. (1982). Ischemic heart disease
and psychological patterns. Advances in Cardiology, 29, 25-31.
Frew, D. R., & Bruning, N. S. (1987). Perceived organizational charac-teristics and personality measures as predictors of stress/strain in
the work place. Journal of Management, 13, 633-646.
Friedman, M., & Rosenman, R. H. (1974). Type A behavior and your
heart. New York: Knopf.
Garber, J., Miller, S. M., & Abramson, L. Y. (1980). On the distinction
between anxiety and depression: Perceived control, certainty, and
probability of goal attainment. In J. Garber & M. E. P Seligman
(Eds.), Human helplessness: Theory and application (pp. 131-169).
San Diego, CA: Academic Press.
Gerbing, D. W, & Anderson, J. C. (1988). An updated paradigm for
scale development incorporating unidimensionality and its assess-
ment. Journal of Marketing Research, 25,186-192.
Glass, D. C. (1977). Behavior patterns, stress, and coronary disease.
Hillsdale, NJ: Erlbaum.
Hattie, J. (1985). Methodology review: Assessing unidimensionality of
tests and items. Applied Psychological Measurement, 9,139-164.
Haynes, S. G., Feinleib, M., & Kannel, W B. (1980). The relationship of
psychosocial factors to coronary heart disease in the Framinghamstudy: III. Eight-year incidence of coronary heart disease. American
Journal of Epidemiology, 111, 37-58.
Haynes, S. G, Levine, S, Scotch, N., Feinleib, M., & Kannel, W B.
(1978). The relationship of psychosocial factors to coronary heart
disease in the Framingham study: I. Methods and risk factors. Ameri-
can Journal of Epidemiology, 107, 362-383.
James, L. R. (1980). The unmeasured variable problem in path analy-
sis. Journal of Applied Psychology, 65, 415-421.
Jenkins, C. D (1971). Psychological and social precursors of coronary
disease. New England Journal of Medicine, 284, 244-255,307-317,Jenkins, C. D., Zyzanski, S. J., & Rosenman, R. H. (1979). Jenkins
Activity Survey manual. New York: Psychological Corporation.
Johnston, D. W, & Shaper, A. G. (1983). Type A behavior in British
men: Reliability and intercorrelation of two measures. Journal ofChronic Diseases, 36, 203-207.
Matteson, M. T, & Ivancevich, J. M. (1982). Type A and B behavior
patterns and self-reported health symptoms and stress: Examining
individual and organizational fit. Journal ofOccupational Medicine,
24, 585-589.
Matthews, K. A. (1983). Assessment issues in coronary-prone behav-
ior. In T. M. Dembroski, T. H. Schmidt, & G. Blumchen (Eds}, Bio-
behavioral bases of coronary heart disease (pp. 62-78). New York:Karger.
Matthews, K. A. (1988). Coronary heart disease and Type A behaviors:
Update on and alternative to the Booth-Kewley and Friedman (1987)
quantitative review. Psychological Bulletin, 104, 373-380.
Matthews, K. A., Glass, D. C, Rosenman, R. H., & Bortner, R. W(1977). Competitive drive, Pattern A, and coronary heart disease: A
further analysis of some data from the Western Collaborative Group
Study. Journal of Chronic Diseases, 30, 489-498.Mayes, B. X, Sime, W E., & Ganster, D. C. (1984). Convergent validity
of Type A behavior pattern scales and their ability to predict physio-
logical responsiveness in a sample of female public employees. Jour-nal of Behavioral Medicine, 7, 83-108.
Myrtek, M., & Greenlee, M. W (1984). Psychophysiology of Type A
behavior pattern: A critical analysis. Journal of Psychosomatic Re-
search, 29, 455-466.Novick, M. R., & Lewis, C. (1967). Coefficient alpha and the reliability
of composite measures. Psychomelrika, 32,1-13.Nunnally, J. C. (1978). Psychometric theory. New York: McGraw-Hill.Pedhazur, E. J. (1982). Multiple regression in behavioral research. New
York: Holt, Rinehart, & Winston.Price, K. P., & Clarke, L. K. (1978). Behavioural and psychophysiologi-
cal correlates of the coronary prone personality: New data and anunanswered question. Journal of Psychosomatic Research, 22, 409-
417.Rosenman, R. H. (1978). The interview method of assessment of the
coronary-prone behavior pattern. In T. M. Dembroski, S. M. Weiss,J. L. Shields, S. G. Haynes, & M. Feinleib (Eds.), Coronary-pronebehavior (pp. 55-69). New York: Springer-Verlag.

290 JEFFREY R. EDWARDS AND A. J. BAGLIONI, JR.
Rosenman, R. H., Brand, R. J., Jenkins, C. D., Friedman, M., Straus,R., & Wurm, M. (1975). Coronary heart disease in the Western Col-
laborative Group Study: Final follow-up experience of 8'/z years.JAMA: The Journal of the American Medical Association, 233, 872-
877.
Roskies, E. (1980). Considerations in developing a treatment programfor the coronary-prone (Type A) behavior pattern. In P. Q Davidson& S. M. Davidson (Eds.), Behavioral medicine: Changing health life-
styles (pp. 299-333). New York: Brunner/Mazel.
Shekelle, R. B., Schoenberger, J. A., & Stamler, J. (1976). Correlates ofthe JAS Type A behavior pattern score. Journal of Chronic Diseases,29,381-394.
Shipper, F., Kreitner, R., Reif, W E., & Lewis, K. E. (1986). A study offour psychometric properties of the Jenkins Activity Survey Type Ascale with suggested modifications and validation. Educational and
Psychological Measurement, 46, 551-564.
Somes, G. W, Garrity, T. F., & Marx, M. B. (1981). The relationship ofcoronary-prone behavior pattern to the health of college students atvarying levels of recent life change. Journal of Psychosomatic Re-
search, 25, 565-572.
Spielberger, C. D, Johnson, E. H., Russell, S. E, Crane, R. J., Jacobs,G. A., & Worden, T. J. (1985). The experience and expression ofanger: Construction and validation of an anger expression scale. InM. A. Chesney & R. H. Rosenman (Eds.), Anger and hostility in
cardiovascular and behavioral disorders (f p. 5-30). New York: Hemi-
sphere.van Doornen, L. J., & Orlebeke, K. F. (1982). Stress, personality, and
serum-cholesterol level. Journal of Human Stress, #(4), 24-29.Wilkinson, L. (1988). SYSTAT: The system for statistics. Evanston, IL:
SYSTAT.Williams, R. B. (1989). Biological mechanisms mediating the relation-
ship between behavior and coronary heart disease. In A. W Siegman
& T. M. Dembroski (Eds.), In search of coronary-prone behavior:Beyond Type A (pp. 195-205). Hillsdale, NJ: Erlbaum.
Wolins, L. (1982). Research mistakes in the social and behavioralsciences. Ames: Iowa State University Press.
Received October 13,1989
Revision received September 19,1990
Accepted September 21,1990 •
Today's Date_American Psychological Association
Subscription Claims InformationThis form is provided to assist members, institutions, and nonmember individuals with any subscription problems. With the appropri-
ate information provided, a resolution can begin. If you use the services of an agent, please do NOT duplicate claims through them anddirectly to us. PLEASE PRINT CLEARLY AND IN INK IF POSSIBLE.
RUNT FULL NAUB OR KEY NAME OF WSTmjTION MEMBER OR CUSTOMER NUMBER ( MAY BB mum ON ANY PAST issue LABEL)
DATC YOUR ORDER WAS MAILED ( OR PHONED)
P. O. NUMBER
STAIS/COUNTOY ZIP
YOUR NAME AND PHONO NUMBER
TmXs)
__PREPAID__.CHBCK__CHAROE. CHECK/CARD CLEARED DATI
(If possible, seod a copy, front and back, of your cancelled check to help us inour research of your claim.)
ISSUES: _MISSINO DWAOEO
VOL./YR. ISSUBS(S) NoTMoNTH
Thank you. Once a claim is received and resolved, delivery of replacement issues routinely takes 4-6 weeks.
»••«•.-••___•___ «»(TO BB FILLED OUT BY APA STAFF) — «MM«M>»aMB
DATE RECBIVED_ACTION TAKEN_STAFF NAME
DATEOPAcnoN_
INV. No. & DATE_LABEL #, DATE
SEND THIS FORM TO: APA Subscription Claims, 1400 N. Uhle Street, Arlington, VA 22201
E DO NOT REMOVE. A PHOTOCOPY MAY BE USED.