relationships of benthic …/67531/metadc407738/m2/1/high... · the trinity river is an urbanized,...
TRANSCRIPT
APPROVED: James H. Kennedy, Major Professor Thomas W. La Point, Committee Member Barney J. Venables, Committee Member William T. Waller, Committee Member Samuel F. Atkinson, Committee Member
and Interim Chair of the Department of Biological Sciences
Mark Wardell, Dean of the Toulouse Graduate School
RELATIONSHIPS OF BENTHIC MACROINVERTEBRATE COMMUNITY STRUCTURE
WITH LAND-USE, HABITAT, IN-STREAM WATER CHEMISTRY, DEPOSITIONAL
SEDIMENT BIOFILM FATTY ACIDS, AND SURFACTANTS IN
THE EFFLUENT DOMINATED TEXAS TRINITY RIVER
Jaime L. Slye, B.S., M.S.
Dissertation Prepared for the Degree of
DOCTOR OF PHILOSOPHY
UNIVERSITY OF NORTH TEXAS
December 2013

Slye, Jaime L. Relationships of Benthic Macroinvertebrate Community Structure
with Land-use, Habitat, In-stream Water Chemistry, Depositional Sediment Biofilm Fatty
Acids, and Surfactants in the Effluent Dominated Texas Trinity River. Doctor of
Philosophy (Biology), December 2013, 151 pp., 21 tables, 21 figures, references, 154
titles.
The Trinity River is an urbanized, effluent-dominated river, and is heavily relied
upon for drinking water. The benthic macroinvertebrate community has been monitored
for over 20 years, with the focus of this dissertation on three studies (1987-88, 2005,
and 2011). Water quality improvement following dechlorination resulted in increased
benthic metrics. Overall habitat quality, in-stream cover, surface water total organic
carbon, sediment total organic carbon, near-field urban land-use, near-field forested
land-use, surface water surfactant toxic units, and depositional sediment biofilm fatty
acids all have statistically significant relationships with benthic macroinvertebrate
metrics. These relationships are better defined with increased taxonomic resolution at
the genus/species level for all benthic taxa, including Chironomidae and Oligochaeta. It
is recommend that benthic identifications for state and city water quality assessments
be done at the genus/species level.
A novel method for quantifying depositional sediment biofilm fatty acids has
been produced and tested in this dissertation. Benthic metrics are directly related to
fatty acid profiles, with several essential fatty acids found only at upstream sites.

Copyright 2013
by
Jaime L. Slye
ii

ACKNOWLEDGMENTS
I gratefully acknowledge the guidance and expertise of my major professor Dr.
James H. Kennedy, along with my committee members Drs. Samuel F. Atkinson,
Thomas W. La Point, Barney J. Venables, and William T. Waller. Members of the
University of North Texas Aquatic Ecology Laboratory provided laboratory and field
assistance, with special thanks to Rosemary Burk, Tamara Contador, Marcus Diosdado,
Marisha Frazier, Heather Krell, Jordan Lancaster, Benjamin Lundeen, and Jeff Mabe.
Analytical chemistry assistance was provided from other UNT graduate students
Andrew Barker, David Baxter, Melinda Coogan, Ty Curran, and Dave Johnson. The
Soap and Detergent Association (SDA) and the SDA Surfactants in Sediments Task
Force provided funding and resources for the 2005 portion of this dissertation. Scientific
contributions from members of the SDA Surfactant Task Force included Scott Dyer,
Hans Sanderson, and Kathleen Stanton. Martin Selby and Remi van Compernolle from
Shell Global Solutions provided surfactant analysis. Dale Honeyfield from the USGS
provided inspiration and insight in the development of a fatty acid methyl ester analysis
protocol.
Finally, this work would not have been possible without the support from my
children Chloe and Orion, and my parents Larry and Lynn Slye. MOA.
iii

TABLE OF CONTENTS
Page
ACKNOWLEDGMENTS .................................................................................................. iii
LIST OF TABLES .......................................................................................................... viii
LIST OF FIGURES .......................................................................................................... x
INTRODUCTION ............................................................................................................. 1
CHAPTER 1 RELATIONSHIPS BETWEEN BENTHIC MACROINVERTEBRATE
COMMUNITY STRUCTURE AND LAND-USE, HABITAT, IN-STREAM WATER
CHEMISTRY, AND SURFACTANTS IN THE EFFLUENT-DOMINATED TRINITY
RIVER, TEXAS .............................................................................................................. 3
Objectives .................................................................................................................... 3
Background ................................................................................................................. 4
Urban Rivers ............................................................................................................ 4
Benthic Macroinvertebrate Biomonitoring ................................................................ 8
Texas Trinity River ................................................................................................. 12
Study Locations and Methods ................................................................................... 18
Sampling Site Locations ......................................................................................... 18
Geospatial Methods ............................................................................................... 21
Habitat Assessment ............................................................................................... 21
In-stream Water Chemistry and Surfactant Collection and Analysis ...................... 22
Toxicity and Risk Assessment Methods ................................................................. 24
Benthic Macroinvertebrate Collection and Analysis ............................................... 26
iv

Statistical Analyses ................................................................................................ 27
Results ....................................................................................................................... 29
Habitat .................................................................................................................... 29
Benthic Macroinvertebrate Community Structure ................................................... 30
Correlation Analysis ............................................................................................... 35
Multiple Regression Analysis ................................................................................. 36
Canonical Correspondence Analysis ..................................................................... 40
Conclusions ............................................................................................................... 42
CHAPTER 2 SPATIAL AND TEMPORAL TRENDS OF THE BENTHIC
MACROINVERTEBRATE COMMUNITY STRUCTURE (1988 AND 2005) ................... 46
Objectives .................................................................................................................. 46
Background ............................................................................................................... 46
1987 – 1988 Trinity River Study ............................................................................. 47
Sandra T Spon Master’s Thesis 1994 .................................................................... 49
Brynne L Bryan Master’s Thesis 1994 ................................................................... 49
Richard J Guinn Doctoral Dissertation 1995 .......................................................... 50
Jaynie M Stephenson Masters Thesis 2000 .......................................................... 51
Study Locations and Methods ................................................................................... 52
Statistical Analyses ................................................................................................ 52
Results ....................................................................................................................... 53
1988 and 2005 Benthic Macroinvertebrate Comparison ........................................ 53
1988 and 2005 Taxa similarity ............................................................................... 54
Conclusions ............................................................................................................... 58
v

CHAPTER 3 BIOFILM FATTY ACID METHYL ESTER (FAME) RICHNESS AS A
VARIABLE TO DESCRIBE VARIANCES IN BENTHIC MACROINVERTEBRATE
COMMUNITY COMPOSITION IN AN URBANIZED, EFFLUENT DOMINATED RIVER
...................................................................................................................................... 60
Objectives .................................................................................................................. 60
Background ............................................................................................................... 60
Study Locations and Methods ................................................................................... 65
Sampling Site Locations ......................................................................................... 65
Habitat Assessment ............................................................................................... 67
Sediment Sampling and Analyses .......................................................................... 67
Benthic Macroinvertebrate Community Structure ................................................... 68
Depositional Sediment Biofilm Fatty Acid Methyl Ester Analysis ........................... 69
Statistical Analyses ................................................................................................ 71
Results ....................................................................................................................... 72
Benthic Macroinvertebrate Community Structure ................................................... 72
2011 Taxa Similarity ............................................................................................... 75
Biofilm Fatty Acid Methyl Esters ............................................................................. 79
Relationships between Benthic Macroinvertebrate Data and Fatty Acid Richness 83
CCA Analysis with Selected Fatty Acid Metrics and Other Environmental Variables
to Explain Taxa Variance among Sites .................................................................. 89
Discussion ................................................................................................................. 91
Benthic Macroinvertebrate Structure and Fatty Acids ............................................ 91
Land-use, Biofilms, and Benthic Macroinvertebrates ............................................. 92
vi

Wastewater Effluent Influences .............................................................................. 94
Conclusions ............................................................................................................... 95
CHAPTER 4 IMPORTANCE OF CHOOSING THE APPROPRIATE TAXONOMIC
RESOLUTION ............................................................................................................... 97
Objectives .................................................................................................................. 97
Background ............................................................................................................... 97
Texas Trinity River ............................................................................................... 100
Study Locations and Methods ................................................................................. 102
Benthic Macroinvertebrate Collection ................................................................... 102
Statistical Analyses .............................................................................................. 103
Results ..................................................................................................................... 105
Assessment of Taxa Richness ............................................................................. 105
Canonical Correspondence Analysis ................................................................... 108
Discussion ............................................................................................................... 111
Conclusions ............................................................................................................. 113
CHAPTER 5 RELEVANCE AND IMPORTANCE ........................................................ 116
Summary of Objectives and Hypotheses ................................................................. 116
Recommendations for Future Biomonitoring ........................................................... 124
Final Conclusions .................................................................................................... 127
APPENDIX .................................................................................................................. 132
LITERATURE CITED .................................................................................................. 139
vii

LIST OF TABLES
Page
Table 1. 2005 Sample site identification number and geographic location, with rationale for the selection. Includes the habitat quality index score (HQIS) derived from nine habitat variables. ........................................................................................................... 20
Table 2. Physical and chemical variables chosen as independent variables in regression analyses for 2005a, with basic statistics and comments. ............................ 38
Table 3. MAX R2 regression summary of eight selected variables a,b. Models were selected based on: overall p values < 0.05; variables that exhibited an increased adjusted R2 of >= 0.05; variables must have a p value < 0.05. ..................................... 39
Table 4. Eigenvalue, variance explained, and total inertia of the CCA analysis of selected environmental variables with all taxa from the 2005 study. ............................. 41
Table 5. 2011 taxa list with associating CCA ordination plot number from Figure 13. Average number of individuals is listed by site number. ................................................ 77
Table 6. Fatty Acid Methyl Ester metrics. ..................................................................... 80
Table 7. Average fatty acid methyl esters in ng/g for each site with standard deviations. Long-chain polyunsaturated fatty acids that are considered essential to benthic macroinvertebrates are denoted as EFA. Fatty acids that are unique to the BAME standard are denoted with an asterisk. Values lower than the Practical Quantitation Limits (PQL) are "semi-quantitative estimates" as are all estimated BAME concentrations. .............................................................................................................. 81
Table 8. Eigenvalue, variance explained, and total inertia of the CCA analysis of FAME metrics total lipid (ng/g) and total lipid richness with all taxa from the 2011 study. ........ 85
Table 9. Eigenvalue, variance explained, and total inertia of the CCA analysis of fatty acids (ng/g) eight to 17 carbons in length with all taxa from the 2011 study. ................ 86
Table 10. Eigenvalue, variance explained, and total inertia of the CCA analysis of fatty acids (ng/g) 18 to 24 carbons in length with all taxa from the 2011 study. .................... 87
Table 11. Eigenvalue, variance explained, and total inertia of the CCA analysis of fatty acids (ng/g) unique to bacteria with all taxa from the 2011 study. ................................. 88
Table 12. Pearson’s correlation (r2) results with environmental variables and benthic macroinvertebrate metrics. Probabilities are shown. All r values are above 0.95. ....... 89
viii

Table 13. Eigenvalue, variance explained, and total inertia of the CCA analysis of selected environmental variables (urban, total lipid, instream cover, and flow) with all taxa from the 2011 study. .............................................................................................. 91
Table 14. 2005 and 2011 Sample site identification name, geographic location, with rationale for the selection, and year(s) sampled. ......................................................... 104
Table 15. Total taxa richness of 2005 sampling of all 10 Sites based on taxonomic refinements. ................................................................................................................ 105
Table 16. Total taxa richnessa of 2011 sampling of all four sites based on taxonomic refinements. ................................................................................................................ 106
Table 17. Total taxa richnessa of 2005 sampling of Elm, West1, West2, and Main1 based on taxonomic refinements. ............................................................................... 106
Table 18. Difference in taxa richness among sites for increasing taxonomic refinement in 2005 using ANOVA. Different letters represent statistically significant richness by site (Student Newman-Keuls multiple range test). ............................................................. 108
Table 19. Difference in taxa richness among sites for increasing taxonomic refinement in 2011 using ANOVA. Different letters represent statistically significant richness by site (Student Newman-Keuls multiple range test). ............................................................. 108
Table 20. Eigenvalue, variance explained, and total inertia of the CCA analysis of selected environmental variables (urban, total lipid, instream cover, and flow) with sub-family level identifications from the 2011 study. .......................................................... 111
Table 21. Eigenvalue, variance explained, and total inertia of the CCA analysis of selected environmental variables (urban, total lipid, instream cover, and flow) with species level identifications from the 2011 study. ....................................................... 111
ix

LIST OF FIGURES
Page
Figure 1. Dallas-Fort Worth Metropolitan area, 1987 and 2005 satellite images (approximately 150 kilometers (95 miles) wide and 125 kilometers (79 miles) tall, showing sampling locations, including four major wastewater treatment plants. (Site 15 is not within the satellite imagery, but is approximately 92 kilometers (57 miles) southeast of Site 14). .................................................................................................... 16
Figure 2. Stylized representation of study area showing hydrologic relationship between 10 sampling sites (circles), and four wastewater treatment plants (triangles) (see Table 1 for descriptions). ......................................................................................................... 19
Figure 3. Average number of individuals per PONAR grab for each site location in 2005. Sites with different letters are statistically significantly different from each other. ...................................................................................................................................... 31
Figure 4. Average number of taxa per PONAR grab for each site location in 2005. Sites with different letters are statistically significantly different from each other. ......... 32
Figure 5. Average diversity per PONAR grab for each site location in 2005. ............... 33
Figure 6. Average evenness per PONAR grab for each site location in 2005 .............. 33
Figure 7. CCA analysis ordination diagram of selected environmental variables with all taxa from the 2005 study. Circles represent site locations. .......................................... 41
Figure 8. Benthic macroinvertebrate abundance, taxa richness, diversity, and evenness for 1988 and 2005. An asterisk indicates a statistically significant difference between 1988 and 2005. ............................................................................................................. 56
Figure 9. Significant taxa similarity (Morisita’s Similarity Index, >0.52) of average total organisms in a) 1988 and b) 2005. In 1988, significant taxa similarity among sites are grouped by triangles (Sites 3, 4, 6, and 15), and squares (Sites 10, 13, and 14). In 2005 significant taxa similarity among sites are grouped by stars (Sites 6, 8, 10, 13, and 14). Site locations with solid circles are not significantly similar with any other site locations. Non-solid circles represent wastewater treatment plants. ............................................. 57
Figure 10. Average number of individuals for each site location in 2011. ..................... 73
Figure 11. Average number of taxa for each site location in 2011. Sites with different letters are statistically significantly different from each other. ........................................ 74
Figure 12. Significant taxa similarity (Morisita’s Similarity Index, >0.52) of average total organisms per taxa. ....................................................................................................... 76
x

Figure 13. Canonical Correspondence Analysis of taxa collected in 2011. See Table 5 for taxa list and associating CCA ordination number. .................................................... 78
Figure 14. Average Total Lipid (ng/g) from the 2011 study. ......................................... 80
Figure 15. CCA analysis ordination diagram of FAME metrics (ng/g) with all taxa from the 2011 study. Circles represent site locations, and Arrows the FAME variables ....... 85
Figure 17. CCA analysis ordination diagram of fatty acids (ng/g) 18 to 24 carbons in length with all taxa from the 2011 study. Circles represent site locations. .................... 87
Figure 18. CCA analysis ordination diagram of fatty acids (ng/g) unique to bacteria length with all taxa from the 2011 study. Circles represent site locations. .................... 88
Figure 19. CCA analysis ordination diagram of selected environmental variables with all taxa from the 2011 study. Circles represent site locations. .......................................... 90
Figure 20. CCA analysis ordination diagram of selected environmental variables with sub-family taxa from the 2011 study. Circles represent site locations. ....................... 110
Figure 21. CCA analysis ordination diagram of selected environmental variables with species level taxa from the 2011 study. Circles represent site locations. ................... 110
xi

INTRODUCTION
This dissertation research analyzes relationships between benthic
macroinvertebrate community structure with land-use, habitat, in-stream water
chemistry, depositional sediment biofilm fatty acids, and surfactant variables from the
effluent-dominated Texas Trinity River. Changes in the benthic macroinvertebrate
community structure from studies conducted from 1987 to 2011 are assessed.
Additionally, a novel method has been developed to determine biofilm fatty acid
richness in order to better understand sediment nutrient and contaminant
concentrations that influence macroinvertebrate distributions.
The content of this dissertation is divided into five chapters. The first chapter
introduces the Trinity Rivers’ history, physical attributes, and challenges. A literature
review of those challenges includes a section on urban rivers, contaminants, and
benthic macroinvertebrate biomonitoring. Additionally, a study conducted in 2005 is
presented that documents the benthic macroinvertebrate structure of the river with
relationships to land-use, habitat, water chemistry, and surfactant measurements. The
following chapter presents a temporal study of the changes in benthic
macroinvertebrate community structure from a study conducted in 1987 – 88 with the
2005 data. To better understand the conclusions of those changes, a field study was
conducted in 2011 in which benthic macroinvertebrates were sampled along with
biofilms from depositional sediment. This work is presented in chapter three. Chapter 3
contains both the 2011 benthic results, but also describes a novel method of extracting
and quantifying fatty acid methyl esters from the depositional sediment biofilms. These
fatty acids are then used as an environmental parameter to aid in the explanation of the
1

benthic macroinvertebrate variance. From the 1987 – 88, 2005, and 2011 benthic
results, an analysis of the importance of appropriate taxa resolution is warranted and is
presented in chapter 4. Chapter 5 provides an overview of the major conclusions of the
dissertation and highlights the relevance, importance, future implications, and the broad
scope of this research as it applies to modern ecological theory.
2

CHAPTER 1
RELATIONSHIPS BETWEEN BENTHIC MACROINVERTEBRATE COMMUNITY
STRUCTURE AND LAND-USE, HABITAT, IN-STREAM WATER
CHEMISTRY, AND SURFACTANTS IN THE EFFLUENT-
DOMINATED TRINITY RIVER, TEXAS 1
Objectives
The goal of this chapter is to provide an assessment of the influence of
watershed land-use, drainage/soil characteristics, habitat quality, wastewater treatment
plant (WWTP) discharges, and in-stream physical/chemical characteristics on the
distribution of surfactant residues and the subsequent potential risk towards the benthic
macroinvertebrate community structure.
Objectives include:
1) Characterization of the benthic macroinvertebrate community structure of the
Upper Trinity River in the Dallas-Fort Worth metropolitan area
2) Identification of the relationships between geospatial land-use, habitat, and in-
stream water chemistry with the benthic macroinvertebrate community structure
in the Dallas-Fort Worth metropolitan area
3) Evaluate relationships between the benthic macroinvertebrate community
structure and surface water surfactant toxic unit (TU) measurements.
1 Study methods, results, and discussion sections of this chapter have been published in Slye JL, Kennedy JH, Johnson DR, Atkinson SF, Dyer SD, Ciarlo M, Stanton K, Sanderson H, Nielsen AM. 2011. Relationships between benthic macroinvertebrate community structure with geospatial, habitat, in-stream water chemistry, and surfactants in the effluent dominated Texas Trinity River. Environ Toxicol Chem. 30(5): 1127-1138. .
3

Specific hypotheses that are tested are as follows:
1. HO Benthic macroinvertebrate community structure metrics (average
abundance, richness, diversity, evenness, Oligochaeta, and Chironomidae
abundance and richness) are not correlated to land-use, water chemistry,
surfactant, and habitat parameters.
2. HO Benthic macroinvertebrate community structure (average abundance,
richness, diversity, evenness, Oligochaeta, and Chironomidae abundance)
cannot be predicted using a determined model of parameters selected
from land-use, water chemistry, surfactant, and habitat data.
Background
Urban Rivers
Increased human population has brought an array of historical changes to rivers
and their surrounding watersheds. Alterations of watersheds include deforestation of
the riparian area, increased agriculture that leads to siltation and nutrient loading,
channelization of rivers, and increased impervious surface cover (ISC) from urban
development (Dunne and Leopold 1978). Chemical contamination from point and non-
point source loadings within the watershed may lead to modifications of biological
integrity and function to organisms on a molecular level to community wide scales
(Brooks et al. 2006).
Urban development in watersheds alters terrestrial landscape substrate, such as
increased concrete area and manicured lawns. This increase in impervious surface
impacts aquatic systems by changing the hydrology, geomorphology, stream habitat,
and runoff from urbanized groundcover. Impervious surface decreases infiltration of
4

rainfall into the surrounding porous soils, which results in increased surface runoff
amount and velocity into waterways (Dunne and Leopold 1978). As percent catchment
ISC increases to 10-20%, runoff increases two-fold; 35-50% ISC increases runoff three-
fold, and 75-100% ISC increases surface runoff more than fivefold over forested
catchments (Arnold & Gibbons 1996). Many thresholds of degradation in streams are
associated with an ISC of 10-20%, such as increasing peak discharge while decreasing
lag time between peaks (Espey et al. 1965). Cuffney et al. (2010) find that the 10-20%
impervious surface criterion is not acceptable, but instead conclude that there is an
immediate response that generally continues in a linear fashion. In addition, other
alterations of aquatic habitat, such as decreased large woody debris, decreased cobble
and gravel, increased fine sediment, and increased coarse sand fractions have been
observed in urban channels as a result of altered velocities (Finkenbine et al. 2000,
Pizzuto et al. 2000).
The chemical loading from point and non-point sources into urban catchments
result in increased loading of nutrients, metals, pesticides, as well as other
contaminants such as pharmaceutical and personal care products (PPCPs). Sources of
chemicals include urban/residential runoff, WWTPs, combined sewer overflows, and
stormwater drainage. As a result, there is a trend of increased oxygen demand,
conductivity, suspended solids, ammonium, hydrocarbons, and metals in urban
watersheds (Paul and Meyer 2001). Implementation of better WWTP technologies can
improve effluent quality and lead to increased dissolved oxygen and dechlorination of
effluent. While improvements are needed, treatment cannot remove all constituents
associated with these contaminates from wastewater, treatment systems fail, and
5
permitted discharge limits are exceeded. Furthermore, new concerns are now present
as emerging contaminants such as pharmaceutical and personal care products
(PPCPs) are increasingly released from WWTP effluents in unknown quantities.
Pharmaceutical and personal care products in urban waters have been
recognized as emerging contaminants in recent years. Pharmaceuticals and chemicals
included in the formulation of personal care products that are discarded “down the
drain” become constituents of wastewater effluents and are the major sources of
PPCPs in urban areas. Levels of PPCPs enter the waterways continuously from
effluents, resulting in “pseudo-persistence” (Daughton 2007). This constant presence of
PPCPs may alter normal functioning of ecosystems, at the organismal, biochemical,
physiological, reproductive, and ecological process levels (Brooks et al. 2006). The
release of PPCPs, especially drug residues such as heart medications, anti-
depressants, and/or endocrine disruptors, are of particular concern for river water that is
processed, or “re-used”, for human consumption (Daughton 2007). PPCPs have a
range of modes of actions including, baseline toxicity that results in narcosis, enzyme
inhibition or specific receptor binding, inhibition of photosynthesis, endocrine disruption,
and reactive toxicity (Escher et al. 2005). There are several ways to assess the
exposure and potential risk from PPCPs, with most of the techniques focusing on
vertebrate responses or endpoints. For example, estrogen-containing pharmaceuticals
have been measured in adult male fish using the biomarker vitellogenin (Huggett et al.
2003a). In addition, it has been proposed that mammalian pharmacological data may
be used to estimate fish response to exposure (Huggett et al. 2003b). However,
pharmaceuticals may exert different toxicities to invertebrates than that seen in
6

vertebrates (Brooks et al. 2006). The effects of exposure to PPCPs in effluent
dominated urban waterways to benthic macroinvertebrates have not been investigated
(Brooks et al. 2006).
The potential interactions of pharmaceuticals with other chemicals or personal
care products, such as surfactants, that have different and similar mechanisms of
action, are not known (Ostroumov 2002). Surfactants, such as alkyl sulfates (AS), alkyl
ethoxylates (AE), alkyl ethoxysulfates (AES), and linear alkylbenzene sulfonates (LAS),
are used in high volumes in detergent and personal care products (Sanderson et al.
2006, Dyer et al. 2006) and are considered to be part of the PPCPs introduced by
WWTP effluents (Knepper and Berna 2003). The micelles that are formed by
surfactants act as emulsifying or foaming agents that bind to dirt, grease, or other
organic substances in the solvent, usually water. The most widely used surfactant is
linear alkyl benzene sulfonates (LAS) that have a reported annual global production of 3
X 106 t in 2001 (Knepper and Berna 2003). In addition to LAS, alkyl ethoxysulfates
(AES) are produced in high quantities for use in laundry and cleaning detergents, as
well as cosmetic products (Knepper and Berna 2003). Toxic metabolites of surfactants
in WWTP effluent have also been detected. The amphipathic properties of surfactants
and low water solubility promote partitioning into organic materials and sorption to
sediments (Knepper and Berna 2003). Sorption to sediments is dependent on physio-
chemical parameters, such as temperature, pH, organic carbon content, and suspended
solids (Gonzalez-Mazo and Leon 2003). Because of the surface-active properties,
surfactants also have the ability to attach to non-polar contaminants, such as heavy
metals. These properties of surfactant behavior and contaminant binding have the
7

potential to increase the bioavailability of contaminants to aquatic organisms, either by
direct contact or ingestion. The cell membranes of benthic macroinvertebrates are
lipophilic and thus surfactants may have detrimental effects on these organisms by
increasing the permeability of their membranes and leading to the disruption of the
membrane integrity (de Voogt et al. 2003). Also, the ecotoxicity of mixtures of chemical
compounds (as would be expected in WWTP effluent) with surfactants is unknown
(Blasco et al. 2003).
Benthic Macroinvertebrate Biomonitoring
The effects of exposure to PPCPs in effluent dominated urban waterways to
benthic macroinvertebrates have not been investigated (Brooks et al. 2006).
Characterization of the benthic community and the relationship to surfactant
concentration provides an additional line-of-evidence for assessing the potential risk of
surfactants, as well as other contaminants, due to the sedentary nature of the
organisms, large number of species available, and their ubiquitous occurrence
(Rosenberg 1992).
Biological monitoring uses the responses (indirect or direct) of organisms to
assess whether the environment is favorable to living material (Cairns & Pratt 1993). In
the last hundred years, biomonitoring of aquatic systems has evolved from a relatively
simple description of the presence or absence of a single taxa to a complex science that
interprets community structure with associated environmental quality parameters, with
the main goal of evaluating the ecological health of a system. In the beginning of the
20th century, Kolkwitz and Marson (1908) developed the saprobian system that uses
the presence or absence of ‘biological indicators’ to determine the degree of organic
8

enrichment pollution in rivers that result in detrimental reductions of dissolved oxygen.
Subsequently, the work of Thienemann (1925) Lindeman (1942) contributed to the
understanding of lake ecology, along with the trophic relationships of aquatic organisms.
In the middle of the 20th century, other researchers made significant contributions in
biomonitoring. Ruth Patrick (1949) and colleagues demonstrated the ability of using
community structure to respond to perturbations. They utilized several taxonomic
groups, including diatoms, as biological measures of stream condition. In the 1980’s,
ecologists began focusing on the energetics of streams and rivers to assess
environmental health. The River Continuum Concept (Vannote et al. 1980) was based
on functional feeding group organization of stream invertebrates from the work of
Cummins and Klug (1979) and their relationship to the energy sources as a stream
becomes larger with the addition of tributaries. Although criticized, the concept
established a way of thinking that has influenced stream ecosystem research for over
30 years. The integration of multiple environmental variables in the analysis and
classification of stream ecosystems have become essential techniques of biomonitoring
(Whittier et al. 1988). These include not only general water chemistry, but also
geophysical and habitat parameters.
By the end of the 1980s, waterways were still heavily impacted by both chemical
and physical alterations by industrial, commercial, and agricultural land-uses (Karr
+1991). The use of the Index of Biotic Integrity (IBI) was introduced and provided a
multi-parameter tool for the assessment of biotic integrity in running waters (Karr 1991).
To be able to assess the degree of waterway impairment, an ideal IBI would be
sensitive to all stresses placed on biological systems by human society, while also
9

having limited sensitivity to natural variation in physical and biological environments
(Karr 1991). The index would detect degradation, identify the cause, and assess if
improvement resulted from management actions (Karr 1991). Using the IBI,
standardized qualitative biomonitoring was streamlined to assess wadeable streams
(Lenat 1988, Karr 1991).
Today, six general trends are repeatedly found in the literature regarding recent
developments in biomonitoring/bioassessment techniques:
1) Use of a combination of environmental parameters associated with
geophysical, in-stream water chemistry, habitat, and biotic metrics to
determine what environmental variables can predict biological community
structure (Norris and Thoms 1999, Poulton et al. 2002, and Norris et al. 2007)
2) The need for bioassessment protocols that are cost efficient while effectively
answer questions regarding the degree of stream/river impairment (Bonada et
al. 2006, Flotemersch et al. 2006)
3) Rather than defining a reference site, determine a set of reference conditions
to compare both the environmental parameters and biota collected from an
impaired sites’ conditions (Reynoldson et al. 1997, Chessman and Royal
2004)
4) In addition to community structure, use of the measurement of benthic
metabolism and nutrient cycling as a measure of catchment disturbance by
determining gross primary production and algal biomass (Fellows et al. 2006),
or nutrient transformation (Udy et al. 2006)
10

5) Incorporation of a multivariate analysis approach using metrics associated with
geophysical, in-stream water chemistry, habitat quality, and biotic metric data
collected to be used to understand the effects of environmental disturbance,
including land-use changes (Thorpe and Lloyd 1999, Boyle and Fraleigh 2003,
Dodkins et al. 2005, Leunda et al. 2009)
6) Development of better habitat assessment and bioassessment for non-
wadeable rivers, as opposed to those that are specific to wadeable streams
(Lazorchak et al. 2000, Flotemersch et al. 2006, Wilhelm et al. 2007). This is a
desired development in river biomonitoring, as the habitat parameters currently
measured (for example number of riffles) are not applicable
Current biomonitoring centers on community-based studies of benthic
macroinvertebrates. Benthic macroinvertebrates are used due to the ease of sampling
and identification of organisms that are relatively long-lived and immobile, and directly
tied to the energy dynamics, habitat quality, water quality, and health of the system
(Cairns and Pratt, 1993). Effects from increased urban land-use can be quantitatively
measured using benthic macroinvertebrates. General biotic response to urbanization
includes decreased diversity and abundances in response to toxins, temperature
change, siltation, and organic nutrients; and increased abundances in response to
inorganic and organic nutrients (Resh and Grodhaus 1983, Wiederholm 1983, Gray
2004). Benthic macroinvertebrates have been shown to have an increase in the
bioaccumulation of synthetic and toxic organics and heavy metals, with resulting
increases in mortality rates and deformities (Allan 2004, Pratt et al. 1981, Medeiros et
al. 1983).
11

Benthic biomonitoring is best suited to assess the changes from increased
urbanization, habitat changes, and influxes of point and non-point source loadings of
chemical contaminants. There are many river and stream systems that have been
monitored for changing benthic community structure due to urbanization, and some for
increased contaminant loading. In the literature, these systems are primarily located in
the upper Midwest or northern United States with rock rubble substrates and temperate
climates. As such, the ultimate contrasting scenario would be to monitor an effluent
dominated river that has been severely impacted by rapid urbanization, with substrates
consisting mainly of fine silt, sand, and clay.
Texas Trinity River
The Trinity River, Texas, USA flows through the Dallas-Fort Worth metropolitan
area, and is typical of many urban rivers in the arid, southwestern United States, where
river flow is dominated by effluent from municipal WWTPs (estimated at over 600 million
gallons of effluent discharged per day). North central Texas has experienced significant
growth within the past 100 years, resulting in marked changes in land-use. In the
1900s, the population was approximately 600,000, with the major land-use
characterized as forest/agriculture. Decades of abuse and neglect by industry,
agriculture, livestock processing plants, and typhoid outbreaks resulted in the Trinity
River being compared to the river River Styx, the Greek mythological river of death
(Trinity River Sanitary Survey prepared for the Texas State Board of Health, 1925).
With the passing of the Federal Water Pollution Control Act of 1972 and the Clean
Water Act of 1977, water quality began to improve. This improvement allowed for an
increase in the use of the river and its tributaries to meet citizens’ needs for drinking
12

water and recreation sources. The Upper Trinity River Basin Comprehensive Sewage
Plan was created in 1971 to address long-range water quality problems in the Trinity
River. Implementation of this plan resulted in construction of the large regional
WWTPs, elimination of many small industrial and municipal WWTPs, and upgrades to
obtain secondary levels of treatment. However during the 1960s, population growth in
the area placed increased waste loads on the WWTPs and inadequately treated
wastewaters were periodically discharged, particularly during the times of hydraulic
overloading (Dickson et al. 1989). Major improvements were made at the four major
WWTPs located on the river beginning in the 1970s. These improvements resulted in
increased dissolved oxygen, and decreased biochemical oxygen demand (BOD),
suspended solids, and ammonia (Dickson et al. 1989). However, several other water
quality issues continued to generate attention of the public and public officials. These
included fish kills, lawsuits by downstream property owners over water quality
degradation, non-point source loadings, control of toxic chemicals, use of attainability of
the river and associated stream classifications, and dechlorination of wastewater
effluents (Dickson et al. 1989). By 1980, the total population of north central Texas was
over 3 million. The rapid increase in population led to increased non-point sources of
runoff from yards, streets, parking lots, industrial areas, and other impervious surfaces.
The runoff transported suspended solids, nutrients, pesticides and herbicides, metals
and other contaminants associated with urban activities (Dickson et al. 1989). The
Clean Water Act of 1987 specified that chemicals could not be discharged in toxic
amounts. To address this mandate, the EPA implemented the water quality based
approach for toxics control. Whole Effluent Toxicity testing was implemented. In 1988,
13

the Texas Water Commission developed water quality standards for a number of
chemicals. In 1989, segment 0805 of the Trinity River was listed on the 304 (1)
designation based primarily on levels of lead and cadmium exceedances of water
quality standards (Dickson et al. 1989).
In 2000, the population reached 5.25 million, representing a 70% increase in 18
years leading to larger WWTP releases in the river (Texas Water Development Board,
2006). Future predictions estimate the north central Texas population to be 8 million in
2020 and over 13 million by 2060. The majority of this growth is expected to occur in
Dallas, Denton, and Collin counties (> 1,000,000 people). The population influx has
resulted in changing land usage in the region around the DFW metropolitan area.
Satellite images taken in 1987 and 2004 document these changes in the DFW
metropolitan area (Figure 1). These clearly illustrate the dramatic increase in residential
and urban land usage (light blue area) around DFW in a 17-year period. The arid
environment, rapid urbanization, and lack of dilution of WWTP effluent presents an
opportunity to examine the environmental behavior of household chemicals in a major
river system under near-worst-case circumstances.
The Trinity River consists of three main branches, the West Fork, the Elm Fork,
and the East Fork, all of which converge into the main stem near or within the DFW
metropolitan area. A minor branch, the Clear Fork, converges with the West Fork near
Fort Worth. All four branches are located in the upper Trinity River watershed. The
watershed drains approximately 29,000 km2 (18,000 miles2) from just south of the
Oklahoma border in Montague County to Galveston Bay on the Gulf of Mexico. The
14

river ranges in elevation from over 300 m (1000 ft) in the headwaters to 150 m (550 ft)
in the DFW area to sea level at the mouth.
The Trinity River flow is strongly influenced by both natural and anthropogenic
sources. Rainfall patterns in north central Texas result in highest river flow in the
spring, a dramatic decline in the summer, and a rise to moderate levels in the fall. The
Trinity River of Texas is a heavily urbanized watershed and is effluent dominated,
particularly in the summer when effluent can account for 95% of the water in the river
(Trinity River Authority 2006). The basin provides drinking water for approximately half
of the State’s population, including the Dallas Fort-Worth (DFW) metropolitan area to
the north, as well as Houston to the south (Trinity River Authority 2007).
15

Figure 1. Dallas-Fort Worth Metropolitan area, 1987 and 2005 satellite images (approximately 150 kilometers (95 miles) wide and 125 kilometers (79 miles) tall, showing sampling locations, including four major wastewater treatment plants. (Site 15 is not within the satellite imagery, but is approximately 92 kilometers (57 miles) southeast of Site 14).
16

Overall, 6 WWTPs are located on the West Fork (363 MGD), 19 WWTPs are on
the Elm Fork (123 MGD), 17 WWTPs are on the East Fork (220 MGD), and 12 WWTPs
discharge into the Trinity River main stem (361 MGD), for a total of 1066 MGD
discharged into the rivers and streams of the upper Trinity River watershed. There are
four major WWTPs in the upper Trinity River watershed: Village Creek Wastewater
Treatment Plant, TRA Central Regional Wastewater System, Dallas-Central
Wastewater Treatment Plant, and Dallas-Southside Wastewater Treatment Plant.
These 4 WWTPs treat and discharge 665 MGD, or 62 % of all effluent, into the upper
Trinity River watershed.
The first of two field studies for my dissertation research was conducted in
collaboration with The American Cleaning Institute (formerly known as The Soap and
Detergent Association) “Surfactants in Sediments Task Force” and EA Engineering,
Science, and Technology, Inc., to examine potential ecological effects of surfactants in
the Trinity River in the DFW metropolitan area. The objective of the study was to
identify sources of surfactants, their fate, and possible indicators of effects on benthic
macroinvertebrates. The study integrated watershed land-use, drainage/soil
characteristics, habitat quality, WWTP discharges, and in-stream physical/chemical
characteristics in order to analyze the distribution of surfactant residues and benthic
macroinvertebrate community structure. The Trinity River was chosen for this study
because of the existing historical data from a previous study conducted in 1987 – 88,
and the location of the river in a semi-arid, rapidly urbanizing landscape with heavy
effluent loading.
17

Study Locations and Methods
Sampling Site Locations
The study covered the Upper Trinity River watershed area of 33,323 km2, or
approximately 70% of the entire watershed (Figure 1). The sampling site locations were
chosen to be the same as in the historical study. Four least-impacted sample sites
were selected: one on the Elm Fork (Site 2); two on the West Fork (Sites 3 and 4); and
one on the East Fork (Site 12) (Table 1 and Figure 2). Sites 2 and 3 were selected to
characterize baseline river conditions (i.e., before addition of effluent) in less urbanized
areas, while Site 4 represents baseline river conditions in urban areas. Site 12
characterizes inputs from the East Fork before confluence with the main stem. Once
the baseline stations were established, sites linked to the potential inputs of surfactants
were selected based on proximity to one of the four major municipal WWTPs. Three
sites (6, 8, and 10) were sampled to characterize the mixing of effluent and river water
as the Trinity River passes through the Dallas-Fort Worth metropolitan area, both
downstream from a major WWTP and immediately upstream of inputs from the next
WWTP. Finally, the study design included three sites (13, 14, and 15) for the purpose
of characterizing the river downstream of the Dallas-Fort Worth metropolitan area. Site
15 is over 160 km southeast of Dallas. At each site, in-stream water chemistry, habitat,
and biota were sampled. In addition, effluent was collected for chemistry analysis from
the four major WWTPs (Sites 5, 7, 9, and 11). All sampling was conducted between
September 30 and October 4, 2005.
18

Figure 2. Stylized representation of Trinity River study area showing hydrologic relationship between 10 sampling sites (circles), and four wastewater treatment plants (triangles) (see Table 1 for descriptions).
19
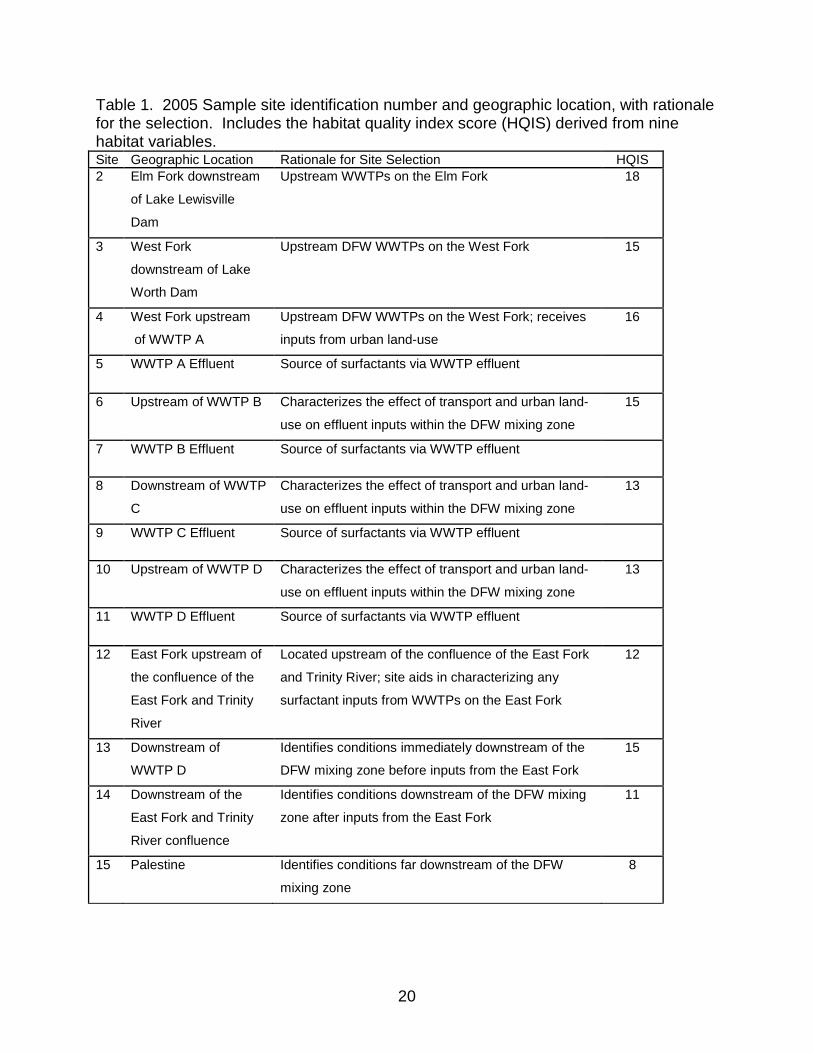
Table 1. 2005 Sample site identification number and geographic location, with rationale for the selection. Includes the habitat quality index score (HQIS) derived from nine habitat variables. Site Geographic Location Rationale for Site Selection HQIS 2 Elm Fork downstream
of Lake Lewisville
Dam
Upstream WWTPs on the Elm Fork 18
3 West Fork
downstream of Lake
Worth Dam
Upstream DFW WWTPs on the West Fork 15
4 West Fork upstream
of WWTP A
Upstream DFW WWTPs on the West Fork; receives
inputs from urban land-use
16
5 WWTP A Effluent Source of surfactants via WWTP effluent
6 Upstream of WWTP B Characterizes the effect of transport and urban land-
use on effluent inputs within the DFW mixing zone
15
7 WWTP B Effluent Source of surfactants via WWTP effluent
8 Downstream of WWTP
C
Characterizes the effect of transport and urban land-
use on effluent inputs within the DFW mixing zone
13
9 WWTP C Effluent Source of surfactants via WWTP effluent
10 Upstream of WWTP D Characterizes the effect of transport and urban land-
use on effluent inputs within the DFW mixing zone
13
11 WWTP D Effluent Source of surfactants via WWTP effluent
12 East Fork upstream of
the confluence of the
East Fork and Trinity
River
Located upstream of the confluence of the East Fork
and Trinity River; site aids in characterizing any
surfactant inputs from WWTPs on the East Fork
12
13 Downstream of
WWTP D
Identifies conditions immediately downstream of the
DFW mixing zone before inputs from the East Fork
15
14 Downstream of the
East Fork and Trinity
River confluence
Identifies conditions downstream of the DFW mixing
zone after inputs from the East Fork
11
15 Palestine Identifies conditions far downstream of the DFW
mixing zone
8
20

Geospatial Methods
Geospatial parameter data from north central Texas were obtained in the form of
shapefiles or raster images from several state and federal agencies and re-projected in
a Texas-specific projection system called Texas Centric Mapping System/Albers Equal
Area (TX Albers). This projection system, based on the Albers Equal Area projection, is
optimized for mapping the entire state within a single dataset. The Texas Centric
Mapping System/Albers Equal Area projection system utilizes algorithms that minimize
distortions of area, specifically for Texas. The available variables were analyzed by
near-field (i.e., individual) sub-watersheds within the Upper Trinity River watershed,
based on the land and water located between an upstream and a downstream sampling
site. Data were also analyzed by far-field (i.e., cumulative) sub-watersheds; that is, all
the land and water located upstream from the sampling site of interest. For complete
details of the geospatial methods used in this study refer to Atkinson et al. (2009) and
Johnson (DR Johnson, 2008, Master’s thesis, University of North Texas, Denton,
Texas, USA).
Habitat Assessment
A habitat assessment was performed at each site using modified procedures of
the Texas Commission on Environmental Quality Receiving Water Assessment
Procedures Manual (1999). The habitat parameters observed and measured were used
to calculate a Habitat Quality Index Score (HQIS). The HQIS consists of nine
parameters: available in-stream cover, bottom substrate stability, number of riffles,
dimensions of largest pool, channel flow status, bank stability, channel sinuosity,
riparian buffer vegetation, and aesthetics of reach. Each parameter was scored
21

according to a pre-defined algorithm and the nine scores were summed for an overall
index of quality. Additionally, the latitude, longitude, depth, flow, width, slope of banks,
sediment, and vegetation types for each transect were recorded. One of the main
purposes of a habitat assessment is to provide an estimate of the aquatic life potential.
The parameters measured to compile the HQIS are useful in determining environmental
conditions that may have beneficial or detrimental effects to fish and
macroinvertebrates. The HQIS measures the quality of habitat for all aquatic
macroinvertebrates, including the sediment dwellers.
In-stream Water Chemistry and Surfactant Collection and Analysis
Samples for in-stream water chemical analysis and surfactant concentrations
were collected concurrently with the benthic samples. Sediment, interstitial water, and
surface water were collected from the ten sampling sites, as well as effluent from the
four major WWTPs. Additional samples were taken at Sites 2, 5, and 8 for laboratory
quality assurance (matrix spiking and duplicate matrix spiking of surfactants). Sampling
and preservation methods were based on Sanderson et al. (2006), who found that
samples preserved with 8% formalin did not lose surfactants over a 14-d period,
whereas unpreserved samples showed a 57% loss of surfactant over the same time
period. Therefore, the samples for surfactant analysis were preserved with 8% formalin
to minimize surfactant degradation. Surface water samples were collected using
decontaminated bottles that were submerged directly below the surface of the water
until full. A total of 5 L of surface water was collected at each location to be analyzed
for target surfactants, and 1 L was collected for general chemistry analysis. Samples
were collected for sediment and interstitial water analyses. Sampling was biased
22

towards areas of fine, depositional sediment, since these are most likely to contain
surfactants. Sediment samples were collected using a petite PONAR grab (Wildco,
Yulee, FL, USA). The sample was placed in a decontaminated 20 L bucket; buckets
were decontaminated by washing with tap water from off-site, followed by a brief rinse
using deionized water and methanol. A sample of whole sediment was collected for
surfactant analysis and placed in a 500 ml container preserved with 8% formalin.
Interstitial water was collected via a rotating drum separator. Approximately 2 L of
sediment was placed in the drum at a time, which was spun to separate interstitial
water. A total of 5 L of interstitial water was collected per site for the analysis for target
surfactants. Additional volume was collected and sent for the analysis of the general
physical and chemical parameters. Samples were stored on ice and in darkness during
transfer to the laboratory at the University of North Texas. Interstitial water samples for
surfactants and general chemistry parameters were centrifuged in the laboratory due to
the high concentration of suspended solids that were not removed by the rotating drum
separator. Samples were shipped to Accu-Test (Dayton, NJ, USA) for general in-
stream chemistry analyses and to Shell Global Solutions (Manchester, UK) for
surfactant analyses. For complete details on in-stream chemistry and surfactant
collection and analysis, refer to Atkinson et al. (2009), University of North Texas (2007)
and Johnson (2008).
Alkyl ethoxylates, AES/AS, and LAS surfactants were collected from sediment,
surface water, and sediment interstitial water, or pore water, using methods described
by Shell Global Solutions (Selby 2006). Limits of quantitation for each surfactant entity
were defined as the limit of detection plus three standard deviations. When none were
23

detected, a value equal to one-half the limit of quantitation was used as the numerical
value representing the surfactant concentration. All resulting aqueous surfactant
concentrations were compared to toxicity values for each respective surfactant. Given
that surfactants occur as mixtures, methodologies have been developed that account
for the assessment of co-occurring constituents.
Toxicity and Risk Assessment Methods
Acute and chronic quantitative structure-activity relationships (QSAR) have been
developed for the anionic and nonionic surfactants. These QSARs have been tested
and verified via acute and chronic laboratory tests. Single surfactants, as well as
commercial surfactant mixtures, have been tested via several model ecosystem studies
to verify that the chronic toxicity-to-model ecosystem extrapolation ratios ranged from
one to ten. For each respective surfactant (LAS, AES, and AE), toxic units (TUs) were
generated for community-level responses using single species acute and/or chronic
toxicity values predicted from QSARs and converted to a community value, using
chronic-to-model ecosystem ratios. This approach was used by Sanderson et al. (2006)
and Dyer et al. (2006) but also developed by Belanger et al. (2006) and Boeije et al.
(2006). Boeije et al. (2006) describes the development of acute and chronic QSARs for
alcohol and alcohol ethoxylates and how these can be used to estimate mixture
responses. Belanger et al. (2006) provides rationale for how monitored chain lengths
were used to determine the number of toxic units for mixtures and compares them with
experimental stream responses. The entire approach allowed for the predicted risk at
the ecosystem level. A more detailed explanation follows.
24

For LAS, the toxicity of each constituent was estimated via the acute toxicity
(QSAR) from Fendinger et al. (1994). The acute endpoint was converted to a chronic
endpoint via the use of the acute-to-chronic ratio of 2.95 from Versteeg and Rawlings
(2003). To estimate community-level responses, a chronic-to-model ecosystem ratio of
3.73 was used (Belanger et al. 2002). The net result are TUs representing the ratio of
measured surfactant constituent concentrations to the predicted no effect concentration
(PNEC). Using concentration addition principles, the TUs of all constituents were
summed to determine the total toxic load for all constituents as a mixture.
A similar approach was used for AES, but a chronic QSAR from Dyer et al.
(2006) was used to estimate constituent concentrations. A chronic-to-model ecosystem
ratio of 1 was used to estimate the PNEC, because there is sufficient evidence from
Belanger et al. (1995a and 1995b) and Lizotte et al. (2002) that laboratory chronic
studies with sensitive organisms (e.g., Ceriodaphnia dubia) are more sensitive than
community-level responses, hence a more conservative estimator of potential
ecosystem effects.
The potential hazard and risk of AEs were estimated using the AE Workbook, as
published by Belanger et al. (2006) and Boeije et al. (2006). Specifically, a deterministic
use of a chronic QSAR with Daphnia magna with an assessment factor of 10 (to
account for potential ecosystem-level responses) was used to predict the PNEC for
each AE constituent. Furthermore, due to some AE constituents being highly sorptive
to solids and organic carbon, dissociation constants (Kds) from van Compernolle et al.
(2006) were used to convert solids concentrations to pore water values, allowing for the
25

determination of sediment-based AE TUs. The toxic units for all AE constituents were
summed to derive a total TU.
Because all surfactant constituents are thought to exert the same mode of action
(i.e. narcosis), the estimated TUs for AE, AES, and LAS were added together to
estimate the total surfactant TU. This calculation was applied separately to surface
water and pore water concentrations.
Benthic Macroinvertebrate Collection and Analysis
The benthic macroinvertebrate samples were taken from 30 September and 4
October 2005. The majority of the habitat/substrate type in the Trinity River is
depositional with sand, silt, and clay being the dominating substrate. As mentioned
previously, because surfactants have a strong affinity to sorb to sediments, the
depositional habitat was a suitable choice to examine the effects of surfactants on the
benthic macroinvertebrate community that live in direct contact with the sediment
(Sanderson et al. 2006). Benthic macroinvertebrates from depositional areas were
collected using a weighted petite PONAR grab (Wildco, Yulee, FL, USA) with a sample
area of 152 mm2. The PONAR grab sampling technique is the preferred method of
collecting sand/silt/clay substrate in depositional areas of non-wadeable rivers, with
moderate currents (Elliot and Drake 1981) (Texas Commission on Environmental
Quality Receiving Water Assessment Procedures Manual 1999). All benthic metrics are
expressed as “per PONAR grab”. A total of four replicate samples were collected within
a 150 m reach and field-washed through an American Society for Testing and Materials
no. 80 sieve (150 µm mesh). The smaller mesh size was used to collect the highest
possible abundance of oligochaetes and first instar insects. Each concentrated
26

replicate was preserved in a buffered 10% formalin solution and transferred to 70%
ethanol in the lab. Samples were processed to remove excess silt, and the organisms
were found using a dissection microscope. Unless damaged or in an early
developmental stage, specimens were identified to genus (except for nematodes,
bivalves, and gastropods) using various taxonomic keys (Wiederholm 1983, Merritt and
Cummins 1996, Kathman and Brinkhurst 1998, Epler 2001). Oligochaeta and
Chironomidae were mounted on microscope slides using CMC-9 (Masters Chemical,
Wood Dale, IL, USA), following methods described by Epler (2001) and Kathman and
Brinkhurst (1998) for identification.
Macroinvertebrate population metrics used for data analyses include the
following: average total organisms, total organisms, richness, evenness, Brillouin’s
diversity (Brillouin 1960), and average abundances of the taxa Chironomidae,
Chironominae, Tanypodinae, Orthocladiinae, Naididae, Tubificinae, and Naidinae.
Brillouin’s diversity index was chosen over other diversity indices, because earlier
studies on the Trinity River used Brillouin’s in determining diversity patterns.
Statistical Analyses
All tests to determine statistical significance were set at an α-level of 0.05.
Assumptions for all tests of significance were determined. Homogeneity of variance
was tested using an F-test, while normality was tested using the Shapiro-Wilks test for
normality (Sneath and Sokal 1973). If violations occurred, a log transformation was
used. Analysis of variance (ANOVA) was used to determine if there was a statistically
significant difference of a benthic metric among sites. A posteriori testing to determine
27

which sites were significantly different was conducted using a Student-Newman-Keuls
test (SNK) (SAS 2008).
Pearson’s correlation procedure tested all geospatial, habitat, in-stream
chemistry, and benthic macroinvertebrate variables for statistically significant
correlations (SAS 2008). This generated a large matrix of positively and negatively
correlated variables. When two variables were auto-correlated, best professional
judgment determined which variable was more ecologically useful in describing the
benthic metrics. A multiple MAX R2 stepwise regression procedure (SAS 2008) was
used to identify the best set of independent variables to explain variation of the
dependent benthic population metrics. The independent variables ultimately chosen
were determined by the examination of the correlation analysis discussed above.
Surfactant SWTUs were included as one of the possible variables to satisfy the
objective of determining relationships between benthic metrics and measured surfactant
levels, but otherwise would not have passed the a priori screening. To determine the
best model to use with each dependent benthic variable, the following criteria had to be
satisfied: the entire regression was significant, each independent variable provided an
increased partial R2 of at least 0.05, and each independent variable was significant.
A Canonical Correspondence Analysis (CCA) (ter Braak 2005) was conducted to
further determine which environmental variables explain the variation of taxa of the
benthic macroinvertebrate community structure. A CCA is a constrained unimodal
ordination method that produces eigenvalues for each axis based on inter-species (or
taxa) relationships and their relationships with the environmental variables.
Eigenvalues range from zero to one, and measures the importance of each axis. The
28

method also gives information on how much variation of the taxa are explained by each
eigenvalue. The amount of taxa variance explained can be low (i.e. 20%) due to the
expected high amount of variation with benthic macroinvertebrate data. The strength of
the axis, the variation explained, and the direction of the vectors help to inform about
niche separation of each taxa as they relate to the site in which they found.
Eigenvalues, associated taxa variance explained, total inertia (sum of all eigenvalues for
each of the four axis), and ordination diagrams are presented. Several options are
performed to give an optimal CCA output. An automatic forward selection was chosen
for the selected environmental variables which generates a test statistic and a F-ratio.
The second option was to perform an unrestricted Monte-Carlo Permutation test based
on 199 permutations, which randomizes the data sets (ter Braak 2005).
Results
A compilation of all parameters measured and corresponding measurements is
found in the APPENDIX.
Habitat
Habitat scores generally declined downstream through the Dallas-Fort Worth
metropolitan area (Table 1). The downstream habitat scores were low mainly because
the habitat assessment protocols that were available were designed for wadeable
streams characterized by rock rubble substrate, high riparian vegetation, and riffle
areas. However, there were no metrics measured or variables observed that indicate
that the reduction in the HQIS score would limit benthic community structure that would
be expected in large, non-wadeable rivers. The habitat scores generated reflect of a
large river characterized by soft depositional sediment.
29

The average width of the river at the sites sampled ranged from 18.0 to 34.3 m at
Sites 4 and 15, respectively. The average depth ranged from 0.25 to 0.78 m at Sites 12
and 6. Flow ranged from 0.04 to 36.81 m3 s-1 at Sites 3 and 15. The dominant
substrate was sand/silt/clay, with some of the upstream sites (2, 3, 4, 6, and 8)
containing gravel as well. Percent in-stream cover was highest at upstream Sites 2 and
3, and continually decreased downstream.
Benthic Macroinvertebrate Community Structure
A total of 112 taxa (four phyla, 25 families, five sub-families, 82 genera) and
5,913 individuals were collected from 40 benthic samples. There was a statistically
significant difference among total organism abundance between sites (ANOVA, p =
0.012) (Figure 3). The average number of macroinvertebrates collected ranged from a
maximum of 244 individuals per PONAR grab at Elm Fork (Site 2) to a minimum of 25
individuals per PONAR grab collected at the furthest downstream site at Palestine (Site
15) (Figure 3). Site 2 had statistically significant (SNK) more organisms than Sites 6, 8,
12, and 15. At all sites, Oligochaeta and Chironomidae were the most dominant taxa.
Over 80% of the total number of individuals collected belonged to 21 taxa, all of which
were chironomids (36%), oligochaetes (34%), and nematodes (13%).
30
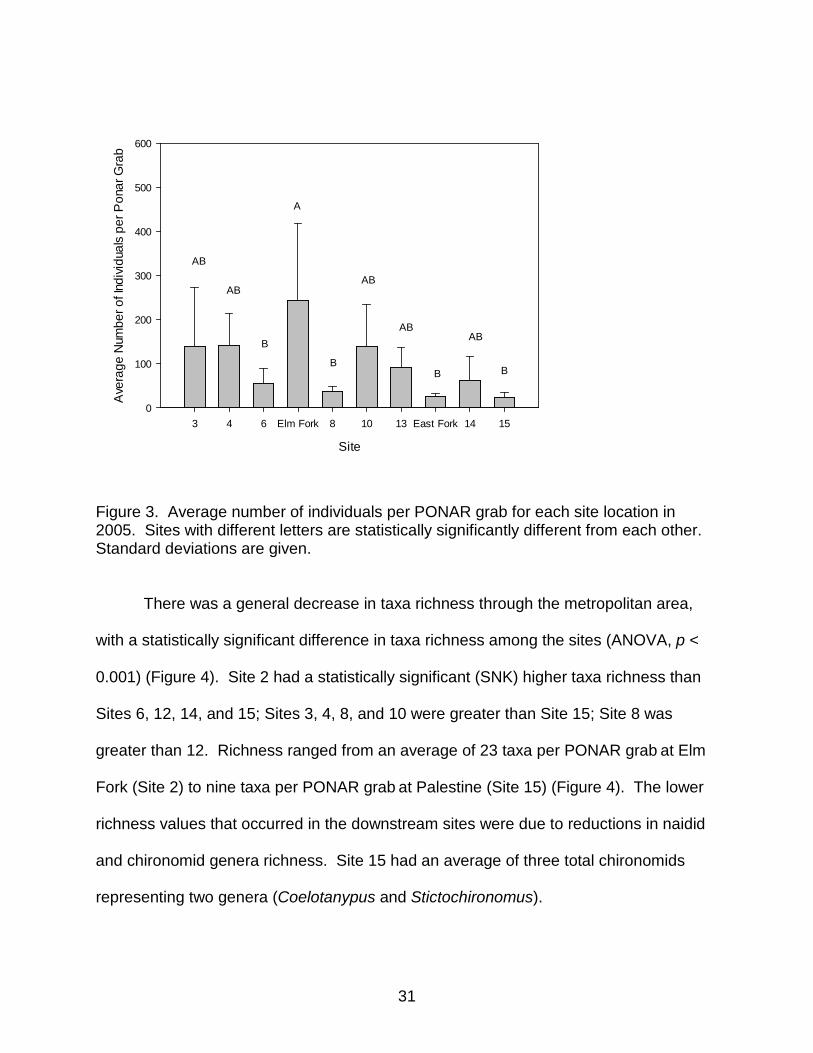
Figure 3. Average number of individuals per PONAR grab for each site location in 2005. Sites with different letters are statistically significantly different from each other. Standard deviations are given.
There was a general decrease in taxa richness through the metropolitan area,
with a statistically significant difference in taxa richness among the sites (ANOVA, p <
0.001) (Figure 4). Site 2 had a statistically significant (SNK) higher taxa richness than
Sites 6, 12, 14, and 15; Sites 3, 4, 8, and 10 were greater than Site 15; Site 8 was
greater than 12. Richness ranged from an average of 23 taxa per PONAR grab at Elm
Fork (Site 2) to nine taxa per PONAR grab at Palestine (Site 15) (Figure 4). The lower
richness values that occurred in the downstream sites were due to reductions in naidid
and chironomid genera richness. Site 15 had an average of three total chironomids
representing two genera (Coelotanypus and Stictochironomus).
Site
3 4 6 Elm Fork 8 10 13 East Fork 14 15
Ave
rage
Num
ber o
f Ind
ivid
uals
per
Pon
ar G
rab
0
100
200
300
400
500
600
A
B
BBB
AB
ABAB
ABAB
31

Figure 4. Average number of taxa per PONAR grab for each site location in 2005. Sites with different letters are statistically significantly different from each other. Standard deviations are given. Diversity was highest upstream of WWTP A (Site 4) and lowest at Palestine (Site
15) and the East Fork (Site 12) (Figure 5). Diversity decreased through the
metropolitan area (Sites 6 and 8). Evenness was highest upstream of the WWTP B
(Site 6), upstream of the WWTP C (Site 8), the East Fork (Site 12), and Palestine (Site
15) (Figure 6). The lowest evenness values occurred at Elm Fork, downstream of
Lewisville Lake (Site 2), and downstream of Lake Worth (Site 3).
32

Figure 5. Average diversity per PONAR grab for each site location in 2005.
Figure 6. Average evenness per PONAR grab for each site location in 2005
Site
3 4 6 Elm Fork 8 10 13 East Fork 14 15
Ave
rage
Eve
nnes
s pe
r Pon
ar G
rab
0.0
0.2
0.4
0.6
0.8
1.0
Site
3 4 6 Elm Fork 8 10 13 East Fork 14 15
Ave
rage
Div
ersi
ty p
er P
onar
Gra
b
0
1
2
3
4
33

Oligochaete total abundance and taxa richness were significantly different among
the sites (ANOVA, p = 0.001 and 0.035 respectively). Significantly lower oligochaete
taxa richness (SNK) was measured at the downstream Sites 13, 14, and 15, as well as
at Site 12. Tubificinae (Oligochaeta: Naididae) was the dominant oligochaete sub-
family, with Naidinae (Oligochaeta: Naididae) sub-dominant, except downstream of
Lake Worth (Site 3), where Dero sp. (Naidinae) was dominant. Sexually immature
Tubificinae without capilliform chaetae were the most abundant oligochaete, comprising
17% of the total individuals collected. The four most abundant oligochaete taxa, all in
the sub-family Tubificinae, were sexually immature without capilliform chaetae,
Aulodrilus pigueti, Branchiura sowerbyi, and Limnodrilus hoffmeisteri.
Chironomid total abundance and taxa richness were significantly different among
the sites (ANOVA, p < 0.005 and 0.001, respectively). Site 2 had a significantly (SNK)
higher chironomid abundance and richness than all other sites. Lower chironomid
abundance was found upstream of the WWTP B (Site 6), as well as at every station
downstream of the WWTP C (Sites 10, 13, 14, and 15). A decline in chironomid genera
richness was noted for all sites within and downstream of the Dallas-Fort Worth
metropolitan area. Sub-family Chironominae (Chironomidae) was more abundant than
Tanypodinae and Orthocladiinae (Chironomidae) at every site, except downstream of
the confluence with the East Fork (Site 14), and Palestine (Site 15). At Site 15,
Tanypodinae was the most abundant chironomid; however, only nine total chironomids
were collected. Overall, the most abundant chironomid genera were Polypedilum sp.
(10% of the total organism abundance) and Glyptotendipes sp. (9% of the total
organism abundance). Seven chironomid genera were dominant at most sites:
34

Polypedilum, Cryptochironomus, Glyptotendipes, Paracladopelma, Cryptotendipes,
Dicrotendipes, and Paralauterborniella.
Correlation Analysis
The HQIS score that defines the overall habitat quality was significantly positively
correlated with all eight of the benthic macroinvertebrate metrics (Pearson’s Correlation,
α level = 0.05). Other habitat variables with significant positive correlations with benthic
metrics include the following: in-stream habitat cover with richness, Chironomidae,
Chironominae, and Orthocladiinae, percent gravel with Tubificinae, and native
vegetation with diversity. Tubificinae abundance was positively correlated with three
geospatial variables (population, near-field urban, and near-field residential), but was
negatively correlated with near-field forest. Naidinae was negatively correlated with
near-field rain values.
Individual surfactant TUs were found to be low (below unity) in the Trinity River
flowing through the Dallas-Fort Worth metropolitan area, and thus all surfactants in the
surface water were combined to produce total TUs for surface water (SWTU), while all
surfactants in the pore water were combined to produce total TUs for pore water
(PWTU). Total TUs, though, were still low, ranging from 0.06 to 0.14 for surface water
and 0.11 to 0.31 for pore water. Surfactant SWTU and PWTU were significantly
positively correlated with one another; however, they were not significantly correlated
with any of the benthic population metrics (Pearson’s Correlation, α level = 0.05).
Additionally, SWTU had a significant negative correlation with average river depth and
with near-field urban land. Surface water TU had a significant positive correlation with
near-field forested land-use. Pore water TUs were significantly negatively correlated
35

with near-field soil organic matter and percent gravel, and positively correlated with
percent sand.
Other variables of interest in the correlation analysis were in-stream cover, HQIS,
and surface water total organic carbon. In-stream cover and surface water total organic
carbon were not significantly correlated to any other environmental variable. The HQIS
had a significant negative correlation with average flow and was positively correlated
with average width of native vegetation.
Multiple Regression Analysis
A total of eight variables were chosen as independent variables to use in a MAX
R2 multiple regression to predict benthic dependent variables (Table 2). The
independent variables were chosen from the 52 available parameters using correlation
statistics and best professional judgment, and included: near-field urban land-use,
near-field forest land-use, far-field water land-use, HQIS, width, in-stream cover,
SWTUs, and surface water total organic carbon. The models developed had adjusted
R2 values ranging from 43 to 94% to explain the variation in the benthic variables.
Surface water TUs, in-stream habitat cover, and surface water total organic carbon
were considered the top three parameters because they accounted for variation in the
majority of the models. Habitat parameters (HQIS scores or percent in-stream cover)
were useful for predicting all benthic dependent variables, except for the abundance of
Naididae. Percent in-stream cover is one of the nine parameters that the HQIS is
derived from, and could lead to inter-correlation in the multiple regression models, but
the models selected do not have both HQIS and in-stream cover in the same model
(Table 3). Surface water total organic carbon accounted for 13 to 30% of the variation
36

of both total and average abundance and abundance of Chironomidae and
Chironominae. Surface water total organic carbon was negatively related to all four of
these benthic parameters. Surface water TUs were useful in predicting five of the eight
benthic models; this was not expected since there was no significant correlation with
any benthic variable, and there was low variation of TUs.
37

Table 2. Physical and chemical variablesa chosen as independent variables in regression analyses for 2005, with basic statistics and comments. Parameter Units n Mean SD Range Comments
Forest NFa % 10 24.66 9.06 9.39 – 41.52 % of forest land-use in NF subwatershed
Urban NF % 10 7.03 5.56 0.95 – 18.97 % of urban land-use in NF subwatershed
Water FFb % 10 3.46 1.40 2.00 – 5.89 % of water land-use in FF subwatersheds
Surfactant Surface Water
(SW) Sum
TU 10 0.01 0.02 0.07 – 0.14 surfactant surface water toxic units (TU)
Total Organic Carbon SW mg/L 10 6.94 1.61 4.80 – 10.00 EPA 415.1
Habitat Quality Index Score N/A 10 13.60 2.84 8.00 – 18.00 derived from summation of nine
parameters
In-stream Cover % 10 9.60 8.59 0.00 – 27.00 average % of in-stream habitat cover
Width m 10 29.86 10.04 17.60 –
52.60
average width of transects
aNF = near-field subwatershed that includes drainage from below the upstream site and the sampling site; FF= far-field,
which includes all cumulative drainage area subwatersheds to the sampling site
38

Table 3. MAX R2 regression summary of eight selected variables a,b. Models were selected based on: overall p values < 0.05; variables that exhibited an increased adjusted R2 of >= 0.05; variables must have a p value < 0.05. Dependent Variable Adj R2 R2
P Value 1st Variable
partial R2 2nd Variable
partial R2 3rd Variable
partial R2
Avg. Organisms 0.741 0.828 0.011 SWTU 0.330
In-stream Cover 0.300 SW TOC 0.199
Total Organisms 0.733 0.822 0.012 SWTU 0.331
In-stream Cover 0.294 SW TOC 0.196
Richness 0.585 0.631 0.006 HQIS 0.631
Diversity 0.936 0.957 <0.00
0 HQIS 0.757 SWTU 0.104 Water FF 0.096
Chironomidae 0.842 0.895 0.002 HQIS 0.405 SW TOC 0.132 SWTU 0.033
Chironominae 0.842 0.894 0.003 In-stream
Cover 0.480 SW TOC 0.300 SWTU 0.117
Orthocladiinae 0.880 0.920 0.001 In-stream
Cover 0.636 Forest NF 0.157 Width 0.128
Tubificidae 0.431 0.494 0.023 Urban NF 0.494
aNF = near-field, FF = far-field, SW = surface water, TU = toxic units, HQIS = Habitat Quality Index Score, TOC = total organic carbon. bVariables in italics have a negative relationship with the dependent variable
39

Canonical Correspondence Analysis
Using the information provided by the correlation and multiple regression
procedures, ten environmental variables where chosen to help explain the variation of
taxa of the benthic macroinvertebrate community structure using a CCA analysis
(Figure 7). All four eigenvalues reported are canonical and correspond to axes that
are constrained by the environmental variables (Table 4).
40

Figure 7. CCA analysis ordination diagram of selected environmental variables with all taxa from the 2005 study. Circles represent site locations. HQIS is habitat quality index score, and SWTU is surface water toxic units. Table 4. Eigenvalue, variance explained, and total inertia of the CCA analysis of selected environmental variables with all taxa from the 2005 study.
Axes 1 2 3 4 Total inertia
Eigenvalues : 0.505 0.361 0.328 0.218 1.939 Species-environment correlations: 1 1 1 1 Cumulative percentage variance of species data : 26.1 44.7 61.6 72.8 of species-environment relation: 26.1 44.7 61.6 72.8 Sum of all eigenvalues 1.939 Sum of all canonical eigenvalues 1.939
-3 4
-2
3
2
3
4 6 8 10 12
13 14
15
Forest
Urban
Surface Water TOC
Fines
Width
Flow
Erosion
Instream Cover
HQIS SWTU
41
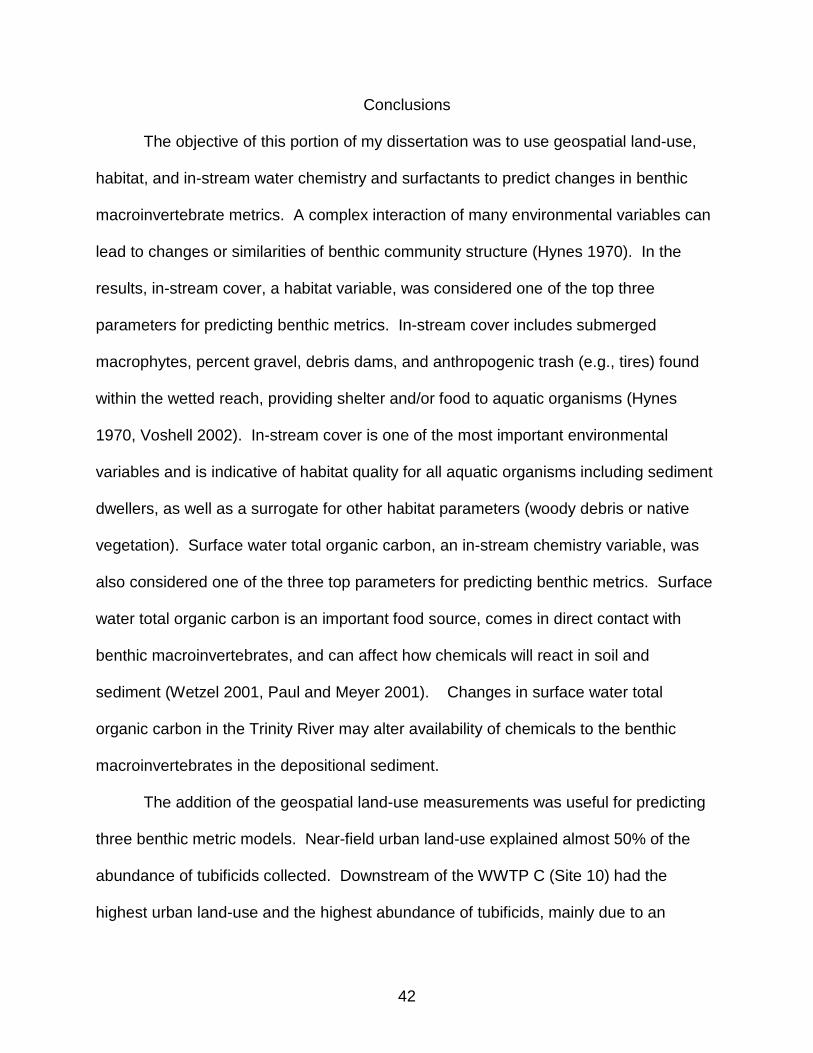
Conclusions
The objective of this portion of my dissertation was to use geospatial land-use,
habitat, and in-stream water chemistry and surfactants to predict changes in benthic
macroinvertebrate metrics. A complex interaction of many environmental variables can
lead to changes or similarities of benthic community structure (Hynes 1970). In the
results, in-stream cover, a habitat variable, was considered one of the top three
parameters for predicting benthic metrics. In-stream cover includes submerged
macrophytes, percent gravel, debris dams, and anthropogenic trash (e.g., tires) found
within the wetted reach, providing shelter and/or food to aquatic organisms (Hynes
1970, Voshell 2002). In-stream cover is one of the most important environmental
variables and is indicative of habitat quality for all aquatic organisms including sediment
dwellers, as well as a surrogate for other habitat parameters (woody debris or native
vegetation). Surface water total organic carbon, an in-stream chemistry variable, was
also considered one of the three top parameters for predicting benthic metrics. Surface
water total organic carbon is an important food source, comes in direct contact with
benthic macroinvertebrates, and can affect how chemicals will react in soil and
sediment (Wetzel 2001, Paul and Meyer 2001). Changes in surface water total
organic carbon in the Trinity River may alter availability of chemicals to the benthic
macroinvertebrates in the depositional sediment.
The addition of the geospatial land-use measurements was useful for predicting
three benthic metric models. Near-field urban land-use explained almost 50% of the
abundance of tubificids collected. Downstream of the WWTP C (Site 10) had the
highest urban land-use and the highest abundance of tubificids, mainly due to an
42
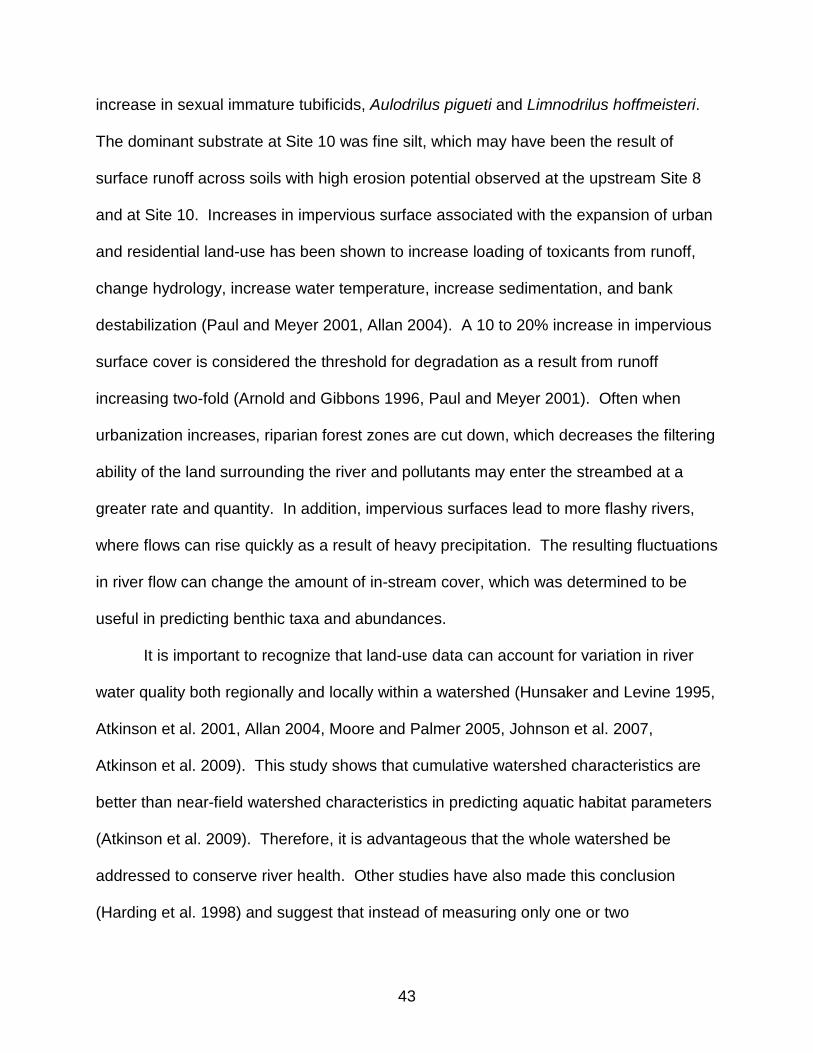
increase in sexual immature tubificids, Aulodrilus pigueti and Limnodrilus hoffmeisteri.
The dominant substrate at Site 10 was fine silt, which may have been the result of
surface runoff across soils with high erosion potential observed at the upstream Site 8
and at Site 10. Increases in impervious surface associated with the expansion of urban
and residential land-use has been shown to increase loading of toxicants from runoff,
change hydrology, increase water temperature, increase sedimentation, and bank
destabilization (Paul and Meyer 2001, Allan 2004). A 10 to 20% increase in impervious
surface cover is considered the threshold for degradation as a result from runoff
increasing two-fold (Arnold and Gibbons 1996, Paul and Meyer 2001). Often when
urbanization increases, riparian forest zones are cut down, which decreases the filtering
ability of the land surrounding the river and pollutants may enter the streambed at a
greater rate and quantity. In addition, impervious surfaces lead to more flashy rivers,
where flows can rise quickly as a result of heavy precipitation. The resulting fluctuations
in river flow can change the amount of in-stream cover, which was determined to be
useful in predicting benthic taxa and abundances.
It is important to recognize that land-use data can account for variation in river
water quality both regionally and locally within a watershed (Hunsaker and Levine 1995,
Atkinson et al. 2001, Allan 2004, Moore and Palmer 2005, Johnson et al. 2007,
Atkinson et al. 2009). This study shows that cumulative watershed characteristics are
better than near-field watershed characteristics in predicting aquatic habitat parameters
(Atkinson et al. 2009). Therefore, it is advantageous that the whole watershed be
addressed to conserve river health. Other studies have also made this conclusion
(Harding et al. 1998) and suggest that instead of measuring only one or two
43

environmental variables, such as reduction in riparian vegetation, that the whole
watershed must be addressed to conserve stream or river health. Brooks et al. (2006)
address issues with personal care products, such as pharmaceuticals and surfactants,
in effluent-dominated systems and also conclude that a watershed approach is useful to
determine which environmental parameters will be important for water management and
policy.
The other main objective of this portion of the dissertation was to determine
relationships between the benthic macroinvertebrate metrics and SWTU
measurements. While there was no direct correlation with any benthic variables and
TUs, SWTU did appear as one of the top three variables in the regression model.
However, TUs were below one at all sites. Since TUs are based on conservative
assumptions (i.e., using predicted no effect concentrations derived from chronic toxicity
data with verification from model ecosystem tests), it is reasonable to assume that the
potential for surfactants to be the cause of biological impacts is low. However, since
surfactants emanate from WWTPs, surfactant TUs are considered a surrogate for the
presence of wastewater that may contain other chemicals with similar properties
associated with biological perturbations. Furthermore, since SWTUs were found to be
both negative and positive factors in various biological dependent variables, it was
dubious to relate the TUs with causality. The sandy/clay substrate of the river in which
benthic macroinvertebrates live may still be affected by chemical and nutrient loading
from WWTP effluent. The relationship of increasing Chironomidae abundance with
SWTUs may be due to moderate environmental stress and degraded depositional
areas, as other studies have found an increase in Chironomidae abundance with
44

environmental stress (Canfield et al. 1994, Boyle and Fraleigh 2003). Further studies
are needed to evaluate the toxicity of the river depositional areas, with the potential of
surfactants, or other chemical mixtures from point and non-point sources, influencing
the changes in Chironomidae and Oligochaeta taxa found in this preliminary study.
45

CHAPTER 2
SPATIAL AND TEMPORAL TRENDS OF THE BENTHIC MACROINVERTEBRATE
COMMUNITY STRUCTURE (1988 AND 2005)
Objectives
The main objective of this portion of the dissertation was to compare historical
benthic macroinvertebrate community structure with the previously discussed benthic
data collected in 2005. The specific hypotheses tested were:
1. HO Benthic macroinvertebrate community structure metrics (average abundance,
richness, diversity, evenness, Oligochaeta, and Chironomidae abundance and
richness) does not differ temporally from the 1987 – 88 and the 2005 study.
2. HO Community similarity does not differ spatially or temporally within or among
the 1987 – 88 and 2005 study.
Background
Historically, the University of North Texas has completed several studies that
have examined the water quality and ecology of the Trinity River since 1987. These
studies have encompassed large sections of the river, as well as specific segments,
have had different objectives, and have targeted different groups of taxa and habitats
within the river. 2
2 Study methods, results, and discussion sections of this chapter have been published in Slye JL, Kennedy JH, Johnson DR, Atkinson SF, Dyer SD, Ciarlo M, Stanton K, Sanderson H, Nielsen AM. 2011. Relationships between benthic macroinvertebrate community structure with geospatial, habitat, in-stream water chemistry, and surfactants in the effluent dominated Texas Trinity River. Environ Toxicol Chem. 30(5): 1127-1138.
46

1987 – 1988 Trinity River Study
A water quality and ecological survey of the Trinity River was conducted from
June 1987 through December 1988 by the Institute of Applied Science at the University
of North Texas and the Graduate Program in Environmental Sciences at the University
of Texas at Dallas. The survey was commissioned by the City of Dallas Water Utilities
to develop a contemporary understanding of the chemical, physical, and biological
water quality parameters above, in, and below the DFW metropolitan area (Dickson et
al. 1989). The objectives of the 1987-88 study were as follows:
1) Document the spatial and temporal distribution of fish and benthic
macroinvertebrates
2) Characterize the water and sediment physically, chemically, and biologically
3) Assess the toxicity of water and sediments in the Trinity River to aquatic life
4) Develop a database that could be used to better understand the relationships
between point and non-point source loading to the Trinity River and the fish kills
that had occurred (Dickson et al. 1989)
Twelve stations (Figure 1 and 2) were sampled every three months for two years;
water and sediment samples were analyzed for contaminants, acute and chronic toxicity
tests were conducted using fish and invertebrates, and the benthic macroinvertebrate
community structure was characterized (Dickson et al. 1989). Benthic
macroinvertebrates were collected from depositional sediment using a petite PONAR
grab (Wildco) with a sample area of 152 mm2. Three replicates were collected within a
150 m reach and field washed through an ASTM no. 80 sieve. Replicates were
preserved in a buffered 10% formalin solution and then transferred to 70% ethanol in
47

the laboratory. Specimens were identified to genus (except for nematodes, bivalves,
and gastropods) using various taxonomic keys. Oligochaeta and Chironomidae were
mounted on microscope slides using CMC-9 (Masters Chemical Co.) for identification.
Macroinvertebrate population metrics used for data analyses include: average total
organisms, total organisms, richness, evenness, Brillouin’s diversity, and average
abundances of the taxa Chironomidae, Chironominae, Tanypodinae, Orthocladiinae,
Naididae, Tubificinae, and Naidinae.
Results from the 1987 – 88 study indicate that, except for reaches immediately
downstream of WWTPs, the Trinity River supported a diverse fish and benthic
macroinvertebrate community structure. Although there were no distinct spatial patterns
of exceedances of water quality criteria, acute and chronic toxicity tests were laboratory
indicators that there were detrimental effects to biota downstream of the WWTPs.
Overall, the report concluded that there were still some continuing water
problems in the Trinity River in the DFW metropolitan area, but generally the biological
water quality conditions had shown improvements from poor water quality conditions
that existed up to that time period (Dickson et al. 1989).
There have been several other studies that have been conducted by UNT
graduate students on the Trinity River in smaller segments and with different sampling
methods and objectives. However, these studies can provide additional data useful in
understanding the benthic community structure throughout the watershed during the
time period of 1990 to 2005.
48

Sandra T Spon Master’s Thesis 1994
Dischargers to the Trinity River in North Texas were required to dechlorinate their
effluents in 1990-1991. Field surveys were conducted upstream and downstream an
outfall of the Village Creek WWTP to determine the response of benthic
macroinvertebrates and caged in situ juvenile Asiatic clams (Corbicula fluminea) to
chlorinated and dechlorinated effluent. Within 6 months after dechlorination began,
insect community composition and C. fluminea survival significantly improved at stations
below the outfall. Significantly lower clam growth within one mile below the
dechlorinated effluent indicated the presence of non-chlorine toxicants. Effects from
chlorinated and dechlorinated effluent exposure were comparable between
Ceriodaphnia dubia lab tests and in situ C. fluminea.
Brynne L Bryan Master’s Thesis 1994
The purpose of this study was to test the hypothesis that dechlorination had no
effect on the integrity of three select communities: periphyton, phytoplankton, and
zooplankton. These communities have constituents from different trophic levels, and
each level had the potential of being affected in different ways, either directly from the
removal of chlorine or indirectly from shifts in the composition of adjacent trophic levels.
Within each community there were different aspects, or parameters, evaluated to test
the hypothesis that there was no effect on that community from removal of chlorine.
Zooplankton was analyzed for total densities, taxa richness, and distribution.
Phytoplankton was analyzed for chlorophyll-a concentrations as well as for total
densities, taxa richness, and distribution. Periphyton was analyzed for ash-free dry
weight and chlorophyll-a concentrations as well as for densities, taxa richness, and
49
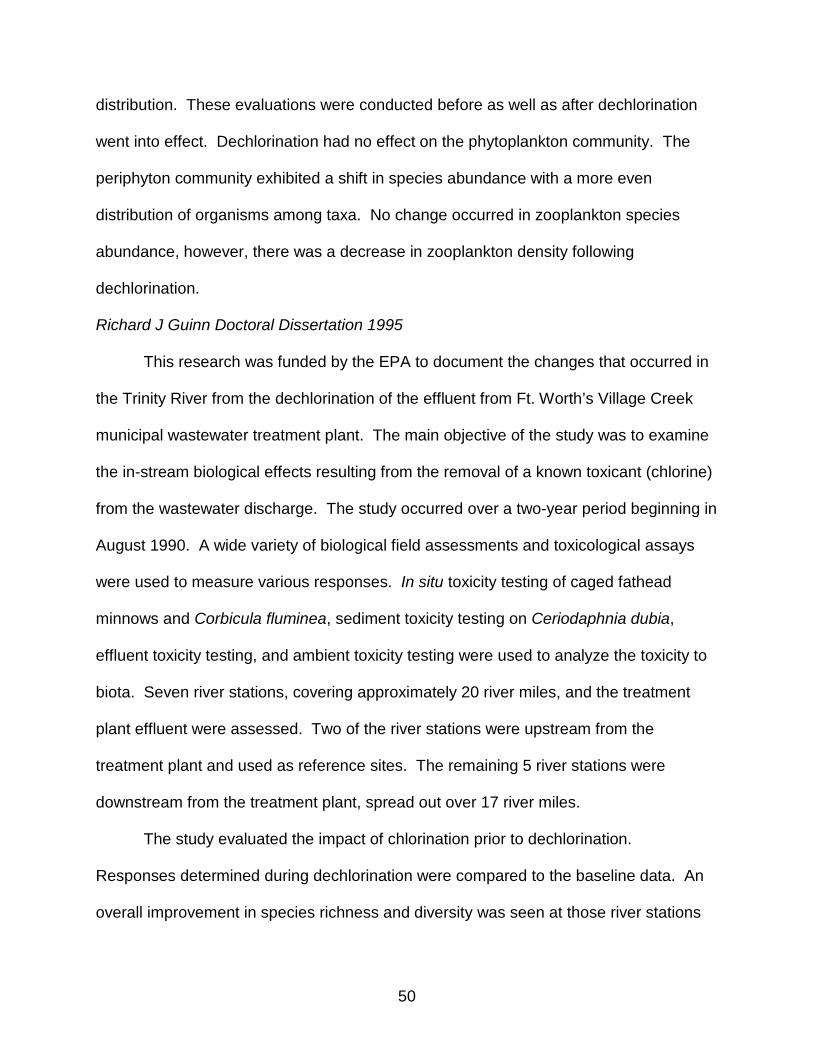
distribution. These evaluations were conducted before as well as after dechlorination
went into effect. Dechlorination had no effect on the phytoplankton community. The
periphyton community exhibited a shift in species abundance with a more even
distribution of organisms among taxa. No change occurred in zooplankton species
abundance, however, there was a decrease in zooplankton density following
dechlorination.
Richard J Guinn Doctoral Dissertation 1995
This research was funded by the EPA to document the changes that occurred in
the Trinity River from the dechlorination of the effluent from Ft. Worth’s Village Creek
municipal wastewater treatment plant. The main objective of the study was to examine
the in-stream biological effects resulting from the removal of a known toxicant (chlorine)
from the wastewater discharge. The study occurred over a two-year period beginning in
August 1990. A wide variety of biological field assessments and toxicological assays
were used to measure various responses. In situ toxicity testing of caged fathead
minnows and Corbicula fluminea, sediment toxicity testing on Ceriodaphnia dubia,
effluent toxicity testing, and ambient toxicity testing were used to analyze the toxicity to
biota. Seven river stations, covering approximately 20 river miles, and the treatment
plant effluent were assessed. Two of the river stations were upstream from the
treatment plant and used as reference sites. The remaining 5 river stations were
downstream from the treatment plant, spread out over 17 river miles.
The study evaluated the impact of chlorination prior to dechlorination.
Responses determined during dechlorination were compared to the baseline data. An
overall improvement in species richness and diversity was seen at those river stations
50

that had previously been adversely impacted by chlorine. Periodic toxicity was
observed with these tests in the effluent and river samples after dechlorination was
initiated. Those tests, along with in situ toxicity assays, proved to be good predictors of
biological community responses.
Jaynie M Stephenson Masters Thesis 2000
This study described macroinvertebrate community structure and assessed its
potential in detecting point and non-point sources of disturbance associated with rural
and urban areas in the Upper Trinity River Basin. Geospatial techniques were used to
quantify land-use within the watershed in a GIS. At rural sites near the headwaters of
the Trinity River, collector-gathering burrowers that are adapted to minimal flow
comprised the majority of taxa. Densities of taxa compositions at downstream sites
increased and shifted toward psammophilic and rheophilic invertebrates, including
primarily collector-filtering clingers, which are characteristic of shifting sand habitats in
large prairie rivers. Benthic community structure generally benefited from point source
impacts including WWTP effluents that maintained higher flow. Community indices
were negatively associated with forest land-use and positively associated with urban
land-use. Partial CCA determined that flow and land-use contributed equally to species
dispersion. Comparisons with historical biomonitoring studies in the upper Trinity River
Basin indicate improved watershed health (Stephenson and Kennedy 2010).
Because these studies had not incorporated all, if any, of the large-scale 1987 –
88 benthic macroinvertebrate study locations and/or sampling methods, a second study
of its’ type was needed to evaluate the benthic macroinvertebrate community structure
of the DFW metroplex post de-chlorination and rapid metropolitan growth.
51

Study Locations and Methods
The benthic sampling protocol in the 1987-88 study and the 2005 study were the
same. The 2005 samples were taken from 30 September and 4 October. August 1988
samples from the 1987-88 study were used to compare with the 2005 data because of
similarity in seasonality and rainfall.
Statistical Analyses
All tests to determine statistical significance were set at an α-level of 0.05.
Assumptions for all tests of significance were determined. Homogeneity of variance
was tested using an F-test, while normality was tested using the Shapiro-Wilks test for
normality (SAS 2008). If violations occurred, a log transformation was used. An
independent t test (SAS 2008) was used to determine differences according to site
between 1988 and 2005. Analysis of variance (ANOVA) was used to determine if there
was a statistically significant difference of a benthic metric among sites for either 1988
or 2005. A posteriori testing to determine which sites were significantly different was
conducted using a Student-Newman-Keuls test (SNK) (SAS 2008). To show if a
statistical significant difference existed among a chosen benthic metric between 1988
and 2005 a general linear model (GLM) was used due to uneven sample sizes between
the years.
To classify taxa similarity among sites, hierarchical agglomerative methods using
un-weighted pair groups and arithmetic averages (UPGMA) (Sneath and Sokal 1973)
were used to produce dendrograms of taxa similarity among the site locations (Kovach
1999). The degree of similarity among sites, or groups of sites, is indicated by the level
52

at which linkage occurs. Similarity increases as linkages approach 1.0. Sites that
cluster with similarity values of >0.52 were chosen to represent ecological importance.
Results
A table presenting benthic macroinvertebrate data for August 1988 and all data
from 2005 is found in the supplementary data.
1988 and 2005 Benthic Macroinvertebrate Comparison
Organism abundance was higher in 2005 than in 1988 at Sites 2, 4, 10, 13, and
14, although only Site 13 was statistically significant (independent t test, p = 0.04)
(Figure 8). There were significantly more organisms collected in 1988 at Site 12
(independent t test, p = 0.01), yet this is due to a ten-fold increase in the number of
nematodes. Benthic macroinvertebrate abundance decreased downstream of the
WWTP outfalls in 2005 and 1988, with the exception of downstream of the WWTP C
(Site 10). In 1988, benthic populations increased downstream of the confluence with
the East Fork (Site 14) to Palestine (Site 15), whereas in 2005 they decreased. Taxa
richness was significantly higher in 2005 in 1988 (GLM, p = 0.002). Fifty taxa were
reported from the 1988 data, as compared to 112 taxa in 2005. Sites 4, 8, 13, and 14
had significantly higher taxa richness in 2005 than 1988 (independent t test, all p < 0.03)
(Figure 8).
Oligochaete abundance was greater at every site in 1988 than 2005, except for
upstream of the WWTP A and upstream of the WWTP D (Sites 4 and 10, respectively).
A total of 18 oligochaete genera were reported in 1988 compared to 22 in 2005. Four
genera of oligochaetes identified in 1988 were not identified in 2005. A higher number
of Chironomidae genera were collected in 2005 (50 genera) than in 1988 (20 genera).
53

In 2005, three genera of Chironomidae were not identified that were present in the 1988
benthic collection. Site 12 had a significantly lower number of Chironomidae in 2005
than in 1988 (independent t test, p = 0.03). More sub-family Chironominae were
collected in 2005 than in 1988 at all sites, except Site 6 and the downstream Sites 13,
14, and 15; however these differences were not statistically significant. Lower numbers
of Chironominae were collected in 2005 downstream of WWTP D than in 1988. In
1988, all sites had a greater number of Tanypodinae collected than in 2005, except for
south of the confluence with the East Fork (Site 14).
1988 and 2005 Taxa Similarity
Morisita’s clustering similarity index indicated differences in taxa similarities
among the sites from the 1988 and 2005 data (Figure 9). In 1988, sites upstream and
downstream of the metropolitan area formed separate groups, in contrast to 2005 when
all metropolitan sites (6, 8, 10, 13, and 14) were included in a single cluster. There
were two groups present during the 1988 study; Sites 3, 4, 6 and 15 with a similarity
index of 0.53, and Sites 10, 13, 14 cluster with a similarity index of 0.72. In 2005, sites
located in and downstream of the metropolitan area (Sites 6, 8, 10, 13, and 14) form a
related group with a similarity index of 0.61. This large grouping of sites indicate that
community composition of the 2005 study locations within the Dallas-Fort Worth
metropolitan area was more homogeneous than that of the 1988 study.
In 2005, it is considered that the study area has been divided into four “zones”:
Sites 3 and 4 upstream on the West Fork, Site 2 on the Elm Fork, Site 15 the most
downstream site, and the remaining “metropolitan” Sites 6, 8, 10, 13, and 14. In 2005,
Sites 6 and 8 had a high similarity index of 0.87. The dominant taxa found at both
54

locations are sexually immature tubificids without capilliform chaetae, with
Cryptochironomus and Polypedilum sub-dominant. Sites 10 and 13 also have a high
similarity index value (0.88) with the dominant taxa of both locations being nematodes
and sexually immature tubificids without capilliform chaetae, with Branchiura sowerbyi,
Paracladopelma, and Polypedilum sub-dominant. Sites located in the metropolitan area
(Sites 6, 8, 10, 13, and 14) form a related group with a similarity index of 0.61.
55
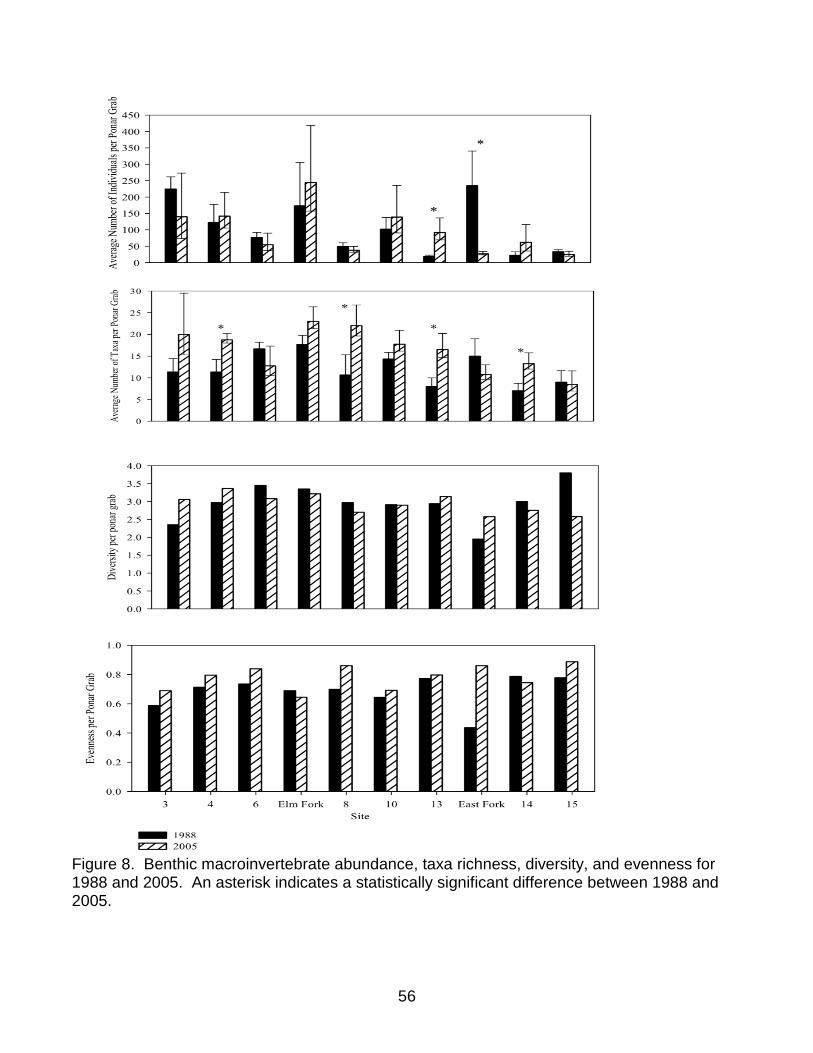
Figure 8. Benthic macroinvertebrate abundance, taxa richness, diversity, and evenness for 1988 and 2005. An asterisk indicates a statistically significant difference between 1988 and 2005.
56

a. b.
Figure 9. Significant taxa similarity (Morisita’s Similarity Index, >0.52) of average total organisms in a) 1988 and b) 2005. In 1988, significant taxa similarity among sites are grouped by triangles (Sites 3, 4, 6, and 15), and squares (Sites 10, 13, and 14). In 2005 significant taxa similarity among sites are grouped by stars (Sites 6, 8, 10, 13, and 14). Site locations with solid circles are not significantly similar with any other site locations. Non-solid circles represent wastewater treatment plants.
57

Conclusions
The objective of this section was to characterize the historical and current benthic
macroinvertebrate community structure of the Upper Trinity River in the Dallas-Fort
Worth metropolitan area. The results show a general improvement of the benthic
community structure, with increased abundance and richness for most of the Dallas-Fort
Worth metropolitan area locations since 1988. Improvements in municipal treatment
methods since the 1987 to 1988 study, such as de-chlorination, are thought to be the
major influence causing this change. A previous study conducted on a smaller segment
of the river during 1990 to 1992, reported significant improvements in the benthic
macroinvertebrate structure below WWTP outfalls during a post de-chlorination period
(ST Spon1994). The 2005 study has provided additional data of the benthic
macroinvertebrate structure of the depositional sediments to assess the impacts of
personal care products entering the river via WWTP effluent. In addition to increases in
taxa richness and abundances since 1988, the taxa composition has become more
homogenous among the sites in the immediate vicinity of the Dallas-Fort Worth
metropolitan area. The habitat and in-stream water parameters were also similar in this
heavily urbanized area, which may explain the taxa similarity of the site locations. The
benthic macroinvertebrate community was useful for detecting spatial and temporal
changes in water and habitat quality, and provided an important tool for the assessment
of management and conservation practices as they are implemented in this urbanized
watershed.
The use of historical benthic macroinvertebrate data, coupled with changing land-
use, have been interpreted in several other studies, although few systems were located
58

in arid regions, were effluent-dominated, and heavily urbanized. Grubaugh and Wallace
(1995) show that decreased sediment loads and pollutants associated with decreasing
agriculture practices explained improvement in the benthic structure in the Piedmont
River over a 35-year period. However, they speculate that future studies may show that
urbanization reverses the stream condition. Although we found overall improvements in
the benthic macroinvertebrate community structure since the 1987 to 1988 study, we
still detected a general decline in abundance and richness downstream of a major
metropolitan area, a trend more prominent in the 2005 data than the 1988 data.
59

CHAPTER 3
BIOFILM FATTY ACID METHYL ESTER (FAME) RICHNESS AS A VARIABLE TO
DESCRIBE VARIANCES IN BENTHIC MACROINVERTEBRATE COMMUNITY
COMPOSITION IN AN URBANIZED, EFFLUENT DOMINATED RIVER
Objectives
This chapter has two objectives:
1) Develop a method to quantify biofilm fatty acid methyl esters (FAME)
abundance and richness from depositional sediment
2) Determine relationships between the FAME richness and
corresponding benthic macroinvertebrate metrics and taxa to help
elucidate influences from urban land-use and WWTP effluent
The specific hypotheses tested were:
HO - Benthic macroinvertebrate community structure metrics (average
abundance, richness, Oligochaeta and Chironomidae abundance and
richness) do not correlate or have a relationship with depositional sediment
biofilm fatty acid profiles.
HO – There is no relationship with urban land-use, habitat, and FAME
abundance and/or richness on the benthic macroinvertebrate communities.
Background
Benthic macroinvertebrate communities are structured by multiple physical-
chemical and biological influences. Identifying and understanding these driving factors
is an important research consideration. It is established that substrate has a major
influence on macroinvertebrate community structure (Allen 1995, Palmer et al. 2000).
60

Increasingly, there is evidence that substrate surface biofilms are also a major influence
by contributing nutrients essential for growth and reproduction of higher trophic levels
(Lock et al. 1984, Allan and Castillo 2007, Rosi-Marshall and Royer 2012). ‘Biofilm’,
‘periphyton’, or ‘aufwuch’ are terms for the assemblage of microbial organisms that
attach to the surface of substrate particles in a polysaccharide matrix (Lock et al. 1984).
This microbial community includes viruses, eubacteria, archaebacteria, fungi, protozoa,
micrometazoa, and algae (Margulis et al. 1986). Aquatic and terrestrial global
ecosystems are dependent on microbial communities that are essential to the facilitation
of carbon, hydrogen, nitrogen, oxygen, and sulfur biochemical cycles (Vestal and White
1989, Wetzel 1993). The availability of these key elements is critical to primary
production. On a community level, the microbial population is at the center of the
trophic structure or the “ooze” (Lindeman 1942, Vannote 1980). At the organismal level,
microbes provide essential fatty acids, phospholipids, and glycolipids to primary
consumers, such as aquatic insects and other invertebrates (oligochaetes, gastropods,
etc.), including the functional feeding groups of shredders, collector-gatherers, and
scrapers (Allan 1995). Long-chain polyunsaturated fatty acids are not easily
synthesized by most organisms (Brett and Muller-Navarra 1997). Some of these fatty
acids are considered to be essential for aquatic organisms and are found in the
photosynthetic membranes of food sources (Hill et al. 2011). Biofilms are the “peanut
butter” on the cracker for macroinvertebrates, providing the bulk of the nutrition from
eating leaves, decaying wood, or scraping the surfaces of rocks and sediments (Meyer
1994).
61
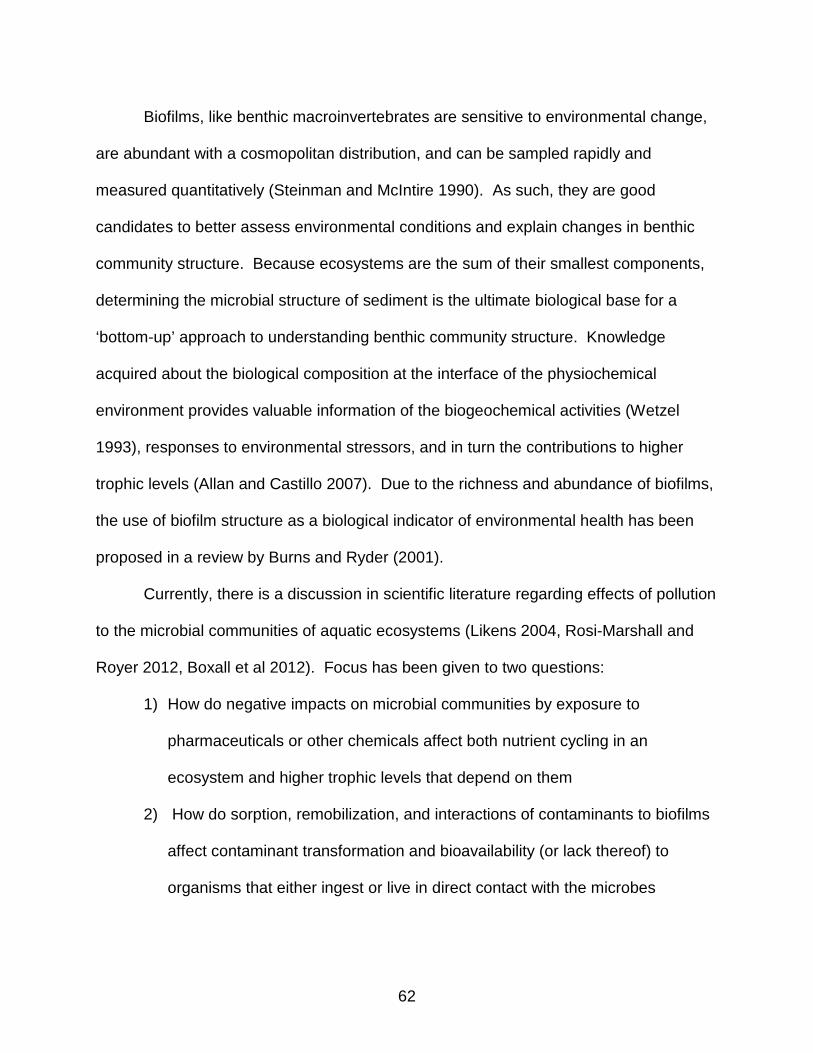
Biofilms, like benthic macroinvertebrates are sensitive to environmental change,
are abundant with a cosmopolitan distribution, and can be sampled rapidly and
measured quantitatively (Steinman and McIntire 1990). As such, they are good
candidates to better assess environmental conditions and explain changes in benthic
community structure. Because ecosystems are the sum of their smallest components,
determining the microbial structure of sediment is the ultimate biological base for a
‘bottom-up’ approach to understanding benthic community structure. Knowledge
acquired about the biological composition at the interface of the physiochemical
environment provides valuable information of the biogeochemical activities (Wetzel
1993), responses to environmental stressors, and in turn the contributions to higher
trophic levels (Allan and Castillo 2007). Due to the richness and abundance of biofilms,
the use of biofilm structure as a biological indicator of environmental health has been
proposed in a review by Burns and Ryder (2001).
Currently, there is a discussion in scientific literature regarding effects of pollution
to the microbial communities of aquatic ecosystems (Likens 2004, Rosi-Marshall and
Royer 2012, Boxall et al 2012). Focus has been given to two questions:
1) How do negative impacts on microbial communities by exposure to
pharmaceuticals or other chemicals affect both nutrient cycling in an
ecosystem and higher trophic levels that depend on them
2) How do sorption, remobilization, and interactions of contaminants to biofilms
affect contaminant transformation and bioavailability (or lack thereof) to
organisms that either ingest or live in direct contact with the microbes
62

Drury et al. (2013) assessed the impacts of WWTP effluent on the size, activity,
and composition of benthic microbial communities in urban rivers in Chicago. It was
concluded that sites upstream of effluent input differed significantly in chemical
characteristics and in the composition of their sediment bacterial communities.
Downstream sites had significant decreases in the population size and diversity of
sediment bacterial communities. Their results suggest that WWTP effluent has the
potential to reduce the natural variability that exists among river ecosystems and
indicates that WWTP effluent may contribute to biotic homogenization. Subsequently,
they further detected that there was a decrease in biomass with increased urban land-
use. Guckert et al. (1985) reported shifts in phospholipid fatty acid community structure
of marine sediment under different oxygen conditions (Guckert et al. 1985). Ben-David
et al. (2004) used total phospholipid concentration to deduce that acid rock drainage
and the resulting water chemistry alterations decreased microbial biomass by >70%.
They found that the environmental parameters with the greatest bearing on
phospholipid profiles included pH changes, increased levels of soluble aluminum, total
extractable iron, and zinc, which are attributed to acid rock drainage.
There have been studies that test specific compounds on microbial responses
and show that biofilms have an important role for the fate and transport of organic
contaminants in aquatic environments. Rosi-Marshall et al. (2013) measured in situ
responses of biofilms to six common pharmaceutical compounds (caffeine, cimetidine,
ciprofloxacin, diphenhydramine, metformin, ranitidine, and a mixture of each) by
deploying pharmaceutical diffusing substrates in streams. Decreases in biofilm
chlorophyll a content, decreased rates of gross primary production and respiration, as
63

well as a shift in biological composition were detected. Triclosan and tetracycline,
commonly used antimicrobial compounds, has been shown to alter the composition of
both algae and bacteria in stream biofilms, and led to reduced biofilm growth rates
(Wilson et al. 2003, Lawrence et al. 2009, Ricart et al. 2010, Quinlan et al. 2011).
Studies to determine the ability of the polysaccharide matrix of biofilms to sorb
contaminants in the environment have been conducted. Corpe (1975) reported the
binding of calcium, magnesium, zinc, nickel and cobalt by the polymers from a marine
microbe. Diclofop-methyl, DDT, trillate, tetrabutyltin, lindane, atrazine, and parathion-
methyl were determined to be bound to biofilms in a laboratory setting (Headley et al.
1998). Writer et al. (2011) analyzed 17β-estradiol and 4-nonylphenol hydrophobic
partitioning into water, biofilm, sediment, and dissolved organic matter matrices. It was
concluded that because the compounds bound to the biofilm substrate, they play a
primary role in attenuating those compounds in surface waters. Accumulation of
steroidal hormones and 4-nonylphenol compounds in the stream biofilm may be an
exposure pathway for organisms in higher trophic levels. Lundqvist and Goedkoop
(2012) determined rates of sorption of selected pesticides. Lindane and chlorpyrifos
sorbed to biofilms at rates of 3.4–6.4 and 1.7–3.3 L/kg 9 h-1, respectively. For
carbofuran, however, uptake rates were generally much lower, and ranged
from 1.3–1.5 L/kg 9 h-1 . The higher sorption rates to biofilms of the two more
hydrophobic pesticides, lindane and chlorpyrifos, show that biofilms, through efficient
sorption, may act as a sink for pesticides during peak run-off events. Within 48 h after
exposure, biofilm concentrations for these two insecticides were between 382-128 times
higher than those in the water.
64

For this dissertation research, biofilms are used as an additional environmental
parameter to explain changes in benthic macroinvertebrate structure. Biofilm fatty acid
richness has previously been used as a variable to predict benthic macroinvertebrate
richness and indicate that macroinvertebrates need essential fatty acids that are found
in biofilms (Torres-Ruiz et al. 2007). Because biofilms are used as a food source for
some benthic macroinvertebrates, providing a series of essential fatty acids, it is
hypothesized that a higher richness in biofilm taxa would lead to a higher richness of
fatty acids available to the consumer. The result is increased benthic macroinvertebrate
growth and fecundity (Torres-Ruiz et al. 2007). Alternatively, benthic macroinvertebrate
communities could be affected from either ingesting or living in contact with biofilms that
have contaminants sorbed to them.
An extensive literature review found no published studies that examined the
relationship of biofilm fatty acid richness with benthic macroinvertebrate community
structure in soft depositional sediment. I have tested a novel method to extract and
derivatize fatty acid methyl esters from depositional sediment biofilm in order to
calculate their quantity and richness.
Study Locations and Methods
Sampling Site Locations
A 2005 study of the Trinity River benthic macroinvertebrates identified four
zones based on benthic community responses to changes in water quality. While not
pristine, two zones located downstream of Lake Lewisville and Lake Worth had the
cleanest water quality available in the Metroplex region. Additional zones include a
65
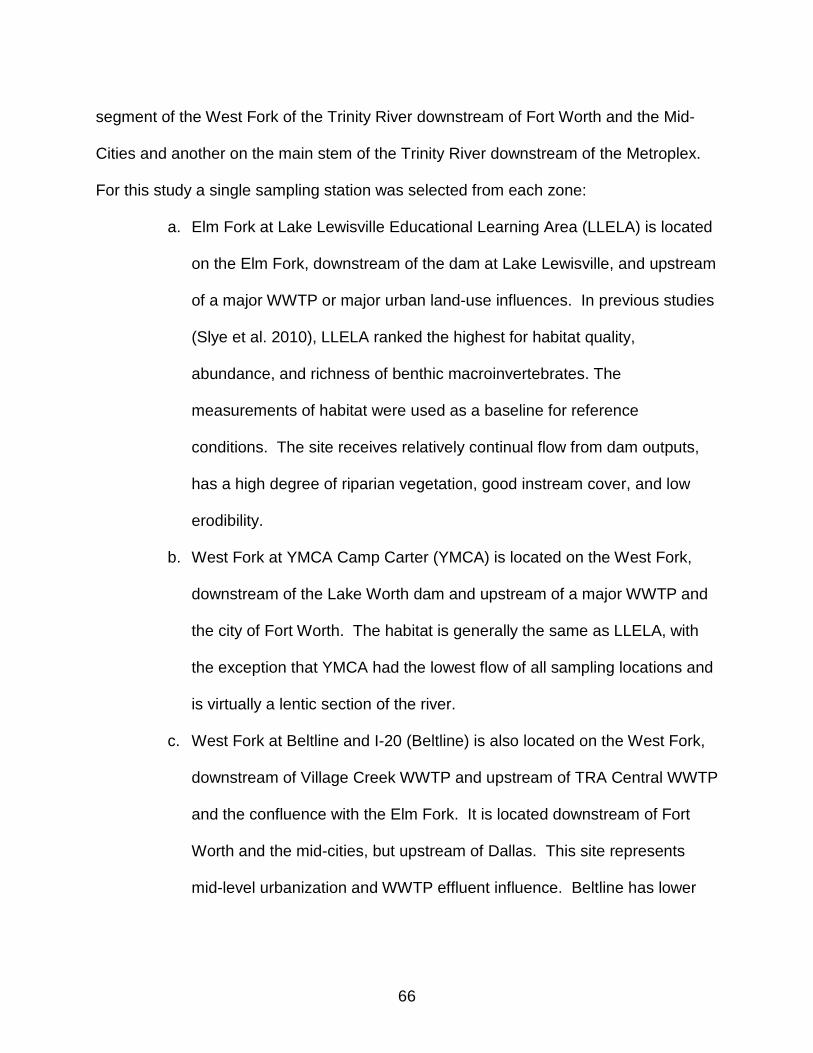
segment of the West Fork of the Trinity River downstream of Fort Worth and the Mid-
Cities and another on the main stem of the Trinity River downstream of the Metroplex.
For this study a single sampling station was selected from each zone:
a. Elm Fork at Lake Lewisville Educational Learning Area (LLELA) is located
on the Elm Fork, downstream of the dam at Lake Lewisville, and upstream
of a major WWTP or major urban land-use influences. In previous studies
(Slye et al. 2010), LLELA ranked the highest for habitat quality,
abundance, and richness of benthic macroinvertebrates. The
measurements of habitat were used as a baseline for reference
conditions. The site receives relatively continual flow from dam outputs,
has a high degree of riparian vegetation, good instream cover, and low
erodibility.
b. West Fork at YMCA Camp Carter (YMCA) is located on the West Fork,
downstream of the Lake Worth dam and upstream of a major WWTP and
the city of Fort Worth. The habitat is generally the same as LLELA, with
the exception that YMCA had the lowest flow of all sampling locations and
is virtually a lentic section of the river.
c. West Fork at Beltline and I-20 (Beltline) is also located on the West Fork,
downstream of Village Creek WWTP and upstream of TRA Central WWTP
and the confluence with the Elm Fork. It is located downstream of Fort
Worth and the mid-cities, but upstream of Dallas. This site represents
mid-level urbanization and WWTP effluent influence. Beltline has lower
66

habitat quality than LLELA and YMCA, with little instream cover, high
erodibility, and low riparian vegetation.
d. Main stem downstream of Dallas (South Dallas) is located on the main
stem of the Trinity River and is downstream of Dallas and three of the four
major WWTPs. It is upstream of Dallas Southside WWTP. South Dallas
characterizes the effect of transport of WWTP effluent and non-point
source loading from the entirety of the DFW metropolitan area. Habitat
quality is low, with a severe degree of erodibility and little instream cover.
Habitat Assessment
At the four sampling site locations, a habitat assessment was performed in part
by using modifications of procedures established by the Texas Commission of
Environmental Quality (TCEQ) (2007). The parameters observed and measured were
used to calculate a Habitat Quality Index Score (HQIS). Latitude, longitude, depth, flow,
width, slope of banks, sediment and vegetation types for one transect per station were
recorded.
Sediment Sampling and Analyses
Depositional sediments from the study sites contained a mixture particles ranging
from coarse sand (2.00 – 0.05 mm to clay (<0.002 mm). All collected sediment was
classified as coarse sand (2.00 – 0.05 mm), silt (0.05 – 0.002 mm), to clay (<0.002 mm).
The size classes were determined by placing dried sediment into various sieve sizes
(USA standard sieve sizes ASTM 6, 10, 18, 35, 70, and 80) and then placed on a
sediment shaker (Tyler portable sieve shaker RX-24). Percent clay was determined
67

using the Bouyoucos hydrometer method (NASA’s Soil Science Education program
http://soil.gsfc.nasa.gov/ last accessed 31 March 2013).
Sediment total organic carbon was measured as ash free dry weight (AFDW).
This is obtained by subtracting the ash weight (AW) from the dry weight (DW). DW
(inorganic + organic content) is obtained by drying a sediment sample to a constant
temperature. Ash weight (AW) (inorganic content only) was determined by incinerating
the DW samples at 550ºC in a muffle furnace for two to three hours or until all
noticeable traces of organic carbon were gone. Ash free dry weight (organic content) =
DW – AW.
Benthic Macroinvertebrate Community Structure
Benthic sampling took place on September 02, 03, and 23, 2011. For each site,
eight PONAR samples were collected from depositional substrate. From each of the
eight PONAR grabs, approximately 100 g of substrate was collected and placed into a
plastic zip-lock type bag and directly into ice for AFDW and FAME analysis. The
remaining sample was field-washed through an American Society for Testing and
Materials no. 80 sieve (150 µm mesh). The smaller mesh size was used to collect the
highest possible abundance of oligochaetes and first instar insects. Each concentrated
replicate was preserved in a buffered 10% formalin solution and transferred to 70%
ethanol in the lab. Samples were processed to remove excess silt, and the organisms
were separated from the sediment using a dissection microscope. Unless damaged or
in an early developmental stage, specimens were identified to genus or species if
taxonomic information was available (except for nematodes, bivalves, and gastropods)
using various taxonomic keys (for example, Wiederholm 1983, Merritt and Cummins
68

1996, Kathman and Brinkhurst 1998, Epler 2001). Oligochaeta and Chironomidae were
mounted on microscope slides using CMC-9 (Masters Chemical, Wood Dale, IL, USA),
following methods described by Epler (2001) and Kathman and Brinkhurst (1998) for
identification. Macroinvertebrate population metrics used for data analyses include the
following: average total organisms, richness, and average abundances and richness of
Chironomidae and Oligochaeta. All metrics are expressed as “per PONAR grab”.
The number of replicates needed to detect difference between means (α –level
0.05) for this sampling effort was determined by the variability of the 2005 abundance
data. The following formula was used from Sokal and Rolf (1969):
n ≥ 2 (σ / δ )2 {tα[v] + t2(1 – P)[v]}2
where n = number of replications
σ = true standard deviation
δ = the smallest true difference that it is desired to detect (20%)
v = degrees of freedom of the sample standard deviation with a groups and
n replications per group
P = desired probability that a difference will be found to be significant
tα[v] and t2(1 – P)[v] = values from a two tailed t-table.
Although eight replicates were taken for benthic macroinvertebrate, sediment
TOC, sediment size, and FAME analysis, only four replicates from each site were
processed.
Depositional Sediment Biofilm Fatty Acid Methyl Ester Analysis
A total of eight replicates were taken from each of the four locations, for a total of
32 FAME samples. In the laboratory prior to any step in the FAME analysis, the wet
69
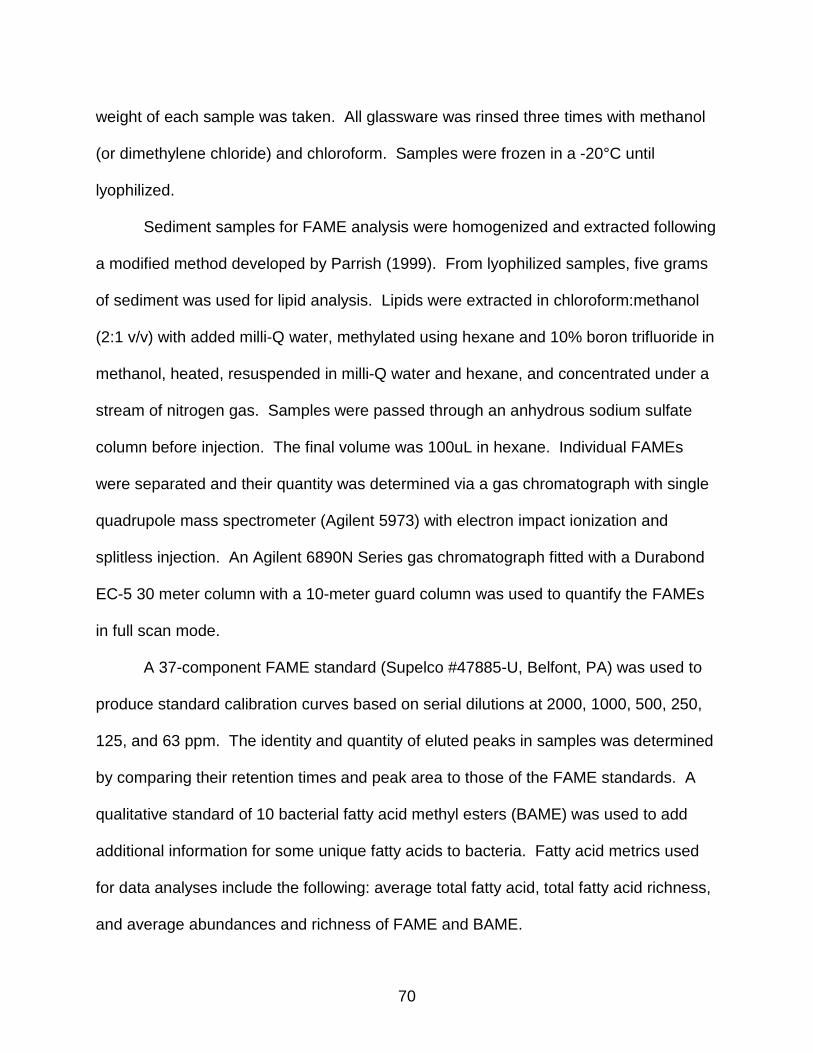
weight of each sample was taken. All glassware was rinsed three times with methanol
(or dimethylene chloride) and chloroform. Samples were frozen in a -20°C until
lyophilized.
Sediment samples for FAME analysis were homogenized and extracted following
a modified method developed by Parrish (1999). From lyophilized samples, five grams
of sediment was used for lipid analysis. Lipids were extracted in chloroform:methanol
(2:1 v/v) with added milli-Q water, methylated using hexane and 10% boron trifluoride in
methanol, heated, resuspended in milli-Q water and hexane, and concentrated under a
stream of nitrogen gas. Samples were passed through an anhydrous sodium sulfate
column before injection. The final volume was 100uL in hexane. Individual FAMEs
were separated and their quantity was determined via a gas chromatograph with single
quadrupole mass spectrometer (Agilent 5973) with electron impact ionization and
splitless injection. An Agilent 6890N Series gas chromatograph fitted with a Durabond
EC-5 30 meter column with a 10-meter guard column was used to quantify the FAMEs
in full scan mode.
A 37-component FAME standard (Supelco #47885-U, Belfont, PA) was used to
produce standard calibration curves based on serial dilutions at 2000, 1000, 500, 250,
125, and 63 ppm. The identity and quantity of eluted peaks in samples was determined
by comparing their retention times and peak area to those of the FAME standards. A
qualitative standard of 10 bacterial fatty acid methyl esters (BAME) was used to add
additional information for some unique fatty acids to bacteria. Fatty acid metrics used
for data analyses include the following: average total fatty acid, total fatty acid richness,
and average abundances and richness of FAME and BAME.
70

Method/reagent blanks with milli-Q water were processed and analyzed in the
same manner as samples to monitor background levels of fatty acids. The 37-compent
FAME standard and 10-component BAME standard were used to spike an aliquot of
sediment from one replicate from each site to test the accuracy of the analysis. An
unmethylated surrogate, 11-Dodecenoic acid (C12:1) was added to each sample prior
to lipid extraction to monitor efficiency and losses of fatty acids throughout the analysis.
The internal standard, Me-10-undecanoate (C11:1), was added prior to injection.
Statistical Analyses
Parametric means comparison testing were used to determine differences
among and within environmental parameters, based on site. Student’s t test and
ANOVA was used via SAS (SAS 2010). Multiple range tests (SNK or Tukey’s) were
conducted to elucidate which groups were similar or different. An alpha level of 0.05
was used for all statistical testing.
To classify benthic taxa similarity among sites, hierarchical agglomerative
methods using un-weighted pair groups and arithmetic averages (UPGMA) (Sneath and
Sokal 1973) were used to produce dendrograms of taxa similarity among the site
locations (Kovach 1999). The degree of similarity among sites, or groups of sites, is
indicated by the level at which linkage occurs. Similarity increases as linkages
approach 1.0. Sites that cluster with similarity values of >0.52 were chosen to represent
ecological importance.
All geospatial, habitat, in-stream chemistry, and benthic macroinvertebrate
variables (abundance, richness, Oligochaete abundance, Oligochaete richness,
Chironomidae abundance, and Chironomidae richness) were tested for significant
71

correlations (Pearson’s Correlation Procedure, α = 0.05). When two variables
correlated, best professional judgment determined which variable is more ecologically
useful in describing the benthic metrics.
To evaluate the relative importance of the environmental variables on benthic
macroinvertebrate community structure a Canonical Correspondence Analysis (CCA)
was performed using CANOCO version 4.5 (ter Braak 2005). The most significant
environmental variables were selected by the forward selection method with an
unrestricted Monte-Carlo Permutation test based on 199 permutations, to randomize the
data sets (ter Braak 2005). Environmental variables were “normalized” by ratioing
against the largest value collected to avoid a bias in the final results (M. Acevedo
personal communication – March 2013). Ordination with CCA was used to estimate the
total amount of variance explained (as the sum of the canonical eigenvalues) by all
explanatory variables. The strength of the axis, the variation explained, and the
direction of the vectors help to inform about niche separation of each taxa as they relate
to the site in which they found.
Results
Benthic Macroinvertebrate Community Structure
A total of 58 taxa (two phyla, one class, six families, four sub-families, 20 genera,
and 25 species) and 923 individuals were collected from 16 benthic samples. Over
85% of the total number of individuals collected belonged to 41 taxa, all of which were
chironomids (59%) and oligochaetes (26%). There was no significant statistical
difference between the total number of individuals collected (Figure 10). The average
number of macroinvertebrates collected ranged from a maximum of 87 individuals at the
72
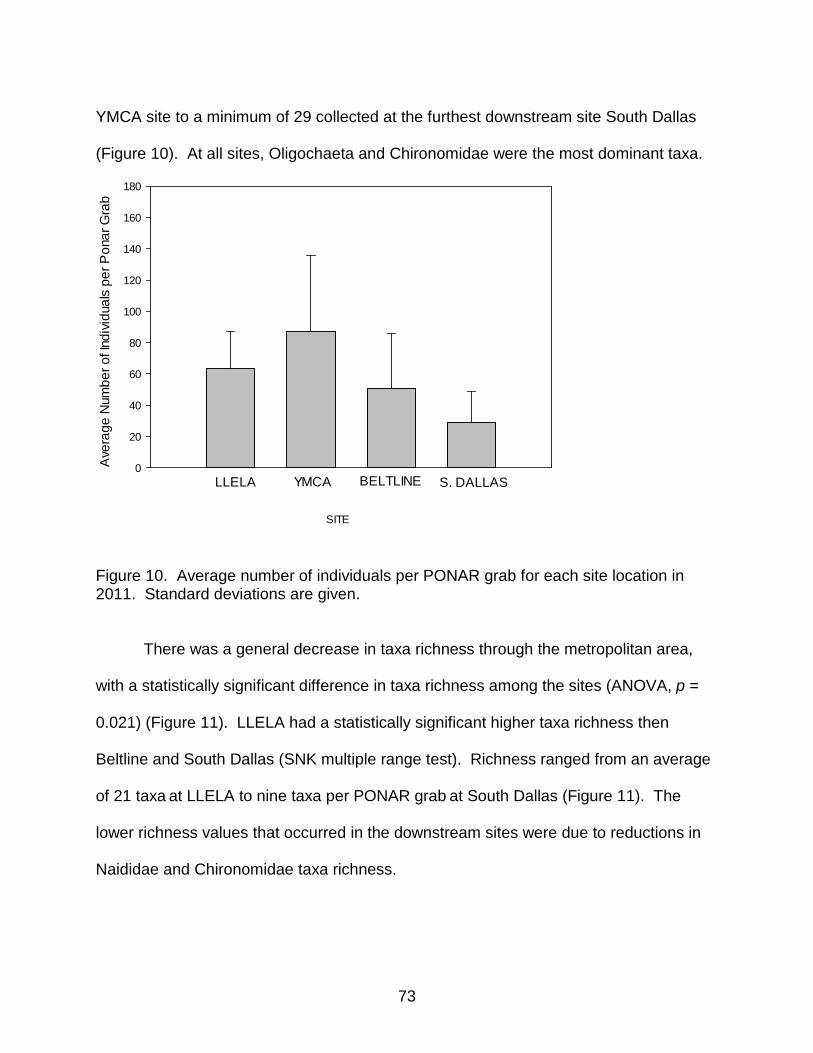
YMCA site to a minimum of 29 collected at the furthest downstream site South Dallas
(Figure 10). At all sites, Oligochaeta and Chironomidae were the most dominant taxa.
Figure 10. Average number of individuals per PONAR grab for each site location in 2011. Standard deviations are given.
There was a general decrease in taxa richness through the metropolitan area,
with a statistically significant difference in taxa richness among the sites (ANOVA, p =
0.021) (Figure 11). LLELA had a statistically significant higher taxa richness then
Beltline and South Dallas (SNK multiple range test). Richness ranged from an average
of 21 taxa at LLELA to nine taxa per PONAR grab at South Dallas (Figure 11). The
lower richness values that occurred in the downstream sites were due to reductions in
Naididae and Chironomidae taxa richness.
Ave
rage
Num
ber o
f Ind
ivid
uals
per
Pon
ar G
rab
0
20
40
60
80
100
120
140
160
180
LLELA YMCA BELTLINE S. DALLAS
SITE
73

Figure 11. Average number of taxa for each site location in 2011. Sites with different letters are statistically significantly different from each other. Standard deviations are given.
Almost 50% of the total number of individuals consisted of five taxa. Polypedilum
halterale (Chironomidae: Chironominae) was the most abundant taxa, comprising 16%
of the total individuals collected. This species was found primarily at Beltline and South
Dallas. Pristinella sp. “A” (Oligochaeta: Naididae: Naidinae) was the second most
abundant taxa, comprising 12% and found primarily at YMCA. Three other taxa
Cladotanytarsus, Polypedilum flavum and Cryptochironomus were found in abundance
and comprised 8%, 6%, and 5%, respectively. Over 80% (44 of 53 individuals) of
Polypedilum flavum was found at LLELA. Cladotanytarsus and Cryptochironomus were
found at all locations.
Ave
rage
Num
ber o
f Tax
a pe
r Pon
ar G
rab
0
5
10
15
20
25
30
LLELA YMCA BELTLINE S. DALLAS
SITE
A
AB
B
B
74

2011 Taxa Similarity
Morisita’s clustering similarity index indicated differences in community
similarities among the sites (Figure 12). Replicates from LLELA form a unique cluster,
replicates from YMCA form another unique cluster, while samples from Beltline and
South Dallas cluster together. The dominant taxa found at both Beltline and South
Dallas were sexually immature tubificids without capilliform chaetae, Cryptochironomus,
and Polypedilum halterale. These taxa were also the dominant taxa of an earlier study
(Slye et al. 2011) that characterized a cluster that included Beltline and South Dallas.
A CCA ordination plot shows the separation of individual taxa among the sites
(Figure 13 and Table 5). Of the total taxa (58) collected during this study, 17 taxa were
identified from LLELA, with 82.4% of them exclusive to this site. YMCA had 10 taxa,
with eight (80%) exclusive. Beltline had eight taxa unique (62.5%), and South Dallas
had four taxa, with only one being exclusive (25%).
75

Figure 12. Significant taxa similarity (Morisita’s Similarity Index, >0.52) of average total organisms per taxa. Each replicate is represented for each site. 02 is LLELA, 03, is YMCA, 06 is BELTLINE, and 08 is S. DALLAS.
Modified Morisita's Similarity (>0.52 is significant)
02-11-A02-11-C02-11-B02-11-D06-11-A08-11-A06-11-B06-11-C08-11-C08-11-D08-11-B06-11-D03-11-A03-11-C03-11-B03-11-D
0.04 0.2 0.36 0.52 0.68 0.84 1
76

Table 5. 2011 taxa list with associating CCA ordination plot number from Figure 13. Average number of individuals is listed by site number.
CCA ordination Taxa
03
06
08
1 Platyhelminthes 1 0 0 0 2 Dero pectinata 1 0 0 0 3 Nais 1 0 0 0 4 Pristina aequiseta 1 0 0 0 5 Pristina leidyi 1 0 0 0 6 Pristinella osborni 1 0 0 0 7 Slavina 2 0 0 0 8 Physidae 1 0 0 0 9 Helisoma 1 0 0 0
10 Chironomus 1 0 0 0 11 Dicrotendipes fumidus 3 0 0 0 12 Polypedilum flavum 11 0 1 1 13 Polypedilum scalaenum 1 0 0 0 14 Polypedilum tritum 2 0 0 0 15 Dicrotendipes sp. B 7 0 1 0 16 Tanytarsus 1 0 0 0 17 Orthocladius/Cricotopus 2 1 0 0 18 Caenis 1 1 0 0 19 Ceratopogonidae 2 2 0 0 20 Immature tubificid w/oc 6 4 2 2 21 Corbicula 1 0 0 1 22 Limnodrilus hoffmeisteri 1 2 1 0 23 Chironominae pupae 2 3 2 0 24 Nais variabilis 2 6 1 0 25 Pristinella sp. "A" 0 25 3 0 26 Coleoptera 0 11 1 0 27 Tanypodinae 0 4 0 0 28 Tanypus I 0 1 0 0 29 Cladopelma 0 4 0 0 30 Nanocladius 0 1 0 0 31 Parakiefferiella 0 3 0 0 32 Fissimentum 0 1 0 0 33 Harnischia complex "D" 0 1 0 0 34 Zavreliella marmorata 0 3 0 0 35 Nematoda 2 3 2 1 36 Cladotanytarsus 3 10 4 2 37 Dicrotendipes neomodestus 2 1 3 1 38 Cryptochironomus 2 3 2 6 39 Polypedilum halterale 3 0 21 13
77

Table 5 continued. 2011 Taxa list with associating CCA ordination plot number from Figure 13. Average number of individuals is listed by site number.
CCA ordination Taxa
02
03
06
08
40 Tricorythidae 0 0 0 1 41 Aulodrilus pigueti 0 0 1 0 43 Dicrotendipes lucifer 0 0 3 0 42 Dicrotendipes tritomus 0 0 4 0 44 Microchironomus 0 0 1 0 45 Parachironomus tenuicaudatus 0 0 1 0
Figure 13. Canonical Correspondence Analysis of taxa collected in 2011. See Table 5 for taxa list and associating CCA ordination number. Triangles are taxa, and circles are sites.
-2 3
-2
2
35
1,2,3,4,5,6,7,8,9,10,11,12,13,14
24
25 23
20 21
19
40
26
17
22
38 37
15
41,42,43,44,45
16
39
36
18
27,28,29,30,31,32,33,34 YMCA
Beltline South Dallas
LLELA
78

Biofilm Fatty Acid Methyl Esters
Forty-one out of 51 FAME and BAME were quantified from the 16 biofilm
samples. The average total lipid quantity ranged from 1920.57 ng/g (+ 1091.87 ng/g SD)
at LLELA to 952.36 ng/g (+ 729.79 ng/g SD) at South Dallas (Figure 14 and Table 6).
Palmitic acid (C16:0) and Palmitoleic acid (C16:1) were the most abundant fatty acids
(Table 7). Six fatty acids were present at only one site. Two FAME, Linolenic acid
(C18:3N6 (Gamma)) and Cis-8, 11, 14—Eicosapentaenoic acid (C20:3N6), were unique
to LLELA at 8.32 ng/g and 6.34 ng/g, respectively. Two BAME, 3-OH 12:0 3-
Hydroxydodecanoate and 2-OH 16:0 2-Hydroxyhexadecanoate, were unique to LLELA
at 6.37 ng/g and 12.86 ng/g, respectively. One FAME, C22:5 Cis-7,10,13,16,19-
Docosapentaenoic acid was unique to Beltline at 8.95 ng/g. One FAME, Erucic acid
(C22:1N9) was unique to South Dallas at 21.82 ng/g. Although there were correlations
between fatty acids variables and benthic macroinvertebrate community metrics there
were no statistically significant differences detected among sites for any of the six fatty
acid metrics. Low statistical power of the ANOVA test (α-level 0.05) may have
contributed to this lack of differences (Figure 14).
79

Figure 14. Average Total Lipid (ng/g) from deposistional sediment biofilm fatty acids from 5.6 grams dry weight of the 2011 study. Standard deviations are given. Table 6. Fatty Acid Methyl Ester and bacterial acid methyl ester metrics. Site LLELA YMCA BELTLINE DALLAS Total Lipid (FAME and BAME) (ng/g) 1920.57 1286.03 1468.25 952.36 Total FAME (ng/g) 1548.83 961.17 1060.33 728.46 Total BAME (ng/g) 371.74 324.86 407.92 223.89 Total Richness (FAME and BAME) 26 26 25 21.50 Richness FAME 19 19 18 17.00 Richness BAME 8 7 8 4.50
Aver
age
Tota
l Lip
id (n
g/g)
0
500
1000
1500
2000
2500
3000
3500
LLELA YMCA BELTLINE S. DALLAS
SITE
80

81
Table 7. Average fatty acid methyl esters in ng/g for each site with standard deviations. Long-chain polyunsaturated fatty acids that are considered essential to benthic macroinvertebrates are denoted as EFA. Fatty acids that are unique to the BAME standard are denoted with an asterisk. Values lower than the Practical Quantitation Limits (PQL) are "semi-quantitative estimates" as are all estimated BAME concentrations.
Sample Fatty Acid PQL LLELA Std Dev YMCA Std Dev BELTLINE Std Dev2 S.DALLAS Std Dev3 10 Undecenoic Acid (methylated int. std.)(5ppm) 94008.40 12718.77 80322.82 11320.47 63784.90 13541.03 83909.15 22412.86 C12:1-Dodecenoic (unmethylated surrogate)(5ppm) 271059.52 163700.00 147046.59 73188.49 99750.29 404067.92 471665.49 98228.25 C6:0 Caproic 44.64 0.00 0.00 0.00 0.00 0.83 1.67 0.00 0.00 C8:Caprylic 44.64 0.00 0.00 0.00 0.00 0.22 0.44 0.00 0.00 C10:0 Capric 44.64 0.00 0.00 0.00 0.00 0.00 0.00 0.00 0.00 C11:0 Undecanoic 22.32 0.62 1.24 1.50 1.79 0.44 0.88 1.20 1.39 C12:0 44.64 9.27 2.01 13.67 1.88 36.24 13.59 13.15 8.45 C13:0 Tridecanoic 22.32 0.00 0.00 4.66 3.37 0.00 0.00 2.45 1.83 C14:1 Myristoleic 22.32 0.00 0.00 0.00 0.00 0.00 0.00 0.00 0.00 C14:0 Myristic 44.64 116.77 88.39 45.30 8.25 69.89 47.74 43.34 35.15 C15:1 Cis-1-10 Pentadecenoic 22.32 11.69 23.37 0.00 0.00 11.69 23.37 11.39 22.78 C15:0 Pentadecanoic 22.32 32.38 16.05 37.53 7.13 20.36 20.12 22.57 16.51 C16:1 Palmitoleic 22.32 497.77 395.46 212.33 48.23 258.89 128.68 143.07 140.29 C16:0 Palmitic 66.96 393.81 237.52 276.32 30.87 318.33 162.83 229.32 158.49 C17:1 Cis-10-Heptadecenoic 22.32 15.98 21.14 33.36 13.48 10.06 20.12 10.08 13.58 C17:0 Heptadecanoic 22.32 4.76 6.13 20.36 1.88 13.25 5.76 9.01 7.42 C18:3N3 Alpha-LinolenicEFA 22.32 16.23 19.50 5.74 8.42 8.66 17.31 11.02 13.34 C18: 2N6C (Cis)LinoleicEFA 22.32 26.11 25.90 8.64 17.29 0.00 0.00 17.61 13.95 C18:3N6 (Gamma) LinolenicEFA 22.32 8.32 10.69 0.00 0.00 0.00 0.00 0.00 0.00 C18:2N6T (Trans) LinolelicEFA 22.32 46.52 38.60 45.58 7.97 57.27 32.74 23.24 27.68 C18: 1N9C Oleic 44.64 101.57 40.83 96.54 6.32 135.78 35.20 36.34 23.78 C18:1N9T Elaidic 22.32 51.58 28.60 38.63 13.63 59.13 23.41 43.02 35.81 C18:0 Stearic 44.64 44.34 15.50 46.86 10.41 81.16 52.16 48.16 33.97 C20:5N3 Cis-5, 8, 11, 14, 17-Eicosapentaenoic EFA 22.32 26.62 31.69 0.00 0.00 32.47 64.94 0.00 0.00 C20:4N6 ArachidonicEFA 22.32 40.20 36.54 0.00 0.00 11.28 22.57 0.44 0.89 C20:3N6 Cis-8, 11, 14--EicosapentaenoicEFA 22.32 6.34 8.87 0.00 0.00 0.00 0.00 0.00 0.00 C20:2 Cis-11, 14-Eicosadienoic 22.32 0.00 0.00 0.00 0.00 0.00 0.00 0.00 0.00 C20:1N9 Cis-11-Eicosenoic 22.32 8.44 8.54 9.54 11.77 20.10 2.84 1.46 2.93 C20:3N3 Cis-11, 14,17-Eicosenoic 22.32 0.00 0.00 0.00 0.00 0.00 0.00 0.00 0.00 C20:0 Arachidic 44.64 2.25 3.15 8.24 5.65 11.18 6.33 4.89 5.69 C21:0 Heneicosanoic 22.32 41.63 78.84 6.10 4.52 3.14 2.60 4.68 6.85

82
Sample Fatty Acid PQL LLELA Std Dev YMCA Std Dev BELTLINE Std Dev2 S.DALLAS Std Dev3 C22:6N3 Cis-4, 7, 10,13,16, 19-DocosahexaenoicEFA 44.64 0.00 0.00 0.66 1.32 0.00 0.00 0.00 0.00 C22:5 Cis-7,10,13,16,19-Docosapentaenoic 22.32 0.00 0.00 0.00 0.00 8.95 17.91 0.00 0.00 C22:2 Cis-13,16-Docosadienoic 22.32 0.00 0.00 0.00 0.00 0.00 0.00 0.00 0.00 C22:1N9 Erucic 22.32 0.00 0.00 0.00 0.00 0.00 0.00 21.82 15.00 C22:0 Benhenic 44.64 6.00 2.87 20.46 2.12 20.02 13.29 5.94 8.70 C23:0 Tricosanoic 22.32 31.95 60.73 7.13 1.12 8.44 5.98 3.87 4.04 C24:1N9 Nervonic 22.32 0.00 0.00 0.00 0.00 0.00 0.00 0.00 0.00 C24:0 Lignoceric 44.64 7.68 5.09 22.01 5.69 25.49 18.41 20.40 22.21 2-OH 10:0 2-hydroxydecanoate* 44.64 0.00 0.00 0.00 0.00 0.00 0.00 0.00 0.00 2-OH 12:0 2-hydroxydodecanoate* 44.64 0.00 0.00 0.00 0.00 0.00 0.00 0.00 0.00 3-OH 12:0 3-hydroxydodecanoate* 44.64 6.37 12.74 0.00 0.00 0.00 0.00 0.00 0.00 i-15:0 13-Methyltetradecanoate* 89.29 80.16 28.75 72.17 7.37 111.23 44.84 74.29 71.14 a-15:0 12-Methyltetradecanoate* 44.64 67.69 35.61 55.98 11.25 65.79 22.61 40.31 40.32 2-OH 14:0 2-hydroxytetradecanoate* 89.29 0.00 0.00 0.00 0.00 0.00 0.00 0.00 0.00 3-OH 14:0 2-hydroxytetradecanoate* 89.29 0.00 0.00 0.00 0.00 0.00 0.00 0.00 0.00 i-16:0 14-methylpentadecanoate* 44.64 15.73 18.21 33.34 3.84 40.39 10.20 10.59 21.19 i-17:0 15-methylhexadecanoate* 44.64 30.62 4.05 22.63 15.16 37.91 8.66 25.15 19.67 17:0 cis-9, 10-methylenehexadecanoate* 44.64 42.60 8.96 36.75 9.45 24.48 16.59 26.75 21.04 2-OH 16:0 2-hydroxyhexadecanoate* 89.29 12.86 25.71 0.00 0.00 0.00 0.00 0.00 0.00 18:2 cis-9, 12-octadecadienoate* 44.64 62.01 27.22 57.51 3.73 65.53 19.80 28.88 22.46 19:0 cis-9, 10-methyleneoctadecanoate* 44.64 31.43 2.42 23.70 15.85 27.23 18.66 17.91 21.04 19:0 nonadecanoate* 44.64 22.27 14.86 22.77 15.18 29.70 0.54 0.00 0.00

Relationships between Benthic Macroinvertebrate Data and Fatty Acid Richness
Correlations between fatty acid variables and benthic macroinvertebrate
community metrics were detected. Average total FAME was significantly positively
correlated with average Oligochaeta taxa richness (Pearson’s Correlation, α level =
0.05, r = 0.96). At LLELA, average total FAME (1548.83 ng/g) and Oligochaeta
richness (seven) were higher than other sites. Downstream of urbanization at S.
DALLAS, the average total FAME (728.46 ng/g) and Oligochaeta richness (three) were
lower than other sites. Average total BAME was significantly positively correlated with
average Chironomidae abundance (Pearson’s Correlation, α level = 0.05, r = 0.98). At
Beltline, both average total BAME (407.92 ng/g) and average Chironomidae abundance
(41 individuals) were higher than other sites. Polypedilum halterale with 21 individuals,
or 17% of the total chironomid abundance, was collected at Beltline. Five of the 11
quantified individual total fatty acids unique to the BAME mixture were highest at
Beltline.
A CCA analysis revealed other relationships between fatty acids and benthic taxa
(Figures 15 - 18). Refer to the CCA ordination diagram that shows dispersion of taxa by
sample site (Figure 13, Table 5). The pattern of taxa as displayed in Figure 13 does not
change in Figures 15 – 18, but are not shown due to crowding of the diagrams. In each
CCA diagram, the sites do not change location on the axes either. Therefore, each
diagram shows the separation of the selected fatty acid metrics or individual fatty acids
as they explain taxa variation among sites. Under each diagram, a table gives the
eigenvalues and variance data for the CCA analysis specific to each ordination plot for
the variable(s) that explains the most variation (Tables 8 - 11). All FAME metrics show
83

separation into two quadrants containing LLELA and YMCA (Figure 15, Table 8). No
FAME metrics are separated into the quadrants where Beltline and South Dallas are
located. This is somewhat surprising due to the above mentioned correlation with
average total BAME abundance and Oligochaeta richness, which were both highest at
Beltline.
Myristic acid (C14:0) is strongly associated with LLELA (Figure 16). Myristic acid
has an average total quantity of 116.77 ng/g at LLELA, which is greater than twice that
of other sites although not statistically significant. C17:1 Cis-10-Heptadecenoic acid is
associated with YMCA. The quantity of this fatty acid (33.36 ng/g) at YMCA is greater
than twice that of other sites although not statistically significant. There are seven of the
19 longer chain fatty acids that separate near LLELA, all with quantities above at least 5
ng/g (Figure 17). At YMCA, C22:6N3 Cis-4, 7, 10,13,16, 19-Docosahexaenoic acid
shows a strong association. This is because C22:6N3 was not found at other sites,
however the average quantity is only 0.66 ng/g (Figure 17). There are four bacterial
fatty acids associated with Site LLELA (Figure 18), two of which only occur at LLELA.
84

Figure 15. CCA analysis ordination diagram of FAME metrics (ng/g) with all taxa from the 2011 study. Circles represent site locations, and arrows are the FAME variables.
Table 8. Eigenvalue, variance explained, and total inertia of the CCA analysis of FAME metrics total lipid (ng/g) and total lipid richness with all taxa from the 2011 study.
Axes 1 2 3 4 Total inertia
Eigenvalues : 0.600 0.369 0.426 0 1.395 Species-environment correlations : 1 .96 0 0 Cumulative percentage variance of species data : 43.0 69.0 100 0 of species-environment relation: 61.9 100 0 0 Sum of all eigenvalues 1395 Sum of all canonical eigenvalues 0.969
-2 3
-2
2 LLELA
YMCA
BELTLINE S. DALLAS
Total Lipid Total FAME
Total BAME
Total Richness
BAME Richness
FAME Richness
85
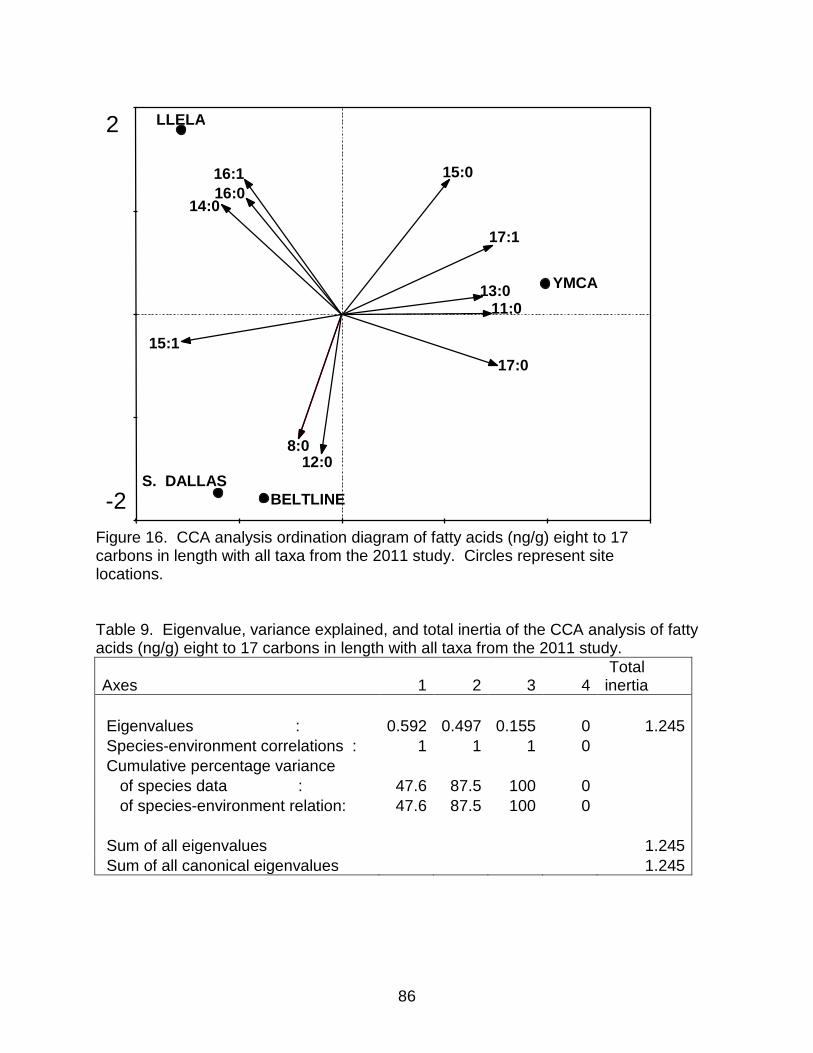
Table 9. Eigenvalue, variance explained, and total inertia of the CCA analysis of fatty acids (ng/g) eight to 17 carbons in length with all taxa from the 2011 study.
Axes 1 2 3 4 Total inertia
Eigenvalues : 0.592 0.497 0.155 0 1.245 Species-environment correlations : 1 1 1 0 Cumulative percentage variance of species data : 47.6 87.5 100 0 of species-environment relation: 47.6 87.5 100 0 Sum of all eigenvalues 1.245 Sum of all canonical eigenvalues 1.245
-2 3
-2
2 LLELA
YMCA
BELTLINE S. DALLAS
8:0
11:0
12:0
13:0
14:0
15:1
15:0 16:1 16:0
17:1
17:0
Figure 16. CCA analysis ordination diagram of fatty acids (ng/g) eight to 17 carbons in length with all taxa from the 2011 study. Circles represent site locations.
86

Figure 17. CCA analysis ordination diagram of fatty acids (ng/g) 18 to 24 carbons in length with all taxa from the 2011 study. Circles represent site locations.
Table 10. Eigenvalue, variance explained, and total inertia of the CCA analysis of fatty acids (ng/g) 18 to 24 carbons in length with all taxa from the 2011 study.
Axes 1 2 3 4 Total inertia
Eigenvalues : 0.592 0.497 0.155 0 1.245 Species-environment correlations : 1 1 1 0 Cumulative percentage variance of species data : 47.6 87.5 100 0 of species-environment relation: 47.6 87.5 100 0 Sum of all eigenvalues 1.245 Sum of all canonical eigenvalues 1.245
-2 3
-2
2 LLELA
YMCA
BELTLINE S. DALLAS
18:3N3
18:2N6 18:3N6
18:2N6T
18:1N9
18:1N9T
18:0
20:5N3
20:4N6
20:3N6
20:1N9
20:0
21:0
C22:6N3
22:5 C
22:1N9 22:0
23:0
24:0
87
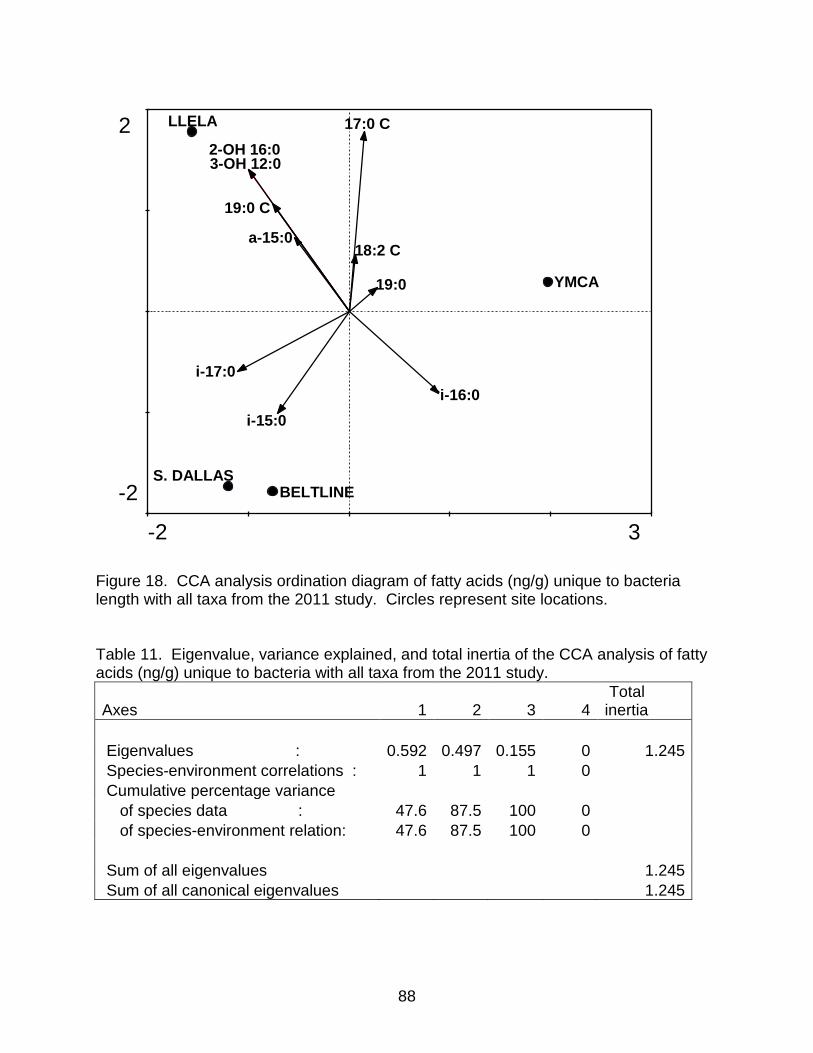
Figure 18. CCA analysis ordination diagram of fatty acids (ng/g) unique to bacteria length with all taxa from the 2011 study. Circles represent site locations.
Table 11. Eigenvalue, variance explained, and total inertia of the CCA analysis of fatty acids (ng/g) unique to bacteria with all taxa from the 2011 study.
Axes 1 2 3 4 Total inertia
Eigenvalues : 0.592 0.497 0.155 0 1.245 Species-environment correlations : 1 1 1 0 Cumulative percentage variance of species data : 47.6 87.5 100 0 of species-environment relation: 47.6 87.5 100 0 Sum of all eigenvalues 1.245 Sum of all canonical eigenvalues 1.245
-2 3
-2
2 LLELA
YMCA
BELTLINE S. DALLAS
3-OH 12:0
i-15:0
a-15:0
i-16:0 i-17:0
17:0 C
2-OH 16:0
18:2 C
19:0 C
19:0
88

CCA Analysis with Selected Fatty Acid Metrics and Other Environmental Variables to
Explain Taxa Variance among Sites
There are 18 correlations of environmental variables with the benthic metrics for
the 2011 data (Table 12). From these correlations, selected environmental variables
were chosen to incorporate into a CCA to predict benthic metrics.
Table 12. Pearson’s correlation (r2) results with environmental variables and benthic macroinvertebrate metrics. Probabilities are shown. All r values are above 0.95. Negative values represent negative correlations Benthic Metric Abundance
CURB pH
-0.029 0.033 Richness CRES Cond Eros InCov -0.027 -0.020 -0.018 0.006 Oligochaeta Abundance Temp 0.002 Oligochaeta Richness Eros HQIS TotFAME -0.049 0.014 0.044 Chironomidae Abundance TotBAME <0.001 Chironomidae Richness CRES NURB CURB CPOP DO pH Cond -0.009 -0.029 -0.030 -0.009 0.005 0.024 0.035
aCURB = cumulative urban, InCov = instream cover, TotFAME = total FAME (ng/g), TotBAME = total BAME (ng/g), HQIS = Habitat Quality Index Score, EROS = erosion, CRES = cumulative residential, Cond = conductivity, CPOP = cumulative population, and Temp = water temperature.
89

CCA analysis identified environmental variables that helped to explain
differences in taxa at each of the study sites (Figure 19 and Table 13). Four
environmental variables were identified at LLELA: HQIS, percent silt, near-field
agriculture, and total fatty acid quantity. Sediment total organic carbon and near-field
forest are associated with YMCA. Total fatty acid richness from both FAME and BAME
has a vector that is shared among LLELA and YMCA. Beltline and South Dallas are
located in the same quadrant and are associated with near-field urban and erosion
potential.
Figure 19. CCA analysis ordination diagram of selected environmental variables with all taxa from the 2011 study. Circles represent site locations.
-2 3
-2
2 LLELA
YMCA
BELTLINE
S. DALLAS
Agriculture
Forest
Urban
Sediment TOC Flow
Erosion
Insteam Cover
HQIS
Sand
Clay
Silt Total Fatty Acid Fatty Acid Richness
90

Table 13. Eigenvalue, variance explained, and total inertia of the CCA analysis of selected environmental variables (urban, total lipid, instream cover, and flow) with all taxa from the 2011 study.
Axes 1 2 3 4 Total inertia
Eigenvalues : 0.603 0.506 0.286 0 1.395 Species-environment correlations : 1 1 1 0 Cumulative percentage variance of species data : 43.2 79.5 100 0 of species-environment relation: 43.2 79.5 100 0 Sum of all eigenvalues 1.395 Sum of all canonical eigenvalues 1.395
Discussion
Benthic Macroinvertebrate Structure and Fatty Acids
Quantification of the individual fatty acids from sediment biofilms has provided
information about the nutrients available to higher trophic levels in the Trinity River. A
higher abundance and richness of total fatty acids available enables the benthic
macroinvertebrates to spend more energy on growth and reproduction than on
synthesizing fatty acids. At LLELA, benthic richness, as well as total fatty acid
abundance and richness were higher than those at the other sites although not
statistically significant. The excellent habitat quality and cleaner water, along with
greater amounts of fatty acids quantified, suggest that there are more nutrients and
microhabitat available to these organisms. This would ensure more niche space for a
wider range of taxa to become established.
Eight of the fatty acids found among the sites are considered to be essential fatty
acids to invertebrates. Linolenic acid (C18:3N6 [Gamma]) and cis-8, 11, 14-
eicosapentaenoic acid (C20:3N6) are long-chain polyunsaturated fatty acids that
benthic macroinvertebrates cannot synthesize directly (Brett and Müller-Navarra,1997).
91

These fatty acids were only detected at LLELA, where 14 unique taxa were also found.
C22:5 cis-7,10,13,16,19-docosapentaenoic acid, an essential fatty acid (Brett and
Müller-Navarra,1997), was only found in one replicate in the study at Beltline. In this
same replicate, 41% of the total Dicrotendipes taxa were found from a total of 92
individuals from all replicates. There were five species of Dicrotendipes identified in the
study area; four of those five were found at Beltline (two of which were unique to
Beltline only). These associations suggest that the availability of specific essential fatty
acids lead to a higher taxa richness.
Myristic acid (C14:0) is strongly associated with LLELA (Figure 16), with an
average total quantity that was twice that of other sites. Myristic and Palmitic acid are
considered to be fatty acid bioanchors for hydrophobic proteins. They group together in
a “lipid raft” and are thought to contribute to the cellular processes such as signal
transduction, endocytosis, transcytosis, and cholesterol trafficking (Moffett et al. 2000).
Land-use, Biofilms, and Benthic Macroinvertebrates
A major contributing factor to the differences in the benthic community among the
sites appears to be land-use. Near-field urban land-use, instream cover, flow, total lipid,
and lipid richness, explained almost 80% of the taxa variance. In the literature, there
are many articles stating that increased urbanization affects the biota of receiving
systems (Dunne and Leopold 1978, Finkenbine et al. 2000, Pizzuto et al. 2000, Brooks
et al. 2006). However, there is little information available on the effects of urbanization
to biofilm structure and function (Drury et al. 2013). In this study, a conclusion can be
made that integrates the effects of anthropogenic disturbances to biofilm structure with
cascading deleterious changes in benthic macroinvertebrate structure. LLELA and
92

YMCA are both upstream of the DFW metropolitan area and downstream of reservoirs
that have higher water quality then sites further downstream. They both have higher
degrees of agriculture and forested land-use than that of Beltline and South Dallas.
Impervious surface from increased urban land-use in the DFW area intensifies storm
run-off amount and velocity, thereby raising contaminant loadings from surfaces and
lawns into the river. These contaminants may be sorbing to the biofilm polysaccharide
matrix, resulting in biofilm decay and therefore hindering nutrient availability benthic
organisms (Drury et al. 2013). If the contaminants, such as metals, petroleum
hydrocarbons, polycyclic aromatic hydrocarbons, polychlorinated biphenyls, and
pesticides are sorbed into food sources this would enable trophic transfer to
oligochaetes and chironomids by ingestion and dermal contact. This could explain the
lower richness and abundance of oligochaetes and chironomids at Beltline and South
Dallas. Further, the organisms (Polypedilum halterale) that are abundant at these
downstream sites are considered to be pollution tolerant (Beck 1977, US EPA 2013).
In future experiments, it may be useful to identify individual bacteria species.
Drury et al. (2013) found higher abundances of Bacteroidetes, Dechloromonas, and
Nitrospira, which are bacteria that are able to oxidize or digest petroleum hydrocarbons,
polycyclic aromatic hydrocarbons, and polychlorinated biphenyls. Therefore these
species of bacteria may be expected to be higher at Beltline and South Dallas. Beltline
had the highest BAME abundance, which may be explained by bacterial species
present that can utilize or degrade substances from urban run-off.
Agricultural influences may also impact nutrient and chemical sources to
organisms. At LLELA, agricultural land-use is the highest among study sites (62%).
93
The use of fertilizers in farming activities could contribute to higher concentrations of
inorganic and organic nutrients to enhance biofilm structure. Drury et al. (2013) showed
higher abundances of heterotrophic bacteria with greater agriculture land-use due to
additions of fertilizer run-off.
Wastewater Effluent Influences
In the literature, few studies have examined the potential effects of WWTP
effluent on biofilm structure, and only one has been published on sediment microbial
community function and structure in a highly urbanized habitat within a major city (Drury
et al. 2013). Until this dissertation research, the relationship of benthic
macroinvertebrate structure with biofilm characteristics and potential effects from
WWTP influences in a heavily urbanized city has not been conducted/published. It is
not known the multitude of toxic compounds entering waterways and the effects they
have on organisms (Brooks et al. 2006). Pharmaceuticals and personal care products
found in effluent have been considered emerging contaminants of recent publications.
These are biologically active compounds and include antimicrobial that may inhibit
bacterial communities in the sediment biofilms. In future analysis, quantification of these
constituents may provide some insight to the decreased fatty acid abundances and
richness seen at Beltline and South Dallas.
Drury et al. (2013) found shifts in bacterial community composition downstream
of WWTP outfalls. In their study, the upstream sites were distinct based on bacterial
community analysis, whereas the sites downstream of the WWTPs were
indistinguishable. In my study, LLELA and YMCA had distinct benthic
macroinvertebrate community structures, while sites downstream of WWTPs and
94

urbanization were not unique from each other in the taxa found. Similar results were
found in Slye et al. (2011), suggesting that this pattern does not change over time. This
could be a result of a lower richness of available food sources caused by effects from
WWTP contaminants that are consistently present. From these results, it is clear that
biotic homogenization has occurred at urban sites downstream of WWTPs.
Conclusions
Several conclusions about the relationships between benthic macroinvertebrates
and land-use, habitat, and depositional fatty profiles can be drawn from the data.
Benthic macroinvertebrate abundance and richness are directly related to fatty acid
abundance and richness. Increased urban land-use and vicinity to WWTP effluents
have been shown in this study to alter the taxa of benthic species, with increasing
homogenization and lowered abundances. This is possibly due to point and non-point
source additions of environmental and anthropogenic pollutants. The mechanism by
which these contaminants are affecting the distribution of benthic species could be one
of several routes. Nutrients obtained from sediment could be diminished from toxicity to
bacterial, algal, fungal, or protozoa that make up the biofilm matrix on which benthic
organisms, such as chironomids and oligochaetes, require for growth and reproduction.
Another possibility is that the contaminants become bioavailable to benthic organisms
after sorption to the polysaccharide coat that surrounds the microbial communities.
Because of the persistent loading of WWTP effluent, these negative impacts remain
over time. Alternately, there may be some species in the microbial community that are
able to attenuate some of the contaminants. Future research is needed to elucidate
what compounds are found in the depositional sediment, and possibly what specific
95

species are present in the biofilms. Metabolic analysis of the sediment would provide
additional information about nutrient cycling from the biofilms and benthic
macroinvertebrates. Experiments that examine chironomid and oligochaete
growth/reproduction in response to added fatty acids would further test the hypothesis
that increased fatty acid richness and abundance enhances benthic vitality.
Habitat quality is another key factor in sustaining biodiversity of aquatic systems.
Loss of riparian vegetation increases erosion and run-off amounts with a lowered ability
of the surrounding land to filter storm water. Channelization and clear-cutting of trees
and shrubs results in loss of instream cover. In the Trinity River, instream cover and
erosion account for much of the variation in benthic abundance and richness.
Therefore, management practices need to ensure stabilization of river banks and
maintain riparian corridors to improve diversity and river health.
Given the assurance that the human population growth and urban sprawl will
continue to increase exponentially, along with decreasing water availability in the United
States and worldwide, the understanding of river health is at a heightened priority.
Texas is currently in drought conditions and water scarcity is a pressing issue.
Therefore the aquatic systems that provide drinking water for the state need to be cared
for with upmost attention. Biotic homogenization is occurring in this river ecosystem
and appears to be anthropogenically induced. Loss of biotic diversity is a concern on a
global scale and has been studied extensively for plant and other animal communities.
This research suggests that the organisms required for whole-ecosystem functioning
are at risk for biodiversity decay. Habitat degradation, increased surface run-off, and
96
unknown mixing and interactions of increased chemical loading into the Trinity River are
driving this loss in both microbial and benthic macroinvertebrate richness.
CHAPTER 4
IMPORTANCE OF CHOOSING THE APPROPRIATE TAXONOMIC RESOLUTION
Objectives
This chapter has the following objective:
1) Explore the need for a higher taxonomic resolution when identifying benthic
macroinvertebrates in aquatic systems dominated by Oligochaeta and
Chironomidae.
The specific hypotheses tested were:
1) HO There is no difference in benthic macroinvertebrate taxa richness among
sites when calculated using family, sub-family, generic, or species taxonomic
level identifications.
2) HO Predictor environmental variables do not differ when using family, sub-
family, generic, or species taxonomic level identifications.
Background
Global climate change, eutrophication, habitat degradation, contaminant loading,
species invasions, and loss of biodiversity are just some of the stressors challenging
freshwater systems (Vörösmarty et al., 2005, Greffard et al. 2011). Changes in
ecosystems inherently alter species composition, which directly affects ecosystem
processes (Jones 2008). As such, species are a fundamental unit in understanding the
ecology of a particular location (Resh and Unzicker 1975, Jones 2008). Biomonitoring
of macroinvertebrates, particularly chironomids, have shown to be key indicators of
97

freshwater ecosystem health because their community structure reflects a combination
of the physical, chemical, and biological characteristics of their habitat (Rosenberg
1992, Bonada et al. 2006).
Despite the broad application of macroinvertebrate sampling in aquatic studies,
defining the appropriate level of taxonomic resolution is an active area of discussion.
The level of taxonomic identifications used in benthic macroinvertebrate studies is an
important decision that can affect study results and future management practices. In
the literature, there are some who argue for the “finest or lowest-practicable level”,
because it is thought that important ecological information is lost when combining taxa
of similar morphotypes into a course grouping. This is because taxa may differ in their
tolerances to a variety of environmental variables (Resh 1979). In contrast, others
argue for a genus or grouped-level approach on the basis that it provides sufficient
ecological information while being less costly, both in terms of the expertise and time
needed to identify organisms. In a recent review of biomonitoring studies, Jones (2008)
found support for both approaches, but ultimately drew the conclusion that “the default
taxonomic level should be species”, in order to obtain the greatest amount of knowledge
of a system. Furthermore, greater taxonomic detail may be needed to distinguish a
“benchmark” or reference site from other sites “biological condition” (Jones 2008).
Lenat and Resh (2001) recommend that a finer resolution of taxa identification be
implemented where better management decisions may result from study conclusions, if
the study has historical data, and/or the data may be compared with future studies. In
order to achieve confidence and discrimination ability in predictive models of
98
environmental change, genus/species level identifications of Chironomidae are
essential in some studies (Molozzi 2012).
Macroinvertebrates often have behaviors that differ at the sub-family and genus
level, which can influence responses due to habitat degradation or contaminant
exposure (Resh and Unzicker 1975). Kennedy et al. (1994) demonstrated that
Chironomidae taxa needed to be identified to the sub-family level to understand
pesticide effects on the aquatic community. In ecosystems that have not been
described and/or where loss of biodiversity is a main concern, a finer taxonomic level is
needed to gain as much information as possible. For instance, a study of the benthic
macroinvertebrate population of 30 tributary streams at different altitudes within the
catchment of the Sepik River, Papua New Guinea was conducted to record biodiversity
and explore which environmental variables contribute to changes in biodiversity
(Dudgeon 2012). The richness of the “near-pristine” river had not been fully
documented, and anticipated human population in the area is expected to increase.
While Chironomidae were only sorted to genus due the lack of taxonomic keys for the
region, all other aquatic insects were identified to the lowest possible taxon, usually
species. Analysis of the family level data set failed to uncover strong effects of any
environmental variable, but the species level data set showed changes in taxa with
varying degrees of altitude, with weaker responses to water chemistry and other
variables. It was concluded that in order to gage whether or not ecological impacts are
occurring, detailed knowledge of the community composition and how it changes with
existing environmental gradients must be documented (Dudgeon 2012). A
recommendation was made that species level identification was required to detect
99

environmental changes from reference conditions in a region where loss of biodiversity
and human impact is of high concern (Dudgeon 2012).
Chironomids and Oligochaetes are two of the most abundant organisms that
inhabit freshwater (Pinder 1986, Ferrington 2007, Martin et al. 2008). Chironomidae is
the most speciose and widespread aquatic family; the number of species in this single
family is greater than that described for many other aquatic insect orders (Pinder 1986,
Ferrington 2007). Oligochaetes are also specious with about 1,100 freshwater species
known to date (Martin et al. 2008). Chironomids and oligochaetes can inhabit a wide
range of environmental gradients and play important roles in ecosystem processes
(Ferrington 2007, Martin et al. 2008). In studies where taxa richness includes many
orders and families, as often occurs in rock rubble streams, Oligochaeta and
Chironomidae are commonly identified to family, or to the sub-family level due to the
difficulty and expertise required to identify these organisms to lower taxonomic levels.
The objective of this chapter is to explore when it is necessary to identify chironomids
and oligochaetes to the genus level, or species level if there is taxonomic information
available.
Texas Trinity River
The Trinity River, Texas, USA flows through the Dallas-Fort Worth metropolitan
area, and is typical of many urban rivers in the arid southwestern United States, where
river flow is dominated by effluent from municipal WWTPs (estimated at over 600 million
gallons of effluent discharged per day). North central Texas has experienced significant
growth within the past 100 years, resulting in marked changes in land-use. By 1980,
the total population of north central Texas was over 3 million. The rapid increase in
100

population led to increased non-point sources of runoff from yards, streets, parking lots,
industrial areas, and other impervious surfaces. The runoff transports suspended
solids, nutrients, pesticides and herbicides, metals and other contaminants associated
with urban activities (Dickson et al. 1989). In 2000, the population reached 5.25 million,
representing a 70% increase in 18 years leading to larger WWTP releases in the river
(Texas Water Development Board, 2006). Future predictions estimate the north central
Texas population to be 8 million in 2020 and over 13 million by 2060. The majority of
this growth is expected to occur in Dallas, Denton, and Collin counties (> 1,000,000
people). The population influx has resulted in changing land usage in the region around
the DFW metropolitan area. Documentation of the benthic macroinvertebrate structure
of the river as it flows through the metroplex is critical to understand how human
impacts have changed the system. Key environmental variables have been shown to
have effects on the taxa found (Slye et al. 2011). Habitat quality, instream cover,
percent silt, erosion potential, and land use types are important in determining the
community abundance and richness (Slye et al. 2011). Because of the dominance of
Oligochaeta and Chironomidae in the sandy/silt/clay depositional substrate that
characterizes the upper Trinity River, it was expected that it would be necessary to
identify the organisms to the genus, or species level if taxonomic information was
available. The objective of this chapter is to evaluate the need for finer taxonomic
resolution. Two important questions were:
1. Does finer taxonomic resolution of macroinvertebrates allow better
discrimination among sites differentially impacted by human activity than
higher taxonomic levels
101
2. Are different environmental predictors of oligochaete and chironomid
community composition identified when performing multivariate analyses
at a fine versus a coarse level of taxonomic resolution
Study Locations and Methods
Benthic Macroinvertebrate Collection
Benthic macroinvertebrate data were selected from two previous studies
conducted in 2005 and 2011 on the Texas Trinity River in the Dallas – Ft. Worth
Metroplex (Slye et al. 2011). In the 2005 study there were 10 sampling locations, and
four of those sites were sampled in 2011 (Table 14). All sampling occurred in late
August to September. Benthic macroinvertebrates from depositional areas were
collected using a weighted petite PONAR grab (Wildco, Yulee, FL, USA) with a sample
area of 152 mm2. A total of four replicate samples were collected within a 150 m reach
and field-washed through an American Society for Testing and Materials no. 80 sieve
(150 µm mesh). The smaller mesh size was used to collect the highest possible
abundance of oligochaetes and first instar insects that can be thin and easily pass
through a larger mesh size (Kennedy et al. 1994). Each concentrated replicate was
preserved in a buffered 10% formalin solution and transferred to 70% ethanol in the lab.
Samples were processed to remove excess silt, and the organisms were found using a
dissection microscope. Unless damaged or in an early developmental stage,
specimens were identified to genus or species (except for nematodes, bivalves, and
gastropods) using various taxonomic keys (Wiederholm 1983, Merritt and Cummins
1996, Kathman and Brinkhurst 1998, Epler 2001). Oligochaeta and Chironomidae were
mounted on microscope slides using CMC-9 (Masters Chemical, Wood Dale, IL, USA),
102

following methods described by Epler (2001) and Kathman and Brinkhurst (1998) for
identification. In 2005, oligochaetes and chironomids were identified to the generic
level, whereas in 2011 extra effort was made to identify them to species, if taxonomic
knowledge was available. Taxa richness was calculated for the species, genus, sub-
family, and family taxonomic levels.
Statistical Analyses
Each statistical test discussed in this section was performed on the abundance
and richness at the family, sub-family, genus, and species levels. Assumptions for all
tests of significance were determined. Homogeneity of variance was tested using an F-
test, while normality was tested using the Shapiro-Wilks test for normality (Sneath and
Sokal 1973). If violations occurred, a log transformation was used, and homogeneity of
variance was tested. Analysis of variance (ANOVA) was used to determine if there was
a statistically significant difference of taxa richness among sites. A posteriori testing to
determine which sites were significantly different was conducted using a Student-
Newman-Keuls test (SNK) (SAS 2008). All tests to determine statistical significance
were set at an α-level of 0.05. A Canonical Correspondence Analysis (CCA) was used
to detect relationships between benthic taxa and environmental variables. A CCA
analysis was performed on only the 2011 data at sub-family and species levels.
103

Table 14. 2005 and 2011 Sample site identification names, geographic locations, with rationale for the selection, and year(s) sampled. Site Geographic Location and Rationale Year Sampled ELM Elm Fork downstream of Lake Lewisville Dam;
Upstream of WWTPs and urban land use
2005, 2011
WEST1 West Fork downstream of Lake Worth Dam;
Upstream of DFW WWTPs and urban land use
2005, 2011
WEST2 West Fork upstream of Village Creek WWTP;
Upstream DFW WWTPs and receives inputs from
urban land-use
2005
WEST3 West Fork upstream of TRA Central WWTP;
Characterizes effect of transport and urban land-use
on effluent inputs within the DFW mixing zone
2005, 2011
MAIN1 Main stem downstream of Dallas Central WWTP;
Characterizes the effect of transport and urban
land-use on effluent inputs within the DFW mixing
zone
2005, 2011
MAIN2 Main stem upstream of Dallas Southside WWTP;
Characterizes the effect of transport and urban
land-use on effluent inputs within the DFW mixing
zone
2005
EAST East Fork upstream of the confluence of the East
Fork and main stem Trinity River; site aids in
characterizing any inputs from WWTPs on the East
Fork
2005
MAIN3 Main stem downstream of Dallas Southside WWTP;
Identifies conditions immediately downstream of the
DFW mixing zone before inputs from the East Fork
2005
MAIN4 Main stem downstream of the East Fork confluence;
Identifies conditions downstream of the DFW mixing
zone after inputs from the East Fork
2005
MAIN5 Main stem at Palestine; Identifies conditions far
downstream of the DFW mixing zone
2005
104

Results
Assessment of Taxa Richness
Richness was calculated for family, sub-family, generic, and species taxonomic
levels. When the taxonomic level was refined from sub-family to genus, richness
increased almost 200% in 2005, and 115% in 2011 (Table 15 and 16). If the percent
change for 2005 richness was calculated using only the four site locations sampled in
2011, there was a 190% change from sub-family to genus (Table 17). The larger
increase in richness numbers in 2005 was because there were more genera of
chironomids 2005 than in 2011. If taxa were refined from genera to species level,
richness increased by 15% in 2005, and 37% in 2011 (Table 15 and 16). If the percent
change for 2005 richness was calculated using only the four site locations sampled in
2011, there was a 13% change from genus to species (Table 17). The larger change in
richness in 2011 was due to more species level identifications of chironomids and
oligochaetes.
Table 15. Average total taxa richness of 2005 sampling of all 10 Sites based on taxonomic refinements.
Taxa Species Genus Sub-family Family Class Phylum Phylum Nematoda 1 1 1 1 1 1 Phylum Annelida 0 0 0 0 0 1 Class Oligochaeta 1 1 1 1 1 Family Naididae 0 0 0 1 Sub-family 1 1 2 Genus 4 9 Species 15 Phylum Mollusca 0 0 0 0 0 1 Class 1 1 1 1 2 Family 5 5 5 5 Phylum Arthropoda 0 0 0 0 0 1 Class Insecta 0 0 0 0 1 Family 14 14 14 14 Sub-family 3 3 3 Genus 45 45 Species 1 Total Taxa Richness 91 80 27 23 5 4
105

a Taxa are counted by the lowest taxonomic level possible, and not counted again in the next higher level. Table 16. Average total taxa richnessa of 2011 sampling of all four sites based on taxonomic refinements.
Taxa Species Genus Sub-family Family Class Phylum Phylum Nematoda 1 1 1 1 1 1 Phylum Platyhelminthes 1 1 1 1 1 1 Phylum Annelida 0 0 0 0 0 1 Class Oligochaeta 1 1 1 1 1 Family Naididae 0 0 0 1 Sub-family 1 1 2 Genus 2 7 Species 12 Phylum Mollusca 0 0 0 0 0 1 Class 1 1 1 1 2 Family 2 2 2 2 Phylum Arthropoda 0 0 0 0 0 1 Class Insecta 0 0 0 0 1 0 Family 3 3 8 8 Sub-family 3 3 3 Genus 15 21 Species 14 Total Taxa Richness 56 41 19 15 6 5
a Taxa are counted by the lowest taxonomic level possible, and not counted again in the next higher level. Table 17. Average total taxa richnessa of 2005 sampling of Elm, West1, West2, and Main1 based on taxonomic refinements.
Taxa Species Genus Sub-family Family Class Phylum Phylum Nematoda 1 1 1 1 1 1 Phylum Annelida 0 0 0 0 0 1 Class Oligochaeta 1 1 1 1 1 Family Naididae 0 0 0 1 Sub-family 1 1 2 Genus 4 7 Species 10 Phylum Mollusca 0 0 0 0 0 1 Class 1 1 1 1 2 Family 4 4 4 4 Phylum Arthropoda 0 0 0 0 0 1 Class Insecta 0 0 0 0 1 Family 10 10 10 10 Sub-family 3 3 3 Genus 33 33 Species 1 Total Taxa Richness 69 61 21 19 5 4
a Taxa are counted by the lowest taxonomic level possible, and not counted again in the next higher level.
106
Differences in taxa richness among sites were tested across a range of
taxonomic levels (Table 18 and 19). Considering all 10 sites in the 2005 analyses at the
family and sub-family level, the only statistically significant difference in richness was
that Main1 had a greater richness than West3 and Main5. When increased taxonomic
levels of genus and species were used, the ability to detect statistically significant
differences in richness increased. Based on what is known about the habitat and
position of the upstream and downstream sites in relation to urban and WWTP
influences, these separations are biologically relevant. Elmfork had a greater richness
than West3, East, Main4, and Main5. This would be expected since Elm has better
habitat and less urban and WWTP influence.
In 2011, there were no statistically significant differences in taxa richness among
the four sites at the family level (Table 19). At the sub-family level, Elm and West1 had
statistically significant higher richness then West3 and Main1. This would be expected
as Elm and West1 are considered to be reference locations. When examined at the
generic level, West1 taxa richness continued to be statistically significantly higher than
the downstream sites; however at this level, the other reference location at Elm did not
have a higher richness than West3 and Main1. The increased richness observed when
benthos were identified to the genus level at West1 was due to six chironomid genera
that were unique to that site only (Fissimentum, Harnischia, Zavreliella, Cladopelma,
Nanocladius, and Parakiefferiella). When the chironomids and oligochaetes were taken
to the species level, if taxonomic information was available, Elm richness was
statistically greater than West3 and Main1. This difference was attributed to a greater
number of species belonging to the chironomid genera, Dicrotendipes and Polypedilum,
107

and the oligochaete genera, Dero, Nais, Pristina, and Pristinella. There were 16
species of chironomids and oligochaetes at Elm, compared to eleven and five at West3
and Main1, respectively.
Table 18. Difference in taxa richness among sites for increasing taxonomic refinement in 2005 using ANOVA. Different letters represent statistically significant richness by site (Student Newman-Keuls multiple range test). Level Family Sub-family Genus Species P-value 0.021 0.005 <0.001 <0.001
Site
ELM AB AB A A WEST1 AB AB ABC ABC WEST2 AB AB ABC ABC WEST3 B B CDB BCD MAIN1 A A AB AB MAIN2 AB AB ABC ABC EAST AB AB CD CD MAIN3 AB AB ABCD ABCD MAIN4 AB AB ABCD BCD MAIN5 AB B D D
Table 19. Difference in taxa richness among sites for increasing taxonomic refinement in 2011 using ANOVA. Different letters represent statistically significant richness by site (Student Newman-Keuls multiple range test). Level Family Sub-family Genus Species P-value 0.068 0.015 0.016 0.021
Site
ELM
A AB A WEST1
A A AB
WEST3
B B B MAIN1
B B B
Canonical Correspondence Analysis
Thirteen environmental variables where chosen to help explain community
structure using a CCA for the 2011 sub-family and species level identifications. Three
land-use measurements (near-field urban, near-field agriculture, and near-field forest)
were used to detect changes in benthic taxa due to differences in predominant
surrounding catchment landscapes. Because sediment characteristics are known to
108

have influence on the benthic species present, sediment total organic carbon, percent
sand, percent silt, and percent clay were chosen. Two nutritional parameters, biofilm
total fatty acid and fatty acid richness, where used to test if higher food quality would
result in higher species richness. The remaining variables (habitat quality index score,
instream cover, flow, and erosion potential) are indicators of habitat quality and
heterogeneity. Different results were obtained when species data was reduced to sub-
family (Figures 20 and 21; Tables 20 and 21). The reduction in taxonomic resolution
from species to sub-family level identifications resulted in:
1) Eigenvalue decrease, which is indicative of species variance explained by the
environmental variables
2) A change in the magnitude of vectors, which is a measure of niche space
3) A change in the direction of vectors, which places the sites in different
quadrants, thus changing the responses of sites
4) A decrease in the scale used on the ordination axis
5) Total inertia decreases, which suggests a loss of descriptive power of the
test
When species data were used, Elm and West1 fell into positive quadrants with
strong indications (vector length) that habitat quality, nutritional resources, and less-
urbanized land-use support higher taxa richness (Figure 21). Also, urbanized land-use
and bank erosion accounted for the lower taxa richness at the downstream sites. When
the sub-family level was used, West1 shifted into a negative quadrant, and West3 and
Main1 were placed into a positive one. Although the environmental variables still had
the general placement as in the species plot, they were not as widely separated.
109

Figure 20. CCA analysis ordination diagram of selected environmental variables with sub-family taxa from the 2011 study. Circles represent site locations.
Figure 21. CCA analysis ordination diagram of selected environmental variables with species level taxa from the 2011 study. Circles represent site locations.
-2.0 2.0
-1.5
2.0 ELM
WEST1 WEST3
Agriculture
Forest
Urban Sediment TOC
Flow
Erosion
Instream Cover
Sand
Silt HQIS
Total Fatty Acid
Fatty Acid Richness
MAIN1
-2 3
-2
2 ELM
WEST1
WEST3 MAIN1
Agriculture
Forest
Urban
Sediment TOC Flow
Erosion
Insteam Cover
HQIS
Sand
Clay
Silt Total Fatty Acid Fatty Acid Richness
110
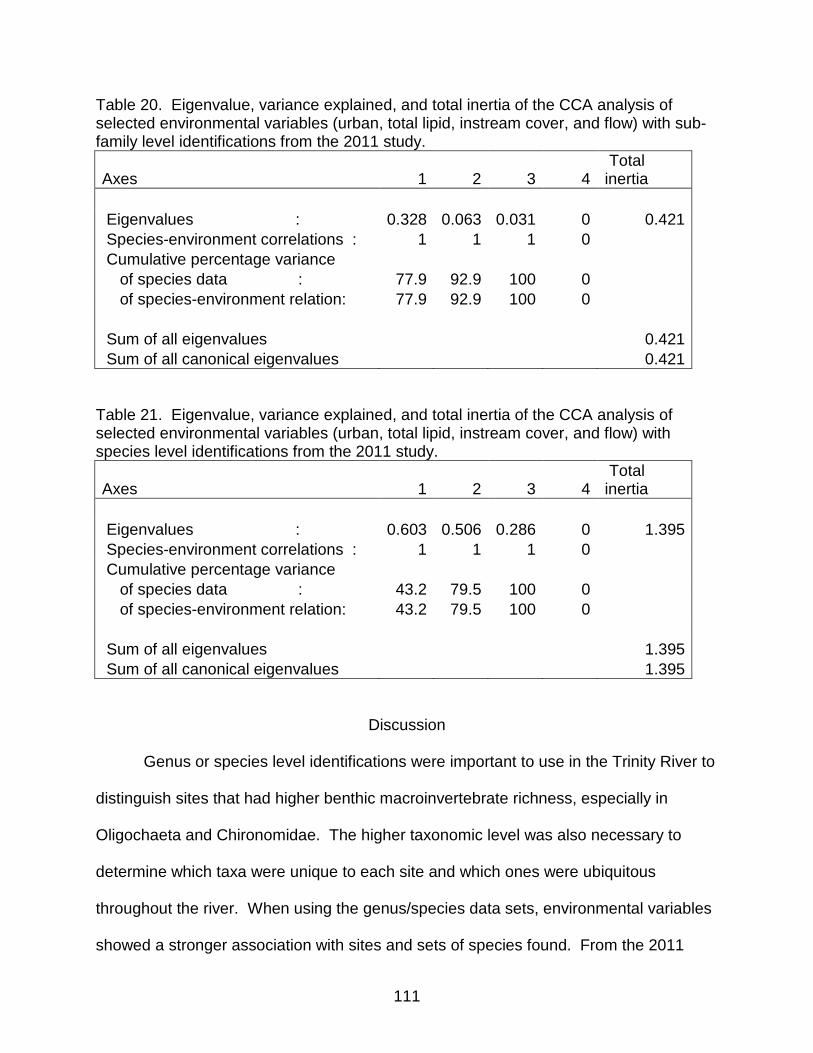
Table 20. Eigenvalue, variance explained, and total inertia of the CCA analysis of selected environmental variables (urban, total lipid, instream cover, and flow) with sub-family level identifications from the 2011 study.
Axes 1 2 3 4 Total inertia
Eigenvalues : 0.328 0.063 0.031 0 0.421 Species-environment correlations : 1 1 1 0 Cumulative percentage variance of species data : 77.9 92.9 100 0 of species-environment relation: 77.9 92.9 100 0 Sum of all eigenvalues 0.421 Sum of all canonical eigenvalues 0.421
Table 21. Eigenvalue, variance explained, and total inertia of the CCA analysis of selected environmental variables (urban, total lipid, instream cover, and flow) with species level identifications from the 2011 study.
Axes 1 2 3 4 Total inertia
Eigenvalues : 0.603 0.506 0.286 0 1.395 Species-environment correlations : 1 1 1 0 Cumulative percentage variance of species data : 43.2 79.5 100 0 of species-environment relation: 43.2 79.5 100 0 Sum of all eigenvalues 1.395 Sum of all canonical eigenvalues 1.395
Discussion
Genus or species level identifications were important to use in the Trinity River to
distinguish sites that had higher benthic macroinvertebrate richness, especially in
Oligochaeta and Chironomidae. The higher taxonomic level was also necessary to
determine which taxa were unique to each site and which ones were ubiquitous
throughout the river. When using the genus/species data sets, environmental variables
showed a stronger association with sites and sets of species found. From the 2011
111

study, a conclusion can be made that instream cover and urban land-use were the two
most important environmental variables that explained the distribution of the taxa in the
Trinity River from reference sites to more impacted sites. This may allow for better
predictive models to be made that aid city planners and government agencies.
Conclusions about which sites should be considered reference and which should
be considered impacted were changed with a courser taxonomic resolution. This
pattern was seen for both the 2005 and 2011 data, suggesting that it is a valid
argument. Had the identifications been only taken to sub-family, Main1 would have
been considered the site with the highest richness in 2005. With the exception of
Main1, the sites were not distinguished from one another until the genus level
identification is made. In 2011, Elm was grouped with the downstream sites at genus
level. Only when species level identifications of Polypedilum and Dicrotendipes
(Chironomidae: Chironominae), Nais, Pristina, and Pristinella (Oligochaeta: Naididae:
Naidinae) were made could Elm be distinguished from West3 and Main1. Not only were
the sites concluded to be different, but also new questions could be formulated as to the
cause of the decrease in richness. Certainly the concentration of urbanization and
effluent from WWTP and major influences with these two sites should be considered
further.
From an ecological standpoint, the species represents the basic unit of the
ecosystem and the niche space available. Species aggregated into higher taxonomic
levels, even from species to genus, can have different ecological features (Greffard et
al. 2011). Variables that alter taxa composition may be physical or chemical, but also
may be due to competition or predation interactions. In 2005, oligochaete genera
112

richness was lower at West3 than any other site. This difference was attributed to
greater numbers of Chironominae that belong to the Harnischia complex, which are
predatory on Oligochaeta (Armitage et al. 1995). Identifications made at taxonomic
levels above genus would have overlooked this important interaction.
Conclusions
This exercise has demonstrated that genus/species level identifications may
provide greater insight into the ecosystem functioning of the benthic macroinvertebrate
community in the Trinity River. There are four specific recommendations when the
researcher, whether manager or academic, should consider genus/species level
identifications:
1) When the system is dominated by oligochaetes and chironomids, as is typical of
depositional substrates when
2) Identifying reference conditions from impacted sites
3) There is long-term monitoring
4) The conclusions could impact management of river health and thus water quality
for biota by improving our ability to judge the efficacy of programs and efforts to
improve water quality
The Trinity River has been monitored for over 20 years (Arnold 1980, Dickson et al.
1989, Bryan 1994, Spon 1994, Guinn 1995, Atkinson et al. 2009, Stephenson and
Kennedy 2010, Slye et al. 2011). It is a highly impacted system, with heavy and rapid
urbanization. The river is effluent-dominated and has a history of poor water quality.
Over half of the state of Texas depends upon the river for drinking water. Because the
substrate of the river is primarily depositional sand, silt, and clay, it has the potential to
113

act as a sink for contaminants. Understanding the nature of the biota that live in these
depositional sediments is important to assess the bioavailability of the many compounds
that are known to be present in the effluent and impervious surface run-off. This study
has demonstrated that a more informative way to measure biotic richness, a key
indicator of river health, is to identify the oligochaetes and chironomids to genus/or
species if taxonomic knowledge is available.
The ultimate goal of stream and river quality assessment is to provide an accurate
measure of the biotic integrity that can easily be understood by city managers and water
authorities, who may have little biological training (Karr 1991). In the case of the Trinity
River, in order to obtain accuracy or at least a more defined picture of the biotic
community structure, this study shows it is necessary to identify taxa to the
genus/species level. By doing so, sites are better distinguished from reference
conditions and environmental variables show increased definition towards certain taxa.
Although a lack of taxonomic knowledge and the cost of biological monitoring are
important considerations in the scope of sampling and analyses, it may be more cost
effective to provide the additional effort of identifying taxa to genus/species in this
system. This is due to the additional data, increased accuracy of the study, and more
biologically relevant conclusions that could be made. A recommendation may be
concluded that the Texas Commission of Environmental Quality, the Trinity River
Authority, and other state and city management agencies require benthic
macroinvertebrate identifications to made at the genus/species level.
On a global perspective, every effort should be taken into consideration to
document the biodiversity of all systems, terrestrial and aquatic, in order to
114

understand what factors contribute to species loss. Also, new species are
discovered every year. If these identifications at the species level are not attempted,
that contribution to science and world knowledge will be lost for generations to
come.
115
CHAPTER 5
RELEVANCE AND IMPORTANCE
Summary of Objectives and Hypotheses
There were seven objectives covered in this dissertation. Objectives include:
1) Characterization of the benthic macroinvertebrate community structure of the
Upper Trinity River in the Dallas-Fort Worth metropolitan area
2) Identification of the relationships between geospatial land-use, habitat, and in-
stream water chemistry with the benthic macroinvertebrate community structure
in the Dallas-Fort Worth metropolitan area
3) Evaluate relationships between the benthic macroinvertebrate community
structure and surface water surfactant toxic unit (TU) measurements
4) Compare historical benthic macroinvertebrate community structure with the
benthic data collected in 2005
5) Develop a method to quantify biofilm fatty acid methyl esters (FAME) abundance
and richness from depositional sediment
6) Determine relationships between the FAME richness and corresponding benthic
macroinvertebrate metrics and taxa to help elucidate influences from urban land-
use and WWTP effluent
7) Evaluate the need for a higher taxonomic resolution when identifying benthic
macroinvertebrates in aquatic systems dominated by Oligochaeta and
Chironomidae
Specific hypotheses that were tested and are as follows:
116

1. Ha Benthic macroinvertebrate community structure metrics (average abundance,
richness, diversity, evenness, Oligochaeta, and Chironomidae abundance and
richness) are correlated to land-use, water chemistry, surfactant, and habitat
parameters. – Accepted.
2. Ha Benthic macroinvertebrate community structure (average abundance,
richness, diversity, evenness, Oligochaeta, and Chironomidae abundance) can
be predicted using a determined model of parameters selected from land-use,
water chemistry, surfactant, and habitat data. – Accepted.
3. Ha Benthic macroinvertebrate community structure metrics (average abundance,
richness, diversity, evenness, Oligochaeta, and Chironomidae abundance and
richness) differs temporally from the 1987 – 88 and the 2005 study - Accepted.
4. Ha Community similarity does differ spatially or temporally within or among the
1987 – 88 and 2005 studies. – Accepted.
5. Ha Benthic macroinvertebrate community structure metrics (average abundance,
richness, Oligochaeta and Chironomidae abundance and richness do correlate or
have a relationship with depositional sediment biofilm fatty acid profiles. –
Accepted.
6. Ha There are relationships with urban land-use, habitat, and FAME abundance
and/or richness on the benthic macroinvertebrate communities. – Accepted.
117

7. Ha There is a difference in benthic macroinvertebrate taxa richness among sites
when calculated using family, sub-family, generic, or species taxonomic level
identifications. – Accepted.
8. Ha Predictor environmental variables do differ when using family, sub-family,
generic, or species taxonomic level identifications. – Accepted.
The spatial and temporal benthic macroinvertebrate data, together with the
geospatial, habitat, in-stream water chemistry, and biofilm richness parameters
presented a unique opportunity to assess the water quality of the Trinity River.
Measurements of changes in the physical, chemical, and biological characteristics of
the river over a 20-year period provided insight that is useful for developing
management and conservation practices in this urbanized, effluent-dominated
watershed. To my knowledge, there is no aquatic study in the literature that
incorporates all of the parameters measured in this dissertation on the vast spatial and
temporal scale covered.
All of the studies conducted on the Trinity River have demonstrated the value
and importance of monitoring the benthic macroinvertebrate community structure.
There is no laboratory setting that could replicate the complex interactions between
water chemistry constituents, sediment characteristics, habitat variability, and biotic
interactions to deduce the health of the river. Furthermore, the importance of realizing
the necessity for genus/species level taxonomic identifications from depositional
sediment was paramount to detecting the variability with communities. In the 1987 -88,
2005, and especially in 2011 identification to the lowest possible level provided better
118

characterization of the benthic community and environmental parameters driving those
communities.
This dissertation has also highlighted the validation of measuring the variables
that are grouped into the land-use, water chemistry, and habitat environmental
parameters. Without such a detailed and expansive effort, the holistic picture of the
Trinity River watershed could not have been realized, as Hynes and others also found
regarding other stream and rivers (Hynes 1975, Harding et al. 1998). Because this
system does not fit the typical Midwestern or northern streams and rivers, it was critical
to investigate all possible avenues of factors that could aid in the explanation of the
benthos found. Assessing the land-use, chemistry, habitat, and biofilm nutrient
availability has led to better benthic ecotoxicology. In a review of the literature
regarding the influence of land-use on stream ecosystems, Allan (2004) suggests that
research is needed to examine responses of biota to land-use that employs variables
that have greater diagnostic value than those in current use. Furthermore,
understanding the impacts of land-use requires data from multiple spatial scales, as well
as comparisons with historical data (Allan 2004). This line of reasoning has been
employed in the 2005 study with large array of watershed land-use measurements,
water chemistry, and habitat assessments on a very large spatial scale along with the
comparisons made with the 1987 – 88 historical study. Long-term monitoring of the
benthic macroinvertebrate community, together with the changes in geospatial, habitat,
and water chemistry will continue to be of importance as new emerging concerns arise
in the future.
119

A major conclusion from the 2005 and the 2011 study is that there were eight
environmental variables that are useful to predict, explain, or have strong associations
with the benthic macroinvertebrate metrics. Near-field forest and near-field urban land-
use were two important geospatial parameters used to explain the benthic
macroinvertebrate structure. In both studies, near-field forest was positively associated
with increased macroinvertebrate metrics. Sediment characteristics that proved
important to measure were sediment total organic carbon and percent silt, both
associated with Sites 2 and 3 (Elm and West1), along with increased benthic
macroinvertebrate metrics. The overall habitat quality score, or HQIS, along with
instream cover were both strongly and positively related to higher benthic metrics, while
erosion potential was more associated with downstream sites (i.e. Site 8 or Main 1)
where there is a decrease in the benthic community. This information can be used in
future biomonitoring programs that reduce the number of environmental variables
measured by selecting these eight, along with others such as width, near-field
agriculture, as well as the fatty acid methyl ester parameters. Focusing on fewer, but
demonstrated effective, parameters to measure would reduce time, effort, and cost to
biomonitoring programs specific to an urban, soft-bottomed, and non-wadeable rivers.
Furthermore, the measurement of these selected environmental variables have been
shown to be predictive of changes in ecological health.
This dissertation has successfully demonstrated the use of depositional sediment
biofilm fatty acids as a useful tool to understand the benthic macroinvertebrate
community structures. Because benthic macroinvertebrates and biofilms live in direct
contact with many contaminants and are major contributors to the energy flow of the
120

river, understanding their assemblages is a critical step to understand the ecology of the
river as it flows through the metroplex. The idea of studying the sediment microbiota
has been suggested by ecologists whom want to understand the trophic dynamics and
interactions in the community. It has been long suggested that that the incorporation of
fatty acid (microbial measurements) would better enable our ability to understand the
relationship of benthic organisms with their environment. Brinkhurst (1999) has
suggested the following:
“Benthic biology needs a method for identifying factors that are directly related to worm biology, such as food, rather than physical and chemical factors related to the water column. Surveys, relating communities to chemical and physiographic factors will remain unpredictive.” He goes on to say, “The use of meaningful variables, such as the abundance of specific bacteria used as food, is too complex, expensive and difficult in the absence of aquatic microbiologists. Benthic ecology will make a quantum leap once we can typify soft sediments in a way that is significant to the organisms inhabiting them.” As the 2011 sampling effort demonstrates, these ‘meaningful’ variables, such as
bacterial abundance, can be inferred by the amount of fatty acids quantified from
sediment that are unique to bacteria. Likewise, fatty acids that are biomarkers for algal,
fungal, and protists can be used to identify those abundances as well, which are also
used as food sources for benthic macroinvertebrates. Peeters et al. (2004) conclude
that because biological processes determine food, biotic factors are important on site, or
local scales, whereas other environmental factors determine patterns of distribution and
abundance of the benthic structure on larger scales. A conclusion can be made that
aspects of both create a more complete picture than the two by themselves.
Furthermore, the use of the microbial community has been proposed as a
comprehensive risk assessment tool for remediation efforts, instead of multiple toxicity
tests on single organisms (White et al. 1998). A baseline microbial structure, such as
121

the 2011 study, could be used to compare with future contaminated site samples. The
return of a baseline community would indicate that a biological component of
remediation has decreased the risk (White et al. 1998). Gresens et al. (2007) studied
the effects of urbanization on streams and suggests that significant shifts in taxonomic
composition of chironomid assemblages were due to persistent effects of stormwater
and possibly toxic compounds and/or nutrients adsorbed to deposited sediment. Pratt
et al. (1981) also concluded that decreases in stream benthos were due to persistent
chemical loading in sediment. Rosi-Marshall (1994) found that chironomid growth rate
declined when fed suspended fine particulate organic matter collected downstream of
urbanized environments with permitted wastewater discharge on the Chattahoochee
River, Tennessee, USA.
The conclusions and methodology provided in this effort have long reaching
implications in various subsets of ecological, toxicological, evolution, and biochemical
questions. Questions that arise are numerous, both in number and complexity. How do
the fatty acids relate specifically to taxa growth and fecundity rates of the benthic
macroinvertebrates? Are there mechanisms in which the biofilm fatty acids mediate
contaminant bioavailability to higher trophic levels? If so, how do other environmental
parameters alter these functions? Do macroinvertebrates selectively feed on specific
fatty acids? Are there other ways to measure the biochemistry of the sediment, such as
processing the sediment for metabolomic indices? These questions have been partially
answered, or at least mentioned in the literature to some extent. Peeters et al. (2004)
tested the contribution of sediment food sources, including polyunsaturated fatty acids,
carbohydrates, proteins, and carbon, along with environmental variables to explain
122

variation in the benthic structure. They show that a significant portion of variance of the
benthic metrics were explained by sediment food variables, but depended on the
intensity of other environmental factors. Chironomus riparius has been a test organism
for investigating what kinds of food sources (long-chain polyunsaturated fatty acid
concentrations) effect growth (Goedkoop et al. 2007). It was shown from this research
that both larval and adult size was affected by both food quantity and quality. This
seems to be an inherently simple result, however in previous research these types of
questions regarding growth were related to mostly nitrogen and phosphorus. The
implications of assessing fatty acids and growth are that the researcher obtains a more
complete picture of trophic interactions and transfer. Preferred food sources have been
shown to change with species during different instars (Ingvason et al. 2004). Gut
analysis of Tanytarsus gracilentus revealed a dietary shift in preference for diatoms in
earlier instars to detritus in the final instar. The study concludes that further studies are
needed to establish how various food sources are utilized and fatty acid biomarkers
could be a method to see these changes. In regards to pollution, Glyadshev et al.
(2012) has shown that anthropogenic pollution results in decreases of resources
(species of microalgae) of polyunsaturated fatty acids in the biomass of the upper links
of the food chain the river ecosystem. The particular contaminants of interest in that
study where heavy metals. The specific fatty acids of interest were comprised of
eicopentanoic acid and docosahexaenic acid. In humans, deficiencies of these fatty
acids have been shown to cause health problems such as cardiovascular disease and
nervous disorders.
123
In the 2011 biofilm study, linolenic acid (C18:3N6 [Gamma]) and cis-8, 11, 14-
eicosapentaenoic acid (C20:3N6) are long-chain polyunsaturated fatty acids that
benthic macroinvertebrates cannot synthesize directly (Brett and Müller-Navarra,1997).
These fatty acids were only detected at LLELA, where 14 unique taxa were also found.
C22:5 cis-7,10,13,16,19-docosapentaenoic acid, an essential fatty acid (Brett and
Müller-Navarra,1997), was only found in one replicate in the study at Beltline. In this
same replicate, 41% of the total Dicrotendipes taxa were found from a total of 92
individuals from all replicates. There were five species of Dicrotendipes in the study,
and four of those five were found at Beltline (two of which were unique to Beltline only).
These associations suggest that the availability of specific essential fatty acids lead to a
higher taxa richness. It may be possible that the these fatty acids were not detected at
the downstream Main 1 site due to contamination altering the microbiota at that site.
Recommendations for Future Biomonitoring
Currently, there are numerous federal, state, city, and other agencies and
programs that monitor and plan for the upper Trinity River Watershed. The Texas
Commission of Environmental Quality (TCEQ) Surface Water Quality Monitoring
program “monitors the quality of surface water to evaluate physical, chemical, and
biological characteristics of aquatic systems” and provides data for policy making to
“promote the protection, restoration, and wise use of surface water in Texas”. The
Clean Rivers Program forms a partnership between TCEQ and regional water
authorities “to coordinate and conduct water quality monitoring, assessment, and
stakeholder participation to improve the quality of surface water”. The Clean Rivers
Program coordinates basin wide fixed monitoring, however there is only one site
124
(Catfish Creek, a state reference stream) that is scheduled to have benthic
macroinvertebrate assessments. Data from all fixed monitoring and special studies are
entered into a database for the Trinity River basin. The Trinity River Authority also
submits data to TCEQ for incorporation into the statewide water quality database,
where the data can be used in decision-making and regulatory processes. All
monitoring of biota in Texas must be done according to TCEQ’s Surface Water Quality
Monitoring Procedures, Volume 1: Physical and Chemical Monitoring Methods (RG-
415) and Surface Water Quality Monitoring Procedures, Volume 2: Methods for
Collecting and Analyzing Biological Assemblage and Habitat Data (RG-416). In Volume
1, land-use parameters are not listed in the physical properties that should be
measured. Because of the rapid urbanization and changing landscape of the upper
Trinity River, I purpose a section on land-use be added. Percent near-field urban and
forest would provide invaluable information as to the types of challenges a site may
have in terms of river health. In Volume 2, it is stated that Insecta is to be identified to
genus, except to leave Chironomidae at family. Oligochaeta are to be left at
Oligochaeta. I plan to propose amendments to these requirements that state
Chironomidae and Oligochaeta should be identified to genus/species level at sites on
the upper Trinity River. Currently these sites are not monitored for benthic
macroinvertebrates. The valuable information that my dissertation has provided for
these sites suggests that yearly monitoring should be enacted during the critical time
period of August 15th to September 15th, when water levels are low, but dominated by
effluent. This type of monitoring may fall into the TCEQ’s “Special Projects of the
Surface Water Quality Monitoring Team”. Also, the US EPA is considering asking that
125

genus level identifications of Chironomidae be included in TCEQ benthic monitoring
studies. One problem is the lack of scientists trained to competently do these
identifications (Robert Cook US EPA Personal communication April 2013.)
The National Research Councils’ “Committee on the Assessment of Water
Reuse as an Approach for Meeting Future Water Supply Needs” published a book
called “Water Reuse: Potential for Expanding the Nation's Water Supply Through Reuse
of Municipal Wastewater” (2012). The book has a primary purpose of evaluating the
state of the Nations’ use of municipal effluent for drinking water and the human health
risks, cost, and ecological implications involved. In the book, Atkinson et al. (2009) and
Slye et al. (2011) were cited as “two studies that represent examples for how
geographic information systems (GIS) and chemical and biological monitoring can be
incorporated to evaluate an ecosystem dominated with effluent”. Slye et al. (2011) was
also cited as a manuscript that describes how environmental stressors may affect
aquatic life, but by performing ecological assessments, scientists can understand the
site-specific factors than may influence biota at different locations.
Both Dallas and Fort Worth have special projects currently underway to modify
the hydrology of the river in the downtown areas to improve the ecology and provide
recreational uses. The Dallas Floodway Project is a component of the City of Dallas'
Balanced Vision Plan, which includes raising the existing east and west levees,
constructing a system of floodwater conveyance lakes that would contribute to flood risk
management, ecosystem restoration, and recreation. Designs also include
implementing a lake recharge system that would provide reuse of treated wastewater
discharge for water quality and recreation purposes, creating over 400 acres of new
126

wetland, and restoring Trinity River meanders and riparian habitat to replace a
previously straightened river channel. A similar project is planned by the Tarrant
Regional Water District to develop an area north of "downtown" as "uptown" along the
Trinity River. The Trinity River Vision Authority is the organization responsible for the
implementation of the “Trinity River Vision”. The master plan for the Trinity River in Fort
Worth, Texas calls for a rechannelization of the river to incorporate meanders and
riparian vegetation. Both projects state that one of the missions is to improve the
ecology of the river. Benthic macroinvertebrate sampling conducted as these projects
are carried out, and yearly afterwards to assess the effectiveness of these projects to
improve the ecological health of the river within the downtown areas of Dallas and Fort
Worth.
Final Conclusions
The Trinity River has been monitored for over 20 years (Arnold 1980, Dickson et
al. 1989, Bryan 1994, Spon 1994, Guinn 1995, Atkinson et al. 2009, Stephenson and
Kennedy 2010, Slye et al. 2011). It is a highly impacted system, with heavy and rapid
urbanization. The river is effluent-dominated and has a history of poor water quality.
Over half of the state of Texas depends upon the river for drinking water, as well as
recreational uses. Because the substrate of the river is primarily depositional sand, silt,
and clay, it has the potential to act as a sink for contaminants. Understanding the
nature of the biota that live in these depositional sediments is important to assess the
bioavailability of the many compounds that are known to be present in the effluent and
impervious surface run-off.
127
Taxa richness and abundance has improved both upstream and downstream of
wastewater treatment plants (WWTPs) and urban sprawl. Dechlorination of effluent is
thought to be one of the major reasons for the increase. There are several dominating
environmental parameters that are related to increased richness and abundance at sites
upstream of the metroplex. Overall habitat quality as expressed as an index score of
multiple measurements and in-stream cover are two powerful predictors of benthic taxa
richness, which implies more niche space and availability. Surface water total organic
carbon and sediment total organic carbon were also considered top parameters for
predicting benthic metrics. Surface water and sediment total organic carbon is an
important food source, comes in direct contact with benthic macroinvertebrates, and can
affect how chemicals will react in soil and sediment (Wetzel 2001, Paul and Meyer
2001). Changes in surface water total organic carbon in the Trinity River may alter
availability of chemicals to the benthic macroinvertebrates in the depositional sediment.
The addition of incorporating land-use measurements was found useful in predicting
benthic metrics. Near-field urban land-use was associated with decreased taxa
richness. Increases in impervious surface associated with the expansion of urban and
residential land-use has been shown to increase loading of toxicants from runoff,
change hydrology, increase water temperature, increase sedimentation, and bank
destabilization (Paul and Meyer 2001, Allan 2004). Often when urbanization increases,
riparian forest zones are cut down, which decreases the filtering ability of the land
surrounding the river and pollutants may enter the streambed at a greater rate and
quantity.
128
Another main objective of the dissertation was to determine relationships
between the benthic macroinvertebrate metrics and SWTU measurements. While there
was no direct correlation with any benthic variables and TUs, SWTU did appear as one
of the top three variables in the regression models. However, TUs were below one at
all sites. Since TUs are based on conservative assumptions (i.e., using predicted no
effect concentrations derived from chronic toxicity data with verification from model
ecosystem tests), it is reasonable to assume that the potential for surfactants to be the
cause of biological impacts is low. However, since surfactants emanate from WWTPs,
surfactant TUs are considered a surrogate for the presence of wastewater that may
contain other chemicals with similar properties associated with biological perturbations.
Further studies are needed to evaluate the toxicity of the river depositional areas, with
the potential of surfactants, or other chemical mixtures from point and non-point
sources, influencing the changes in Chironomidae and Oligochaeta taxa found.
A novel method for quantifying depositional sediment fatty acids has been
produced and tested. Benthic macroinvertebrate abundance and richness are directly
related to fatty acid abundance and richness. Increased urban land-use and vicinity to
WWTP effluents have been shown in this study to alter the taxa of benthic species, with
increasing homogenization and lowered abundances. This is possibly due to point and
non-point source additions of environmental and anthropogenic pollutants. The
mechanism by which these contaminants are affecting the distribution of benthic
species could be one of several routes. Nutrients obtained from sediment could be
diminished from toxicity to bacterial, algal, fungal, or protozoa that make up the biofilm
matrix on which benthic organisms, such as chironomids and oligochaetes, require for
129

growth and reproduction. Another possibility is that the contaminants become
bioavailable to benthic organisms after sorption to the polysaccharide coat that
surrounds the microbial communities. Because of the persistent loading of WWTP
effluent, these negative impacts may remain over time. Alternately, there may be some
species in the microbial community that are able to attenuate some of the contaminants.
Future research is needed to elucidate what compounds are found in the depositional
sediment, and possibly what specific species are present in the biofilms. Metabolic
analysis of the sediment would provide additional information about nutrient cycling from
the biofilms and benthic macroinvertebrates. Experiments that examine chironomid and
oligochaete growth/reproduction in response to added fatty acids would further test the
hypothesis that increased fatty acid richness and abundance enhances benthic vitality.
Finally, this dissertation has shown that genus/species level identifications provide
greater insight into the ecosystem functioning of the benthic macroinvertebrate
community in the Trinity River. When genus/species level identifications were made,
sites were better distinguished from reference conditions and environmental variables
could be used to explain taxa composition. Although a lack of taxonomic knowledge
and the cost of biological monitoring are important considerations in the scope of
sampling and analyses, it is more cost effective to provide the additional effort of
identifying taxa to genus/species in this system. Therefore it is recommended that the
Texas Commission of Environmental Quality, the Trinity River Authority, and other state
and city management agencies require benthic macroinvertebrate identifications to
made at the genus/species level.
130

Given the assurance that the human population growth and urban sprawl will
continue to rise exponentially, along with decreasing water availability in the United
States and worldwide, the understanding of river health is at a heightened priority.
Texas is currently in drought conditions and water scarcity is a pressing issue.
Therefore the aquatic systems that provide drinking water for the state need to be cared
for with upmost attention. Loss of biotic diversity is a concern on a global scale and has
been studied extensively for plant and other animal communities. Drury et al. (2013)
assessed impacts of WWTP effluent on the composition of benthic microbial
communities by comparing two distinct rivers in the Chicago metropolitan region, at
sites above and below WWTPs. Their major conclusion was that the rivers were distinct
in biological and chemical properties above WWTPs, however were “almost
indistinguishable” downstream of effluent influences. Like the study in Chicago, this
dissertation research suggests that the organisms required for whole-ecosystem
functioning are at risk for biodiversity decay. Biotic homogenization is occurring in this
river ecosystem and appears to be anthropogenically induced. Habitat degradation,
increased surface run-off, and unknown mixing and interactions of increased chemical
loading into the Trinity River could be driving the loss in both microbial and benthic
macroinvertebrate richness.
131

APPENDIX
ALL ENVIRONMENTAL VARIABLES MEASURED FROM 1987 – 88, 2005,
AND 2011 SAMPLING
132

Appendix – All environmental variables measured from 1987 – 88, 2005, and 2011 sampling. Group designates which heading the variable belongs to (L = land-use, C = chemistry, H = habitat, and FA = fatty acid).
1988 Group Environmental Variable (63) 02 03 04 06 08 10 12 13 14 15 L Agriculture (near) 78.12 77.86 65.60 40.24 61.87 18.56 65.00 27.17 72.79 67.37 L Agriculture (cumulitive) L Forest (near) 12.25 17.02 9.25 14.95 15.66 7.83 16.63 17.14 17.11 25.81 L Forest (cumulitive) L Residential (near) 2.77 1.42 16.67 34.06 13.40 57.80 8.97 41.81 5.83 1.02 L Residential (cumulitive) L Urban (near) 0.51 0.71 6.54 7.87 5.58 12.72 2.34 7.27 1.43 1.50 L Urban (cumulitive) L Water (near) 6.35 2.99 1.95 2.88 3.48 3.09 7.06 6.61 2.84 4.30 L Water (cumulitive) L Population density (near) L Population density (cumulitive) L Area (near) 4276.79 5340.04 1847.82 725.33 3643.94 381.45 3255.72 283.60 1794.21 11760.98 L Area (cummulitive) 4290.01 5340.04 7187.86 7913.19 15847.14 16228.59 3255.72 16512.19 21562.12 33323.10 L Rainfall (in.) L Erosivity (High K factor) L Average erosivity (K factor) C Organic matter (%) C Nitrogen 0.80 0.60 0.70 1.00 2.40 2.80 2.50 2.40 2.00 1.20 C Phosphorus C Phosphate 0.02 0.02 0.03 1.54 2.45 3.38 3.61 3.13 2.87 1.56 C Surface water total dissolved solids C Surface water total organic carbon C Hardness 124.00 185.00 193.00 157.00 152.00 136.00 153.00 136.00 144.00 169.00 C Chlorine C Chlorides 56.00 110.00 138.00 214.00 216.00 191.00 89.00 202.00 202.00 225.00 C Water temperature © C Dissolved oxygen 8.00 5.00 5.00 7.00 5.00 6.00 8.00 7.00 8.00 5.00 C Ph 7.10 6.90 7.20 7.20 7.10 7.10 6.90 7.20 7.20 7.30 C Conductivity 0.45 0.66 0.66 0.96 0.99 0.87 0.75 0.72 0.72 0.74 C Turbidity 15.00 23.00 37.00 11.00 57.00 34.00 24.00 16.00 16.00 61.00 C Interstitial total dissolved solids 400.00 322.00 364.00 497.00 441.00 469.00 409.00 457.00 426.00 467.00 C Interstitial total organic carbon 4.20 4.30 5.50 8.30 7.70 11.50 54.20 9.10 9.10 6.50 C Interstitial hardness H Fines (%)
133

1988 Group Environmental Variable (63) 02 03 04 06 08 10 12 13 14 15 H Clay (%) H Silt (%) H Sediment Total Organic Carbon (%) H River width (m) H River depth (m) H Flow (ft3/sec) 115.83 3.53 5.30 157.86 565.03 565.03 48.73 448.50 497.94 509.94 H Riffles H Erosion potential H Native vegatation H Aesethic value H Bottom Stability H Width of largest pool (m) H Flow status H Insteam cover (%) H Habitat Quality Score FA Total Lipid (FAME and BAME) (ng/g) FA Total FAME (ng/g) FA Total BAME (ng/g) FA Total Richness (FAME and BAME) FA Richness FAME FA Richness BAME
134

2005 Group Environmental Variable (63) 02 03 04 06 08 10 12 13 14 15 L Agriculture (near) 61.98 48.96 51.43 25.82 45.52 13.30 51.69 28.06 69.84 55.40 L Agriculture (cumulitive) 61.94 48.96 49.59 47.41 50.91 50.02 51.69 49.65 51.64 52.96 L Forest (near) 23.93 41.52 19.44 23.05 22.65 9.39 23.95 26.63 19.07 36.94 L Forest (cumulitive) 24.00 41.52 35.85 34.67 29.02 28.56 23.95 28.52 27.05 30.54 L Residential (near) 5.74 5.57 20.14 36.88 19.92 56.34 13.33 33.55 6.07 2.56 L Residential (cumulitive) 5.73 5.57 9.31 11.84 12.04 13.08 13.33 13.43 12.81 9.19 L Urban (near) 2.50 1.78 7.32 11.81 9.13 18.97 5.12 9.25 3.20 0.95 L Urban (cumulitive) 2.51 1.78 3.20 3.99 4.77 5.11 5.12 5.18 5.00 3.57 L Water (near) 5.80 2.12 1.64 2.40 2.75 1.96 5.89 2.47 1.81 4.14 L Water (cumulitive) 5.79 2.12 2.00 2.04 3.21 3.19 5.89 3.17 3.47 3.70 L Population density (near) 63.28 23.87 343.40 747.26 392.95 1668.26 257.63 815.49 124.81 24.68 L Population density (cumulitive) 63.10 23.87 106.02 164.80 189.73 224.49 257.63 234.64 228.97 156.87 L Area (near) 4276.79 5340.04 1847.82 725.33 3643.94 381.45 3255.72 283.60 1794.21 11760.98 L Area (cummulitive) 4290.01 5340.04 7187.86 7913.19 15847.14 16228.59 3255.72 16512.19 21562.12 33323.10 L Slope 30m res. (%) 3.03 4.18 4.05 2.75 3.23 2.39 2.76 2.54 2.17 2.61 L Rainfall (in.) 37.53 32.27 33.38 34.61 35.30 37.71 39.70 37.00 37.19 38.47 L Average erosivity (K factor) 0.31 0.31 0.26 0.31 0.32 0.30 0.30 0.31 0.32 0.32 C Organic matter (%) 1.55 1.25 1.43 1.29 1.69 2.29 2.28 1.96 2.14 1.62 C Nitrogen 247.00 368.00 151.00 223.00 138.00 918.00 390.00 328.00 281.00 135.00 C Phosphorus 106.00 70.70 122.00 162.00 219.00 425.00 906.00 119.00 460.00 147.00 C Cation 1230.00 780.00 1940.00 1400.00 1070.00 6450.00 10300.00 3580.00 6570.00 2780.00 C Surface water total dissolved solids 191.00 235.00 248.00 471.00 487.00 460.00 440.00 370.00 20.00 472.00 C Surface water total organic carbon 5.80 10.00 4.80 7.90 8.20 6.90 8.10 6.70 5.70 5.30 C Hardness 122.00 176.00 159.00 176.00 165.00 178.00 188.00 165.00 155.00 255.00 C Chlorine 29.70 33.00 29.40 99.10 86.40 76.40 115.00 85.90 69.70 89.30 C Water temperature © 26.50 28.67 25.35 25.47 25.15 26.45 27.98 27.16 27.72 26.68 C Dissolved oxygen 9.34 9.77 5.50 7.44 7.11 7.31 8.91 7.72 7.97 7.73 C Ph 8.15 8.28 7.71 7.88 7.76 7.32 7.95 7.84 7.84 7.70 C Conductivity 0.27 0.32 0.39 0.70 0.65 0.61 0.69 0.59 0.58 0.64 C Ox Redox 36.10 23.70 58.10 134.60 56.00 75.40 387.00 52.30 48.30 55.40 C Turbidity 4.40 4.60 39.50 36.80 14.10 14.70 32.90 21.00 61.50 68.00 C Interstitial total dissolved solids 339.00 . 555.00 473.00 439.00 . 517.00 406.00 436.00 544.00 C Interstitial total organic carbon 15.70 . 9.10 8.20 8.50 . 6.20 . 5.10 9.60 C Interstitial hardness 204.00 . 186.00 196.00 192.00 . 216.00 192.00 167.00 108.00 H Sand (%) 93.50 90.40 83.20 85.80 79.90 35.50 22.00 67.30 34.80 63.30 H Gravel (%) 1.40 5.10 2.40 4.10 9.60 0.00 1.20 4.60 6.10 0.00 H Fines (%) 5.00 4.50 14.50 10.10 10.50 64.50 76.90 28.10 59.10 36.70
2005
135

Group Envrionmental Variable (63) 02 03 04 06 08 10 12 13 14 15 H Clay (%) H Silt (%) H Sediment Total Organic Carbon (%) H River width (m) 34.50 28.00 18.00 24.30 26.10 30.40 17.60 52.60 34.30 32.80 H River depth (m) 0.41 0.72 0.43 0.78 0.74 0.55 0.25 0.50 0.64 0.35 H Flow (ft3/sec) 308.0
1.32 3.61 223.0
423.0
663.00 62.10 725.5
788.0
130
H Riffles 0.00 0.00 1.00 3.00 0.00 1.00 1.00 0.00 0.00 0.00 H Erosion potential 36.00 47.00 43.50 69.00 82.00 63.00 33.50 19.00 54.00 78.0
H Native vegatation 20.00 10.00 20.00 7.50 18.00 14.00 0.00 20.00 12.00 3.00 H Aesethic value 2.00 2.00 0.00 1.00 1.00 1.00 2.00 2.00 2.00 2.00 H Bottom Stability 3.00 4.00 2.00 3.00 4.00 3.00 1.00 1.00 1.00 1.00 H Width of largest pool (m) 1.00 1.00 3.00 1.00 1.00 1.00 1.00 1.00 1.00 1.00 H Flow status 2.00 1.00 2.00 3.00 2.00 2.00 1.00 2.00 2.00 1.00 H Insteam cover (%) 27.00 21.00 7.00 6.00 7.00 2.80 14.80 5.32 0.00 5.00 H Habitat Quality Score 18.00 15.00 16.00 15.00 13.00 13.00 12.00 15.00 11.00 8.00 FA Total Lipid (FAME and BAME) (ng/g) FA Total FAME (ng/g) FA Total BAME (ng/g) FA Total Richness (FAME and BAME) FA Richness FAME FA Richness BAME
136

2011 Group Environmental Variable (63) 02 03 06 08 L Agriculture (near) 61.98 48.96 25.82 45.52 L Agriculture (cumulitive) 61.94 48.96 47.41 50.91 L Forest (near) 23.93 41.52 23.05 22.65 L Forest (cumulitive) 24.00 41.52 34.67 29.02 L Residential (near) 5.74 5.57 36.88 19.92 L Residential (cumulitive) 5.73 5.57 11.84 12.04 L Urban (near) 2.50 1.78 11.81 9.13 L Urban (cumulitive) 2.51 1.78 3.99 4.77 L Water (near) 5.80 2.12 2.40 2.75 L Water (cumulitive) 5.79 2.12 2.04 3.21 L Population density (near) 63.28 23.87 747.26 392.95 L Population density (cumulitive) 63.10 23.87 164.80 189.73 L Area (near) 4276.79 5340.04 725.33 3643.94 L Area (cummulitive) 4290.01 5340.04 7913.19 15847.14 L Slope 30m res. (%) 3.03 4.18 2.75 3.23 L Rainfall (in.) 37.53 32.27 34.61 35.30 L Erosivity (High K factor) 0.32 0.32 0.32 0.32 L Average erosivity (K factor) 0.31 0.31 0.31 0.32 C Organic matter (%) 1.55 1.25 1.29 1.69 C Nitrogen C Phosphorus C Phosphate C Surface water total dissolved solids C Surface water total organic carbon C Hardness C Chlorine C Chlorides C Water temperature © 26.50 28.67 25.47 25.15 C Dissolved oxygen 9.34 9.77 7.44 7.11 C Ph 8.15 8.28 7.88 7.76 C Conductivity 0.27 0.32 0.70 0.65 C Ox Redox 36.10 23.70 134.60 56.00 C Turbidity 4.40 4.60 36.80 14.10 C Interstitial total dissolved solids C Interstitial total organic carbon C Interstitial hardness H Sand (%) 70.11 82.78 78.66 73.37 H Fines (%) 2011 Group Envrionmental Variable (63) 02 03 06 08
137
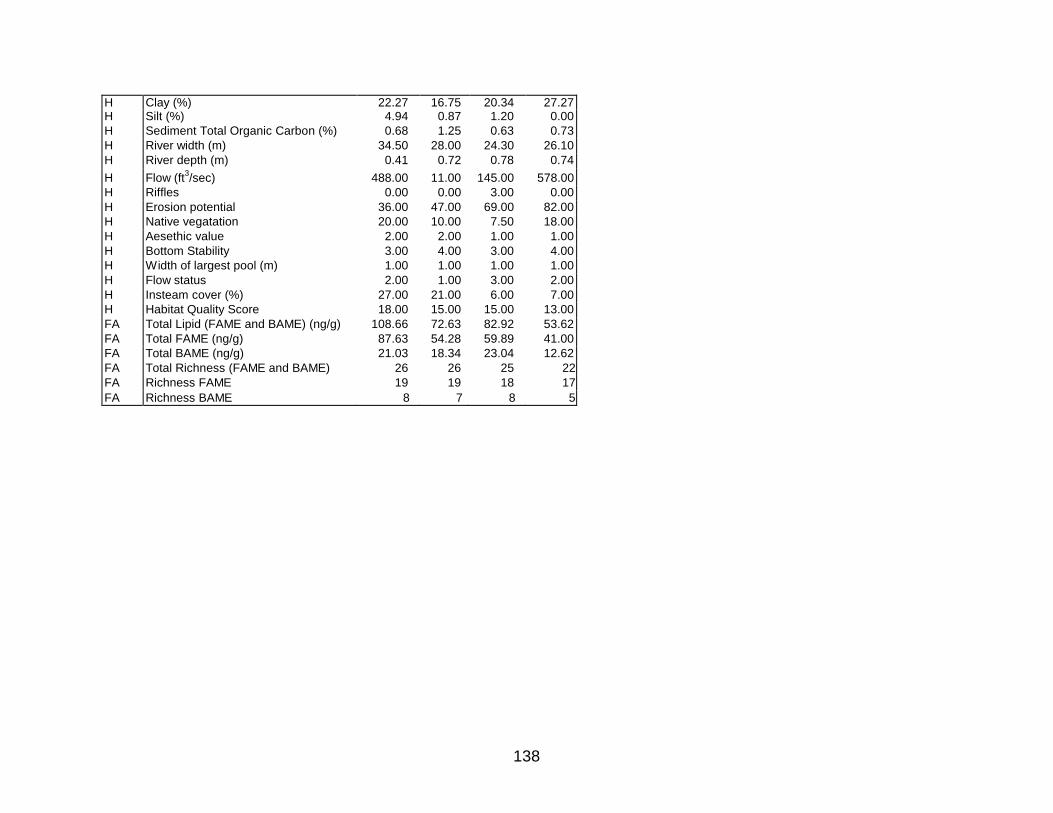
H Clay (%) 22.27 16.75 20.34 27.27 H Silt (%) 4.94 0.87 1.20 0.00 H Sediment Total Organic Carbon (%) 0.68 1.25 0.63 0.73 H River width (m) 34.50 28.00 24.30 26.10 H River depth (m) 0.41 0.72 0.78 0.74 H Flow (ft3/sec) 488.00 11.00 145.00 578.00 H Riffles 0.00 0.00 3.00 0.00 H Erosion potential 36.00 47.00 69.00 82.00 H Native vegatation 20.00 10.00 7.50 18.00 H Aesethic value 2.00 2.00 1.00 1.00 H Bottom Stability 3.00 4.00 3.00 4.00 H Width of largest pool (m) 1.00 1.00 1.00 1.00 H Flow status 2.00 1.00 3.00 2.00 H Insteam cover (%) 27.00 21.00 6.00 7.00 H Habitat Quality Score 18.00 15.00 15.00 13.00 FA Total Lipid (FAME and BAME) (ng/g) 108.66 72.63 82.92 53.62 FA Total FAME (ng/g) 87.63 54.28 59.89 41.00 FA Total BAME (ng/g) 21.03 18.34 23.04 12.62 FA Total Richness (FAME and BAME) 26 26 25 22 FA Richness FAME 19 19 18 17 FA Richness BAME 8 7 8 5
138

LITERATURE CITED
Allan DJ. 1995. Stream ecology: structure and function of running waters. Chapman and Hall, London, United Kingdom. Allan DJ. 2004. Landscapes and riverscapes: The influence of land-use on stream ecosystems. Annu Rev Ecol Evol Syst. 35: 257-84.
Allan DJ, Castillo MM. 2007. Stream ecology: structure and function of running waters. Springer, Dordrecht, The Netherlands.
Armitage PD, Cranston PS, Pinder LCV, eds. 1995. The Chironomidae: Biology and Ecology of Non-biting Midges. Chapman and Hall, London, UK. Arnold CL Jr, Gibbons CJ. 1996. Impervious surface coverage: The emergence of a key environmental indicator. J Am Plan Assoc. 62(2): 243-258.
Arnold WR. 1989. Effects of water quality, in-stream toxicity, and habitat variability on fish assemblages in the Trinity River, Texas. Dissertation University of North Texas, Denton, TX, USA. 489 pp. Atkinson SF, Waller WT, Crooks TJ. 2001. Assessing atrazine pollution potential to a drinking water reservoir using remote sensing and geographic information systems modeling. Aquat Ecosyst Health Manag 4: 327-338. Atkinson SF, Johnson DR, Venables BJ, Slye JL, Kennedy JH, Dyer SD, Price BB, Ciarlo M, Stanton K, Sanderson H, Nielsen A. 2009. Use of watershed factors to predict consumer surfactant risk, water quality, and habitat quality in the upper Trinity River, Texas. Sci Tot Envir 407: 4028-4037. Beck WM Jr. 1977. Environmental Requirements and Pollution Tolerances of Common Freshwater Chironomidae. EPA – 600/4-77-024. 268pp. Belanger SE, Rupe KL, Bausch RG. 1995a. Responses of invertebrates and fish to alkyl sulfate and alkyl ethoxylate sulfate anionic surfactants during chronic exposure. Bull Environ Contam Toxicol. 55: 751-758. Belanger SE, Meiers EM, Bausch RG. 1995b. Direct and indirect ecotoxicological effects of alkyl sulfate and alkyl ethoxysulfate on macroinvertebrates in stream mesocosms. Aquat Toxicol. 33: 65-87. Belanger SE, Bowling JW, Lee DM, LeBlanc EM, Kerr KM, McAvoy DC, Christman SC, Davidson DH. 2002. Integration of aquatic fate and ecological responses to linear alkylbenzene sulfonate (LAS) in model stream ecosystems. Ecotoxicol Environ Saf. 52: 150-171.
139

Belanger SE, Dorn PB, Toy R, Boeije G, Marshall SJ, Wind T, van Compernolle R, Zeller D. 2006. Aquatic risk assessment of alcohol ethoxylates in North America and Europe. Ecotoxicol Environ Saf. 64: 85-99.
Ben-David EA, Holden PJ, Stone DJM, Harch BD, Foster LJ. 2004. The use of phospholipids fatty acid analysis to measure impact of acid rock drainage on microbial communities in sediments. Micro Eco. 48: 300-315.
Blasco J, Hampel M, Moreno-Garrido I. 2003. Toxicity of Surfactants. in Comprehensive Analytical Chemistry Analysis and Fate of Surfactants in the Aquatic Environment. Elsevier. 40: 827-867.
Bligh EG, Dyer WJ. 1959. A rapid method of total lipid extraction and purification. Can J Biochem and Phys. 37: 911-917. Blocsom KA, Johnson BR. 2009. Development of a regional macroinvertebrate index for large river bioassessment. Ecol Indic. 9 (2): 313-328. Boeije GM, Cano ML, Marshall SJ, Belanger SE, van Compernolle R, Dorn PB, Gumbel H, Toy R, Wind T. 2006. Ecotoxicity quantitative structure-activity relationships for alcohol ethoxylate mixtures based on substance-specific toxicity predictions. Ecotoxicol Environ Saf 64: 75-84. Bonada N, Pratt N, Resh VH, Statzner B. 2006. Developments in aquatic insect biomonitoring: a comparative analysis of recent approaches. Annu Rev Entomol. 51: 495–523. Boxall ABA, Verslycke T, Ankley GT, Beazley KF, Belanger SE, Berninger JP. 2012 Pharmaceuticals and personal care products in the environment: What are the big questions?. Environ Health Persp. 120(9): 1221-9.
Boyle TP, Fraleigh HD. 2003. Natural and anthropogenic factors affecting the structure of the benthic macroinvertebrate community in an effluent-dominated reach of the Santa Cruz River, AZ. Ecol Indic. 3(2): 93-117. Brett MT, Müller-Navarra DC. 1997. The role of highly unsaturated fatty acids in aquatic food webs. Fresh Bio. 38: 483-499. Brillouin L. 1960. Science and information theory. 2nd ed. Academic Press. New York, NY, USA. 351 pp. Brinkhurst RO. 1999. Retrospect and prospect: reflections on forty years of study of aquatic oligochaetes. Hydrobiologia. 406: 9-19.
140

Brooks BW, Riley TM, Taylor RD. 2006. Water quality of effluent-dominated ecosystems: ecotoxicological, hydrological, and management considerations. Hydrobiologia. 556(1): 365-379. Bryan BL. 1994. Plankton community response to dechlorination of a municipal effluent discharged into the Trinity River. Masters Thesis University of North Texas, Denton, TX, USA. Burns A, Ryder DS. 2001. Potential for biofilms as biological indicators in Australian riverine systems. Ecol Manage Restor. 2(1): 53-63. Cairns J Jr, Pratt JR. 1993. A history of biological monitoring using benthic macroinvertebrates. In: Freshwater Biomonitoring and Benthic Macroinvertebrates. Chapman and Hall, New York, NY, USA. pp10 - 27. Canfield TJ, Kemble NE, Brumbaugh WG, Dwyer FJ, Ingersoll CG, Fairchild JF. 1994. Use of benthic invertebrate community structure and the sediment quality triad to evaluate metal –contaminated sediment in the upper Clark Fork River, Montana. Environ Toxicol Chem 13: 1999-2012. Chessman BC, Royal MJ. 2004. Bioassessment without Reference Sites: Use of Environmental Filters to Predict Natural Assemblages of River Macroinvertebrates. J N Am Benthol Soc. 23:3 599-615. Corpe WA.1975. Metal binding properties of surface materials from marine bacteria. Dev. Ind. Microbiol. 16: 249-255. Cuffney TF, Brightbill RA, May JT, Waite IR. 2010. Responses of benthic macroinvertebrates to environmental changes associated with urbanization in nine metropolitan areas. Ecol Appl. 20:5 1384-1401. Cummins KW, Klug MJ. 1979. Feeding Ecology of Stream Invertebrates. Feeding Ecology of Stream Invertebrates. Annu Rev Ecol Syst. 10: 147-172. Daughton CG. 2007. Pharmaceuticals in the environment: sources and their management. In: Comprehensive Analytical Chemistry. Elsevier 50: 1-58. de Voogt P, Sáez M, González-Mazo E. 2003. Sample handling for the determination of surfactants in biota. In: Knepper TP, Barceló, de Voogt P. Wilson and Wilson’s Comprehensive Analytical Chemistry. Elsevier Science. Amsterdam, The Netherlands: p 429 – 441. Dickson KL, Waller WT, Kennedy JH, Arnold WR, Desmond WP, Dyer SD, Hall JF, Knight JT, Malas D, Martinez ML, Matzner SL. 1989. A water quality and ecological survey of the Trinity River. Rept. to City of Dallas Water Utilities by Institute of Applied
141

Sciences, University of North Texas, and Graduate Program in Environmental Sciences, University of Texas at Dallas, 339 pp. Dodkins I, Rippey B, Hale P. 2005. An application of canonical correspondence analysis for developing ecological quality assessment metrics for river macrophytes. Freshw Biol. 50:5 891-904. Drury B, Rosi-Marshall E, Kelly JJ. 2013. Wastewater Treatment Effluent Reduces the Abundance and Diversity of Benthic Bacterial Communities in Urban and Suburban Rivers. Appl. Environ. Microbiol. 79(6): 1897. Dudgeon D. 2012. Responses of benthic macroinvertebrate communities to altitude and geology in tributaries of the Sepik River (Papua New Guinea): the influence of taxonomic resolution on the detection of environmental gradients. Freshwater Biology 57, 1794-1812. Dunne T, Leopold LB. 1978. Water in environmental planning. WH Freeman and Co. New York, NY. USA. Dyer SD, Stanton DT, Lauth JR, Cherry DS. 2000. Acute and chronic structure activity relationships for alcohol ethersulfates. Environ Toxicol Chem. 19: 608-616. Dyer SD, Sanderson H, Waite SW, van Compernolle R, Price B, Nielson AM, Evans A, DeCarvalho AJ, Hooton DJ, Sherren AJ. 2006. Assessment of alcohol ethoxylate surfactants and fatty alcohols mixtures in river sediments and prospective risk assessment. Environ Monit Assess. 120: 45-63. Elliot JM, Drake CM. 1981. A comparative study of seven grabs used for sampling benthic macroinvertebrates in rivers. Freshw Biol. 11: 99-120. Epler JH. 2001. Identification manual for the larval Chironomidae (Diptera) of North and South Carolina. Special Publication SJ2001-SP13. North Carolina Department of Environment and Natural Resources, Raleigh, NC and St. Johns River Water Management District, Palatka FL. 526 pp. Escher BI, Bramaz N, Eggen RIL, Ricter M. 2005. In vitro assessment of modes of action of pharmaceuticals in aquatic life. Environ Sci Technol. 39: 3090-3100. Espey WH Jr, Morgan CW, Masch FD. 1965. A study of some effects of urbanization on storm runoff from a small watershed. Technical report. 44D 07-6501 CRWR-2, Center for Restoration in Water Resources, University of Texas, Austin, TX, USA. Fellows CS, Clapcott JE, Udy JW, Bunn SE, Harch BD, Smith MJ, Davies PM. 2006. Benthic metabolism as an indicator of stream ecosystem health. Hydrobiologia. 572: 71-87. Fendinger NJ, Versteeg DJ, Weeg E, Dyer S, Rapaport RA. 1994. Environmental behavior and fate of anionic surfactants. In Baker LA, Environmental Chemistry of lakes
142

and Reservoirs. ACS Advances in Chemistry Series. ACS 237. American Chemical Society, Washington, DC, pp 528-557. Finkenbine, JK, Atwater DS, Mavinic DS. 2000. Stream health after urbanization. J Am Wat Res Assoc. 36 1149-1160. Flotemersch JE, Blocksom K, Hutchens JJ Jr, Autrey BC. 2006. Development of a standardized large river bioassessment protocol (LR-BP) for macroinvertebrate assemblages. River Res Appl. 22(7): 775-790. Gladyshev MI, Anishchenko OV, Sushchinik NN, Kalacheva GS, Gribovskaya IV, Ageev AV. 2012. Influence of anthropogenic pollution on content of essential polyunsaturated fatty acids in links of food chain of river ecosystem Contemp Probl Ecol. 5(4): 376-385. Goedkoop W, Demandt M, Ahlgren G. 2007. Interactions between food quantity and quality (long-chain polyunsaturated fatty acid concentrations) effects on growth and development of Chironomus riparius. Can Jour Fish Aqu. 64(3): 425-436. Gonzalez-Mazo, E, Leon VM. 2003. Surfactant sorption on natural sediment in Comprehensive Analytical Chemisty . Elsevier. 40: 607-625. Gray L. 2004. Changes in water quality and macroinvertebrate communities resulting from urban stormflows in the Provo River, Utah, U.S.A.: Hydrobiologia. 518 (1-3): 33-46. Greffard, MH, Saulnier-Talbot E, Gregory-Eaves I. 2011. A Comparative Analysis of Fine Versus Coarse Taxonomic Resolution in Benthic Chironomid Community Analyses. Ecol Indicat 11(6): 1541-51. Gresens SE, Belt KT, Tang JA, Gwinn DC, Banks PA. 2007. Temporal and spatial responses of Chironomidae (Diptera) and other benthic invertebrates to urban stormwater runoff. Hydrobiologia. 575: 173–190. Grubaugh JW, Wallace JB. 1995. Functional structure and production of the benthic community in a Piedmont River: 1956-1957 and 1991-1992. Limnol Ocean 40: 490-501. Guckert, JB, Antworth CP, Nichols PD, White DC. 1985. Phospholipid, ester-linked fatty acid profiles as reproducible assays for changes in prokaryotic community structure of esturine sediments. FEMS Microbiol Ecol. 31: 147-158. Guinn, RJ. 1995. Biological and toxicological responses resulting from dechlorination of a major municipal wastewater treatment plant discharge to the Trinity River. Dissertation University of North Texas, Denton, TX, USA. 489 pp.
143

Harding JS, Benfield EF, Bolstad PV, Helfman GS, Jones III EBD. 1998. Stream biodiversity: the ghost of land-use past. Proc Natl Acad Sci 95: 14843-4847. Headley JV, Gandrass J, Kuballa J, Peru KM, Gong Y. 1998. Rates of sorption and partitioning of contaminants in river biofilm. Environ Sci Technol. 32(24): 3968-3973. Hill WR, Rinchard J, Czesny S. 2011. Light, nutrients and the fatty acid composition of stream periphyton. Fresh Biol. 56(9): 1825-1836. Huggett DB, Foran CM, Brooks BW, Weston JJ, Peterson B, Marsh E, La Point TW, Schlenk D. 2003a. Comparison of in vitro and in vivo bioassays for estrogenicity in fractionated effluent from North American wastewater effluent. Toxicol Sci. 72: 77-83. Huggett DB, Cook JC, Ericson JF, Williams RT. 2003b. A theoretical model for utilizing mammalian pharmacology and safety data to prioritorized potential impacts of human pharmaceuticals to fish. Hum Ecol Risk Assess. 9: 1789-1800. Hunsaker CT, Levine DA. 1995. Hierarchical approaches to the study of water quality in rivers. BioScience 45: 193-203. Hynes HBN. 1970. Ecology of Running Waters. University of Toronto Press, Toronto, ON, Canada. Hynes HBN. 1975. The stream and its valley. Internationale Vereinigung für theoretische und angewandte Limnologie Verhandlungen 19:1-15. Ingavason HR, Olafsson JS, Gardarsson A. 2004. Food selection of Tanytarsus gracilentus larvae (Diptera: Chironomidae): An analysis of instars and cohorts. Aquat Eco. 38(2): 231-237. Jobling S, Sumpter JP, Sheahan D, Osborne JA, Matthiessen P. 1996. Inhibition of testicular growth in rainbow trout (Ohcorhynchus mykiss) exposed to alkylphenolic chemicals. Environ Toxicol Chem. 15(2): 194-202. Johnson DR. 2008. Use of in-stream water quality measurement and geospatial parameters to predict consumer surfactant toxic units in the upper Trinity River watershed, Texas. Masters Thesis University of North Texas, Denton, TX, USA. Johnson RK, Furse MT, Hering D, Sandin L. 2007. Ecological relationships between stream communities and spatial scale: implications for designing catchment-level monitoring programmes. Freshw Biol 52: 939-958. Jones FC. 2008. Taxonomic sufficiency: The influence of taxonomic resolution on freshwater bioassessments using benthic macroinvertebrates. Enviro Rev. 16:45-69.
144

Karr JR. 1991. Biological Integrity: A Long-Neglected Aspect of Water Resource Management. Ecol Appl. 1:66-84. Kathman RD, Brinkhurst RO. 1998. Guide to the Freshwater Oligochaetes of North America. Aquatic Resources Center, College Grove, TN, USA. Kennedy JH, Johnson ZB, Johnson PC. 1994. Sampling and analysis strategy for biological effects in freshwater field tests. In Hill IR, Heimbach F, Leeuwangh P, Matthiessen P, eds, Freshwater Field Tests for Hazard Assessment of Chemicals. CRC, Boca Raton, FL, USA, pp 159-181. Knepper TP, Berna JL. 2003. Surfactants: properties, production and environmental aspects. in Comprehensive Analytical Chemistry Analysis and Fate of Surfactants in the Aquatic Environment. Elsevier. 40: 1-49. Kolkwitz R, Marson M. 1908. Ökologie der pflanzlichen Saprobien. Ver Deutsche Bot Ges 26: 505–519. Kovach WL. 1999. MVSP – A Multivariate Statistical Package for Windows, Ver. 3.1. Kovach Computing Services. Wales, UK. Lawrence JR, Zhu B, Swerhone GDW, Roy J, Wassenaar LI, Topp E, Korber DR. 2007. Comparative microscale analysis of the effects of triclosan and triclocarban on the structure and function of river biofilm communities. Sci Tot Envir. 407(10): 3307–3316. Lazorchak JM, Hill BH, Averill DK, Peck DV, Klemm DJ. 2000. Environmental monitoringstream ecology – The benefits of genus and assessment program – surface waters: Field operations and methods for measuring the ecological condition of non-wadeable rivers and streams. Environmental Protection Agency, EPA/ 620/R-00/007, Cincinnati, OH, USA. Lenat DR. 1988. Water quality assessment of streams using a qualitative collection method for benthic macroinvertebrates.species-level identifications. J N Am Benthol Soc. 7(3): 222-233. Lenat DR, Resh VA. 2001. Taxonomy and stream ecology—The benefits of genus- and species-level identifications. J N Am Benthol Soc. 20(2): 287-298. Leunda PM, Oscoz J, Miranda R, Arino AH. 2009. Longitudinal and seasonal variation of the benthic macroinvertebrate community and biotic indices in an undisturbed Pyrenean river. Ecol Indic. 9(1): 52-63. Likens GE. 2004. Some Perspectives On Long-Term Biogeochemical Research From The Hubbard Brook Ecosystem Study. Ecology. 85: 2355–2362. Lindeman RL. 1942. The trophic-dynamic aspect of ecology. Ecology. 23: 399-418.
145
Lizotte RE, Dorn PB, Steinriede Jr. W, Wong DCL, Rodgers JH. 2002. Ecological effects of an anionic C12-15 AE-3S alkyl ethoxysulfate surfactant in outdoor stream mesocosms. Environ Toxicol Chem. 12: 2742-2751. Lock MA, Wallace RR, Costerton JW, Ventullo RM, Charlton SE. 1984. River epilithon: toward a structural-functional model. Oikos. 42: 10-22. Lundqvist A, Bertlisson S, Goedkoop W. 2012. Interactions with DOM and biofilms affect the fate and bioavailability of insecticides to invertebrate grazers. Ecotoxicology. 21: 2398-2408.
Margulis L, Chase D, Guerrero R. 1986. Microbial Communities. Bioscience. 36: 160-170. Martin P, Martinez-Ansemil E, Pinder A, Timm T, Wetzel MJ. 2008. Global diversity of oligochaetous clitellates (“Oligochaeta”; clitellata) in freshwater. Hydrobiologia. 595(1): 117-27. Medeiros C, Leblanc R, Coler RA. 1983. An in situ assessment of the acute toxicity of urban runoff to benthic macroinvertebrates. Environ Toxicol Chem. 2(1): 119 – 126. Merritt RW, Cummins KW editors. 1996. An Introduction to the Aquatic Insects of North America, 3rd ed. Kendall/Hunt Publishing Company. Dubuque, IA, USA. 862 pp. Molozzi J, Feio MJ, Salas F, Marques JC, Callisto M. 2012. Development and test of a statistical model for the ecological assessment of tropical reservoirs based on benthic macroinvertebrates. Ecol Indic. 23: 155-65.
Moore AA, Palmer MA. 2005. Invertebrate biodiversity in agricultural and urban headwater streams: implications for conservation and management. Ecol Appl. 15: 1169-1177. Meyer JL. 1994. The microbial loop in flowing waters. Microbial Ecology 28(2): 195-199. Moffett S, Brown DA, Linder ME. 2000. Lipid-dependent targeting of G proteins into rafts. Journal of Biological Chemistry, 275(3), 2191-2198. National Research Councils Committee on the Assessment of Water Reuse as an Approach to Meeting Future Water Supply Needs. 2011. Water Reuse: Expanding the Nation's Water Supply Through Reuse of Municipal Wastewater. National Academies Press, Washington, DC. Norris RH, Linke S, Prosser I, Young WJ, Liston P, Bauer N, Sloane N, Dyer F, Thoms M. 2007. Very-broad-scale assessment of human impacts on river condition. Freshw Biol. 52(5): 959-976.
146
Norris RH, Thoms MC. 1999. What is river health? Freshw Biol. 41(2): 197-209. Ostroumov SALizotte RE, Dorn PB, Steinriede Jr. W, Wong DCL, Rodgers JH. 2002. Inhibitory analysis of top-down control: new keys to studying eutrophication, algal blooms, and water self-puryification. Hydrobiologia. 469: 117-129. Palmer MA, Covich AP, Lake S , Biro P, Brooks JJ, Cole J, Dahm C, Gibert J, Goedkoop W, Martens K, Verhoeven J, VanDeBund WJ. 2000. Linkages Between Aquatic Sediment Biota and Life Above Sediments as Potential Drivers of Biodiversity and Ecological Processes. Bioscience. 50: 1062-1075. Parrish C.C. 1999. Determination of total lipid, lipid classes, and fatty acids in aquatic samples. in M. T. Arts and B. C. Wainman (eds). Lipids in freshwater ecosystems. Springer, New York, NY, USA. Patrick R. 1949. A proposed biological measure of stream conditions, based on a survey of the Conestoga Basin, Lancaster County, Pennsylvania. Proc Acad Nat Sci Phila. 101: 277-341. Paul MJ, Meyer JL. 2001. Streams in the Urban Landscape. Annu Rev Ecol Syst. 32: 333-365. Peeters E THM, Gylstra R, Vos JH. 2004. Benthic macroinvertebrate community structure in relation to food and environmental variables. Hydrobiologia 19(1): 103-115. Pinder LCV. 1986. Biology of freshwater Chironomidae. Ann Rev Entomol. 31(1): 1-23. Pizzuto JE, Hession WC, McBride M, 2000. Comparing gravel-bed rivers in paired urban and rural catchments of southeastern Pennsylvania. Geology. 28(1): 79-82. Poulton BC, Wildharber ML, Charbonneau CS, Fairchild JF, Mueller BG, Schmitt CJ. 2003. A longitudinal assessment of the aquatic macroinvertebrate community in the channelized lower Missouri River. Environ Monit Assess 85: 23-53. Pratt JM, Coler RA, Godfrey PJ. 1981. Ecological effects of urban stormwater runoff on benthic macroinvertebrates inhabiting the Green River, Massachusetts. Hydrobiologia 83(1): 29-42. Quinlan EL, Nietch CT, Blocksom K, Lazorchak JM, Batt AL, Griffiths R. 2011. Temporal dynamics of periphyton exposed to tetracycline in stream mesocosms. Environ sci technol. 45(24): 106-184. Resh VH, Unzicker JD. 1975. Water quality monitoring and aquatic organisms: the importance of species identification. J Wat Poll Cont Fed. 47(1): 9-19.
147

Resh VH. 1979. Sampling variability and life history features: basic considerations in the design of aquatic insect studies. J Fish Board Can, 36(3), 290-311. Resh VH, Grodhaus G. 1983. Aquatic insects in urban environments. In GW Frankie and CS Koehler (eds) Urban entomology: interdisciplinary perspectives. Praeger Publishers, New York, NY, USA. Reynoldson TB, Norris RH, Resh VH, Day KE, Rosenberg DM. 1997. The Reference condition: a comparison of multimetric and multivariate approaches to assess water-quality impairment using benthic macroinvertebrates. J N Am Benthol Soc. 16(4): 833-852. Ricart M, Romaní AM, Morin S, Proia L, Sala L, Sureda D. 2010. Triclosan persistence through wastewater treatment plants and its potential toxic effects on river biofilms. Aquat Toxicol. 100(4): 346-53. Rosenberg DM. 1992. Freshwater biomonitoring and Chironomidae. Aquat Ecol. 26(2-4): 101-122. Rosi-Marshall EJ. 1994. Decline in the quality of suspended fine particulate matter as a food resource for chironomids downstream of an urban area. Freshw Biol 49: 515-525. Rosi-Marshall EJ, Royer TV. 2012. Pharmaceutical Compounds and Ecosystem Function: An Emerging Research Challenge for Aquatic Ecologists. Ecosystems 15(6): 867-80. Sanderson H, Dyer SD, Price BB, Nielsen AM, van Compernolle R, Selby M, Stanton K, Evans A, Ciarlo M, Sedlak R. 2006. Occurrence and weight-of-evidence risk assessment of alkyl sulfates, alkyl ethoxysulfates, and linear alkylbenzene sulfonates (LAS) in river water and sediments. Sci Tot Envir. 368(2-3): 695-712. Selby M. 2006. Surfactant analysis for SDA Sediment Task Force. Report to American Cleaning Institute. GS.06.51264. Slye JL, Kennedy JH, Johnson DR, Atkinson SF, Dyer SD, Ciarlo M, Stanton K, Sanderson H, Nielsen AM. 2011. Relationships between benthic macroinvertebrate community structure with geospatial, habitat, in-stream water chemistry, and surfactants in the effluent dominated Texas Trinity River. Environ Toxicol Chem. 30(5): 1127-1138. Sneath PHA, Sokal RR. 1973. Numerical taxonomy: The principles and practice of numerical classification. Freeman, San Francisco, CA, USA. 573 pp. Sokal RR, Rohlf FJ. 1969. Biometry: the principles and practices of statistics in biological research. WH Freeman and Co. San Francisco, CA, USA. 776 pp.
148

Spon ST. 1994. The response of aquatic insect communities and caged in situ juvenile Asiatic clams (Corbicula fluminea) to dechlorinated municipal effluent in the Trinity River in north Texas. Masters Thesis. University of North Texas, Denton, TX, USA. 192 pp. Statistical Analysis System Version 9.1.3. 2008 2010. SAS Institute. Cary, NC, USA. Steinman AD, McIntire CD. 1990. Recovery of lotic periphyton communities after disturbance. Environ Manage. 14: 589-604. Stephenson JM. 2000. Monitoring macroinvertebrate community structure as an indicator of watershed health in the upper Trinity River basin, north central Texas. Masters Thesis. University of North Texas, Denton, TX, USA. Stephenson, J. M. and Kennedy, J.H. 2010. Finding the Best Measures of Chironomid Community Response to Disturbance in the Upper Trinity River Basin, North Central Texas, pp. 174-183. In: Ferrington, L. C. Jr. (ed.) Proceedings of the XV International Symposium on Chironomidae. University of Minnesota Saint Paul, Minnesota 385pp. ter Braak CJF. 19912005. CANOCO version 3.12a4.54. Agricultural Mathematics Group, Wageningen, The Netherlands. Texas Commission on Environmental Quality. 1999. Receiving Water Assessment Procedures Manual. Prepared by Surface Water Quality Monitoring Program, Water Quality Division. Texas Natural Resource Conservation Commission. Austin, TX, USA. 56pp. Texas Commission of Environmental Quality. 2007. Guidance for assessing and reporting surface water quality in Texas. Austin, TX, USA. 166pp. Texas Water Development Board. “Population and Water Demand Data.” http://www.twdb.state.tx.us/data/popwaterdemand/main.asp (accessed August 15, 2006). Thienemann A. 1925. Die Binnengewässer Mitteleuropas. In: A. Thienemann, Die Binnengewässer. Bd. I. 255 pp. Thorpe T, Lloyd B. 1999. The macroinvertebrate fauna of St. Lucia elucidated by canonical correspondence analysis. Hydrobiologia. 400: 195 – 203. Torres-Ruiz M, Wehr JD, Perrone AA. 2007. Trophic relations in a stream food web: importance of fatty acids for macroinvertebrate consumers. J N Am Benthol Soc 26(3): 509-522. Trinity River Authority. 2006. Tour. www.trinityra.org/about_tour1.htm. Accessed 10 September 2006
149

Trinity River Authority. 2007. Master Plan. www.trinityra.org/masterplan.htm. Accessed 21 July 2008. Udy JW, Fellows CS, Bartkow ME, Bunn SE, Clapcott JE, Harch BD. 2006. Measures of nutrient processes as indicators of stream ecosystem health. Hydrobiologia. 572: 89-102. University of North Texas. 2007. Benthic community structure and surfactants in the Trinity River. Prepared for The Soap and Detergent Association Surfactants in Sediments Task Force. 93 pp. van Compernolle R, McAvoy DC, Sherren A, Wind T, Cano ML, Belanger SE, Dorn PB, Kerr KM. 2006. Predicting the sorption of fatty alcohols and alcohol ethoxylates to effluent and receiving water solids. Ecotoxicol Environ Saf. 64: 61-74. Vannote RL, Minshall GW, Cummins KW, Sedell JR, Cushing CE. 1980. The river continuum concept. Can J Fish Aquat Sci. 37: 130-137. Versteeg DJ, Rawlings JM. 2003. Bioconcentration and toxicity of dodecylbenzene sulfonate (C12LAS) to aquatic organisms exposed in experimental streams. Arch Environ Contam Toxicol. 44: 237-246. Vestal RJ, White DC.1989. Lipid analysis in microbial ecology: quantitative approaches to the study of microbial communities. Bioscience. 39: 535-541. Vörösmarty CJ, Liermann CR, Davies PM, McIntyre PB, Gessner MO, Dudgeon D. 2010. Global threats to human water security and river biodiversity. Nature. 467(7315): 555-61. Voshell JR. 2002. A Guide to Common Freshwater Invertebrates of North America. The McDonald and Woodward Publishing Company, Blacksburg, VA, USA. Wetzel RG. 1983. Periphyton of Freshwater Ecosystems. Dr. W. Junk Publishers. The Hague, The Netherlands. Wetzel RG. 1993. Microcommunities and microgradients: Linking nutrient regeneration, microbial mutualism, and high sustained aquatic primary production. Neth J Aquat Ecol. 27(1): 3-9 White DC, Flemming CA, Leun KT, and Manaughton SJ. 1998. In situ microbial ecology for quantitative appraisal, monitoring, and risk assessment of pollution remediation in soils, the subsurface, the rhizosphere and in biofilms. J Microbio Meth. 32: 93-105. Whittier TR, Hughes RM, Larsen DP. 1988. Correspondence between ecoregions and spatial patterns in stream ecosystems in Oregon. Can J Fish Aquat Sci. 45(7): 1264-1278.
150

Wiederholm T. (ed.) 1983. Chironomidae of the Holarctic region. Keys and diagnoses. Part 1. Larvae. Entomologica Scandinavica 19: 1-457. Wilhelm JGO, Allan JD, Wessell KJ, Merritt RW, Cummins KW. 2007. Habitat assessment of non-wadeable rivers in Michigan. Environ Manage. 36(4): 592-609. Wilson BA, Smith VH, deNoyelles F, Larive CK. 2003. Effects of three pharmaceutical and personal care products on natural freshwater algal assemblages. Environ Sci Tech, 37(9), 1713-1719. Writer JH, Ryan JN, Barber LB. 2011. Role of biofilms in sorptive removal of steroidal hormones and 4-nonylphenol compounds from streams. Environ Sci Tech. 45(17): 7275-83. Zuur AF, Ieno EN, Smith GM. 2007. Analysing ecological data. Springer. New York, NY, USA. 672 pp.
151