relative permeability curves for high · pdf filerelative permeability curves for high...
TRANSCRIPT
RELATIVE PERMEABILITY CURVES FOR HIGH PRESSURE, HIGH TEMPERATURE RESERVOIR CONDITIONS
Ahmed Gawish, Emad Al-HomadhiKing Saud University, Petroleum and Natural Gas Engineering,
P.O. Box 800, Riyadh 11421, Saudi [email protected]
www.ksu.edu.sa/agawish
The Objective of this paper is to clearly investigate the effect of some factors on oil- water relative permeability curves under certain reservoir pressure and temperature. In litreture, the effect of different factors on relative permeability of oil-water systems have been studied under ambient room conditions. However, treatments studies dealing with the effect of factores under reservoir conditions are few. Therefore, in this study, wettability alterations, brine chemistry, clay content, and their impacts on relative permeability curves under particular reservoir pressure and temperature were studied. Pore pressure, pore pressure drawdown and their combined effect with overburden stress and brine chemistry on relative permeability curves were also investigated at reservoir conditions. The relative permeability was calculated using JBN method.
In conclusions, the change of wettability from water wet to mixed wet gives relatively higher relative permeability to oil at high and medium oil saturation in the core samples. But at low oil saturation the relative permeability to oil becomes lower in mixed wet than in water wet.
At reservoir temperature, the oil relative permeability increases at all oil saturations compare with room conditions. This effect may be not due to the change in wettability but due to the change in viscosity ratio.
The effect of clay content on all permeability types (absolute, effective, relative permeability, relative permeability ratio, and fractional water flow) was bad due its damaging effect.
The increase of net overburden pressure cause decrease in the relative permeability of oil, however, its effect on relative permeability of water was negligible.
INTRODUCTION
Relative permeability is a critical parameter for evaluation of reservoir
performances. Relative permeability is a direct measure of the ability of the porous
medium to conduct one fluid when two or more fluids are present. This flow property is
the composite effect of pore geometry, wettability, fluid saturation, saturation history,
reservoir temperature, reservoir pressure, overburden pressure, rock types, porosity and
permeability types. The relative permeability curves are very important in reservoir
studies. The are used in predicting production rate and recovery from the reservoirs
during all recovery stages (primary, secondary, and tertiary).
_____________________________________________________________________________ Oil and Gas Business, 2008 http://www.ogbus.ru/eng/
Some of the aforementioned factors were studied at room conditions only and
some at reservoirs condition and others are not studied yet like pore pressure (reservoir
pressure and pore pressure depletion.
This study is concerned to measure and calculate of relative permeability curves
under reservoir conditions by including all involved factors.
The determination of relative permeability curves was carried out by using two
kinds of cores, artificial consolidated core and Berea sand stone cores which is strongly
water-wet sandstone and consisting typically of 90-95% quartz.
Relative permeability data are necessary for reservoir simulation involving
multiphase flow of fluids in porous media. The relative permeability saturation data are
usually obtained from displacement experiments with core flooding in the lab. The
unsteady-state method can be carried out in a relatively short time, but the interpretation
of the data is more complex. Therefore, unsteady state method was used in this study.
LITERATURE REVIEW
Factors affecting the relative permeability Curves
Wettability affects relative permeability because it is a major factor in the
control of the location, flow, and spatial distributions of the fluids in the core.
Wettability determines the relative locations of oil and water with in the reservoir
porous medium. Because of its effect on the oil/water distribution, wettability influences
the relative permeabilities of the flowing fluids [2-6].
Temperature is the one of the early studies of temperature on relative
permeability was presented by Edmondson [9], Weinbrandt et al. [10], Casse and
Ramey [11], Ref. [12], Miller M.A. and Ramey H.J. [13] measured dynamic-displace-
ment relative. The study proves that temperature has no effects. Also the references
[14]-[18] shown consolidated sands water/oil relative permeabilities at temperature
ranging from 22 oC to 175 oC. They found that water/oil relative permeability curves are
affected by temperature especially at low interfacial tensions (IFT).
The change in wettability of the rock and reduction of the interfacial tension
with increasing temperature were important factors in causing the observed changes in
the relative permeability curves. The above results from experimental were conducted
_____________________________________________________________________________ Oil and Gas Business, 2008 http://www.ogbus.ru/eng/
2
on fired Berea sandstone cores using n-dodecane and 1% NaCl. Aqueous low-
concentration surfactant solutions were used to change interfacial tension levels. For the
experiments reported, the fluid pressure was kept constant at 300 psig and the
overburden pressure at 650 psig.
Overburden Pressure
The dynamic displacement experiments studied the effect of the confining
pressure on porosity, absolute and relative permeability [19]. These experiments were
conducted on small, consolidated rock samples under overburden pressure up to
6000 psig and room temperature of 23 oC. The pore pressure was maintained
atmospheric. The examination of experimental results shows a decrease in porosity and
permeability with increase in overburden pressure. The explanation for this
phenomenon is as the overburden increased, the sand grains are brought close together
causing a general shift in the pore throat diameter distribution towards smaller values.
For a given water saturation, this leads to redistribution of the wetting phase to occupy
more pore throats, while this should not cause any significant change in Kw, it leads to
more blockage of the oil flow and hence reduces kro.
Reservoir Pressure
The effect of confining pressure changes at a fixed temperature and reservoir
pressure on the absolute permeability of unconsolidated and consolidated sands was
studied. The results show a linear decrease in permeability when the confining pressure
is applied. Due to the fact that, the initial pressurization of the system compacts the
grains into a tighter structure, after which it responds elastically to changes in confining
pressure.
As the pore pressure increases, the permeability increases. However, when
reservoir pressure was released, the permeability did not return to its initial value, but it
returns to a higher value. And this was attributed to migration of fines that settle into
pore throats.
In conclusion, absolute permeability of a porous medium can only be expressed
as a function of the difference between the confining pressure (overburden pressure)
and the reservoir pressure.
_____________________________________________________________________________ Oil and Gas Business, 2008 http://www.ogbus.ru/eng/
3

The Displacement Rate and Contact Angle
The displacement rate and contact angle are affect the shape of imbibition
relative permeability curves. Increasing contact angle and rate, will be effect the relative
permeability. It increases and the residual saturation decreases [22].
Experimental work
A Berea sand stone cores and artificial highly consolidated sandstone with 12
inches length and 2 inches diameter were used in the flooding test.
In the core flooding test procedure, pressure responses to flow changes through
porous media was monitored according (in-compressible, and linear flow conditions)
see Fig. 1. The Darcy Equation is used to calculate permeability:
q= kA ΔpμL .
Figure 1. Core flooding station under high pressure and temperature
_____________________________________________________________________________ Oil and Gas Business, 2008 http://www.ogbus.ru/eng/
4

System operation
• The core was evacuated using a vacuum pump and saturated with known
salinity brine.
• Core holder was connected to the main core flooding apparatus.
• 10 % methyl alcohol (methanol) (Me-OH) was added to avoid emulation
solution between brine and hydrocarbons.
• Four hours should be sufficient to stabilize core temperature.
• Allow the brine to flow through the cores for 30 minutes (minimum) at 10 ml/
min. Some silica fines will be eluted during this period of time.
• After differential pressures have stabilized (minimum of 3 PV eluted through
the core flooding) pressures at three different flow rates were recorded and calculate kw1.
• The 100 % brine saturated core was then displaced by the oil phase. The
displacement continued until water production from the core becomes zero. After this
stage the core was saturated with oil at irreducible water saturation. The relative
volumes of the effluents were measured. Continue recording all pressures and
periodically measure flow rate.
• After differential pressures have been stabilized (minimum of 3 PV eluted
through the core flooding) ko1 was calculated.
• At this stage, the core should be left under reservoir condition for a period of
time (5-7 days) for agitation processes.
• Injecting brine into the core was started and. The water volume and time at
breakthrough was recorded. After breakthrough, the produced oil and brine volumes as
well as the pressure drop across the core were recorded with time. Oil and water relative
permeability was calculated using the JBN method.
• After 100 % water cut, pressures and flow rate recording and kw2 calculation
continous.
_____________________________________________________________________________ Oil and Gas Business, 2008 http://www.ogbus.ru/eng/
5

RESULTS AND DISCUSSION
The following sections present and discuss the effect of clay, wettability
alteration, temperature, chemical, pore pressure, and overburden pressure on oil-water
relative permeability, fractional flow curves, and relative permeability ratio.
Effect of Brine Chemistry
Sodium hydroxide (NaOH) with low concentration (0.2 %) is used to change the
wettability. The contact angle between oil and brine with 20 % NaCl, 20 % NaCl , and
0.2 % NaOH was measured at room of 23 oC and reservoir temperature of 70 oC as a
function with time for Berea sand stone . The results are shown in Table (1).
Table 1
The pH, viscosity, and contact angle between brine and crude oil at room and reservoir temperature
Brine pH Viscosity, cp Contact angle, o 1 20 % NaCl @ 23 oC 7.2 1.06 432 20 % NaCl +
0.2 % NaOH @ 23 oC10.54 1.50 130
3 20 % NaCl @ 70 oC 7.2 0.8 424 20 % NaCl +
0.2 % NaOH @ 70 oC10.54 0.8 129
5 20 % NaCl @ 23 oCSample eluted from the core 7.2 0.8 43
To investigate the results from the above Table (1), the oil used in this study has
no effect on the pH and the contact angle, when the ageing process is completed (4-7
days) under reservoir condition at connate water saturation. The pH and contact angle
are the same for the brine used in the core flooding under reservoir condition for ageing
process period, and for the other brine that is not used for flooding see Table (1)
Samples 1, 3, and 5 also samples 2, and 4.
_____________________________________________________________________________ Oil and Gas Business, 2008 http://www.ogbus.ru/eng/
6

The Effect of Wettability
The core wettability is changed from water-wet to mixed or oil-wet by adding
0.2 % NaOH. The pore space progressively becomes more oil-wet due to film rupture as
the capillary pressure is raised. The brine during imbibition and the oil sees a different
porous medium, which is now mixed wet or partially oil wet. The brine during
imbibition would tend to go into largest pores of the oil wet and of course continue to
flow through the smallest pores which have not been contacted by oil during drainage
and hence are still water-wet. This may create a very different fluid distribution than
would have been achieved if the core were oil-wet to begin with. Figs (2 - 4) shown
that:
• Oil recovery increases if the core becomes oil-wet, the ultimate oil recovery for
water-wet core equals to 53 %, and the ultimate oil recover for oil-wet core was 67 %.
• Oil relative permeability increases for medium and low oil saturations if the
core was strongly oil-wet, and decreases for high oil saturation.
0
0.2
0.4
0.6
0.8
1
0 0.2 0.4 0.6 0.8 1
Water Saturation, fraction
Rela
tive
Perm
eabi
lity,
frac
tion
Kro at T=70 oC, and 20% Na Cl
Krw at T=70 oC, and 20% Na Cl
Kro at T=70 oC, 20%Na Cl, and 0.2% Na OHKrw at T=70 oC, 20% Na Cl, and0.2% Na OH
Figгку 2. Effect of wettability on relative permeability curves at reservoir conditions
_____________________________________________________________________________ Oil and Gas Business, 2008 http://www.ogbus.ru/eng/
7
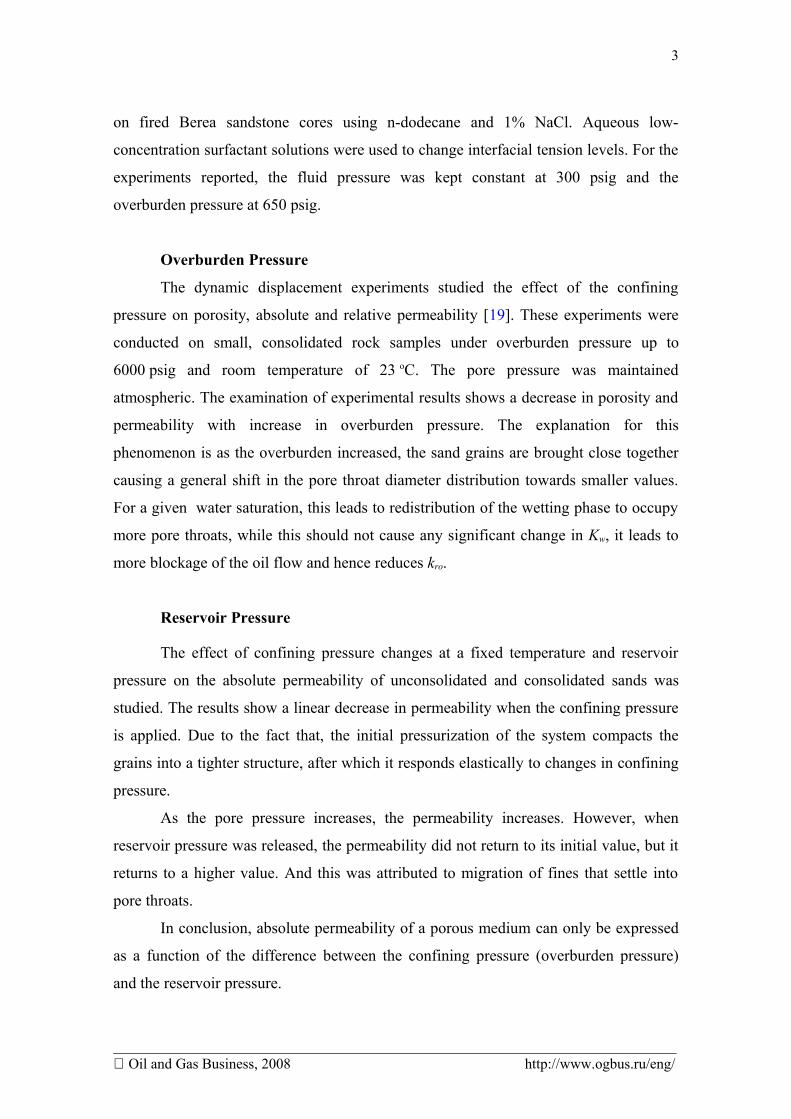
• Fractional water curve for oil-wet core is better than water-wet core for low
oil saturation, but the opposite is true for high and medium oil saturation, see Fig. 3.
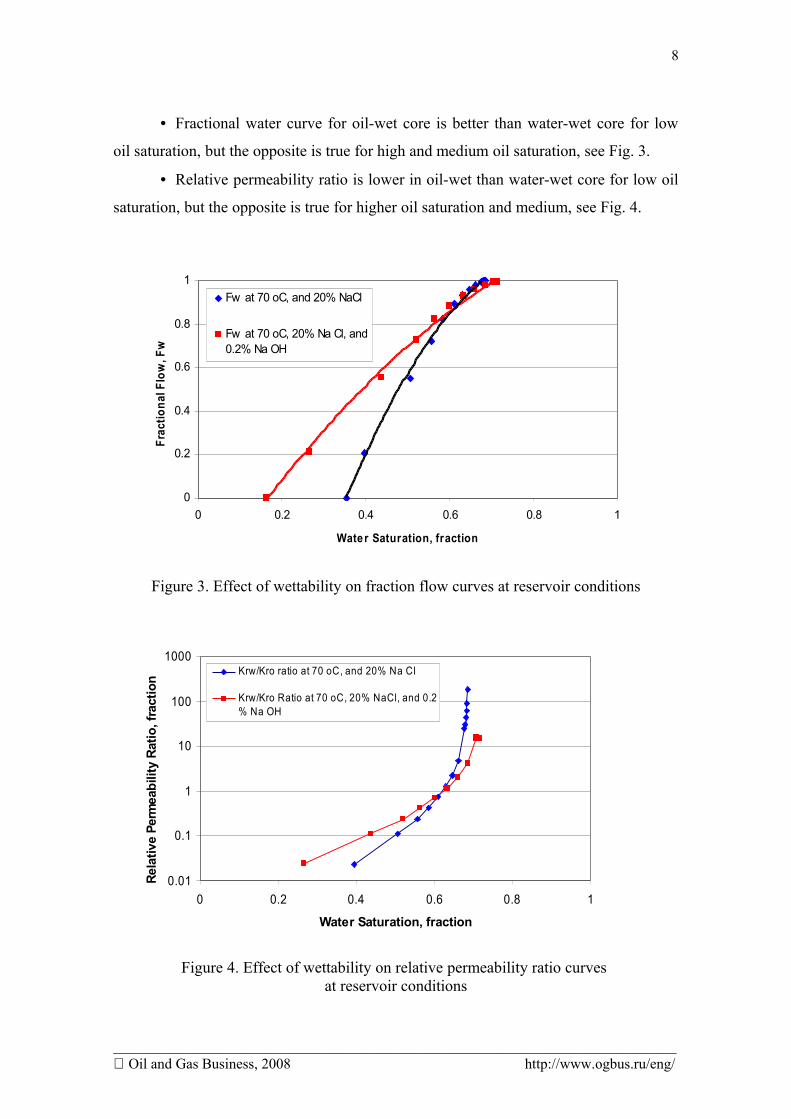
• Relative permeability ratio is lower in oil-wet than water-wet core for low oil
saturation, but the opposite is true for higher oil saturation and medium, see Fig. 4.
0
0.2
0.4
0.6
0.8
1
0 0.2 0.4 0.6 0.8 1
Water Saturation, fraction
Frac
tiona
l Flo
w, F
w
Fw at 70 oC, and 20% NaCl
Fw at 70 oC, 20% Na Cl, and0.2% Na OH
Figure 3. Effect of wettability on fraction flow curves at reservoir conditions
0.01
0.1
1
10
100
1000
0 0.2 0.4 0.6 0.8 1
Water Saturation, fraction
Rela
tive
Perm
eabi
lity
Ratio
, fra
ctio
n
Krw/Kro ratio at 70 oC, and 20% Na Cl
Krw/Kro Ratio at 70 oC, 20% NaCl, and 0.2% Na OH
Figure 4. Effect of wettability on relative permeability ratio curves at reservoir conditions
_____________________________________________________________________________ Oil and Gas Business, 2008 http://www.ogbus.ru/eng/
8

The Effect of Clay Content
Residual oil saturation was lower in the relatively clay free cores.
Oil relative permeability was higher in the clean cores compares with cores
contains some percentage of clay. And we get the opposite results for the water relative
permeability, see Fig. 5.
0
0.2
0.4
0.6
0.8
1
0 0.2 0.4 0.6 0.8 1
Water Saturation, fraction.
Rela
tive
Perm
eabi
lity,
frac
tion
Kro
Krw
Kro, for 5% Clay in the core
Krw , for 5% Clay in thecore
Figure 5. Effect of clay on relative permeability curves at reservoir conditions
• Fractional water curve for clean core was better than dirty cores for all oil
saturations, see Fig. 6.
• Relative permeability ratio is lower in clean core than dirty cores for all oil
saturations, see Fig. 7.
_____________________________________________________________________________ Oil and Gas Business, 2008 http://www.ogbus.ru/eng/
9

0
0.2
0.4
0.6
0.8
1
0 0.2 0.4 0.6 0.8 1
Water Saturation, fraction
Frac
tiona
l Flo
w, F
w
Fw
Fw for 5% Clay in the core
Figure 6. Effect of clay content on fraction flow curves at reservoir conditions
0.1
1
10
100
0 0.2 0.4 0.6 0.8 1
Water Saturation, fraction
Rel
ativ
e Pe
rmea
bilit
y R
atio
, fr
actio
n
Krw /Kro
Krw /Kro w ith 5% Clay inthe core
Figure 7. Effect of clay content on relative permeability ratio curves at reservoir conditions
_____________________________________________________________________________ Oil and Gas Business, 2008 http://www.ogbus.ru/eng/
10

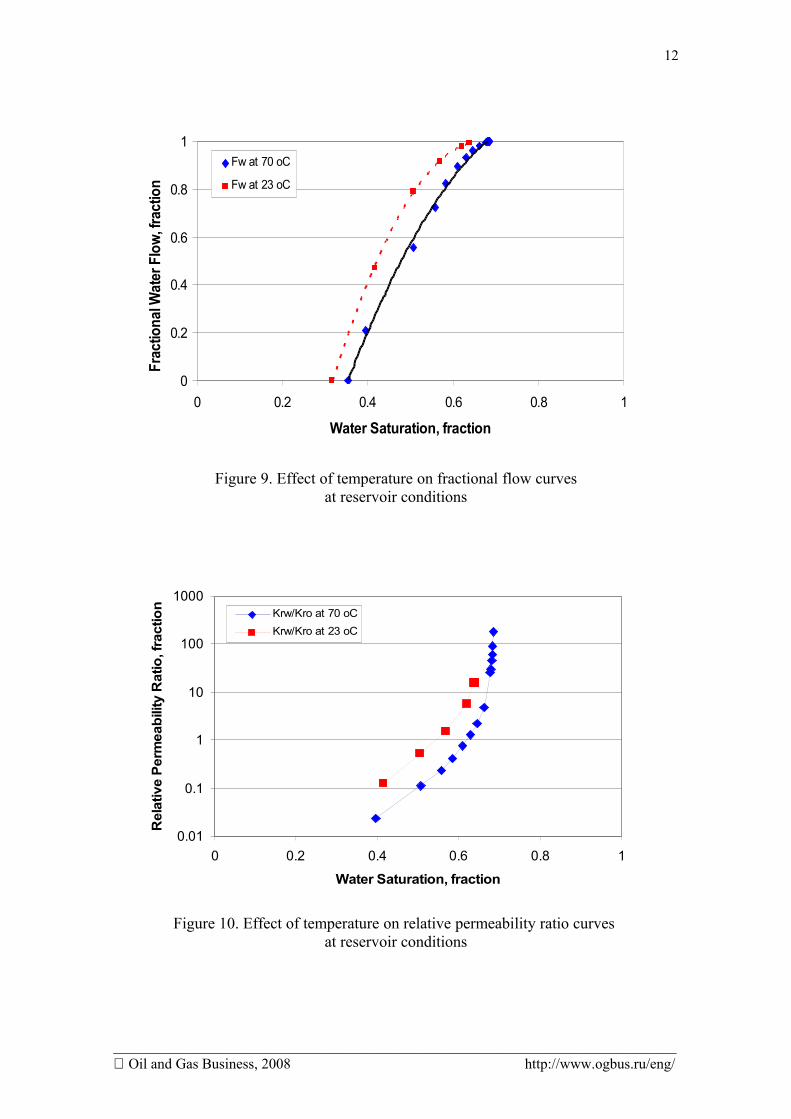
The Effect of Temperature
The water wet cores were studied at 23 oC and 70 oC. The wettability did not
change with temperature for a test of 72 hours. Water pH before and after test are equals
7.2 and 7.3 almost the same. The improvement in the oil relative permeability may be
due to decease in oil-to-water viscosity ratio.
• Oil recovery increases at higher temperature, the ultimate oil recovery for low
temperature core equal to 49.7 %, and the ultimate oil recover for high temperature core
increase to 53 %, see Fig. 8.
• Fractional water flow curve was better for core is tested at higher temperature
at all oil saturations, see Fig. 9.
• Increasing temperature causes lower reservoir relative permeability ratio, see
Fig. 10.
0
0.2
0.4
0.6
0.8
1
0 0.2 0.4 0.6 0.8 1Water Saturation, fraction
Rela
tive
Perm
eabi
lity,
frac
tion
0
0.2
0.4
0.6
0.8
1Kro at T=70 oC
Krw at T=70 oC
Kro at T=23 oC
Krw at T=23 oC
Figure 8. Effect of temperature on relative permeability curves at reservoir conditions
_____________________________________________________________________________ Oil and Gas Business, 2008 http://www.ogbus.ru/eng/
11
0
0.2
0.4
0.6
0.8
1
0 0.2 0.4 0.6 0.8 1
Water Saturation, fraction
Frac
tiona
l Wat
er F
low,
frac
tion
Fw at 70 oC
Fw at 23 oC
Figure 9. Effect of temperature on fractional flow curves at reservoir conditions
0.01
0.1
1
10
100
1000
0 0.2 0.4 0.6 0.8 1
Water Saturation, fraction
Rel
ativ
e Pe
rmea
bilit
y R
atio
, fra
ctio
n Krw/Kro at 70 oCKrw/Kro at 23 oC
Figure 10. Effect of temperature on relative permeability ratio curves at reservoir conditions
_____________________________________________________________________________ Oil and Gas Business, 2008 http://www.ogbus.ru/eng/
12
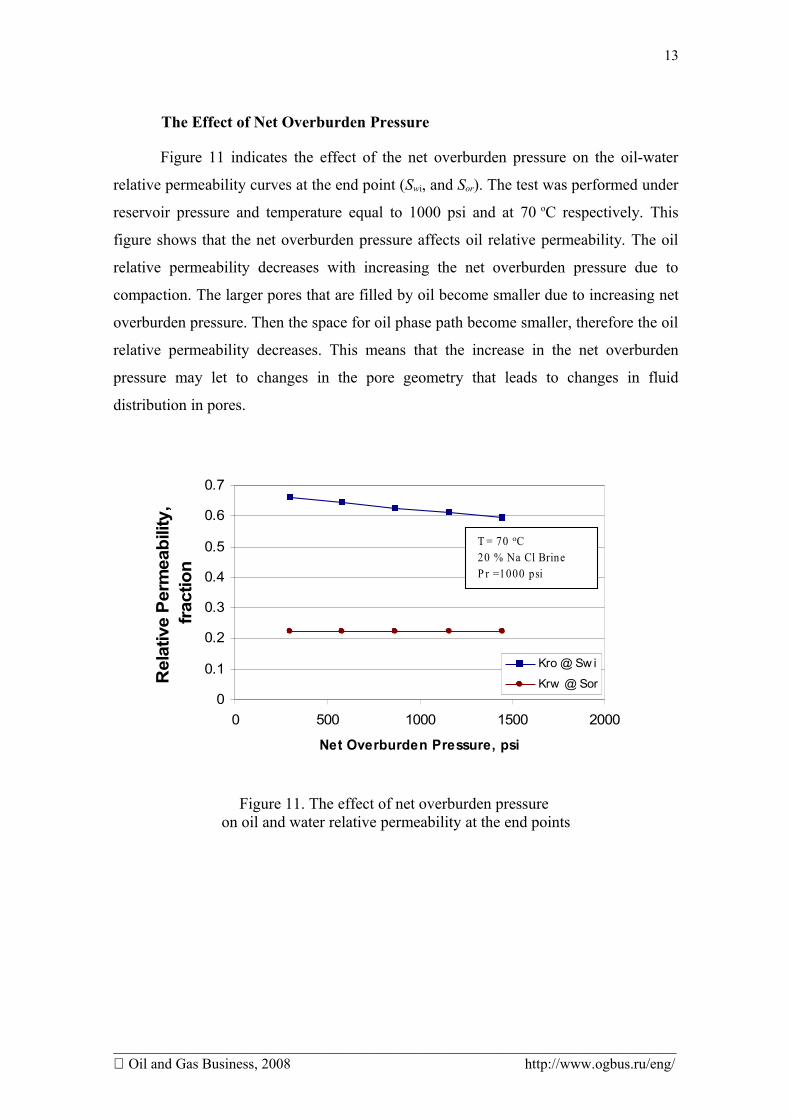
The Effect of Net Overburden Pressure
Figure 11 indicates the effect of the net overburden pressure on the oil-water
relative permeability curves at the end point (Swi, and Sor). The test was performed under
reservoir pressure and temperature equal to 1000 psi and at 70 oC respectively. This
figure shows that the net overburden pressure affects oil relative permeability. The oil
relative permeability decreases with increasing the net overburden pressure due to
compaction. The larger pores that are filled by oil become smaller due to increasing net
overburden pressure. Then the space for oil phase path become smaller, therefore the oil
relative permeability decreases. This means that the increase in the net overburden
pressure may let to changes in the pore geometry that leads to changes in fluid
distribution in pores.
0
0.1
0.2
0.3
0.4
0.5
0.6
0.7
0 500 1000 1500 2000
Net Overburden Pressure, psi
Rel
ativ
e Pe
rmea
bilit
y,
fract
ion
Kro @ Sw i
Krw @ Sor
T = 70 oC20 % Na Cl Brine P r =1000 psi
Figure 11. The effect of net overburden pressure on oil and water relative permeability at the end points
_____________________________________________________________________________ Oil and Gas Business, 2008 http://www.ogbus.ru/eng/
13

CONCLUSIONS
1. The change of wettability from water wet to mixed wet gives higher oil
relative permeability at high and medium oil saturation. But at low oil saturation the
opposite was noticed.
2. At higher temperature, oil relative permeability increases not due to the
change in wettability but due to the change in oil viscosity.
3. Fractional water flow and relative permeability ratios become lower at higher
temperature.
4. Clay content in the core sample has a clear affect on all permeability
(absolute, effective, relative permeability, relative permeability ratio, and fractional
water flow).
5. Fractional water curve and relative permeability ratio are lower in clean cores
than that contain some clay.
6. The net overburden pressure effects oil relative permeability. Oil relative
permeability decreases due to increase of net overburden pressure, but the water relative
permeability dose not change (negligible).
REFERENCES
1. M. Honarpour, and S. M. Mahmood "Relative-permeability measurements an
overview". SPE paper 18565.
2. F.F. Craig, Jr The Reservoir Engineering Aspects of waterflooding. Mono-
graph series, SPE, Richardson, TX. 1993.
3. W.G. Anderson "Wettability Literature survey- part 5: the effects of wetta-
bility on relative permeability" JPT, pp 1453-1467, Nov. 1987.
4. D.N. Rao, M. Glrard, and, S. G. Sayegh "Impact miscible flooding on wetta-
bility, relative permeability, and oil recovery". SPE Reservoir Engineering, pp 204-528,
May 1992.
5. J. S. Archer, and C. G. wall, Petroleum Engineering: Principles and Practice.
Graham and Trotman Inc, Gaithersburg. MD., USA 1986 pp. 108.
_____________________________________________________________________________ Oil and Gas Business, 2008 http://www.ogbus.ru/eng/
14

6. J. Vivek, S. Chattopadhyay, and M. M. Sharma "Effect of capillary pressure,
salinity, and aging on wettability alteration in sandstones and limestones". SPE paper
75189, presented in IOR symposium, Tulsa, OK, 13-17 April 2002.
7. M. Khairy,. and A. Al-Quraishi,, “The Effect of Pore Pressure on Oil-Water
Relative Permeability Curves”, Al-Azhar Engineering 7th International Conference,
Cairo, 7-10 April, 2003.
8. B. Pedrera, H. Bertin, G. Hamon, and A. Augustin,"Wettability effect on oil
relative permeability during a gravity drainage", SPE paper 77542, presented at the SPE
Symposium on IOR, Tulsa, OK, April 2002.
9. T.A. Edmondson "Effects of temperature on water flooding" J. Can. Pet.
Tech. (Oct.-Dec. 1965) 236.
10. M. Polikar, S.M. Farouq Ali, and V.R. Puttagunts "High-temperature
relative permeabilities for Athabasca oil sands". SPE Reservoir Engineering, pp 25-32,
Feb. 1990.
11. F.J. Casse, and H.J. Ramey Jr. "The effect of temperature and confining
pressure on single-phase flow in consolidated rocks". SPE paper 5877.
12. R.D. Sydansk "Discussion of the effect of temperature and confining
pressure on single-phase flow in consolidated rocks". SPE paper Aug. 1980.
13. M.A. Miller, and H.J. Ramey Jr. "Effect of temperature on oil/water relative
permeability of unconsolidated and consolidated sands". SPE paper 12116, December
1985.
14. S. J. Torabzaden, and L.L. Handy "The effect of temperature and interfacial
tension on water/oil relative permeabilities of consolidated sands". SPE paper 12689,
Symposium on EOR, Tulsa, OK, April 1984.
15. E.M. Braun, and R.J. Blackwell "A Steady-state technique for measuring
oil-water relative permeability curves at reservoir conditions". SPE paper 10155.
16. B.D. Gobran, W.E. Brigham, H.J. Ramey Jr "Absolute permeability as a
function of confining pressure, pore pressure, and temperature". SPE Formation
Evaluation, pp 77-84, March 1987.
17. M Khairy,, A. Al-Quraishi, and A. Alsughayer, ”Effect of Oil Type,
Temperature, and Salinity on the Relative Permeability Curves and Wettability of
_____________________________________________________________________________ Oil and Gas Business, 2008 http://www.ogbus.ru/eng/
15

Sandstone”, Al-Azhar Engineering 7th International Conference, Cairo, 7-10 April,
2003.
18. J.M. Schembre, G-Q. Tang,, and A.R. Kovscek "Effect of temperature on
relative permeability for heavy-oil diatomite reservoirs". SPE paper 93831 CA, USA,
30 March-1 April 2005.
19. H.S. Ali, M.A. AL-Marhoun, Abu-Khamsin, and M.S. Calik "The effect of
overburden pressure on relative permeability". SPE paper 15730, Manama, Bahrain,
March 7-10 1987.
20. J. P. Ekwere, S. Khataniar "The effect of Instability on relative permeability
curves obtained by the dynamic-displacement method". SPE Formation Evaluation,
December 1987.
21. T. Ahmed, Reservoir Engineering Handbook. Gulf Publishing Company,
Houston, TX., 2001.
22. V.H. Nguyen, A.P. Sheppared, M.A. Knackstedt, and W.V. Pinczewski
"The effect of displacement rate and wettability on imbibition relative permeabilities".
SPE paper 95953 Dallas, TX., 9-12 Oct. 2005.
23. E.F. Johnson, D.P. Bossler, and V.O. Naumann "Calculation of relative
permeability from displacement experiments". Petroleum Transactions, AIME Vol. 216
pp 370-372 , 1959.
24. J. Toth, T. Bodi, P. Szucs, and F. Civan "Direct determination of relative
permeability from nonsteady-state constant pressure and rate displacements". SPE paper
67318. Production and operations symposium, OK, 24-27 march 2001.
25. J. Toth, T. Bodi, P. Szucs, and F. Civan "Determining relative permeability
from unsteady-state radial fluid displacements". SPE paper 94994. Technical conference
and exhibition, Dallas, TX, 9-12 Oct. 2005.
26. A.M. Tao, and A.T. Watson "Accuracy of JBN estimates of relative
permeability: part 1-error analysis". SPEJ, pp 209-214, April 1984.
27. A.M. Tao, and A.T. Watson "Accuracy of JBN estimates of relative
permeability: part 2-algorithms". SPEJ, pp 215-222, April 1984.
_____________________________________________________________________________ Oil and Gas Business, 2008 http://www.ogbus.ru/eng/
16

NOMENCLATURE
A = cross-section, cm2
φ = core porosity,
φi= initial core porosity,
µo = oil viscosity,
ρo = oil density, g/cc
∆P = pressure drop
∆Ps = pressure drop at the start of injection,
µw = viscosity of the displacing phase (water viscosity),
ρw = water density, g/cc
d = core diameter,
d= derivative operator
f = fractional flow
fo = oil fractional flow, fraction
fo2 = oil fractional flow at the out let end, fraction
fw = water fractional flow, fraction
fw2 = water fractional flow at the out let end, fraction
icrit = critical injection rate, cc/min
IFT = interfacial tension, mN/m
Ir = relative injectivity
iw = injection rate, cc/min.
K = permeability, md
Ki =initial permeability, md
Ko = effective oil permeability, md
_____________________________________________________________________________ Oil and Gas Business, 2008 http://www.ogbus.ru/eng/
17

kro = oil relative permeability, fraction
krw = water relative permeability, fraction
kw = effective water permeability, md
L = core length,
Np = cumulative oil produced, P.V
Pov = overburden pressure, psi
Sor = residual oil saturation, fraction
Sw2 = water saturation at the out let end, fraction
Sw2avg = average water saturation at the out let end, fraction
Swavg = average water saturation,
Swf = water saturation at breakthrough (B.T.), fraction
Swf avrg. =average water saturation at B.T., fraction
Swi = initial water saturation,
Swi = initial water saturation, fraction
t = time
V= average velocity of flow, (v = Aiw )
Vs= average velocity of flow, (vs = Aiw )
Winj = water injected, P.V
Wp= water produced, P.V
JBN : Johnson – Bosller – Naumann approach
ACKNOWLEDGMENT
To Research Center of Engineering Collage, King Saud University is highly
appreciation for funding of this project.
_____________________________________________________________________________ Oil and Gas Business, 2008 http://www.ogbus.ru/eng/
18

Table 2
JBN calculations for a run example
Time, sec ∆p,psi Vt, cc Vop, cc Vwp, cc Qwi, cc Qwi, pv Qwp,cc Qwp, pv Ir Ln(Qwi)0 0 0 0 0 0 0 0 0 3301.2 88 45 45 0 45 0.191489 0 0 1 3.806662810 90 16 12 4 61 0.259574 4 0.017021 1.416884 4.1108741600 85 33 5 28 94 0.4 32 0.13617 1.566452 4.5432951240 80 25 3.5 21.5 119 0.506383 53.5 0.22766 1.626935 4.7791231270 74 25 2 23 144 0.612766 76.5 0.325532 1.717302 4.9698131190 75 25 2 23 169 0.719149 99.5 0.423404 1.808314 5.1298991180 74 25 2 23 194 0.825532 122.5 0.521277 1.848282 5.2678581150 74 25 1.5 23.5 219 0.931915 146 0.621277 1.896498 5.3890721125 75 25 1 24 244 1.038298 170 0.723404 1.912794 5.4971681100 75 25 1 24 269 1.144681 194 0.825532 1.956267 5.5947111105 74 25 1 24 294 1.251064 218 0.92766 1.973731 5.683581110 74 25 1 24 319 1.357447 242 1.029787 1.964841 5.7651911100 72 25 1 24 344 1.46383 266 1.131915 2.037778 5.8406421095 72 25 0 25 369 1.570213 291 1.238298 2.047083 5.910797
Qo, cc fo Ln(1/Qwi) Ln(1(/I*Qwi)) slope m Swav Sw Kro Krw45 1 0.3617 0.3617 1 057 0.391115 -4.11087 -4.45933 0.838476 0.604263 0.50274 0.466459 0.06712662 0.160179 -4.54329 -4.99211 0.76768 0.62554 0.561468 0.208653 0.10112465.5 0.101418 -4.77912 -5.26582 0.731622 0.640433 0.589077 0.138621 0.11353267.5 0.073526 -4.96981 -5.51057 0.703707 0.648944 0.60389 0.104484 0.12169969.5 0.059113 -5.1299 -5.72229 0.681097 0.657455 0.614944 0.086791 0.12769571.5 0.051277 -5.26786 -5.88211 0.662196 0.665965 0.623634 0.077435 0.13243473 0.046903 -5.38907 -6.02908 0.646022 0.672348 0.628639 0.072603 0.13637574 0.044449 -5.49717 -6.14573 0.631932 0.676604 0.630452 0.070339 0.13977575 0.043101 -5.59471 -6.26575 0.619482 0.680859 0.631522 0.069576 0.14278576 0.042403 -5.68358 -6.36351 0.608352 0.685114 0.632065 0.069702 0.14550377 0.042093 -5.76519 -6.4406 0.598308 0.68937 0.632231 0.070353 0.14799478 0.042013 -5.84064 -6.5525 0.589169 0.693625 0.632125 0.071309 0.15030278 0 -5.9108 -6.62721 0.580797 0.693625 0.693625 0 0.155
_____________________________________________________________________________ Нефтегазовое дело, 2008 http://www.ogbus.ru