relative value trading techniques - interactive brokers · relative value trading techniques ......
TRANSCRIPT
Relative Value Trading Techniques
26 February 2015 Adam Grimes, CIO, Waverly Advisors
Overview What does it mean to trade relative value? Why might relative value be useful? Tools and techniques to measure relative
performance. What to do with this information:
– Analytical context – Trading concepts
© 2015 by Waverly Advisors, LLC. All rights reserved. No part of this document may be reproduced or transmitted in any form or by any means without the express written consent of Waverly Advisors.
Relative Value The concept of comparing the performance of one
asset or group of assets to another. Typical examples:
– Pair trades in stocks – Spread trades in commodities – Currencies
General concept is that we want to be long something and short something else, so that the P&L depends on the spread between the assets rather than the direction of either.
© 2015 by Waverly Advisors, LLC. All rights reserved. No part of this document may be reproduced or transmitted in any form or by any means without the express written consent of Waverly Advisors.
Winning and Losing In the simple case of buying asset A:
– Make money if A goes up. – Lose money if A goes down.
Spread trade: buy A, sell (short) B: – Make money if A goes up and B goes down. – Make money if A goes up and B is flat. – Make money if A is flat and B goes down. These are obvious, but…
© 2015 by Waverly Advisors, LLC. All rights reserved. No part of this document may be reproduced or transmitted in any form or by any means without the express written consent of Waverly Advisors.
Other Ways to Win or Lose Make money if both go up, but A goes up more than
B. Make money if both go down, but A goes down less
than B. Basic concept is:
– the “thing you are long” must go up more than the “thing you are short” goes up or
– The “thing you are short” must go down more than the “thing you are long” goes down.
– Any other combination, and you will lose money on the trade.
© 2015 by Waverly Advisors, LLC. All rights reserved. No part of this document may be reproduced or transmitted in any form or by any means without the express written consent of Waverly Advisors.
Why Look at Relative Value? Trading relative relationships can reduce risk
– Can also increase risk, so you have to know what you’re doing.
We already think about markets in relative terms. – Currencies are an obvious example – “Stock A will do better than its competitors.” – “Europe should lag the US because of…”
© 2015 by Waverly Advisors, LLC. All rights reserved. No part of this document may be reproduced or transmitted in any form or by any means without the express written consent of Waverly Advisors.
Why Relative Value? There are fewer market dynamics that can erase relative
value plays. – Directional tendencies can easily be eroded by buying and
selling pressure. – In the case of volatility, there are essentially no market
dynamics that can do this. – With relative value, can be done, but is much more difficult,
depending on the assets involved.
Many relative relationships are “real”. – Quantitative patterns often lack justification, but we can usually
point to real links between assets that explain the relationships. – This may allow different types of analysis.
© 2015 by Waverly Advisors, LLC. All rights reserved. No part of this document may be reproduced or transmitted in any form or by any means without the express written consent of Waverly Advisors.
Measuring Relative Performance Percent change charts Spread charts
– Difference – Ratio – Analytics/indicators
© 2015 by Waverly Advisors, LLC. All rights reserved. No part of this document may be reproduced or transmitted in any form or by any means without the express written consent of Waverly Advisors.
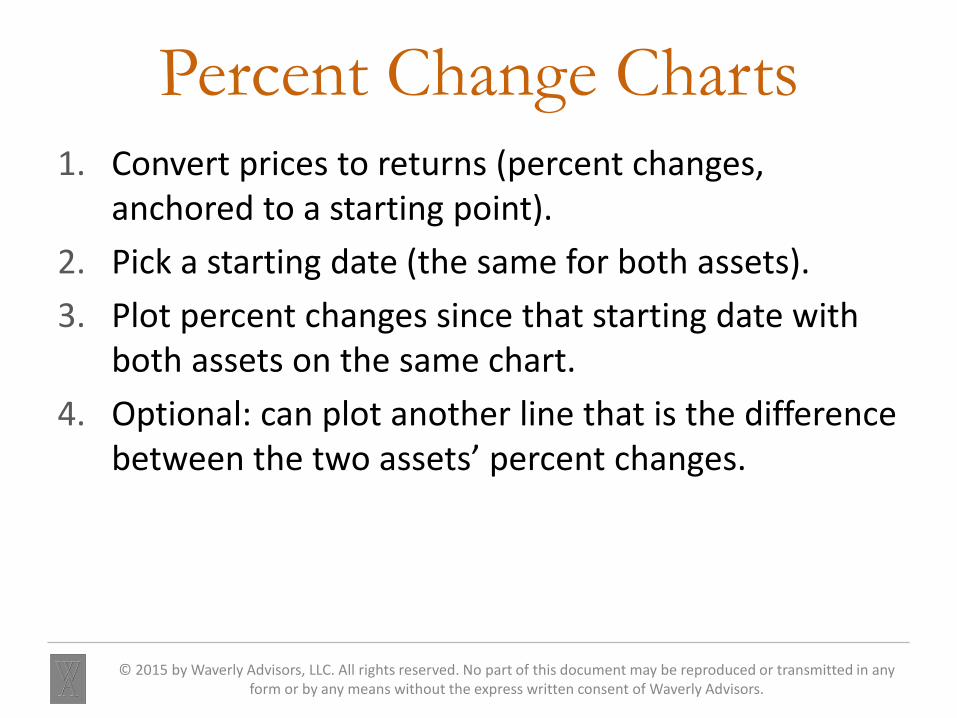
Percent Change Charts 1. Convert prices to returns (percent changes,
anchored to a starting point). 2. Pick a starting date (the same for both assets). 3. Plot percent changes since that starting date with
both assets on the same chart. 4. Optional: can plot another line that is the difference
between the two assets’ percent changes.
© 2015 by Waverly Advisors, LLC. All rights reserved. No part of this document may be reproduced or transmitted in any form or by any means without the express written consent of Waverly Advisors.
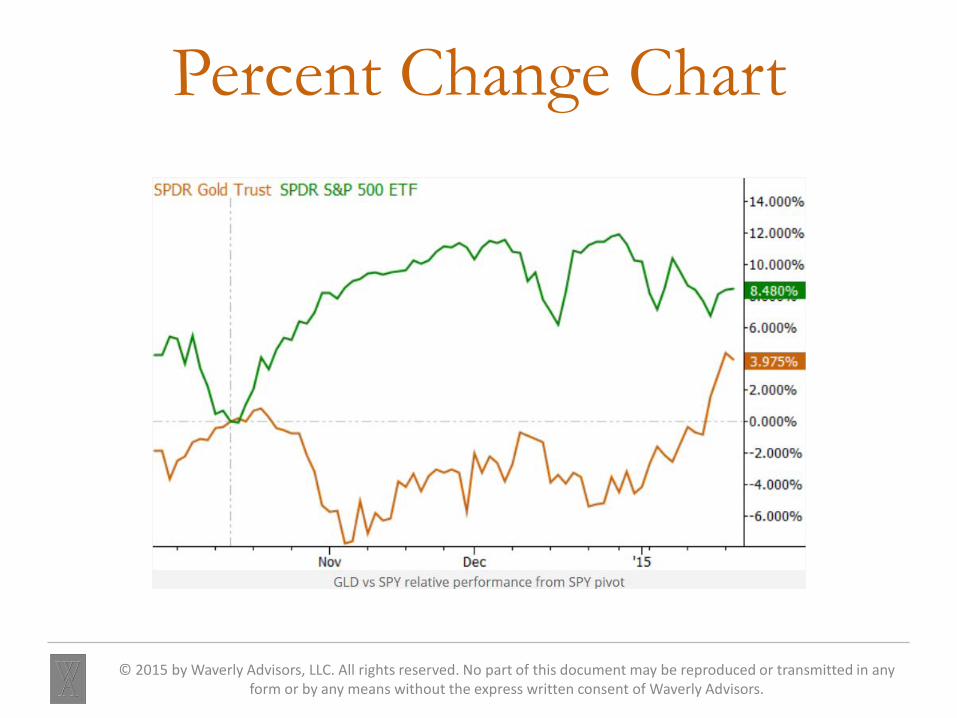
Percent Change Chart
© 2015 by Waverly Advisors, LLC. All rights reserved. No part of this document may be reproduced or transmitted in any form or by any means without the express written consent of Waverly Advisors.
Percent Change Issues Starting point matters.
– Can have completely different charts and impression of relative performance, depending on starting date.
© 2015 by Waverly Advisors, LLC. All rights reserved. No part of this document may be reproduced or transmitted in any form or by any means without the express written consent of Waverly Advisors.
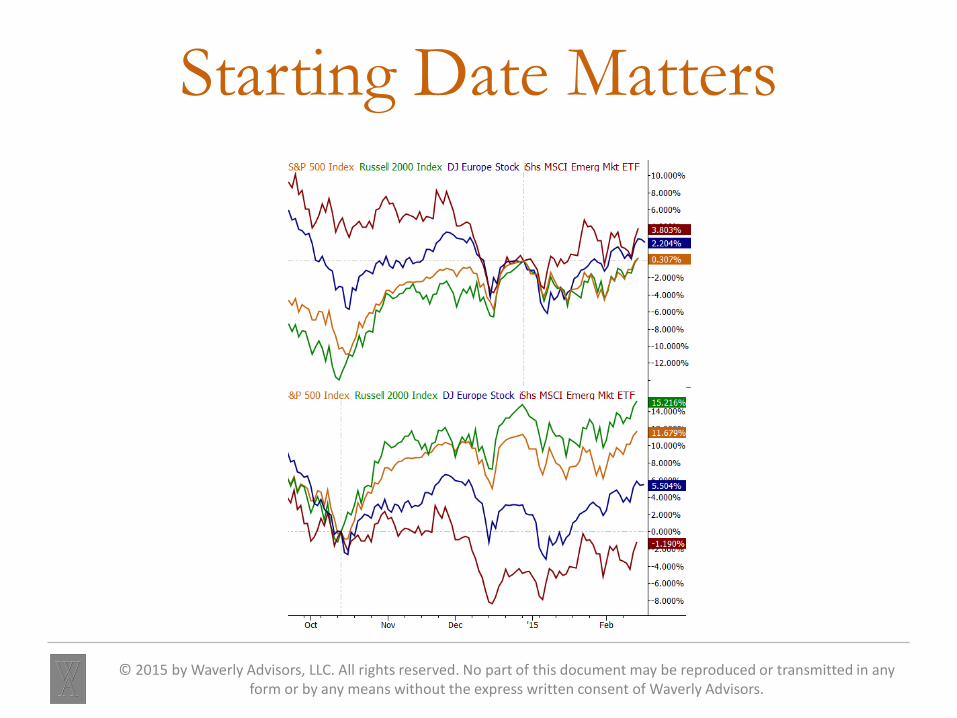
Starting Date Matters
© 2015 by Waverly Advisors, LLC. All rights reserved. No part of this document may be reproduced or transmitted in any form or by any means without the express written consent of Waverly Advisors.
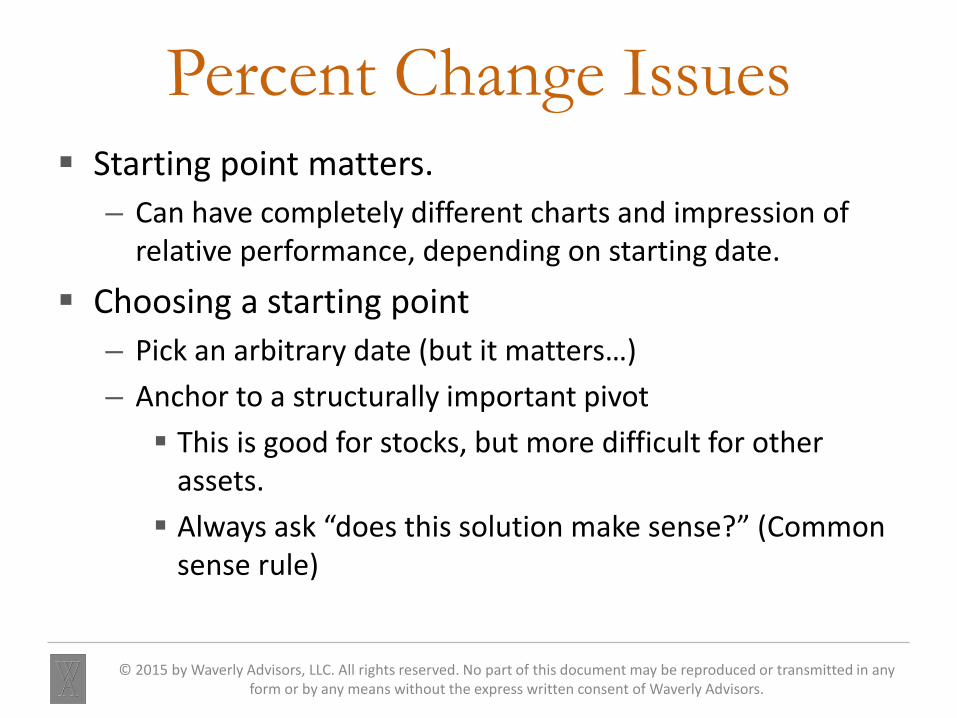
Percent Change Issues Starting point matters.
– Can have completely different charts and impression of relative performance, depending on starting date.
Choosing a starting point – Pick an arbitrary date (but it matters…) – Anchor to a structurally important pivot This is good for stocks, but more difficult for other
assets. Always ask “does this solution make sense?” (Common
sense rule)
© 2015 by Waverly Advisors, LLC. All rights reserved. No part of this document may be reproduced or transmitted in any form or by any means without the express written consent of Waverly Advisors.
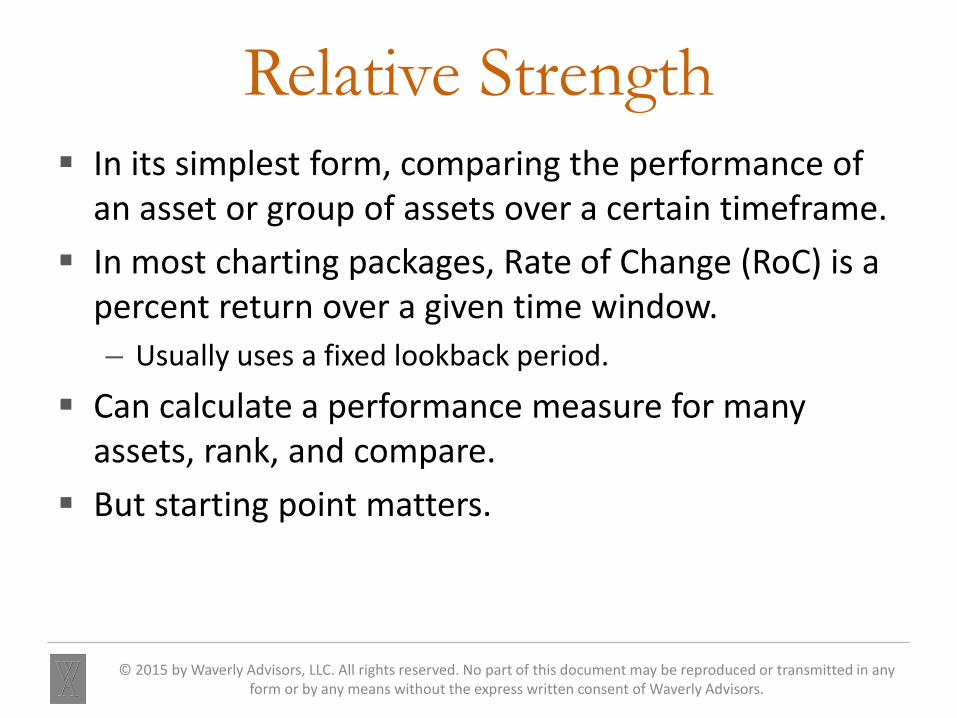
Relative Strength In its simplest form, comparing the performance of
an asset or group of assets over a certain timeframe. In most charting packages, Rate of Change (RoC) is a
percent return over a given time window. – Usually uses a fixed lookback period.
Can calculate a performance measure for many assets, rank, and compare.
But starting point matters.
© 2015 by Waverly Advisors, LLC. All rights reserved. No part of this document may be reproduced or transmitted in any form or by any means without the express written consent of Waverly Advisors.
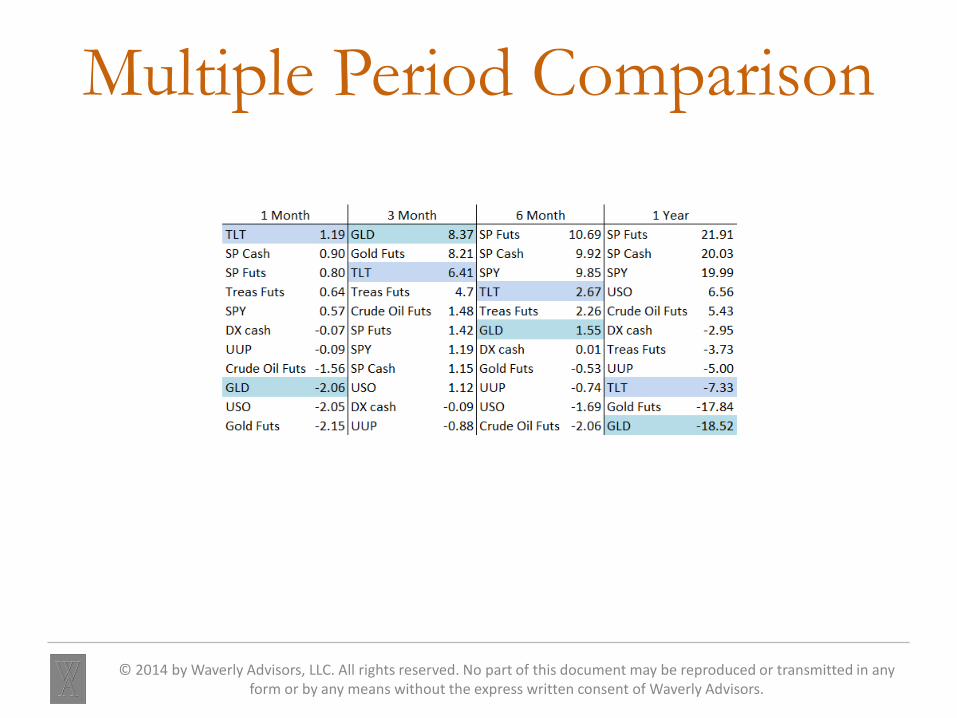
Multiple Period Comparison
© 2014 by Waverly Advisors, LLC. All rights reserved. No part of this document may be reproduced or transmitted in any form or by any means without the express written consent of Waverly Advisors.
Things to Think About Are you comparing apples to apples?
– Currency considerations.
Are you accounting for dividends, splits, and other corporate actions?
If you are using futures, do you understand the rolls? – Two methods: Differenced: Cannot use for returns or percentages. Ratio-adjusted: Can use for percentage measurements.
A return is a measurement over a specific time window. – It is sensitive to what happens on both ends of the time
window.
© 2014 by Waverly Advisors, LLC. All rights reserved. No part of this document may be reproduced or transmitted in any form or by any means without the express written consent of Waverly Advisors.

Possible Distortions
© 2014 by Waverly Advisors, LLC. All rights reserved. No part of this document may be reproduced or transmitted in any form or by any means without the express written consent of Waverly Advisors.

One Possible Solution Rather than use a simple measurement of return,
average several periods’ returns. – A good discussion can be found in O’Neil (William O’Neil:
How to Make Money in Stocks, 4th ed. 2009), but many other authors use similar tools.
Many options: – Use as few as two or many more periods. – Weighted or unweighted. – Can implicitly weight by period selection: E.g., 1 week, 2 week, 1 month, 1 year is front weighted E.g., 1 month, 1 year, 1.5 year, 2 year is back weighted
© 2014 by Waverly Advisors, LLC. All rights reserved. No part of this document may be reproduced or transmitted in any form or by any means without the express written consent of Waverly Advisors.
Waverly Advisors’ Relative Strength We use a front-weighted multi-period relative
strength measure. Periods and calculation are proprietary, but there is
no secret sauce. – The measurement was crafted to be coherent with and to
support our trading style, not because it is better than any other.
We use this as an idea generation tool and as a filter for other trades.
© 2014 by Waverly Advisors, LLC. All rights reserved. No part of this document may be reproduced or transmitted in any form or by any means without the express written consent of Waverly Advisors.
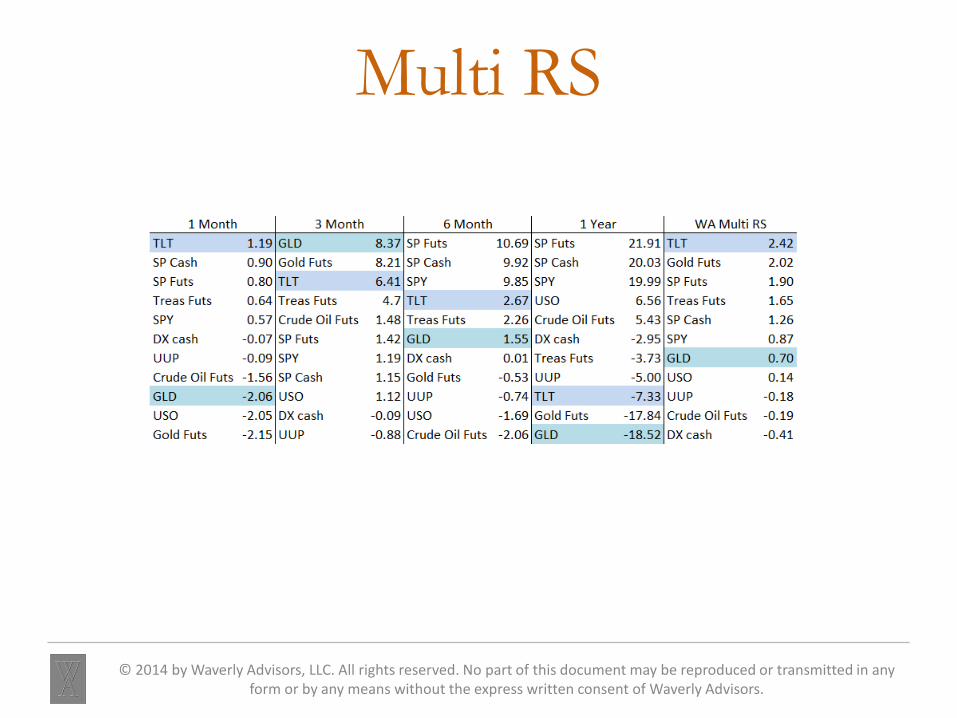
Multi RS
© 2014 by Waverly Advisors, LLC. All rights reserved. No part of this document may be reproduced or transmitted in any form or by any means without the express written consent of Waverly Advisors.
Ranked RS The actual RS value may not be especially meaningful.
– This shouldn’t be surprising: relative strength!
Can simply compare a list of RS values to each other to get a RS ranking.
It is also possible to compare stocks relative to a stock universe.
We do this with a non-parametric ranking: – Create the raw RS measure for each stock in the S&P 500 – Create the raw RS measure for the test stock. – Express the test stock’s RS as a percentile of the S&P 500. Can also be outside the range of the S&P 500
© 2014 by Waverly Advisors, LLC. All rights reserved. No part of this document may be reproduced or transmitted in any form or by any means without the express written consent of Waverly Advisors.
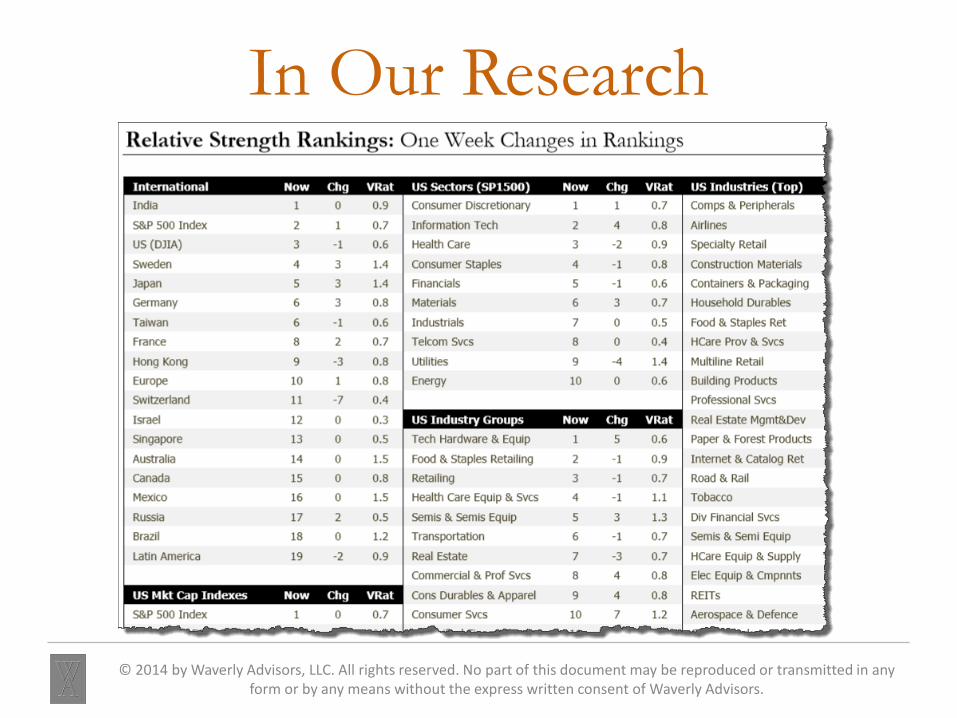
In Our Research
© 2014 by Waverly Advisors, LLC. All rights reserved. No part of this document may be reproduced or transmitted in any form or by any means without the express written consent of Waverly Advisors.
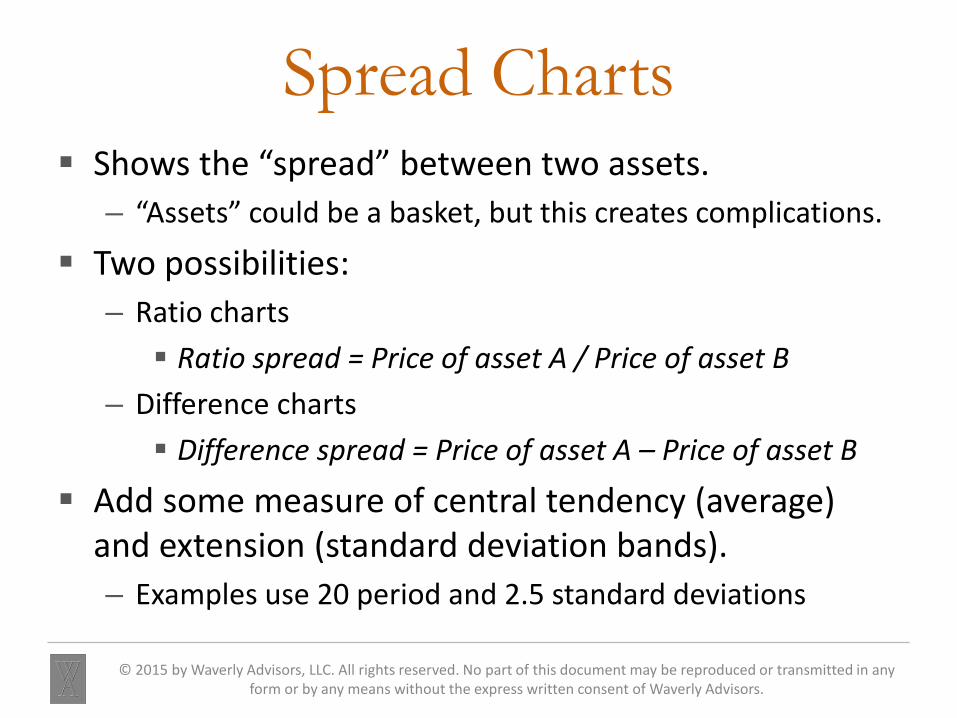
Spread Charts Shows the “spread” between two assets.
– “Assets” could be a basket, but this creates complications.
Two possibilities: – Ratio charts Ratio spread = Price of asset A / Price of asset B
– Difference charts Difference spread = Price of asset A – Price of asset B
Add some measure of central tendency (average) and extension (standard deviation bands). – Examples use 20 period and 2.5 standard deviations
© 2015 by Waverly Advisors, LLC. All rights reserved. No part of this document may be reproduced or transmitted in any form or by any means without the express written consent of Waverly Advisors.
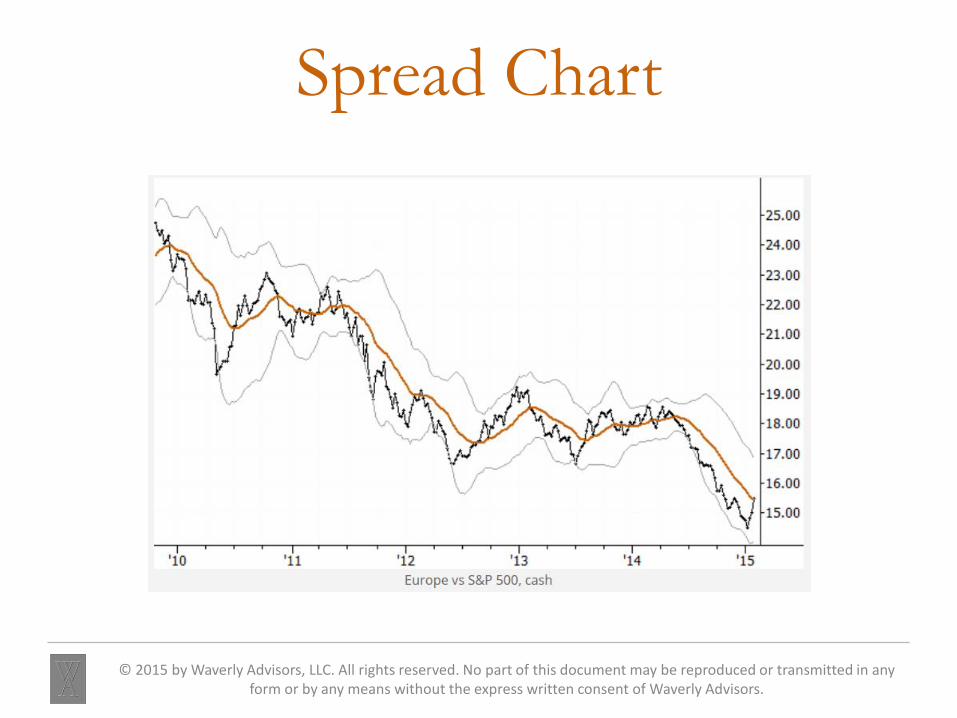
Spread Chart
© 2015 by Waverly Advisors, LLC. All rights reserved. No part of this document may be reproduced or transmitted in any form or by any means without the express written consent of Waverly Advisors.
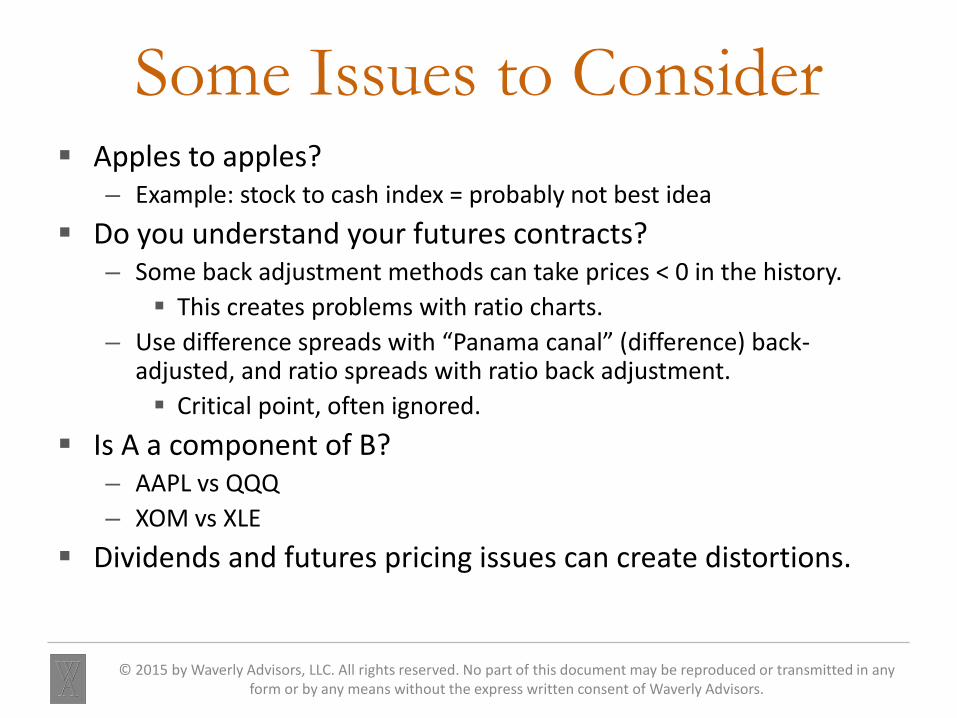
Some Issues to Consider Apples to apples?
– Example: stock to cash index = probably not best idea Do you understand your futures contracts?
– Some back adjustment methods can take prices < 0 in the history. This creates problems with ratio charts.
– Use difference spreads with “Panama canal” (difference) back-adjusted, and ratio spreads with ratio back adjustment. Critical point, often ignored.
Is A a component of B? – AAPL vs QQQ – XOM vs XLE
Dividends and futures pricing issues can create distortions.
© 2015 by Waverly Advisors, LLC. All rights reserved. No part of this document may be reproduced or transmitted in any form or by any means without the express written consent of Waverly Advisors.
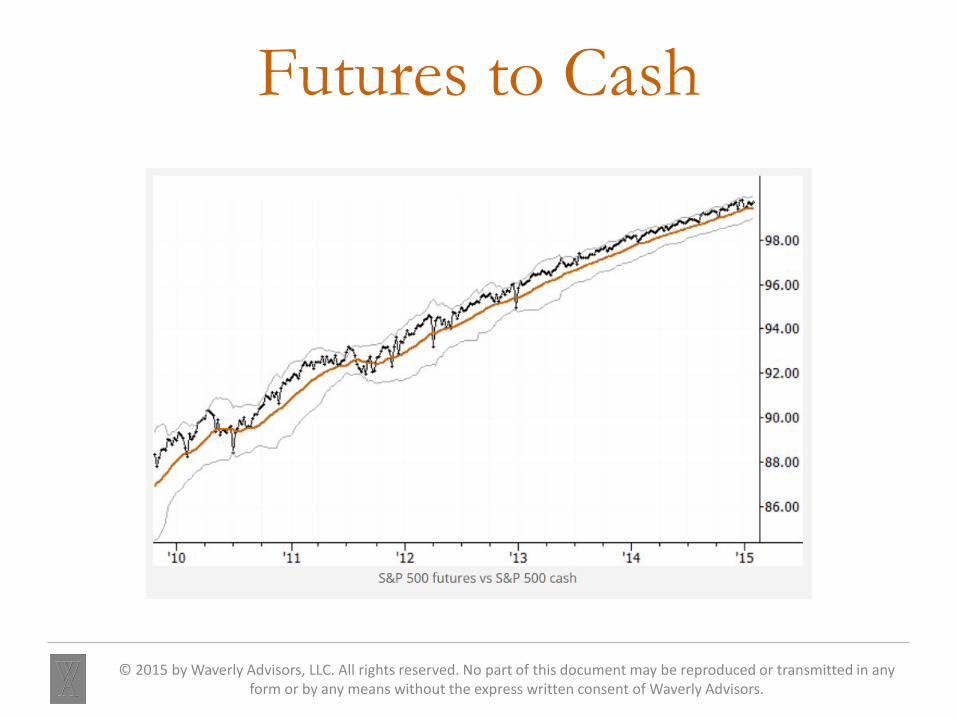
Futures to Cash
© 2015 by Waverly Advisors, LLC. All rights reserved. No part of this document may be reproduced or transmitted in any form or by any means without the express written consent of Waverly Advisors.
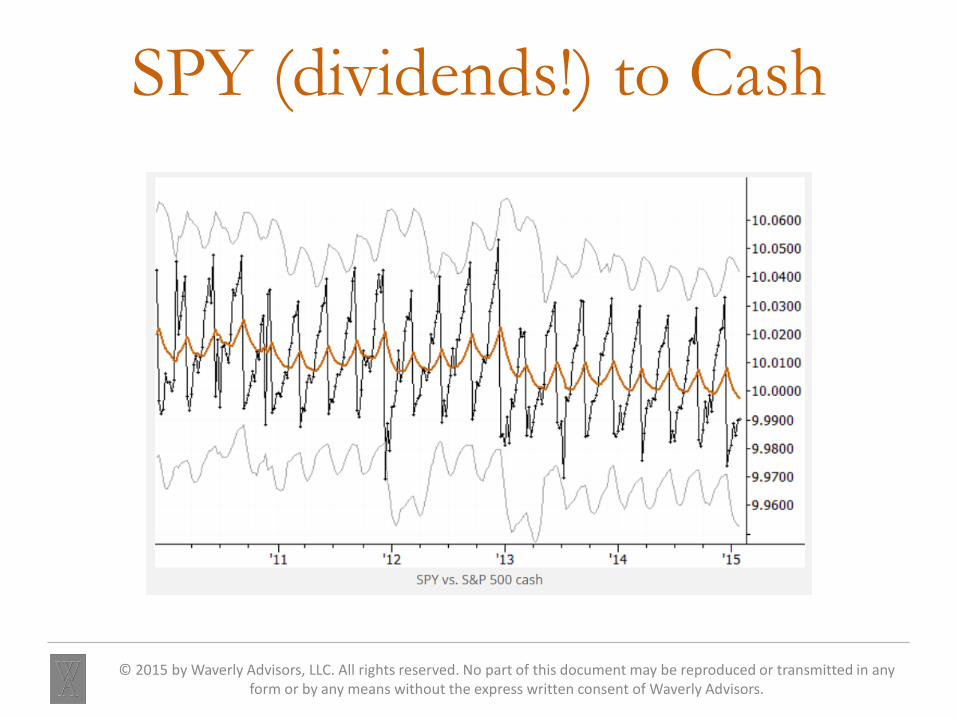
SPY (dividends!) to Cash
© 2015 by Waverly Advisors, LLC. All rights reserved. No part of this document may be reproduced or transmitted in any form or by any means without the express written consent of Waverly Advisors.
Where to Find Tradable Spreads Stocks
– Share classes – Similar companies – Index vs components – Stock vs market (think about what you are trying to do)
Futures – Intercommodity (different months) – Intracommodity (ex. Gold / Silver, Crack or Crush spreads)
Currencies – Can be a complicating factor in other trades
© 2015 by Waverly Advisors, LLC. All rights reserved. No part of this document may be reproduced or transmitted in any form or by any means without the express written consent of Waverly Advisors.
General Concepts in Trading There are, broadly, three kinds of spreads
– Mean-reverting – Trending – Changing
Many spreads wander between these categories over their price history, but when and how they change regimes is important.
Do not assume that all spreads mean revert! When you “think that” the spread is going up, be
long A and short B, and vice versa for a declining spread.
© 2015 by Waverly Advisors, LLC. All rights reserved. No part of this document may be reproduced or transmitted in any form or by any means without the express written consent of Waverly Advisors.
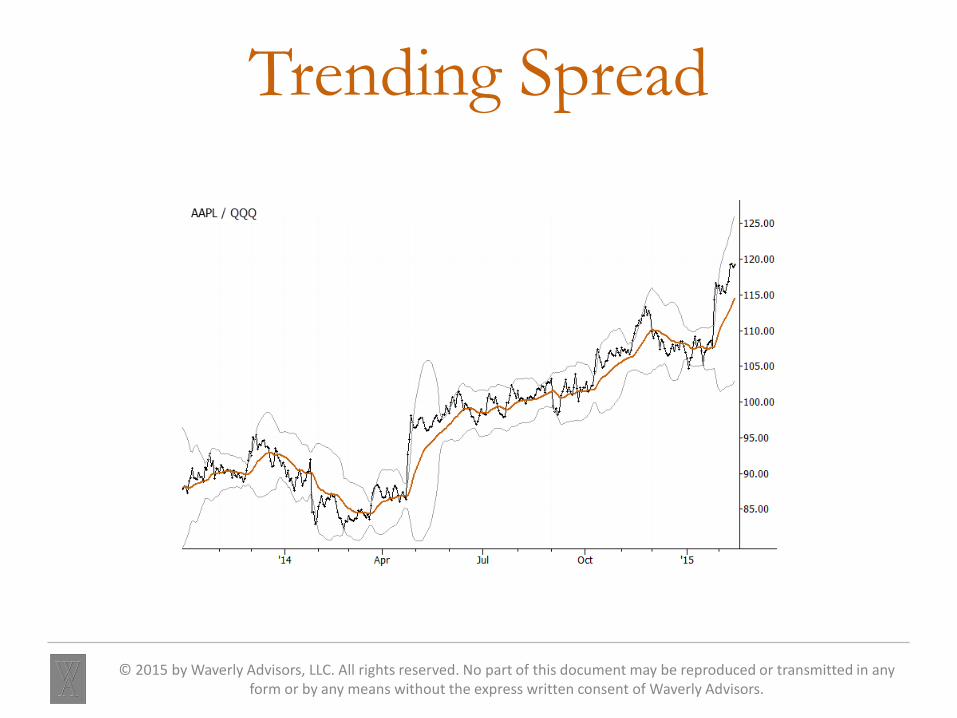
Trending Spread
© 2015 by Waverly Advisors, LLC. All rights reserved. No part of this document may be reproduced or transmitted in any form or by any means without the express written consent of Waverly Advisors.
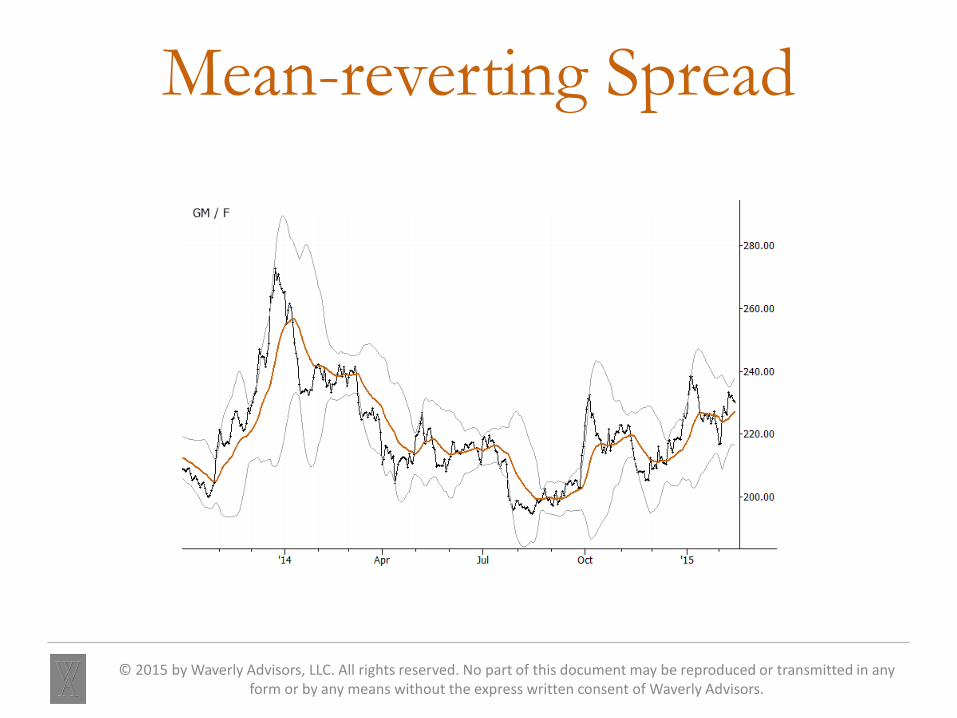
Mean-reverting Spread
© 2015 by Waverly Advisors, LLC. All rights reserved. No part of this document may be reproduced or transmitted in any form or by any means without the express written consent of Waverly Advisors.
Trading Considerations Spread relationships have a bid/ask, just like assets. Make sure your spread chart shows a relationship
that is bigger than that bid/ask spread! – Seems basic, but charts scale so that small moves may look
the same.
Spread charts generally assume rebalancing each period, and may not track P&L over longer timeframes? – Is this an issue? Depends.
© 2015 by Waverly Advisors, LLC. All rights reserved. No part of this document may be reproduced or transmitted in any form or by any means without the express written consent of Waverly Advisors.
Trading Considerations (2) Size can create risk in spreads that might not be present
in outrights. You must truly understand your spread trades.
– Cointegration, if appropriate – Pending corporate actions – Crop year issues with commodities – Etc.
Volatility of one asset can change suddenly and dramatically. – What can make this happen? What is predictable what is not?
Historical relationships can drift apart for many reasons. There is no free lunch! There is always risk.
© 2015 by Waverly Advisors, LLC. All rights reserved. No part of this document may be reproduced or transmitted in any form or by any means without the express written consent of Waverly Advisors.
Summary Relative value tools show the relationship between
markets. There is information in relationships that might not
be apparent in the simple price path of one assets. Many possibilities for trading these, but it is
important to understand the risks. It is important to understand the nuances and details
of any tool you use.
© 2015 by Waverly Advisors, LLC. All rights reserved. No part of this document may be reproduced or transmitted in any form or by any means without the express written consent of Waverly Advisors.
Waverly Advisors’ Research Specific systems, broad tendencies, and actionable
ideas in major liquid markets. – Futures – Currencies – Stocks (indexes and individual names)
Both trend-following and counter-trend components. Applicable to traders working on all timeframes.
– day traders—swing traders—investors
© 2014 by Waverly Advisors, LLC. All rights reserved. No part of this document may be reproduced or transmitted in any form or by any means without the express written consent of Waverly Advisors.
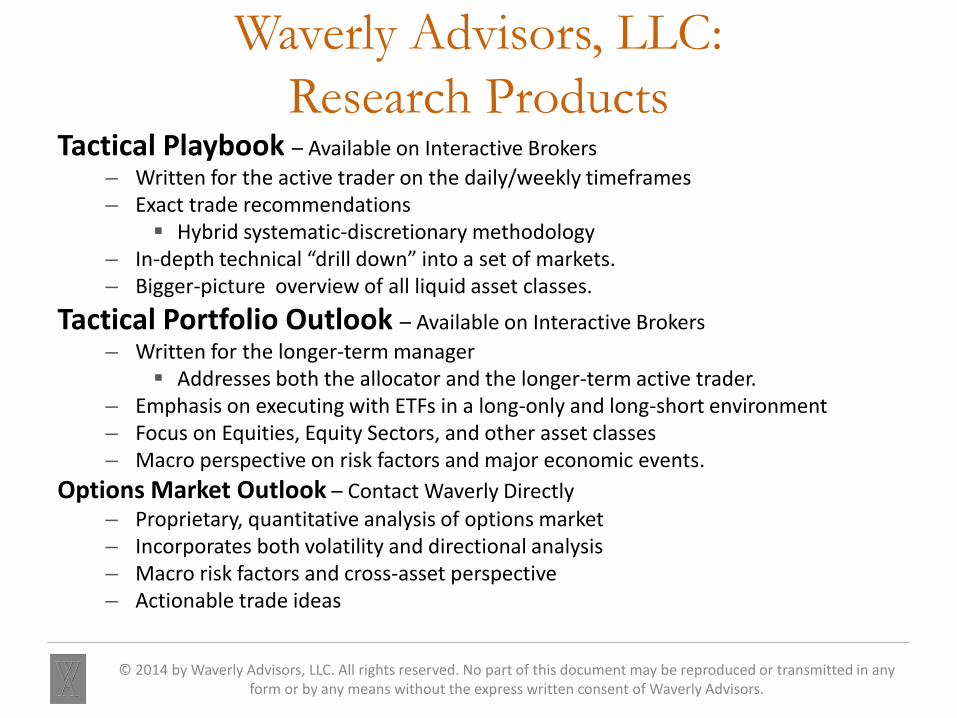
Waverly Advisors, LLC: Research Products
Tactical Playbook – Available on Interactive Brokers – Written for the active trader on the daily/weekly timeframes – Exact trade recommendations
Hybrid systematic-discretionary methodology – In-depth technical “drill down” into a set of markets. – Bigger-picture overview of all liquid asset classes.
Tactical Portfolio Outlook – Available on Interactive Brokers – Written for the longer-term manager
Addresses both the allocator and the longer-term active trader. – Emphasis on executing with ETFs in a long-only and long-short environment – Focus on Equities, Equity Sectors, and other asset classes – Macro perspective on risk factors and major economic events.
Options Market Outlook – Contact Waverly Directly – Proprietary, quantitative analysis of options market – Incorporates both volatility and directional analysis – Macro risk factors and cross-asset perspective – Actionable trade ideas
© 2014 by Waverly Advisors, LLC. All rights reserved. No part of this document may be reproduced or transmitted in any form or by any means without the express written consent of Waverly Advisors.

© 2014 by Waverly Advisors, LLC. All rights reserved. No part of this document may be reproduced or transmitted in any form or by any means without the express written consent of Waverly Advisors.
My Blog
© 2014 by Waverly Advisors, LLC. All rights reserved. No part of this document may be reproduced or transmitted in any form or by any means without the express written consent of Waverly Advisors.
http://adamhgrimes.com/blog/

Contact:
© 2014 by Waverly Advisors, LLC. All rights reserved. No part of this document may be reproduced or transmitted in any form or by any means without the express written consent of Waverly Advisors.
Waverly Advisors 5607 Pittsford-Palmyra Rd. 1034
Pittsford, NY 14534
(607) 684-5300
www.waverlyadvisors.com [email protected]
Adam Grimes Managing Partner, Chief Investment Officer [email protected] Chris Noye Managing Partner [email protected]
40
Interactive Brokers Group Highlights
Prime Broker Highlights Global Trading in a Universal Account®
Availability of Portfolio Margin
Low, Transparent Commissions and Financing
Advanced Allocation and Analysis Technology and Automated Risk Management
Innovative Securities Lending Solutions
Flexible Reporting
41
Strength and Security Facts about Interactive Brokers
• On a consolidated basis, at December 2014 Interactive Brokers Group (IBG) had $5.2 billion in equity capital.
IBG has reported solidly positive earnings for the past 20 consecutive years.
IBG holds no material positions in over-the-counter securities or derivatives.
IBG holds no CDOs, MBS, or CDS.
The gross amount of IBG’s portfolio of debt securities, with the exception of U.S. government securities, is less than 10% of our equity capital.
Interactive Brokers LLC’s Real-Time Margin system continuously enforces trading limits
Risk Management Our sophisticated risk-assessment technology helps you manage your risk in dynamic markets.
Risk Navigator℠ A real-time market-risk management platform provides a measure of risk exposure across
multiple asset classes.
Credit Manager Advanced risk management technology working behind
the scenes to manage risk and enforce credit-related
regulations.
Real Time Activity Monitor
lets you monitor every aspect of your account activity, including the
values used in IB's margin calculations.

Contact Information Mike Brady Interactive Brokers – Institutional Sales Office: (312) 542-6851 Mobile: (312) 550-4761 Fax: (312) 984-1005 [email protected] 209 South LaSalle Street Eleventh Floor Chicago, IL 60604