relevance of financial reporting and disclosure for financial … · 2013. 6. 17. · relevance of...
TRANSCRIPT
Cahier de recherche 2013-04
Relevance of Financial Reporting and Disclosure for Financial Markets under IFRS: Some Canadian Evidence
Denis Cormier, ESG UQAM
July 2013
We acknowledge financial support from l’Autorité des marchés financiers (Québec) and PWC. All usual caveats apply. *Corresponding address:
P.O. Box 8888, downtown station Montréal, Québec, Canada H3C 2P8 [email protected] Tel: 514 987 3000 (ext. 8358)
Relevance of Financial Reporting and Disclosure for Financial Markets under IFRS: Some Canadian Evidence
Abstract This paper investigates the properties of financial reporting and disclosure in Canada under IFRS. This paper provides some evidence that moving from Canadian GAAP to IFRS has reduced the information gap between managers and investors. More specifically, results suggest that compared with Canadian GAAP, under IFRS: (1) the value relevance of earnings is enhanced; (2) Non-GAAP measures have a greater impact on the value relevance of earnings; (3) Financial statement notes have a greater impact on the value relevance of earnings; (4) earnings have a greater impact on the cost of finance; (4) stock markets’ capacity to anticipate future earnings is enhanced, and (5), a slight decrease in earnings management is observed under IFRS. Overall, results suggest that IFRS self-proclaimed goal of providing investors with relevant information is achieved in the Canadian context.
Key words: IFRS, non-GAAP, reliability, predictability, value relevance.
Pertinence de l’information financière en IFRS pour les marchés boursiers : Le cas du Canada
Cet article étudie les propriétés de l’information financière au Canada en vertu des IFRS. Les résultats de la présente étude laissent à penser que le passage des PCGR canadiens aux IFRS a réduit l'écart informationnel entre les gestionnaires et les investisseurs. Plus précisément, les résultats tendent à montrer que, comparativement aux PCGR du Canada, en vertu des IFRS: (1) la pertinence des résultats pour la valorisation boursière est renforcée; (2) Les mesures non-GAAP ont plus d'impact sur la pertinence des résultats; (3) les notes afférentes aux états financiers ont un plus grand impact sur la pertinence des résultats; (4) le résultat comptable a un impact plus important sur le coût de financement; (4) la capacité de marchés boursiers à anticiper les résultats futurs est améliorée, et (5), une légère diminution de la gestion des résultats est observé en vertu des IFRS. Dans l'ensemble, les résultats laissent à penser que l’objectif autoproclamé du référentiel IFRS de fournir aux investisseurs des informations pertinentes est réalisé dans le contexte canadien.
Mots clés : Fiabilité, IFRS, non-GAAP, valorisation boursière, valeur prédictive.
Introduction
The advent of global economies requires stock market participants to compare
firms across countries. To achieve that goal, financial statements remain a key source of
information for financial analysts and investors. In that regard, the perceived need for
harmonization and comparability in financial statements has led to the emergence of
International Financial Reporting Standards (IFRS) as the dominant reference for
financial reporting in most countries around the world. Canada has joined those countries
in 2011for organizations that are publicly accountable.
IFRS adoption raises some questions. For instance, do IFRS meet their stated
goals with respect to financial statements such as improving their relevance, quality, and
comparability? The move toward IFRS confirms the primacy of financial markets in the
determination of accounting standards, with the relevance of financial statements being
mostly defined in terms of how useful they are to equity investors. Stewardship, or the
use of accounting information for contractual purposes, is now relegated to a secondary
role in the determination of accounting standards (Cormier et al., 2007).
The relevance of accounting information can be evaluated through various
measures such as its impact on stock prices, on the accuracy of analyst forecasts, the cost
of finance, analyst following, investment strategies, etc. First, with respect to stock
prices, it appears that IFRS-based financial statements map into how investors assess a
firm’s stock market value. For instance, there is evidence that the IFRS adjustments
reported by French firms for 2004 are useful to investors’ in their assessment of a firm’s
stock market value (financial statements prior to 2005 prepared according to domestic
standards needed to be reconciled with IFRS). Moreover, in the United Kingdom, firms
reporting IFRS earnings that were lower than those computed according to UK GAAP
were penalized by the stock market (Cormier et al., 2009; Horton and Sarafeim, 2010).
Second, there is some evidence that a switch from domestic standards to IFRS has
a modest positive impact on market liquidity and the cost of equity capital, most likely
resulting from the reduction in information asymmetry between investors and managers
following the implementation of IFRS (Daske et al., 2008; Bruggermann et al., 2909).
However, firms that voluntarily adopt IFRS ahead of the mandated year of adoption
experience a stronger improvement in the liquidity of their stock and in their cost of
capital than firms that only adopt IFRS at the required date. Therefore, it is unlikely that
IFRS adoption in itself drives the improvement in the information set that is available to
investors: other regulatory or institutional changes probably take precedence.
Third, the use of IFRS information allows firms to improve their coverage by
foreign financial analysts as well as the accuracy of their forecasts, especially in countries
with high investor protection (Byard et al., 2011). This increase in relevance for stock
markets is observed for firms highly followed by analysts.
Fourth, investors react to the release to IFRS information by rebalancing their
portfolios. Investors who rely more extensively on fundamental analysis or accounting
data (foreign investors, value investors) use IFRS-derived financial statements to sell or
buy specific securities, much more so than when just domestic standards were used and,
on average, increase equity ownership in these firms after IFRS adoption (Florou and
Pope, 2012).

Finally, the level of details in financial reporting under IFRS is higher than under
local GAAP including Canadian GAAP. Under IFRS, income statement items are
detailed in terms of nature (depreciation, purchases of materials, transport costs,
employee benefits, and advertising costs) and function (cost of sales, cost of distribution).
We also observe more notes and more detailed notes under IFRS. This should provide
additional relevant information to market participants.
Overall, we infer that IFRS financial statements do offer relevant information to
investors, thus providing some potentially useful hints as to what Canadian firms and
markets may expect from IFRS adoption. However, it is difficult also to disseminate the
information contained in the accounting numbers themselves from the additional
information provided in the notes or other financial disclosure: is the IFRS effect driven
by better measurement or better disclosure? This is why we will confront earnings figure
with non-GAAP measures and the details in financial statement notes under IFRS.
A few studies compare the levels of discretionary accruals pre- and post-IFRS
adoption for different countries (e.g. Garcia et al., 2009). Overall, it can be inferred that
at both the country and firm levels, the adoption of IFRS does not translate into an
improvement of the quality of financial reporting, as measured by discretionary accruals.
Effective enforcement by institutional and market forces is necessary to ensure that IFRS
adoption leads to an improvement in the quality of financial statements. Post-IFRS, the
rankings of these countries do not substantially change, with earnings quality at the
aggregate level not varying substantially. Therefore, while, in appearance, firms from
different countries present their financial statements in a format that looks comparable,
the numbers reported in these financial statements are not necessarily more comparable
than they were prior to the adoption of IFRS: major differences in measurement,
recognition, audit and market monitoring practices still remain post-IFRS. Hence, beyond
IFRS adoption, its actual implementation and the enforcement of such implementation
play a critical role in ensuring that informational benefits from IFRS flow to investors
and other market participants. In this paper, we compare the level of earnings
management under Canadian GAAP and IFRS without predictions.
Our main results are the following. First, compared with Canadian GAAP, under
IFRS, the value relevance of earnings is enhanced and earnings have a greater impact on
the cost of finance. Second, Non-GAAP measures and the detail in financial statement
notes have a greater impact on the value relevance of earnings. Third, as for stock
markets’ capacity to anticipate future earnings, our results suggest that, under IFRS,
current earnings are more in tune with economic performance as reflected by stock
returns (current and lag). There is a better link between prior stock returns and current
earnings. Finally, we observe a slight decrease in earnings management under IFRS. The
degree of details warranted under IFRS could refrain managers from accrual
management. Overall, results suggest that IFRS self-proclaimed goal of providing
investors with relevant information is achieved in the Canadian context.
Our paper contributes to the literature in capital markets and IFRS in the following
ways. First, as far as we know, this study is the first to assess the value relevance of
earnings under IFRS considering other disclosure measures such as non-GAAP. Second,
this paper is also the first to discriminate earnings numbers and the detail in financial
statement notes in assessing the value relevance of earnings under IFRS. Third, including
in the sample firms that are not affected by a change in the set of GAAP ensure that our
results are not altered by some economic factors affecting the periods of investigation.
Overall, we feel that this study contributes to the debate on the merits and disadvantages
of IFRS for stock market participants.
The remainder of the paper is organized as follows. Section 2 presents the
theoretical background and the development of hypotheses. The study’s method is
described in section 3. Results are presented in section while section 5 provides a
discussion of the potential implications of the results.
2. Background and hypotheses
There is some evidence that a shift from domestic GAAP to IFRS has a modest
positive effect on the market liquidity and the cost of equity capital. Such improvement
results from a reduction in information asymmetry between managers and investors
following the adoption of IFRS. This reduction in asymmetry is attributable to higher
quality financial reporting, higher analyst following and greater oversight by auditors and
directors from the use of a common reference in accounting (Daske et al., 2008;
Bruggerman et al., 2009; Li, 2010). For example, in the UK, at the transition to IFRS,
firms reporting IFRS earnings lower than earnings computed according to UK GAAP
were penalized by the stock market (Horton and Serafeim, 2010). In the context of
Australia, another country categorized by strong enforcement, using a longitudinal study
that covers pre-IFRS and post-IFRS periods during 1990 to 2008, Chalmers et al.’s
(2011) findings show an increase in the value relevance of earnings under IFRS. Their
study suggests that even for a country categorized by strong investor protection and high-
quality financial reporting and enforcement, IFRS adoption affects the associations
between accounting information and stock market value.
In the French context, Cormier et al. (2009) show that IFRS mandatory equity
adjustments at the adoption date are more valued than French GAAP equity, suggesting
that the first-time adoption of IFRS by French firms is perceived as a signal of increase in
the quality of their financial statements. In the case of earnings reconciliation adjustment
following IFRS adoption, Platikanova (2009) shows that the bid/ask spread has decreased
in France, but, not in Germany, Sweden, and in the UK.
Armstrong et al. (2010) study European stock market reactions to specific events
associated with the adoption of IFRS by 18 countries. Based on a three-day market-
adjusted return centered on 16 events, they find an incrementally positive reaction for
firms with lower pre-adoption accounting disclosure quality, and with higher pre-
adoption information asymmetry. This is consistent with investors expecting net
information quality benefits from IFRS adoption. They also find an incrementally
negative reaction for firms in code law countries, consistent with investors’ concerns over
enforcement of IFRS in those countries compared with common law countries.
IFRS confer accounting discretion in financial reporting, especially with the
introduction of fair value accounting. Jeanjean and Stolowy (2008) analyze the effect of
the mandatory introduction of IFRS standards on earnings management for three
countries: Australia, France, and the UK. They find that the pervasiveness of earnings
management did not decline after the introduction of IFRS, and, in fact, increased in

France. Their findings suggest that management incentives and national institutional
factors play an important role in framing financial reporting characteristics.
Chen et al. (2010) compare the accounting quality of publicly listed firms in 15
member states of the European Union before and after the full adoption of IFRS in 2005.
They use five indicators as proxies for accounting quality, namely, earnings smoothing,
earnings management toward targets, the magnitude of absolute discretionary accruals,
accruals quality, and timely loss recognition. Their results are mixed. They find that the
majority of accounting quality indicators improved after IFRS adoption in the European
Union. However, they find that firms engage in more earnings smoothing and recognize
large losses in a less timely manner in post-IFRS periods.
Horton et al. (2013), also for a European sample, and Tan et al. (2011), for an
international sample, find an improvement in the information environment during the
mandatory transition period to IFRS. More specifically, investors can be better at
detecting earnings management as a result of a change in the information environment
following IFRS adoption, i.e. more financial analysts following a firm and lower forecast
errors. Prior findings in the UK suggest that IFRS adoption has increased the amount of
information available to investors but, at the same time, has created more uncertainty
among financial analysts about earnings forecasts. In this vein, Iatridis (2010) shows that
due to the fair value orientation of IFRS, the transition to IFRS appeared to introduce
volatility in British earnings figures. Prior research suggests that the benefits of IFRS

adoption primarily accrue to countries with strong enforcement, being a key component
of success in the implementation of a new reporting regime (e.g. Byard et al., 2011).1
Byard et al. (2011), based on a European sample, find that analysts’ absolute
forecast errors and forecast dispersion decrease relative to a control sample only for those
mandatory IFRS adopters domiciled in countries with both strong enforcement regimes
and domestic accounting standards that differ significantly from IFRS.2 Considering that
Canada is a country with a strong enforcement, IFRS should lead to positive outcomes for
investors.
Concerning non-GAAP measures, the International Accounting Standards Board (IASB)
have tried to deal with the issue of non-GAAP measures by issuing regulations which require
entities to clearly label these numbers as non-GAAP, setting requirements to present them outside
the financial statements (in MD&A) and requiring reconciliation of the non-GAAP numbers to
reported GAAP numbers (Key points from the January 2012 IFRS Discussion Group). However,
how and to what extent regulators have issued regulations on this differs between jurisdictions.
In the Canadian context, and prior to IFRS adoption, Cormier et al. (2011) focus
on a non-GAAP performance measure labeled distributable cash, which purports to
represent the amount of cash a flow-through entity such as a REIT (Real Estate Income
Trusts) is capable of distributing to its investors on a sustaining basis. They find that
distributable cash is deemed to be value relevant by investors, relegating audited GAAP
earnings to a secondary role. However, distributable cash’s measurement is subject to
1 Based on a sample of European countries that adopted IFRS, Li (2010) finds that the reduction in the cost of equity capital following the adoption of IFRS is present only in countries with strong legal enforcement. 2 Byard et al. (2011) document a score of 1.6 for Law enforcement in France versus 1.3 in the UK (the median sample countries’ score is 1.6) and 12 differences between domestic accounting standards and IFRS in France versus 1 difference in the UK.

extensive managerial discretion, is unaudited and is unverifiable by investors. In this
regard, the authors document that reported levels of distributable cash exhibit a
smoothing pattern, thus ensuring stable cash distributions to investors. They show also
that managerial incentives (stock option holdings) and corporate governance (board and
ownership) variables affect the level of reported distributable cash. They infer that
investors, lacking details about underlying measurement assumptions, do not seem able
to see through managerial opportunism and seem to focus on distributable cash as
reported, discretionary or non-discretionary.
In that regard, we anticipate that IFRS make non-GAAP more reliable and thus
should increase their impact on earnings valuation by market participants. We anticipate
the same relation for financial statement notes given the higher degree of details under
IFRS.
Finally, if earnings have a greater predictive power for investors under IFRS, they
should be anticipated much before the release of the annual report under IFRS than under
Canadian GAAP.
This gives rise to the following hypotheses:
Hypothesis 1: The value relevance of earnings is greater under IFRS than under
Canadian GAAP.
Hypothesis 2: Non-GAAP measures have a greater impact on the value relevance
of earnings under IFRS than under Canadian GAAP.
Hypothesis 3: Financial statement notes have a greater impact on the value
relevance of earnings under IFRS than under Canadian GAAP.
Hypothesis 4: Earnings under IFRS have a greater impact on the cost of finance
under IFRS than under Canadian GAAP.
Hypothesis 5: Stock markets’ capacity to anticipate future earnings is greater
under IFRS than under Canadian GAAP.
3. Method
3.1 Sample
The sample is based on Canadian firms composing S&P/TSX index of the
Toronto stock exchange for years 2009 (Canadian GAAP) and 2011 (IFRS). The index
comprises 233 firms. From this sample, there are missing data for 13firms (data not
available for both years). From the sample of 220 firms, we have missing data for
forecast dispersion, forecast error and cost of debt. From the sample of 220 firms, 33
firms use the same set of GAAP for 2009 and 2011 (so-called no-change firms): 17 firms
are complying with US-GAAP and 16 firms have a year-end after April 30 or IFRS
adoption is postponed for different reasons (e.g. regulated industries). For firms with
year-end after April, the data in Compustat database are for 2009 and 2010, i.e. prior to
IFRS adoption. The sample for the purpose of comparison between Canadian GAAP and
IFRS is 187 firms (210 – 33).
For year 2010, Canadian firms must report earnings and balance sheet
reconciliations between Canadian GAAP and IFRS. However, financial statement
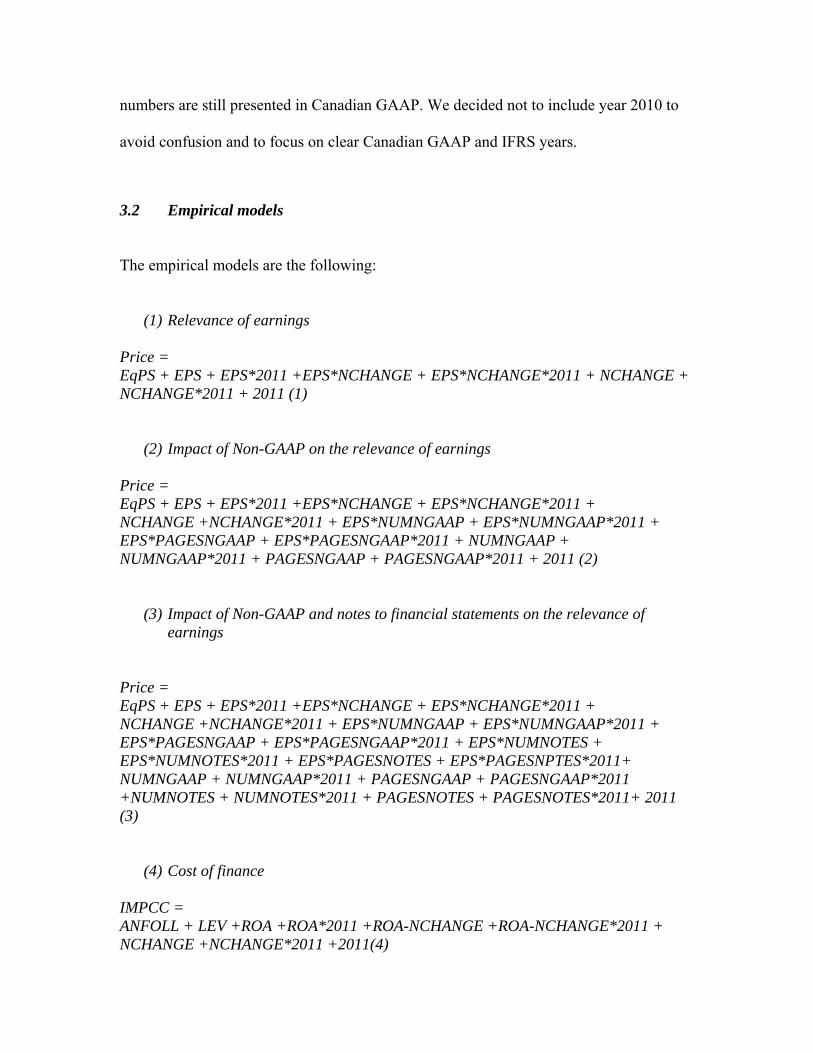
numbers are still presented in Canadian GAAP. We decided not to include year 2010 to
avoid confusion and to focus on clear Canadian GAAP and IFRS years.
3.2 Empirical models The empirical models are the following:
(1) Relevance of earnings Price = EqPS + EPS + EPS*2011 +EPS*NCHANGE + EPS*NCHANGE*2011 + NCHANGE + NCHANGE*2011 + 2011 (1)
(2) Impact of Non-GAAP on the relevance of earnings Price = EqPS + EPS + EPS*2011 +EPS*NCHANGE + EPS*NCHANGE*2011 + NCHANGE +NCHANGE*2011 + EPS*NUMNGAAP + EPS*NUMNGAAP*2011 + EPS*PAGESNGAAP + EPS*PAGESNGAAP*2011 + NUMNGAAP + NUMNGAAP*2011 + PAGESNGAAP + PAGESNGAAP*2011 + 2011 (2)
(3) Impact of Non-GAAP and notes to financial statements on the relevance of earnings
Price = EqPS + EPS + EPS*2011 +EPS*NCHANGE + EPS*NCHANGE*2011 + NCHANGE +NCHANGE*2011 + EPS*NUMNGAAP + EPS*NUMNGAAP*2011 + EPS*PAGESNGAAP + EPS*PAGESNGAAP*2011 + EPS*NUMNOTES + EPS*NUMNOTES*2011 + EPS*PAGESNOTES + EPS*PAGESNPTES*2011+ NUMNGAAP + NUMNGAAP*2011 + PAGESNGAAP + PAGESNGAAP*2011 +NUMNOTES + NUMNOTES*2011 + PAGESNOTES + PAGESNOTES*2011+ 2011 (3)
(4) Cost of finance IMPCC = ANFOLL + LEV +ROA +ROA*2011 +ROA-NCHANGE +ROA-NCHANGE*2011 + NCHANGE +NCHANGE*2011 +2011(4)

COSTDEBT = ANFOLL + LEV +ROA +ROA*2011 +ROA-NCHANGE +ROA-NCHANGE*2011 + NCHANGE +NCHANGE*2011 +2011 (5)
(5) Stock markets’ anticipation of earnings ROE = Ri t + Ri t-1 + Ri t-2 (6) Where: ANFOLL: Number of financial analysts; EPS: Earnings per share; NCHANGE: Year with no change in the set of GAAP; LEV: Leverage (financial debt/total assets); ROE: Return on equity; ROA: Return on assets; NUMNONGAAP: Number of Non-GAAP; PAGESNONGAAP: Number of pages of Non-GAAP in MD&A: IFRS: Year for financial reporting under IFRS; Ri: Stock market return.
The variable NCHANGE allows controlling for economic factors beyond the
change in the set of GAAP that could affect the stock market valuation of earnings
between 2009 and 2011.
Concerning the model of stock market anticipation of earnings, Warfield and Wild
(1992) suggest that three periods are sufficient to capture the effect of market leading
annual earnings. Our tests are based on the comparison of the estimated coefficients
across regressions. Higher estimated coefficients for the return variables would be
consistent with greater recognition of earnings by the market in the year indicated. If
earnings have a predictive power for investors, they should be anticipated much before
the release of the annual report.

3.3 Definition of variables
Implied cost of capital (IMPCC).The implied or ex ante cost of equity is a widely used to
estimate cost of equity. This measure is computed as the discount rate at which financial
analysts' predicted cash flows of the firm equal stock price, hereby capturing long-term
information asymmetry. Prior studies such Easton (2004) apply an implied cost of equity
based on estimates of financial analysts. The cost of capital is measured as the inverse of
the price-earnings-growth ratio (PEG), calculated as the square root of the difference
between the average analysts’ earnings per share forecasts for year t+1 and year t scaled
by stock price at t. This model requires EPSt and EPSt+1 to be positive and EPSt <
EPSt+1(positive growth). Therefore, we lose 119 observations for a total sample of 105
firms. The PEG-method concentrates on earnings growth of the firm, but it assumes that
there is no growth in abnormal returns after the forecast horizon. Cost of equity is
measured as follows:
t
t1t
PEPS
IMPCCEPS−
= +
Where:
IMPCC: ex ante implied cost of equity
EPS t+1 = mean analysts' earnings per share forecasts of year t+1
EPS 1 = mean analysts' earnings per share forecasts of year t
Pt = share price at the end of period t
Cost of debt. We measure cost of debt as the ratio of the interest expense to the sum of
long and short term financial debt at the beginning of the period. This proxy is similar to
the study of Francis et al. (2005).
4. Results
4.1 Descriptive statistics
Table 1 provides some descriptive statistics about sample firms’ financial
variables under Canadian GAAP versus IFRS. It appears that information asymmetry
decreases under IFRS. Hence, forecast dispersion, forecast error, cost of debt, cost of
capital, and bid-ask spreads are lower under IFRS compared with Canadian GAAP.
Moreover, consistent with prior research, firms are followed by more analysts under
IFRS than under local GAAP. We also document more details about Non-GAAP
measures as expressed by the number of pages Non-GAAP. This might be due to the fact
that IFRS require reconciliation between Non-GAAP measures with GAAP. Finally, as
expected, the level of details, as expressed by the number of notes and pages of notes to
financial statements is higher under IFRS.

Table 1
Descriptive statistics
Canadian GAAP (2009) IFRS (2011) N: 187 Mean Median Mean Median
EqPS 14.61 10.70 13.11 10.83EPS 1.10 0.57 1.49 1.02
Ri 0.059 0.058 -0.016 -0.012ANFOLL 6.79 6 8.68 8
PE 20.78 15.20 11.56 11.84ROE 0.05 0.06 0.11 0.10ROA 0.02 0.02 0.05 0.05
NUMNGAAP 2.32 2 2.5 2PAGESNGAAP 12.28 7 15.06 9.50
NUMNOTES 23.39 24 28.04 28PAGESNOTES 33.48 30 47.56 43
FORDIS (1) 0.43 0.16 0.55 0.14FORDIS (2) 0.010 0.026 0.008 0.011
FOREEROR (1) 1.182 0.457 1.027 0.300FORERROR (2) 0.085 0.028 0.031 0.014
COSTDEBT 0.052 0.037 0.049 0.036IMPCC (N: 105) 0.148 0.128 0.110 0.103
BAsk 0.686 0.444 0.386 0.258(1) Scaled by mean forecast in absolute value (2) Scaled by lag Price EqPS:Equity per share; EPS: Earnings per share; Ri: Stock market return; ANFOLL: Number of financial analysts; PE: Price/earnings ratio; NCHANGE: Year with no change in the set of GAAP; LEV: Leverage (financial debt/total assets); ROE: Return on equity; ROA: Return on assets; NUMNGAAP: Number of Non-GAAP; PAGESNGAAP: Number of pages of Non-GAAP in MD&A: IFRS: Year for financial reporting under IFRS; FORDIS: Forecast dispersion; FORERROR: Forecast error; COSTDEBT: Cost of financial debt; IMPCC: Implied cost of capital; BAsk: Bid-Ask spread.
4.2 Multivariate results
We estimate regressions using OLS with robust estimators since the test of Breusch-
Pagan / Cook-Weisberg shows the presence of heteroscedasticity. Durbin-Watson tests
do not reveal problems of autocorrelation (statistic close to 2.0 in all regressions).
Moreover, multicollinearity is not an issue in any regressions since the highest variance

of inflation factor is 4.0. Finally, we exclude from regressions all observations with
standardized residuals exceeding two.
Table 2 reports ordinary-least-square regressions with robust estimators on the
relation between earnings and stock market valuation. Consistent with hypothesis 1,
results suggest that the relevance of earnings is greater under IFRS since the coefficient
on the interaction term EPS*2011 (1.266; p < 0.05) is positive and significant. The
variable EPS-NCHANGE controls for firms that apply the same set of GAAP for 2009
and 2011. It seems that, for the same period, the impact of earnings on stock pricing is
higher for no-change firms in 2009 (1.984 + 1.944 = 3.983 versus 1.984) and lower in
2011 (1.984 + 1.266 + 1.944 – 2.257 = 2.937) compared with under IFRS (1.984 + 1.266
= 3.250). However, this difference is not statistically significant since the coefficient on
coefficient difference EPS*NCHANGE and EPS*NCHANGE*2011 is not different from
zero (F = 0.07; p < 0.793).3 Results from Table 2 show that earnings are more valued
under Canadian GAAP for firms cross-listed in a U.S. stock exchange since the
coefficient on EPS*USLISTED (1.517; p < 0.05) is positive and significant. Finally, this
situation remains under IFRS. Prior research document that, compared to Canadian and
most other national stock markets, the U.S. stock market is the most efficient in the way
information is collected and analyzed, the most liquid and the most transparent in matters
of corporate disclosure (e.g. Saudaragan and Biddle, 1992; Saudaragan and Meek, 1997).
Hence, it is not surprising to observe a higher earnings multiple for U.S. cross-listed
firms. However, we must keep in mind that, even for Canadian U.S. cross-listed firms, 3 Since No-Change firms are composed of US-GAAP compliers to a significant proportion (17 out of 33 firms), this result could indicate that IFRS equals US-GAAP for stock market valuation of earnings. However, given the small sample size of US-GAAP complying firms and given the group of No-Change also comprises Canadian GAAP compliers, this result must be interpreted cautiously.
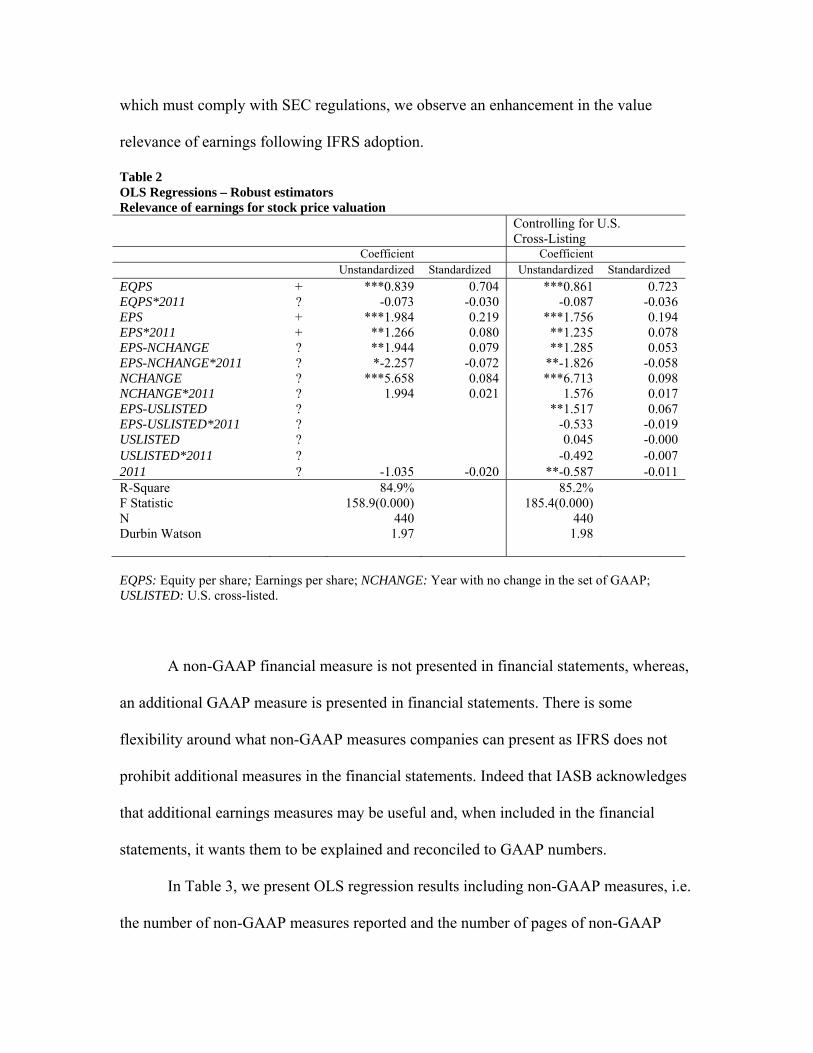
which must comply with SEC regulations, we observe an enhancement in the value
relevance of earnings following IFRS adoption.
Table 2 OLS Regressions – Robust estimators Relevance of earnings for stock price valuation Controlling for U.S.
Cross-Listing Coefficient Coefficient Unstandardized Standardized Unstandardized Standardized EQPS + ***0.839 0.704 ***0.861 0.723 EQPS*2011 ? -0.073 -0.030 -0.087 -0.036 EPS + ***1.984 0.219 ***1.756 0.194 EPS*2011 + **1.266 0.080 **1.235 0.078 EPS-NCHANGE ? **1.944 0.079 **1.285 0.053 EPS-NCHANGE*2011 ? *-2.257 -0.072 **-1.826 -0.058 NCHANGE ? ***5.658 0.084 ***6.713 0.098 NCHANGE*2011 ? 1.994 0.021 1.576 0.017 EPS-USLISTED ? **1.517 0.067 EPS-USLISTED*2011 ? -0.533 -0.019 USLISTED ? 0.045 -0.000 USLISTED*2011 ? -0.492 -0.007 2011 ? -1.035 -0.020 **-0.587 -0.011 R-Square F Statistic N Durbin Watson
84.9% 158.9(0.000)
440 1.97
85.2% 185.4(0.000)
440 1.98
EQPS: Equity per share; Earnings per share; NCHANGE: Year with no change in the set of GAAP; USLISTED: U.S. cross-listed.
A non-GAAP financial measure is not presented in financial statements, whereas,
an additional GAAP measure is presented in financial statements. There is some
flexibility around what non-GAAP measures companies can present as IFRS does not
prohibit additional measures in the financial statements. Indeed that IASB acknowledges
that additional earnings measures may be useful and, when included in the financial
statements, it wants them to be explained and reconciled to GAAP numbers.
In Table 3, we present OLS regression results including non-GAAP measures, i.e.
the number of non-GAAP measures reported and the number of pages of non-GAAP

reported. Consistent with hypothesis 2, results show that the number of non-GAAP
measures and number of pages of non-GAAP increase the association between earnings
and stock price under IFRS. Hence, interaction terms on EPS*NUMNGAAP*2011
(0.788; p < 0.01) and EPS*PAGESNGAAP*2011 (0.034; p < 0.10) are positively
associated with stock price. We also observe that the details of non-GAAP measures
under Canadian GAAP is associated negatively associated with stock pricing
EPS*NUMNGAAP (-0.465; p < 0.01) suggesting that non-GAAP are perceived as less
reliable under Canadian GAAP.
From our descriptive statistics, we observe that the level of details in financial
statements increases significantly under IFRS. The mean score of the number of notes
increase from 23 to 28 while the number of pages went from 33 to 48. In column 4 of
Table 3, we present results adding the number of notes and number of pages of notes to
financial statements. Results show that the number of pages of notes decrease the
relationship between earnings and stock market valuation under Canadian GAAP since
the coefficient on the interaction term EPS*PAGESNOTES (-0.083; p 0.01) is negative
and significant. For example, for an EPS of 1 dollar and for 30 pages of notes, the
valuation of EPS would be 1.709 in 2009 (4.199 – 0.083 X 30) and 4.049 under IFRS
(4.199 – 0.083 X 30 + 0.078 X 30).4 This is consistent with hypothesis 3.
4 Under IFRS, results (not tabulated) also show significant negative correlations between the implied cost of capital and NUMNGAAP (-0.20), PAGESNGAAP (-0.27), NUMNOTES (-0.09) and PAGESNOTES (-0.18) while, except for NUMNGAAP (-0.13), non-significant positive correlations are observed under Canadian GAAP.
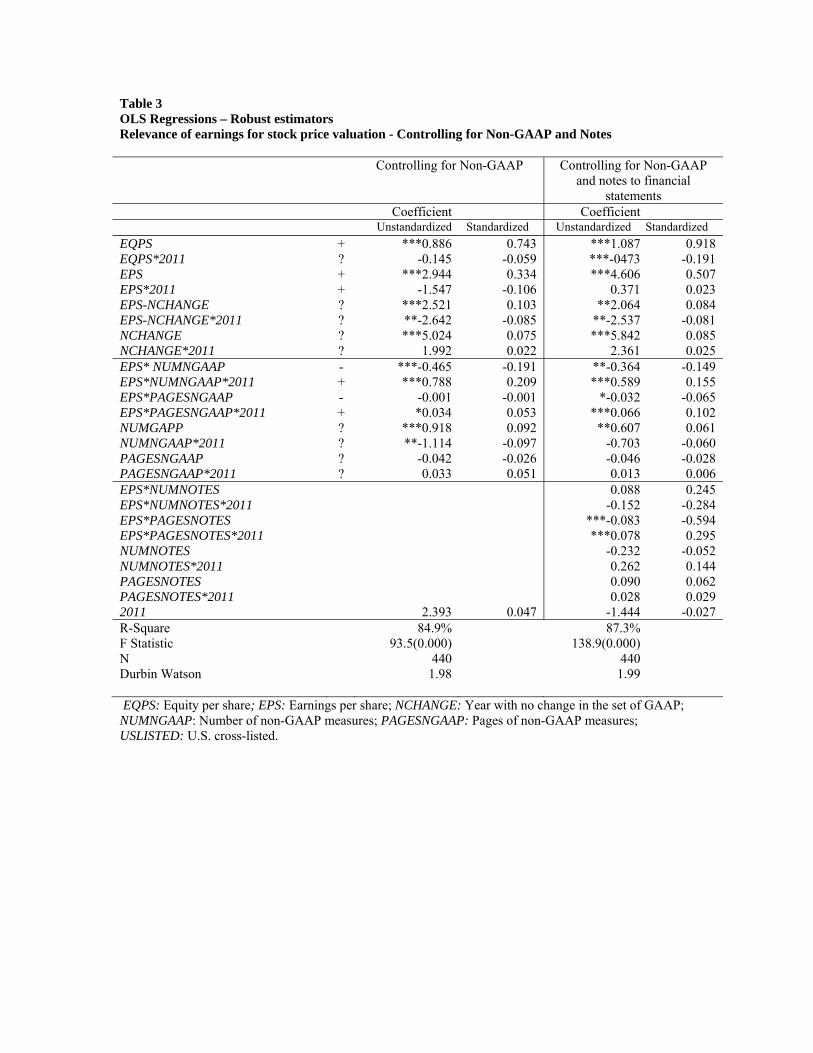
Table 3 OLS Regressions – Robust estimators Relevance of earnings for stock price valuation - Controlling for Non-GAAP and Notes Controlling for Non-GAAP Controlling for Non-GAAP
and notes to financial statements
Coefficient Coefficient Unstandardized Standardized Unstandardized Standardized EQPS + ***0.886 0.743 ***1.087 0.918 EQPS*2011 ? -0.145 -0.059 ***-0473 -0.191 EPS + ***2.944 0.334 ***4.606 0.507 EPS*2011 + -1.547 -0.106 0.371 0.023 EPS-NCHANGE ? ***2.521 0.103 **2.064 0.084 EPS-NCHANGE*2011 ? **-2.642 -0.085 **-2.537 -0.081 NCHANGE ? ***5.024 0.075 ***5.842 0.085 NCHANGE*2011 ? 1.992 0.022 2.361 0.025 EPS* NUMNGAAP - ***-0.465 -0.191 **-0.364 -0.149 EPS*NUMNGAAP*2011 + ***0.788 0.209 ***0.589 0.155 EPS*PAGESNGAAP - -0.001 -0.001 *-0.032 -0.065 EPS*PAGESNGAAP*2011 + *0.034 0.053 ***0.066 0.102 NUMGAPP ? ***0.918 0.092 **0.607 0.061 NUMNGAAP*2011 ? **-1.114 -0.097 -0.703 -0.060 PAGESNGAAP ? -0.042 -0.026 -0.046 -0.028 PAGESNGAAP*2011 ? 0.033 0.051 0.013 0.006 EPS*NUMNOTES 0.088 0.245 EPS*NUMNOTES*2011 -0.152 -0.284 EPS*PAGESNOTES ***-0.083 -0.594 EPS*PAGESNOTES*2011 ***0.078 0.295 NUMNOTES -0.232 -0.052 NUMNOTES*2011 0.262 0.144 PAGESNOTES 0.090 0.062 PAGESNOTES*2011 0.028 0.029 2011 2.393 0.047 -1.444 -0.027 R-Square F Statistic N Durbin Watson
84.9% 93.5(0.000)
440 1.98
87.3% 138.9(0.000)
440 1.99
EQPS: Equity per share; EPS: Earnings per share; NCHANGE: Year with no change in the set of GAAP; NUMNGAAP: Number of non-GAAP measures; PAGESNGAAP: Pages of non-GAAP measures; USLISTED: U.S. cross-listed.

Table 4 reports OLS regressions on the relation between earnings and cost of finance. Results suggest that the earnings has a greater effect on implied cost of capital (-0.143; p < 0.05) and cost of debt (-0.045; p < 0.05) under IFRS since the coefficient on the interaction term ROA*2011 is negative and significant under IFRS. For non-change firms, the impact on the cost of debt remains relatively stable between the two periods at -0.073, which is higher than IFRS firms (-0.045). The training process that faces investors to understand IFRS might explain this result. As for the cost of capital, non-change firms do not seem to differ from those that switched to IFRS. This result must be interpreted cautiously since we have only 18 firms classified as no-change for the computation of the cost of capital.
Table 4 OLS Regression – Robust estimators Impact of earnings on the cost of finance
IMPCC: Implied cost of capital; COSTDEBT: Cost of financial debt; ANFOLL: Number of financial analysts; NCHANGE: Year with no change in the set of GAAP; LEV: Leverage (financial debt/total assets); ROA: Return on assets.
From table 5, we show results from regressions on the stock market anticipation
of earnings. Consistent with hypothesis 5, the stock market anticipation of earnings under
IFRS appears to be greater than under Canadian GAAP. Under IFRS, stock markets
IMPCC COSTDEBT Coefficient Coefficient Unstandardized Standardized Unstandardized Standardized LEV + ***0.013 0.124ANFOLL - -0.001 -0.066 -- ROA - 0.051 0.091 -0.008 -0.031ROA*2011 - **-0.143 -0.243 **-0.045 -0.141ROA-NCHANGE ? -0.162 -0.141 **-0.073 -0.117ROA-NCHANGE*2011 ? 0.371 0.272 0.022 0.002NCHANGE ? 0.008 0.096 -0.003 -0.060NCHANGE*2011 ? -0.021 -0.189 -0.001 -0.0182011 ? -0.012 -0.175 ***0.006 0.136R-Square F Statistic N (219 firms) Durbin Watson
12.4% 2.90(0.000)
210 1.85
7.8% 4.42(0.000)
440 1.92
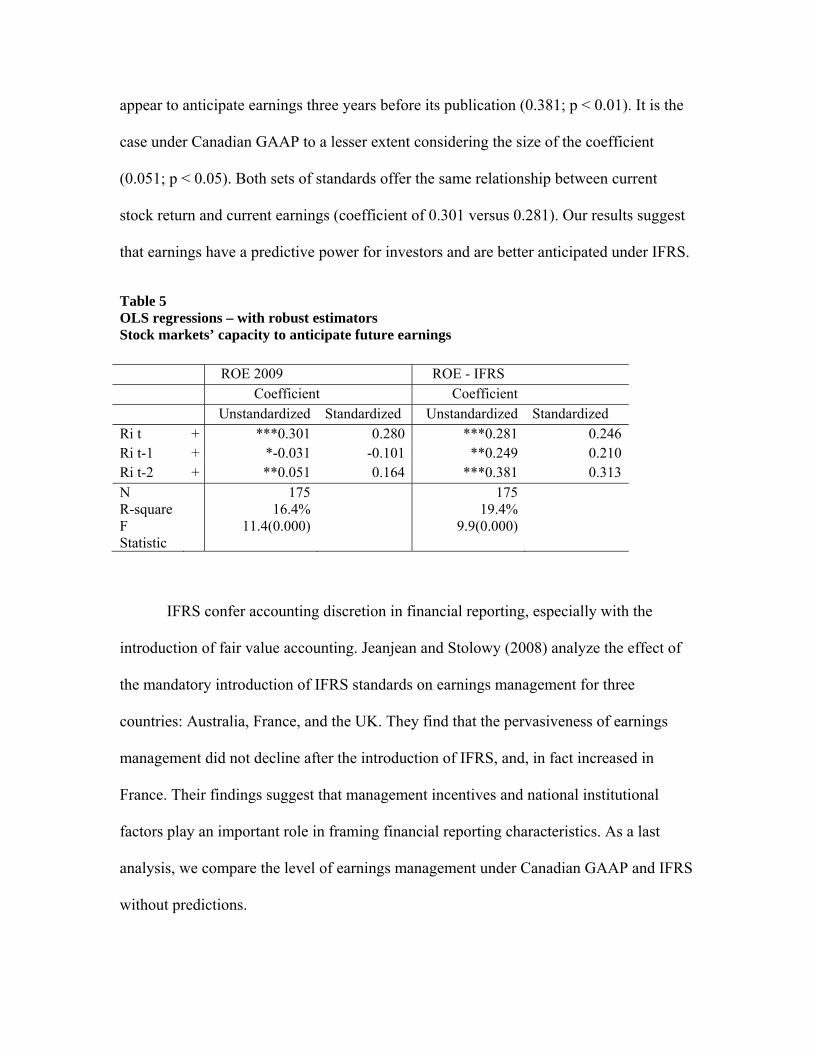
appear to anticipate earnings three years before its publication (0.381; p < 0.01). It is the
case under Canadian GAAP to a lesser extent considering the size of the coefficient
(0.051; p < 0.05). Both sets of standards offer the same relationship between current
stock return and current earnings (coefficient of 0.301 versus 0.281). Our results suggest
that earnings have a predictive power for investors and are better anticipated under IFRS.
Table 5 OLS regressions – with robust estimators Stock markets’ capacity to anticipate future earnings ROE 2009 ROE - IFRS Coefficient Coefficient Unstandardized Standardized Unstandardized Standardized Ri t + ***0.301 0.280 ***0.281 0.246 Ri t-1 + *-0.031 -0.101 **0.249 0.210 Ri t-2 + **0.051 0.164 ***0.381 0.313 N R-square F Statistic
175 16.4%
11.4(0.000)
175 19.4%
9.9(0.000)
IFRS confer accounting discretion in financial reporting, especially with the
introduction of fair value accounting. Jeanjean and Stolowy (2008) analyze the effect of
the mandatory introduction of IFRS standards on earnings management for three
countries: Australia, France, and the UK. They find that the pervasiveness of earnings
management did not decline after the introduction of IFRS, and, in fact increased in
France. Their findings suggest that management incentives and national institutional
factors play an important role in framing financial reporting characteristics. As a last
analysis, we compare the level of earnings management under Canadian GAAP and IFRS
without predictions.

Leuz et al. (2003) developed different country-level measures of earnings
management that capture various dimensions along which insiders can exercise their
discretion to manage reported earnings. We will refer to three of these measures. The first
measure of a country-level earnings management uses the standard deviation of earnings
divided by the standard deviation of cash flow from operations. A low ratio implies a
higher level of earnings management. The second measure of uses the magnitude of
accruals as a proxy for the extent to which managers exercise discretion in reporting
earnings. It is computed as a country’s median of the absolute value of firms’ accruals
scaled by the absolute value of firms’ cash flow from operations. A high ratio suggests a
high level of earnings management. The third measure is the ratio of ‘‘small profits’’ to
‘‘small losses’’, using net earnings scaled by total assets. Small losses are defined to be in
the range [-0.01, 0.00] and small profits are defined to be in the range [0.00, 0.01]. This
last measure is qualified as an earnings-smoothing measure by Leuz et al. (2003).
From table 6, we observe that earnings management does vary in Canada under
IFRS compared to domestic GAAP. The first and second measures exhibit lower earnings
management under IFRS. The level of details warranted under IFRS could refrain
managers from accruals management. However, we observe a slightly larger earnings
smoothing under IFRS since, under Canadian GAAP, our sample firms exhibit a
proportion of 2.625 small profits compared small losses compared to 2.80 under IFRS.
However, considering the small sample (21/8 versus 14/5), this results must be
interpreted cautiously.
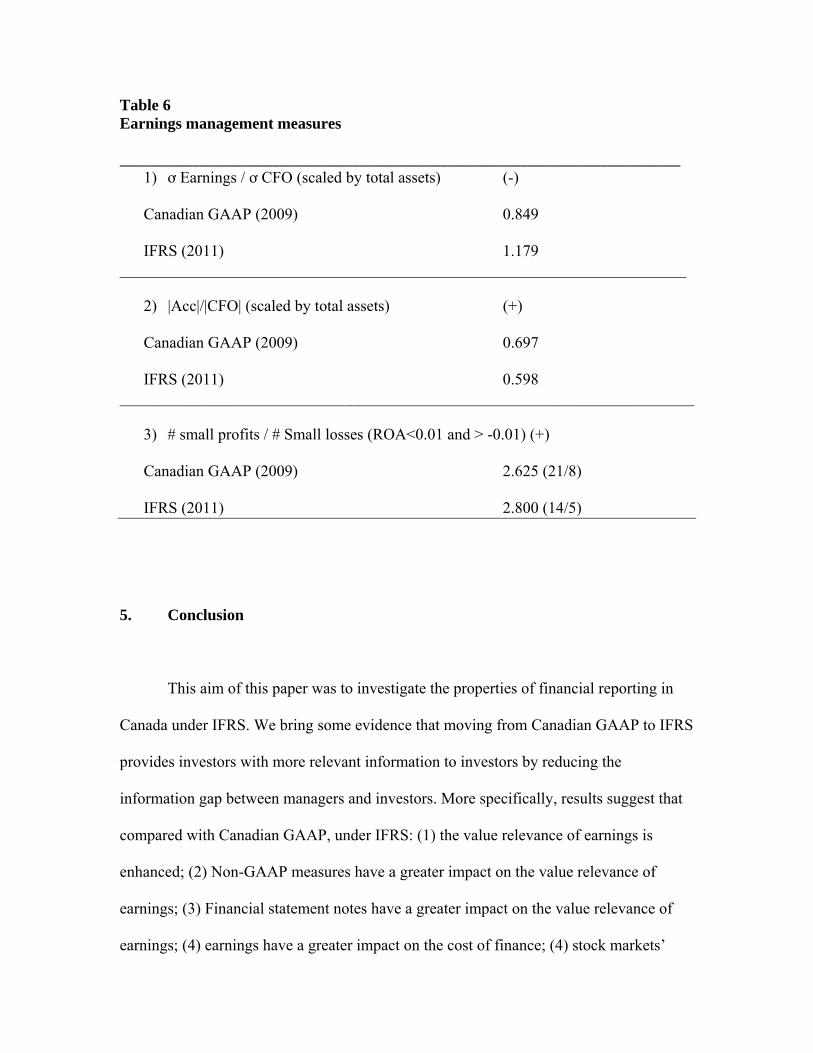
Table 6 Earnings management measures _____________________________________________________________________________
1) ơ Earnings / ơ CFO (scaled by total assets) (-)
Canadian GAAP (2009) 0.849
IFRS (2011) 1.179 _______________________________________________________________________
2) |Acc|/|CFO| (scaled by total assets) (+)
Canadian GAAP (2009) 0.697
IFRS (2011) 0.598 ________________________________________________________________________
3) # small profits / # Small losses (ROA<0.01 and > -0.01) (+)
Canadian GAAP (2009) 2.625 (21/8)
IFRS (2011) 2.800 (14/5)
5. Conclusion
This aim of this paper was to investigate the properties of financial reporting in
Canada under IFRS. We bring some evidence that moving from Canadian GAAP to IFRS
provides investors with more relevant information to investors by reducing the
information gap between managers and investors. More specifically, results suggest that
compared with Canadian GAAP, under IFRS: (1) the value relevance of earnings is
enhanced; (2) Non-GAAP measures have a greater impact on the value relevance of
earnings; (3) Financial statement notes have a greater impact on the value relevance of
earnings; (4) earnings have a greater impact on the cost of finance; (4) stock markets’
capacity to anticipate future earnings is enhanced, and (5) we observe a slight decrease in
earnings management under IFRS. Overall, results suggest that IFRS self-proclaimed
goal of providing investors with relevant information is achieved in the Canadian context.
In general, we infer that IFRS financial statements provide relevant information to
Canadian investors beyond Canadian GAAP. However, since it is difficult also to tease
out the information contained in the accounting numbers themselves from the additional
information provided in the notes or by non-GAAP measure, we have put in interaction
earnings figure with non-GAAP measures and the details in notes under IFRS. This
allows for a more integrated understanding of the incidence of financial reporting and
disclosure for stock market valuation.
The worldwide enforcement of IFRS worries many regulators and market
participants in the United States. A recent SEC study (2011) analyzing financial
statements of public companies prepared in accordance with IFRS, including SEC
registrants and not SEC registrants, found financial statements lacking in transparency
and clarity to the point that questions were raised about whether some companies
financial statements complied with IFRS. The SEC staff also noticed diversity in the
application that made it challenging to compare companies. We think that the current
paper could be of interest for U.S. regulators since the Canadian context if comparable to
the U.S. one in many aspects. We must keep in mind that, even for Canadian U.S. cross-
listed firms, which must comply with SEC regulations, we observe an enhancement in the
value relevance of earnings following IFRS adoption.
References Armstrong, C.S., Barth, M.E., and Riedl, E.J. (2010), Market Reaction to the Adoption of
IFRS in Europe, The Accounting Review, Vol. 85, No.1, pp. 31-61.
Bruggermann, U., Daske, H., Homberg, C., and Pope, P.F. (2009), How Do Individual
Investors React to Global IFRS Adoption? Available at SSRN:
http://ssrn.com/abstract=1437542
Byard, D., Li, Y. and Yu, Y. (2011), The Effect of Mandated IFRS Adoption on Analyst’
Forecast Error, Journal of Accounting Research, Vol. 49, No. 1, pp. 69-96.
Chalmers, K., Clinch, G., and Godfrey, J. (2011), Changes in Value Relevance of
Accounting Information upon IFRS Adoption: Evidence from Australia, Australian
Journal of Management, Vol. 36, No. 2, pp.151-173.
Chen, H., Tang, Q., Jiang, Y. and Lin, Z. (2010), The Role of International Financial
Reporting Standards and Accounting Quality: Evidence from the European Union,
Journal of International Financial Management& Accounting, Vol. 21, No. 3, pp.
220-278.
Cormier, D., Demaria, S., Lapointe, P., and Teller, R. (2009), First-Time Adoption of
IFRS, Managerial Incentives and Value-Relevance: Some French Evidence, Journal
of International Accounting Research, 8(2), 20-22.
Cormier, D., Lapointe-Antunes, P., and Magnan, M. (2007), Le référentiel IFRS : nous
dirigeons-nous vers une comptabilité au-delà du réel?, Comptabilité-contrôle-audit,
December, 43-56.
Cormier, D., Lapointe-Antunes, P., and Magnan, M. (2011), Revisiting the Relevance
and Reliability of non-GAAP Reporting: The Case of Income Trusts, Contemporary
Accounting Research, Vol. 28, No.5, pp. 1585-1609.
Daske, H., Hail, L., Leuz, C., and Verdi, R. (2008), Mandatory IFRS Reporting around
the World: Early Evidence on the Economic Consequences, Journal of Accounting
Research, Vol. 46, No. 5, pp. 1085-1143.
Easton, P. (2004), PE Ratios, PEG Ratios, and Estimating the Implied Expected Rate of
Return on Equity Capital, The Accounting Review, Vol. 79, No. 1, pp. 73-95

Florou, A., and Pope, P.F. (2012), Mandatory IFRS Adoption and Investor Asset
Allocation Decisions, The Accounting Review, Vol. 87, No. 6, pp. 1993-2025.
Francis, J., Khurana, I., and Pereira, R. (2005), Disclosure Incentives and Effects on Cost
of Capital, The Accounting Review, Vol. 80, No. 4, pp. 1125-1162
Garcia, L., Garcia, O., and Pope, P.F. (2009), Earnings Quality Effects of Mandatory
IFRS Adoption, American Accounting Association, 2009 Annual Meeting Sessions
International Accounting.
Horton, J. and Serafeim, G. (2010), Market Reaction & Valuation of IFRS Reconciliation
Adjustments: First Evidence from the UK, Review of Accounting Studies, Vol. 15,
No. 4, pp. 725-751.
Horton, J., Serafeim, G. and Serafeim, I. (2013), Does Mandatory IFRS Adoption
Improve the Information Environment?, Contemporary Accounting Research, Vol.
30, No. 1, pp. 388-423.
Iatridis, G. (2010), IFRS Adoption and Financial Statement Effects: The UK Case,
International Research Journal of Finance and Economics, Vol. 38 (April), pp. 165-
172.
Leuz, C., Nanda, D., and Wysocki, P.D. (2003), Earnings Management and Investor
Protection: An International Comparison, Journal of Financial Economics, Vol. 69,
No. 3, pp. 505-527.
Li, S. (2010), Does Mandatory Adoption of International Financial Reporting Standards
in the European Union reduce the Cost of equity Capital?, The Accounting Review,
Vol. 85, No. 2, pp. 607-636.
Platikanova, P. (2009), Market Liquidity Effects of the IFRS Introduction in Europe,
SSRN: http://ssrn.com/abstract=1005364.
Saudaragan, S., and Biddle, G. (1992), Financial Disclosure Levels and Foreign Stock
Exchange Listings, Journal of International Financial Management and Accounting,
Vol. 4, No. 2, pp. 106–148.
Saudaragan, S., and Meek, G. (1997), A Review of Research on the Relationship between
International Capital Markets and Financial Reporting by Multinational Firms,
Journal of Accounting Literature, Vol. 16, 127–159.
Securities and Exchange commission Staff Paper (SEC) (November 2011), Work Plan for
the Consideration of Incorporating International Financial Reporting Standards into
the Financial Reporting System for U.S. Issuers An Analysis of IFRS in Practice.
Tan, H., Wang, S. and Welker, M. (2011) ‘Analyst Following and Forecast Accuracy
After Mandated IFRS Adoptions’, Journal of Accounting Research, Vol. 49, No. 5,
pp. 1307-1357.
Warfield, T., and Wild, J. (1992), Accounting Recognition and the Relevance of Earnings
as an Explanatory Variable for Returns, The Accounting Review, 67(4), 821-842.