reliability and risk engineering
TRANSCRIPT

||
RREReliability and Risk Engineering
Andrea Antenucci and Prof. Giovanni Sansavini
Reliability and Risk Engineering Laboratory, D-Mechanical and Process Engineering, ETH Zurich
04.04.2019 1
Secure Allocation Of Power Reserves With Large Renewable
Penetration Under Gas Transmission Constraints
Giovanni Sansavini

||
RREReliability and Risk Engineering
04.04.2019Giovanni Sansavini 2
Why the Need for Coupling?
Beside power generation, gas-fired power plants
provide reserves to balance the volatility of
renewables
World net electricity generation by fuel [1012·kWh]
Renewables conversion into gas and network
storage can mitigate curtailments and
seasonality
International Energy
Outlook 2017
U.S. Energy Information
Administration
Hourly electricity generation and consumption in renewable rich areas
Centralschweizerische
Kraftwerke AG0
50
100
150
200
250
0:0
0
1:0
0
2:0
0
3:0
0
4:0
0
5:0
0
6:0
0
7:0
0
8:0
0
9:0
0
10
:00
11
:00
12
:00
13
:00
14
:00
15
:00
16
:00
17
:00
18
:00
19
:00
20
:00
21
:00
22
:00
23
:00
Po
wer
[kW
]
PV surplus
Load
PV feed-in
Power to gas
Gas to power
So far, electricity and gas networks are operated
as independent systems
In the last 10 years, large areas of fluctuating
renewables resulted in excess production or
excess residual load
Therefore, electricity and gas networks are
coupled!

||
RREReliability and Risk Engineering
04.04.2019 3
Gas Supply Impacts Electric Power Production
Source: Report on Outages and Curtailments During the Southwest
Cold Weather Event of February 1-5, 2011 (FERC/NERC)
Giovanni Sansavini
Natural gas prices and wholesale
electricity prices are closely linked
Natural gas supply causes reliability
problems in the power generation

||
RREReliability and Risk Engineering
04.04.2019 4
Research Question
How Can We Enable Safe Operations of Coupled Gas & Electricity Networks ?
Background
Gas constraints usually not accounted for in reserve allocation models
Previous research1 highlighted the impact of gas constraints on reserves
Research gap: need of integrated study on reserve allocation that
combines gas constraints, uncertainties and sensitivity to RES availability
1 Clegg, S. & Mancarella, P., IEEE Transactions Sustainable Energy, 2016Giovanni Sansavini

||
RREReliability and Risk Engineering
04.04.2019 5
Gas analysis
Steady-state
Simulation
- Newton-nodal method
- Newton-loop method
-…
Optimization
- Dynamic programming methods
- Gradient search methods
- Linearization methods
- MINLP
-…
Transient
Simulation
- Method of characteristics
- Implicit and explicit finite difference and finite element methods
-…
Optimization
- Hierarchical control methods
- Mathematical programming:
-NLP
-QP
-MINLP
-…
Modelling Approaches – Gas Network
Giovanni Sansavini

||
RREReliability and Risk Engineering
Li B., Barker K. and Sansavini G., IEEE Systems Journal, in press04.04.2019Giovanni Sansavini 6
Physics-based Modeling of Main Operations
0M
Sx t
R
P h wg f
x x t
PzR
1 1 1
1 1 1
2 2 2
1 1 1
1 0 0 0 0 0
1 1 0 0 0 0
0 1 1 0 0 0
0 0 1 1 0 0
0 0 0 1 1 0
0 0 0 0 1 1
0 0 0 0 0 1
n n
n n n
n n n
d e
a M f
d e
e
a M f
d e
Focus on Integrated Large-Scale Gas and Electric Power Network Transient Models
Antenucci A. and Sansavini G., Journal of Risk and Reliability, 2018

||
RREReliability and Risk Engineering
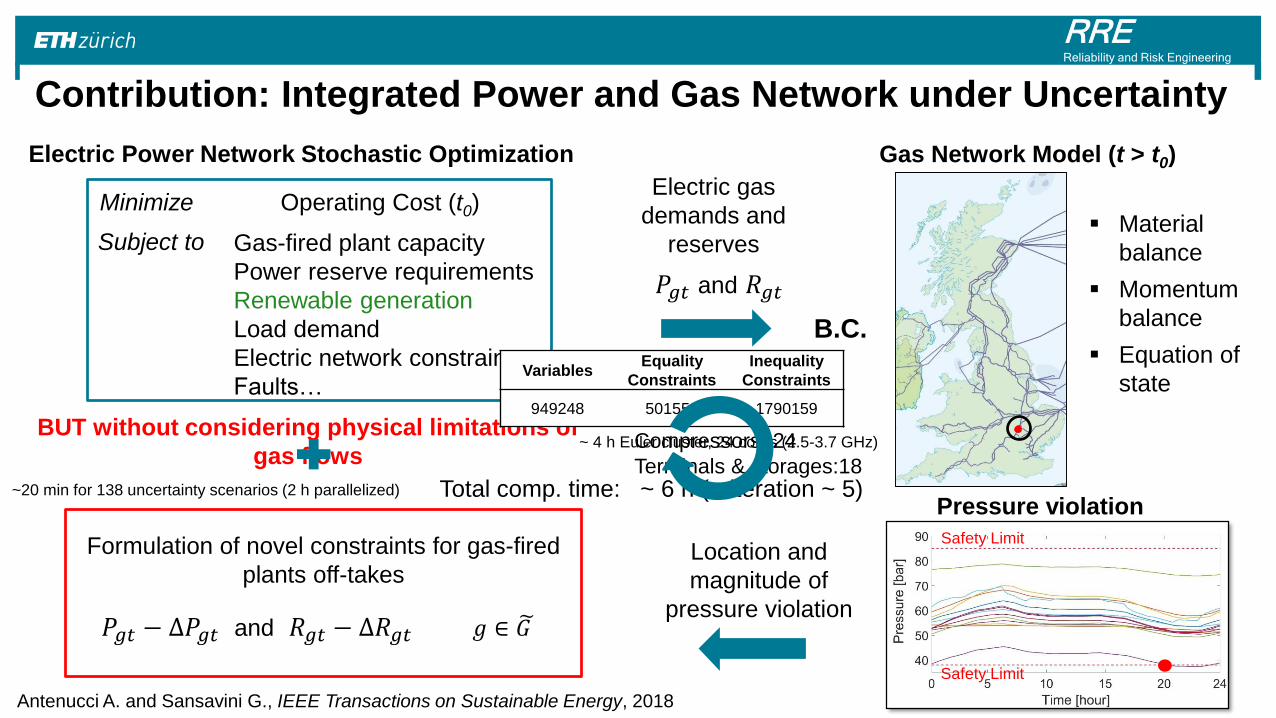
BUT without considering physical limitations of
gas flows
04.04.2019Giovanni Sansavini
Electric Power Network Stochastic Optimization Gas Network Model (t > t0)
Formulation of novel constraints for gas-fired
plants off-takes
Pressure violation
Electric gas
demands and
reserves
Antenucci A. and Sansavini G., IEEE Transactions on Sustainable Energy, 2018
Contribution: Integrated Power and Gas Network under Uncertainty
Minimize Operating Cost (t0)
Subject to Gas-fired plant capacity
Power reserve requirements
Renewable generation
Load demand
Electric network constraints
Faults…
𝑃𝑔𝑡 and 𝑅𝑔𝑡
B.C.
𝑃𝑔𝑡 − ∆𝑃𝑔𝑡 and 𝑅𝑔𝑡 − ∆𝑅𝑔𝑡 𝑔 ∈ ෩𝐺
Location and
magnitude of
pressure violation
Material
balance
Momentum
balance
Equation of
state
Safety Limit
Safety Limit
Pipelines: 304
Nodes: 244
Compressors: 24
Terminals & storages:18

||
RREReliability and Risk Engineering
Start
Master Problem Unit dispatch Reserve schedule
Slave Problems Forecast uncertainty
scenarios N-1 scenarios
Benderscuts
Constraints:
Gen. up-/ down time
Gen. ramp rate
Gen. capacity
Min Gen. setpoint
Reserve allocation
Reserve utilization
Power imports
RES availability
Network power
balance
Electric line capacity
04.04.2019 8
Model – Electric Network Operations
Electric network operations day-ahead stochastic N-1 secure
unit commitment
Uncertainty scenario (s): electric load, RES forecast profile and
faults
Stochastic SCUC
Giovanni Sansavini

||
RREReliability and Risk Engineering
04.04.2019 9
Model – Gas Network OperationsStart
Master Problem Unit dispatch Reserve schedule
Slave Problems Forecast uncertainty
scenarios N-1 scenarios
Benderscuts
Transient gas network simulation
Stochastic SCUC
Modelling choices:
Compressors: constant pressure ratio, maximum nominal power
Gas imports and storage: constant injections, 2-hour delay
corrections
Instant load fluctuations are compensated via linepack variation
Giovanni Sansavini

||
RREReliability and Risk Engineering
04.04.2019
Model – Gas and Electric Network OperationsStart
Master Problem Unit dispatch Reserve schedule
Slave Problems Forecast uncertainty
scenarios N-1 scenarios
Benderscuts
Transient gas network simulation
Stochastic SCUC In case of no pressure violation the algorithm
terminates
In case of pressure violation GFPP off-takes
nearby the violation are constrained
Pressure violation?
No
End
Yes
Constraints on GFPP outputs
10Giovanni Sansavini

||
RREReliability and Risk Engineering
04.04.2019 11
Application: Gas-Constrained Power Reserves Allocation
Large renewables projections (wind 33% of installed capacity)
Renewables volatility compensated mainly by gas-fired power
plants (reserves)
Electric lines and generators are considered in the N-1 security criteria
Stochastic forecast scenarios – Input data:
Giovanni Sansavini
Pipelines: 304
Nodes: 244
Compressors: 24
Terminals & storages:18
Great Britain gas and electric power grids
Buses: 29
Generators: 57
Power lines: 98 An
ten
ucci A
. a
nd
Sa
nsa
vin
i G
.,
Jo
urn
al o
f R
isk a
nd
Re
liab
ility
, 2
01
8
Dem
and
Gas
Electricity

||
RREReliability and Risk Engineering
04.04.2019 12
Application: Impact of Gas Constraints – Windy Day
Combined-cycle gas turbines
(CCGT) from 33% to 30%
Coal (5%) and imports (1%)
contribution increase
A significant amount of wind
energy is curtailed (355 GWh
~40% available wind power)
Minimum pressure violations
in southern regions during
hour 18-24
30% of the reserves between
hours 18-23 are rescheduled
from zones 3-5 to zone 6
Giovanni Sansavini
Neglecting physical gas constraints
Planning for physical gas constraints
Wind
Wind
Antenucci A. and Sansavini G., IEEE
Transactions on Sustainable Energy, 2018
Gas
Gas

||
RREReliability and Risk Engineering
04.04.2019 13
Application: Impact of Gas Constraints – Non-Windy Day
Wind power contribution
from 42% to 4%
Combined-cycle gas
turbines (CCGT)
contribution from 30% to
47%
Power reserves are
allocated to pumped
hydro storage (PS)
If gas constraints are
neglected, security of
supply is compromised
Giovanni SansaviniAntenucci A. and Sansavini G., IEEE
Transactions on Sustainable Energy, 2018
Gas
Gas
Planning for physical gas constraints
Water
Neglecting physical gas constraints

||
RREReliability and Risk Engineering
04.04.2019 14
Application: Impact of Gas Constraints – Non-Windy Day
Wind power contribution
from 42% to 4%
Combined-cycle gas
turbines (CCGT)
contribution from 30% to
47%
Power reserves are
allocated to pumped
hydro storage (PS)
If gas constraints are
neglected, security of
supply is compromised
Giovanni SansaviniAntenucci A. and Sansavini G., IEEE
Transactions on Sustainable Energy, 2018
Gas
Gas
Planning for physical gas constraints
Water
Neglecting physical gas constraints
Gas
Water

||
RREReliability and Risk Engineering
15
Impact of Gas Constraints – Non-windy Day (2)Without gas constraintsWith gas constraints
Giovanni Sansavini 04.04.2019

||
RREReliability and Risk Engineering
Novel formulation of gas constraints in the energy system planning and
operations
Neglecting constraints of the gas grid operations leads to unsafe allocation
of power reserves
Gas constraints affect the type and location of generators that provide
reserves
Cost increase of the proposed safe reserve allocation is limited
Curtailments to critical locations protect against unexpected ramp-down
events
04.04.2019 16
Highlights
Giovanni Sansavini

Thank you for your attention!
Questions?

Backup Slides
||
RREReliability and Risk Engineering
BUT without considering physical limitations of
gas flows
04.04.2019Giovanni Sansavini
Electric Power Network Stochastic Optimization Gas Network Model (t > t0)
Formulation of novel constraints for gas-fired
plants off-takes
Pressure violation
Electric gas
demands and
reserves
Antenucci A. and Sansavini G., IEEE Transactions on Sustainable Energy, 2018
~20 min for 138 uncertainty scenarios (2 h parallelized) Total comp. time: ~ 6 h (× iteration ~ 5)
Contribution: Integrated Power and Gas Network under Uncertainty
Minimize Operating Cost (t0)
Subject to Gas-fired plant capacity
Power reserve requirements
Renewable generation
Load demand
Electric network constraints
Faults…
𝑃𝑔𝑡 and 𝑅𝑔𝑡
B.C.
𝑃𝑔𝑡 − ∆𝑃𝑔𝑡 and 𝑅𝑔𝑡 − ∆𝑅𝑔𝑡 𝑔 ∈ ෩𝐺
~ 4 h Euler cluster, 24 cores (2.5-3.7 GHz)
Location and
magnitude of
pressure violation
Material
balance
Momentum
balance
Equation of
state
Safety Limit
Safety Limit
Pipelines: 304
Nodes: 244
Compressors: 24
Terminals & storages:18
VariablesEquality
Constraints
Inequality
Constraints
949248 501552 1790159

||
RREReliability and Risk Engineering
04.04.2019Giovanni Sansavini 20
Validation: Reproducing 2020 Electricity Generation and Reserves
0
5000
10000
15000
20000
2010 2015 2020 2025 2030
Op
era
tin
g R
ese
rve
R
eq
uir
em
en
ts [
MW
]
Year
Wind load factor 0%
Wind load factor 30%
Wind load factor 100%
Our Model
2
18
31
9
5
22
2
11
5.1
20.9
25
7.8
3.6
24.3
2.2
11.1
HYDRO N UCL EAR G AS OTHER COAL W I N D SOL AR I M PORT
% A
NN
UA
L G
ENER
AT
ION
Future Energy Scenario 2020 Model
Source: Operating the Electricity
Transmission Networks in 2020,
National Grid, 2011
Source: National Grid’s Gone Green
scenario 2020 for Great Britain, 2014

||
RREReliability and Risk Engineering
04.04.2019 21
Implicit Method with Intermediate Step
Fundamental equations for pipeline flow
• Gas state equation: (1)
• Mass balance: (2)
• Momentum conservation: (3)
For strongly subcritical flow and considering natural gas, (3) becomes:
Hypothesis
One-dimensional, isothermal and single phase flow
Constant friction coefficient
0M
Sx t
R
P h dwg f
x x dt
PzR
*
2 2 2
11 0
2 sd sd sd
w h MM g b
x DSw Lw L Sw t
Giovanni Sansavini

||
RREReliability and Risk Engineering
04.04.2019 22
Implicit Method with Intermediate Step (2)
Spatial discretization
The mass balance equation is discretized as:
ρ1 ρ2 ρn+1
M1 Mn-1 Mn
Q1 Q2 Qi Qn Qn+1
2Δxi-1
Qi-1
ρi-1 ρiρn
11 1
1 1 1 1
1
1 1 1 1
11
1 1
1 12,
1 1
ii i i
i i i i i i i i
nn n
n n n n
dM Q
dt x S x S
dM M Q i n
dt x S x S x S x S
dM Q
dt x S x S
Giovanni Sansavini

||
RREReliability and Risk Engineering
04.04.2019 23
Implicit Method with Intermediate Step (2)
Spatial discretization
The momentum equation is discretized as:
where:
*1 12 2 2
ˆ 2 2ˆ 0
2i i i
i i i i i i ii i i i i i i
i i sd sd i sdi
w x h x dMM g b
D S w w S w dt
* *
1
1
1
1i
i i
i i i
i i i
zb a
h h h
1
1
1
2
1
2
i i i
i i i
i i i iP R z
21
1 1
1
ˆˆ
ˆ2
i
ii
i i
sd i i i
ni
i i i
Mw
S
w R z z
P P
R z z
ρ1 ρ2 ρn+1
M1 Mn-1 Mn
Q1 Q2 Qi Qn Qn+1
2Δxi-1
Qi-1
ρi-1 ρiρn
Giovanni Sansavini

||
RREReliability and Risk Engineering
04.04.2019 24
Implicit Method with Intermediate Step (3)
Integration technique
Consider a differential equation:
Linearize:
Apply the implicit method
The parameter ϑ is empirically set to 0.473. Rearranging:
, : , :y f y u y solution u boundarycondition
y Ay Bu
11
2
y t t y tA y t t y t B u t t u t
t
1
1.9 1.9 0.9 1.92
I A t y t t I A t y t B t u t t u t
Giovanni Sansavini

||
RREReliability and Risk Engineering
04.04.2019 25
Implicit Method with Intermediate Step (5)
Network Matrix Formulation
The mass balance and momentum conservation equations are written for the network as:
where:
1 1 1
1 1 1
2 2 2
1 1 1
1 0 0 0 0 0
1 1 0 0 0 0
0 1 1 0 0 0
0 0 1 1 0 0
0 0 0 1 1 0
0 0 0 0 1 1
0 0 0 0 0 1
n n
n n n
n n n
d e
a M f
d e
e
a M f
d e
1 1 1 1 1
1
1 1 1 1
1
0.9 1.9
0.9 1.9
0.9 1.9
0.9
i i i i i i
n n n n n
i i i i i i
e M q d
e M M q d
e M q d
f bM c
1 11
1 1
1
1.9
1.9
1.9
i i i ii
n nn
S xd
t
S x S xd
t
S xd
t
2
*1
2
1.9 2
ˆ1
2
ˆ1.9
i
i
ii
sd i
i i
i i
i
i i i ii i i
sd i
xb
w S t
w ta b
D
g h bc
w
Giovanni Sansavini

||
RREReliability and Risk Engineering
04.04.2019 26
Implicit Method with Intermediate Step (6)
Non-pipe elements
Pressure regulator:
Storages:
Injection:
Withdrawal:
Compressor:
Power:
Tap gas1:
3600
1minC
P QW
m
out fixP P
CCW
In workt s tQ K V
1 21Witht s swork cushion
t t
Q K KV V
Giovanni Sansavini

||
RREReliability and Risk Engineering
04.04.2019 27
Numerical Complexity
Reserve Study PtG Study - Design PtG Study – Daily operations
Element Variables Equality
Constraints
Inequality
Constraints
Power
Plants
207360 1440 789743
RES 304704 76176 152352
Import 96 - 192
Load
curtail
96048 - 192096
Network 327888 423936 655776
Total 949248 501552 1790159
Element Variables Equality
Constraints
Inequality
Constraints
Power
Plants
74880 18720 100841
RES 14352 7176 14352
Import 1248 - 2496
Load
curtail
9048 - 18096
Network 30888 39936 61777
PtG 725 - 18120
Line
Reinf.
99 - -
Total 131420 65832 215682
Element Variables Equality
Constraints
Inequality
Constraints
Power
Plants
5760 1440 7757
RES 1140 552 1104
Import 96 - 192
Load
curtail
696 - 1392
Network 2376 696 4753
Total 10068 5064 15198
Giovanni Sansavini

||
RREReliability and Risk Engineering
04.04.2019 28
Computational Detail
Cascading Failure model (24 h) : ~ [3, 10] min
Start
Design and planning PtG locations and capacities
Line reinforcements
Electric operation optimization
Transient gas network simulation
Pressure violation?
No
End
CO2 balance computation
Start
Master Problem Unit dispatch Reserve schedule
Slave Problems Forecast uncertainty
scenarios N-1 scenarios
Benderscuts
Transient gas network simulation
~ [30, 130] min
~90 min
~20 min · 365 d
~ 4 h
~ [1, 2] min · 138
scenarios
Euler cluster, 24 core (2.5-3.7 GHz)
Total: ~ 5 h (x iteration) Total: ~ 9 h (x iteration)
Giovanni Sansavini

||
RREReliability and Risk Engineering
Pros and Cons (in general)
+ Low computational time
+ Versatile in component representation
- Purely descriptive
- No optimality
04.04.2019 29
Transient simulation model
Implicit finite difference method with intermediate step
Introduced by J. Kràlik et all1 in 1988
+ Standard in industrial and academic analysis
+ Optimized for large and complex network problem
+ Allows freedom in component modelling
+ Provide indications of the influence of model parameters on results, correctness of behavior
and method stability, and spatial and temporal optimal discretization
1: Kràlik J, Stiegler P, Vostry Z, et al. Dynamic modeling of large-scale networks with application to gas distribution. New York, NY: Elsevier, 1988.
Giovanni Sansavini

||
RREReliability and Risk Engineering
04.04.2019 30
Implicit finite difference method with intermediate step (3)
Efficient network solution strategy
Equations are further manipulated by applying the following decomposition method.
The solution strategy is:
1. Densities are found at crossings by solving the continuity equation. The obtained matrix is sparse.
2. Densities and mass flows are found in all internal branches, by using the densities at crossings as
boundary conditions.
3. For boundary branches, boundary conditions are represented by one density at only one crossing.
For non-pipe elements, the momentum conservation equation is replaced with the characteristic
equation of the specific non-pipe element.Giovanni Sansavini

||
RREReliability and Risk Engineering
04.04.2019 31
Cascading Failure Model - EventsE
lectr
icity
Ga
s
𝑇0
Next hour
𝑇0 + 1
Line failure
Gas network
issue
Power
balance
𝑇3𝑇2𝑇1
Time
Time
Giovanni Sansavini
||
RREReliability and Risk Engineering
04.04.2019 32
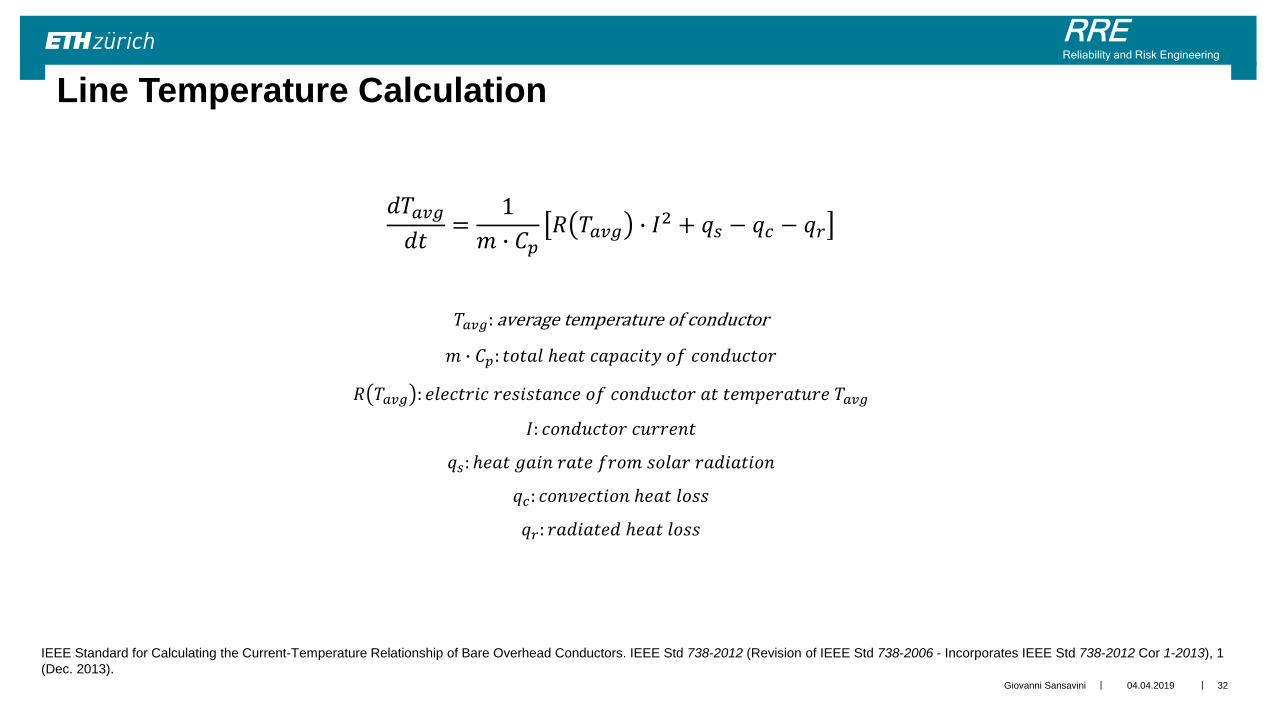
Line Temperature Calculation
𝑑𝑇𝑎𝑣𝑔
𝑑𝑡=
1
𝑚 ∙ 𝐶𝑝𝑅 𝑇𝑎𝑣𝑔 ∙ 𝐼2 + 𝑞𝑠 − 𝑞𝑐 − 𝑞𝑟
𝑇𝑎𝑣𝑔: average temperature of conductor
𝑚 ∙ 𝐶𝑝: 𝑡𝑜𝑡𝑎𝑙 ℎ𝑒𝑎𝑡 𝑐𝑎𝑝𝑎𝑐𝑖𝑡𝑦 𝑜𝑓 𝑐𝑜𝑛𝑑𝑢𝑐𝑡𝑜𝑟
𝑅 𝑇𝑎𝑣𝑔 : 𝑒𝑙𝑒𝑐𝑡𝑟𝑖𝑐 𝑟𝑒𝑠𝑖𝑠𝑡𝑎𝑛𝑐𝑒 𝑜𝑓 𝑐𝑜𝑛𝑑𝑢𝑐𝑡𝑜𝑟 𝑎𝑡 𝑡𝑒𝑚𝑝𝑒𝑟𝑎𝑡𝑢𝑟𝑒 𝑇𝑎𝑣𝑔
𝐼: 𝑐𝑜𝑛𝑑𝑢𝑐𝑡𝑜𝑟 𝑐𝑢𝑟𝑟𝑒𝑛𝑡
𝑞𝑠: ℎ𝑒𝑎𝑡 𝑔𝑎𝑖𝑛 𝑟𝑎𝑡𝑒 𝑓𝑟𝑜𝑚 𝑠𝑜𝑙𝑎𝑟 𝑟𝑎𝑑𝑖𝑎𝑡𝑖𝑜𝑛
𝑞𝑐: 𝑐𝑜𝑛𝑣𝑒𝑐𝑡𝑖𝑜𝑛 ℎ𝑒𝑎𝑡 𝑙𝑜𝑠𝑠
𝑞𝑟: 𝑟𝑎𝑑𝑖𝑎𝑡𝑒𝑑 ℎ𝑒𝑎𝑡 𝑙𝑜𝑠𝑠
IEEE Standard for Calculating the Current-Temperature Relationship of Bare Overhead Conductors. IEEE Std 738-2012 (Revision of IEEE Std 738-2006 - Incorporates IEEE Std 738-2012 Cor 1-2013), 1
(Dec. 2013).Giovanni Sansavini

||
RREReliability and Risk Engineering
04.04.2019 33
Frequency Deviation
𝑓. 𝑑. =Δ𝑃
σΩ𝐷𝐷𝑑 +σΩ𝐺
1𝑅𝑔
Δ𝑃: 𝑝𝑜𝑤𝑒𝑟 𝑖𝑚𝑏𝑎𝑙𝑎𝑛𝑐𝑒
Ω𝐷: 𝑠𝑒𝑡 𝑜𝑓 𝑙𝑜𝑎𝑑 𝑑𝑒𝑚𝑎𝑛𝑑𝑠
Ω𝐺 : 𝑠𝑒𝑡 𝑜𝑓 𝑔𝑒𝑛𝑒𝑟𝑎𝑡𝑜𝑟𝑠
𝐷𝑑: 𝑓𝑟𝑒𝑞𝑢𝑒𝑛𝑐𝑦 𝑐ℎ𝑎𝑟𝑎𝑐𝑡𝑒𝑟𝑖𝑠𝑡𝑖𝑐 𝑜𝑓 𝑡ℎ𝑒 𝑑𝑡ℎ 𝑙𝑜𝑎𝑑
𝑅𝑔: 𝑓𝑟𝑒𝑞𝑢𝑒𝑛𝑐𝑦 𝑐ℎ𝑎𝑟𝑎𝑐𝑡𝑒𝑟𝑖𝑠𝑡𝑖𝑐 𝑜𝑓 𝑡ℎ𝑒 𝑔𝑡ℎ 𝑔𝑒𝑛𝑒𝑟𝑎𝑡𝑜𝑟
Mousavi, O. A., Bozorg, M., Cherkaoui, R. & Paolone, M. Inter-area frequency control reserve assessment regarding dynamics of cascading outages and blackouts. Electric Power Systems Research
107, 144 (Feb. 2014).
Giovanni Sansavini

||
RREReliability and Risk Engineering
04.04.2019 34
Generators Costs and Characteristics: Reserve Study
Unit type Variable costs
(£/MWh) 1,2,3,4
Additional Reserve
costs
(£/MWh) 5
Start-up costs
(£/MW-cap) 4
MSG (%) 3,4 Min. up-time (h) 6 Min. down-time (h) 6 Ramp rates
(p.u./min) 7
Hydro 0 (must run) Not allowed 0 0 1 1 10
Pumped storage 70 +2 0 0 1 1 6
Nuclear 0 (must run) Not allowed 71 50 12 8 0.005
OCGT 67.8 +4 21 10 1 1 0.05
CCGT 53.2 +6 33 50 8 4 0.1
Coal+ CCS 52.1 +10 42 50 8 8 0.04
Other 70 +10 58.5 50 8 6 0.04
CHP 0 (must run) Not allowed 33 50 8 4 0.1
1Qadrdan, M., Abeysekera, M., Chaudry, M., Wu, J. & Jenkins, N. Role of power-to-gas in an integrated gas and electricity system in Great Britain. International Journal of Hydrogen Energy 40, 5763 (May 2015).2 Chaudry, M., Jenkins, N. & Strbac, G. Multi-time period combined gas and electricity network optimisation. Electric Power System Research 78, 1265 (July 2008).3 Clegg, S. & Mancarella, P. Integrated Electrical and Gas Network Flexibility Assessment in Low-Carbon Multi-Energy Systems. IEEE Transanctions Sustaintainable Energy 7, 718 (Dec. 2016).4 Schröder, Andreas, et al. Current and prospective costs of electricity generation until 2050. No. 68. Data Documentation, DIW, 2013.5 Hummon, M. R., et al. Fundamental drivers of the cost and price of operating reserves. No. NREL/TP-6A20-58491. National Renewable Energy Lab.(NREL), Golden, CO (United States), 2013.6 Geiger, Ansgar. Strategic Power Plant Investment Planning under Fuel and Carbon Price Uncertainty. KIT Scientific Publishing, 2011.7 European Commission. DG for Energy (ENER/B2). Study on Synergies between Electricity and Gas Balancing Markets (EGEBS) (2012).
Giovanni Sansavini

||
RREReliability and Risk Engineering
04.04.2019 35
Generators Costs and Characteristics: PtG Study
Unit type Fuel + O&M +
CCS(£/MWh) 1,2
CO2 Emission
(gC02/MJ) 3
Start-up costs
(£/MW-cap) 4
MSG (%) 4 Min. up-time (h) 5 Min. down-time (h) 5 Ramp rates
(p.u./min) 4,6
Hydro 0+6+0 0 0 0 1 1 10
Pumped storage 0+70+0 0 0 0 1 1 6
Nuclear 5+5+0 0 71 50 12 8 0.075
OCGT+CCS 87+3+13 56.1 21 40 1 1 0.2
CCGT+CCS 50.75+3.5+8 56.1 33 40 8 4 0.1
Coal + CCS 24.3+4+17 94.6 42 50 8 8 0.06
Other + CCS 41+11+17 109.6 58.5 50 8 6 0.06
CHP + CCS 63+5+8 - 31 (heat
revenues)
56.1 33 40 8 4 0.1
1Department for Business, Energy & Industrial Strategy. Electricity Generation Costs. Crown Publishing (UK), 20162 Chaudry, M., Jenkins, N. & Strbac, G. Multi-time period combined gas and electricity network optimisation. Electric Power System Research 78, 1265 (July 2008).3 Intergovernmental Panel on Climate Change (IPCC)4 Schröder, Andreas, et al. Current and prospective costs of electricity generation until 2050. No. 68. Data Documentation, DIW, 2013.6 Geiger, Ansgar. Strategic Power Plant Investment Planning under Fuel and Carbon Price Uncertainty. KIT Scientific Publishing, 2011.6 European Commission. DG for Energy (ENER/B2). Study on Synergies between Electricity and Gas Balancing Markets (EGEBS) (2012).
Giovanni Sansavini