reliability & asset management at southern california...
TRANSCRIPT
1
IEEE PES General Meeting
Reliability Panel Session
Utility Practices and Challenges on Predicting Distribution System Reliability
Reliability & Asset Management at
Southern California Edison
Shan (Sam) H Chien
Southern California Edison
July 2014
National Harbor MD
Reliability & Asset Management at SCE:
Introduction of SCE T&D System
Trend of T&D equipment ageing
Forecast circuit reliability – Credit infrastructure replacement
Integrate cable testing with IR
Substation Infrastructure Replacement
Summary
2

3
Introduction of SCE
Transmission and Distribution System
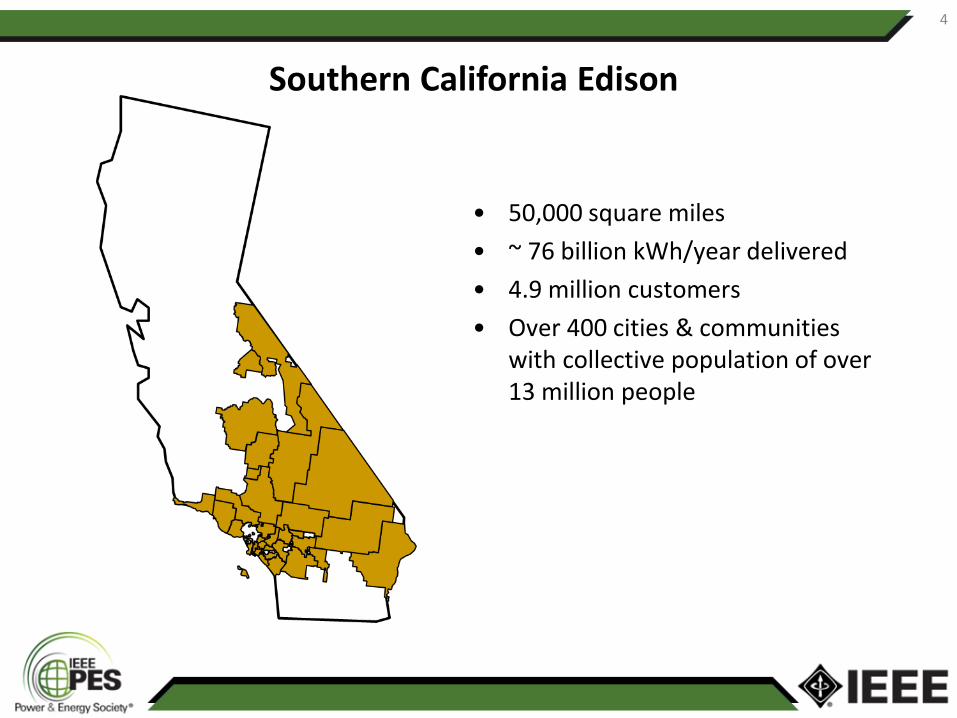
• 50,000 square miles
• ~ 76 billion kWh/year delivered
• 4.9 million customers
• Over 400 cities & communities with collective population of over 13 million people
Southern California Edison
4
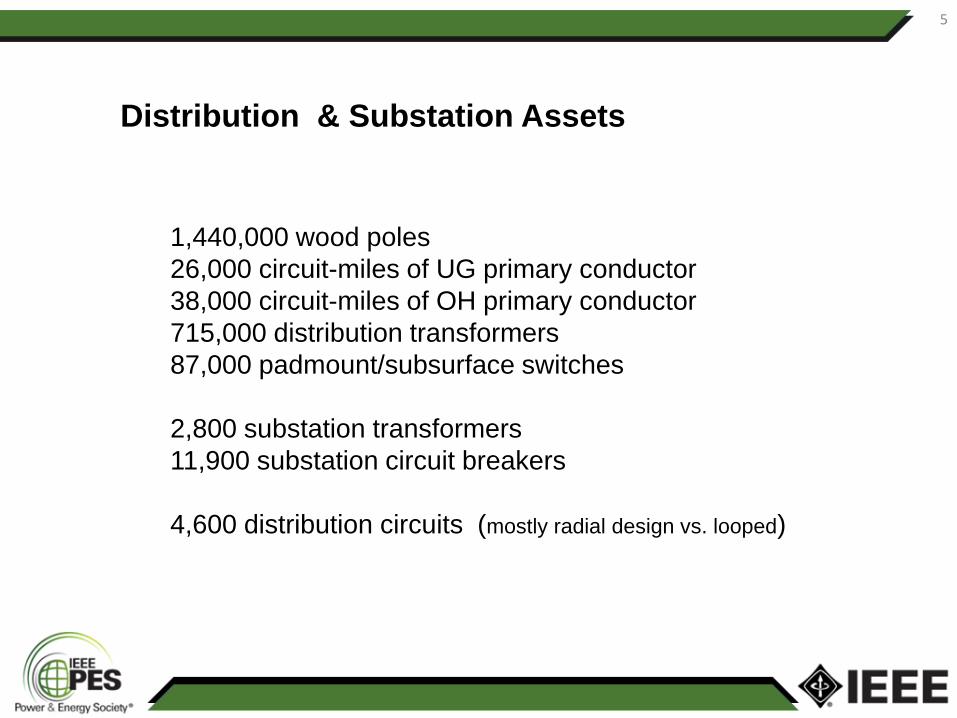
Distribution & Substation Assets
1,440,000 wood poles
26,000 circuit-miles of UG primary conductor
38,000 circuit-miles of OH primary conductor
715,000 distribution transformers
87,000 padmount/subsurface switches
2,800 substation transformers
11,900 substation circuit breakers
4,600 distribution circuits (mostly radial design vs. looped)
5
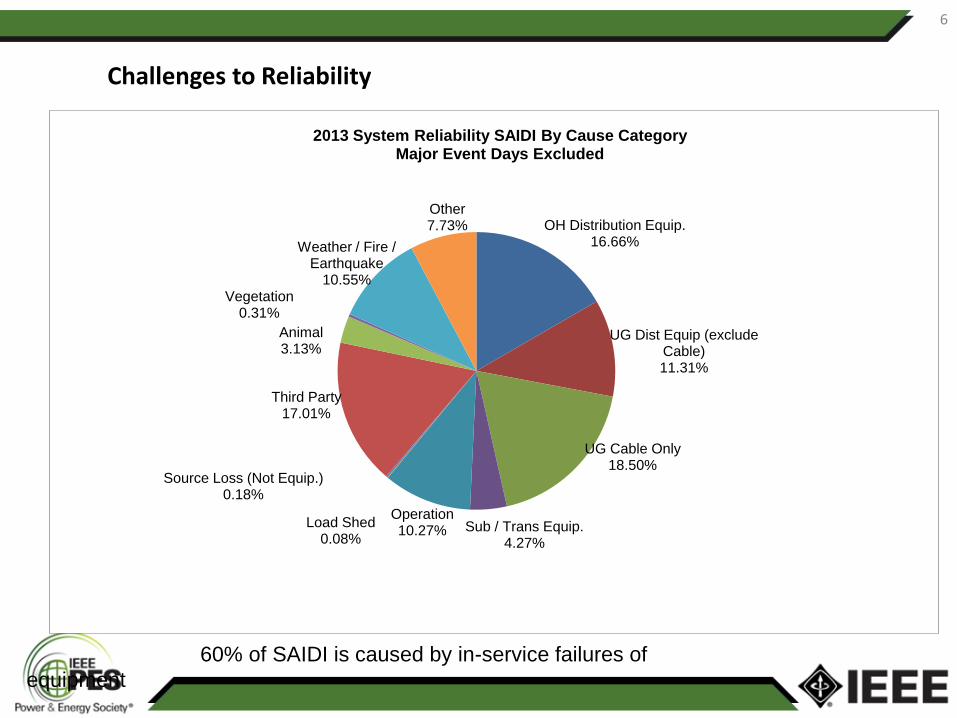
Challenges to Reliability
6
OH Distribution Equip. 16.66%
UG Dist Equip (exclude Cable) 11.31%
UG Cable Only 18.50%
Sub / Trans Equip. 4.27%
Operation 10.27%
Load Shed 0.08%
Source Loss (Not Equip.) 0.18%
Third Party 17.01%
Animal 3.13%
Vegetation 0.31%
Weather / Fire / Earthquake
10.55%
Other 7.73%
2013 System Reliability SAIDI By Cause Category Major Event Days Excluded
60% of SAIDI is caused by in-service failures of
equipment
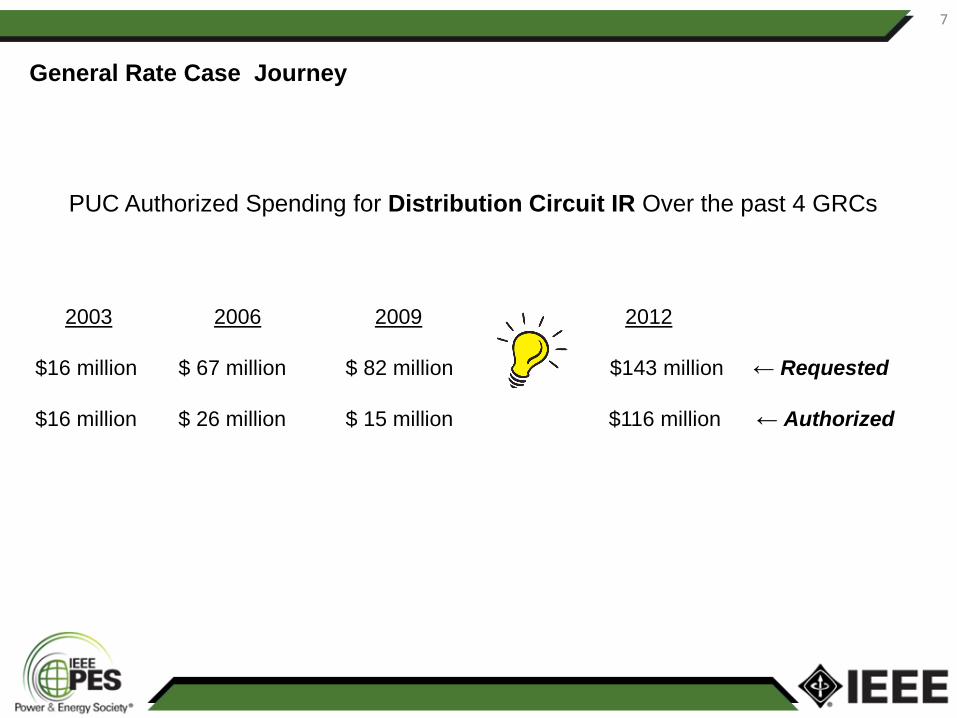
PUC Authorized Spending for Distribution Circuit IR Over the past 4 GRCs
2003 2006 2009 2012
$16 million $ 67 million $ 82 million $143 million ← Requested
$16 million $ 26 million $ 15 million $116 million ← Authorized
General Rate Case Journey
7

8
Trends of Transmission and
Distribution Equipment Ageing
9

Infrastructure Aging
10

ReliaSoft Weibull++ 7 - www.ReliaSoft.com
Failure Rate vs Time Plot
Time, (t)
Fa
ilu
re R
ate
,
f(t)
/R(t
)
0.000 70.00014.000 28.000 42.000 56.0000.000
0.100
0.020
0.040
0.060
0.080
Underground Oil Switch
Mean Life = 35 yrs
Failure Rate Line
ZOILO
ROLDANSCE
3/30/2010
2:35:54 PM
ReliaSoft Weibull++ 7 - www.ReliaSoft.com
Failure Rate vs Time Plot
Time, (t)
Failu
re R
ate,
f(t
)/R(t
)
0.000 100.00020.000 40.000 60.000 80.0000.000
0.150
0.030
0.060
0.090
0.120
Data 1 B-BANK XFMRS
Mean Life = 57
Failure Rate Line
ZOILO ROLDAN
SCE5/18/2010
3:14:59 PM
Time-dependent Failures (Weibull curves)
Forecast Circuit Reliability:
Credit infrastructure replacement
12
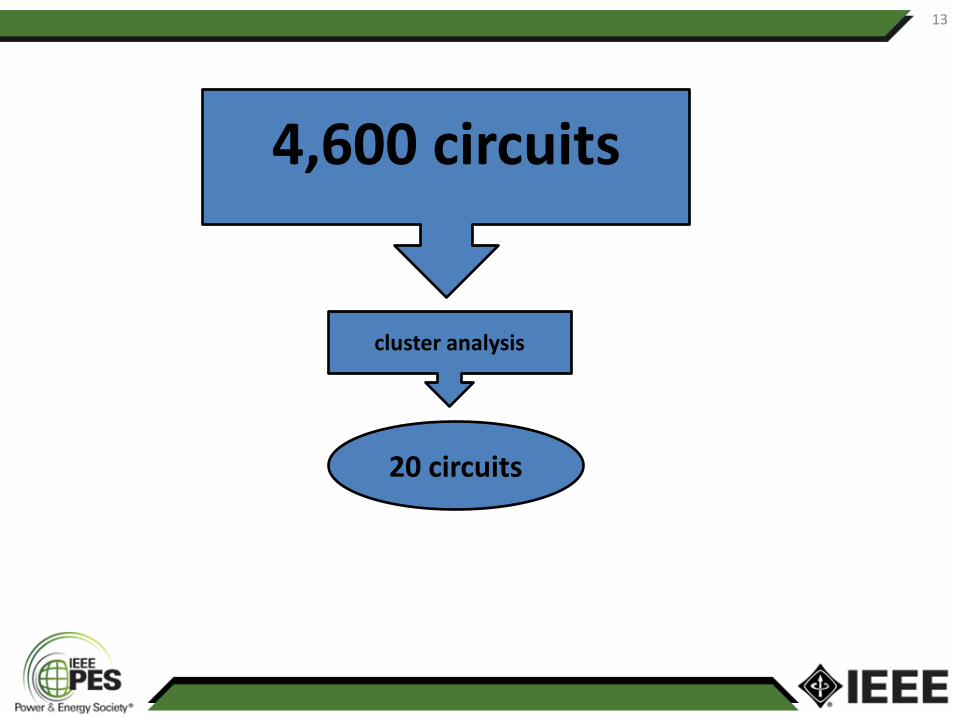
4,600 circuits
cluster analysis
20 circuits
13
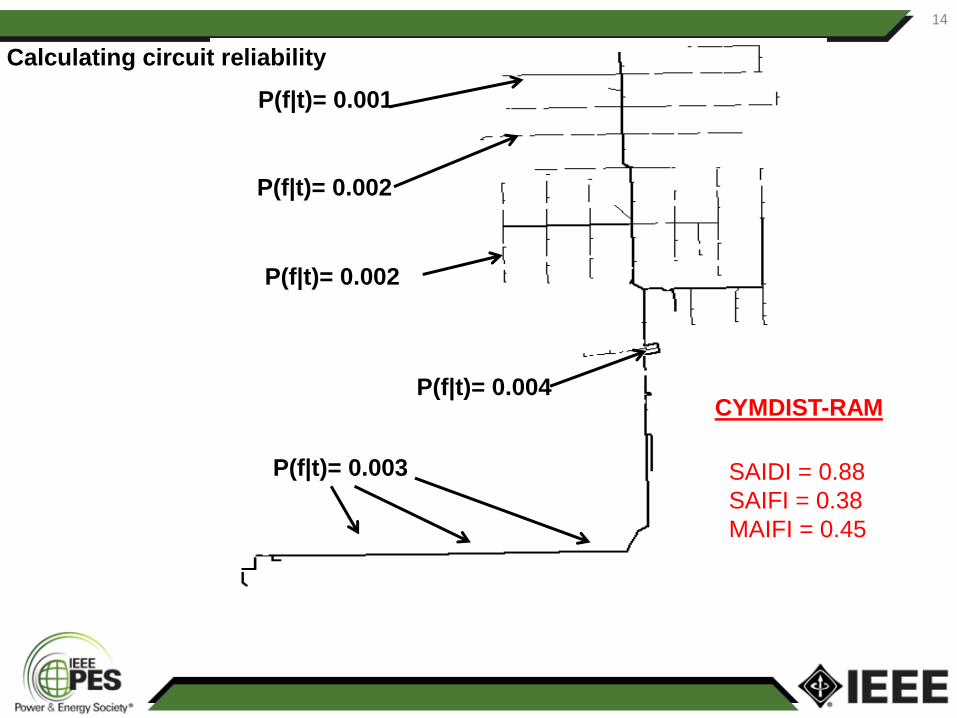
P(f|t)= 0.003
P(f|t)= 0.001
P(f|t)= 0.002
P(f|t)= 0.002
P(f|t)= 0.004
SAIDI = 0.88
SAIFI = 0.38
MAIFI = 0.45
Calculating circuit reliability
CYMDIST-RAM
14
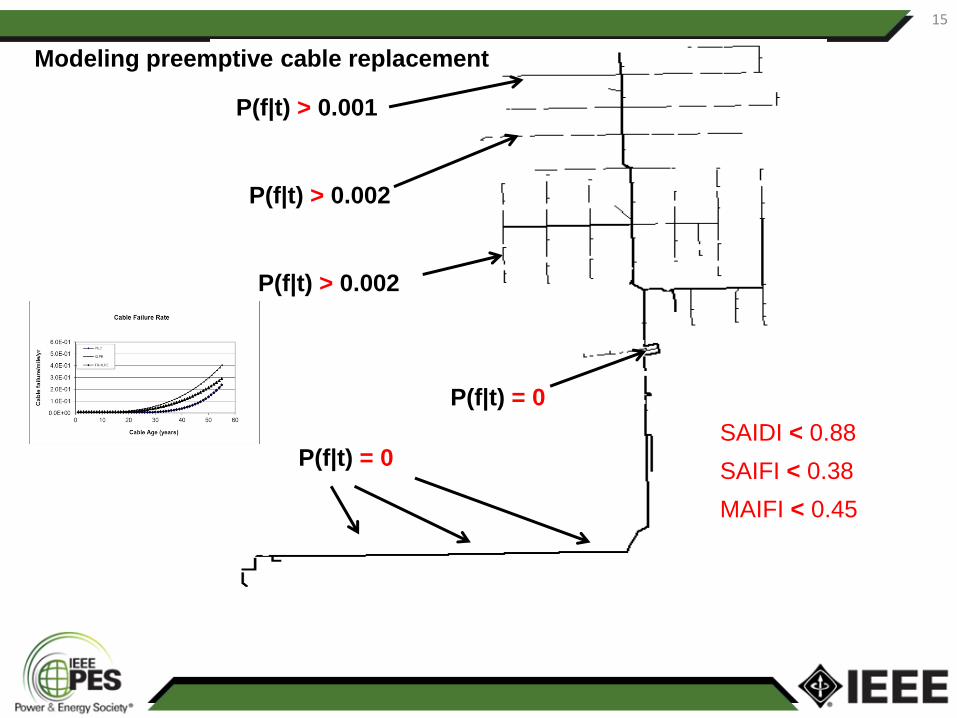
P(f|t) = 0
P(f|t) > 0.001
P(f|t) > 0.002
P(f|t) > 0.002
P(f|t) = 0 SAIDI < 0.88
SAIFI < 0.38
MAIFI < 0.45
Modeling preemptive cable replacement
15

80
90
100
110
120
130
140
150
160
170
2000 2005 2010 2015 2020 2025 2030 2035
Min
ute
s/C
ust
om
er/
year
Years
SAIDI Forecast 2013 - 2032(Excluding IEEE 1366 Major Event Days)
0 IR
500 IR
570 IR
600 IR
Predicted reliability with varying levels of preemptive cable replacement
16
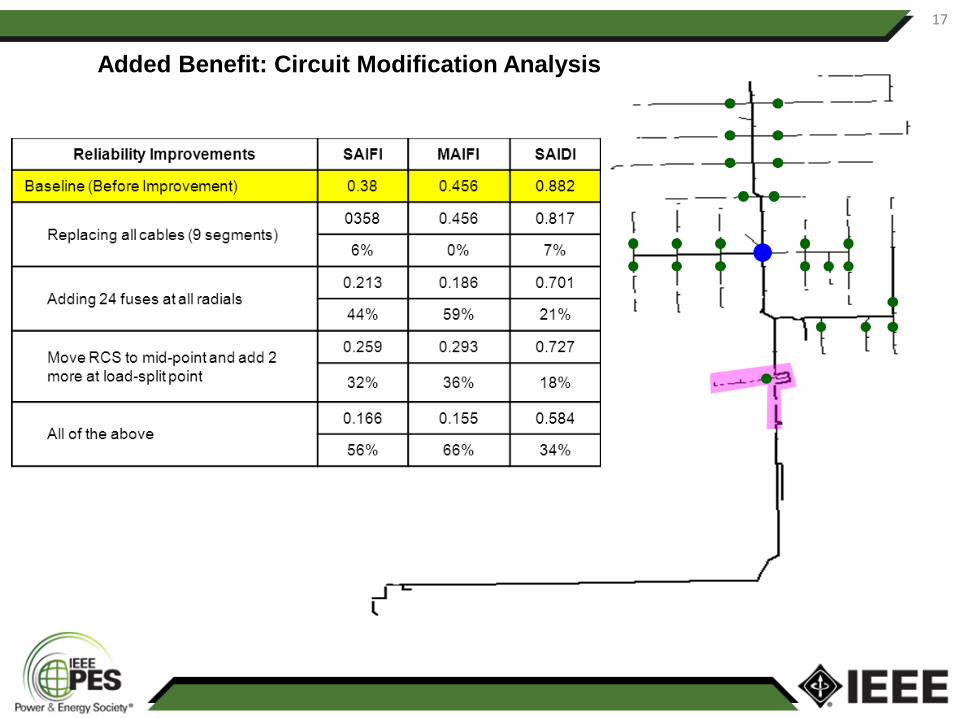
Added Benefit: Circuit Modification Analysis
17
Integrate cable testing
with infrastructure replacement
18
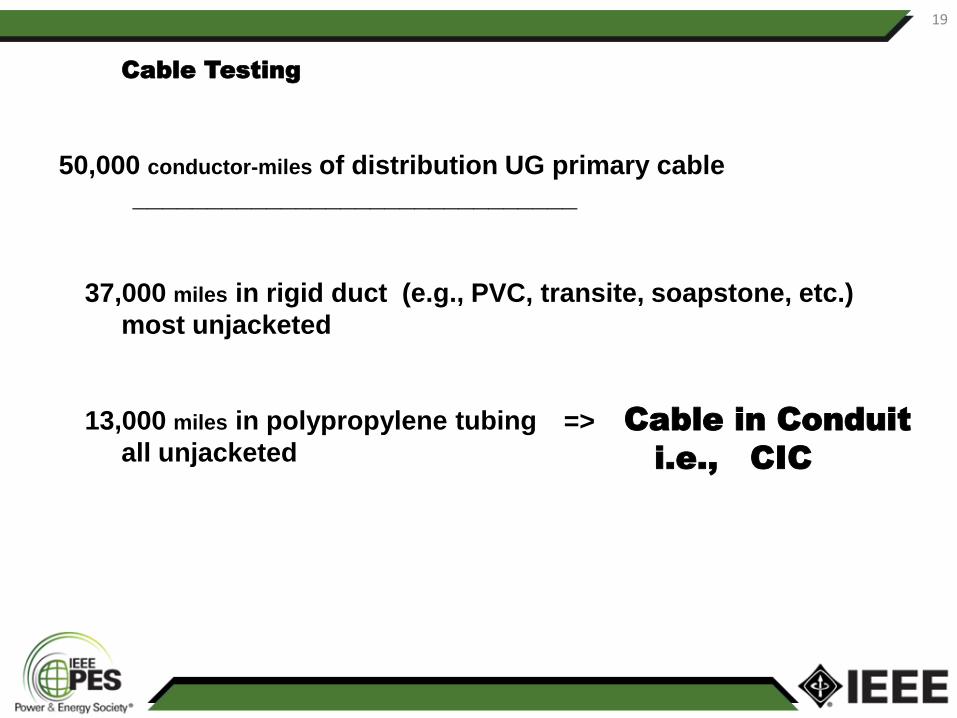
50,000 conductor-miles of distribution UG primary cable
______________________________
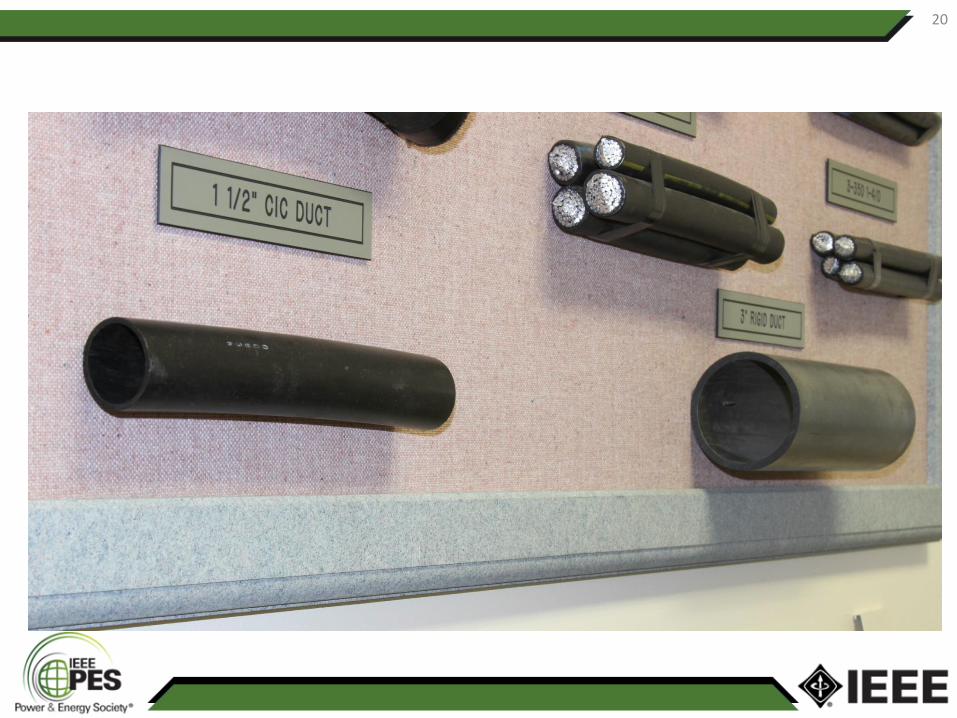
37,000 miles in rigid duct (e.g., PVC, transite, soapstone, etc.)
most unjacketed
13,000 miles in polypropylene tubing
all unjacketed
=> Cable in Conduit
i.e., CIC
Cable Testing
19
20
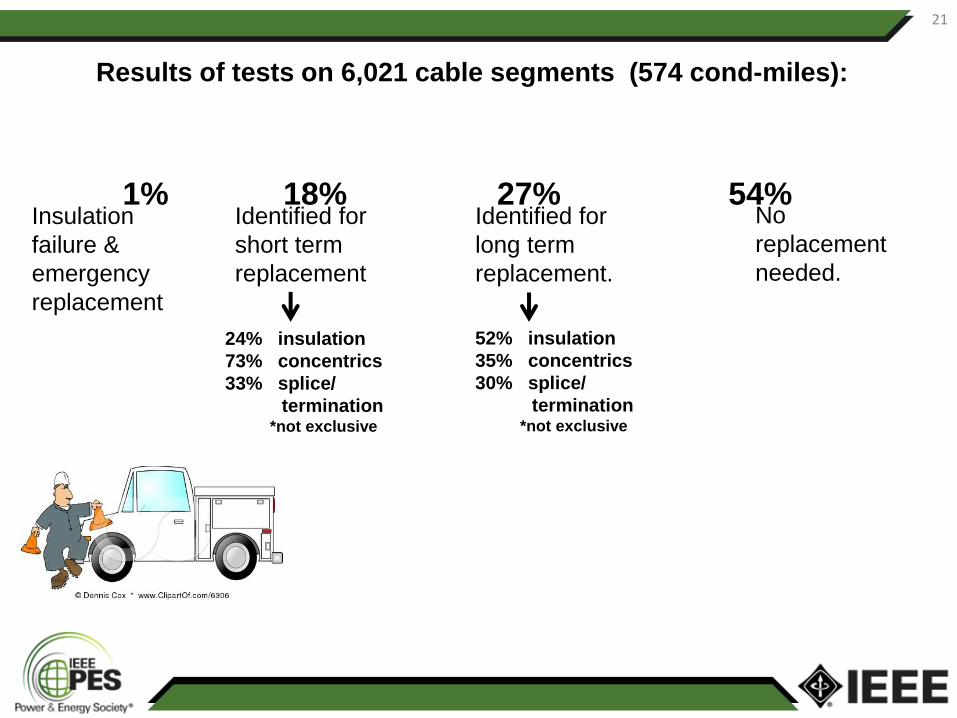
Identified for
short term
replacement
Identified for
long term
replacement.
Results of tests on 6,021 cable segments (574 cond-miles):
1% 18% 27% 54%
No
replacement
needed.
Insulation
failure &
emergency
replacement
24% insulation
73% concentrics
33% splice/
termination *not exclusive
52% insulation
35% concentrics
30% splice/
termination *not exclusive
21
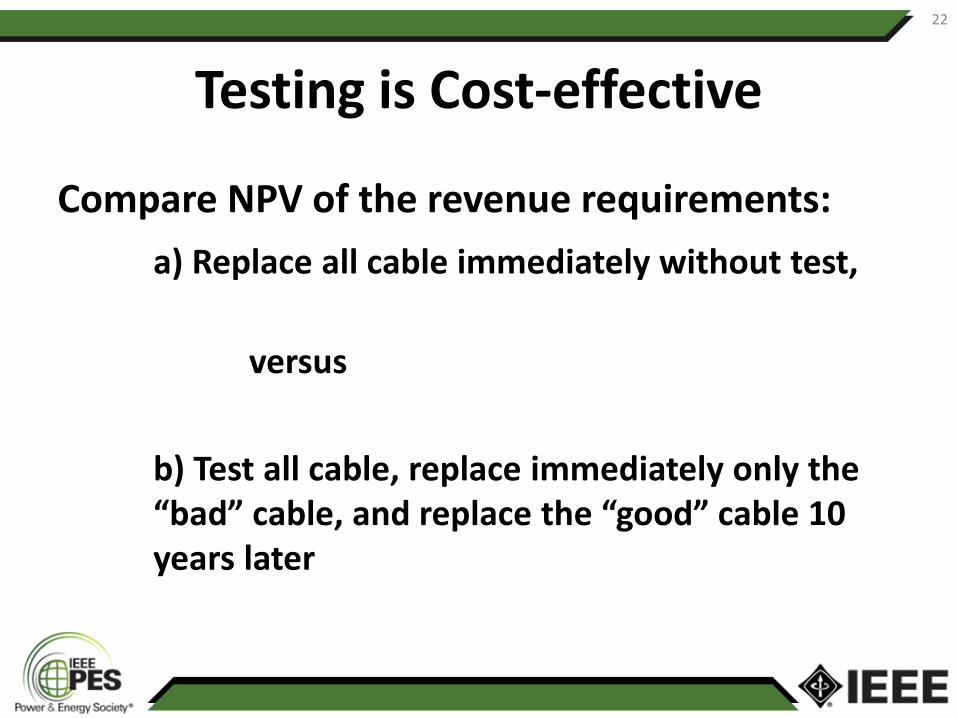
Testing is Cost-effective
Compare NPV of the revenue requirements:
a) Replace all cable immediately without test,
versus
b) Test all cable, replace immediately only the “bad” cable, and replace the “good” cable 10 years later
22
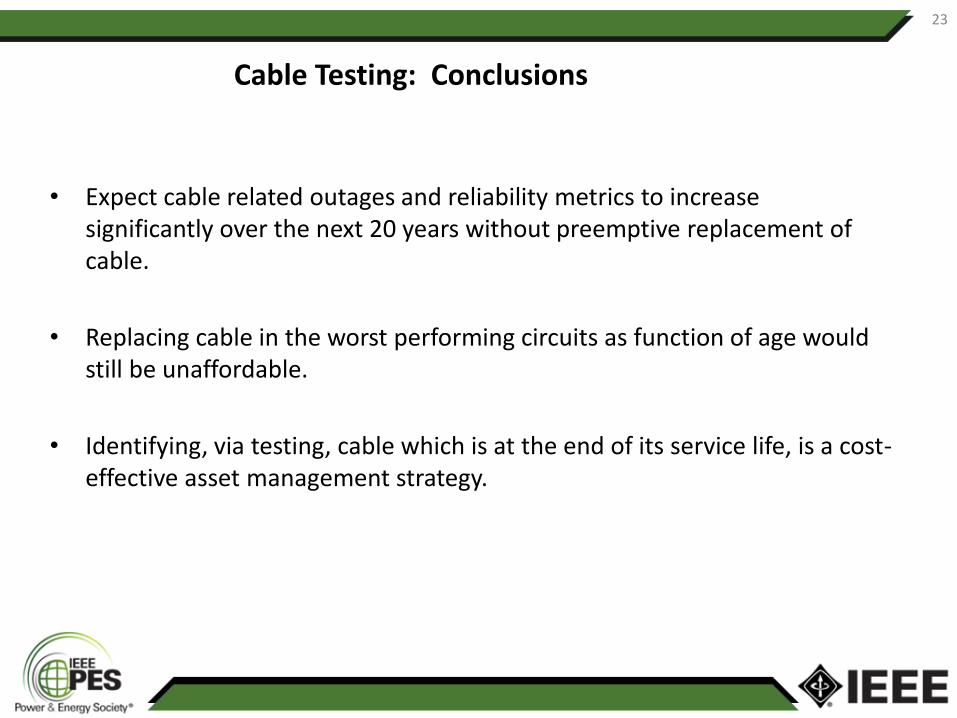
Cable Testing: Conclusions
• Expect cable related outages and reliability metrics to increase significantly over the next 20 years without preemptive replacement of cable.
• Replacing cable in the worst performing circuits as function of age would still be unaffordable.
• Identifying, via testing, cable which is at the end of its service life, is a cost-effective asset management strategy.
23
Substation Infrastructure Replacement: Based on health index to derive risk informed replacement ranking
. Transformers
. Circuit breakers . Auto Reclosers . Switches
24
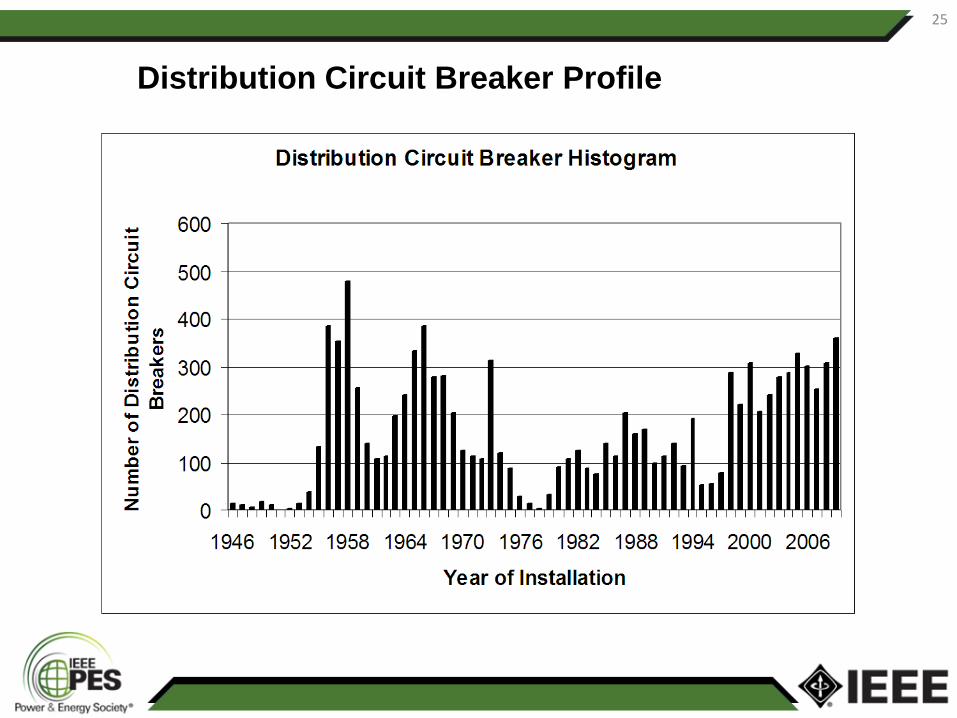
Distribution Circuit Breaker Profile
25
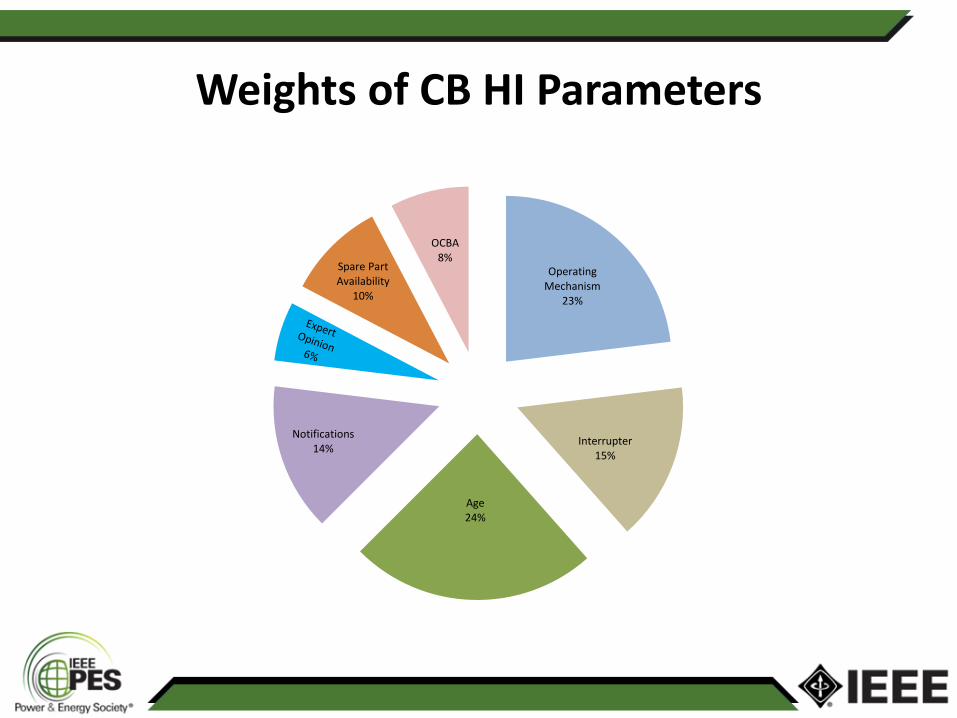
Weights of CB HI Parameters
Operating Mechanism
23%
Interrupter 15%
Age 24%
Notifications 14%
Spare Part Availability
10%
OCBA 8%
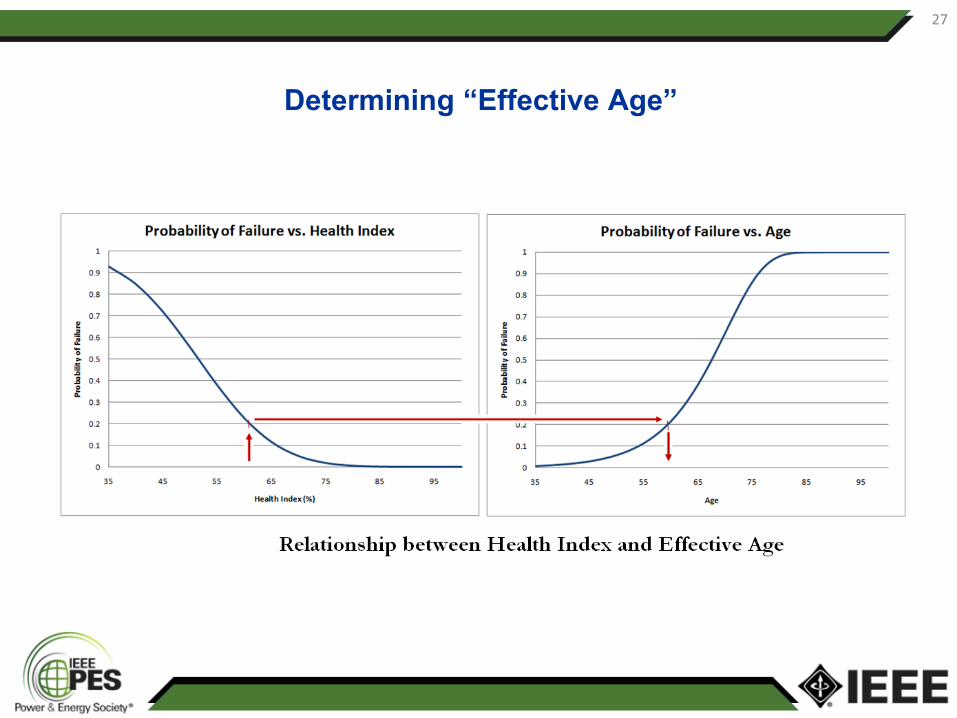
Determining “Effective Age”
27
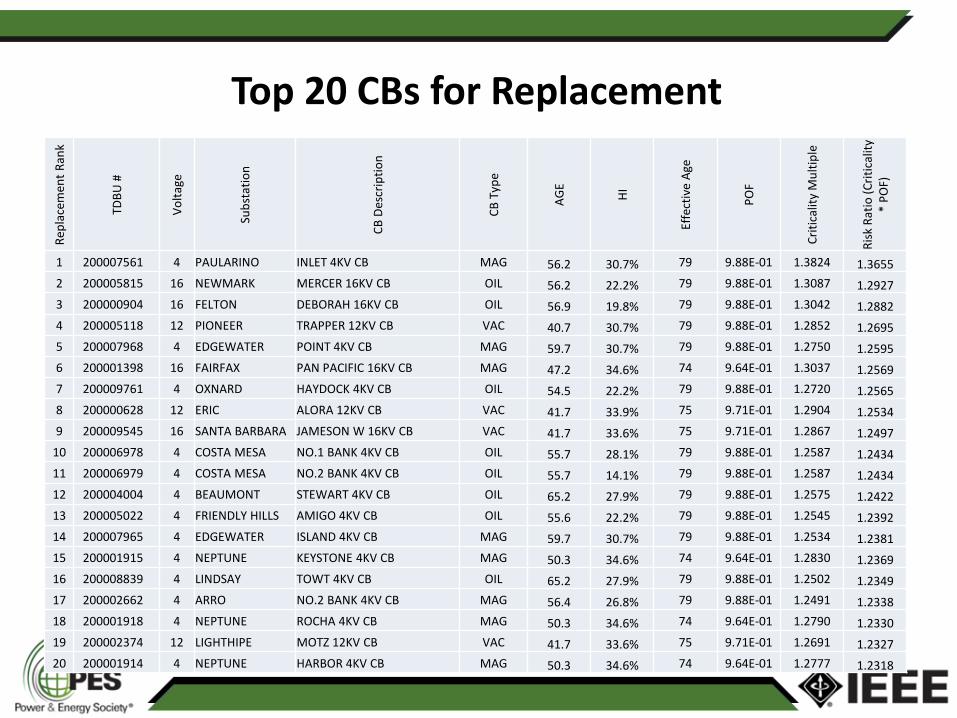
Top 20 CBs for Replacement R
epla
cem
ent
Ran
k
TDB
U #
Vo
ltag
e
Sub
stat
ion
CB
Des
crip
tio
n
CB
Typ
e
AG
E
HI
Effe
ctiv
e A
ge
PO
F
Cri
tica
lity
Mu
ltip
le
Ris
k R
atio
(C
riti
calit
y *
PO
F)
1 200007561 4 PAULARINO INLET 4KV CB MAG 56.2 30.7% 79 9.88E-01 1.3824 1.3655
2 200005815 16 NEWMARK MERCER 16KV CB OIL 56.2 22.2% 79 9.88E-01 1.3087 1.2927
3 200000904 16 FELTON DEBORAH 16KV CB OIL 56.9 19.8% 79 9.88E-01 1.3042 1.2882
4 200005118 12 PIONEER TRAPPER 12KV CB VAC 40.7 30.7% 79 9.88E-01 1.2852 1.2695
5 200007968 4 EDGEWATER POINT 4KV CB MAG 59.7 30.7% 79 9.88E-01 1.2750 1.2595
6 200001398 16 FAIRFAX PAN PACIFIC 16KV CB MAG 47.2 34.6% 74 9.64E-01 1.3037 1.2569
7 200009761 4 OXNARD HAYDOCK 4KV CB OIL 54.5 22.2% 79 9.88E-01 1.2720 1.2565
8 200000628 12 ERIC ALORA 12KV CB VAC 41.7 33.9% 75 9.71E-01 1.2904 1.2534
9 200009545 16 SANTA BARBARA JAMESON W 16KV CB VAC 41.7 33.6% 75 9.71E-01 1.2867 1.2497
10 200006978 4 COSTA MESA NO.1 BANK 4KV CB OIL 55.7 28.1% 79 9.88E-01 1.2587 1.2434
11 200006979 4 COSTA MESA NO.2 BANK 4KV CB OIL 55.7 14.1% 79 9.88E-01 1.2587 1.2434
12 200004004 4 BEAUMONT STEWART 4KV CB OIL 65.2 27.9% 79 9.88E-01 1.2575 1.2422
13 200005022 4 FRIENDLY HILLS AMIGO 4KV CB OIL 55.6 22.2% 79 9.88E-01 1.2545 1.2392
14 200007965 4 EDGEWATER ISLAND 4KV CB MAG 59.7 30.7% 79 9.88E-01 1.2534 1.2381
15 200001915 4 NEPTUNE KEYSTONE 4KV CB MAG 50.3 34.6% 74 9.64E-01 1.2830 1.2369
16 200008839 4 LINDSAY TOWT 4KV CB OIL 65.2 27.9% 79 9.88E-01 1.2502 1.2349
17 200002662 4 ARRO NO.2 BANK 4KV CB MAG 56.4 26.8% 79 9.88E-01 1.2491 1.2338
18 200001918 4 NEPTUNE ROCHA 4KV CB MAG 50.3 34.6% 74 9.64E-01 1.2790 1.2330
19 200002374 12 LIGHTHIPE MOTZ 12KV CB VAC 41.7 33.6% 75 9.71E-01 1.2691 1.2327
20 200001914 4 NEPTUNE HARBOR 4KV CB MAG 50.3 34.6% 74 9.64E-01 1.2777 1.2318
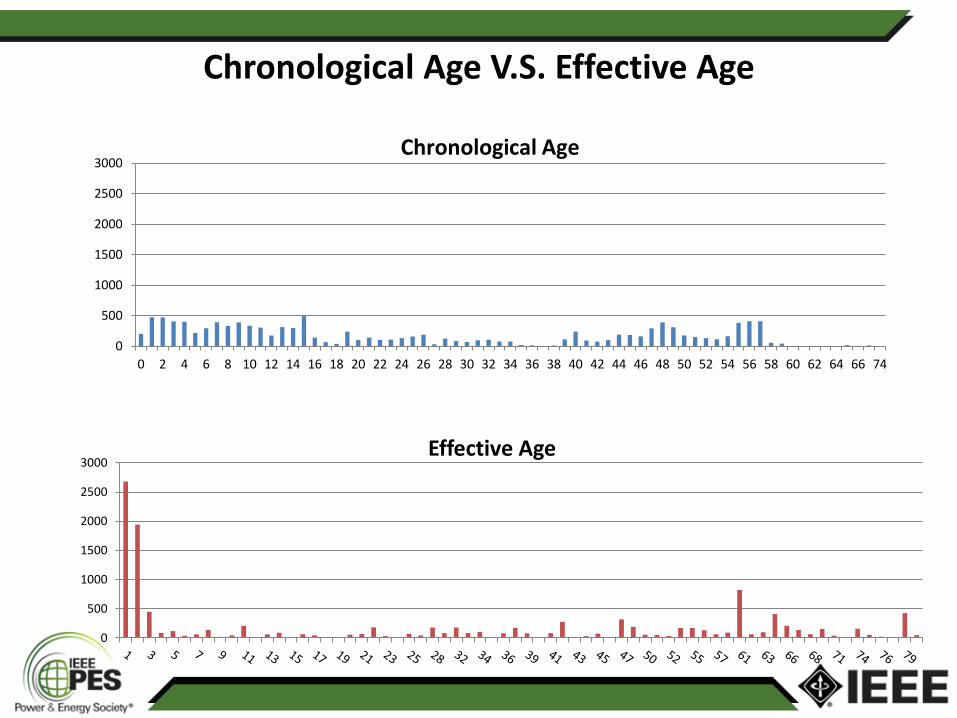
Chronological Age V.S. Effective Age
0
500
1000
1500
2000
2500
3000
0 2 4 6 8 10 12 14 16 18 20 22 24 26 28 30 32 34 36 38 40 42 44 46 48 50 52 54 56 58 60 62 64 66 74
Chronological Age
0
500
1000
1500
2000
2500
3000Effective Age
Ageing of power delivery system is real and needs be managed
Infrastructure replacement is an effective tool against ageing but needs be
managed with quantitative approach
Regulators appear to understand the need for infrastructure replacement to
manage system reliability
Quantitative risk assessments help understand the challenges and enable
approval funding requests
Risk assessments may not be optional in the future
Risk assessments are within the ability of any utility
Health index model integrates quantified parameters and can generate risk
informed ranking for infrastructure replacement
Summary
30