reliability-based design in geotechnical engineering_ 2008_baecher
DESCRIPTION
Optimising foundation designTRANSCRIPT

[14:21 1/2/2008 5108-Phoon-FM.tex] Job No: 5108 PHOON: RB Design in Geo. Eng. Page: i i–xii
Reliability-Based Design inGeotechnical Engineering

[14:21 1/2/2008 5108-Phoon-FM.tex] Job No: 5108 PHOON: RB Design in Geo. Eng. Page: ii i–xii
Also available from Taylor & Francis
Geological HazardsFred Bell Hb: ISBN 0419-16970-9
Pb: ISBN 0415-31851-3
Rock Slope EngineeringDuncan Wyllie and Chris Mah Hb: ISBN 0415-28000-1
Pb: ISBN 0415-28001-X
Geotechnical ModellingDavid Muir Wood Hb: ISBN 9780415343046
Pb: ISBN 9780419237303
Soil LiquefactionMike Jefferies and Ken Been Hb: ISBN 9780419161707
Advanced Unsaturated SoilMechanics and EngineeringCharles W.W. Ng and Bruce Menzies Hb: ISBN 9780415436793
Advanced Soil Mechanics 3rd editionBraja Das Hb: ISBN 9780415420266
Pile Design and Construction Practice5th editonMichael Tomlinson and John Woodward Hb: ISBN 9780415385824

[14:21 1/2/2008 5108-Phoon-FM.tex] Job No: 5108 PHOON: RB Design in Geo. Eng. Page: iii i–xii
Reliability-Based Design inGeotechnical EngineeringComputations andApplications
Kok-Kwang Phoon
[14:21 1/2/2008 5108-Phoon-FM.tex] Job No: 5108 PHOON: RB Design in Geo. Eng. Page: iv i–xii
First published 2008by Taylor & Francis2 Park Square, Milton Park, Abingdon, Oxon OX14 4RN
Simultaneously published in the USA and Canadaby Taylor & Francis270 Madison Avenue, New York, NY 10016, USA
Taylor & Francis is an imprint of the Taylor & Francis Group,an informa business
© Taylor & Francis
Typeset in Sabon by Keyword Group LtdPrinted and bound in Great Britain by
All rights reserved. No part of this book may be reprinted or reproducedor utilised in any form or by any electronic, mechanical, or other means,now known or hereafter invented, including photocopying and recording,or in any information storage or retrieval system, without permission inwriting from the publishers.
The publisher makes no representation, express or implied, with regardto the accuracy of the information contained in this book and cannotaccept any legal responsibility or liability for any efforts or omissions thatmay be made.
British Library Cataloguing in Publication DataA catalogue record for this book is availablefrom the British Library
Library of Congress Cataloging in Publication DataPhoon, Kok-Kwang.
Reliability-based design in geotechnical engineering: computations andapplications/Kok-Kwang Phoon.
p. cm.Includes bibliographical references and index.ISBN 978-0-415-39630-1 (hbk : alk. paper) – ISBN 978-0-203-93424-1
(e-book) 1. Rock mechanics. 2. Soil mechanics. 3. Reliability. I. Title.
TA706.P48 2008624.1’51–dc22 2007034643
ISBN10: 0-415-39630-1 (hbk)IBSN10: 0-213-93424-5 (ebk)
ISBN13: 978-0-415-39630-1 (hbk)ISBN13: 978-0-203-93424-1 (ebk)
[14:21 1/2/2008 5108-Phoon-FM.tex] Job No: 5108 PHOON: RB Design in Geo. Eng. Page: v i–xii
Contents
List of contributors vii
1 Numerical recipes for reliability analysis – a primer 1K. K. PHOON
2 Spatial variability and geotechnical reliability 76GREGORY B. BAECHER AND JOHN T. CHRISTIAN
3 Practical reliability approach using spreadsheet 134B. K. LOW
4 Monte Carlo simulation in reliability analysis 169YUSUKE HONJO
5 Practical application of reliability-based design indecision-making 192R. B. GILBERT, S. NAJJAR, Y. J. CHOI AND S. J. GAMBINO
6 Randomly heterogeneous soils under static anddynamic loads 224RADU POPESCU, GEORGE DEODATIS AND JEAN-HERVÉ PRÉVOST
7 Stochastic finite element methods in geotechnicalengineering 260BRUNO SUDRET AND MARC BERVEILLER
8 Eurocode 7 and reliability-based design 298TREVOR L. L. ORR AND DENYS BREYSSE
[14:21 1/2/2008 5108-Phoon-FM.tex] Job No: 5108 PHOON: RB Design in Geo. Eng. Page: vi i–xii
vi Contents
9 Serviceability limit state reliability-based design 344K. K. PHOON AND F. H. KULHAWY
10 Reliability verification using pile load tests 385LIMIN ZHANG
11 Reliability analysis of slopes 413TIEN H. WU
12 Reliability of levee systems 448T. F. WOLFF
13 Reliability analysis of liquefaction potential of soilsusing standard penetration test 497C. HSEIN JUANG, SUNNY YE FANG, AND DAVID KUN LI
[14:21 1/2/2008 5108-Phoon-FM.tex] Job No: 5108 PHOON: RB Design in Geo. Eng. Page: vii i–xii
List of contributors
Dr Kok-Kwang Phoon is Director of the Centre for Soft Ground Engineer-ing at the National University of Singapore. His main research interestis related to development of risk and reliability methods in geotechni-cal engineering. He has authored more than 120 scientific publications,including more than 20 keynote/invited papers and edited 15 proceedings.He is the founding editor-in-chief of Georisk and recipient of the presti-gious ASCE Normal Medal and ASTM Hogentogler Award. Webpage:http://www.eng.nus.edu.sg/civil/people/cvepkk/pkk.html
Gregory B. Baecher, PhD is Glenn L Martin Institute Professor of Engi-neering at the University of Maryland, where he teaches within theEngineering Project Management Program and the Maryland WaterResources Collaborative. He holds a BSCE from UC Berkeley, and ScMand PhD degrees from MIT. Dr. Baecher’s principal area of work is engi-neering and project risk management. He is co-author with J.T. Christianof, Reliability and Statistics in Geotechnical Engineering (Wiley, 2003),with D.N.D. Hartford of, Risk and Uncertainty in Dam Safety (Thos.Telford, 2004), and with K. Frolov of, Protection of Civil Infrastructurefrom Acts of Terrorism (Springer, 2006). Dr. Baecher is recipient of theASCE Middlebrooks and State-of-the-Art Awards, and was elected to theUS National Academy of Engineering in 2006.
John T. Christian, PhD, PE is a consulting geotechnical engineer inWaban, Massachusetts. He holds BSc, MSc, and PhD degrees from MIT.Dr. Christian’s principal area of interest is geotechnical engineering. Muchof his early work involved developing and applying numerical methods,and in more recent years he has focused on reliability methods, soildynamics, and earthquake engineering. Much of his work in industryhas been associated with power generating facilities, including but notlimited to nuclear power plants. A secondary interest has been the evolv-ing procedures and standards for undergraduate education, especially asreflected in the accreditation process. Dr. Christian is recipient of theASCE Middlebrooks Award and the BSCE Desmond Fitzgerald Medal,
[14:21 1/2/2008 5108-Phoon-FM.tex] Job No: 5108 PHOON: RB Design in Geo. Eng. Page: viii i–xii
viii List of contributors
and was elected to the US National Academy of Engineering in 1999.He was the 39th (2003) Karl Terzaghi Lecturer of the ASCE.
Bak Kong Low obtained his BS and MS degrees from MIT, and PhD degreefrom U.C.Berkeley. He is a Fellow of the ASCE, and a registered pro-fessional engineer of Malaysia. He currently teaches at the NanyangTechnological University in Singapore. He had done research while onsabbaticals at HKUST (1996), University of Texas at Austin (1997)and Norwegian Geotechnical Institute (2006). His research interest andpublications can be found at http://alum.mit.edu/www/bklow.
Yusuke Honjo is currently a professor and the head of Civil EngineeringDepartment at Gifu University in Japan. He is very active in reliabilityanalyses and design code development and is currently the chairpersonof International Society of Soil Mechanics and Geotechnical Engineer-ing (ISSMGE) Technical Committee (TC) 23 ‘Limit state design ingeotechnical engineering practice’ for the term 2001–2009.
Yusuke has published about 100 journal papers and international confer-ence papers in the area of statistical analyses of geotechnical data, inverseanalysis and reliability analyses of geotechnical structures.
Yusuke has received B.E. from Nagoya institute of Technology in 1973and M.E. from Kyoto University in 1975, and Ph.D. from MIT in 1985.He was an associate professor and division chairman at Asian Institute ofTechnology (AIT) in Bangkok between 1989 and 1993. He joined GifuUniversity in 1995.
Radu Popescu is a Consulting Engineer with URS Corporation and aResearch Professor at Memorial University of Newfoundland, Canada.He earned Ph.D. degrees from the Technical University of Bucharestand from Princeton University. He was a Visiting Research Fellowat Princeton University, Columbia University and Saitama University(Japan) and Lecturer at the Technical University of Bucharest (Romania)and Princeton University. Radu has over 25 years experience in compu-tational and experimental soil mechanics (dynamic soil-structure inter-action, soil liquefaction, centrifuge modeling, site characterization) andpublished over 100 articles in these areas. In his research he uses the toolsof probabilistic mechanics to address various uncertainties manifested inthe geologic environment.
Jean H. Prevost is presently Professor of Civil and Environmental Engineer-ing at Princeton University. He is also an affiliated faculty at the PrincetonMaterials Institute, in the department of Mechanical and Aerospace Engi-neering and in the Program in Applied and Computational Mathematics.He received his M.Sc. in 1972 and his Ph.D. in 1974 from StanfordUniversity. He was a post-doctoral Research Fellow at the NorwegianGeotechnical Institute in Oslo, Norway (1974–1976), and a Research
[14:21 1/2/2008 5108-Phoon-FM.tex] Job No: 5108 PHOON: RB Design in Geo. Eng. Page: ix i–xii
List of contributors ix
Fellow and Lecturer in Civil Engineering at the California Institute ofTechnology (1976–1978). He held visiting appointments at the EcolePolytechnique in Paris, France (1984–1985, 2004–2005), at the EcolePolytechnique in Lausanne, Switzerland (1984), at Stanford University(1994), and at the Institute for Mechanics and Materials at UCSD (1995).He was the Director of the Structures and Mechanics program at PrincetonUniversity (1986–1989), and Chairman of the Department of Civil Engi-neering and Operations Research at Princeton University (1989–1994).His principal areas of interest include dynamics, nonlinear continuummechanics, mixture theories, finite element methods, XFEM and con-stitutive theories. He is the author of over 185 technical papers in hisareas of interest. He is currently doing research on topology optimiza-tion, delayed fracture in MEMS, in cracks propagation in microstruc-tures, and reservoir models for CO2 sequestration in deep salineaquifers.
George Deodatis received his Diploma in Civil Engineering from theNational Technical University of Athens in Greece. He holds M.S. andPh.D. degrees in Civil Engineering from Columbia University. He startedhis academic career at Princeton University where he served as a Post-doctoral Fellow, Assistant Professor and eventually Associate Professor.He subsequently moved to Columbia University where he is currently theSantiago and Robertina Calatrava Family Professor at the Department ofCivil Engineering and Engineering Mechanics.
Dr. Bruno Sudret has a master’s degree from Ecole Polytechnique (France,1993), a master’s degree in civil engineering from Ecole Nationale desPonts et Chaussées (1995) and a Ph.D in civil engineering from the sameinstitution (1999). He started his work on probabilistic methods as apost-doctoral visiting scholar at the University of California at Berkeleyin 2000. He then joined EDF (the French major electrical company) as aresearch engineer in 2001. He currently manages a research group of 5 atEDF, which deals with probabilistic engineering mechanics and its appli-cations to components of nuclear power plants. He is member of the JointCommittee on Structural Safety since 2004 and member of the board ofdirectors of the International Civil Engineering Risk and Reliability Asso-ciation since 2007. He got the Jean Mandel Prize in 2005 for his workon structural reliability and stochastic finite element methods (this prizeis awarded every second year by the French Association of Mechanics tothe best young researcher under 35 in the field).
Dr. Marc Berveiller was born in 1979. He has a master’s degree in mechanicalengineering from the French Institute in Advanced Mechanics (Clermont-Ferrand, France, 2002). He got his Ph.D from the Blaise Pascal University(Clermont-Ferrand, France) in 2005, where he worked on “non intrusive
[14:21 1/2/2008 5108-Phoon-FM.tex] Job No: 5108 PHOON: RB Design in Geo. Eng. Page: x i–xii
x List of contributors
stochastic finite element methods” in collaboration with the French majorelectrical company EDF. He is currently working as a research engineerat EDF on probabilistic methods in mechanics.
Trevor Orr is a Senior Lecturer at Trinity College, Dublin and has beeninvolved in Eurocode 7 since the first drafting committee was establishedin 1981. In 2003 he was appointed Chair of the European Technical Com-mittee 10 for the Evaluation of Eurocode 7 and in 2007 was appointeda member of the CEN Maintenance Group for Eurocode 7. He is theco-author of two books on Eurocode 7.
Pr. Denys Breysse, is a Professor of Civil Engineering at Bordeaux 1University, France. He is working on randomness in soils and buildingmaterials, teaches geotechnics, materials science and risk and safety. Heis the chairman of the French Association of Civil Engineering UniversityMembers (AUGC) and of the RILEM Technical Committee TC-INR 207on Non Destructive Assessment of Reinforced Concrete Structures. Hehas also created (and chaired 2003–2007) a national research scientificnetwork on Risk Management in Civil Engineering (MR-GenCi).
Dr. Fred H. Kulhawy is Professor of Civil Engineering at Cornell University,Ithaca, New York. He received his BSCE and MSCE from New JerseyInstitute of Technology and his PhD from University of California atBerkeley. His teaching and research focuses on foundations, soil-structureinteraction, soil and rock behavior, and geotechnical computer and reli-ability applications, and he has authored over 330 publications. Hehas lectured worldwide and has received numerous awards from ASCE,ADSC, IEEE, and others, including election to Distinguished Member ofASCE and the ASCE Karl Terzaghi Award and Norman Medal. He isa licensed engineer and has extensive experience in geotechnical practicefor major projects on six continents.
Dr LM Zhang is Associate Professor of Civil Engineering and AssociateDirector of Geotechnical Centrifuge Facility at the Hong Kong Universityof Science and Technology. His research areas include pile foundations,dams and slopes, centrifuge modelling, and geotechnical risk and reliabil-ity. He is currently secretary of Technical Committee TC23 on ‘LimitState Design in Geotechnical Engineering’, and member of TC18 on‘Deep Foundations’ of the ISSMGE, and Vice Chair of the InternationalPress-In Association.
Dr. Thomas F. Wolff has 40 years experience in the planning, design andconstruction of dams and levees. From 1970 to 1985, he was employedas a geotechnical engineer with the St. Louis District of the Corps ofEngineers. Since 1986, he has been on the faculty of Michigan StateUniversity, where his activities have included a variety of teaching,
[14:21 1/2/2008 5108-Phoon-FM.tex] Job No: 5108 PHOON: RB Design in Geo. Eng. Page: xi i–xii
List of contributors xi
research and consulting activities in geotechnical reliability analysis, earthand hydraulic structures, and more recently, engineering education.
Dr. Charng Hsein Juang is a professor of Civil Engineering at Clemson Uni-versity, South Carolina. He is a registered Professional Engineering inthe State of South Carolina, and a Fellow of ASCE. Among his honorsare being a recipient of the TK Hsieh Award from the United Kingdom’sInstitution of Civil Engineers and an appointment to the Chair Professorof Civil Engineering at National Central University in Chungli, Taiwan.Dr. David Kun Li and Dr. Sunny Ye Fang are two recent PhD graduatesfrom Clemson University.

[14:21 1/2/2008 5108-Phoon-FM.tex] Job No: 5108 PHOON: RB Design in Geo. Eng. Page: xii i–xii
[17:33 1/2/2008 5108-Phoon-Ch02.tex] Job No: 5108 PHOON: RB Design in Geo. Eng. Page: 76 76–133
Chapter 2
Spatial variability andgeotechnical reliability
Gregory B. Baecher and John T. Christian
Quantitative measurement of soil properties differentiated the new disciplineof soil mechanics in the early 1900s from the engineering of earth workspracticed since antiquity. These measurements, however, uncovered a greatdeal of variability in soil properties, not only from site to site and stratumto stratum, but even within what seemed to be homogeneous deposits. Wecontinue to grapple with this variability in current practice, although newtools of both measurement and analysis are available for doing so. Thischapter summarizes some of the things we know about the variability ofnatural soils and how that variability can be described and incorporated inreliability analysis.
2.1 Variability of soil properties
Table 2.1 illustrates the extent to which soil property data vary, accordingto Phoon and Kulhawy (1996), who have compiled coefficients of variationfor a variety of soil properties. The coefficient of variation is the standarddeviation divided by the mean. Similar data have been reported by Lumb(1966, 1974), Lee et al. (1983), and Lacasse and Nadim (1996), amongothers. The ranges of these reported values are wide and are only suggestiveof conditions at a specific site.
It is convenient to think about the impact of variability on safety byformulating the reliability index,
β = E[MS]SD[MS]or
E[FS]− 1SD[FS] (2.1)
in which β = reliability index, MS = margin of safety (resistance minusload), FS = factor of safety (resistance divided by load), E[·] = expectation,and SD[·] = standard deviation. It should be noted that the two definitionsof β are not identical unless MS = 0 or FS = 1. Equation 2.1 expressesthe number of standard deviations separating expected performance from afailure state.
[17:33 1/2/2008 5108-Phoon-Ch02.tex] Job No: 5108 PHOON: RB Design in Geo. Eng. Page: 77 76–133
Spatial variability and geotechnical reliability 77
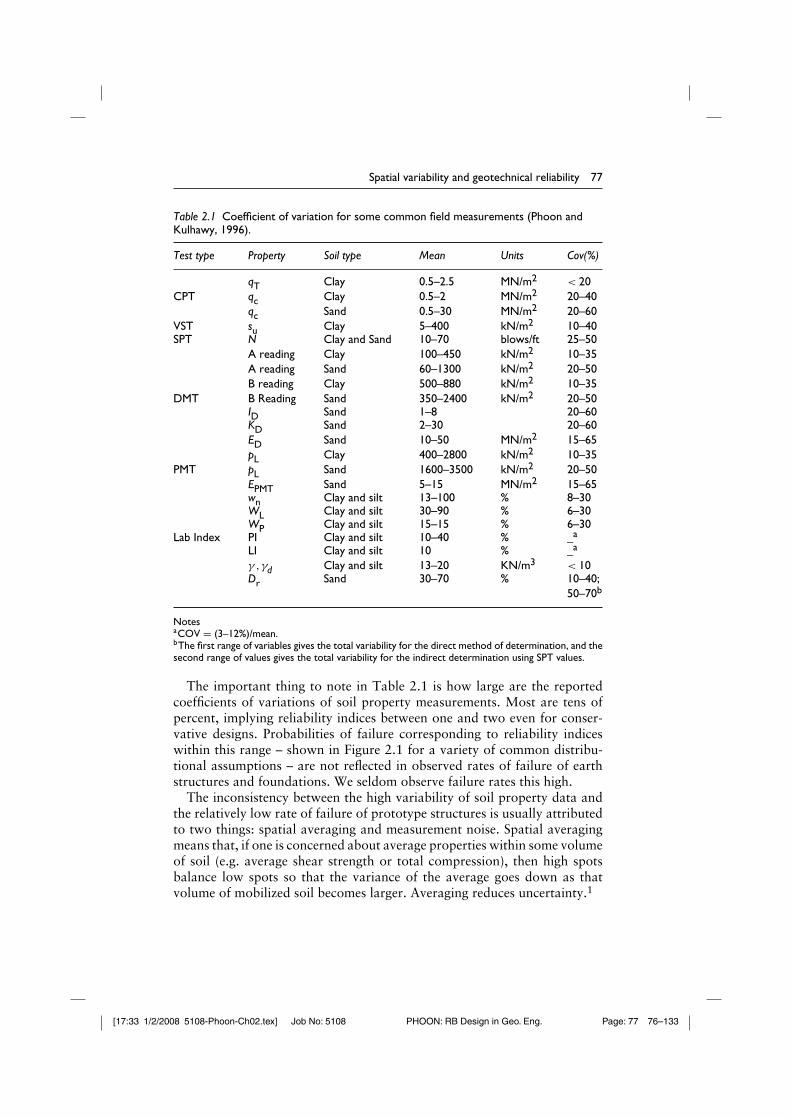
Table 2.1 Coefficient of variation for some common field measurements (Phoon andKulhawy, 1996).
Test type Property Soil type Mean Units Cov(%)
qT Clay 0.5–2.5 MN/m2 < 20CPT qc Clay 0.5–2 MN/m2 20–40
qc Sand 0.5–30 MN/m2 20–60VST su Clay 5–400 kN/m2 10–40SPT N Clay and Sand 10–70 blows/ft 25–50
A reading Clay 100–450 kN/m2 10–35A reading Sand 60–1300 kN/m2 20–50B reading Clay 500–880 kN/m2 10–35
DMT B Reading Sand 350–2400 kN/m2 20–50ID Sand 1–8 20–60KD Sand 2–30 20–60ED Sand 10–50 MN/m2 15–65pL Clay 400–2800 kN/m2 10–35
PMT pL Sand 1600–3500 kN/m2 20–50EPMT Sand 5–15 MN/m2 15–65wn Clay and silt 13–100 % 8–30WL Clay and silt 30–90 % 6–30WP Clay and silt 15–15 % 6–30
Lab Index PI Clay and silt 10–40 % _a
LI Clay and silt 10 % _a
γ ,γd Clay and silt 13–20 KN/m3 < 10Dr Sand 30–70 % 10–40;
50–70b
NotesaCOV = (3–12%)/mean.bThe first range of variables gives the total variability for the direct method of determination, and thesecond range of values gives the total variability for the indirect determination using SPT values.
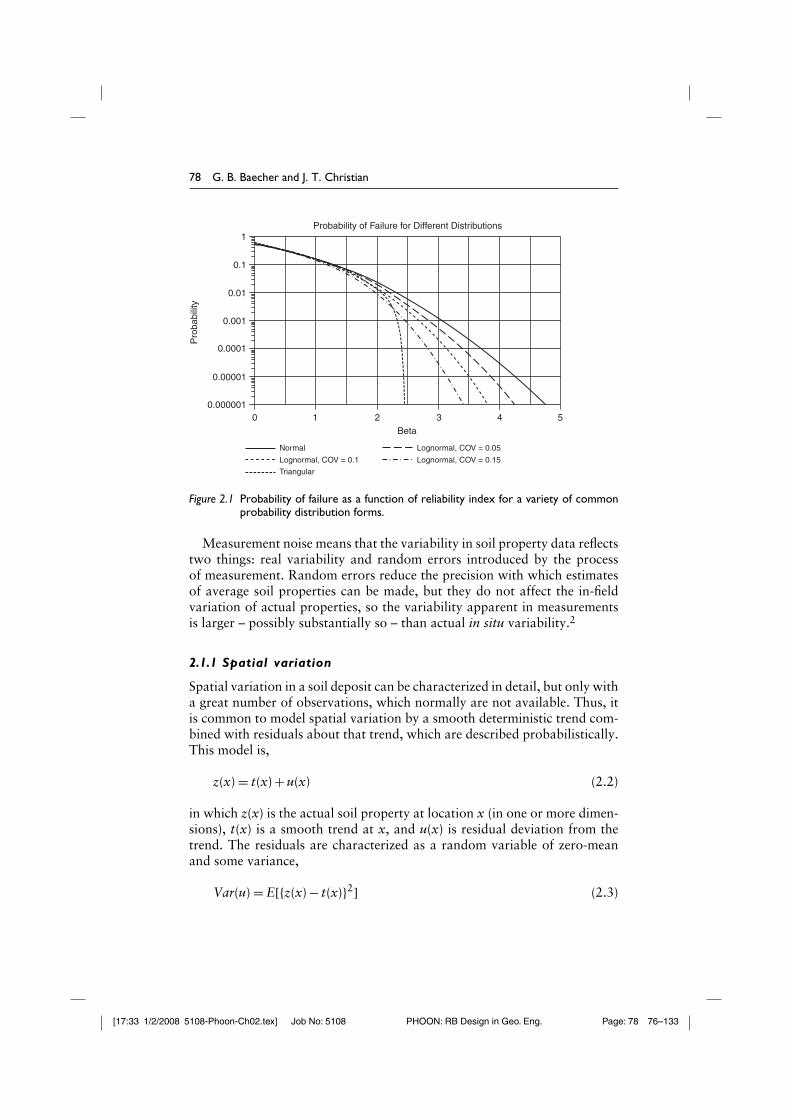
The important thing to note in Table 2.1 is how large are the reportedcoefficients of variations of soil property measurements. Most are tens ofpercent, implying reliability indices between one and two even for conser-vative designs. Probabilities of failure corresponding to reliability indiceswithin this range – shown in Figure 2.1 for a variety of common distribu-tional assumptions – are not reflected in observed rates of failure of earthstructures and foundations. We seldom observe failure rates this high.
The inconsistency between the high variability of soil property data andthe relatively low rate of failure of prototype structures is usually attributedto two things: spatial averaging and measurement noise. Spatial averagingmeans that, if one is concerned about average properties within some volumeof soil (e.g. average shear strength or total compression), then high spotsbalance low spots so that the variance of the average goes down as thatvolume of mobilized soil becomes larger. Averaging reduces uncertainty.1
[17:33 1/2/2008 5108-Phoon-Ch02.tex] Job No: 5108 PHOON: RB Design in Geo. Eng. Page: 78 76–133
78 G. B. Baecher and J. T. Christian
1
0.1
Probability of Failure for Different Distributions
0.01
0.001
0.0001
Pro
babi
lity
0.00001
0.0000010 1 2 3
Beta
Normal
Lognormal, COV = 0.1
Triangular
Lognormal, COV = 0.05
Lognormal, COV = 0.15
4 5
Figure 2.1 Probability of failure as a function of reliability index for a variety of commonprobability distribution forms.
Measurement noise means that the variability in soil property data reflectstwo things: real variability and random errors introduced by the processof measurement. Random errors reduce the precision with which estimatesof average soil properties can be made, but they do not affect the in-fieldvariation of actual properties, so the variability apparent in measurementsis larger – possibly substantially so – than actual in situ variability.2
2.1.1 Spatial variation
Spatial variation in a soil deposit can be characterized in detail, but only witha great number of observations, which normally are not available. Thus, itis common to model spatial variation by a smooth deterministic trend com-bined with residuals about that trend, which are described probabilistically.This model is,
z(x) = t(x) + u(x) (2.2)
in which z(x) is the actual soil property at location x (in one or more dimen-sions), t(x) is a smooth trend at x, and u(x) is residual deviation from thetrend. The residuals are characterized as a random variable of zero-meanand some variance,
Var(u) = E[{z(x) − t(x)}2] (2.3)
[17:33 1/2/2008 5108-Phoon-Ch02.tex] Job No: 5108 PHOON: RB Design in Geo. Eng. Page: 79 76–133
Spatial variability and geotechnical reliability 79
in which Var(x) is the variance. The residuals are characterized as randombecause there are too few data to do otherwise. This does not presume thatsoil properties actually are random. The variance of the residuals reflectsuncertainty about the difference between the fitted trend and the actual valueof soil properties at particular locations. Spatial variation is modeled stochas-tically not because soil properties are random but because information islimited.
2.1.2 Trend analysis
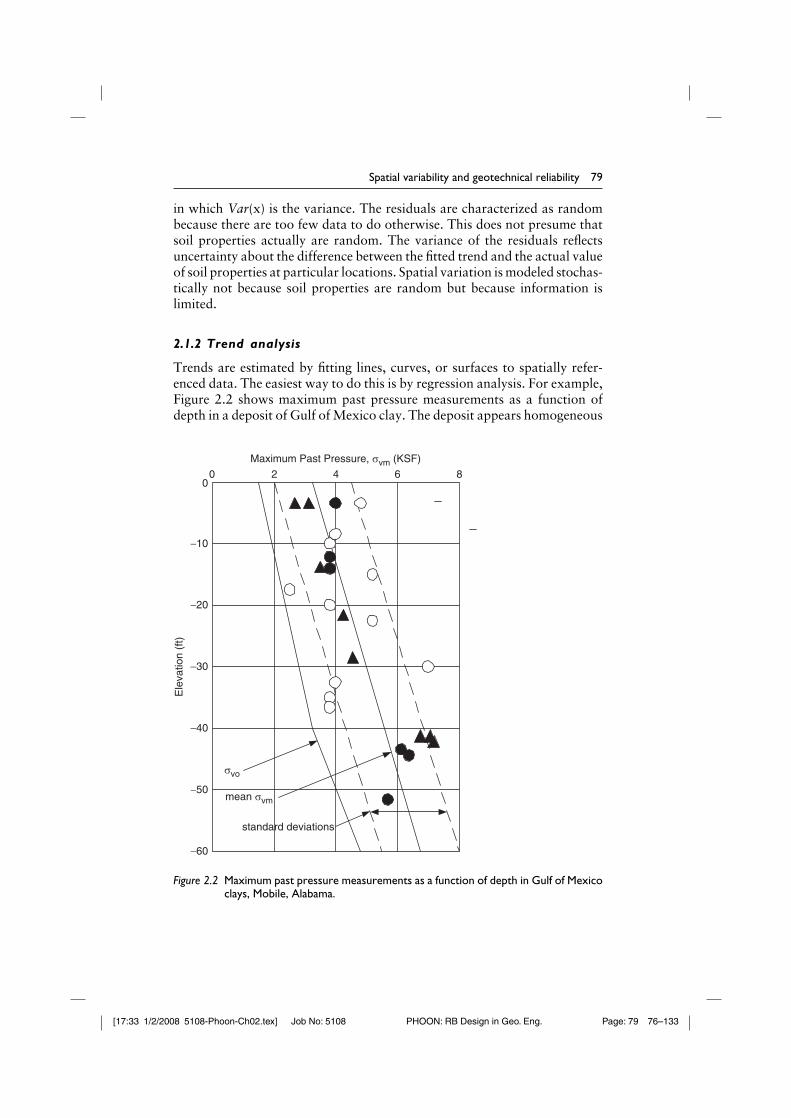
Trends are estimated by fitting lines, curves, or surfaces to spatially refer-enced data. The easiest way to do this is by regression analysis. For example,Figure 2.2 shows maximum past pressure measurements as a function ofdepth in a deposit of Gulf of Mexico clay. The deposit appears homogeneous
Maximum Past Pressure, σvm (KSF)
Ele
vatio
n (f
t)
0 2 4 6 8
−60
−50
−40
−30
−20
−10
0
σvo
mean σvm
standard deviations
Figure 2.2 Maximum past pressure measurements as a function of depth in Gulf of Mexicoclays, Mobile, Alabama.
[17:33 1/2/2008 5108-Phoon-Ch02.tex] Job No: 5108 PHOON: RB Design in Geo. Eng. Page: 80 76–133
80 G. B. Baecher and J. T. Christian
and mostly normally consolidated. The increase of maximum past pressurewith depth might be expected to be linear. Data from an over-consolidateddesiccated crust are not shown. The trend for the maximum past pressuredata, σ ′
vm, with depth x is,
σ ′vm = t(x) + u(x) = α0 +α1x = u (2.4)
in which t(x) is the trend of maximum past pressure with depth, x; α0and α1 are regression coefficients; and u is residual variation about thetrend taken to be constant with depth (i.e. it is not a function of x).Applying standard least squares analysis, the regression coefficients mini-mizing Var[u], are α0 = 3 ksf (0.14 KPa) and α1 = 0.06 ksf/ft (1.4 × 10⁻³
KPa/m), yielding Var(u) = 1.0 ksf (0.05 KPa), for which the correspondingtrend line is shown. The trend t(x) = 3 + 0.06x is the best estimate or meanof the maximum past pressure as a function of depth. (NB: ksf = kip persquare foot.)
The analysis can be made of data in higher dimensions, which in matrixnotation becomes,
z = Xα + u (2.5)
in which z is the vector of the n observations z={z1, …, zn}, X={x1, x2} isthe 2 x n matrix of location coordinates corresponding to the observations,α = α{α1, … , αn } is the vector of trend parameters, and u is the vectorof residuals corresponding to the observations. Minimizing the variance ofthe residuals u(x) over α gives the best-fitting trend surface in a frequentistsense, which is the common regression surface.
The trend surface can be made more flexible; for example, in the quadraticcase, the linear expression is replaced by
z = α0 +α1x +α2x2 + u (2.6)
and the calculation for α performed the same way. Because the quadraticsurface is more flexible than the planar surface, it fits the observed datamore closely, and the residual variations about it are smaller. On the otherhand, the more flexible the trend surface, the more regression parameters thatneed to be estimated from a fixed number of data, so the fewer the degrees offreedom, and the greater the statistical error in the surface. Examples of theuse of trend surfaces in the geotechnical literature are given by Wu (1974),Ang and Tang (1975), and many others.
Historically, it has been common for trend analysis in geotechnicalengineering to be performed using frequentist methods. Although this istheoretically improper, because frequentist methods yield confidence inter-vals rather than probability distributions on parameters, the numericalerror is negligible. The Bayesian approach begins with the same model.
[17:33 1/2/2008 5108-Phoon-Ch02.tex] Job No: 5108 PHOON: RB Design in Geo. Eng. Page: 81 76–133
Spatial variability and geotechnical reliability 81
However, rather than defining an estimator such as the least squarescoefficients, the Bayesian approach specifies an a priori probability distri-bution on the coefficients of the model,and uses Bayes’s Theorem to updatethat distribution in light of the observed data.
The following summarizes Bayesian results from Zellner (1971) for theone-dimensional linear case of Equation (2.4). Let Var(u)= σ 2, so thatVar(u) = Iσ 2, in which I is the identity matrix. The prior probability densityfunction (pdf) of the parameters {α,σ } is represented as f (α,σ ). Given a set ofobservations z = {z1 , …, zn}, the updated or posterior pdf of {α,σ } is foundfrom Bayes’s Theorem as, f (α,σ |z) ∝ f (α,σ )L(α,σ |z), in which L(α,σ |z) isthe Likelihood of the data (i.e. the conditional probability of the observeddata for various values of the parameters). If variations about the trend lineor surface are jointly Normal, the likelihood function is,
L(α,σ |z) = MN(z|α,σ )∝, exp{−(z − Xα)′�−1(z − Xα)} (2.7)
in which MN(.) is the Multivariate-Normal distribution having mean Xα
and covariance matrix � = Iσ .Using a non-informative prior, f (α, σ ) ∝ σ−1, and measurements y made
at depths x, the posterior pdf of the regression parameters is,
f (α0,α1,σ |x,y) ∝ 1σ n+1 exp
[− 1
2σ 2
∑n
i=1(y1 − (α0 +α1x1))2
](2.8)
The marginal distributions are,
f (α0,α1|x,y) ∝ [νs2 + n(α0 −α0) + 2(α0 −α0)(α1 −α1)�xi
+ (α1 −α1)2�x21]−n/2
f (α0|x,y) ∝ [ν + �(xi − x)2
s2�x2i /n
(α0 −α0)2]−(ν−1)/2 (2.9)
f (α1|x,y) ∝ [ν + �(xi − x)2
s2 (α1 −α1)2]−(ν−1)/2
f (σ |x,y) ∝ 1σν−1 exp
(− νs2
2σ 2
)
in which,
ν = n − 2
α0 = y −α1x, α1 =[∑(
xi − x)(
yi − y)]/[∑(
xi − x)]
s2 = ν−1∑(
yi −α0 −α1xi
)2
[17:33 1/2/2008 5108-Phoon-Ch02.tex] Job No: 5108 PHOON: RB Design in Geo. Eng. Page: 82 76–133
82 G. B. Baecher and J. T. Christian
y = n−1∑
yi
x = n−1∑
xi
The joint and marginal pdf’s of the regression coefficients are Student-tdistributed.
2.1.3 Autocorrelation
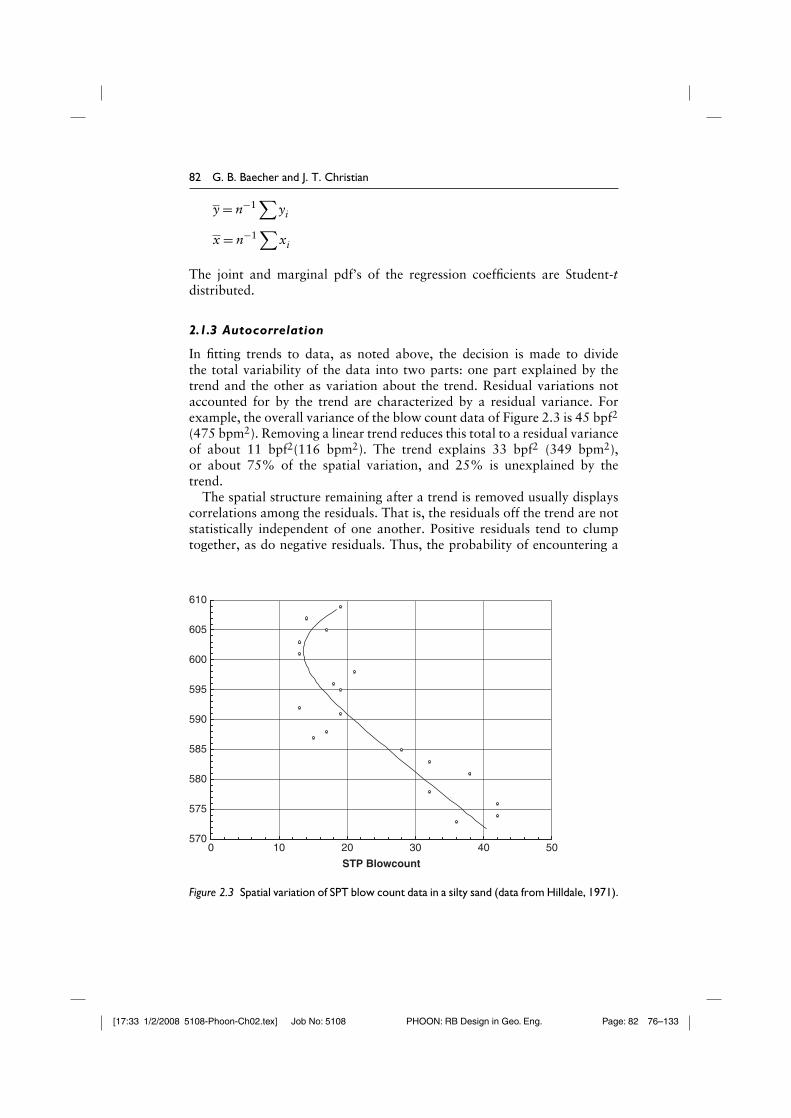
In fitting trends to data, as noted above, the decision is made to dividethe total variability of the data into two parts: one part explained by thetrend and the other as variation about the trend. Residual variations notaccounted for by the trend are characterized by a residual variance. Forexample, the overall variance of the blow count data of Figure 2.3 is 45 bpf2
(475 bpm2). Removing a linear trend reduces this total to a residual varianceof about 11 bpf2(116 bpm2). The trend explains 33 bpf2 (349 bpm2),or about 75% of the spatial variation, and 25% is unexplained by thetrend.
The spatial structure remaining after a trend is removed usually displayscorrelations among the residuals. That is, the residuals off the trend are notstatistically independent of one another. Positive residuals tend to clumptogether, as do negative residuals. Thus, the probability of encountering a
570
575
580
585
590
595
600
605
610
0 10 20 30 40
STP Blowcount
50
Figure 2.3 Spatial variation of SPT blow count data in a silty sand (data from Hilldale, 1971).
[17:33 1/2/2008 5108-Phoon-Ch02.tex] Job No: 5108 PHOON: RB Design in Geo. Eng. Page: 83 76–133
Spatial variability and geotechnical reliability 83
−2.5
−2
−1.5
−1
−0.5
0
0.5
1
1.5
2
Distance along transect
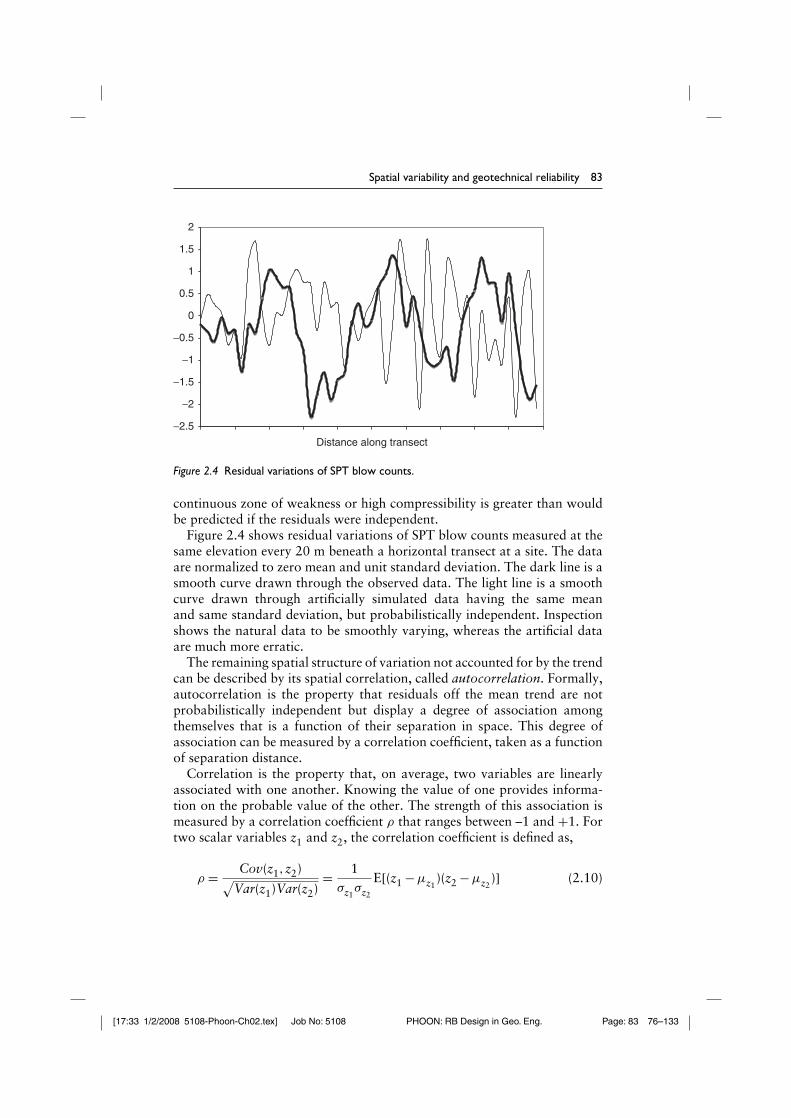
Figure 2.4 Residual variations of SPT blow counts.
continuous zone of weakness or high compressibility is greater than wouldbe predicted if the residuals were independent.
Figure 2.4 shows residual variations of SPT blow counts measured at thesame elevation every 20 m beneath a horizontal transect at a site. The dataare normalized to zero mean and unit standard deviation. The dark line is asmooth curve drawn through the observed data. The light line is a smoothcurve drawn through artificially simulated data having the same meanand same standard deviation, but probabilistically independent. Inspectionshows the natural data to be smoothly varying, whereas the artificial dataare much more erratic.
The remaining spatial structure of variation not accounted for by the trendcan be described by its spatial correlation, called autocorrelation. Formally,autocorrelation is the property that residuals off the mean trend are notprobabilistically independent but display a degree of association amongthemselves that is a function of their separation in space. This degree ofassociation can be measured by a correlation coefficient, taken as a functionof separation distance.
Correlation is the property that, on average, two variables are linearlyassociated with one another. Knowing the value of one provides informa-tion on the probable value of the other. The strength of this association ismeasured by a correlation coefficient ρ that ranges between –1 and +1. Fortwo scalar variables z1 and z2, the correlation coefficient is defined as,
ρ = Cov(z1,z2)√Var(z1)Var(z2)
= 1σz1
σz2
E[(z1 −µz1)(z2 −µz2
)] (2.10)
[17:33 1/2/2008 5108-Phoon-Ch02.tex] Job No: 5108 PHOON: RB Design in Geo. Eng. Page: 84 76–133
84 G. B. Baecher and J. T. Christian
in which Cov(z1,z2) is the covariance, Var(zi) is the variance, σ is thestandard deviation, and µ is the mean.
The two variables might be of different but related types; for example,z1 might be water content and z2 might be undrained strength, or the twovariables might be the same property at different locations; for example,z1 might be the water content at one place on the site and z2 the watercontent at another place. A correlation coefficient ρ = +1 means that tworesiduals vary together exactly. When one is a standard deviation above itstrend, the other is a standard deviation above its trend, too. A correlationcoefficient ρ = −1 means that two residuals vary inversely. When one is astandard deviation above its trend, the other is a standard deviation belowits trend. A correlation coefficient ρ = 0 means that the two residuals areunrelated. In the case where the covariance and correlation are calculated asfunctions of the separation distance, the results are called the autocovarianceand autocorrelation, respectively.
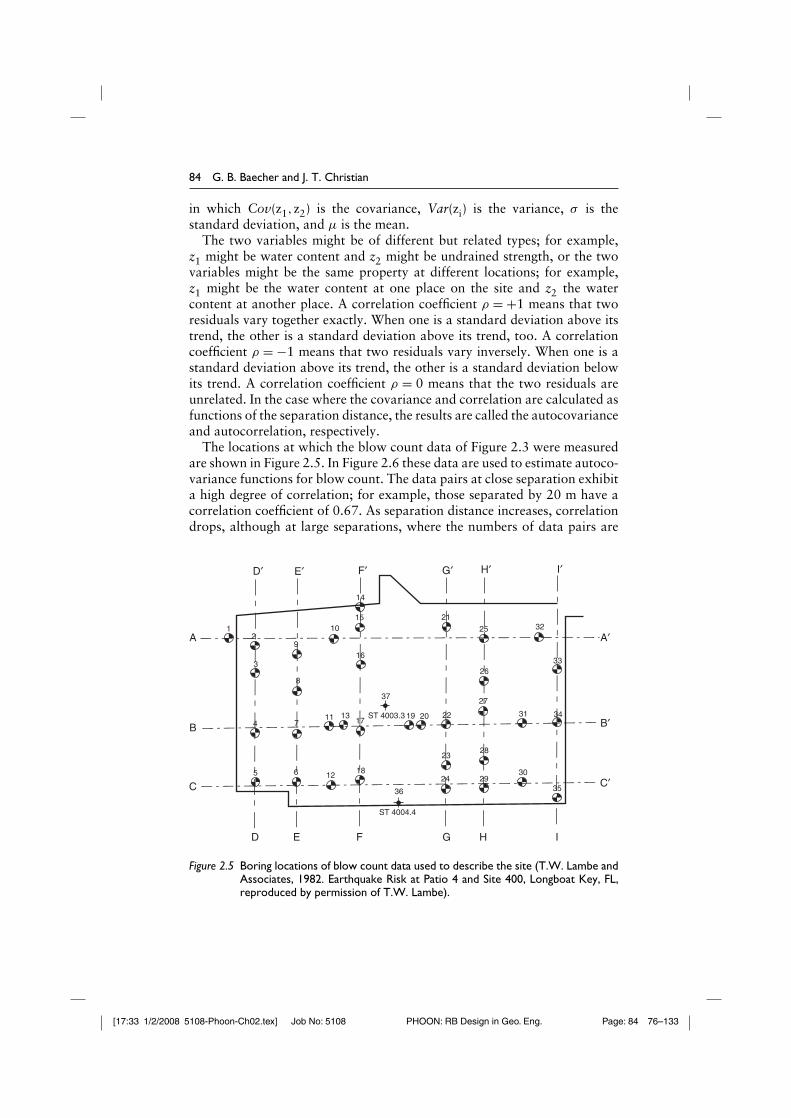
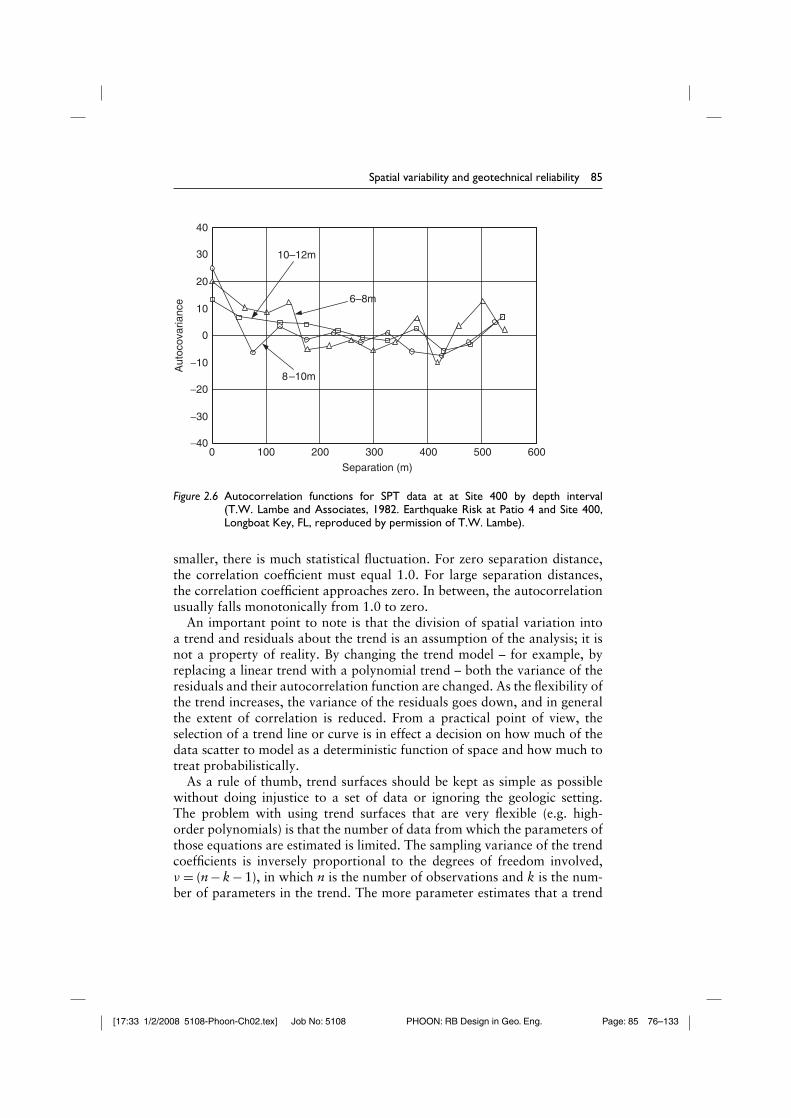
The locations at which the blow count data of Figure 2.3 were measuredare shown in Figure 2.5. In Figure 2.6 these data are used to estimate autoco-variance functions for blow count. The data pairs at close separation exhibita high degree of correlation; for example, those separated by 20 m have acorrelation coefficient of 0.67. As separation distance increases, correlationdrops, although at large separations, where the numbers of data pairs are
A
B
C
D E F G H I
C′
B′
A′
D′ E′ F′ G′ H′
3225
33
21
26
27
2220
37
8
3
210
15
14
169
1
19ST 4003.3 31 34
302924
23
181265
4 711 13
17
36
ST 4004.4
28
35
I′
Figure 2.5 Boring locations of blow count data used to describe the site (T.W. Lambe andAssociates, 1982. Earthquake Risk at Patio 4 and Site 400, Longboat Key, FL,reproduced by permission of T.W. Lambe).
[17:33 1/2/2008 5108-Phoon-Ch02.tex] Job No: 5108 PHOON: RB Design in Geo. Eng. Page: 85 76–133
Spatial variability and geotechnical reliability 85
40
30
20
10
0
−10
−20
−30
−40
Aut
ocov
aria
nce
0 100 200 300 400 500 600
Separation (m)
8–10m
10–12m
6–8m
Figure 2.6 Autocorrelation functions for SPT data at at Site 400 by depth interval(T.W. Lambe and Associates, 1982. Earthquake Risk at Patio 4 and Site 400,Longboat Key, FL, reproduced by permission of T.W. Lambe).
smaller, there is much statistical fluctuation. For zero separation distance,the correlation coefficient must equal 1.0. For large separation distances,the correlation coefficient approaches zero. In between, the autocorrelationusually falls monotonically from 1.0 to zero.
An important point to note is that the division of spatial variation intoa trend and residuals about the trend is an assumption of the analysis; it isnot a property of reality. By changing the trend model – for example, byreplacing a linear trend with a polynomial trend – both the variance of theresiduals and their autocorrelation function are changed. As the flexibility ofthe trend increases, the variance of the residuals goes down, and in generalthe extent of correlation is reduced. From a practical point of view, theselection of a trend line or curve is in effect a decision on how much of thedata scatter to model as a deterministic function of space and how much totreat probabilistically.
As a rule of thumb, trend surfaces should be kept as simple as possiblewithout doing injustice to a set of data or ignoring the geologic setting.The problem with using trend surfaces that are very flexible (e.g. high-order polynomials) is that the number of data from which the parameters ofthose equations are estimated is limited. The sampling variance of the trendcoefficients is inversely proportional to the degrees of freedom involved,ν = (n − k − 1), in which n is the number of observations and k is the num-ber of parameters in the trend. The more parameter estimates that a trend
[17:33 1/2/2008 5108-Phoon-Ch02.tex] Job No: 5108 PHOON: RB Design in Geo. Eng. Page: 86 76–133
86 G. B. Baecher and J. T. Christian
surface requires, the more uncertainty there is in the numerical values of thoseestimates. Uncertainty in regression coefficient estimates increases rapidly asthe flexibility of the trend equation increases.
If z(xi) = t(xi)+u(xi) is a continuous variable and the soil deposit is zonallyhomogeneous, then at locations i and j, which are close together, the residualsui and uj should be expected to be similar. That is, the variations reflectedin u(xi) and u(xj) are associated with one another. When the locations areclose together, the association is usually strong. As the locations becomemore widely separated, the association usually decreases. As the separationbetween two locations i and j approaches zero, u(xi) and u(xj) become thesame, the association becomes perfect. Conversely, as the separation becomeslarge, u(xi) and u(xj) become independent, the association becomes zero.This is the behavior observed in Figure 2.6 for the Standard Peretrationtest(SPT) data.
This spatial association of residuals off the trend t(xi) is summarized bya mathematical function describing the correlation of u(xi) and u(xj) asseparation distance increases. This description is called the autocorrelationfunction. Mathematically, the autocorrelation function is,
Rz(δ) = 1Var{u(x)}E[u(xi)u(xi+δ)] (2.11)
in which Rz(δ) is the autocorrelation function, Var[u(x)] is the variance ofthe residuals across the site, and E[u(xi)u(xi+δ)]=Cov[u(xi)u(xi+δ)] is thecovariance of the residuals spaced at separation distance, δ. By definition,the autocorrelation at zero separation is Rz(0) = 1.0; and empirically, formost geotechnical data, autocorrelation decreases to zero as δ increases.
If Rz(δ) is multiplied by the variance of the residuals, Var[u(x)], theautocovariance function, Cz(δ) is obtained,
Cz(δ) = E[u(xi)u(xi+δ)] (2.12)
The relationship between the autocorrelation function and the autocovari-ance function is the same as that between the correlation coefficient and thecovariance, except that autocorrelation and autocovariance are functions ofseparation distance, δ.
2.1.4 Example: TONEN refinery, Kawasaki, Japan
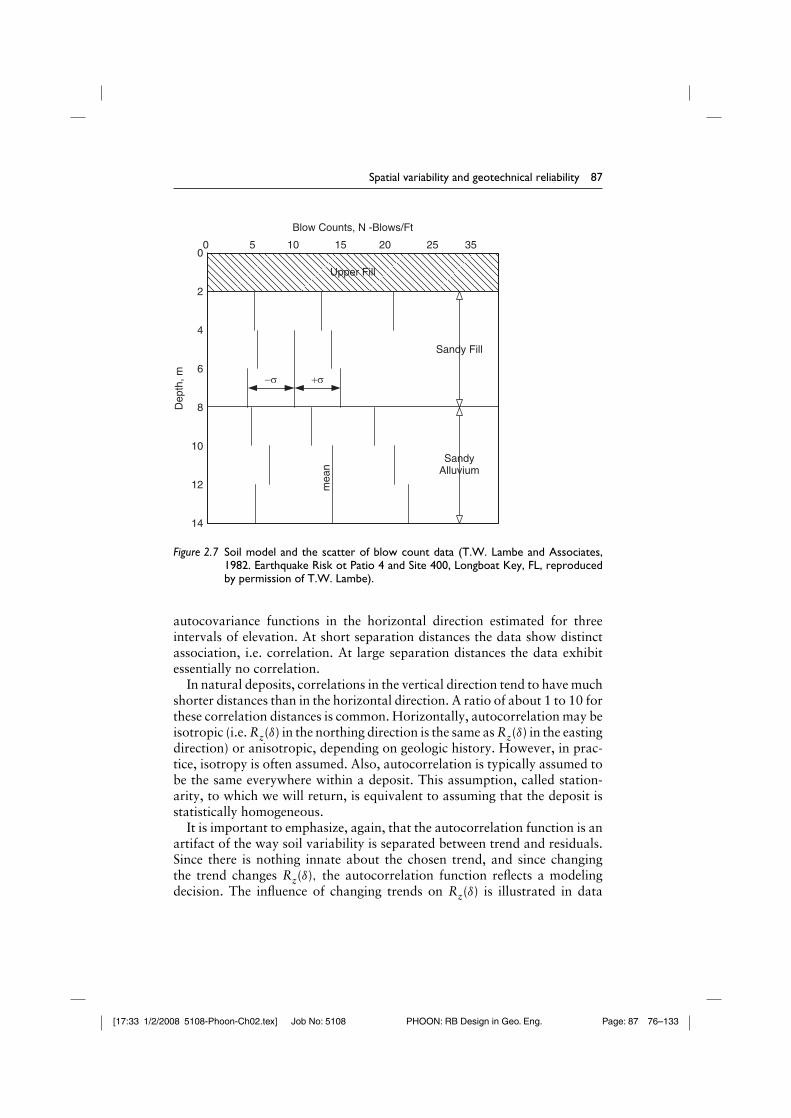
The SPT data shown earlier come from a site overlying hydraulic bay fillin Kawasaki (Japan). The SPT data were taken in a silty fine sand betweenelevations +3 and −7 m, and show little if any trend horizontally, so aconstant horizontal trend at the mean of the data was assumed. Figure 2.7shows the means and variability of the SPT data with depth. Figure 2.6 shows
[17:33 1/2/2008 5108-Phoon-Ch02.tex] Job No: 5108 PHOON: RB Design in Geo. Eng. Page: 87 76–133
Spatial variability and geotechnical reliability 87
Upper Fill
Blow Counts, N -Blows/Ft
0 5 10 15 20 25 350
2
4
6
8
10
12
14
Dep
th, m
Sandy Fill
SandyAlluvium
+σ−σ
mea
n
Figure 2.7 Soil model and the scatter of blow count data (T.W. Lambe and Associates,1982. Earthquake Risk ot Patio 4 and Site 400, Longboat Key, FL, reproducedby permission of T.W. Lambe).
autocovariance functions in the horizontal direction estimated for threeintervals of elevation. At short separation distances the data show distinctassociation, i.e. correlation. At large separation distances the data exhibitessentially no correlation.
In natural deposits, correlations in the vertical direction tend to have muchshorter distances than in the horizontal direction. A ratio of about 1 to 10 forthese correlation distances is common. Horizontally, autocorrelation may beisotropic (i.e. Rz(δ) in the northing direction is the same as Rz(δ) in the eastingdirection) or anisotropic, depending on geologic history. However, in prac-tice, isotropy is often assumed. Also, autocorrelation is typically assumed tobe the same everywhere within a deposit. This assumption, called station-arity, to which we will return, is equivalent to assuming that the deposit isstatistically homogeneous.
It is important to emphasize, again, that the autocorrelation function is anartifact of the way soil variability is separated between trend and residuals.Since there is nothing innate about the chosen trend, and since changingthe trend changes Rz(δ), the autocorrelation function reflects a modelingdecision. The influence of changing trends on Rz(δ) is illustrated in data
[17:33 1/2/2008 5108-Phoon-Ch02.tex] Job No: 5108 PHOON: RB Design in Geo. Eng. Page: 88 76–133
88 G. B. Baecher and J. T. Christian
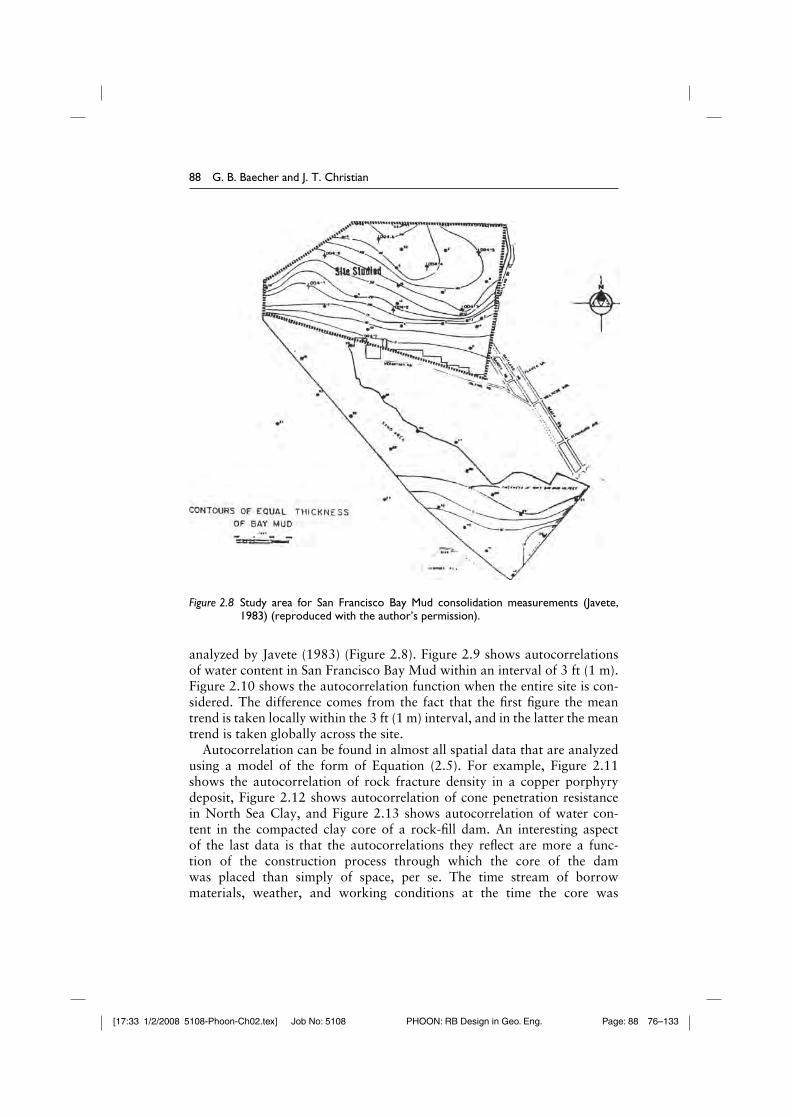
Figure 2.8 Study area for San Francisco Bay Mud consolidation measurements (Javete,1983) (reproduced with the author’s permission).
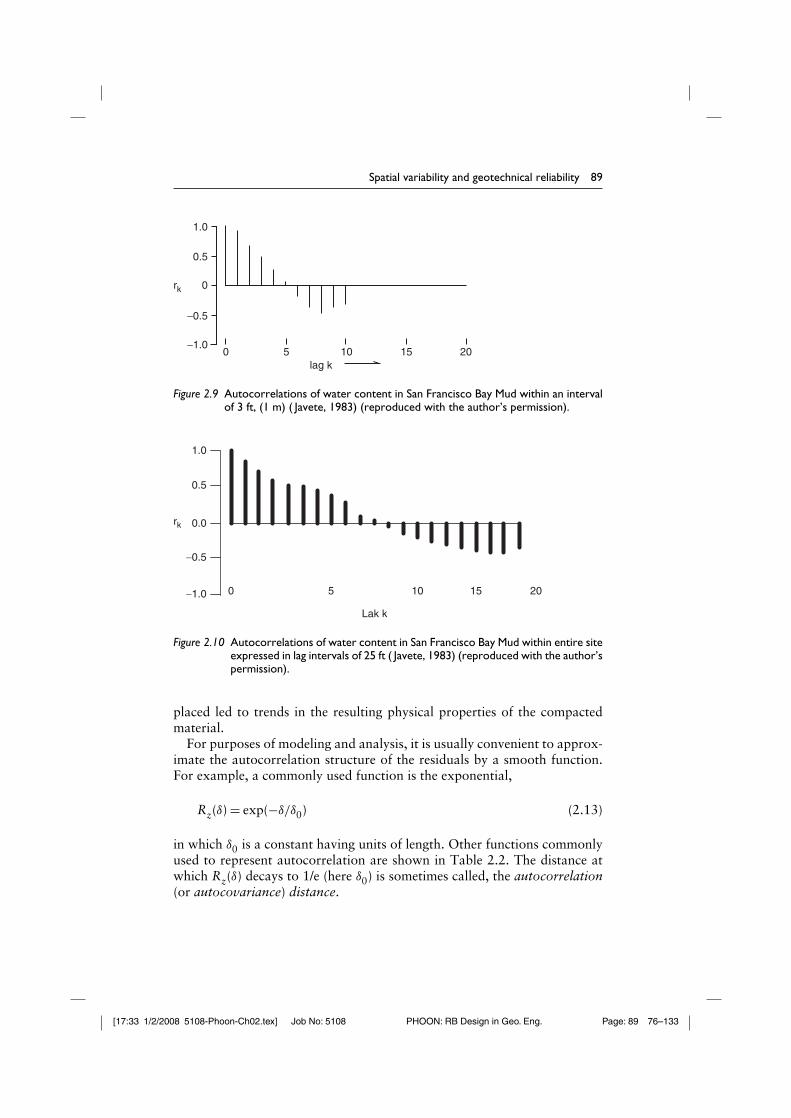
analyzed by Javete (1983) (Figure 2.8). Figure 2.9 shows autocorrelationsof water content in San Francisco Bay Mud within an interval of 3 ft (1 m).Figure 2.10 shows the autocorrelation function when the entire site is con-sidered. The difference comes from the fact that the first figure the meantrend is taken locally within the 3 ft (1 m) interval, and in the latter the meantrend is taken globally across the site.
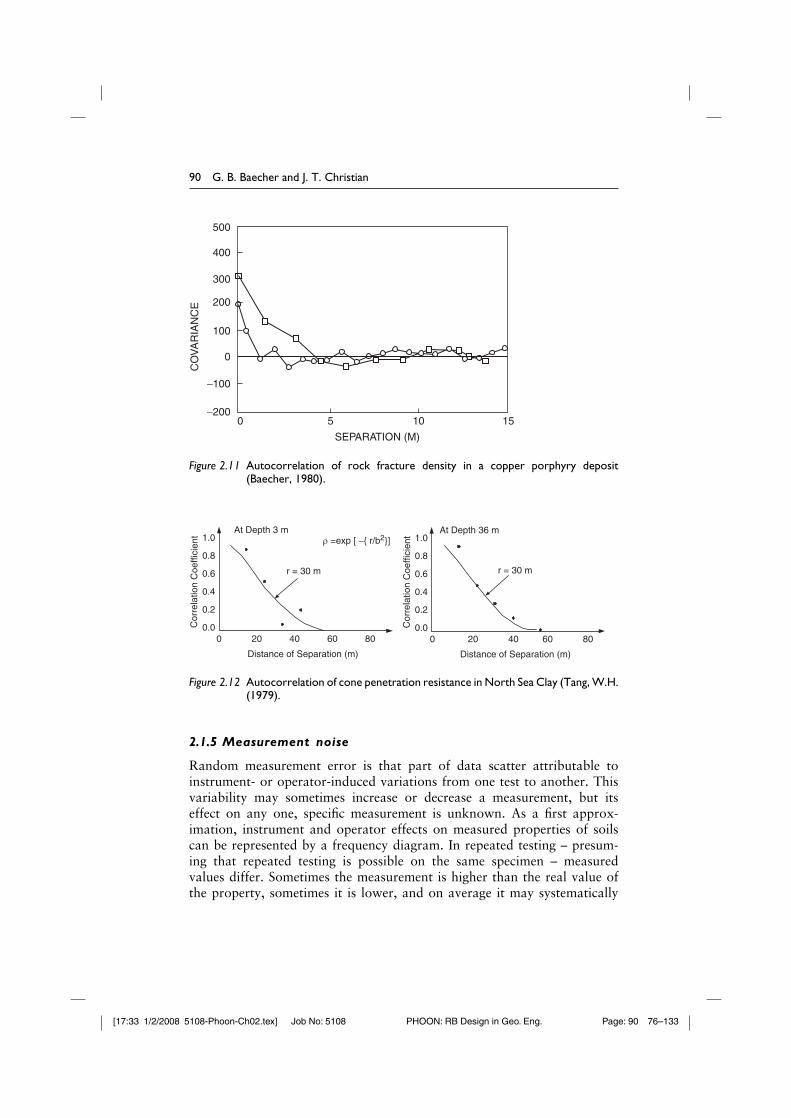
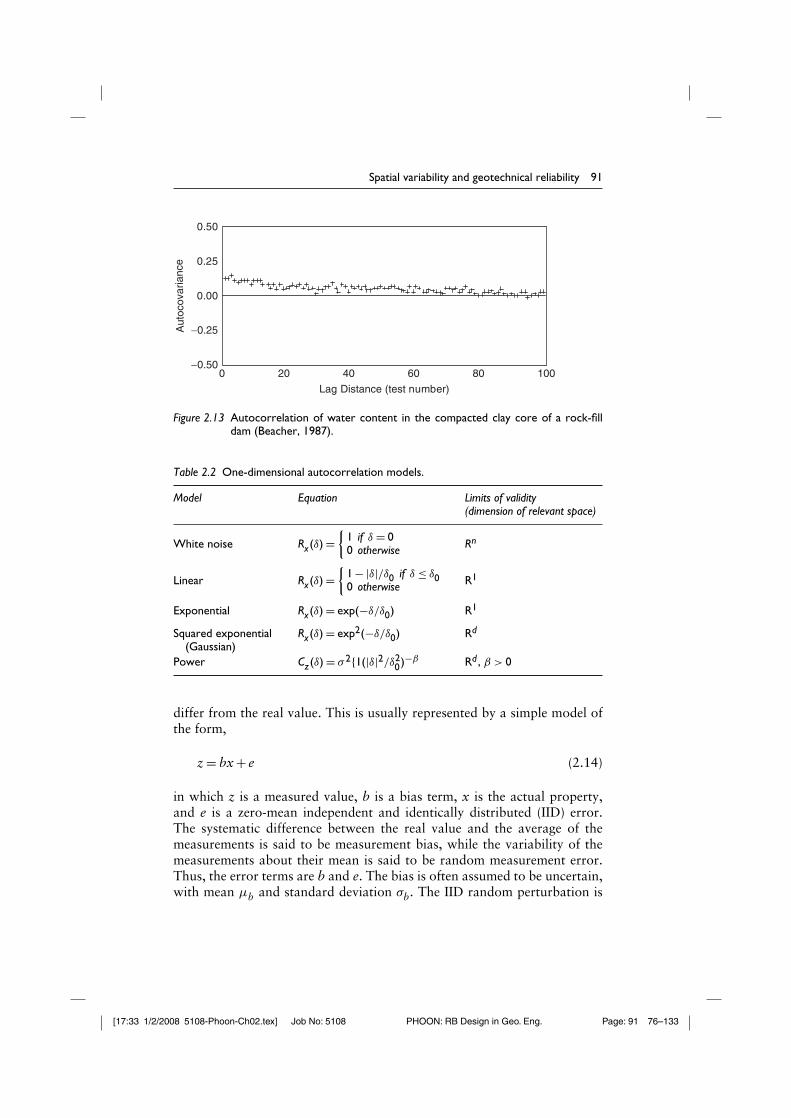
Autocorrelation can be found in almost all spatial data that are analyzedusing a model of the form of Equation (2.5). For example, Figure 2.11shows the autocorrelation of rock fracture density in a copper porphyrydeposit, Figure 2.12 shows autocorrelation of cone penetration resistancein North Sea Clay, and Figure 2.13 shows autocorrelation of water con-tent in the compacted clay core of a rock-fill dam. An interesting aspectof the last data is that the autocorrelations they reflect are more a func-tion of the construction process through which the core of the damwas placed than simply of space, per se. The time stream of borrowmaterials, weather, and working conditions at the time the core was
[17:33 1/2/2008 5108-Phoon-Ch02.tex] Job No: 5108 PHOON: RB Design in Geo. Eng. Page: 89 76–133
Spatial variability and geotechnical reliability 89
1.0
0.5
0rk
−0.5
−1.00 5 10 15 20
lag k
Figure 2.9 Autocorrelations of water content in San Francisco Bay Mud within an intervalof 3 ft, (1 m) ( Javete, 1983) (reproduced with the author’s permission).
0 5 10
Lak k
15 20
rk
1.0
0.5
0.0
−0.5
−1.0
Figure 2.10 Autocorrelations of water content in San Francisco Bay Mud within entire siteexpressed in lag intervals of 25 ft ( Javete, 1983) (reproduced with the author’spermission).
placed led to trends in the resulting physical properties of the compactedmaterial.
For purposes of modeling and analysis, it is usually convenient to approx-imate the autocorrelation structure of the residuals by a smooth function.For example, a commonly used function is the exponential,
Rz(δ) = exp(−δ/δ0) (2.13)
in which δ0 is a constant having units of length. Other functions commonlyused to represent autocorrelation are shown in Table 2.2. The distance atwhich Rz(δ) decays to 1/e (here δ0) is sometimes called, the autocorrelation(or autocovariance) distance.
[17:33 1/2/2008 5108-Phoon-Ch02.tex] Job No: 5108 PHOON: RB Design in Geo. Eng. Page: 90 76–133
90 G. B. Baecher and J. T. Christian
−200
−100
0
100
200
300
400
500
50
SEPARATION (M)
CO
VA
RIA
NC
E
10 15
Figure 2.11 Autocorrelation of rock fracture density in a copper porphyry deposit(Baecher, 1980).
Distance of Separation (m)
ρ =exp [ −{ r/b2}]
r = 30 m
At Depth 3 m
0 20 40 60 800 20 40 60 80
1.0
0.8
0.6
0.4
0.2
0.0Cor
rela
tion
Coe
ffici
ent1.0
0.8
0.6
0.4
0.2
0.0Cor
rela
tion
Coe
ffici
ent
Distance of Separation (m)
r = 30 m
At Depth 36 m
Figure 2.12 Autocorrelation of cone penetration resistance in North Sea Clay (Tang, W.H.(1979).
2.1.5 Measurement noise
Random measurement error is that part of data scatter attributable toinstrument- or operator-induced variations from one test to another. Thisvariability may sometimes increase or decrease a measurement, but itseffect on any one, specific measurement is unknown. As a first approx-imation, instrument and operator effects on measured properties of soilscan be represented by a frequency diagram. In repeated testing – presum-ing that repeated testing is possible on the same specimen – measuredvalues differ. Sometimes the measurement is higher than the real value ofthe property, sometimes it is lower, and on average it may systematically
[17:33 1/2/2008 5108-Phoon-Ch02.tex] Job No: 5108 PHOON: RB Design in Geo. Eng. Page: 91 76–133
Spatial variability and geotechnical reliability 91
0 20 40 60 80 100
Lag Distance (test number)
0.50
0.25
0.00
−0.25
−0.50
Aut
ocov
aria
nce
Figure 2.13 Autocorrelation of water content in the compacted clay core of a rock-filldam (Beacher, 1987).
Table 2.2 One-dimensional autocorrelation models.
Model Equation Limits of validity(dimension of relevant space)
White noise Rx(δ) ={
1 if δ = 00 otherwise Rn
Linear Rx(δ) ={
1 −|δ|/δ0 if δ ≤ δ00 otherwise R1
Exponential Rx(δ) = exp(−δ/δ0) R1
Squared exponential(Gaussian)
Rx(δ) = exp2(−δ/δ0) Rd
Power Cz(δ) = σ 2{1(|δ|2/δ20)−β Rd , β > 0
differ from the real value. This is usually represented by a simple model ofthe form,
z = bx + e (2.14)
in which z is a measured value, b is a bias term, x is the actual property,and e is a zero-mean independent and identically distributed (IID) error.The systematic difference between the real value and the average of themeasurements is said to be measurement bias, while the variability of themeasurements about their mean is said to be random measurement error.Thus, the error terms are b and e. The bias is often assumed to be uncertain,with mean µb and standard deviation σb. The IID random perturbation is
[17:33 1/2/2008 5108-Phoon-Ch02.tex] Job No: 5108 PHOON: RB Design in Geo. Eng. Page: 92 76–133
92 G. B. Baecher and J. T. Christian
usually assumed to be Normally distributed with zero mean and standarddeviation σe.
Random errors enter measurements of soil properties through a varietyof sources related to the personnel and instruments used in soil investiga-tions or laboratory testing. Operator or personnel errors arise in many typesof measurements where it is necessary to read scales, personal judgment isneeded, or operators affect the mechanical operation of a piece of testingequipment (e.g. SPT hammers). In each of these cases, operator differenceshave systematic and random components. One person, for example, mayconsistently read a gage too high, another too low. If required to make aseries of replicate measurements, a single individual may report numbersthat vary one from the other over the series.
Instrumental error arises from variations in the way tests are set up,loads are delivered, or soil response is sensed. The separation of mea-surement errors between operator and instrumental causes is not onlyindistinct, but also unimportant for most purposes. In triaxial tests, soilsamples may be positioned differently with respect to loading platens insucceeding tests. Handling and trimming may cause differing amounts ofdisturbance from one specimen to the next. Piston friction may vary slightlyfrom one movement to another, or temperature changes may affect fluidsand solids. The aggregate result of all these variables is a number of dif-ferences between measurements that are unrelated to the soil properties ofinterest.
Assignable causes of minor variation are always present because a verylarge number of variables affect any measurement. One attempts to controlthose that have important effects, but this leaves uncontrolled a large numberthat individually have only small effects on a measurement. If not identified,these assignable causes of variation may influence the precision and possiblythe accuracy of measurements by biasing the results. For example, hammerefficiency in the SPT test strongly affects measured blow counts. Efficiencywith the same hammer can vary by 50% or more from one blow to the next.Hammer efficiency can be controlled, but only at some cost. If uncontrolled,it becomes a source of random measurement error and increases the scatterin SPT data.
Bias error in measurement arises from a number of reasonably well-understood mechanisms. Sample disturbance is among the more importantof these mechanisms, usually causing a systematic degradation of average soilproperties along with a broadening of dispersion. The second major contrib-utor to measurement bias is the phenomenological model used to interpretthe measurements made in testing, and especially the simplifying assump-tions made in that model. For example, the physical response of the testedsoil element might be assumed linear when in fact this is only an approxima-tion, the reversal of principal stress direction might be ignored, intermediateprincipal stresses might be assumed other than they really are, and so forth.
[17:33 1/2/2008 5108-Phoon-Ch02.tex] Job No: 5108 PHOON: RB Design in Geo. Eng. Page: 93 76–133
Spatial variability and geotechnical reliability 93
The list of possible discrepancies between model assumptions and the realtest conditions is long.
Model bias is usually estimated empirically by comparing predictionsmade from measured values of soil engineering parameters against observedperformance. Obviously, such calibrations encompass a good deal more thanjust the measurement technique; they incorporate the models used to makepredictions of field performance, inaccuracies in site characterization, and ahost of other things.
Bjerrum’s (1972, 1973) calibration of field vein test results for theundrained strength, su, of clay is a good example of how measurement biascan be estimated in practise. This calibration compares values of su mea-sured with a field vane against back-calculated values of su from large-scalefailures in the field. In principle, this calibration is a regression analysis ofback-calculated su against field vane su, which yields a mean trend plus resid-ual variance about the trend. The mean trend provides an estimate of µbwhile the residual variance provides an estimate of σb. The residual vari-ance is usually taken to be the same regardless of the value of x, a commonassumption in regression analysis.
Random measurement error can be estimated in a variety of ways,some direct and some indirect. As a general rule, the direct techniques aredifficult to apply to the soil measurements of interest to geotechnical engi-neers, because soil tests are destructive. Indirect methods for estimating Veusually involve correlations of the property in question either with otherproperties such as index values, or with itself through the autocorrelationfunction.
The easiest and most powerful methods involve the autocorrelationfunction. The autocovariance of z after the trend has been removed becomes
Cz(δ) = Cx(δ) + Ce(δ) (2.15)
in which Cx(δ) is from Equation (2.12) and Cx(δ) is the autocovariancefunction of e. However, since ei and ej are independent except when i = j,the autocovariance function of e is a spike at δ = 0 and zero elsewhere.Thus, Cx(δ) is composed of two functions. By extrapolating the observedautocovariance function to the origin, an estimate is obtained of the fractionof data scatter that comes from random error. In the “geostatistics” literaturethis is called the nugget effect.
2.1.6 Example: settlement of shallow footings on sand,Indiana (USA)
The importance of random measurement errors is illustrated by a case involv-ing a large number of shallow footings placed on approximately 10 mof uniform sand (Hilldale, 1971). The site was characterized by Standard
[17:33 1/2/2008 5108-Phoon-Ch02.tex] Job No: 5108 PHOON: RB Design in Geo. Eng. Page: 94 76–133
94 G. B. Baecher and J. T. Christian
Penetration blow count measurements, predictions were made of settlement,and settlements were subsequently measured.
Inspection of the SPT data and subsequent settlements reveals an interest-ing discrepancy. Since footing settlements on sand tend to be proportional tothe inverse of average blow count beneath the footing, it would be expectedthat the coefficient of variation of the settlements equaled approximatelythat of the vertically averaged blow counts. Mathematically, settlement ispredicted by a formula of the form, ρ ∝ q/Nc , in which ρ = settlement,q = net applied stress at the base of the footing, and Nc = average cor-rected blow count (Lambe and Whitman, 1979). Being multiplicative, thecoefficient of variation of ρ should be the same as that of Nc.
In fact, the coefficient of variation of the vertically averaged blow countsis about Nc
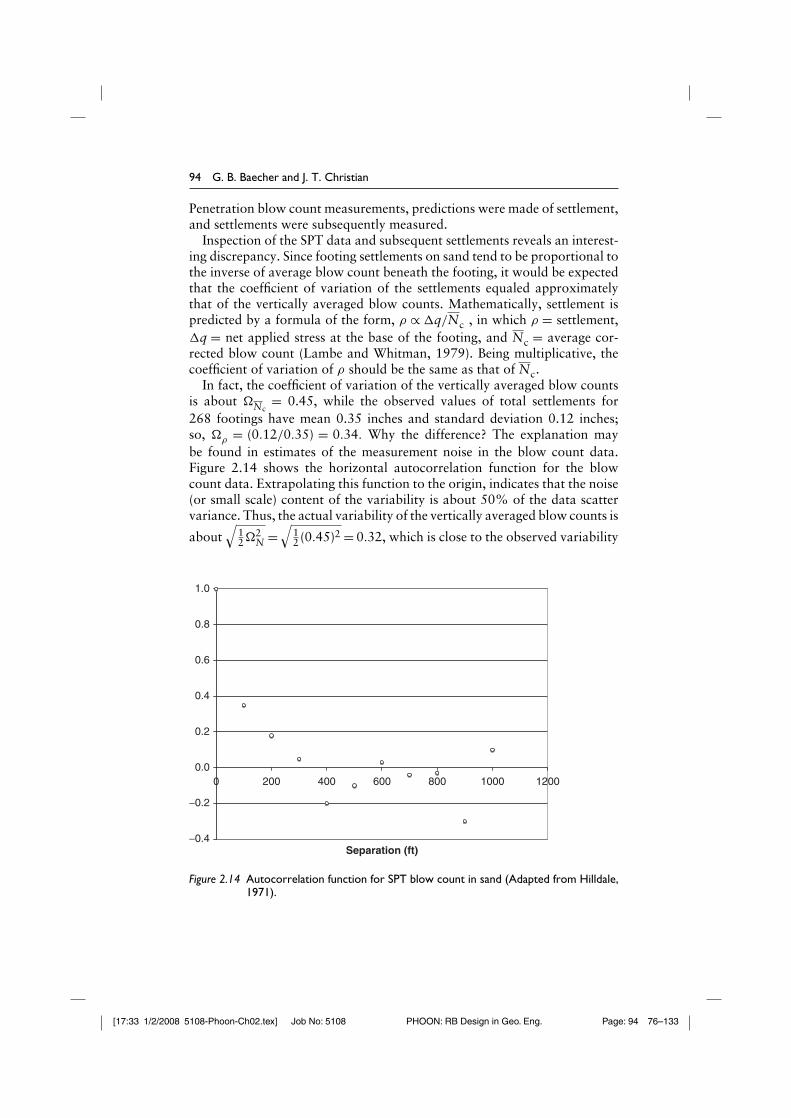
= 0.45, while the observed values of total settlements for268 footings have mean 0.35 inches and standard deviation 0.12 inches;so, ρ = (0.12/0.35) = 0.34. Why the difference? The explanation maybe found in estimates of the measurement noise in the blow count data.Figure 2.14 shows the horizontal autocorrelation function for the blowcount data. Extrapolating this function to the origin, indicates that the noise(or small scale) content of the variability is about 50% of the data scattervariance. Thus, the actual variability of the vertically averaged blow counts is
about√
122
N =√
12 (0.45)2 = 0.32, which is close to the observed variability
−0.4
−0.2
0.0
0.2
0.4
0.6
0.8
1.0
0 200 400 600 800 1000 1200
Separation (ft)
Figure 2.14 Autocorrelation function for SPT blow count in sand (Adapted from Hilldale,1971).
[17:33 1/2/2008 5108-Phoon-Ch02.tex] Job No: 5108 PHOON: RB Design in Geo. Eng. Page: 95 76–133
Spatial variability and geotechnical reliability 95
of the footing settlements. Measurement noise of 50% or even more of theobserved scatter of in situ test data, particularly the SPT, has been noted onseveral projects.
While random measurement error exhibits itself in the autocorrelation orautocovariance function as a spike at δ = 0, real variability of the soil at ascale smaller than the minimum boring spacing cannot be distinguished frommeasurement error when using the extrapolation technique. For this reason,the “noise” component estimated in the horizontal direction may not be thesame as that estimated in the vertical direction.
For many, but not all, applications the distinction between measure-ment error and small-scale variability is unimportant. For any engineeringapplication in which average properties within some volume of soil areimportant, the small-scale variability averages quickly and therefore has lit-tle effect on predicted performance. Thus, for practical purposes it can betreated as if it were a measurement error. On the other hand, if perfor-mance depends on extreme properties – no matter their geometric scale –the distinction between measurement error and small scale is important.Some engineers think that piping (internal erosion) in dams is such a phe-nomenon. However, few physical mechanisms of performance easily cometo mind that are strongly affected by small-scale spatial variability, unlessthose anomalous features are continuous over a large extent in at least onedimension.
2.2 Second-moment soil profiles
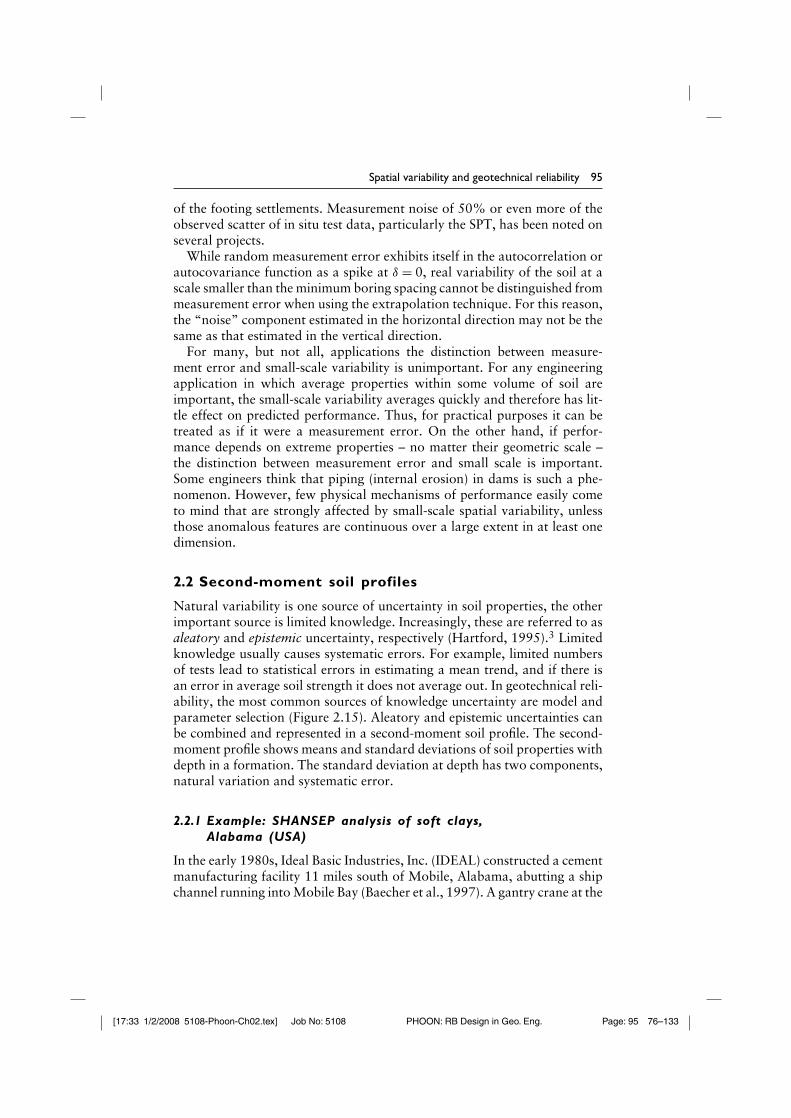
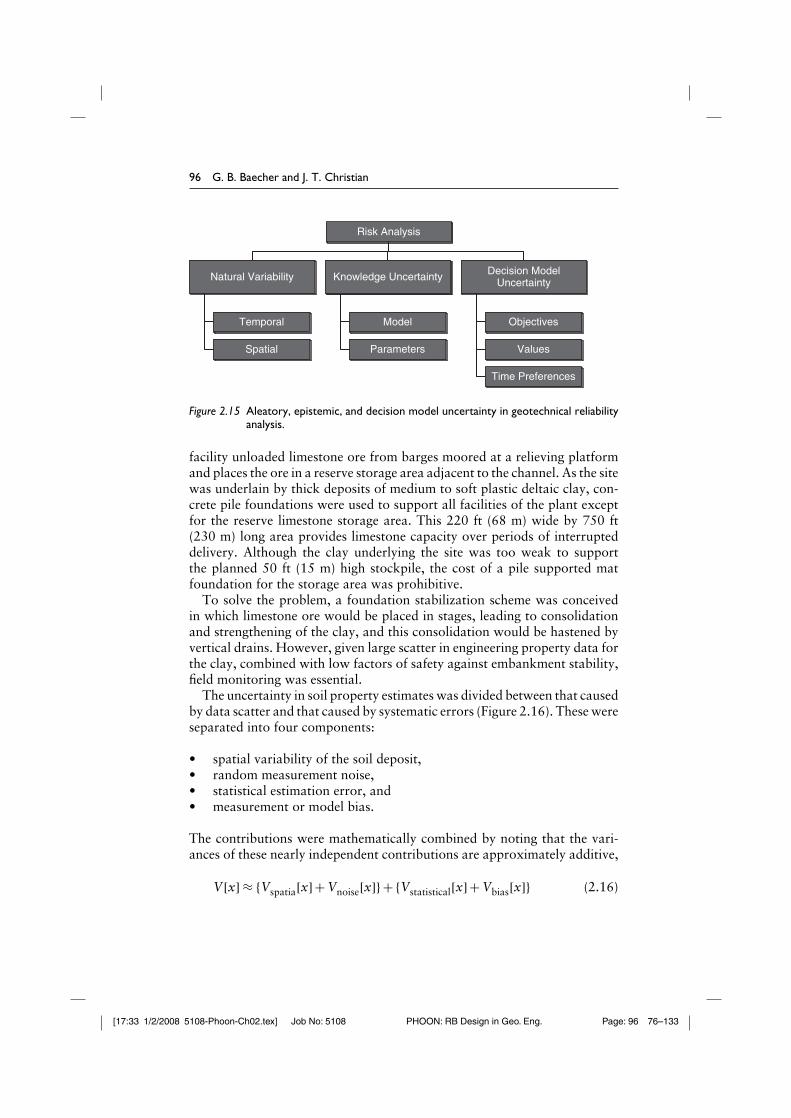
Natural variability is one source of uncertainty in soil properties, the otherimportant source is limited knowledge. Increasingly, these are referred to asaleatory and epistemic uncertainty, respectively (Hartford, 1995).3 Limitedknowledge usually causes systematic errors. For example, limited numbersof tests lead to statistical errors in estimating a mean trend, and if there isan error in average soil strength it does not average out. In geotechnical reli-ability, the most common sources of knowledge uncertainty are model andparameter selection (Figure 2.15). Aleatory and epistemic uncertainties canbe combined and represented in a second-moment soil profile. The second-moment profile shows means and standard deviations of soil properties withdepth in a formation. The standard deviation at depth has two components,natural variation and systematic error.
2.2.1 Example: SHANSEP analysis of soft clays,Alabama (USA)
In the early 1980s, Ideal Basic Industries, Inc. (IDEAL) constructed a cementmanufacturing facility 11 miles south of Mobile, Alabama, abutting a shipchannel running into Mobile Bay (Baecher et al., 1997). A gantry crane at the
[17:33 1/2/2008 5108-Phoon-Ch02.tex] Job No: 5108 PHOON: RB Design in Geo. Eng. Page: 96 76–133
96 G. B. Baecher and J. T. Christian
Temporal
Spatial
Natural Variability
Model
Parameters
Knowledge Uncertainty
Objectives
Values
Time Preferences
Decision ModelUncertainty
Risk Analysis
Figure 2.15 Aleatory, epistemic, and decision model uncertainty in geotechnical reliabilityanalysis.
facility unloaded limestone ore from barges moored at a relieving platformand places the ore in a reserve storage area adjacent to the channel. As the sitewas underlain by thick deposits of medium to soft plastic deltaic clay, con-crete pile foundations were used to support all facilities of the plant exceptfor the reserve limestone storage area. This 220 ft (68 m) wide by 750 ft(230 m) long area provides limestone capacity over periods of interrupteddelivery. Although the clay underlying the site was too weak to supportthe planned 50 ft (15 m) high stockpile, the cost of a pile supported matfoundation for the storage area was prohibitive.
To solve the problem, a foundation stabilization scheme was conceivedin which limestone ore would be placed in stages, leading to consolidationand strengthening of the clay, and this consolidation would be hastened byvertical drains. However, given large scatter in engineering property data forthe clay, combined with low factors of safety against embankment stability,field monitoring was essential.
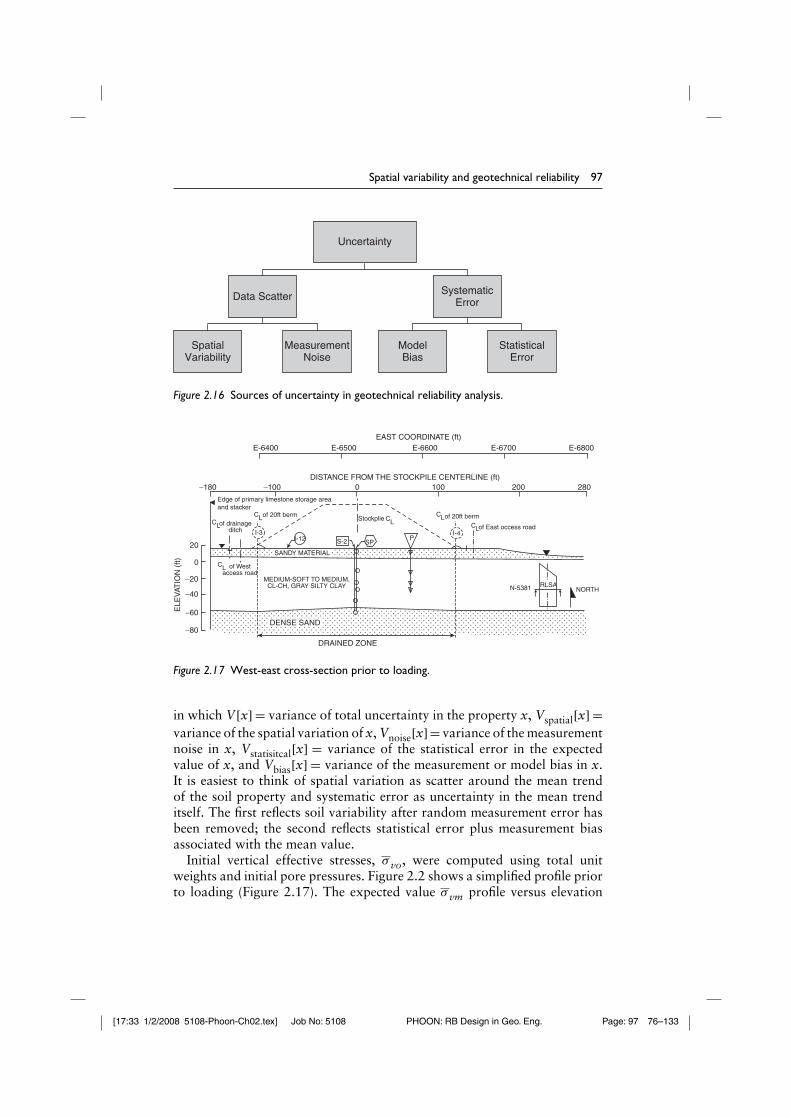
The uncertainty in soil property estimates was divided between that causedby data scatter and that caused by systematic errors (Figure 2.16). These wereseparated into four components:
• spatial variability of the soil deposit,• random measurement noise,• statistical estimation error, and• measurement or model bias.
The contributions were mathematically combined by noting that the vari-ances of these nearly independent contributions are approximately additive,
V[x] ≈ {Vspatia[x]+ Vnoise[x]}+ {Vstatistical[x]+ Vbias[x]} (2.16)
[17:33 1/2/2008 5108-Phoon-Ch02.tex] Job No: 5108 PHOON: RB Design in Geo. Eng. Page: 97 76–133
Spatial variability and geotechnical reliability 97
Uncertainty
Data Scatter
SpatialVariability
MeasurementNoise
SystematicError
ModelBias
StatisticalError
Figure 2.16 Sources of uncertainty in geotechnical reliability analysis.
E-6400
−180 −100
−20
−40
−60
−80
0
20
0
ELE
VAT
ION
(ft)
100 200 280
E-6500
DRAINED ZONE
DENSE SAND
CLCL
CL
CLCL
CL
SANDY MATERIAL
Edge of primary limestone storage areaand stacker
of Westaccess road
MEDIUM-SOFT TO MEDIUM,CL-CH, GRAY SILTY CLAY
of drainageditch
of 20ft berm Stockplie of 20ft berm
I-4P
SPS-2I-12I-3
N-5381 RLSANORTH
of East occess road
EAST COORDINATE (ft)
DISTANCE FROM THE STOCKPILE CENTERLINE (ft)
E-6600 E-6700 E-6800
Figure 2.17 West-east cross-section prior to loading.
in which V[x] = variance of total uncertainty in the property x, Vspatial[x] =variance of the spatial variation of x, Vnoise[x]= variance of the measurementnoise in x, Vstatisitcal[x] = variance of the statistical error in the expectedvalue of x, and Vbias[x] = variance of the measurement or model bias in x.It is easiest to think of spatial variation as scatter around the mean trendof the soil property and systematic error as uncertainty in the mean trenditself. The first reflects soil variability after random measurement error hasbeen removed; the second reflects statistical error plus measurement biasassociated with the mean value.
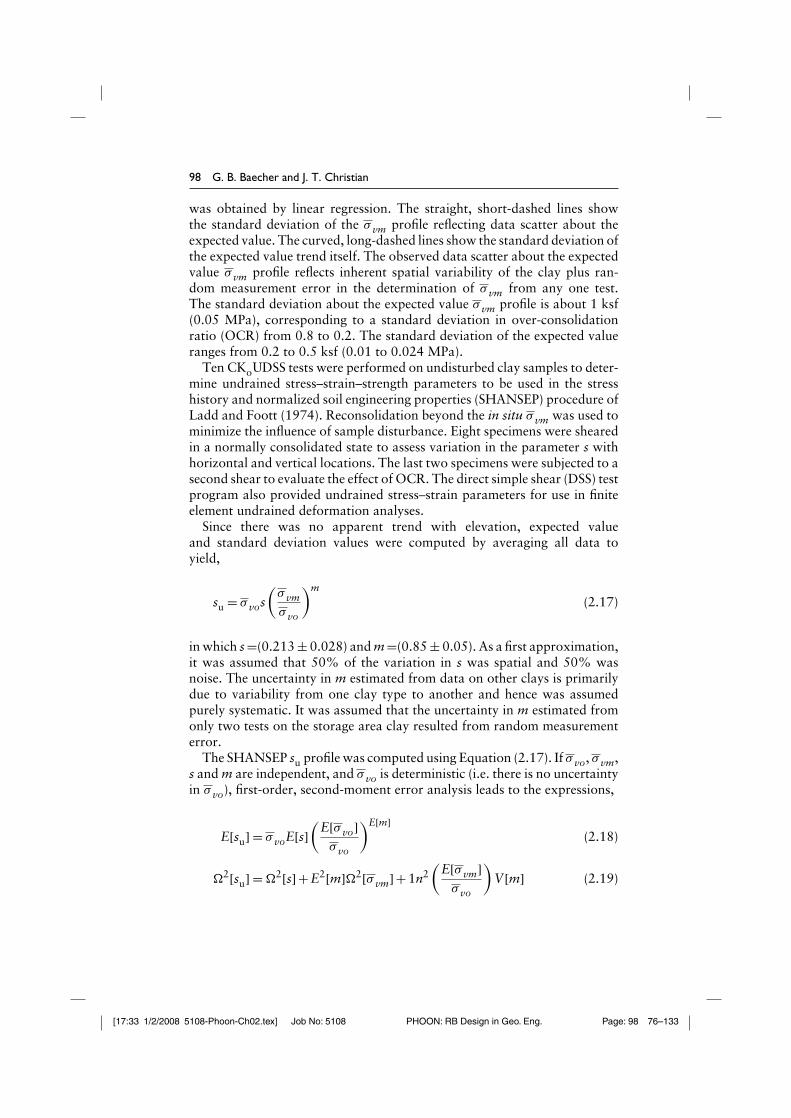
Initial vertical effective stresses, σ vo, were computed using total unitweights and initial pore pressures. Figure 2.2 shows a simplified profile priorto loading (Figure 2.17). The expected value σ vm profile versus elevation
[17:33 1/2/2008 5108-Phoon-Ch02.tex] Job No: 5108 PHOON: RB Design in Geo. Eng. Page: 98 76–133
98 G. B. Baecher and J. T. Christian
was obtained by linear regression. The straight, short-dashed lines showthe standard deviation of the σ vm profile reflecting data scatter about theexpected value. The curved, long-dashed lines show the standard deviation ofthe expected value trend itself. The observed data scatter about the expectedvalue σ vm profile reflects inherent spatial variability of the clay plus ran-dom measurement error in the determination of σ vm from any one test.The standard deviation about the expected value σ vm profile is about 1 ksf(0.05 MPa), corresponding to a standard deviation in over-consolidationratio (OCR) from 0.8 to 0.2. The standard deviation of the expected valueranges from 0.2 to 0.5 ksf (0.01 to 0.024 MPa).
Ten CKoUDSS tests were performed on undisturbed clay samples to deter-mine undrained stress–strain–strength parameters to be used in the stresshistory and normalized soil engineering properties (SHANSEP) procedure ofLadd and Foott (1974). Reconsolidation beyond the in situ σ vm was used tominimize the influence of sample disturbance. Eight specimens were shearedin a normally consolidated state to assess variation in the parameter s withhorizontal and vertical locations. The last two specimens were subjected to asecond shear to evaluate the effect of OCR. The direct simple shear (DSS) testprogram also provided undrained stress–strain parameters for use in finiteelement undrained deformation analyses.
Since there was no apparent trend with elevation, expected valueand standard deviation values were computed by averaging all data toyield,
su = σ vos(
σ vm
σ vo
)m
(2.17)
in which s =(0.213 ± 0.028) and m =(0.85 ± 0.05). As a first approximation,it was assumed that 50% of the variation in s was spatial and 50% wasnoise. The uncertainty in m estimated from data on other clays is primarilydue to variability from one clay type to another and hence was assumedpurely systematic. It was assumed that the uncertainty in m estimated fromonly two tests on the storage area clay resulted from random measurementerror.
The SHANSEP su profile was computed using Equation (2.17). If σ vo, σ vm,s and m are independent, and σ vo is deterministic (i.e. there is no uncertaintyin σ vo), first-order, second-moment error analysis leads to the expressions,
E[su] = σ voE[s](
E[σ vo]σ vo
)E[m](2.18)
2[su] = 2[s]+ E2[m]2[σ vm]+ 1n2(
E[σ vm]σ vo
)V[m] (2.19)
[17:33 1/2/2008 5108-Phoon-Ch02.tex] Job No: 5108 PHOON: RB Design in Geo. Eng. Page: 99 76–133
Spatial variability and geotechnical reliability 99
in which E[X] = expected value of X, V[X] = variance of X, and [X] =√V[X]/E[X] =coefficient of variation of X. The total coefficient of variation
of su is divided between spatial and systematic uncertainty such that,
2[su] = 2sp[su]+2
sy[su] (2.20)
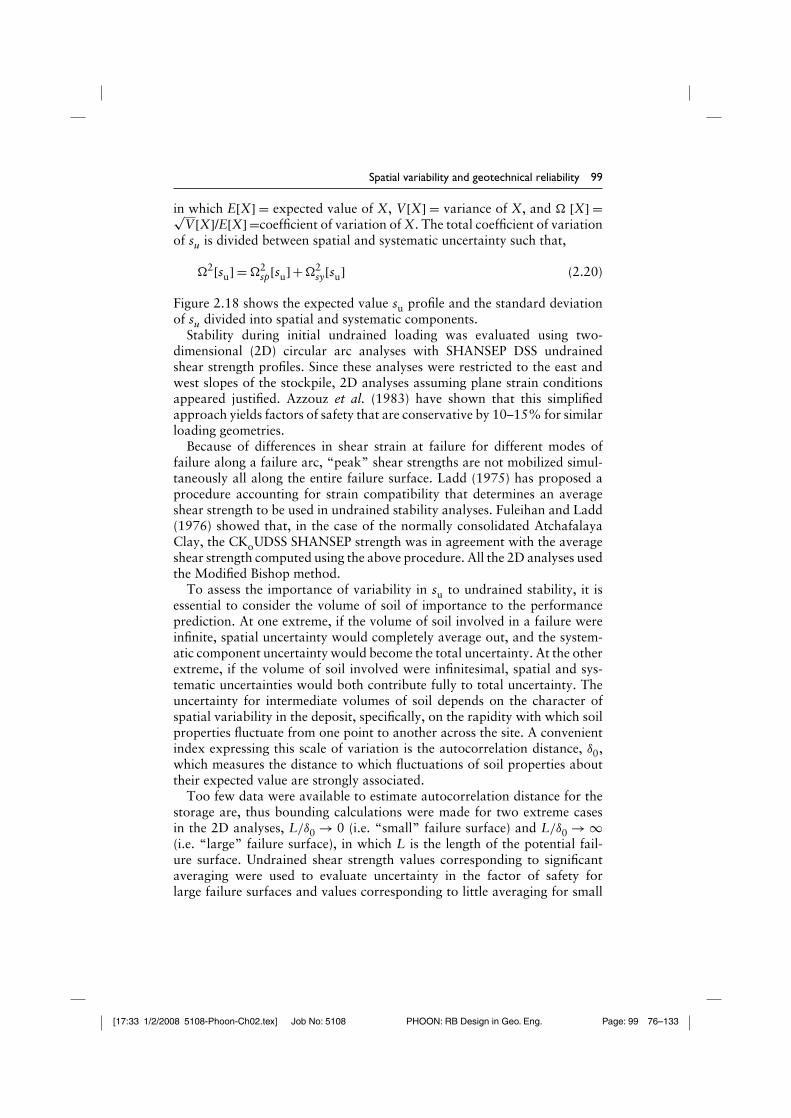
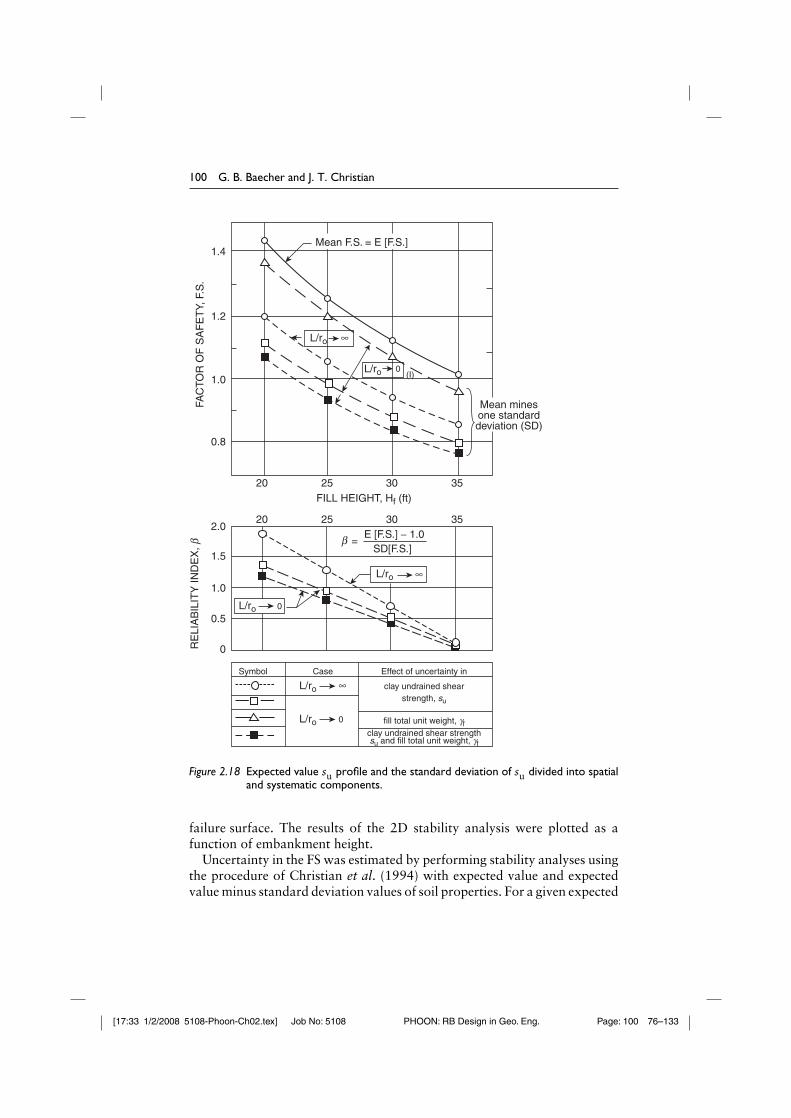
Figure 2.18 shows the expected value su profile and the standard deviationof su divided into spatial and systematic components.
Stability during initial undrained loading was evaluated using two-dimensional (2D) circular arc analyses with SHANSEP DSS undrainedshear strength profiles. Since these analyses were restricted to the east andwest slopes of the stockpile, 2D analyses assuming plane strain conditionsappeared justified. Azzouz et al. (1983) have shown that this simplifiedapproach yields factors of safety that are conservative by 10–15% for similarloading geometries.
Because of differences in shear strain at failure for different modes offailure along a failure arc, “peak” shear strengths are not mobilized simul-taneously all along the entire failure surface. Ladd (1975) has proposed aprocedure accounting for strain compatibility that determines an averageshear strength to be used in undrained stability analyses. Fuleihan and Ladd(1976) showed that, in the case of the normally consolidated AtchafalayaClay, the CKoUDSS SHANSEP strength was in agreement with the averageshear strength computed using the above procedure. All the 2D analyses usedthe Modified Bishop method.
To assess the importance of variability in su to undrained stability, it isessential to consider the volume of soil of importance to the performanceprediction. At one extreme, if the volume of soil involved in a failure wereinfinite, spatial uncertainty would completely average out, and the system-atic component uncertainty would become the total uncertainty. At the otherextreme, if the volume of soil involved were infinitesimal, spatial and sys-tematic uncertainties would both contribute fully to total uncertainty. Theuncertainty for intermediate volumes of soil depends on the character ofspatial variability in the deposit, specifically, on the rapidity with which soilproperties fluctuate from one point to another across the site. A convenientindex expressing this scale of variation is the autocorrelation distance, δ0,which measures the distance to which fluctuations of soil properties abouttheir expected value are strongly associated.
Too few data were available to estimate autocorrelation distance for thestorage are, thus bounding calculations were made for two extreme casesin the 2D analyses, L/δ0 → 0 (i.e. “small” failure surface) and L/δ0 → ∞(i.e. “large” failure surface), in which L is the length of the potential fail-ure surface. Undrained shear strength values corresponding to significantaveraging were used to evaluate uncertainty in the factor of safety forlarge failure surfaces and values corresponding to little averaging for small
[17:33 1/2/2008 5108-Phoon-Ch02.tex] Job No: 5108 PHOON: RB Design in Geo. Eng. Page: 100 76–133
100 G. B. Baecher and J. T. Christian
Symbol
2.0
0.8
1.0
1.2
1.4
20 25 30
20 25
=E [F.S.] − 1.0
SD[F.S.]
FILL HEIGHT, Hf (ft)30
Mean minesone standarddeviation (SD)
Mean F.S. = E [F.S.]
35
35
RE
LIA
BIL
ITY
IND
EX
, bFA
CTO
R O
F S
AF
ET
Y, F
.S.
1.5
1.0
0.5
0
Case Effect of uncertainty in
clay undrained shearstrength, su
L/ro
L/ro
L/ro
L/ro
L/ro
L/ro
fill total unit weight, gfclay undrained shear strengthsu and fill total unit weight, gf
(I)
b
∞
∞
∞
0
0
0
Figure 2.18 Expected value su profile and the standard deviation of su divided into spatialand systematic components.
failure surface. The results of the 2D stability analysis were plotted as afunction of embankment height.
Uncertainty in the FS was estimated by performing stability analyses usingthe procedure of Christian et al. (1994) with expected value and expectedvalue minus standard deviation values of soil properties. For a given expected
[17:33 1/2/2008 5108-Phoon-Ch02.tex] Job No: 5108 PHOON: RB Design in Geo. Eng. Page: 101 76–133
Spatial variability and geotechnical reliability 101
value of FS, the larger the standard deviation of FS, the higher the chancethat the realized FS is less than unity and thus the lower the actual safety ofthe facility. The second-moment reliability index [Equation (2.1)] was usedto combine E[FS] and SD[FS] in a single measure of safety and related to a“nominal” probability of failure by assuming FS Normally distributed.
2.3 Estimating autocovariance
Estimating autocovariance from sample data is the same as making anyother statistical estimate. Sample data differ from one set of observa-tions to another, and thus the estimates of autocovariance differ. Theimportant questions are, how much do these estimates differ, and howmuch might one be in error in drawing inferences? There are two broadapproaches: Frequentist and Bayesian. The Frequentist approach is morecommon in geotechnical practice. For discussion of Bayesian approaches toestimating autocorrelation see Zellner (1971), Cressie (1991), or Berger et al.(2001).
In either case, a mathematical function of the sample observations, is usedas an estimate of the true population parameters, θ . One wishes to determineθ = g(z1, . . . ,zn), in which {z 1, …, zn} is the set of sample observations and θ ,which can be a scalar, vector, or matrix. For example, the sample mean mightbe used as an estimator of the true population mean. The realized value of θ
for a particular sample {z1 …, zn} is an estimate. As the probabilistic proper-ties of the {z1,…, zn} are assumed, the corresponding probabilistic propertiesof θ can be calculated as functions of the true population parameters. This iscalled the sampling distribution of θ . The standard deviation of the samplingdistribution is called, the standard error.
The quality of the estimate obtained in this way depends on how variablethe estimator θ is about the true value θ . The sampling distribution, andhence the goodness of an estimate, has to do with how the estimate mighthave come out if another sample and therefore another set of observationshad been made. Inferences made in this way do not admit of a probabilitydistribution directly on the true population parameter. Put another way, theFrequentist approach presumes the state of nature θ to be a constant, andyields a probability that one would observe those data that actually wereobserved. The probability distribution is on the data, not on θ . Of course,the engineer or analyst wants the reverse: the probability of θ , given the data.For further discussion, see Hartford and Baecher (2004).
Bayesian estimation works in a different way. Bayesian theory allowsprobabilities to be assigned directly to states of nature such as θ . Thus,Bayesian methods start with an a priori probability distribution, f (θ ), whichis updated by the likelihood of observing the sample, using Bayes’s Theorem,
f (θ |z1, . . . , zn)∞ f (θ )L(θ |z1, . . . , zn) (2.21)
[17:33 1/2/2008 5108-Phoon-Ch02.tex] Job No: 5108 PHOON: RB Design in Geo. Eng. Page: 102 76–133
102 G. B. Baecher and J. T. Christian
in which f (θ |z1,…, zn) is the a posteriori pdf of θ conditioned on the obser-vations, and L(θ |z1 , … , zn) is the likelihood of θ , which is the conditionalprobability of {z1, …, zn} as a function of θ . Note, the Fisherian conceptof a maximum likelihood estimator is mathematically related to Bayesianestimation in that both adopt the likelihood principle that all informationin the sample relevant to making an estimate is contained in the Likelihoodfunction; however, the maximum likelihood approach still ends up with aprobability statement on the variability of the estimator and not on the stateof nature, which is an important distinction.
2.3.1 Moment estimation
The most common (Frequentist) method of estimating autocovariance func-tions for soil and rock properties is the method of moments. This uses thestatistical moments of the observations (e.g. sample means, variances, andcovariances) as estimators of the corresponding moments of the populationbeing sampled.
Given the measurements {z1,…, zn} made at equally spaced locations{x1,…, xn} along a line, as for example in a boring, the sample autocovarianceof the measurements for separation is,
Cz(δ) = 1(n − δ)
n−δ∑i=1
[{z(xi) − t(xi)}{z(xi+δ) − t(xi+δ)}] (2.22)
in which Cz(δ) is the estimator of the autocovariance function at δ, (n− δ) isthe number of data pairs having separation distance δ, and t(xi) is the trendremoved from the data at location xi.
Often, t(xi) is simply replaced by the spatial mean, estimated by the meanof the sample. The corresponding moment estimator of the autocorrelation,R(δ), is obtained by dividing both sides by the sample variance,
Rz(δ) = 1s2z (n − δ)
n−δ∑i=1
[{z(xi) − t(xi)}{z(xi+δ) − t(xi+δ)}] (2.23)
in which sz is the sample standard deviation. Computationally, this simplyreduces to taking all data pairs of common separation distance d, calcu-lating the correlation coefficient of that set, then plotting the result againstseparation distance.
In the general case, measurements are seldom uniformly spaced, at least inthe horizontal plane and seldom lie on a line. For such situations the sampleautocovariance can still be used as an estimator, but with some modification.The most common way to accommodate non-uniformly placed measure-ments is by dividing separation distances into bands, and then taking theaverages within those bands.
[17:33 1/2/2008 5108-Phoon-Ch02.tex] Job No: 5108 PHOON: RB Design in Geo. Eng. Page: 103 76–133
Spatial variability and geotechnical reliability 103
The moment estimator of the autocovariance function requires no assump-tions about the shape of the autocovariance function, except that secondmoments exist. The moment estimator is consistent, in that as the samplesize becomes large, E[(θ − θ )2]→ 0. On the other hand, the moment estima-tor is only asymptotically unbiased. Unbiasedness means that the expectedvalue of the estimator over all ways the sample might have been taken equalsthe actual value of the function being estimated. For finite sample sizes, theexpected values of the sample autocovariance can differ significantly from theactual values, yielding negative values beyond the autocovariance distance(Weinstock, 1963).
It is well known that the sampling properties of the moment estima-tor of autocorrelation are complicated, and that large sampling variances(and thus poor confidence) are associated with estimates at large sep-aration distances. Phoon and Fenton (2004) and Phoon (2006a) haveexperimented with bootstrapping approaches to estimate autocorrelationfunctions with promising success. These and similar approaches fromstatistical signal processing should be exploited more thoroughly in thefuture.
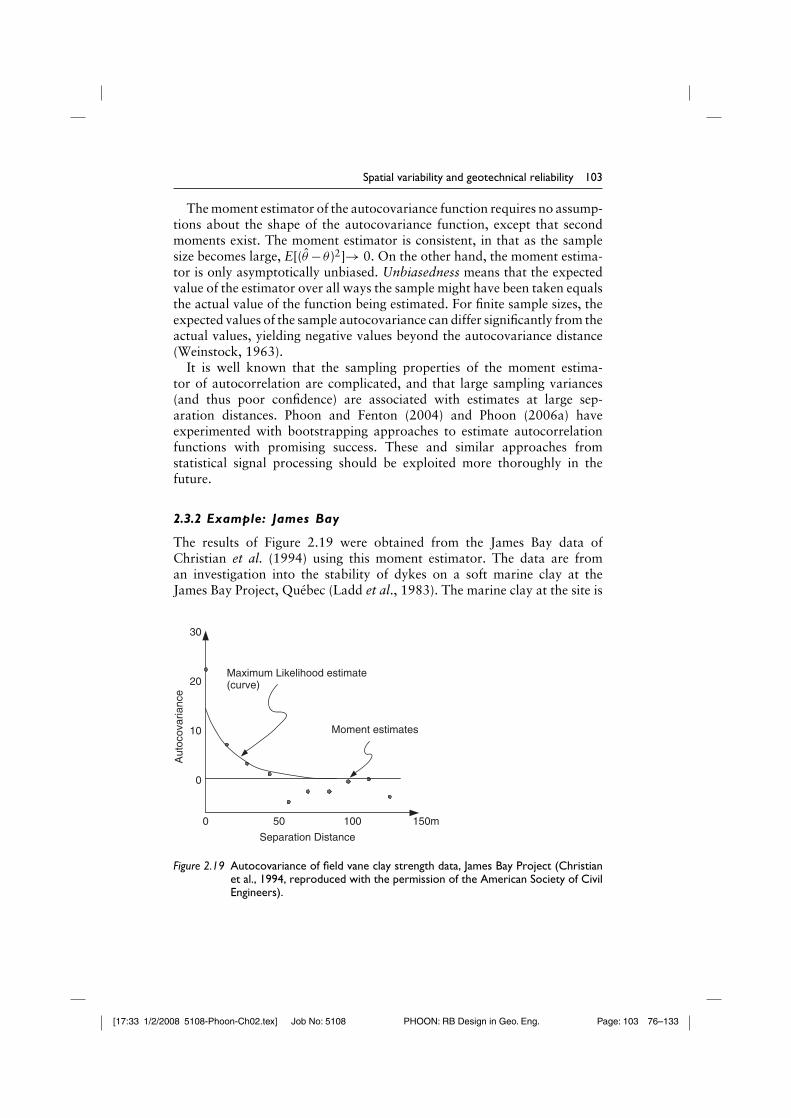
2.3.2 Example: James Bay
The results of Figure 2.19 were obtained from the James Bay data ofChristian et al. (1994) using this moment estimator. The data are froman investigation into the stability of dykes on a soft marine clay at theJames Bay Project, Québec (Ladd et al., 1983). The marine clay at the site is
Separation Distance
Aut
ocov
aria
nce
30
0
10
20Maximum Likelihood estimate(curve)
Moment estimates
150m100500
Figure 2.19 Autocovariance of field vane clay strength data, James Bay Project (Christianet al., 1994, reproduced with the permission of the American Society of CivilEngineers).
[17:33 1/2/2008 5108-Phoon-Ch02.tex] Job No: 5108 PHOON: RB Design in Geo. Eng. Page: 104 76–133
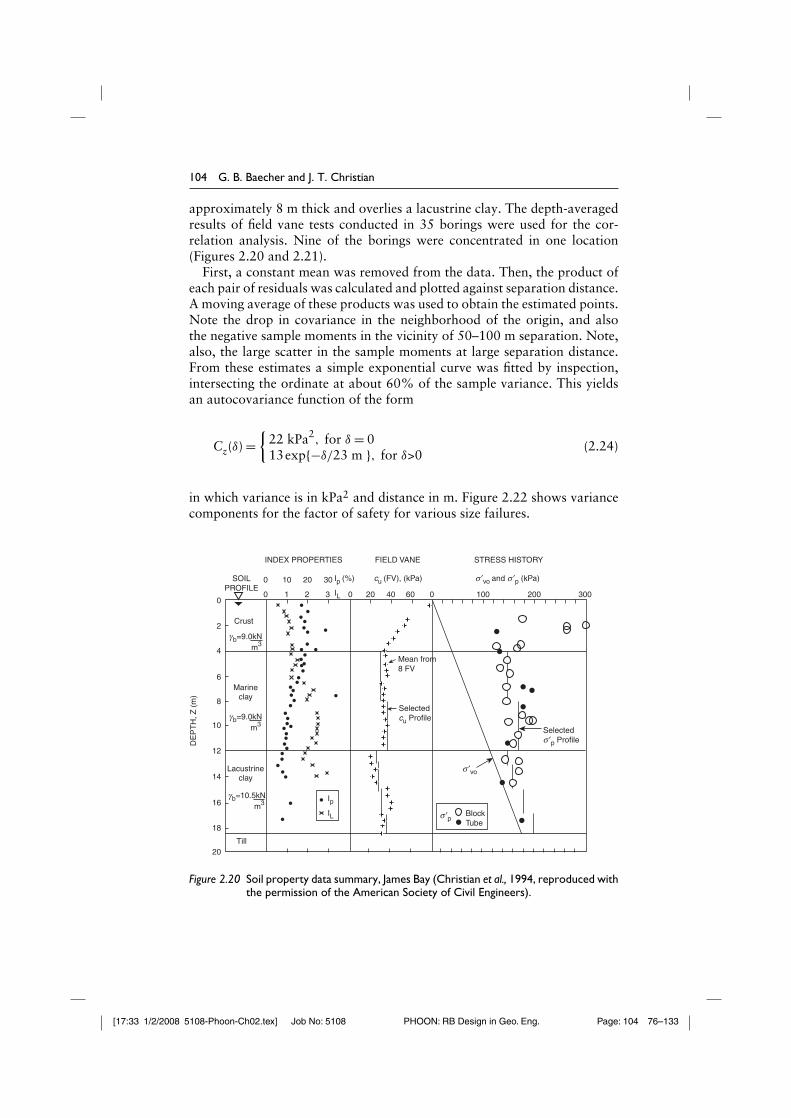
104 G. B. Baecher and J. T. Christian
approximately 8 m thick and overlies a lacustrine clay. The depth-averagedresults of field vane tests conducted in 35 borings were used for the cor-relation analysis. Nine of the borings were concentrated in one location(Figures 2.20 and 2.21).
First, a constant mean was removed from the data. Then, the product ofeach pair of residuals was calculated and plotted against separation distance.A moving average of these products was used to obtain the estimated points.Note the drop in covariance in the neighborhood of the origin, and alsothe negative sample moments in the vicinity of 50–100 m separation. Note,also, the large scatter in the sample moments at large separation distance.From these estimates a simple exponential curve was fitted by inspection,intersecting the ordinate at about 60% of the sample variance. This yieldsan autocovariance function of the form
Cz(δ) ={
22 kPa2, for δ = 0
13exp{−δ/23 m }, for δ>0(2.24)
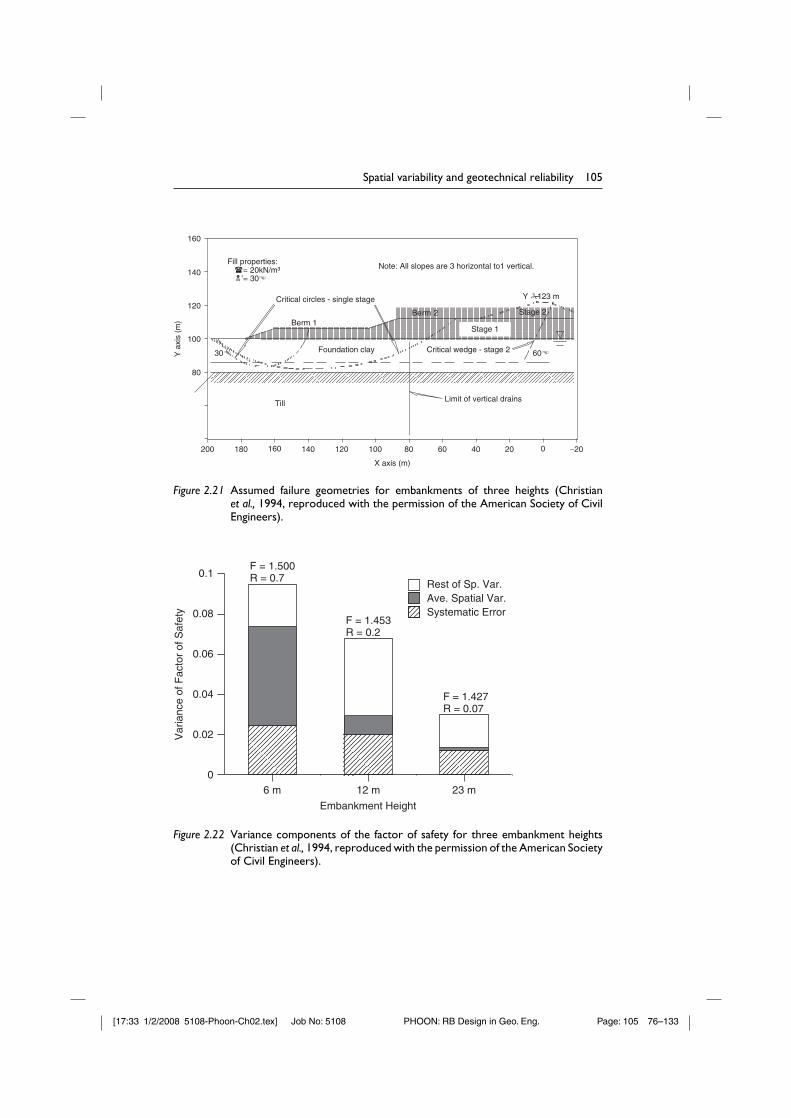
in which variance is in kPa2 and distance in m. Figure 2.22 shows variancecomponents for the factor of safety for various size failures.
INDEX PROPERTIES FIELD VANE STRESS HISTORY
DE
PT
H, Z
(m
)
0
SOILPROFILE
0
0 1 2 3 0 20 6040 0 100 200 300
10 20 30
2
4
6
8
10
12
14
16
18
20
Mean from8 FV
Selectedcu Profile
Ip
IL
Ip (%) cu (FV), (kPa) s ′vo and s ′p (kPa)
IL
Selecteds ′p Profile
BlockTube
Till
Lacustrineclay
Marineclay
Crust
s ′p
s ′vo
gb=9.0kNm3
gb=9.0kNm3
gb=10.5kNm3
Figure 2.20 Soil property data summary, James Bay (Christian et al., 1994, reproduced withthe permission of the American Society of Civil Engineers).
[17:33 1/2/2008 5108-Phoon-Ch02.tex] Job No: 5108 PHOON: RB Design in Geo. Eng. Page: 105 76–133
Spatial variability and geotechnical reliability 105
160
140
120
100
Y a
xis
(m)
80
200 180 160 140 120 100 80 60 40 20 0 −20
X axis (m)
Fill properties: = 20kN/m³’= 30
Note: All slopes are 3 horizontal to1 vertical.
Y 123 m
Stage 2Berm 2Berm 1
Foundation clay Critical wedge - stage 2
Critical circles - single stage
Till Limit of vertical drains
6030
Stage 1
Figure 2.21 Assumed failure geometries for embankments of three heights (Christianet al., 1994, reproduced with the permission of the American Society of CivilEngineers).
Embankment Height
6 m 12 m 23 m0
0.02
0.04
0.06
0.08
Var
ianc
e of
Fac
tor
of S
afet
y
0.1Rest of Sp. Var.Ave. Spatial Var.Systematic Error
F = 1.500R = 0.7
F = 1.453R = 0.2
F = 1.427R = 0.07
Figure 2.22 Variance components of the factor of safety for three embankment heights(Christian et al., 1994, reproduced with the permission of the American Societyof Civil Engineers).
[17:33 1/2/2008 5108-Phoon-Ch02.tex] Job No: 5108 PHOON: RB Design in Geo. Eng. Page: 106 76–133
106 G. B. Baecher and J. T. Christian
2.3.3 Maximum likelihood estimation
Maximum likelihood estimation takes as the estimator that value of theparameter(s) θ leading to the greatest probability of observing the data,{z1, … , zn}, actually observed. This is found by maximizing the likelihoodfunction, L(θ |z1, … , zn). Maximum likelihood estimation is parametricbecause the distributional form of the pdf f (z1, … , zn|θ ) must be specified.In practice, the estimate is usually found by maximizing the log-likelihood,which, because it deals with a sum rather than a product and becausemany common probability distributions involve exponential terms, is moreconvenient.
The appeal of the maximum likelihood estimator is that it possessesmany desirable sampling properties. Among others, it has minimum vari-ance (although not necessarily unbiased), is consistent, and asymptoticallyNormal. The asymptotic variance of θML is
limn→∞ Var[θML]=Iz(θ ) = nE[−δ2LL/∂θ2] (2.25)
in which, Iz(θ ) is Fisher’s Information (Barnett, 1982) and LL is the log-likelihood.
Figure 2.23 shows the results of simulated sampling experiments in whichspatial fields were generated from a multivariate Gaussian pdf with speci-fied mean trend and autocovariance function. Samples of sizes n = 36, 64,and 100 were taken from these simulated fields, and maximum likelihoodestimators used to obtain estimates of the parameters of the mean trend andautocovariance function. The smooth curves show the respective asymp-totic sampling distributions, which in this case conform well with the actualestimates (DeGroot and Baecher, 1993).
An advantage of the maximum likelihood estimator over moment esti-mates in dealing with spatial data is that it allows simultaneous estimation ofthe spatial trend and autocovariance function of the residuals. Mardia andMarshall (1984) provide an algorithmic procedure finding the maximum.DeGroot and Baecher used the Mardia and Marshall approach in analyzingthe James Bay data. First, they removed a constant mean from the data, andestimated the autocovariance function of the residuals as,
Cz(δ) ={
23forδ = 013.3 exp { − δ/21.4}, for δ > 0
(2.26)
in which variance is in kPa2 and distance is in m. Then, using estimating thetrend implicitly,
β0 = 40.7 kPa
β1 = −2.0 × 10⁻³ kPa/m
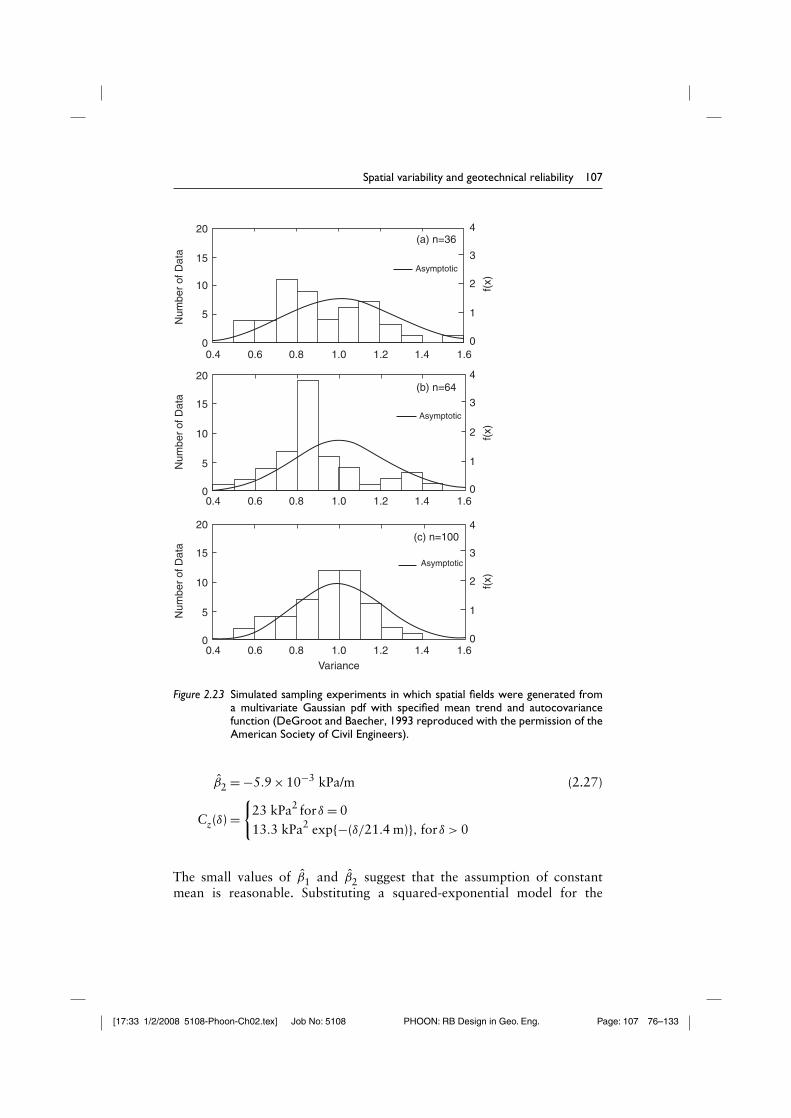
[17:33 1/2/2008 5108-Phoon-Ch02.tex] Job No: 5108 PHOON: RB Design in Geo. Eng. Page: 107 76–133
Spatial variability and geotechnical reliability 107
20
15
Num
ber
of D
ata
Num
ber
of D
ata
10
5
0
15
10
5
0
20
Num
ber
of D
ata
15
10
5
0
20
0.4 0.6 0.8 1.0 1.2 1.4 1.6
0.4 0.6 0.8 1.0 1.2 1.4 1.6
0.4 0.6 0.8 1.0Variance
1.2 1.4 1.6
0
4
3
2
1
0
1
2 f(x)
f(x)
3
4(a) n=36
(b) n=64
Asymptotic
0
1
2 f(x)
3
4(c) n=100
Asymptotic
Asymptotic
Figure 2.23 Simulated sampling experiments in which spatial fields were generated froma multivariate Gaussian pdf with specified mean trend and autocovariancefunction (DeGroot and Baecher, 1993 reproduced with the permission of theAmerican Society of Civil Engineers).
β2 = −5.9 × 10⁻³ kPa/m (2.27)
Cz(δ) ={
23 kPa2 forδ = 013.3 kPa2 exp{−(δ/21.4 m)}, forδ > 0
The small values of β1 and β2 suggest that the assumption of constantmean is reasonable. Substituting a squared-exponential model for the
[17:33 1/2/2008 5108-Phoon-Ch02.tex] Job No: 5108 PHOON: RB Design in Geo. Eng. Page: 108 76–133
108 G. B. Baecher and J. T. Christian
autocovariance results in
β0 = 40.8 kPa
β1 = −2.1 × 10⁻³ kPa/m
β2 = −6.1 × 10⁻³ kPa/m (2.28)
Cz(δ) ={
22.9 kPa2 forδ = 012.7 kPa2 exp{−(δ/37.3 m)2}, forδ > 0
The exponential model is superimposed on the moment estimates ofFigure 2.19.
The data presented in this case suggest that a sound approach to estimatingautocovariance should involve both the method of moments and maximumlikelihood. The method of moments gives a plot of autocovariance versusseparation, providing an important graphical summary of the data, whichcan be used as a means of determining if the data suggest correlation and forselecting an autocovariance model. This provides valuable information forthe maximum likelihood method, which then can be used to obtain estimatesof both autocovariance parameters and trend coefficients.
2.3.4 Bayesian estimation
Bayesian inference for autocorrelation has not been widely used in geotechni-cal and geostatistical applications, and it is less well developed than momentestimates. This is true despite the fact that Bayesian inference yields theprobability associated with the parameters, given the data, rather than theconfidence in the data, given the probabilistic model. An intriguing aspect ofBayesian inference of spatial trends and autocovariance functions is that formany of the non-informative prior distributions one might choose to reflectlittle or no prior information about process parameters (e.g. the Jeffreysprior, the Laplace prior, truncated parameter spaces), the posterior pdf’scalculated through Bayesian theorem are themselves improper, usually inthe sense that they do not converge toward zero at infinity, and thus thetotal probability or area under the posterior pdf is infinite.
Following Berger (1993), Boger et al. (2001) and Kitanidis (1985, 1997),the spatial model is typically written as a Multinomial random process:
z(x) =k∑
i=1
fi(x)β + ε(x) (2.29)
in which fi(x) are unknown deterministic functions of the spatial loca-tions x, and ε (x) is a zero-mean spatial random function. The random
[17:33 1/2/2008 5108-Phoon-Ch02.tex] Job No: 5108 PHOON: RB Design in Geo. Eng. Page: 109 76–133
Spatial variability and geotechnical reliability 109
term is spatially correlated, with an isotropic autocovariance function. Theautocovariance function is assumed to be non-negative and to decreasemonotonically with distance to zero at infinite separation. These assumptionsfit most common autocovariance functions in geotechnical applications. TheLikelihood of a set of observations, z={z1, …, zn}, is then,
L(β,σ |z) = (2πσ 2)−n/2|Rθ |−1/2 exp{− 1
2σ 2 (z − Xβ)tR−1θ (z − Xβ)
}(2.30)
in which X is the (n × k) matrix defined by Xij=fj(Xi), Rθ is the matrix ofcorrelations among the observations dependent on the parameters, and |Rθ |is the determinant of the correlation matrix of the observations.
In the usual fashion, a prior non-informative distribution on the param-eters (β, σ , θ ) might be represented as f (β, σ , θ )∞(σ 2)−af (θ ) for variouschoices of the parameter a and of the marginal pdf f (θ ). The obvious choicesmight be {a = 1, f (θ ) = 1}, {a = 1, f (θ ) = 1/θ }, or {a = 1, f (θ ) = 1}; but eachof these leads to an improper posterior pdf, as does the well-known Jeffreysprior. A proper, informative prior does not share this difficulty, but it iscorrespondingly hard to assess from usually subjective opinion. Given thisproblem, Berger et al. (2001) suggest the reference non-informative prior,
f (β,σ,θ ) ∝ 1σ 2
(|W2
θ |− |W2θ |
(n − k)
)1/2
(2.31)
in which,
W2θ = ∂Rθ
∂θR−1
θ {I − X(X′R−1θ X)−1X
′R−1
θ } (2.32)
This does lead to a proper posterior. The posterior pdf is usually evaluatednumerically, although depending on the choice of autocovariance functionmodel and the extent to which certain of the parameters of that model areknown, closed-form solutions can be obtained. Berger et al. (2001) presenta numerically calculated example using terrain data from Davis (1986).
2.3.5 Variograms
In mining, the importance of autocorrelation for estimating ore reserveshas been recognized for many years. In mining geostatistics, a functionrelated to the autocovariance, called the variogram (Matheron, 1971), iscommonly used to express the spatial structure of data. The variogramrequires a less-restrictive statistical assumption on stationarity than doesthe autocovariance function and it is therefore sometimes preferred for
[17:33 1/2/2008 5108-Phoon-Ch02.tex] Job No: 5108 PHOON: RB Design in Geo. Eng. Page: 110 76–133
110 G. B. Baecher and J. T. Christian
inference problems. On the other hand, the variogram is more difficult touse in spatial interpolation and engineering analysis, and thus for geotech-nical purposes the autocovariance is used more commonly. In practice, thetwo ways of characterizing spatial structure are closely related.
Whereas the autocovariance is the expected value of the product oftwo observations, the variogram 2γ is the expected value of the squareddifference:
2γ = E[{z(xi) − z(xj)}2] = Var[z(xi) − z(xj)] (2.33)
which is a function of only the increments of the spatial properties, nottheir absolute values. Cressie (1991) points out that, in fact, the commondefinition of the variogram as the mean squared difference – rather thanas the variance of the difference – limits applicability to a more restric-tive class of processes than necessary, and thus the latter definition is tobe preferred. None the less, one finds the former definition more commonlyreferred to in the literature. The term γ is referred to as the semivariogram,although caution must be exercised because different authors interchangethe terms. The concept of average mean-square difference has been usedin many applications, including turbulence (Kolmogorov, 1941) and timeseries analysis (Jowett, 1952), and is alluded to in the work of Matérn(1960).
The principal advantage of the variogram over the autocovariance is thatit makes less restrictive assumptions on the stationarity of the spatial prop-erties being sampled; specifically, only that their increment and not theirmean is stationary. Furthermore, the use of geostatatistical techniques hasexpanded broadly, so that a great deal of experience has been accumulatedwith variogram analysis, not only in mining applications, but also in environ-mental monitoring, hydrology, and even geotechnical engineering (Chiassonet al., 1995; Soulie and Favre, 1983; Soulie et al., 1990).
For spatial variables with stationary means and autocovariances (i.e.second-order stationary processes), the variogram and autocovariance func-tion are directly related by
γ (δ) = Cz(0) − Cz(δ) (2.34)
Common analytical forms for one-dimensional variograms are given inTable 2.3.
For a stationary process, as |δ → ∞,Cz(δ) → 0; thus, γ (δ) → Cz(0) =Var(z(x)). This value at which the variogram levels off, 2Cz(δ), is called thesill value. The distance at which the variogram approaches the sill is called,the range. The sampling properties of the variogram are summarized byCressie (1991).
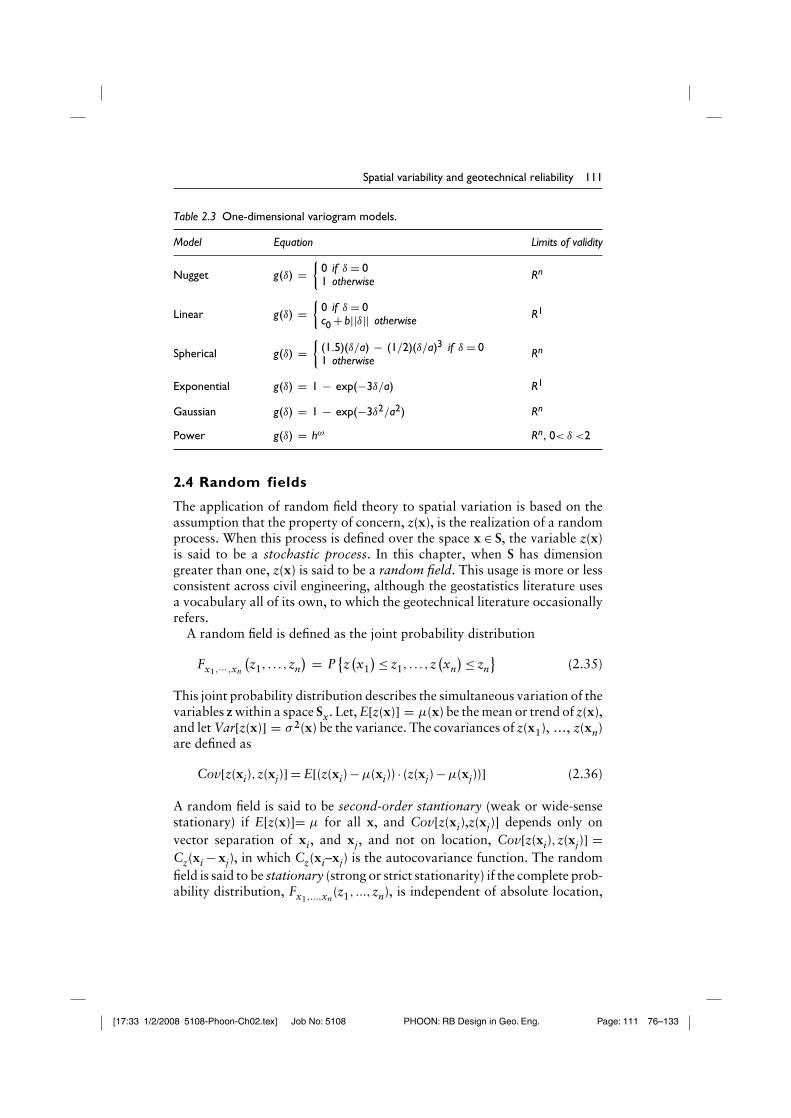
[17:33 1/2/2008 5108-Phoon-Ch02.tex] Job No: 5108 PHOON: RB Design in Geo. Eng. Page: 111 76–133
Spatial variability and geotechnical reliability 111
Table 2.3 One-dimensional variogram models.
Model Equation Limits of validity
Nugget g(δ) ={
0 if δ = 01 otherwise Rn
Linear g(δ) ={
0 if δ = 0c0 + b||δ|| otherwise R1
Spherical g(δ) ={
(1.5)(δ/a) − (1/2)(δ/a)3 if δ = 01 otherwise
Rn
Exponential g(δ) = 1 − exp(−3δ/a) R1
Gaussian g(δ) = 1 − exp(−3δ2/a2) Rn
Power g(δ) = hω Rn, 0< δ <2
2.4 Random fields
The application of random field theory to spatial variation is based on theassumption that the property of concern, z(x), is the realization of a randomprocess. When this process is defined over the space x ∈ S, the variable z(x)is said to be a stochastic process. In this chapter, when S has dimensiongreater than one, z(x) is said to be a random field. This usage is more or lessconsistent across civil engineering, although the geostatistics literature usesa vocabulary all of its own, to which the geotechnical literature occasionallyrefers.
A random field is defined as the joint probability distribution
Fx1,··· ,xn
(z1, . . . ,zn
) = P{z(x1)≤ z1, . . . ,z
(xn
)≤ zn
}(2.35)
This joint probability distribution describes the simultaneous variation of thevariables z within a space Sx. Let, E[z(x)] = µ(x) be the mean or trend of z(x),and let Var[z(x)] = σ 2(x) be the variance. The covariances of z(x1), …, z(xn)are defined as
Cov[z(xi),z(xj)] = E[(z(xi) −µ(xi)) · (z(xj) −µ(xj))] (2.36)
A random field is said to be second-order stantionary (weak or wide-sensestationary) if E[z(x)]= µ for all x, and Cov[z(xi),z(xj)] depends only onvector separation of xi, and xj, and not on location, Cov[z(xi),z(xj)] =Cz(xi − xj), in which Cz(xi–xj) is the autocovariance function. The randomfield is said to be stationary (strong or strict stationarity) if the complete prob-ability distribution, Fx1,...,xn
(z1, ...,zn), is independent of absolute location,
[17:33 1/2/2008 5108-Phoon-Ch02.tex] Job No: 5108 PHOON: RB Design in Geo. Eng. Page: 112 76–133
112 G. B. Baecher and J. T. Christian
depending only on vector separations among the xi…xn. Strong stationarityimplies second-order stationarity. In the geotechnical literature, stationar-ity is sometimes referred to as statistical homogeneity. If the autocovariancefunction depends only on the absolute separation distance and not direction,the random field is said to be isotropic.
Ergodicity is a concept originating in the study of time series, in whichone observes individual time series of data, and wishes to infer proper-ties of an ensemble of all possible time series. The meaning and practicalimportance of ergodicity to the inference of unique realizations of spatialrandom fields is less well-defined and is debated in the literature. Simply,ergodicity means that the probabilistic properties of a random process(field) can be completely estimated from observing one realization of thatprocess. For example, the stochastic time series z(t) = ν + ε(t), in which ν
is discrete random variable and ε(t) is an autocorrelated random processof time, is non-ergotic. In one realization of the process there is but onevalue of ν, and thus the probability distribution of ν cannot be estimated.One would need to observe many realizations of zt, in order to have suf-ficiently many observations of ν, to estimate Fν(ν). Another non-ergoticprocess of more relevance to the spatial processes in geotechnical engi-neering is z(x) = ν + ε(x), in which the mean of z(x) varies linearly withlocation x. In this case, z(x) is non-stationary; Var[z(x)] increases with-out limit as the window within which z(x) is observed increases, andthe mean mz of the sample of z(x) is a function of the location of thewindow.
The meaning of ergodicity for spatial fields of the sort encountered ingeotechnical engineering is less clear, and has not been widely discussed inthe literature. An assumption weaker than full erogodicity, which none theless should apply for spatial fields, is that the observed sample mean mz andsample autocovariance function Cz(δ) converge in mean-squared error to therespective random field mean and autocovariance function as the volumeof space within which they are sampled increases. This means that, as thevolume of space increases, E[(mz − µ)2]→0, and E[{(Cz(δ) − Cz(δ)}2] → 0.Soong and Grigoriu (1993) provide conditions for checking ergodicity inmean and autocorrelation.
When the joint probability distribution Fx1,...,xn(z1, . . .,zn) is multivari-
ate Normal (Gaussian), the process z(x) is said to be a Gaussian randomfield. A sufficient conditionfor ergodicity of a Gaussian random field isthat lim|δ|→∞Cz(δ) = 0. This can be checked empirically by inspecting thesample moments of the autocovariance function to ensure they convergeto 0. Cressie (1991) notes limitations of this procedure. Essentially allthe analytical autocovariance functions common in the geotechnical liter-ature obey this condition, and few practicioners appear concerned aboutverifying ergodicity. Christakos (1992) suggests that, in practial situations,it is difficulty or impossible to verify ergodicy for spatial fields.
[17:33 1/2/2008 5108-Phoon-Ch02.tex] Job No: 5108 PHOON: RB Design in Geo. Eng. Page: 113 76–133
Spatial variability and geotechnical reliability 113
A random field that does not meet the conditions of stationarity is saidto be non-stationary. Loosely speaking, a non-stationary field is statisticallyheterogeneous. It can be heterogeneous in a number of ways. In the sim-plest case, the mean may be a function of location, for example, if there is aspatial trend that has not been removed. In a more complex case, the vari-ance or autocovariance function may vary in space. Depending on the wayin which the random field is non-stationary, sometimes a transformation ofvariables can convert a non-stationary field to a stationary or nearly station-ary field. For example, if the mean varies with location, perhaps a trend canbe removed.
In the field of geostatistics, a weaker assumption is made on stationaritythan that described above. Geostatisticians usually assume only that incre-ments of a spatial process are stationary (i.e. differences |z1 − z2|) and thenoperate on the probabilistic properties of those increments. This leads to theuse of the variogram rather than the autocovariance function. Stationarityof the autocovariance function implies stationarity of the variogram, but thereverse is not true.
Like most things in the natural sciences, stationarity is an assumption ofthe model and may only be approximately true in the world. Also, station-arity usually depends on scale. Within a small region soil properties maybehave as if drawn from a stationary process, whereas the same propertiesover a larger region may not be so well behaved.
2.4.1 Permissible autocovariance functions
By definition, the autocovariance function is symmetric, meaning
Cz(δ) = Cz(−δ) (2.37)
and bounded, meaning
Cz(δ) ≤ Cz(0) = σ 2z (2.38)
In the limit, as distance becomes large,
lim |δ|→∞Cz(δ)
|δ|−(n−1)/2 = 0 (2.39)
In general, in order for Cz(δ) to be a permissible autocovariance function,it is necessary and sufficient that a continuous mathematical expression ofthe form
m∑i=1
m∑j=1
kikjCz(δ) ≥ 0 (2.40)
[17:33 1/2/2008 5108-Phoon-Ch02.tex] Job No: 5108 PHOON: RB Design in Geo. Eng. Page: 114 76–133
114 G. B. Baecher and J. T. Christian
be non-negative-definite for all integers m, scalar coefficients k1,…km,and δ. This condition follows from the requirement that variances of linearcombinations of the z(xi), of the form
var
[m∑
i=1
kiz(xi)
]=
m∑i=1
m∑j=1
kikjCz(δ) ≥ 0 (2.41)
be non-negative, i.e. the matrix is positive definite (Cressie, 1991). Christakos(1992) discusses the mathematical implications of this condition on selectingpermissible forms for the autocovariance. Suffice it to say that analyticalmodels of autocovariance common in the geotechnical literature usuallysatisfy the condition.
Autocovariance functions valid in a space of dimension d are validin spaces of lower dimension, but the reverse is not necessarily true.That is, a valid autocovariance function in 1D is not necessarily validin 2D or 3D. Christakos (1992) gives the example of the linearly decliningautcovariance,
Cz(δ) ={
σ 2(1 − δ/δ0), for 0 ≤ δ ≤ δ0
0, for δ > δ0(2.42)
which is valid in 1D, but not in higher dimensions.Linear sums of valid autocovariance functions are also valid. This means
that if Cz1(δ) and Cz2(δ) are valid, then the sum Cz1(δ)+Cz2(δ) is also a validautocovariance function. Similarly, if Cz(δ) is valid, then the product with ascalar, αCz(δ), is also valid.
An autocovariance function in d-dimensional space is separable if
Cz(δ) =d∏
i=1
Czi(δi) (2.43)
in which δ is the d-dimensioned vector of orthogonal separation distances{δ1,…,δd}, and Ci(δi) is the one-dimensional autocovariance function indirection i. For example, the autocovariance function
Cz(δ) = σ 2 exp{−a2|δ|2}= σ 2 exp{−a2(δ1
2 +·· ·+ δ2d)} (2.44)
= σ 2d∏
i=1
exp{−a2δ2i }
is separable into its one-dimensional components.
[17:33 1/2/2008 5108-Phoon-Ch02.tex] Job No: 5108 PHOON: RB Design in Geo. Eng. Page: 115 76–133
Spatial variability and geotechnical reliability 115
The function is partially separable if
Cz(δ) = Cz(δi)Cz(δj =i) (2.45)
in which Cz(δj =i) is a (d − 1) dimension autocovariance function, implyingthat the function can be expressed as a product of autocovariance func-tions of lower dimension fields. The importance of partial separability togeotechnical applications, as noted by Vanmarcke (1983), is the 3D case ofseparating autocorrelation in the horizontal plane from that with depth:
Cz(δ1,δ2,δ3) = Cz(δ1,δ2)Cz(δ3) (2.46)
in which δ1, δ2, are horizontal distances, and δ3 is depth.
2.4.2 Gaussian random fields
The Gaussian random field is an important special case because it is widelyapplicable due to the Central Limit Theorem, has mathematically conve-nient properties, and is widely used in practice. The probability densitydistribution of the Gaussian or Normal variable is
fz(z) = − 1√2πσ
exp
{−1
2
(x −µ
σ
)2}
(2.47)
for −∞ ≤ z ≤ ∞. The mean is E[z] = µ , and variance Var[z] = σ 2. For themultivariate case of vector z, of dimension n, the correponding pdf is
fz(z) = (2π )−n/2|�|−1/2 exp{−1
2(z −µ)′�−1(z −µ)
}(2.48)
in which µ is the mean vector, and � the covariance matrix:
�ij ={Cov
[zi(x),zj(x)
]}(2.49)
Gaussian random fields have the following convenient properties (Adler,1981): (1) they are completely characterized by the first- and second-ordermoments: the mean and autocovarinace function for the univariate case,and mean vector and autocovariance matrix (function) for the multivari-ate case; (2) any subset of variables of the vector is also jointly Gaussian;(3) the conditional probability distributions of any two variables or vectorsare also Gaussian distributed; (4) if two variables, z1 and z2 are bivariateGaussian, and if their covariance Cov[z1, z2] is zero, then the variables areindependent.
[17:33 1/2/2008 5108-Phoon-Ch02.tex] Job No: 5108 PHOON: RB Design in Geo. Eng. Page: 116 76–133
116 G. B. Baecher and J. T. Christian
2.4.3 Interpolating random fields
A problem common in site characterization is interpolating among spa-tial observations to estimate soil or rock properties at specific locationswhere they have not been observed. The sample observations themselvesmay have been taken under any number of sampling plans: random, sys-tematic, cluster, and so forth. What differentiates this spatial estimationquestion from the sampling theory estimates in preceding sections of thischapter is that the observations display spatial correlation. Thus, the assump-tion of IID observations underlying the estimator results is violated in animportant way. This question of spatial interpolation is also a problemcommon to the natural resources industries such as forestry (Matérn, 1986)and mining (Matheron, 1971), but also geohydrology (Kitanidis, 1997), andenvironmental monitoring (Switzer, 1995).
Consider the case for which the observations are sampled from aspatial population with constant mean, µ, and autocovariance functionCz(δ) = E[z(xi)z(xi+δ)]. The set of observations z={zi,… , zn} thereforehas mean vector m in which all the terms are equal, and covariancematrix,
� =
Var(z1) · · · Cov(z1,zn)...
. . ....
Cov(zn,z1) · · · Var(zn)
(2.50)
in which the terms z(xi) are replaced by zi for convenience. These termsare found from the autocovariance function as Cov(z(xi)z(xj)) = Cz (δij), inwhich δij is the (vector) separation between locations xi and xj.
In principle, we would like to estimate the full distribution of z(x0) atan unobserved location x0, but in general this is computationally intensiveif a large grid of points is to be interpolated. Instead, the most commonapproach is to construct a simple linear unbiased estimator based on theobservations,
z(x0) =n∑
i=1
wiz(xi) (2.51)
in which the weights w={w1,…, wn} are scalar values chosen to make theestimate in some way optimal. Usually, the criteria of optimality are unbi-asedness and minimum variance, and the result is sometimes called the bestlinear unbiased estimator (BLUE).
The BLUE estimator weights are found by expressing the variance of theestimate z(x0) using a first-order second-moment formulation, and minimiz-ing the variance over w using a Lagrange multiplier approach subject to the
[17:33 1/2/2008 5108-Phoon-Ch02.tex] Job No: 5108 PHOON: RB Design in Geo. Eng. Page: 117 76–133
Spatial variability and geotechnical reliability 117
condition that the sum of the weights equals one. The solution in matrixform is,
w = G−1h (2.52)
in which w is the vector of optimal weights, and the matrices G and h relatethe covariance matrix of the observations and the vector of covariances of theobservations to the value of the spatial variable at the interpolated location,x0, respectively:
G =
Var(z1) · · · Cov(z1,zn) 1...
. . .... 1
Cov(zn,z1) · · · Var(zn) 11 1 1 0
h =
Cov(z1,z0)...
Cov(zn,z0)1
(2.53)
The resulting estimator variance is
Var(z0) = E[(z0 − z0)2]
= Var(z0) −n∑
i=1
wiCov(z0,zi) −λ (2.54)
in which λ is the Lagrange multiplier resulting from the optimization. Thisis a surprisingly simple and convenient result, and forms the basis of theincreasingly vast literature on the subject of so-called kriging in the field ofgeostatistics. For regular grids of observations, such as a grid of borings, analgorithm can be established for the points within an individual grid cell,and then replicated for all cells to form an interpolated map of the largersite or region (Journel and Huijbregts, 1978). In the mining industry, andincreasingly in other applications, it has become common to replace the auto-covariance function as a measure of spatial association with the variogram.
2.4.4 Functions of random fields
Thus far, we have considered the properties of random fields themselves.In this section, we consider the extension to properties of functions of ran-dom fields. Spatial averaging of random fields is among the most importantconsiderations for geotechnical engineering. Limiting equilibrium stabil-ity of slopes depends on the average strength across the failure surface.
[17:33 1/2/2008 5108-Phoon-Ch02.tex] Job No: 5108 PHOON: RB Design in Geo. Eng. Page: 118 76–133
118 G. B. Baecher and J. T. Christian
Settlements beneath foundations depend on the average compressibility ofthe subsurface soils. Indeed, many modes of geotechnical performance ofinterest to the engineer involve spatial averages – or differences amongspatial averages – of soil and rock properties. Spatial averages also playa significant role in mining geostatistics, where average ore grades withinblocks of rock have important implications for planning. As a result, thereis a rich literature on the subject of averages of random fields, only a smallpart of which can be reviewed here.
Consider the one-dimensional case of a continuous, scalar stochastic pro-cess (1D random field), z(x), in which x is location, and z(x) is a stochasticvariable with mean µz, assumed to be constant, and autocovariance functionCz(r), in which r is separation distance, r = (x1 −x2). The spatial average ormean of the process within the interval [0,X] is
MX{z(x)} = 1X
∫ X
0z(x)dx (2.55)
The integral is defined in the common way, as a limiting sum of z(x) valueswithin infinitesimal intervals of x, as the number of intervals increases.We assume that z(x) converges in a mean square sense, implying the existenceof the first two moments of z(x). The weaker assumption of convergence inprobability, which does not imply existence of the moments, could be made,if necessary (see, Parzen (1964, 1992) for more detailed discussion).
If we think of MX{z(x)} as a sample observation within one interval of theprocess z(x), then, over the set of possible intervals that we might observe,MX{z(x)} becomes a random variable with mean, variance, and possiblyother moments. Consider first the integral of z(x) within intervals of length X.Parzen (1964) shows that the first two moments of
∫ X0 z(x)dx are
E
[∫ X
0z(x)dx
]=∫ X
0µ(x)dx = µX (2.56)
Var
[∫ X
0z(x)dx
]=∫ X
0
∫ X
0Cz(xi − xj)dxidxj = 2
∫ X
0(X − r)Cz(r)dr
(2.57)
and that the autocovariance function of the integral∫ X
0 z(x)dx as the interval[0, X] is allowed to translate along dimension x is (Vanmarcke, 1983):
C∫ X0 z(x)dx(r) = Cov
[∫ X
0z(x)dx,
∫ r+X
rz(x)dx
]
=∫ X
0
∫ X
0Cz(r + xi − xj)dxidxj (2.58)
[17:33 1/2/2008 5108-Phoon-Ch02.tex] Job No: 5108 PHOON: RB Design in Geo. Eng. Page: 119 76–133
Spatial variability and geotechnical reliability 119
The corresponding moments of the spatial mean MX{z(x)}are
E[MX{z(x)}]= E
[1X
∫ X
0z(x)dx
]=∫ X
0
1X
µ(x)dx = µ (2.59)
Var[MX{z(x)}]= Var
[1X
∫ X
0z(x)dx
]= 2
X2
∫ X
0(X − r)Cz(r)dr (2.60)
CMX{z(x)}(r) = Cov
[1X
∫ X
0z(x)dx,
1X
∫ r+X
rz(x)dx
]
= 1X2
∫ X
0
∫ X
0Cz(r + xi − xj)dxidxj (2.61)
The effect of spatial averaging is to smooth the process. The varianceof the averaged process is smaller than that of the original process z(x),and the autocorrelation of the averaged process is wider. Indeed, averaging issometimes referred to as smoothing (Gelb and Analytic Sciences CorporationTechnical Staff, 1974).
The reduction in variance from z(x) to the averaged process MX{z(x)} canbe represented in a variance reduction function, γ (X),
γ (X) = Var[MX{z(x)}]
var[z(x)] (2.62)
The variance reduction fuction is 1.0 for X = 0, and decays to zero as Xbecomes large. γ (X) can be calculated from the autocovariance function ofz(x) as
γ (X) = 2x
x∫0
(1 − r
X
)R2(r)dr (2.63)
in which Rz(r) is the autocorrelation function of z(x). Note that the squareroot of γ (X) gives the corresponding reduction of the standard deviationof z(x). Table 2.4 gives one-dimensional variance reduction functions forcommon autocovariance functions. It is interesting to note that each of thesefunctions is asymptotically proportional to 1/X. Based on this observation,Vanmarcke (1983) proposed a scale of fluctuation, θ , such that
θ = limX→∞
X γ (X) (2.64)
or γ (X) = θ /X, as X → ∞; that is, θ /X is the asymptote of the variancereduction function as the averaging window expands. The function γ (X)
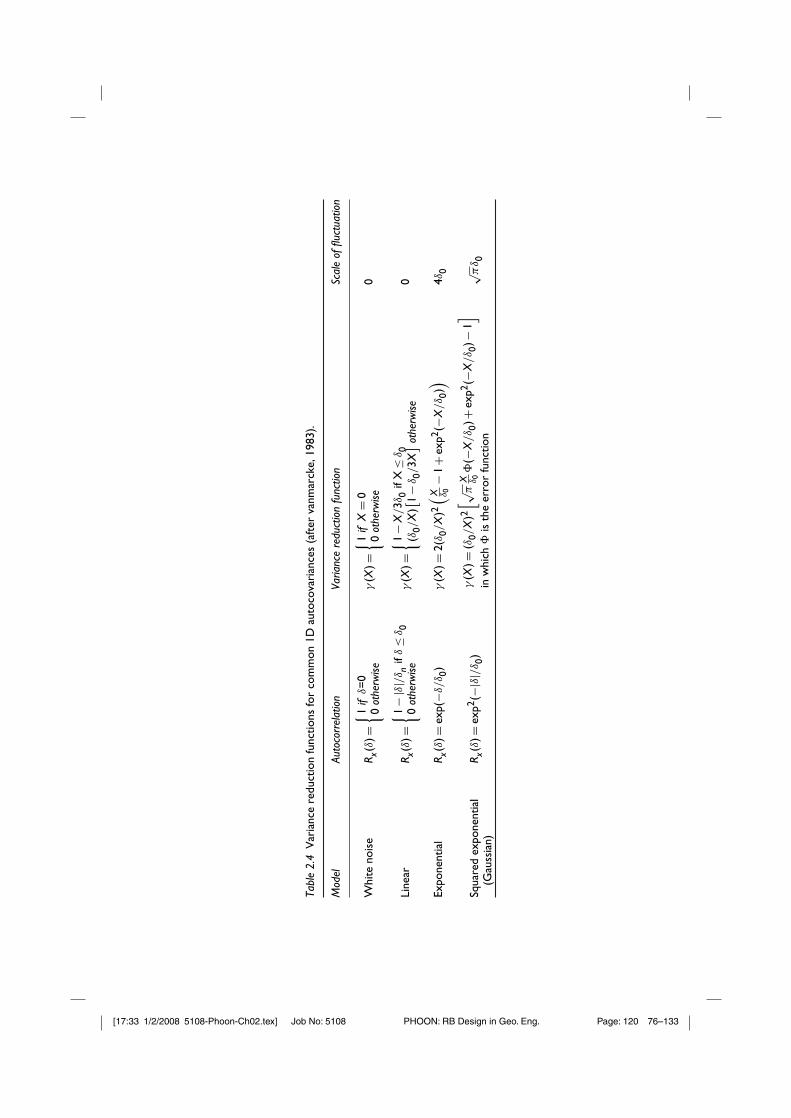
[17:33 1/2/2008 5108-Phoon-Ch02.tex] Job No: 5108 PHOON: RB Design in Geo. Eng. Page: 120 76–133
Tabl
e2.
4V
aria
nce
redu
ctio
nfu
nctio
nsfo
rco
mm
on1D
auto
cova
rian
ces
(aft
erva
nmar
cke,
1983
).
Mod
elAu
toco
rrel
atio
nVa
rianc
ere
duct
ion
func
tion
Scal
eof
fluct
uatio
n
Whi
teno
ise
R x(δ
)={ 1
ifδ=
00
othe
rwise
γ(X
)={ 1
ifX
=0
0ot
herw
ise0
Line
arR x
(δ)=
{ 1−
|δ|/δ n
ifδ
≤δ 0
0ot
herw
iseγ
(X)=
{ 1−
X/3δ
0if
X≤
δ 0(δ
0/X
)[ 1−
δ 0/3X] ot
herw
ise0
Expo
nent
ial
R x(δ
)=ex
p(−δ
/δ 0
)γ
(X)=
2(δ 0
/X
)2( X δ 0
−1+
exp2
(−X
/δ 0
))4δ
0
Squa
red
expo
nent
ial
(Gau
ssia
n)R x
(δ)=
exp2
(−|δ|
/δ 0
)γ
(X)=
(δ0/
X)2[ √ π
X δ 0�
(−X
/δ 0
)+ex
p2(−
X/δ 0
)−1]
inw
hich
�is
the
erro
rfu
nctio
n
√ πδ 0
[17:33 1/2/2008 5108-Phoon-Ch02.tex] Job No: 5108 PHOON: RB Design in Geo. Eng. Page: 121 76–133
Spatial variability and geotechnical reliability 121
converges rapidly to this asymptote as X increases. For θ to exist, it isnecessary that Rz(r) →0 as r → ∞, that is, that the autocorrelation func-tion decreases faster than 1/r. In this case, θ can be found from the integralof the autocorrelation function (the moment of Rz(r) about the origin):
θ = 2∫ ∞
0Rz(r)dr =
∫ ∞
−∞Rz(r)dr (2.65)
This concept of summarizing the spatial or temporal scale of autocorrelationin a single number, typically the first moment of Rz(r), is used by a variety ofother workers, and in many fields. Taylor (1921) in hydrodynamics calledit the diffusion constant (Papoulis and Pillai, 2002); Christakos (1992) ingeoscience calls θ /2 the correlation radius; Gelhar (1993) in groundwaterhydrology calls θ the integral scale.
In two dimensions, the equivalent expressions for the mean and varianceof the planar integral,
∫ X0
∫ X0 z(x)dx, are
E
[∫ X
0z(x)dx
]=∫ X
0µ(x)dx = µX (2.66)
Var
[∫ X
0z(x)dx
]=∫ X
0
∫ X
0Cz(xi − xj)dxidxj = 2
∫ X
0(X − r)Cz(r)dr
(2.67)
Papoulis and pillai (2002) discusses averaging in higher dimensions, as doElishakoff (1999) and Vanmarcke (1983).
2.4.5 Stochastic differentiation
The continuity and differentiability of a random field depend on the con-vergence of sequences of random variables {z(xa),z(xb)}, in which xa, xb aretwo locations, with (vector) separation r = |xa −xb|. The random field is saidto be continuous in mean square at xa, if for every sequence {z(xa),z(xb)},E2[z(xa)−z(xb)] →0, as r→0. The random field is said to be continuousin mean square throughout, if it is continuous in mean square at every xa.Given this condition, the random field z(x) is mean square differentiable,with partial derivative,
∂z(x)∂xi
= lim|r|→0
z(x + rδi) − z(x)r
(2.68)
in which the delta function is a vector of all zeros, except the ith term,which is unity. While stronger, or at least different, convergence propertiescould be invoked, mean square convergence is often the most natural form in
[17:33 1/2/2008 5108-Phoon-Ch02.tex] Job No: 5108 PHOON: RB Design in Geo. Eng. Page: 122 76–133
122 G. B. Baecher and J. T. Christian
practice, because we usually wish to use a second-moment representation ofthe autocovariance function as the vehicle for determining differentiability.
A random field is mean square continuous if and only if its autocovariancefunction, Cz(r), is continuous at |r| = 0. For this to be true, the first derivativesof the autocovariance function at |r|=0 must vanish:
∂Cz(r)∂xi
= 0, for all i (2.69)
If the second derivative of the autocovariance function exists and is finite at|r| = 0, then the field is mean square differentiable, and the autocovariancefunction of the derivative field is
C∂z/∂xi(r) = ∂2Cz(r)/∂x2
i (2.70)
The variance of the derivative field can then be found by evaluating the auto-covariance C∂z/∂xi
(r) at |r| = 0. Similarly, the autocovariance of the secondderivative field, is
C∂2z/∂xi∂xj(r) = ∂4Cz(r)/∂x2
i ∂x2j (2.71)
The cross covariance function of the derivatives with respect to xi and xj inseparate directions is
C∂z/∂xi,∂z/∂xj(r) = −∂2Cz(r)/∂xi∂xj (2.72)
Importantly, for the case of homogeneous random fields, the field itself, z(x),and its derivative field are uncorrelated (Vanmarcke, 1983).
So, the behavior of the autocovariance function in the neighborhood ofthe origin is the determining factor for mean-square local properties of thefield, such as continuity and differentiability (Cramér and Leadbetter, 1967).Unfortunately, the properties of the derivative fields are sensitive to thisbehavior of Cz(r) near the origin, which in turn is sensitive to the choice ofautocovariance model. Empirical verification of the behavior of Cz(r) nearthe origin is exceptionally difficult. Soong and Grigoriu (1993) discuss themean square calculus of stochastic processes.
2.4.6 Linear functions of random fields
Assume that the random field, z(x), is transformed by a deterministicfunction g(.), such that
y(x) = g[z(x)] (2.73)
In this equation, g[z(x0)] is a function of z alone, that is, not of x0, and not ofthe value of z(x) at any x other than x0. Also, we assume that the transforma-tion does not depend on the value of x; that is, the transformation is space- or
[17:33 1/2/2008 5108-Phoon-Ch02.tex] Job No: 5108 PHOON: RB Design in Geo. Eng. Page: 123 76–133
Spatial variability and geotechnical reliability 123
time-invariant, y(z + δ) = g[z(x + δ)]. Thus, the random variable y(x) is adeterministic transformation of the random variable z(x), and its probabilitydistribution can be obtained from derived distribution methods. Similarly,the joint distribution of the sequence of random variables {y(x1), …, y(xn)}can be determined from the joint distribution of the sequence of randomvariables {x(x1) …, x(xn)}. The mean of y(x) is then
E[y(x)] =∞∫
−∞g(z)fz(z(x))dz (2.74)
and the autocorrelation function is
Ry(y1,y2) = E[y(x1)y(x2)] =∞∫
−∞
∞∫−∞
g(z1)g(z2)fz(z(x1)z(x2))dz1dz2
(2.75)
Papoulis and Pillai(2002) shows that the process y(x) is (strictly) stationary ifz(x) is (strictly) stationary. Phoon (2006b) discusses limitations and practicalmethods of solving this equation. Among the limitations is that such non-Gaussian fields may not have positive definite covariance matrices.
The solution for nonlinear transformations are difficult, but for linearfunctions general results are available. The mean of y(x) for linear g(z) isfound by transforming the expected value of z(x) through the function
E[y(x)] = g(E[z(x)]) (2.76)
The autocorrelation of y(x) is found in a two-step process:
Ryy(x1,x2) = Lx1[Lx2
[Rzz(x1,x2)]] (2.77)
in which Lx1is the transformation applied with respect to the first variable
z(x1) with the second variable treated as a parameter, and Lx2is the trans-
formation applied with respect to the second variable z(x2) with the firstvariable treated as a parameter.
2.4.7 Excursions (level crossings)
A number of applications arise in geotechnical practice for which one isinterested not in the integrals (averages) or differentials of a stochastic pro-cess, but in the probability that the process exceeds some threshold, eitherpositive or negative. For example, we might be interested in the probabilitythat a stochastically varying water inflow into a reservoir exceed some rate
[17:33 1/2/2008 5108-Phoon-Ch02.tex] Job No: 5108 PHOON: RB Design in Geo. Eng. Page: 124 76–133
124 G. B. Baecher and J. T. Christian
or in the properties of the weakest interval or seam in a spatially varyingsoil mass. Such problems are said to involve excursions or level crossings ofa stochastic process. The following discussion follows the work of Cramér(1967), Parzen (1964), and Papoulis and Pillai (2002).
To begin, consider the zero-crossings of a random process: the points xi atwhich z(xi) = 0. For the general case, this turns out to be a surprisingly diffi-cult problem. Yet, for the continuous Normal case, a number of statementsor approximations are possible. Consider a process z(x) with zero mean andvariance σ 2. For the interval [x,x+ δ], if the product
z(x)z(x + δ) < 0, (2.78)
then there must be an odd number of zero-crossings within the interval, forif this product is negative, one of the values must lie above zero and the otherbeneath. Papoulis and Pillai(2002) demonstrates that, if the two (zero-mean)variables z(x) and z(x + δ) are jointly normal with correlation coefficient
r = E [z(x)z(x + δ)]σxσx+δ
, (2.79)
then
p(z(x)z(x + δ) < 0) = 12
− arcsin(r)π
= arccos(r)π
p(z(x)z(x + δ) > 0) = 12
+ arcsin(r)π
= π − arccos(r)π
(2.80)
The correlation coefficient, of course, can be taken from the autocorrelationfunction, Rz(δ). Thus,
cos[πp(z(x)z(x + δ) < 0)] = Rz(δ)
Rz(0)(2.81)
and the probability that the number of zero-crossings is positive is just thecomplement of this result.
The probability of exactly one zero-crossing, p1(δ), is approximately,p1(δ) ≈ p0(δ), and expanding the cosine in a Fourier series and truncating totwo terms,
1 − π2p21(δ)
2= Rz(δ)
Rz(0)(2.82)
or,
p1(δ) ≈ 1π
√2[Rz(0) − Rz(δ)]
Rz(0)(2.83)
[17:33 1/2/2008 5108-Phoon-Ch02.tex] Job No: 5108 PHOON: RB Design in Geo. Eng. Page: 125 76–133
Spatial variability and geotechnical reliability 125
In the case of a regular autocorrelation function, for which the derivativedRz(0)/dδ exists and is zero at the origin, the probability of a zero-crossingis approximately,
p1(δ) ≈ δ
π
√−d2Rz(0)/dδ2
Rz(0)(2.84)
The non-regular case, for which the derivative at the origin is not zero (e.g.dRz(δ) = exp(δ/δ0)), is discussed by Parzen (1964). Elishakoff (1999) andVanmarcke (1983) treat higher dimensional results. The related probabilityof the process crossing an arbitrary level, z∗, can be approximated by notingthat, for small δ and thus r →1,
P[{z(x) − z∗}{z(x + δ) − z∗} < 0
]≈ P [{z(x)}{z(x + δ)} < 0]e−arcsin2(r)
2σ2
(2.85)
For small δ, the correlation coefficient Rz(δ) is approximately 1, and thevariances of z(x) and z(x + δ) are approximately Rz(0), thus
p1,z∗ (δ) ≈ p1,z∗ (δ) < 0]e −arcsin2(r)2Rz (0) (2.86)
and for the regular case,
p1(δ) ≈ δ
π
√−d2Rz(0)dδ2
Rz(0)e
−arcsin2(r)2Rz (0) (2.87)
Many other results can be found for continuous Normal processes, e.g. theaverage density of the number of crossings within an interval, the probabilityof no crossings (i.e. drought) within an interval, and so on. A rich literature isavailable of these and related results (Yaglom, 1962; Parzen, 1964; Cramérand Leadbetter, 1967; Gelb and Analytic Sciences Corporation TechnicalStaff, 1974; Adler, 1981; Cliff and Ord, 1981; Cressie, 1991; Christakos,1992, 2000; Christakos and Hristopulos, 1998).
2.4.8 Example: New Orleans hurricane protection system,Louisiana (USA)
In the aftermath of Hurricane Katrina, reliability analyses were con-ducted on the reconstructed New Orleans hurricane protection system(HPS) to understand the risks faced in future storms. A first-excursionor level crossing methodology was used to calculate the probability offailure in long embankment sections, following the approach proposed
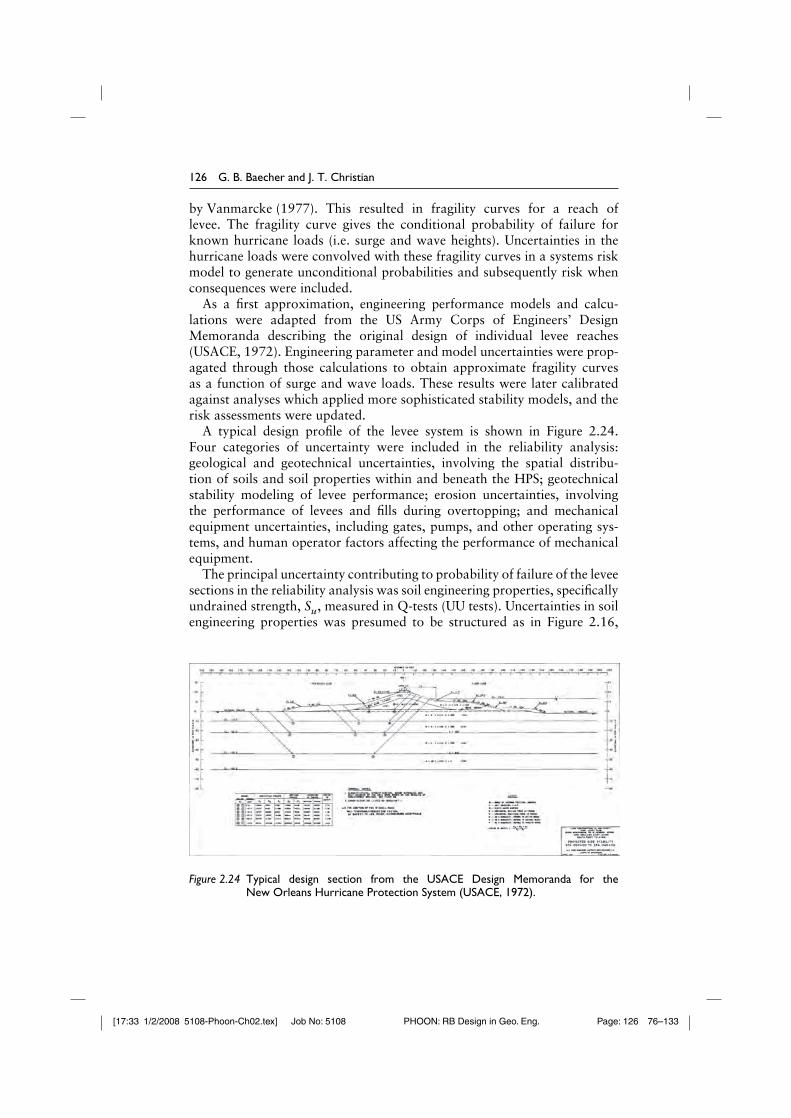
[17:33 1/2/2008 5108-Phoon-Ch02.tex] Job No: 5108 PHOON: RB Design in Geo. Eng. Page: 126 76–133
126 G. B. Baecher and J. T. Christian
by Vanmarcke (1977). This resulted in fragility curves for a reach oflevee. The fragility curve gives the conditional probability of failure forknown hurricane loads (i.e. surge and wave heights). Uncertainties in thehurricane loads were convolved with these fragility curves in a systems riskmodel to generate unconditional probabilities and subsequently risk whenconsequences were included.
As a first approximation, engineering performance models and calcu-lations were adapted from the US Army Corps of Engineers’ DesignMemoranda describing the original design of individual levee reaches(USACE, 1972). Engineering parameter and model uncertainties were prop-agated through those calculations to obtain approximate fragility curvesas a function of surge and wave loads. These results were later calibratedagainst analyses which applied more sophisticated stability models, and therisk assessments were updated.
A typical design profile of the levee system is shown in Figure 2.24.Four categories of uncertainty were included in the reliability analysis:geological and geotechnical uncertainties, involving the spatial distribu-tion of soils and soil properties within and beneath the HPS; geotechnicalstability modeling of levee performance; erosion uncertainties, involvingthe performance of levees and fills during overtopping; and mechanicalequipment uncertainties, including gates, pumps, and other operating sys-tems, and human operator factors affecting the performance of mechanicalequipment.
The principal uncertainty contributing to probability of failure of the leveesections in the reliability analysis was soil engineering properties, specificallyundrained strength, Su, measured in Q-tests (UU tests). Uncertainties in soilengineering properties was presumed to be structured as in Figure 2.16,
Figure 2.24 Typical design section from the USACE Design Memoranda for theNew Orleans Hurricane Protection System (USACE, 1972).
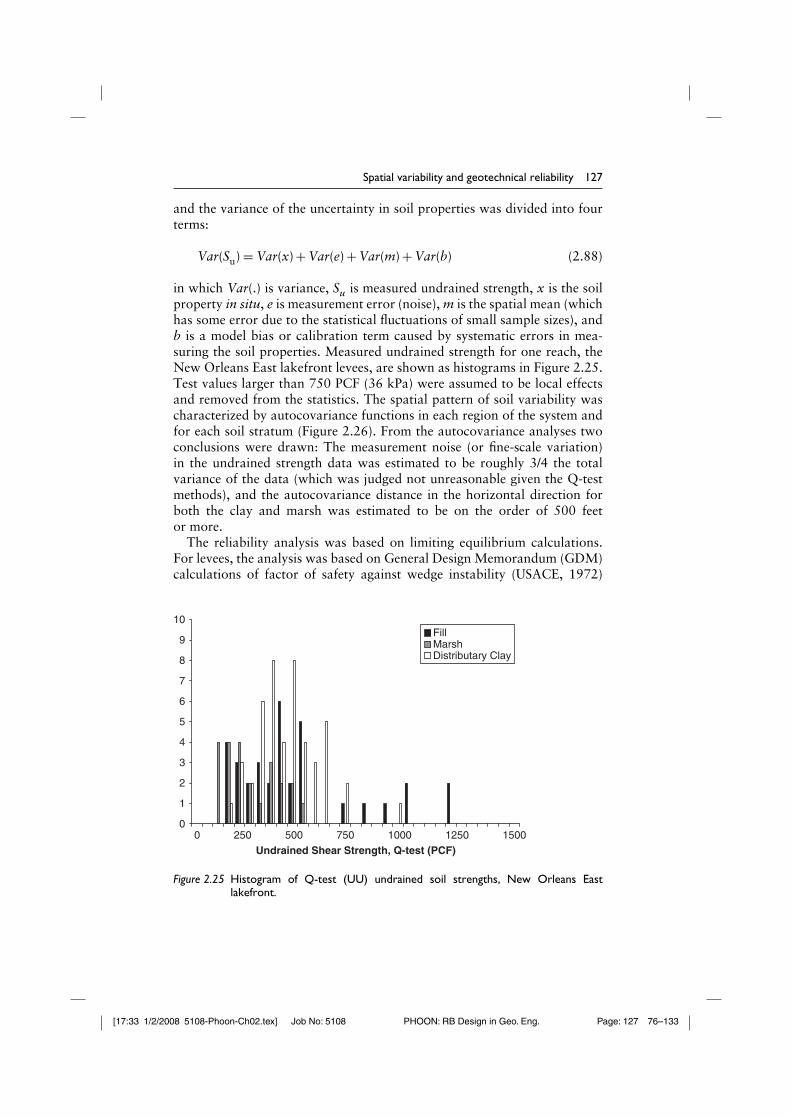
[17:33 1/2/2008 5108-Phoon-Ch02.tex] Job No: 5108 PHOON: RB Design in Geo. Eng. Page: 127 76–133
Spatial variability and geotechnical reliability 127
and the variance of the uncertainty in soil properties was divided into fourterms:
Var(Su) = Var(x) + Var(e) + Var(m) + Var(b) (2.88)
in which Var(.) is variance, Su is measured undrained strength, x is the soilproperty in situ, e is measurement error (noise), m is the spatial mean (whichhas some error due to the statistical fluctuations of small sample sizes), andb is a model bias or calibration term caused by systematic errors in mea-suring the soil properties. Measured undrained strength for one reach, theNew Orleans East lakefront levees, are shown as histograms in Figure 2.25.Test values larger than 750 PCF (36 kPa) were assumed to be local effectsand removed from the statistics. The spatial pattern of soil variability wascharacterized by autocovariance functions in each region of the system andfor each soil stratum (Figure 2.26). From the autocovariance analyses twoconclusions were drawn: The measurement noise (or fine-scale variation)in the undrained strength data was estimated to be roughly 3/4 the totalvariance of the data (which was judged not unreasonable given the Q-testmethods), and the autocovariance distance in the horizontal direction forboth the clay and marsh was estimated to be on the order of 500 feetor more.
The reliability analysis was based on limiting equilibrium calculations.For levees, the analysis was based on General Design Memorandum (GDM)calculations of factor of safety against wedge instability (USACE, 1972)
0
1
2
3
4
5
6
7
8
9
10
0 250 500 750 1000 1250 1500
Undrained Shear Strength, Q-test (PCF)
FillMarshDistributary Clay
Figure 2.25 Histogram of Q-test (UU) undrained soil strengths, New Orleans Eastlakefront.
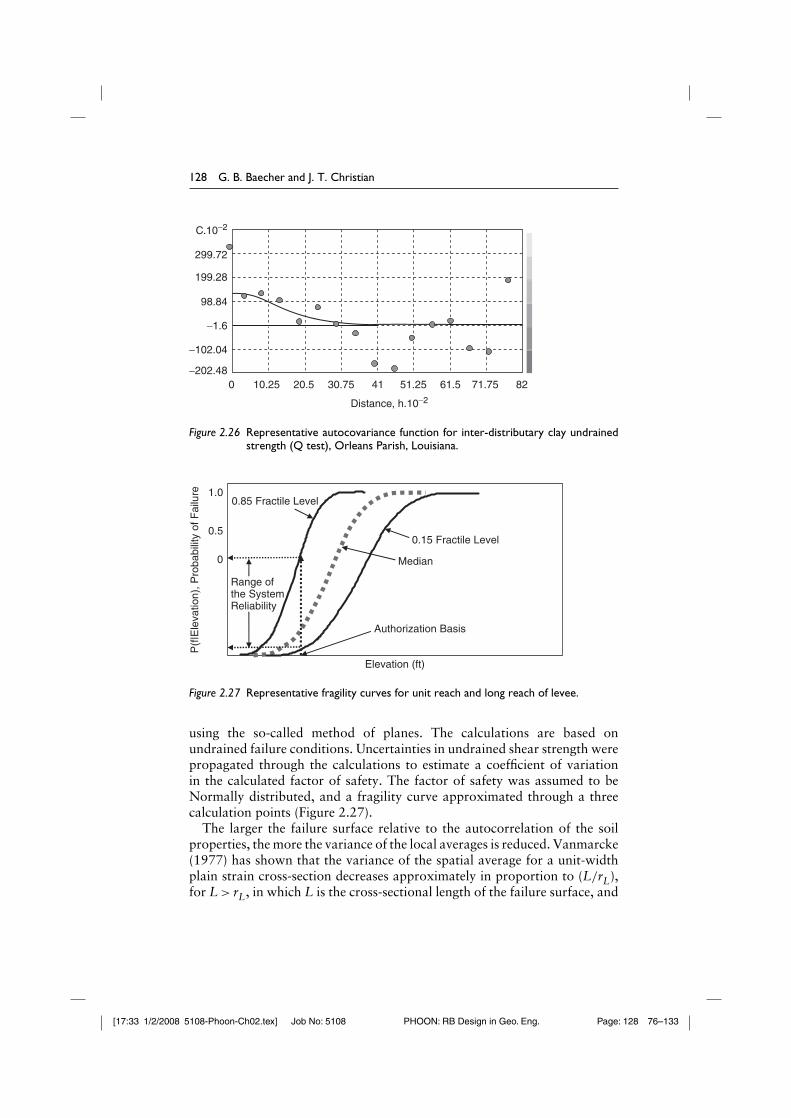
[17:33 1/2/2008 5108-Phoon-Ch02.tex] Job No: 5108 PHOON: RB Design in Geo. Eng. Page: 128 76–133
128 G. B. Baecher and J. T. Christian
C.10−2
299.72
199.28
98.84
−1.6
−102.04
−202.480 10.25 20.5 30.75 41
Distance, h.10−2
51.25 61.5 71.75 82
Figure 2.26 Representative autocovariance function for inter-distributary clay undrainedstrength (Q test), Orleans Parish, Louisiana.
P(f
|Ele
vatio
n), P
roba
bilit
y of
Fai
lure 1.0
0.5
0
Authorization Basis
0.15 Fractile Level
0.85 Fractile Level
Median
Elevation (ft)
Range ofthe SystemReliability
Figure 2.27 Representative fragility curves for unit reach and long reach of levee.
using the so-called method of planes. The calculations are based onundrained failure conditions. Uncertainties in undrained shear strength werepropagated through the calculations to estimate a coefficient of variationin the calculated factor of safety. The factor of safety was assumed to beNormally distributed, and a fragility curve approximated through a threecalculation points (Figure 2.27).
The larger the failure surface relative to the autocorrelation of the soilproperties, the more the variance of the local averages is reduced. Vanmarcke(1977) has shown that the variance of the spatial average for a unit-widthplain strain cross-section decreases approximately in proportion to (L/rL),for L > rL, in which L is the cross-sectional length of the failure surface, and
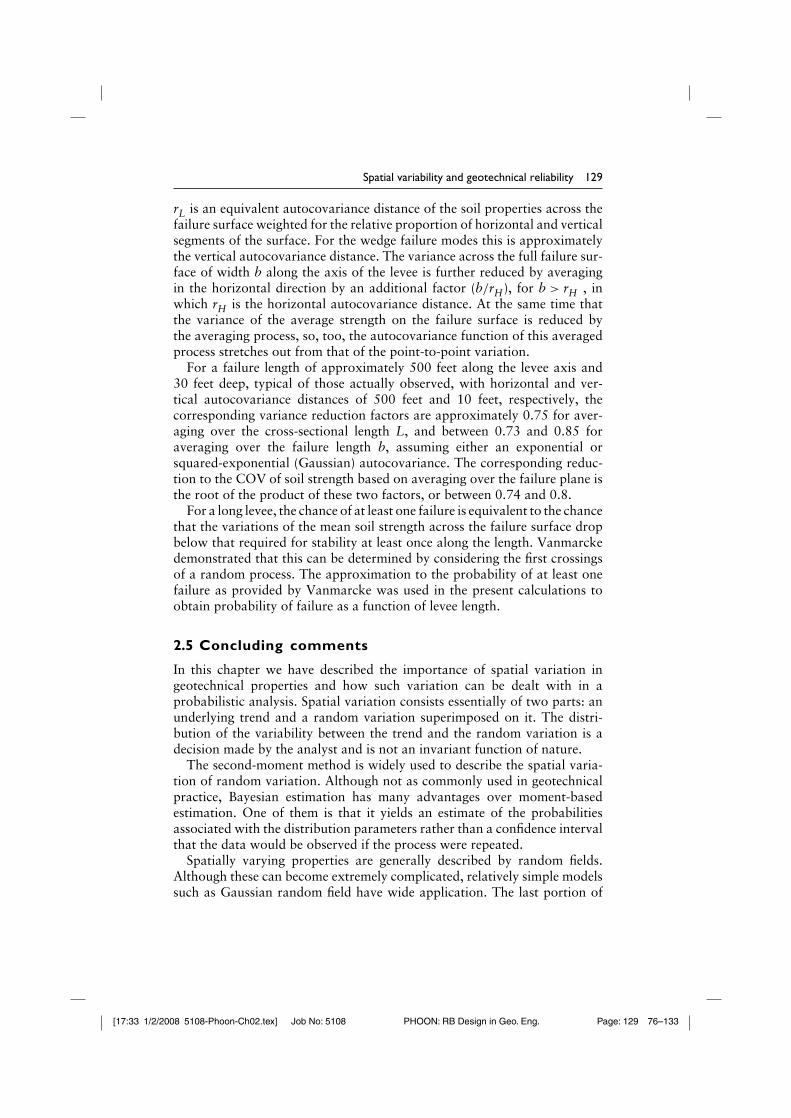
[17:33 1/2/2008 5108-Phoon-Ch02.tex] Job No: 5108 PHOON: RB Design in Geo. Eng. Page: 129 76–133
Spatial variability and geotechnical reliability 129
rL is an equivalent autocovariance distance of the soil properties across thefailure surface weighted for the relative proportion of horizontal and verticalsegments of the surface. For the wedge failure modes this is approximatelythe vertical autocovariance distance. The variance across the full failure sur-face of width b along the axis of the levee is further reduced by averagingin the horizontal direction by an additional factor (b/rH), for b > rH , inwhich rH is the horizontal autocovariance distance. At the same time thatthe variance of the average strength on the failure surface is reduced bythe averaging process, so, too, the autocovariance function of this averagedprocess stretches out from that of the point-to-point variation.
For a failure length of approximately 500 feet along the levee axis and30 feet deep, typical of those actually observed, with horizontal and ver-tical autocovariance distances of 500 feet and 10 feet, respectively, thecorresponding variance reduction factors are approximately 0.75 for aver-aging over the cross-sectional length L, and between 0.73 and 0.85 foraveraging over the failure length b, assuming either an exponential orsquared-exponential (Gaussian) autocovariance. The corresponding reduc-tion to the COV of soil strength based on averaging over the failure plane isthe root of the product of these two factors, or between 0.74 and 0.8.
For a long levee, the chance of at least one failure is equivalent to the chancethat the variations of the mean soil strength across the failure surface dropbelow that required for stability at least once along the length. Vanmarckedemonstrated that this can be determined by considering the first crossingsof a random process. The approximation to the probability of at least onefailure as provided by Vanmarcke was used in the present calculations toobtain probability of failure as a function of levee length.
2.5 Concluding comments
In this chapter we have described the importance of spatial variation ingeotechnical properties and how such variation can be dealt with in aprobabilistic analysis. Spatial variation consists essentially of two parts: anunderlying trend and a random variation superimposed on it. The distri-bution of the variability between the trend and the random variation is adecision made by the analyst and is not an invariant function of nature.
The second-moment method is widely used to describe the spatial varia-tion of random variation. Although not as commonly used in geotechnicalpractice, Bayesian estimation has many advantages over moment-basedestimation. One of them is that it yields an estimate of the probabilitiesassociated with the distribution parameters rather than a confidence intervalthat the data would be observed if the process were repeated.
Spatially varying properties are generally described by random fields.Although these can become extremely complicated, relatively simple modelssuch as Gaussian random field have wide application. The last portion of
[17:33 1/2/2008 5108-Phoon-Ch02.tex] Job No: 5108 PHOON: RB Design in Geo. Eng. Page: 130 76–133
130 G. B. Baecher and J. T. Christian
the chapter demonstrates how they can be manipulated by differentiation,by transformation through linear processes, and by evaluation of excursionsbeyond specified levels.
Notes
1 It is true that not all soil or rock mass behaviors of engineering importance aregoverned by averages, for example, block failures in rock slopes are governed by theleast favorably positioned and oriented joint. They are extreme values processes.Nevertheless, averaging soil or rock properties does reduce variance.
2 In early applications of geotechnical reliability, a great deal of work was focusedon appropriate distributional forms for soil property variability, but this no longerseems a major topic. First, the number of measurements typical of site characteri-zation programs is usually too few to decide confidently whether one distributionalform provides a better fit than another, and, second, much of practical geotechnicalreliability work uses second-moment characterizations rather than full distribu-tional analysis, so distributional assumptions only come into play at the endof the work. Second-moment characterizations use only means, variances, andcovariances to characterize variability, not full distributions .
3 In addition to aleatory and epistemic uncertainties, there are also uncertainties thathave little to do with engineering properties and performance, yet which affectdecisions. Among these is the set of objectives and attributes considered importantin reaching a decision, the value or utility function defined over these attributes,and discounting for outcomes distributed in time. These are outside the presentscope.
References
Adler, R. J. (1981). The Geometry of Random Fields. Wiley, Chichester.Ang, A. H.-S. and Tang, W. H. (1975). Probability Concepts in Engineering Planning
and Design. Wiley, New York.Azzouz, A., Baligh, M. M. and Ladd, C. C. (1983). Corrected field vane strength
for embankment design. Journal of Geotechnical Engineering, ASCE, 109(3),730–4.
Baecher, G. B.(1980). Progressively censored sampling of rock joint traces. Journalof the International Association of Mathematical Geologists, 12(1), 33–40.
Baecher, G. B. (1987). Statistical quality control for engineered fills. EngineeringGuide, U.S. Army Corps of Engineers, Waterways Experiment Station, GL-87-2.
Baecher, G. B., Ladd, C. C., Noiray, L. and Christian, J. T. (1997) Formal obser-vational approach to staged loading. Transportation Research Board AnnualMeeting, Washington, D.C.
Barnett, V. (1982). Comparative Statistical Inference. John Wiley and Sons, London.Berger, J. O. (1993). Statistical Decision Theory and Bayesian Analysis. Springer,
New York.Berger, J. O., De Oliveira, V. and Sanso, B. (2001). Objective Bayesian analysis of
spatially correlated data. Journal of the American Statistical Association, 96(456),1361–74.
Bjerrum, L. (1972). Embankments on soft ground. In ASCE Conference on Perfor-mance of Earth and Earth-Supported Structures, Purdue, pp. 1–54.
[17:33 1/2/2008 5108-Phoon-Ch02.tex] Job No: 5108 PHOON: RB Design in Geo. Eng. Page: 131 76–133
Spatial variability and geotechnical reliability 131
Bjerrum, L. (1973). Problems of soil mechanics and construction on soft clays. InEighth International Conference on Soil Mechanics and Foundation Engineering,Moskow. Spinger, New York, pp. 111–59.
Chiasson, P., Lafleur, J., Soulie, M. and Law, K. T. (1995). Characterizing spatialvariability of a clay by geostatistics. Canadian Geotechnical Journal, 32, 1–10.
Christakos, G. (1992). Random Field Models in Earth Sciences. Academic Press,San Diego.
Christakos, G. (2000). Modern Spatiotemporal Geostatistics. Oxford UniversityPress, Oxford.
Christakos, G. and Hristopulos, D. T. (1998). Spatiotemporal Environmental HealthModelling : A Tractatus Stochasticus. Kluwer Academic, Boston, MA.
Christian, J. T., Ladd, C. C. and Baecher, G. B. (1994). Reliability applied toslope stability analysis. Journal of Geotechnical Engineering, ASCE, 120(12),2180–207.
Cliff, A. D. and Ord, J. K. (1981). Spatial Processes: Models & Applications. Pion,London.
Cramér, H. and Leadbetter, M. R. (1967). Stationary and Related StochasticProcesses; Sample Function Properties and their Applications. Wiley, New York.
Cressie, N. A. C. (1991). Statistics for Spatial Data. Wiley, New York.Davis, J. C. (1986). Statistics and Data Analysis in Geology. Wiley, New York.DeGroot, D. J. and Baecher, G. B. (1993). Estimating autocovariance of in situ soil
properties. Journal Geotechnical Engineering Division, ASCE, 119(1), 147–66.Elishakoff, I. (1999). Probabilistic Theory of Structures. Dover Publications,
Mineola, NY.Fuleihan, N. F. and Ladd, C. C. (1976). Design and performance of Atchafalaya
flood control levees. Research Report R76-24, Department of Civil Engineering,Massachusetts Institute of Technology, Cambridge, MA.
Gelb, A. and Analytic Sciences Corporation Technical Staff. (1974). Applied OptimalEstimation. M.I.T. Press, Cambridge, MA.
Gelhar, L. W. (1993). Stochastic Subsurface Hydrology. Prentice-Hall, EnglewoodCliffs, N.J.
Hartford, D. N. D. (1995). How safe is your dam? Is it safe enough? MEP11-5, BCHydro, Burnaby, BC.
Hartford, D. N. D. and Baecher, G. B. (2004). Risk and Uncertainty in Dam Safety.Thomas Telford, London.
Hilldale, C. (1971). A probabilistic approach to estimating differential settle-ment. M.S. thesis, Civil Engineering, Massachusetts Institute of Technology,Cambridge, MA.
Javete, D. F. (1983). A simple statistical approach to differential settlements on clay.Ph. D. thesis, Civil Engineering, University of California, Berkeley.
Journel, A. G. and Huijbregts, C. (1978). Mining Geostatistics. Academic Press,London.
Jowett, G. H. (1952). The accuracy of systematic simple from conveyer belts. AppliedStatistics, 1, 50–9.
Kitanidis, P. K. (1985). Parameter uncertainty in estimation of spatial functions:Bayesian analysis. Water Resources Research, 22(4), 499–507.
Kitanidis, P. K. (1997). Introduction to Geostatistics: Applications to Hydrogeology.Cambridge University Press, Cambridge.
[17:33 1/2/2008 5108-Phoon-Ch02.tex] Job No: 5108 PHOON: RB Design in Geo. Eng. Page: 132 76–133
132 G. B. Baecher and J. T. Christian
Kolmogorov, A. N. (1941). The local structure of turbulence in an incompress-ible fluid at very large Reynolds number. Doklady Adademii Nauk SSSR, 30,301–5.
Lacasse, S. and Nadim, F. (1996). Uncertainties in characteristic soil properties. InUncertainty in the Geological Environment, ASCE specialty conference, Madison,WI. ASCE. Reston, VA, pp. 40–75.
Ladd, C.C. and Foott, R. (1974). A new design procedure for stability of soft clays.Journal of Geotechnical Engineering, 100(7), 763–86.
Ladd, C. C. (1975). Foundation design of embankments constructed on con-necticut valley varved clays. Report R75-7, Department of Civil Engineering,Massachusetts Institute of Technology, Cambridge, MA.
Ladd, C. C., Dascal, O., Law, K. T., Lefebrve, G., Lessard, G., Mesri, G. andTavenas, F. (1983). Report of the subcommittee on embankment stability__annexeII, Committe of specialists on Sensitive Clays on the NBR Complex. Societéd’Energie de la Baie James, Montreal.
Lambe, T.W. and Associates (1982). Earthquake risk to patio 4 and site 400. Reportto Tonen Oil Corporation, Longboat Key, FL.
Lambe, T. W. and Whitman, R. V. (1979). Soil Mechanics, SI Version. Wiley,New York.
Lee, I. K., White, W. and Ingles, O. G. (1983). Geotechnical Engineering. Pitman,Boston.
Lumb, P. (1966). The variability of natural soils. Canadian Geotechnical Journal,3, 74–97.
Lumb, P. (1974). Application of statistics in soil mechanics. In Soil Mechanics: NewHorizons, Ed. I. K. Lee. Newnes-Butterworth, London, pp. 44–112.
Mardia, K. V. and Marshall, R. J. (1984). Maximum likelihood estikmation ofmodels for residual covariance in spatial regression. Biometrika, 71(1), 135–46.
Matérn, B. (1960). Spatial Variation. 49(5), Meddelanden fran Statens Skogsforskn-ingsinstitut.
Matérn, B. (1986). Spatial Variation, Springer, Berlin.Matheron, G. (1971). The Theory of Regionalized Variables and Its Application –
Spatial Variabilities of Soil and Landforms, Les Cahiers du Centre de Morphologiemathematique 8, Fontainebleau.
Papoulis, A. and Pillai, S. U. (2002). Probability, Random Variables, and StochasticProcesses, 4th ed. McGraw-Hill, Boston, MA.
Parzen, E. (1964). Stochastic Processes, Holden-Day, San Francisco, CA.Parzen, E. (1992). Modern Probability Theory and its Applications. Wiley,
New York.Phoon, K. K. (2006a). Bootstrap estimation of sample autocorrelation functions.
In GeoCongress, Atlanta, ASCE.Phoon, K. K. (2006b). Modeling and simulation of stochastic data. In GeoCongress,
Atlanta, ASCE.Phoon, K. K. and Fenton, G. A. (2004). Estimating sample autocorrelation func-
tions using bootstrap. In Proceedings, Ninth ASCE Specialty Conference onProbabilistic Mechanics and Structural Reliability, Albuquerque.
Phoon, K. K. and Kulhawy, F. H. (1996). On quantifying inherent soil variability.Uncertainty in the Geologic Environment, ASCE specialty conference, Madison,WI. ASCE, Reston, VA, pp. 326–40.

[17:33 1/2/2008 5108-Phoon-Ch02.tex] Job No: 5108 PHOON: RB Design in Geo. Eng. Page: 133 76–133
Spatial variability and geotechnical reliability 133
Soong, T. T. and Grigoriu, M. (1993). Random Vibration of Mechanical andStructural Systems. Prentice Hall, Englewood Cliffs, NJ.
Soulie, M. and Favre, M. (1983). Analyse geostatistique d’un noyau de barrage telque construit. Canadian Geotechnical Journal, 20, 453–67.
Soulie, M., Montes, P. and Silvestri, V. (1990). Modeling spatial variability of soilparameters. Canadian Geotechnical Journal, 27, 617–30.
Switzer, P. (1995). Spatial interpolation errors for monitoring data. Journal of theAmerican Statistical Association, 90(431), 853–61.
Tang, W.H. (1979). Probabilistic evaluation of penetration resistance. Journal of theGeotechnical Engineering Division, ASCE, 105(10): 1173–91.
Taylor, G. I. (1921). Diffusion by continuous movements. Proceeding of the LondonMathematical. Society (2), 20, 196–211.
USACE. (1972). New Orleans East Lakefront Levee Paris Road to South Point LakePontchartrain. Barrier Plan DM 2 Supplement 5B, USACE New Orleans District,New Orleans.
Vanmarcke, E. (1983). Random Fields, Analysis and Synthesis. MIT Press,Cambridge, MA.
Vanmarcke, E. H. (1977). Reliability of earth slopes. Journal of the GeotechnicalEngineering Division, ASCE, 103(GT11), 1247–65.
Weinstock, H. (1963). The description of stationary random rate processes. E-1377,Massachusetts Institute of Technology, Cambridge, MA.
Wu, T. H. (1974). Uncertainty, safety, and decision in soil engineering. JournalGeotechnical Engineering Division, ASCE, 100(3), 329–48.
Yaglom, A. M. (1962). An Introduction to the Theory of Random Functions.Prentice-Hall, Englewood Cliffs, NJ.
Zellner, A. (1971). An Introduction to Bayesian Inference in Econometrics. Wiley,New York.