reliability centered prediction technique for diagnostic...
TRANSCRIPT

RELIABILITY CENTERED PREDICTION TECHNIQUE
FOR
DIAGNOSTIC MODELING AND IMPROVEMENT
by
Michael D. MurphyCaptain, USAF
Department of Engineering MechanicsUSAF Academy, CO 80840
Robert PaaschAssistant Professor
Mem. ASMEDepartment of Mechanical Engineering
Oregon State UniversityCorvallis, OR 97330

2
A diagnosability prediction metric is developed for system modeling of component
failure rates and unjustified removals. The metric emphasizes ambiguity of system
component indications as well as system structure. The metric is evaluated using historical
data from the bleed air control system (BACS) on the Boeing 737-300. Four design
changes are suggested based on improving system diagnosability by changing component
functions, modifying indications, and adding or changing sensors. The resulting designs
are compared via Boeing’s life cycle cost mechanism, DEPCOST model, based on cost
improvements. It is shown that system improvements based on this prediction technique
will increase the quality of a product since increased diagnosability decreases life cycle
costs.
1.0 Introduction
The term quality, with respect to products, is broadening from a characteristic built
into a system by the way it is manufactured to characteristics entirely inherent to the design
process -- reliability and maintainability. A product is designed to achieve a given function
and its quality is the degree to which it meets the functional specifications. Product failure
is departure from these specifications. Emphasis on the consumer serves as the catalyst to
bring about methodologies for increasing the degree a system meets its specifications
through statistics and engineering. With the steady increase in complexity of systems,
stringency of operating conditions, and positive identification of system effectiveness
requirements, more and more emphasis is being placed on preventative maintenance,
analysis, speedy repair, and replacement parts (Babb, 1973). These represent a major
portion of system operating costs especially when each minute out of service is going to
result in considerable financial loss for any high revenue-earning industry.
Diagnosability, the measure of the ease of isolating the cause of a loss of
functionality, can strongly influence product quality through reliability and maintainability.
Poor diagnosability can increase the cost of a product through increased maintenance down
time which, in turn, decreases quality because a product, in general, cannot provide its
3
intended function during this time (Clark, 1993). Improving diagnosability not only eases
the diagnosis process--minimizing the total time of diagnosis, but the total cost of
diagnosis is decreased in proportion to the above factors as well as in relation to the
decrease in unjustified removals (removal of a suspect component later found to be in
working order) of each Line Replaceable Unit (LRU)/Least Replaceable Assembly (LRA).
The historical unjustifiable removal rates of major components that are mechanical
in nature average up to fifty percent higher than their failure rates. These inequities demand
diagnosability metrics and methodologies to increase the quality of any mechanical system
of today. Previous studies (Clark, 1993 and Wong 1994) present general methodologies
which provide insight into the diagnosability of systems and suggest areas for design
improvement, but focus mainly in the abstract. Previous work fails to address the issue of
cost analysis of current and modified designs in a tangible way.
The objective of this research is to produce methodologies for the evaluation of
diagnosability, a subset of maintainability, in the design and redesign phase of a product.
A metric common to all mechanical systems enabling a prediction of the costs and, in turn,
the quality of the product is developed. This metric can be used to accurately predict not
only current, but modified system life cycle costs based on reliability and maintainability,
or specifically, diagnosability. An analysis is presented of a real system that has
experienced diagnosability problems and has iterated through redesign phases. The metric
evaluated is Mean Time Between Unscheduled Removals (MTBUR) -- a function of both
system structure and LRU failure rates.
The Bleed Air Control System (BACS) on the Boeing 737-300,400,500 aircraft
was chosen as the analysis testbed for several reasons. Previous work (Clark, 1993 and
Wong, 1994) utilized the 747-400 BACS, a subsequent iteration of the 737 BACS, so
analytical comparisons can be drawn. The 737 BACS has a complete Failure Modes and
Effects Analysis (FMEA) available which can be modeled through a Fault Tree Analysis
(FTA). The system has a diagnosability problem evident in a large number of unjustifiable

4
removals of LRUs. Also, the determining factor, cost, can be arrived at since a complete
life cycle costing mechanism is in place for the system. The objective is to decrease cost by
manipulating indication-LRU relationships without increasing complexity.
In the following section the BACS is described and modeled stating all analysis
assumptions. Next, the method and metrics for prediction and design are derived using
reliability mathematics for quantitative diagnosability analysis. The modeling equation
arrived at is tested on the original design and, based on redesign for diagnosability
potential, modifications are made to the system. The modifications range from dividing
primary LRU functions differently to merely changing sensor types. The modified systems
are then re-evaluated on the basis of diagnosability and ultimately cost. Finally,
conclusions are drawn from the diagnosability analysis, recommendations are made for
system changes, and direction for future research is laid out.
2.0 Description and Modeling of the Boeing 737-300 Bleed Air Control
System
This section introduces the bleed air control system (BACS) including major LRUs
and their indications. The scope of the analysis and all assumptions are explicitly stated for
the system. Modeling of the system is accomplished with the use of a failure modes and
effects analysis (FMEA) by Airesearch and maintenance manuals provided by the Boeing
Company. Failure combinations are incorporated in similar fashion to previous research
(Clark, 1993) for ease of comparison analysis and application of system metrics. Though
the 737-300 is singled out in this research, all analyses and recommendations can be
extended to the 400 and 500 models since they are exactly the same.
2.1 Description of the Bleed Air Control System (BACS)
The BACS consists of two identical sets (one per engine) of valves, controls,
ducts, and a heat exchanger mounted in the engine nacelle area as shown in figures 1 and 2.

5
Figure 1. 737-300 BACS component location - left view
Figure 2. 737-300 BACS component location - right view
Each set of equipment automatically selects the engine bleed air supply from either
the low-stage (5th stage) or high-stage (9th stage) bleed ports and regulates the pressure
and temperature supplied to the air-using systems such as cabin air conditioning, cargo
heating, and anti-ice.
Bleed air from the 5th and 9th stage compressors is routed through a heat
exchanger, called the precooler, where it is cooled with air from the engine’s fan. From the
precooler, the air continues to the pneumatic manifold as shown in figure 3.
to airplane5th Stage
9th Stage
pclr
HSreg
Breg
prsov
Thermo
pclr sensorcheck
famv FAN
out duct
6
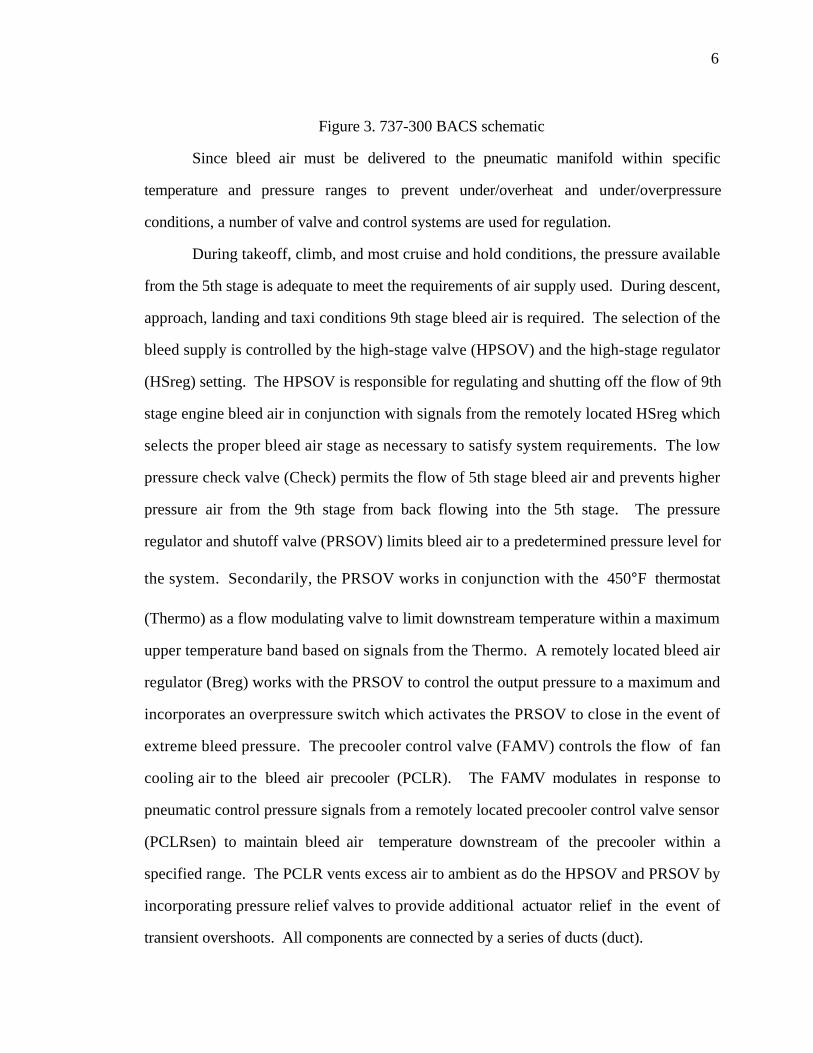
Figure 3. 737-300 BACS schematic
Since bleed air must be delivered to the pneumatic manifold within specific
temperature and pressure ranges to prevent under/overheat and under/overpressure
conditions, a number of valve and control systems are used for regulation.
During takeoff, climb, and most cruise and hold conditions, the pressure available
from the 5th stage is adequate to meet the requirements of air supply used. During descent,
approach, landing and taxi conditions 9th stage bleed air is required. The selection of the
bleed supply is controlled by the high-stage valve (HPSOV) and the high-stage regulator
(HSreg) setting. The HPSOV is responsible for regulating and shutting off the flow of 9th
stage engine bleed air in conjunction with signals from the remotely located HSreg which
selects the proper bleed air stage as necessary to satisfy system requirements. The low
pressure check valve (Check) permits the flow of 5th stage bleed air and prevents higher
pressure air from the 9th stage from back flowing into the 5th stage. The pressure
regulator and shutoff valve (PRSOV) limits bleed air to a predetermined pressure level for
the system. Secondarily, the PRSOV works in conjunction with the 450°F thermostat
(Thermo) as a flow modulating valve to limit downstream temperature within a maximum
upper temperature band based on signals from the Thermo. A remotely located bleed air
regulator (Breg) works with the PRSOV to control the output pressure to a maximum and
incorporates an overpressure switch which activates the PRSOV to close in the event of
extreme bleed pressure. The precooler control valve (FAMV) controls the flow of fan
cooling air to the bleed air precooler (PCLR). The FAMV modulates in response to
pneumatic control pressure signals from a remotely located precooler control valve sensor
(PCLRsen) to maintain bleed air temperature downstream of the precooler within a
specified range. The PCLR vents excess air to ambient as do the HPSOV and PRSOV by
incorporating pressure relief valves to provide additional actuator relief in the event of
transient overshoots. All components are connected by a series of ducts (duct).
7
The 737 BACS currently has five sensors, or indications, that are used to diagnose
system failures. These indications include 1) above normal readings on an analog pressure
gauge 2) below normal readings on an analog pressure gauge 3) bleed trip off light
illumination 4) low cabin pressure on an analog pressure gauge, and 5) low cabin
temperature on an analog temperature gauge. All subsequent analysis refer to these
indications in the predeeding numerical order, e.g., bleed pressure hi & bleed trip off
equals indication 13.
2.2 Scope and Assumptions of BACS Analysis
The valves, controls, ducts, and systems making up the BACS and described in the
previous section (parenthetically denoted) are considered LRUs which can be replaced on
the repair line as the lowest physical level of replacement. Each LRU provides a function
for the system that can be measured. The five indications listed provide the performance
measures of each LRU individually and collectively depending on the mode of operation of
the system. An example is the HPSOV providing pressure to the system measured by the
analog pressure gauge on the pilot’s overhead panel. The LRU, HPSOV in this case, is
directly associated with an indication, pressure in this case. The LRU to indication
relationship is causal in direction.
Each indication, though, does not necessarily imply a causal relationship to an LRU
unless only one LRU could have possibly caused the indication--a distinguishability of one
(Clark, 1993). The process of diagnosis is one of determining the set of parameters,or
LRUs, of a system that have parameter measures, or indications, that fall outside the
desired (or necessary) design values. This indication to LRU relationship is diagnostic in
direction, and the resulting set of suspect LRUs are called candidates.
The scope of BACS model is to define the LRU/indication relationships in such a
way as to incorporate all LRUs and indications in the system as well as all modes of failure
of each LRU. Successful completion of the model allows for systematic changes to be
8
incorporated and analyzed. Assumptions are made to simplify the analysis and to provide
consistency with a real system.
As opposed to previous research, this analysis incorporates all operating conditions
of the aircraft at once since the information from all engine output conditions is realistically
available to maintenance personnel. To move beyond the trivial, proper electrical power is
assumed to be available to the system, a failure that has no indication associated with it is
not considered, and an indicator failure is not considered since the flight crew can establish
its validity. Failure of circuit protection is not considered. Valve port leakage and external
leakage are not considered.
Only one LRU failure at a time is considered, i.e., mutually exclusive, though an
analysis technique for dependent LRU failures (passive) is developed. All ducting is
considered to be one LRU. The failure rates experienced based on the FMEA and Boeing’s
Dependability Cost (DEPCOST) model are in the same proportion as those predicted.
Failure modes obtained from the FMEA for the BACS are the only failure modes
considered. Maintenance is performed in accordance with established maintenance
procedures and by personnel possessing appropriate skills and training.
Inputs to the BACS model are obtained through design standards and engineering
judgment if not stated explicitly by the Airesearch FMEA or Boeing publications.
2.3 Modeling of the Bleed Air Control System (BACS)
Failure mode information is available from the FMEA conducted on the 737-300
BACS including probability assessments for each mode of failure. Mean time between
failures for each LRU is available from a completed DEPCOST model based on historical
data and maintenance reviews for the system as well. Since an LRU can fail in several
ways, a “sometimes” indication developed to exhibit relations between failures and
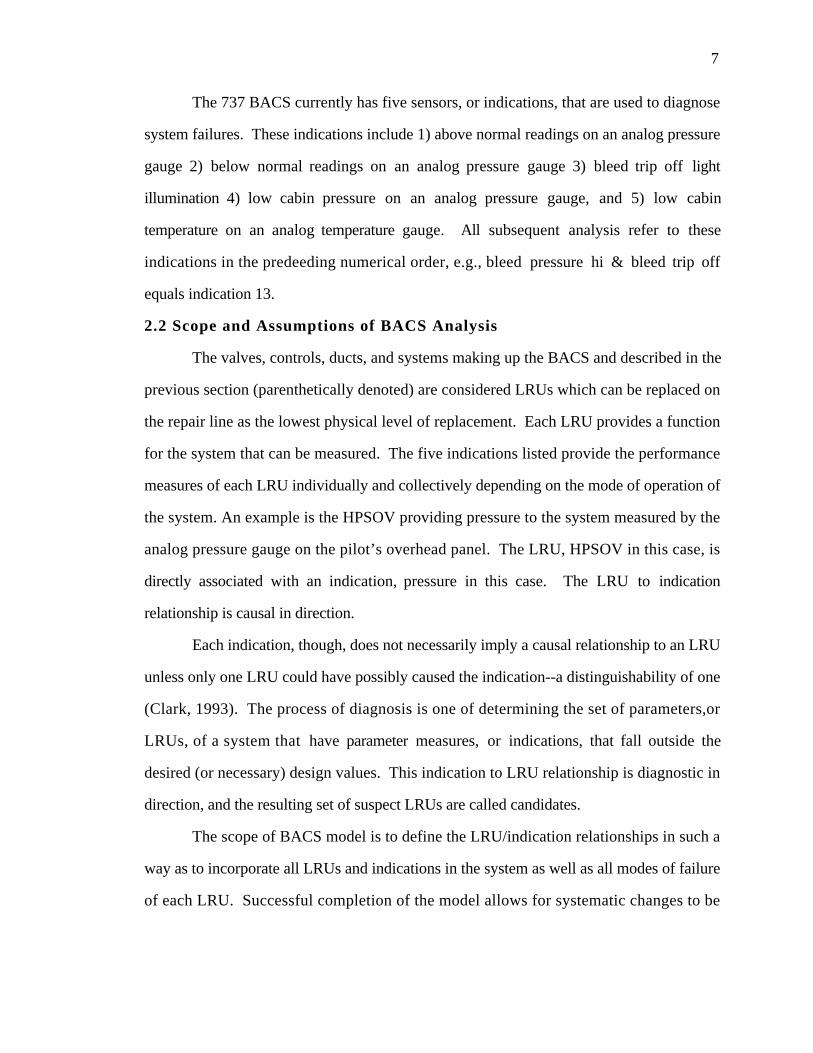
indications that only sometimes promote failure indications. The fault tree analysis model
of the BACS shown in figure 4 incorporates both always and sometimes relations depicted

9
as solid and dashed lines, respectively. Due to space constraints the LRU failures
(rectangles) are placed both above and below the indications (ovals).
Figure 4. Fault tree analysis model for the BACS
With this defined system model, metrics can be developed to compare different
systems that perform the same function by totally different designs or by reassigning LRU-
indication relationships. Defining a prediction method to determine mean time between
unscheduled removals (MTBUR) leads to a redesign methodology based on diagnosability.
Incorporating these prediction metrics into the life cycle costing mechanism DEPCOST
model, total diagnosability cost savings can be discovered.
3.0 Diagnosability Metrics
For diagnosability to be considered in the design/redesign process, there must be
some way to predict how system changes will affect system parameters for comparing
competing designs with respect to diagnosability. A methodology based on the prediction
technique must be arrived at for use in determining what parts of the system should be
changed to improve diagnosability.. A prediction metric based on unjustified removals and
time is introduced in this section.
bleed pressure hi bleed pressure lo bleed trip off cabin pressure lo cabin temp lo
checkopen
checkclosed
hpsovclosed
hpsovopen
famvopen
famvclosed
hsreglo
hsreghi
hsregreverse
pclrsenlo
pclrsenhi
ductleak
prsovclosed
prsovopen
pclr bleedleak
pclr fanleak
pclr findamage
pclr fanclog
pclr bleedclog
breg lo breg hi bregreverse
thermoovertemp
thermolo

10
Attributed by Boeing as the “single most important input” in the DEPCOST model,
Mean Time Between Unscheduled Removals (MTBUR) has been targeted by this research
as the overriding prediction parameter of diagnosability. For an aircraft system, MTBUR
is defined as the average number of unit flight hours occurring between unscheduled
removals of an LRU. Mathematically, it is the inverse of the LRU removal rate. Reliability
mathematics and labor time are the key contributors to the derivation of the predicted
MTBUR based on LRU failure rates and system structure.
Though the normal distribution is capable of describing most mechanical part lives,
the scheduled maintenance overhaul and replacement times are assumed to be within the
middle portion of the famous bathtub curve describing system life. Therefore, the
exponential distribution of is used in all subsequent analysis--assuming a constant, or near
constant, failure rate. The structure of a system is most readily evaluated in terms of times
to complete maintenance actions. The assumption of constant working conditions in the
context of human factors as well as proper experience and training are made. The analysis
also assumes a certain degree of maintenance technician knowledge prior to diagnosis
based on the principle of optimum checking order (minimizing time and the chance of
replacing the wrong LRU).
From a generic FMEA a fault tree analysis model can be assembled to include the
failure rate of not only the LRU, but also the mode in which it fails. Therefore, a particular
failure indication rate can be assessed by summing the failure rates of all LRUs with a
common indication:
failrateLRU ind failrateindii
n
j j=∑ =
1
(1)
given ind j is the common indication. Since maintenance technicians work in the
diagnostic direction, this indication failure rate is a necessary starting point.
An LRU will be removed in one of two conditions: failed or not failed. Removal in
the failed condition can be predicted directly from the reliability of the LRU and is
11
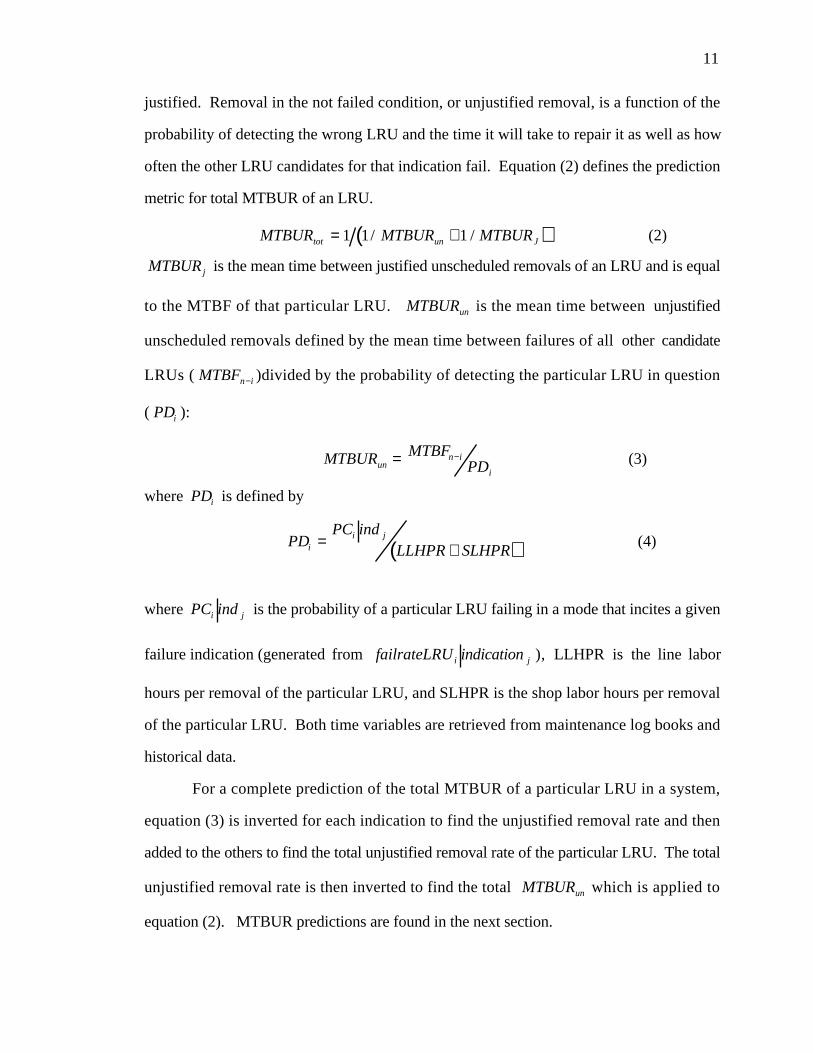
justified. Removal in the not failed condition, or unjustified removal, is a function of the
probability of detecting the wrong LRU and the time it will take to repair it as well as how
often the other LRU candidates for that indication fail. Equation (2) defines the prediction
metric for total MTBUR of an LRU.
( )MTBUR MTBUR MTBURtot un J= +1 1 1/ / (2)
MTBUR j is the mean time between justified unscheduled removals of an LRU and is equal
to the MTBF of that particular LRU. MTBURun is the mean time between unjustified
unscheduled removals defined by the mean time between failures of all other candidate
LRUs ( MTBFn i− )divided by the probability of detecting the particular LRU in question
( PDi ):
MTBUR MTBFPDun
n i
i= − (3)
where PDi is defined by
( )PDPC ind
LLHPR SLHPRii j= + (4)
where PC indi j is the probability of a particular LRU failing in a mode that incites a given
failure indication (generated from failrateLRU indicationi j ), LLHPR is the line labor
hours per removal of the particular LRU, and SLHPR is the shop labor hours per removal
of the particular LRU. Both time variables are retrieved from maintenance log books and
historical data.
For a complete prediction of the total MTBUR of a particular LRU in a system,
equation (3) is inverted for each indication to find the unjustified removal rate and then
added to the others to find the total unjustified removal rate of the particular LRU. The total
unjustified removal rate is then inverted to find the total MTBURun which is applied to
equation (2). MTBUR predictions are found in the next section.
12
4.0 Application and Evaluation of MTBUR Prediction Metric
The procedures introduced in the previous sections allow the designer to accurately
model an existing system to shed light on which LRUs are a source of diagnosability
problems. The designer can also incorporate system changes and see precisely how time
and cost are affected. For the BACS, the PRSOV is a known diagnostic challenge due to
its historical high rate of unjustifiable removals. Previous work (Clark, 1993) suggests a
comparison of metrics such as c (the average number of candidates for a given failure) to
identify components, like the PRSOV, with potential diagnosability problems and then an
application WD (weighted distinguishability) for modified systems to see if an
improvement is achieved. Application of the MTBUR prediction metric allows for an
immediate evaluation of not only which LRUs pose a threat to diagnosability, but which
improvements in diagnosability are feasible.
The current 737 BACS design is the testing ground for the MTBUR prediction
metric in section 4.1. Section 4.2 applies design changes to develop several redesigns of
the system and an evaluation based on MTBUR changes and cost savings is presented
along with recommendations.
4.1 Application of MTBUR prediction to the original 737 BACS
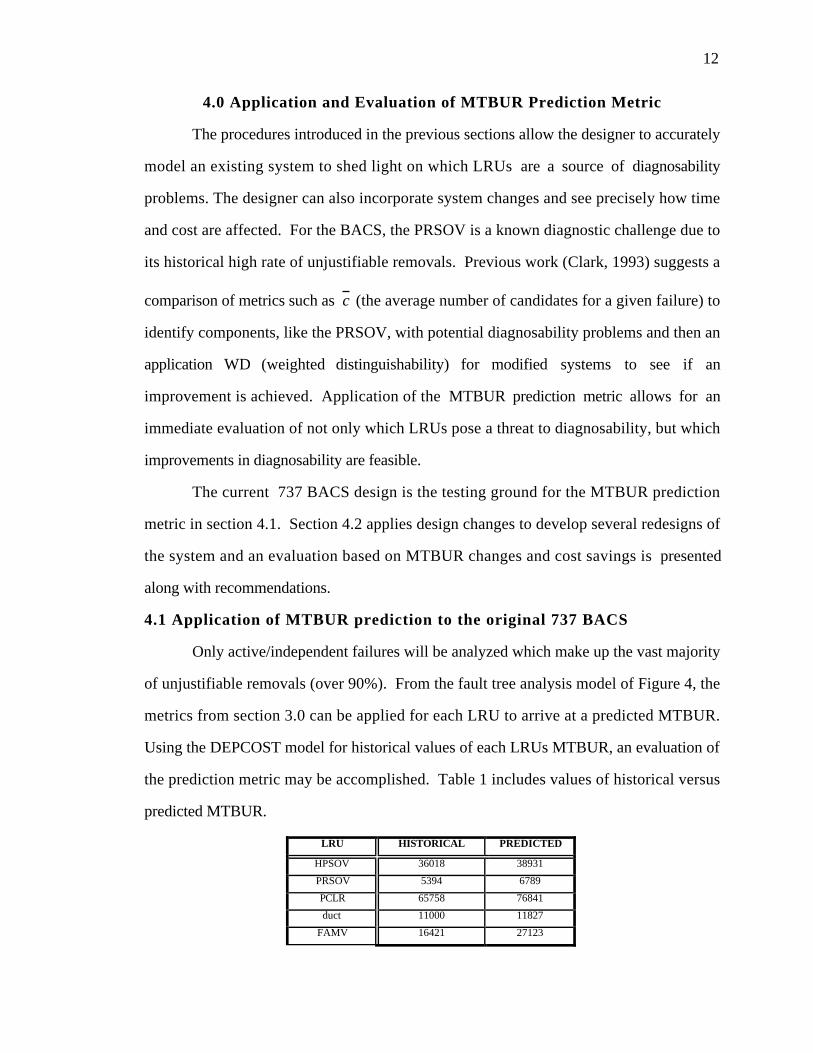
Only active/independent failures will be analyzed which make up the vast majority
of unjustifiable removals (over 90%). From the fault tree analysis model of Figure 4, the
metrics from section 3.0 can be applied for each LRU to arrive at a predicted MTBUR.
Using the DEPCOST model for historical values of each LRUs MTBUR, an evaluation of
the prediction metric may be accomplished. Table 1 includes values of historical versus
predicted MTBUR.
LRU HISTORICAL PREDICTED
HPSOV 36018 38931
PRSOV 5394 6789
PCLR 65758 76841
duct 11000 11827
FAMV 16421 27123

13
CHECK 309102 319140
HSreg 10985 15659
PCLRsen 15168 24106
Breg 11607 16700
Thermo 13799 89645
Table 1. Historical versus predicted MTBUR
Several LRUs (HPSOV, Breg, and duct) had no MTBUR listed. Based on
engineering judgment, these LRUs were assigned an MTBUR equal to twice their historical
mean time between failures (MTBF). Other omitted items include the Shop Labor Hours
per Repair (SLHPR and spares cost of the Breg and HPSOV which are estimated at values
of similar equipment (HSreg and PRSOV values, respectively, varying slightly due to
complexity differences). The predicted values fall within approximately twenty percent of
the true values with the exception of the 450°F thermostat. This anomaly could be
explained by organizational factors outside the scope of this research, e.g., direction from
higher levels because of low spares cost, ease of maintenance, least SLHPR, or merely
politics, since the LRU should last much longer based on its failure rate.
Not only are predicted MTBURs and costs within an acceptable range of historical
values, but order is preserved with respect to both candidates for diagnosability problems
and cost drivers. With this information, the choice of LRUs and functions for redesign can
be easily made.
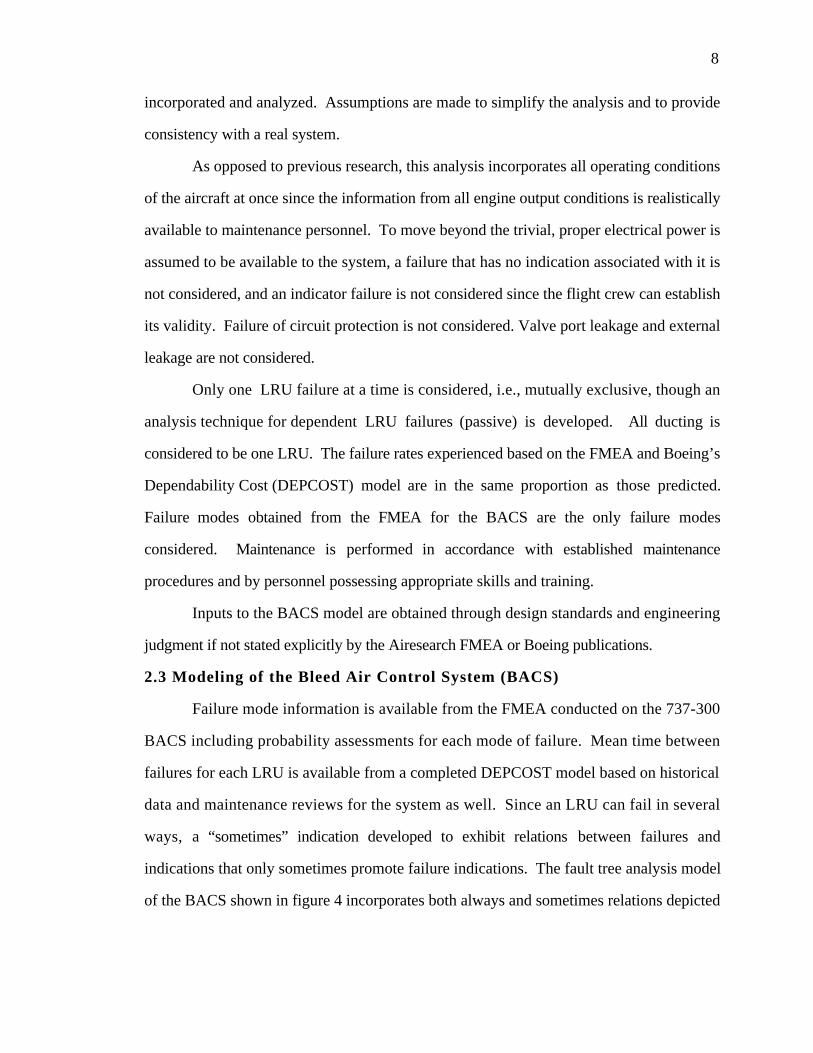
Using the DEPCOST model directly, a comparison of cost and MTBUR can be
accomplished by viewing figure 5. This figure is constructed by modifying the MTBUR
input column of the DEPCOST model to reflect predicted values of MTBUR. The 450°F
thermostat is extracted from subsequent analysis due to the assumed organizational factors
mentioned earlier as well as the LRU impotency with respect to overall cost savings
compared to all other LRUs in the system. Since no passive failures are addressed in this
research one would anticipate a higher predicted MTBUR and therefore a lower cost than
the historical values.
14
Figure 5. DEPCOST model of predicted MTBURs

15
4.2 System Modification and Comparison
All redesigns are based on not only diagnosability improvements, but also on cost
savings since cost is always the common denominator. Four design modifications are
studied and evaluations for each based on feasibility given. The benchmark for all design
comparisons is the original design using predicted values of MTBUR for continuity.
4.2.1 Change 1--Remove Pressure Function from PRSOV
Like the temperature control function, the pressure control function of the PRSOV
is shared by other LRUs. In this case, the pressure is regulated directly at the high and low
pressure ports instead of at the junction of the two just prior to the precooler. This change
requires the check valve to be replaced by a control valve. Also, the Breg must then be
moved to the new control valve to monitor downstream pressure and signal a bleed trip off
indication in the event of an overpressurization.
Based on benchmark MTBUR and cost, change 1 increases the MTBUR for the
PRSOV by 51 percent, decreases the MTBUR for the check valve by 79 percent, and
slightly decreases the MTBUR for the Breg. Since the check valve is converted to a control
valve, the failure rate of its counterpart control valve, the HPSOV, is assigned to the check
valve bringing its MTBUR down exponentially. Since the check valve is more resistant to
cost change than the PRSOV due to labor time and ambiguity, overall cost is in favor of the
PRSOV. The cost savings for this system change is on the order of 8 percent--a significant
amount based on the size and complexity of an aircraft system.
The feasibility of this design change can be approached from two directions. The
number of LRUs remains constant, and hence the complexity does not increase nor do the
functional requirements change drastically. Even the relationship of the Breg is not
significantly altered since it was remotely located from the PRSOV anyway. Yet,
considering the limited amount of space available in this particular system, any change in
size and complexity at the LRU level could be restrictive, i.e., making the check valve a

16
control valve. Also, keeping the bleed trip off functional relationship with the PRSOV
requires an additional control line from the Breg.
For an original design for future aircraft (737-600,700,800...) change 1 is a
feasible and logical design to address the unjustifiable removal problem, but a “quick fix”
for current aircraft it is not.
4.2.2 Change 2--Add PRSOV Closed Sensor Light
Using an existing design modification based on the 747-400 BACS design, a
PRSOV closed sensor light/indication is added to the system to arrest the unjustifiable
removals of at least that particular LRU. Since 70 percent of the PRSOV failure modes are
in the closed position, this modification promises significant impact.
Basically, this modification entails simply adding a limit switch type sensor to give
the aircraft crew, and thus troubleshooting personnel, an indication when the valve is in its
closed position (indication 6 for analysis). Thus, if an indication 2 (bleed pressure low)
occurs without an indication 6 (PRSOV closed) then a PRSOV failure can be discounted.
This decrease in ambiguity of indication 2 (below normal analog pressure gauge reading),
which is the most ambiguous, should aid in overall system diagnosability.
Based on the benchmark, MTBUR of the PRSOV increases by 34 percent and all
other MTBURs increase slightly as well with the exception of the check valve’s decreasing
slightly because of the system metric dynamics (the ambiguity of the check valve’s only
indication, 2, mandates an increase in false detections of low failure rate LRUs with a
decrease in number high failure rate candidates). Overall cost savings is approximately 7
1/2 percent.
This modification exemplifies the age old battle between BITE and increased weight
and complexity. Modern sensors have a reliability of at least an order of magnitude above
that of the parent system and weigh as little as a dime, yet even the slightest increase in
weight and complexity can substantially increase cost in terms of fuel and assembly hours--
especially for aircraft systems. From the human factors standpoint, there is a point of

17
diminishing returns on information available to crewmembers in the form of indications,
but since this indication is continuous and can be recorded, reaching that point from this
indication is doubtful.
Since so many system variables comprise fuel saving strategies, the cost benefit
seems to be in favor of increased weight based on the amount of savings this change
produces. Even in this particular system, there is always enough room under the cowling
for “just one more sensor”.
4.2.3 Change 3--Add Indication 3 to PRSOV
Targeting the PRSOV once again, the function-indication relationship is modified to
decrease the ambiguity of indication 2 in much the same way as adding a sensor.
Some type of relationship with existing indications or LRUs and the PRSOV is
sought after because of the high failure rate of the PRSOV in the closed position.
Considering the bleed trip off light illuminates whenever a bleed trip occurs and a bleed trip
closes the PRSOV in the case of overheat or overpressure, an association is already in
place. Merely running the bleed trip off light (indicator 3) wire from the PRSOV closed
position instead of the overheat/overtemperature probes which currently signal the
indication not only reduces the ambiguity of indication 2, but maintains system integrity by
changing no functions and adding no sensors. This modification simply changes the
PRSOV failed closed indication from indication 2 to indication 23.
The MTBUR for the PRSOV increases by 29 percent and increases slightly for the
HSreg, duct, Breg, HPSOV, and PCLR primarily due to the decrease in ambiguity of
indication 2 which these LRUs share. All other LRU MTBURs decrease slightly due to
associations with both indications 2 and 3 (except for the check valve whose MTBUR
decreases for the same reason stated in section 5.2.2) which the PRSOV is now associated
with. The overall cost savings for this modification is almost 6 1/2 percent.
This modification seems very feasible due mainly to its simplicity. According to
Boeing publications the bleed trip off light is incited by an overpressure (>180 ± 10 psi) at
18
the inlet of the PRSOV which is monitored by an overpressure switch inside the remotely
located Breg. The indication is also incited by an overheat (>490°±10°F) out of the
precooler which is monitored by an overheat switch just downstream of the precooler.
This change would replace two wires running from the switches with one wire running
only from the PRSOV to the bleed switch off light. A drawback would be an apparent
need to install a limit switch sensor in the PRSOV to monitor its position and relay the
message to the indication, therefore adding a sensor like change 2 but not decreasing the
ambiguity as much as a separate indication might.
Overall, this design mentality is logical. Scrutiny reveals that complexity is even
reduced if the bleed trip off light signal wires are removed from the Breg overpressure and
overtemperature switches. Of course, a modification like this may take more hours of
overhaul than desired. In addition, even though indication 2 decreases in ambiguity,
indication 23 increases in ambiguity. In light of the above discussion, change 3 promises
to be a sound design.
4.2.4 Change 4--Add PRSOV & FAMV Stuck Sensors
The final modification of this analysis incorporates a “stuck” sensor for both the
PRSOV and FAMV. This modification essentially eliminates all unjustifiable removals of
the two least diagnosable/highest cost drivers in the pneumatic system.
Both the PRSOV and FAMV incorporate butterfly-type valves for their operation so
a sensor placed on the axis of the valve could monitor any movement, or lack thereof.
Complexity is not increased to a great extent and added weight does not seem to threaten
feasibility.
Based on the benchmark once more, all LRU MTBURs realize a rather tremendous
increase: PRSOV 65 percent; PCLRsen 54 percent; FAMV 25 percent; and all others over 3
percent. The overall cost savings is over 16 percent.
This change is recommended over all other changes due to its simplicity and ease of
retrofitting current aircraft designs. Information from the Boeing company and the Federal
19
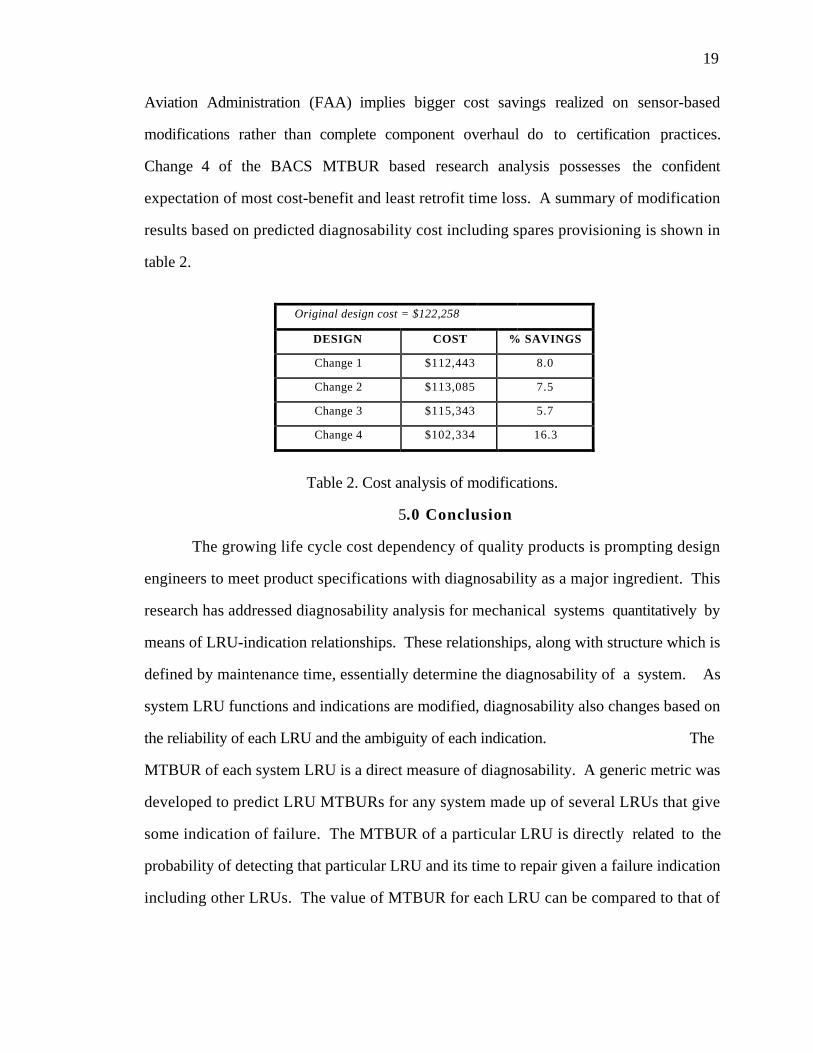
Aviation Administration (FAA) implies bigger cost savings realized on sensor-based
modifications rather than complete component overhaul do to certification practices.
Change 4 of the BACS MTBUR based research analysis possesses the confident
expectation of most cost-benefit and least retrofit time loss. A summary of modification
results based on predicted diagnosability cost including spares provisioning is shown in
table 2.
Original design cost = $122,258
DESIGN COST % SAVINGS
Change 1 $112,443 8.0
Change 2 $113,085 7.5
Change 3 $115,343 5.7
Change 4 $102,334 16.3
Table 2. Cost analysis of modifications.
5.0 Conclusion
The growing life cycle cost dependency of quality products is prompting design
engineers to meet product specifications with diagnosability as a major ingredient. This
research has addressed diagnosability analysis for mechanical systems quantitatively by
means of LRU-indication relationships. These relationships, along with structure which is
defined by maintenance time, essentially determine the diagnosability of a system. As
system LRU functions and indications are modified, diagnosability also changes based on
the reliability of each LRU and the ambiguity of each indication. The
MTBUR of each system LRU is a direct measure of diagnosability. A generic metric was
developed to predict LRU MTBURs for any system made up of several LRUs that give
some indication of failure. The MTBUR of a particular LRU is directly related to the
probability of detecting that particular LRU and its time to repair given a failure indication
including other LRUs. The value of MTBUR for each LRU can be compared to that of

20
other LRUs to determine which ones present a diagnostic challenge. System changes
based on this information can then be made to decrease the cost of diagnosability.
The MTBUR prediction metric was applied to the 737 BACS to determine system
improvements. LRU evaluation presented the PRSOV and FAMV as primary candidates
for diagnosability improvement. The life cycle costing mechanism, DEPCOST model, was
used to evaluate system cost based on the diagnosability parameters of unjustified
removals, spares cost, and maintenance time. Four design changes were suggested and
analyzed based on MTBUR, cost, and feasibility. These redesigns modify LRU
indications by optimizing current indications or by adding sensors to strategic LRUs.
Evaluations of the redesigns revealed an improvement in diagnosability directly impacting
the cost of the system.
Quality through diagnosability cannot be neglected in today’s marketplace. The
MTBUR prediction serves as an indespensible design tool for analysis of system
redesigns, sensor reallocations, and the developement of system fault isolation procedures.
The relationships of diagnosability developed here can be directly compared with other
common design decision-making variables such as manufacturability and ease of assembly
in the arena of life cycle costing. The optimal result of lower life cycle costs increases
throughout the design process since the prediction model becomes more accurate as the
system is refined. The direction of future research is expected to address the structure of
designs explicitly in terms of maintenance hours. This will especially enhance prediction
techniques of systems with a lack of historical data.
REFERENCES
1. Babb, A. H. and Smith, D. J., Maintainability Engineering, John Wiley andSons, New York, 1973
2. Clark, Garrett, “Diagnostic Modeling and Diagnosability Evaluation forMechanical Systems”, to appear in ASME Transactions: Journal of Mechanical Design,1996.
3. Wong, Bryan, “Diagnosability Analysis for Mechanical Systems and HumanFactors in Diagnosability”, M.S. Thesis, Department of Mechanical Engineering, OregonState University, Corvallis, Oregon, 1994

21