reliability cost sharing
TRANSCRIPT
Sharing the
Responsibility of
Power Reliability and
Power Quality
J. David Lankutis, P.E.
POWER Engineers IEEE Joint Technical Conference
Anaheim, CA
January 14, 2015
Power Interruption Cost
Even if we find a way to accurately estimate
cost impact of power interruptions on
customers, how do we use these costs in
our business case for reliability projects?
2
Basic Assumption
In a majority of cases, the most cost effective solution to a given power quality or reliability issue involves investment of time and money on both sides of the electric meter.
Perceptions and practices regarding sharing of cost between utility and customer varies considerably.
3
Customer takes appropriate amount of responsibility
• For reliability
• For interruption information
• For energy efficency
Utility offers education
4

Being Neighborly
5

Being Neighborly
“Don’t dim my lights when you start your
motor”
“Don’t dump your hazardous harmonics on
the power system and pollute it for others”
6
Being Neighborly
“Don’t raise my rates to satisfy special
needs customer.”
7
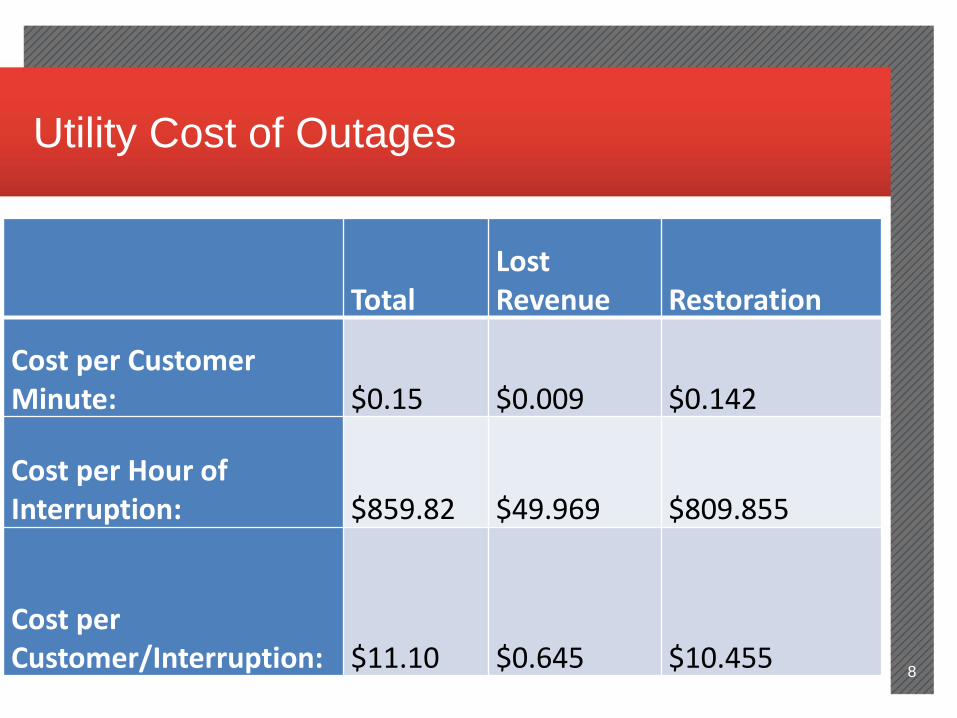
Utility Cost of Outages
8
Table 2
Total Lost Revenue Restoration
Cost per Customer Minute: $0.15 $0.009 $0.142
Cost per Hour of Interruption: $859.82 $49.969 $809.855
Cost per Customer/Interruption: $11.10 $0.645 $10.455

Utility Cost of Outages (5 years)
9 ICE Calculator = $24,740,710/yr

Cost of Outages including Customer Satisfaction
10
Table 2
Total Customer
Satisfy
Lost Revenue Restoration
Cost per Customer Minute: $0.55 $0.40 $0.009 $0.142
Cost per Hour of Interruption: $3147 $2287 $49.969 $809.855
Cost per Cust/Interruption $40.62 $29.52 $0.645 $10.455
Consumer Perspective
Common Types of Consumers
• Residential
• Commercial
• Agricultural
• Industrial
11

Evaluating Impact on Consumer
12
Notification Factor??
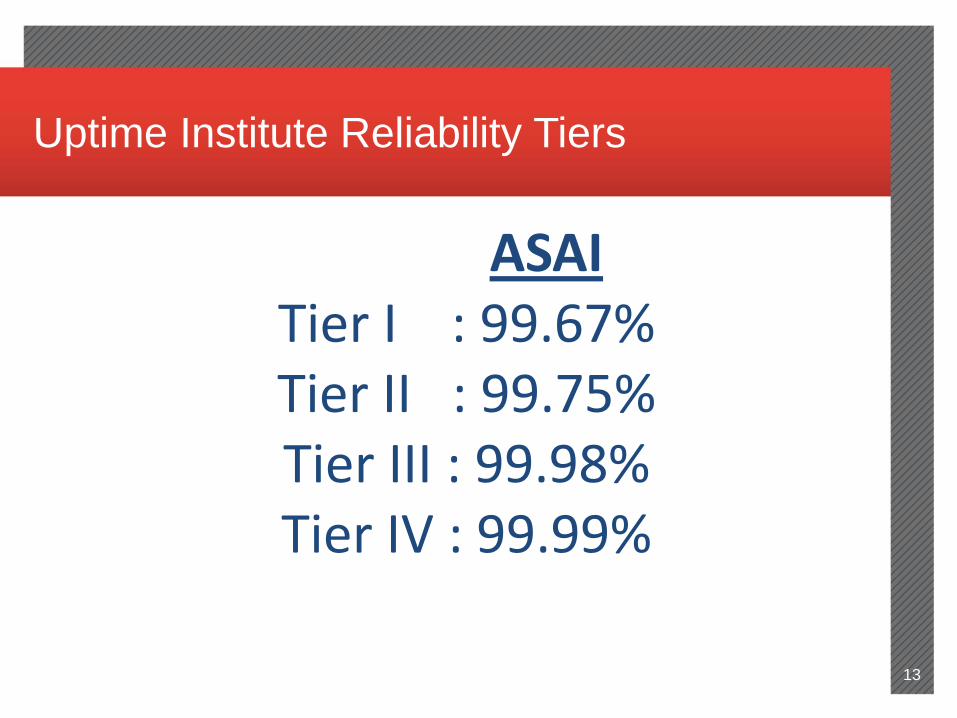
ASAI Tier I : 99.67% Tier II : 99.75%
Tier III : 99.98%
Tier IV : 99.99%
13
Uptime Institute Reliability Tiers

Data Center Reliability
“Tier III and IV engine-generator plants are considered the primary power source for the data center. The local power utility is an economic alternative. Disruptions to the utility power are not considered a failure, but rather an expected operational condition for which the site must be prepared.”
- Uptime Institute 14

15
Tier I ASAI = 99.67% SAIDI = 1,734 min
Courtesy of Uptime Institute
Basic
16
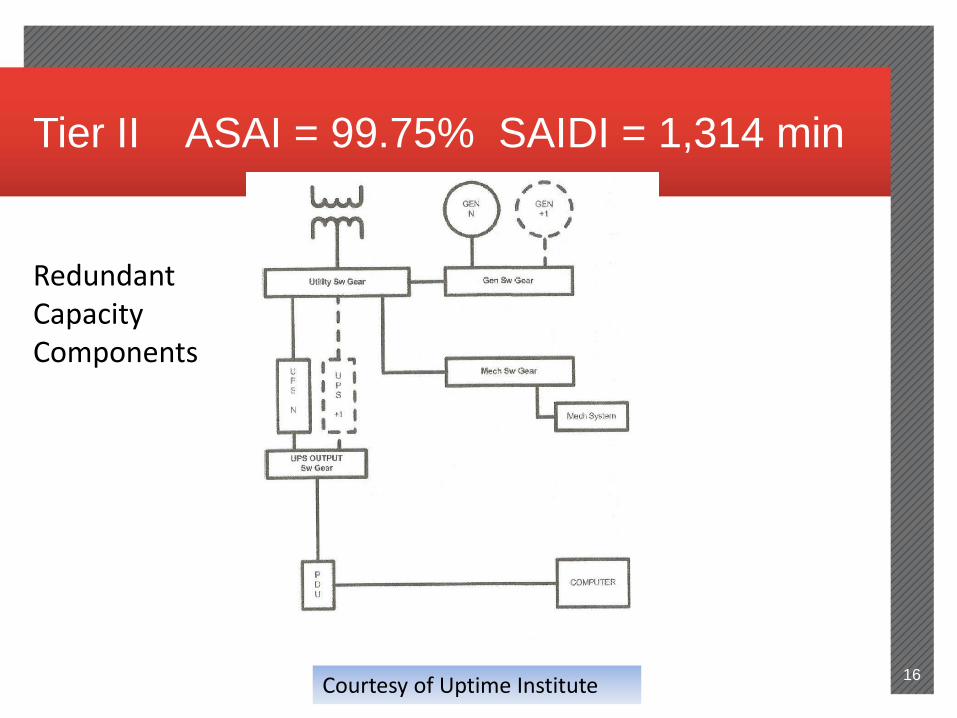
Tier II ASAI = 99.75% SAIDI = 1,314 min
Courtesy of Uptime Institute
Redundant Capacity Components
17
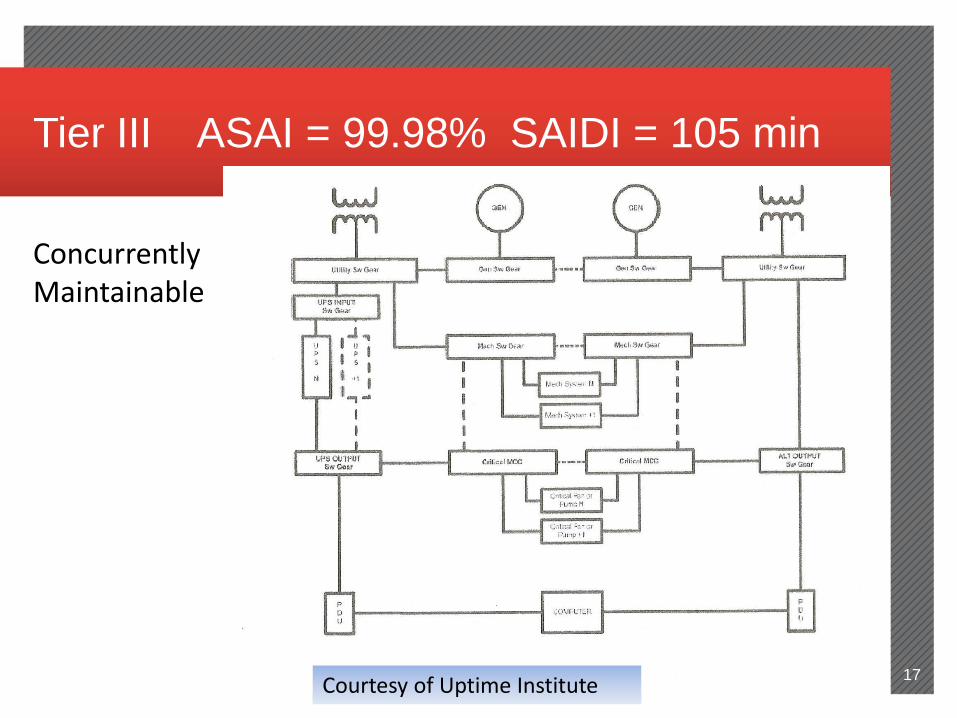
Tier III ASAI = 99.98% SAIDI = 105 min
Courtesy of Uptime Institute Courtesy of Uptime Institute
Concurrently Maintainable
18
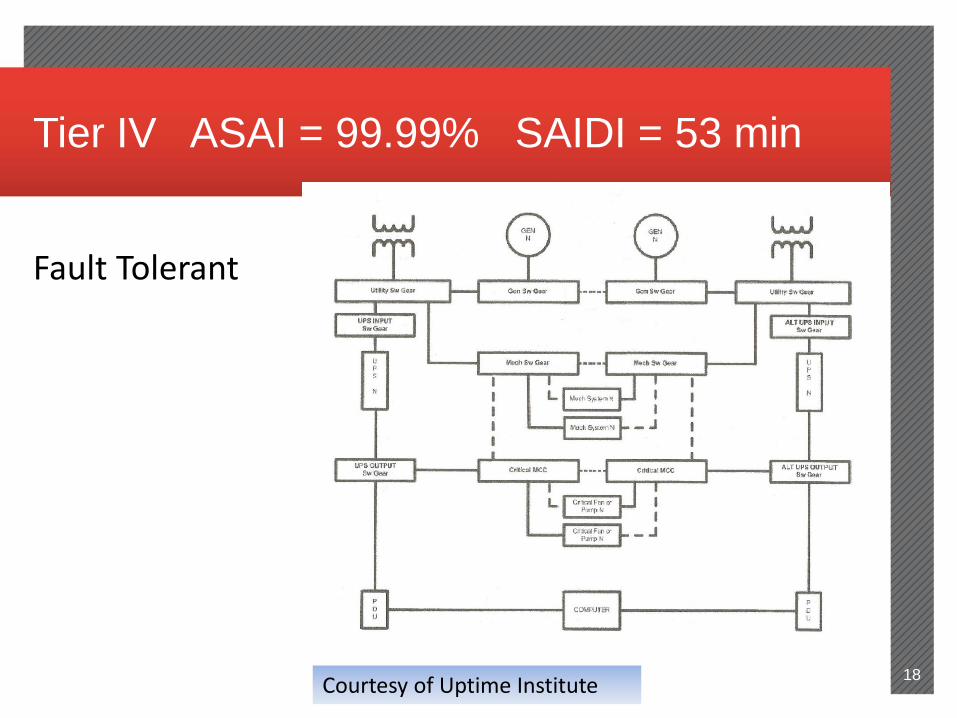
Tier IV ASAI = 99.99% SAIDI = 53 min
Courtesy of Uptime Institute
Fault Tolerant
19
20
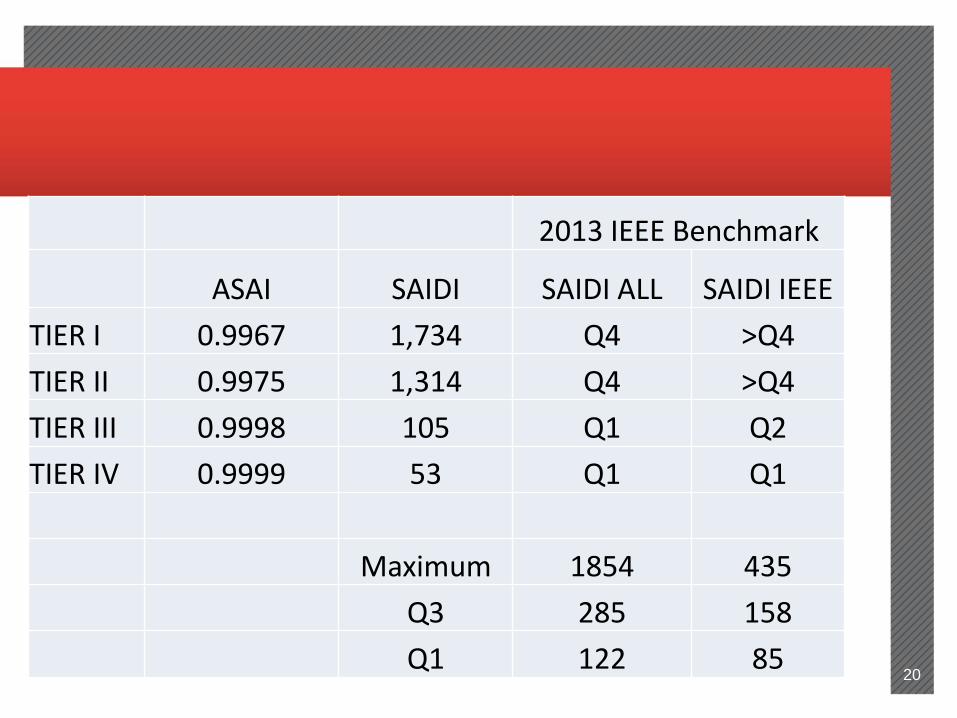
2013 IEEE Benchmark
ASAI SAIDI SAIDI ALL SAIDI IEEE
TIER I 0.9967 1,734 Q4 >Q4
TIER II 0.9975 1,314 Q4 >Q4
TIER III 0.9998 105 Q1 Q2
TIER IV 0.9999 53 Q1 Q1
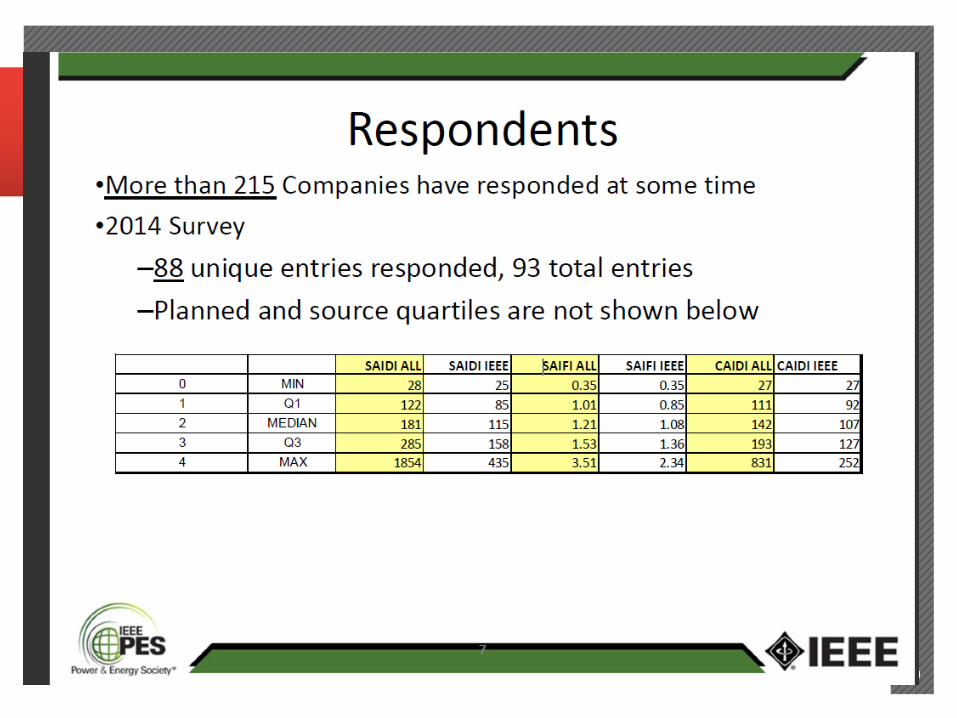
Maximum 1854 435
Q3 285 158
Q1 122 85
Operational Sustainability
“The majority of reported data center outages are
directly attributable to human error”
Uptime Institute
21
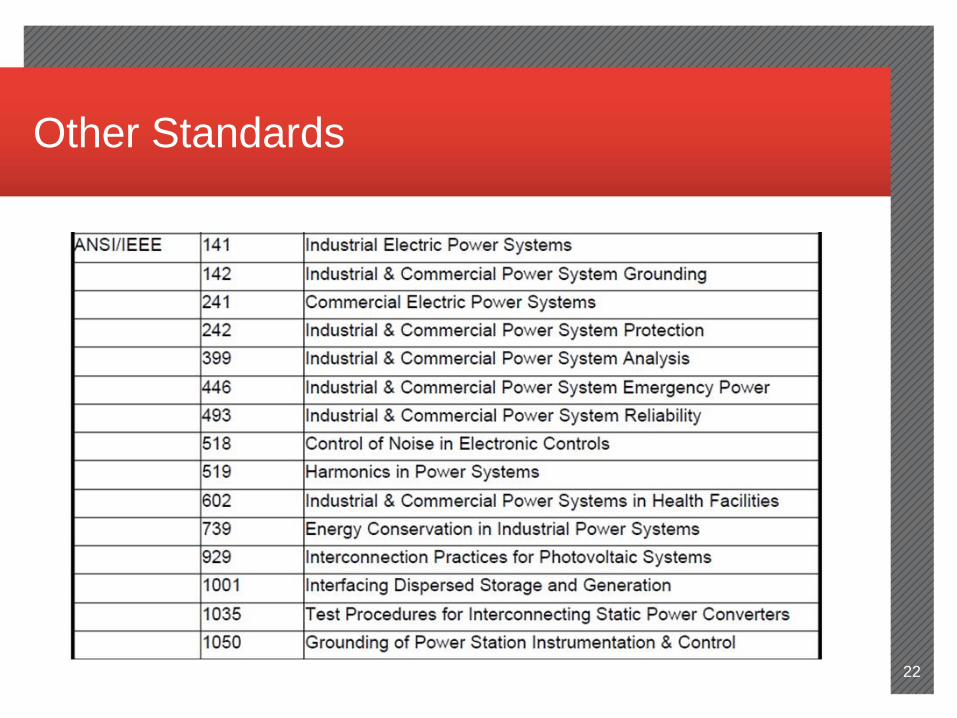
Other Standards
22

Other Standards
23
Possible Next Steps
• Review existing standards for applicability and
completeness
• Survey existing practices and policies
• Dialog with IEEE I&CPS, PCIC
• Discussion of reliability based rates
24
Example IEEE 519 Responsibility
Customer meets current standard
Utility meets voltage standard
25
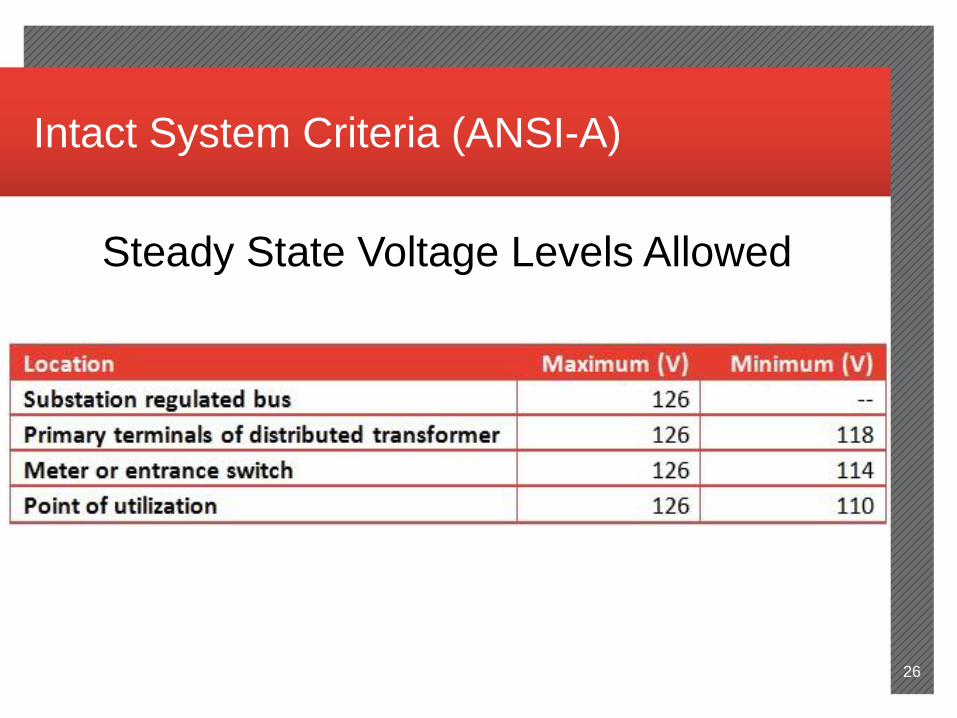
Intact System Criteria (ANSI-A)
Steady State Voltage Levels Allowed
26
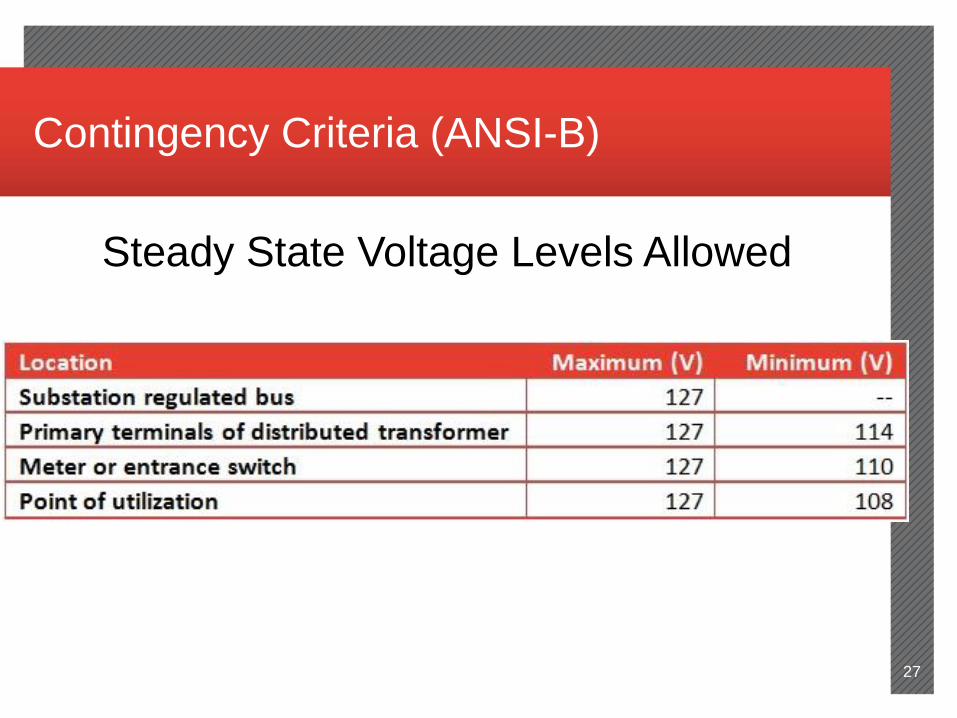
Contingency Criteria (ANSI-B)
Steady State Voltage Levels Allowed
27
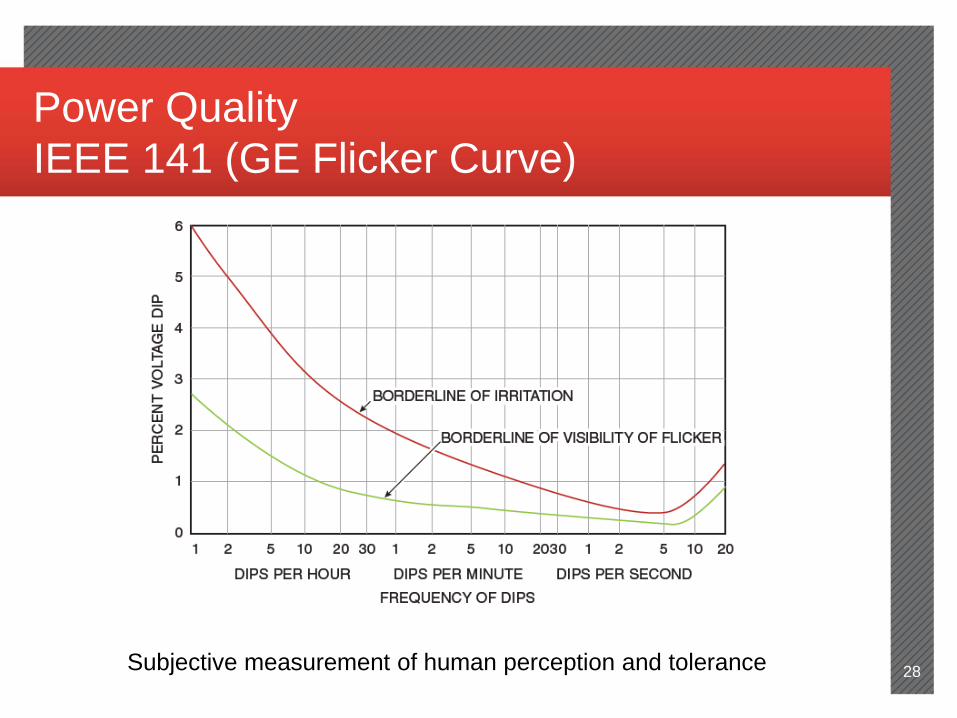
Power Quality
IEEE 141 (GE Flicker Curve)
Subjective measurement of human perception and tolerance 28

29