reliability of railway operation - trafikdage.dk · trafikdage på aalborg universitet 2012 issn...
TRANSCRIPT

Trafikdage på Aalborg Universitet 2012 ISSN 1603‐9696 1
ReliabilityofRailwayOperationAlexLandex,[email protected] DTUTransport
AbstractDelays in railway networks cause problems in the daily operation and result in reduced reliability of the railway operation. The article defines methods based on the two closely related concepts of regularity and punctuality. These methods cover the traditional measures for trains based on the realized and simulated operation but also more advanced methods that take the passengers’ experience into account. This is done by using passenger delay models that estimates the delays of the passengers based on train delays and knowledge about the passenger behavior. For high‐frequent operation, the traditional measures cannot describe the perceived service reliability of the passengers as passengers can travel with delayed trains without knowing of the delay. Here, the article presents other reliability measures. Using the presented reliability approaches, the article illustrates how the reliability of railway operation can be improved through reliability analyses.
1 IntroductionDelays in a railway network are one of the biggest problems in the daily operations of a railway company (Berger, Hoffmann, Lorenz & Stiller 2011). Therefore, attention to transit quality and efficiency in general and reliability in particular is increasing. (van Oort, van Nes 2010). For railway services, reliability can be defined as the continuity of correct service (Avizienis, Laprie, Randell 2001). Seen from the passengers point of view, the reliability can be divided into the two closely related concepts regularity and punctuality. Regularity is the variation in headways while punctuality relates to the deviation from the scheduled arrival and departure times (van Oort 2005). Trains are not allowed to depart before time since from a passenger perspective, the next departure is “late” by the frequency (Bush 2007). Therefore, the trains will always depart “on time”/punctual or delayed. If the time is divided in small time intervals (e.g. seconds), it is very difficult for the trains to depart exactly on time. Since the trains are not allowed to depart before time, the risk of (very) small delays is high (Landex 2009). To avoid discussions of when a train deviates from its timetable (i.e., the train is punctual), most countries have decided on threshold values for when a train is on time. In Denmark it is decided that the trains are punctual if they arrive within the following thresholds (Landex et al. 2007; Landex 2008):
S‐trains – 2½ minutes
Regional trains – 5 minutes
Intercity and Intercity Express trains – 5 minutes
Freight trains – 10 minutes
Denne artikel er publiceret i det elektroniske tidsskrift
Artikler fra Trafikdage på Aalborg Universitet
(Proceedings from the Annual Transport Conference
at Aalborg University)
ISSN 1603‐9696
www.trafikdage.dk/artikelarkiv

Trafikdage på Aalborg Universitet 2012 ISSN 1603‐9696 2
The threshold value for when a train is punctual differs by country. In the USA, the threshold value varies from 5 to 30 minutes depending on the length of the train service and not the average travel distance for the passenger (Bush 2007). In Europe, the threshold values vary too, but also where to measure the punctuality varies. E.g. The Netherlands measure the punctuality at the departure from 32 measuring stations spread out over the network, while Germany and Norway measure the punctuality at arrival at the terminal station1 (Daamen et al. 2007; Olsson and Haugland 2004). Because of the different ways of measuring punctuality only few international comparrisons of train delays (e.g. (Nederlanse Spoorwegen 2001; Vromans 2005)) are conducted, cf. Figure 1.
Figure 1: Trains arriving less than 5 minutes late in year 1999‐2002. Data from (NEA 2003).
In high‐frequency systems, more focus on headway deviation is common because travelers tend to arrive at random (van Oort, van Nes 2010). However, in case the vehicles operate slower than planned, the headway deviation method may not be sufficient to describe the reliability of the railway operation. To achieve a method with low complexity, the headway deviation can be combined with the running time deviation of the vehicles (Landex 2009). To guesstimate the impact on the reliability of the railway operation in case of altered timetables or modified infrastructure, it is necessary to conduct a simulation of the railway operation. Therefore, this article first (in section 2) presents the traditional method of simulating train delays. This is (in section 3) followed by an approach that takes passenger delays into account when measuring the reliability of the railway operation. In section 4, reliability measures for high‐frequent train operation are presented. Before the conclusions (section 6), section 5 discuses how the reliability of railway operation can be improved based on the described methods.
2 SimulationofTrainDelaysThe delay propagation and the total delay can be calculated for a given initial delay provided that the timetable and the characteristics of the infrastructure are known. However, these calculations of delays are only possible for idealized situations. This is because only one railway line would be examined, no dispatching would be included, and it will be assumed that the timetable will regenerate before the next delay occurs. However, a delay on one railway line may influence other railway lines too, and the total amount of delay may be reduced through dispatching (e.g. changing the order of the trains). Furthermore,
1 In Norway, punctuality is measured at some importat stations too.
70% 75% 80% 85% 90% 95% 100%
Finland
Hungaria
Switzerland
Denmark
Austria
Belgium
Netherlands
Norway
Sweden Long distance trains
Local trains
All trains

Trafikdage på Aalborg Universitet 2012 ISSN 1603‐9696 3
if two initial delays occur shortly after each other, the second delay might not have the same influence, as the train would have got a consecutive delay, also if the delay did not occur, cf. Figure 2.
Figure 2: Two initial delays shortly after each other (broken lines are the planned timetable).
Instead of calculations on idealized situations, simulation can be used. Originally, the science of simulation was the reproduction of a real object or a process as a model. In a simulation, this model was used instead of the original. However, given the success of computers as a technical tool, almost all processes can now be simulated with computer programs. During recent years, it has become clear that simulation is a suitable method to reproduce the reality in a virtual process. The results can help to understand and analyze processes more easily (Siefer 2008). Simulation models are often more precise than the idealized formulas. This is because simulation can take delays occurring immediately after each other into account and because simulation models often have detailed knowledge about the infrastructure and train operation so that they can, for example, calculate the delay caused by speed reductions due to restrictive signals. Furthermore, more railway lines can be examined at the same time, dispatching can to some extent be included, and previous delays are included when the total amount of delay is computed. There are many simulation models that can be used for different analysis but in general, the models can be divided into three categories, cf. Figure 3. For analysing delays and delay propagation, tactical (and/or operational) models can be used (e.g. RailSys (Siefer, Radtke 2005) and OpenTrack (Nash, Huerlimann 2004))2. These types of simulation models are generally built up in several steps. First, the infrastructure must be built up before constructing the timetable. Then, the delay distribution of the initial delays must be entered together with the rules for dispatching. Finally, the simulation can be run and the results can be evaluated, cf. Figure 4. To ensure a stable and reproducible result, 50–200 simulations should be conducted (Siefer 2008)3.
2 (Barber et. al 2007) and (Koutsopoulos, Wang 2007) give an overview of different simulation tools. 3 (Radtke, Bendfeldt 2001) suggest 50–100 simulations.
Time
Distance
Point of delay
Point of delay

Trafikdage på Aalborg Universitet 2012 ISSN 1603‐9696 4
Figure 3: Different types of simulation models and their main types of analysis. Based on (Kaas 1998).
The advantages of simulation models compared with the analytical models are the high accuracy and the possibility to test future changes in the infrastructure and the timetables for an entire network. Furthermore, simulation models can estimate the impact of the trains in the case of reduced speed and queuing, skip any conditional stops, and changing the order of the trains to reduce the amount of consecutive delays. However, simulation models also have their limits. Although simulation models are more accurate than idealized formulas, they cannot dispatch the trains in the same way as does the dispatcher in real life where more tools to relieve the disruptions exist, e.g., (Jacobs 2008, Jespersen‐Groth et al. 2007):
Overtaking4: Choose to overtake another train to have better overall relief in the disruptions
Change in stop pattern: A delayed train can skip some stations to recover from its delay. Another train might then have additional stops. This kind of dispatching is often used on the Copenhagen suburban railway network
Inserting an on‐time train: In the case of delays, the delayed train can be replaced by another train running on time. This kind of dispatching is often used on the Coast line (from Copenhagen to Elsinore) in Denmark
Increasing residual capacity/cancel train(s): Cancellation of one or more trains can ensure sufficient capacity to avoid too many consecutive delays. In this way, the number of disruptions can be reduced. The cancellation of trains can be over the entire route or only part of it. This kind of dispatching is often used on the Copenhagen suburban railway network
Use of alternative routes: If there are parallel routes between two stations along a railway corridor, the train can choose an alternative route. It might be necessary to skip some stations to be able to change to another train service. This kind of dispatching has been used in Denmark for freight trains in the case of major incidents
Bundle trains: In the case of reduced capacity (e.g. due to a closed track), extra capacity can be gained by bundling the trains. The trains in the same direction can be bundled by speed or by direction for unscheduled single track operation. This kind of dispatching has been used in Denmark in cases of construction/maintenance work and in cases of unscheduled closure of tracks
4 Simulation tools often allow unscheduled overtakings in the case of disruptions but the dispatcher might choose the overtaking based on criteria other than the dispatch algorithm—and possibly even combine the overtaking with other dispatching actions.
Operational models
Tactical models
Strategic models
Planning horizon
Leve
l of d
etai
lHigh
Low
Short Long
Operation
Specialtimetables
Timetable
Plan of operation
Traffic forecasts

Trafikdage på Aalborg Universitet 2012 ISSN 1603‐9696 5
Coupling trains: In some cases, two or more trains can be coupled to one train. In this way fewer trains have to pass a bottleneck and capacity is gained. This kind of dispatching has been used in Denmark in cases of construction/maintenance work and in cases of unscheduled closure of tracks
Figure 4: Typical steps when simulating delays in railway networks (Landex, Nielsen 2006a).
Besides the dispatching rules, the difficulty in calibrating simulation models comes from the difficultly in entering the right initial delays, because it is difficult, or even impossible, to find a standard distribution type that is widely applicable (Yuan 2006). To calibrate the models the initial delays can be extracted5 from collected data about the actual operation6 (Tromp 2004). By identifying the consecutive delays7, it is possible to derive the initial delay from the actual operation. These initial delays can be entered in the simulation model and the final calibration can be conducted based on the outputs, cf. Figure 5 and re‐running the steps in Figure 4. This calibration can be time consuming (Kaas 2000) as even small changes in the delay distribution(s) can result in changes elsewhere in the network. When using (microscopic) simulation models to predict effects of scenarios it is necessary to calibrate the simulation models to give the results actually observed. However, the literature on calibration of rail simulation models is limited (Koutsopoulos, Wang 2007). The difficulty calibrating simulation models to give exactly the same results as in real life operation, results in ad hoc adjustments based on simple statistics or performance measures to compare the simulation output to field observations. Here, the adjusting of the model parameters is often done by trial and error, or some kind of estimation, until the simulated measures are close to the observed ones, cf. Figure 5. Often the purpose of calibrating simulation models is
5 It should be noted that the observed delays are the sum of the initial delays and the consecutive delays. 6 (de Fabris, Longo & Medeossi 2008) describe a method to analyze the actual operation. 7 (Daamen, Goverde & Hansen 2007) describe a method to identify consecutive delays.
95,4%
84,0%
15,7%
90,6%
80,5%
17,3%
95,4%90,3%
22,5%
91,4%86,8%
22,5%
92,7%
85,0%
19,6%
0%
10%
20%
30%
40%
50%
60%
70%
80%
90%
100%
Morning Day Afternoon Other time Total
Train regularity [%] Passenger regularity [%] Arrivals before time [%]
Infrastructure
Timetable
Evaluation
Simulation

Trafikdage på Aalborg Universitet 2012 ISSN 1603‐9696 6
to reproduce the operation of an average day, to be able to examine the consequences of changes in the operation and/or infrastructure.
Figure 5: Calibration of simulation models. Based on (Toledo, Koutsopoulos 2004).
A robust timetable is able to deal with only minor initial delays—a few minutes of delay—because no reasonable timetable is sufficiently robust in the case of large delays (Vromans, Dekker & Kroon 2006). Perturbed operation causes delays and, at least in congested areas, this requires frequent real‐time modifications (D'Ariano 2008). This is further complicated by the limited dispatch algorithms, which makes the calibration even more complicated. Microscopic simulation models perform according to the applied algorithms and the rules entered. However, in the case of delays more passengers might want to use the same train, which might result in longer dwell times. This means that delayed trains generally have a higher risk of becoming even more delayed. This is generally not taken into account in micro simulation models. However, if another train going in the same direction has overtaken the delayed train and is running immediately in front of the delayed train, the delayed train might have fewer passengers and thereby possible shorter dwell times, which is why the train may pick up time faster. Although simulation models have disadvantages, they are more accurate than simple delay calculations. To overcome, or at least reduce, the disadvantages of simulation models, the results are often compared relatively to each other. In this way, it is possible to examine the relative differences for different projects and choose the best alternative. Microscopic simulation models are powerful, but they require extensive work to enter the detailed infrastructure topology, train characteristics, signal locations and timetables. Furthermore, these models require more computing time compared with simpler models, which is why it might be tempting to use these simpler macroscopic or operational research models8. Although these models are suitable for evaluating the overall stability of timetables of interconnected lines, they cannot be used to estimate the distributions of consecutive delays and the punctuality level of the scheduled trains, as they are generally based on a deterministic modeling approach (Yuan 2006). Nevertheless, the simpler models give an indication about the delay(s) that might be satisfactory—at least in a screening process with several alternatives. To achieve better simulation results from simulation models, further research and development is needed, especially within dispatching algorithms.
8 Microscopic models require more detailed data than do the simpler models. In some countries these data are difficult to procure, but in Denmark there is open access to the necessary data.
SimulationOutput
SimulationOutput
RealOutputReal
Output
SimulatedSystem
Simulation
SimulatedSystem
SimulatedSystem
Simulation
RealSystem
Operation
RealSystem
RealSystem
Operation
Com
parison
RealInput
Initial delays
RealInputRealInput
Initial delays
SimulationInput
Delay distribution
SimulationInput
SimulationInput
Delay distribution
EstimationModel
Real life

Trafikdage på Aalborg Universitet 2012 ISSN 1603‐9696 7
3 PassengerDelaysSimulation of train delays does not reflect the passenger’s perception of reliability. This can instead be done by calculating travel time for passengers for the planned situation and the actually performed operation. These times can then be compared, and the extended travel time of the passengers – or passenger delay – can then be used as a measure for the reliability of the operation. Several methods have been applied to calculate rail passenger delays. The majority of these do not include schedule‐based route choice models; in the following classified as 0th generation models. Some methods are simple and straightforward to implement, but also simplified and inaccurate, while other methods are more precise. The simplest methods (0th generation) are not reported in the international literature, as they have been developed and used by railway companies (Landex 2008). Although the 0th generation methods are simple and inaccurate, these models found the basis for the later 1st, 1½, 2nd and 3rd generation passenger delay models (based on (Landex 2008)):
0th generation models are the simplest models where the passenger delays are assumed equal to the train delays or the train delays multiplied with either amount of passengers in the train (cross‐section delays) or the amount of alighting passengers at the stations (counting train delays). These models do not take transfers and changed routes/trains due to delays into account.
1st generation models compare the time the passengers use in the system calculated by an optimal route choice model based on the planned timetable and the actually performed operation. These models take the passengers’ entire route into account but the models assume that the passengers know all delays in advance.
1½ generation models are similar to 1st generation models but are improved as the passenger is not assumed to know all delays in advance before arriving at the station. However, the models still assume that the passengers know all delays in advance – but the passengers first receive this knowledge when they arrive at the first station.
2nd generation models assume that the passengers know the delay distribution of the train service(s) and include this when the passengers consider their routes using a 1st generation model.
3rd generation models are the most advanced models. Here the passengers will attempt to follow a pre‐planned route based on the published timetable. However, if this is not possible or the passengers become more delayed than a certain threshold, the passengers will reconsider their route choice from that point in time and space. This reconsideration will be done assuming full knowledge of all (future) delays.
Table 1 below compares the different passenger delay calculation methods and models with respect to their main characteristics. 1st to 3rd generation passenger delay models require the same data and the same work effort to run but since 3rd generation passenger delay models give the most realistic results (Landex 2008) it is recommended that 3rd generation models are used. 3rd generation models require more data than 0th generation models but they are more precise and can be used to perform more kind of analyses. For instance 3rd generation models can include transfers in the calculations so that the total travel time from the start station of the passengers to the end station can be examined. This means that the 3rd generation passenger delay models can examine the entire network (see e.g. (Landex and Nielsen 2006a) and not only the consequences of the passengers on a single railway line or a part of the network as the 0th generation models do (including the service frequency, travel time and combined approaches).

Trafikdage på Aalborg Universitet 2012 ISSN 1603‐9696 8
Table 1: Comparison of methods to calculate passenger delays (Landex 2008).
Passengers in the 1st to 3rd generation passenger delay models can change their route choice in case they become delayed more than a specified amount of time (Landex 2008; Landex, Nielsen 2006b). However, in the 3rd generation models the passengers are assumed to reconsider their route choice at the point in time and space when the specified amount of delay occurs – and not already before the trip starts as in 1st to 2nd generation models (Landex 2008). Because passengers do not know the delays in advance, the passengers’ route choice in 3rd generation passenger delay models are fairly accurate. This makes it possible to estimate the amount of passengers in trains, and thereby if the seating capacity is sufficient – both for the planned and realized timetable, see example in Figure 6. Furthermore, capacity constrains can be incorporated in the model so that it is possible to examine additional delays for passengers in case they cannot board a completely full train and thereby experience reduced reliability of the railway operation. Calculating passenger delays of the performed operation is of interest to evaluate the reliability of the system and to identify aspects or routines that could be improved. However, by combining the passenger delay model with a rail simulation model it is possible to predict or estimate the future passenger delays. This can be used to evaluate changes in the infrastructure and/or in the timetables as early as in the planning phase.
Tra
in d
elay
s
(0th g
ener
atio
n)
Cro
ss s
ectio
n
dela
ys
(0th g
ener
atio
n)
Cou
ntin
g train
dela
ys
(0th g
ener
atio
n)
Opt
imal
rout
e
choi
ce m
odel
(1st g
ener
atio
n)
1½ g
ener
atio
n
mod
el
Pas
seng
er d
ela
y
mod
el
(2nd
gene
ratio
n)
Pas
seng
er d
ela
y
mod
el
(3rd g
ener
atio
n)
Considerations of passenger delays
No Partly Partly Partly Partly Yes Yes
Complexity of the method
Very simple
Low Low Medium Medium High High
Needs of information on passenger demand
No Average alighting
passengers
Counted passengers
OD matrix OD
matrix OD
matrix OD matrix
Passengers may predict delays in the future (full information is assumed)
No No No Yes Yes Partly Can be
incorporated
Passengers may arrive before time if a better con-nection emerges
No No No Yes Yes Yes Yes
Accuracy Very low Quite low Fairly low Low Medium Medium High
Bias
Mostly under-
estimates delays
Will quite often under-
estimate delays
Will fairly often
under-estimate delays
Large under-
estimation of delays
Under-estimates
delays
No sys-tematic
bias
No system-atic bias

Trafikdage på Aalborg Universitet 2012 ISSN 1603‐9696 9
Figure 6: Seating capacity and amount of passengers for planed and realized timetable. Based on (Seest et al. 2005).
Calculation of passenger delays requires result data from the simulation of both the planned and all the realized/simulated timetables for all arrivals and departures. These data can be derived from the railway simulation software and used in the passenger delay model. The workflow of calculating the passenger delays is shown in Figure 7. Here, the simulation of operation, export to the passenger delay model, and calculation of passenger delays simulates the impacts from one to several days of operation. To calibrate the model and to obtain a delay distribution, it is necessary to repeat this step a number of times before the evaluation is done.
Figure 7: Workflow of simulating disturbances and modelling expected train passenger delays. Based on (Landex, Nielsen 2006b).
(Landex, Nielsen 2006a) has shown the possibility of predicting the future passenger delays by simulation for the entire Copenhagen suburban railway network. As expected, the results showed that the punctuality of trains is higher than the punctuality of passengers, cf. Figure 8.
Train route B from Høje Taastrup to Holte, Train number 60126
0
50
100
150
200
250
300
350
Actual (delayed) timetable Planned timetable Seatingcapacity
Am
ou
nt
of
pa
ss
en
ge
rs
Coding of infrastructure
Timetabling
Rules of operationSet up of delay distribution
Simulation of operation Export to passenger delay model
Calculation of passenger delays
Evaluation
Calibration
Joint evaluation
Passenger delays
Traditional simulation
Calibration

Trafikdage på Aalborg Universitet 2012 ISSN 1603‐9696 10
Figure 8: Punctuality of trains and passengers at all stations for an average day. The figure shows the accumulated distribution of arrivals, i.e. how many passengers arrive with less than x seconds of delays ‐ e.g., 20% arrive before planned, 60% with less than 60 seconds of delay (including the 20% arriving before planned) in the 3rd generation model. Based on (Landex, Nielsen 2006a).
In comparison, the traditional way of calculating passenger punctuality (multiplying the delay of the train with the expected number of passengers alighting the train) resulted, as expected, in higher passenger punctuality than when calculated by the passenger delay model. However, train delays do not necessarily cause passenger delays. For the simulated network the 1st and 3rd generation models calculate that about 20% of passengers arrive earlier than planned, cf. Figure 8. From Figure 8 it is seen that the 1st generation benchmark model, as expected, results in better punctuality than the more realistic 3rd generation model. However, the difference in the methods is (in this case) small. A passenger delay model can also be used for evaluating (and ranking) infrastructure improvements. The benefits for passengers in terms of travel time and delays can be estimated and compared with the construction costs in, e.g., a cost‐benefit analysis. Furthermore, different timetable alternatives can be evaluated and compared in the process of developing the best possible timetable for passengers. In this way, it can be said that calculation of passenger delays is of importance for the passengers, the train operating company (e.g., as a tool to improve the timetables for the passengers and thereby attract more passengers) and the infrastructure manager/planning authority to prioritize infrastructure/maintenance projects. Although passenger delays can be interesting to the infrastructure manager and the train operating company, these delays might not be used in daily operation. This is because the infrastructure manager, and possibly also the train operating company, may focus more on reducing the train delays than the passenger delays. This is because train delays is an easier measurement to decide on and fewer train delays reduces the risk of consecutive delays and requires less rescheduling of crew and rolling stock. Furthermore, both the infrastructure manager and the train operating company may be measured on the punctuality of trains, rather than that of passengers, and the companies might have contracts (e.g., with the Ministry of Transport or with each other) resulting in a bonus if the train punctuality is above a certain level.
0%
10%
20%
30%
40%
50%
60%
70%
80%
90%
100%
Earlie
r tha
n plan
ned
At tim
e
30s de
laye
d
60s de
laye
d
90s de
laye
d
120s
delay
ed
150s
delay
ed
180s
delay
ed
210s
delay
ed
240s
delay
ed
270s
delay
ed
300s
delay
ed
330s
delay
ed
360s
delay
ed
390s
delay
ed
420s
delay
ed
450s
delay
ed
480s
delay
ed
510s
delay
ed
540s
delay
ed
570s
delay
ed
600s
delay
ed
1500
s de
laye
d
3000
s de
laye
d
Cross section delaysTrain delays1st generation model3rd generation model

Trafikdage på Aalborg Universitet 2012 ISSN 1603‐9696 11
4 Reliabilitymeasuresforhigh‐frequentoperationFor high frequent train services (like metro systems), with headway times of 1½ to 5 minutes, reliability methods based on train delays are not sufficient. This is because the passengers will not realize that the trains are delayed if all trains are delayed the same amount of time. In fact, the punctuality for timetables with a simple structure and high frequency (e.g. metro services), the punctuality is not so important (Weits 2000). Instead, passenger delays can be used, but this approach is comprehensive, and the approach only measures the train operation indirectly. The reason for this is that it is possible that a passenger is punctual or even ahead of time when using a previously delayed train instead of the originally scheduled one (Martin 2008). Therefore, different approaches to make up the reliability for high frequent operation are needed. In this article, three approaches for high frequent operation are described. All methods can be based on either realized operations data or simulated data.
4.1 ServicefrequencyThe frequency of the operation is a quality criterion for public passenger transport (European Committee for Standardization 2002). Therefore, one way of examining the reliability of the operation for high frequent railway operation is to examine the service frequency (Kaas et al. 2008). This can be done by examining the planned number of train departures and the realized (or simulated) amount of train departures per time interval. If the amount of trains per time interval is stable, it indicates that the trains arrive at the station in (more or less) the same time intervals, which indicates that the operation is stable. The service frequency approach is a straightforward method to evaluate the frequency – and thereby implicitly the reliability of the operation – of high frequency railway systems. However, if the examined time intervals are too long there is a risk of overlooking variation in the frequency – and thereby the reliability. Therefore, the time intervals as a minimum should be long enough to contain 3‐4 trains (Landex 2009).
4.2 TraveltimeThe Service frequency approach only considers the headway times between the trains and not extended travel times. The travel times between the stations can be longer than planned although the promised service frequency is kept. This can be the case (for e.g. driverless metro systems) if the train operating company operates more trains than needed to maintain the promised frequency. Furthermore, the travel time is an important quality criterion for public passenger transport (European Committee for Standardization 2002). Therefore, a measurement taking the travel time into account can be wanted. To evaluate if the train operating company keeps the promised quality, the travel times between the stations can be examined. For this it can be decided if there should be an accept criteria (or threshold) for when a train is delayed. For timetables without supplements, the threshold is necessary since many trains else would be registered as delayed. To take the passengers experience into account, the article suggests that the accept criteria for timetables (with and without supplements) for high frequent operation should be the published travel times. The travel time measurement can either be examined between two successive stations or accumulated travel times between a number of stations. Some delays may not be detected if it is the accumulated travel times that are examined. However, since many passengers travel further than one station, passengers may (due to the difference between the minimum and the published travel time) arrive on time although there is a (smaller) delay. The travel time approach reflects the experiences of the passengers regarding travel time delay in the vehicle but not delays due to an uneven frequency, cancellations and no possibility to board a train due to lack of capacity. Therefore, the travel time approach cannot calculate the total delay for passengers. However, the approach is simple and only the realized timetable is needed for the analyses.
Trafikdage på Aalborg Universitet 2012 ISSN 1603‐9696 12
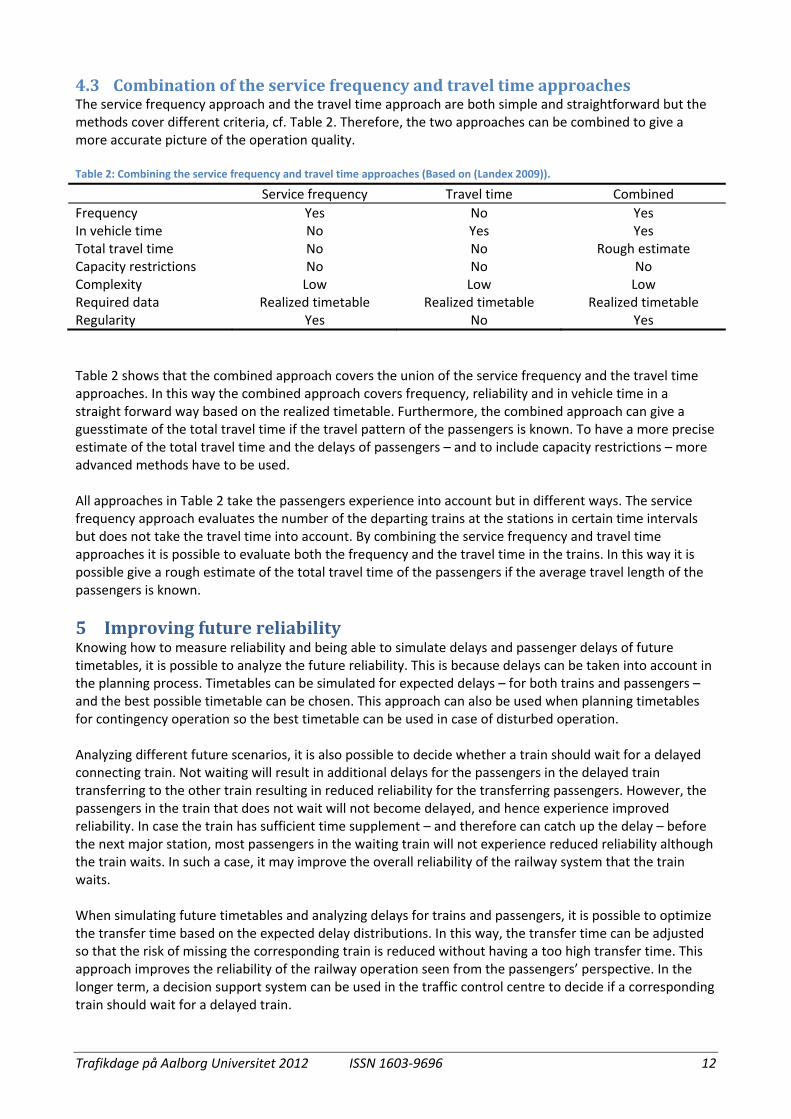
4.3 CombinationoftheservicefrequencyandtraveltimeapproachesThe service frequency approach and the travel time approach are both simple and straightforward but the methods cover different criteria, cf. Table 2. Therefore, the two approaches can be combined to give a more accurate picture of the operation quality. Table 2: Combining the service frequency and travel time approaches (Based on (Landex 2009)).
Table 2 shows that the combined approach covers the union of the service frequency and the travel time approaches. In this way the combined approach covers frequency, reliability and in vehicle time in a straight forward way based on the realized timetable. Furthermore, the combined approach can give a guesstimate of the total travel time if the travel pattern of the passengers is known. To have a more precise estimate of the total travel time and the delays of passengers – and to include capacity restrictions – more advanced methods have to be used. All approaches in Table 2 take the passengers experience into account but in different ways. The service frequency approach evaluates the number of the departing trains at the stations in certain time intervals but does not take the travel time into account. By combining the service frequency and travel time approaches it is possible to evaluate both the frequency and the travel time in the trains. In this way it is possible give a rough estimate of the total travel time of the passengers if the average travel length of the passengers is known.
5 ImprovingfuturereliabilityKnowing how to measure reliability and being able to simulate delays and passenger delays of future timetables, it is possible to analyze the future reliability. This is because delays can be taken into account in the planning process. Timetables can be simulated for expected delays – for both trains and passengers – and the best possible timetable can be chosen. This approach can also be used when planning timetables for contingency operation so the best timetable can be used in case of disturbed operation. Analyzing different future scenarios, it is also possible to decide whether a train should wait for a delayed connecting train. Not waiting will result in additional delays for the passengers in the delayed train transferring to the other train resulting in reduced reliability for the transferring passengers. However, the passengers in the train that does not wait will not become delayed, and hence experience improved reliability. In case the train has sufficient time supplement – and therefore can catch up the delay – before the next major station, most passengers in the waiting train will not experience reduced reliability although the train waits. In such a case, it may improve the overall reliability of the railway system that the train waits. When simulating future timetables and analyzing delays for trains and passengers, it is possible to optimize the transfer time based on the expected delay distributions. In this way, the transfer time can be adjusted so that the risk of missing the corresponding train is reduced without having a too high transfer time. This approach improves the reliability of the railway operation seen from the passengers’ perspective. In the longer term, a decision support system can be used in the traffic control centre to decide if a corresponding train should wait for a delayed train.
Service frequency Travel time Combined
Frequency Yes No Yes In vehicle time No Yes Yes Total travel time No No Rough estimate Capacity restrictions No No No Complexity Low Low Low Required data Realized timetable Realized timetable Realized timetable Regularity Yes No Yes

Trafikdage på Aalborg Universitet 2012 ISSN 1603‐9696 13
If a timetable has a high amount of timetable supplement, it is easier to achieve high reliability in the operation. However, in the case of no disturbances in the operation, the passengers will spend longer time travelling than necessary: the passengers experience extended travel time. From the passengers’ viewpoint, an extended travel time is better than a delay as it is possible to plan in relation to a scheduled delay. Therefore, socioeconomic calculations generally have a higher value for unplanned delays than for the travel time (including scheduled delays) 9. Being able to simulate passenger delays of future timetables, and knowing the socioeconomic values of time for scheduled and unscheduled delays, it is possible to estimate the best level of timetable supplement in the timetable. Figure 9 shows the idealized socioeconomic utility (with a given set of parameters) depending on the timetable supplement, and thereby implicitly the running time and (expected) delayed time.
Figure 9: Socioeconomic utility of a given timetable (for an idealized situation) depending on the amount of timetable supplement (Landex 2008).
This method has been used for preliminary analyses of the Danish railway line from Ringsted to Nykøbing Falster. Here, Thorhauge (2010) demonstrated that the optimum timetable supplements for different timetable scenarios were 7‐8% while the current timetable supplement was 12.6‐12.7% on average.
6 ConclusionsThis article defines reliability as the continuity of correct service that can be divided into the two closely related concepts regularity and punctuality. This is followed by improved methods to measure reliability of railway operation for both trains and passengers for conventional as well as high‐frequent operation. These improved methods are enabled by the development of simulation models and the possibility of combining these simulation models with route choice models. To achieve the best results with the new more sophisticated methods, more data and model calibration is required. Using the measurements on realized as well as simulated railway operation can locate reliability problems to be dealt with and thereby improve the service. This can be done both for normal and contingency operation. The reliability can be improved by including more supplements in the timetable increasing the travel time. However, there is a tradeoff between reliability and the travel time. Using simulation and the presented reliability measures, the optimal timetable supplements can be found based on a socio‐economic analysis.
9 In Denmark, an unplanned delay is valued twice as much as travel time (including scheduled delays) (Danish Ministry of Transport 2006).
Socioeconomic optimumof timetable supplement
Timetable supplement [minutes]
Soc
ioe
cono
mic
util
ity [
€]

Trafikdage på Aalborg Universitet 2012 ISSN 1603‐9696 14
7 ReferencesAvizienis, A., Laprie, J. & Randell, B. 2001, “Fundamental Concepts of Dependability”, Computer and Information Science, vol. 1145, pp. 7‐12. Barber, F., Abril, M., Salido, M.Á., Ingolotti, L.P., Tormos, P. & Lova, A. 2007, Survey of automated Systems for Railway Management, Department of Computer Systems and Computation, Technical University of Valencia. Berger, A., Hoffmann, R., Lorenz, U. & Stiller, S. 2011, Online railway delay management: Hardness, simulation and computation, Simulation, 88(7), pp. 616‐629. Bush, R. 2007, “Does Every Trip Need to Be On Time? Multimodal Scheduling Performance Parameters with an Application to Amtrak Service in North Carolina”, in Proceedings of 86th Annual Meeting at Transport Research Board, Transportation Research Board, Washington D.C., USA. Daamen, W., Goverde, R.M.P. & Hansen, I.A. 2007, “Non‐discriminatory Automatic and Distinct Registration of Primary and Secondary Train Delays”, in Proceedings of the 2nd International Seminar on Railway Operations Modelling and Analysis, eds. I.A. Hansen, A. Radtke, J.P. Pachl & E. Wendler, International Association of Railway Operations Research, Hannover, Germany. Danish Ministry of Transport. 2006, Manual concerning socio‐economic analysis – applied methodology in the transport sector (Nøgletalskatalog – til brug for samfundsøkonomiske analyser på transportområdet), 4th edn, Danish Ministry of Transport, Denmark. (in Danish) D’Ariano, A. 2008, Improving Real‐Tim Train Dispatching: Models, Algorithms and Applications, Delft University of Technology. European Committee for Standardization 2002, Transport – Logistics and services – Public passenger transport – Service quality definition, targeting and measurement (EN 13816), Danish Standards Association, Charlottenlund, Denmark. de Fabris, S., Longo, G. & Medeossi, G. 2008, “Automated analysis of train event recorder data to improve micro‐simulation models”, in Proceedings of the 11th International Conference on Computers in Railways, eds. J. Allan, E. Arias, C.A. Brebbia, et al, WITpress, pp 575. Jespersen‐Groth, J., Potthoff, D., Clausen, J., Huisman, D., Kroon, L.G., Maroti, G. & Nielsen, M.N. 2007, Disruption Management in Passenger Railway Transportation, Informatics and Mathematical Modelling, Technical University of Denmark. Hoyle, D. 1994, ISO9000 Quality Systems Handbook, 2nd edn, Butterworth‐Heinemann Ltd, Oxford, Great Britain. Jacobs, J. 2008, “Rescheduling”, in Railway Timetable & Traffic, eds. I.A. Hansen & J. Pachl, 1st edn, Eurail Press, pp 182‐191. Kaas, A.H. & Jacobsen, E.M. 2008, “Analysing the Metro Cityring in Copenhagen”, Proceedings of the 11th International Conference on Computers in Railways, eds. J. Allan, E. Arias, C.A. Brebbia, et al, WITpress, pp. 45. Kaas, A.H., Jacobsen, E.M. & Lund, K.H. 2008, “The Cityring ‐ traffic analyses (Cityringen, trafikale analyser)”, in Proceedings of the Annual Transport Conference at Aalborg University, in Danish.
Trafikdage på Aalborg Universitet 2012 ISSN 1603‐9696 15
Kaas, A.H. 2000, “Punctuality model for railways”, in Proceedings of the 7th International Conference on Computers in Railways, eds. J. Allan, R.J. Hill, C.A. Brebbia, G. Sciutto, S. Sone, WITpress, pp. 853. Kaas, A.H. 1998, Methods to calculate capacity of railways (Metoder til beregning af jernbanekapacitet), Technical University of Denmark, in Danish. Koutsopoulos, H.N. & Wang, Z. 2007, “Simulation of Urban Rail Operations: Application Framework”, Journal of the Transportation Research Board, vol. 2006, pp. 84‐91. Landex, A. 2009 “Examination of Operation Quality for High‐frequent Railway Operation”, in Proceedings of the 3rd International Seminar on Railway Operations Research, IAROR, Switzerland. Landex, A. 2008 Methods to estimate railway capacity and passenger delays, Technical University of Denmark, Department of Transport. Landex, A., Kaas, A.H. & Nielsen, O.A. 2007, “Punctuality of Railways (Opgørelse af regularitet på jernbaner)”, Proceedings of the Annual Transport Conference at Aalborg University, in Danish. Landex, A. & Nielsen, O.A. 2006, "Modelling expected train passenger delays on large scale railway networks", Proceedings of the 7th World Congress on Railway Research, UIC, Canada. Landex, A. & Nielsen, O.A. 2006, “Simulation of passenger delays in railway networks (Simulering af passagerforsinkelser på jernbaner)”, in Proceedings of the Annual Transport Conference at Aalborg University, eds. L.G. Hansen, L.D. Nielsen, O.A. Nielsen & T. Hels, in Danish. Martin, U. 2008, “Performance Evaluation” in Railway Timetable & Traffic, eds. I.A. Hansen & J. Pachl, 1st edn, Eurail Press, pp. 192‐208. NEA 2003, BOB Railway Case ‐ Benchmarking Passenger Transport in Railways, NEA Transport research and training, Rijswijk, The Netherlands. Nash, A. & Huerlimann, D. 2004, “Railroad simulation using OpenTrack”, in Proceedings of the 9th International Conference on Computers in Railways, eds. J. Allan, C.A. Brebbia, R.J. Hill, G. Sciutto & S. Sone, WITpress, pp 45. Nederlanse Spoorwegen 2001, De Koppeling, nr. 1619, Nederlandse Spoorwegen, Utrecht, The Netherlands, in Dutch. Nie, L. & Hansen, I.A. 2005, “System analysis of train operations and track occupancy at railway stations”, European Journal of Transport and Infrastructure Research, vol. 5, no. 1, pp. 31‐54. Olsson, N.O.E. & Haugland, H. 2004, “Influencing factors on train punctuality ‐ results from some Norwegian studies”, Transport Policy, vol. 11, no. 4, pp. 387‐397. Oort, N. van & Nes, R. van 2010, Impact of Rail Terminal Design on Transit Service Reliability, Journal of Transportation Research Board, vol. 2146, pp. 109‐118. Oort, N. van & Nes, R. van. 2005, “Service Regularity Analysis for Urban Transit Network Design”, in Proceedings of the 10th International Conference on Computer‐Aided Scheduling of Public Transport. Radtke, A. & Bendfeldt, J. 2001, “Handling of railway operation problems with RailSys”, in Proceedings of the 5th World Congress on Rail Research, Cologne, Germany

Trafikdage på Aalborg Universitet 2012 ISSN 1603‐9696 16
Seest, E., Nielsen, O.A. & Frederiksen, R.D. 2005, “Calculating passenger punctuality in the Copenhagen suburban network (Opgørelse af passagerregularitet i S‐tog)”, in Proceedings of the Annual Transport Conference at Aalborg University, in Danish. Siefer, T. 2008, “Simulation”, in Railway Timetable & Traffic, eds. I.A. Hansen & J. Pachl, 1st edn, Eurail Press, Hamburg, Germany, pp. 155‐169. Siefer, T. & Radtke, A. 2005, “Railway‐Simulation Key for Better Operation and Optimal Use of Infrastructure”, in Proceedings of the 1st International Seminar on Railway Operations Modelling and Analysis, eds. I.A. Hansen, F.M. Dekking, R.M.P. Goverde, B. Hindergott & L.E. Meester, International Association of Railway Operations Research, Delft, The Netherlands. Thorhauge, M. 2010, “Optimization of timetable supplement from a passenger based socio‐economic point of view”, in Proceedings of the Annual Transport Conference at Aalborg University, Trafikdage, Aalborg, Denmark. Toledo, T., Koutsopoulos, H.N. 2004, “Statistical validation of traffic simulation models”, Journal of the Transportation Research Board, vol. 1876, no. 29, pp. 142‐150. Tromp, J.P.M. 2004, “Validation of a train simulation model with train detection data”, in Proceedings of the 9th International Conference on Computers in Railways, eds. J. Allan, C.A. Brebbia, R.J. Hill, G. Sciutto & S. Sone, WITpress, pp. 583. Vromans, M.J.C.M., Dekker, R. Kroon, L.G. 2006, “Reliability and heterogeneity of railway services”, European Journal of Operational Research, vol. 172, no. 2, pp. 647‐665. Vromans, M.J.C.M. 2005, Reliability of Railway Systems, Netherlands TRAIL Research School. Weits, E.A.G. 2000, “Railway Capacity and Timetable Complexity”, in Proceedings of the 7th International Workshop on Project Management and Scheduling, Osnabrück, Germany. Yuan, J. 2006, Stochastic Modelling of Train Delays and Delay Propagation in Stations, Netherlands TRAIL Research School.