relieving congestion keeping the nation’s arteries and travel ways unclogged ~anyesha mookherjee...
TRANSCRIPT

RELIEVING CONGESTION
Keeping the Nation’s Arteries and Travel Ways Unclogged
~Anyesha Mookherjee
Traffic Engineer, URS Corp

The Text Book Definition
“Traffic Engineering is that phase of transportation engineering which deals with the planning, geometric design and traffic operations of roads, streets, and highways, their networks, terminals, abutting lands, and relationships with other modes of transportation.”
Traffic Engineering by Roess, Prassas and McShane

What it Actually Means
Provide transportation from point A to point B that is: Safe Fast Comfortable Convenient Economical Environmentally Compatible

Congestion
Congestion results when traffic demand approaches or exceeds the available capacity of the systemCongestion on roadways leads to
Increased frequency of crashes
Increased average trip times
Increased fuel consumption
Increased green house gas emissions
Leading Causes
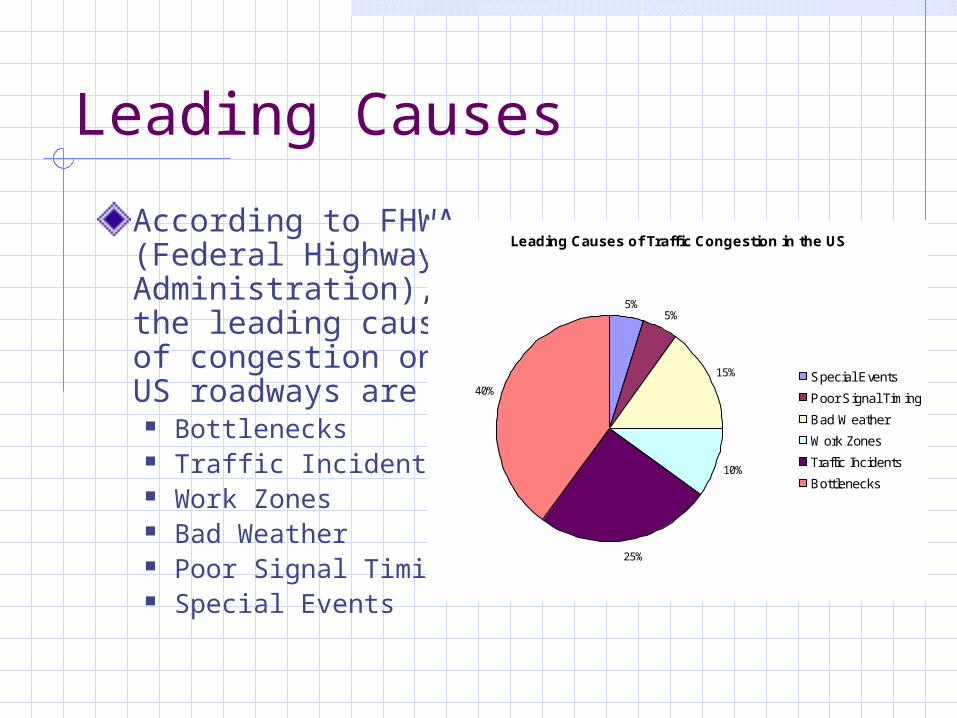
According to FHWA (Federal Highway Administration), the leading causes of congestion on US roadways are
Bottlenecks Traffic Incidents Work Zones Bad Weather Poor Signal Timing Special Events
Leading Causes of Traffic Congestion in the US
5%5%
15%
10%
25%
40%Special Events
Poor Signal Timing
Bad Weather
Work Zones
Traffic Incidents
Bottlenecks

The Congestion Relief Toolbox
Improve Service on Existing Roadways
Add Capacity
Electronic Toll Collection and Pricing
Better Work Zones
Travel Options
Traveler Information

Improving Service on Existing Roadways
Access ManagementTraffic Incident ManagementTraffic Signal Timing

Access Management
At urban intersections separate out the critical turning volumes and provide exclusive turn lanes
Major street with shared left through movements causes through vehicles to queue behind left turning vehicles
Major street with dedicated left turn lanes movements removes left turning vehicles from the paths of through vehicles

Access Management
Channelize heavy/critical turning movements
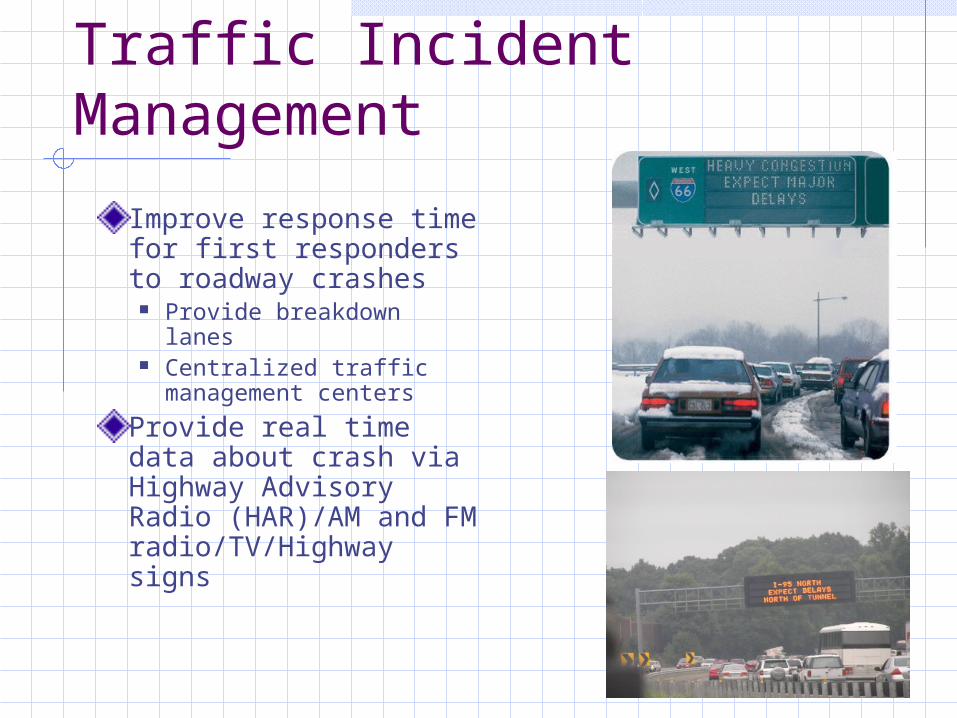
Traffic Incident Management
Improve response time for first responders to roadway crashes
Provide breakdown lanes
Centralized traffic management centers
Provide real time data about crash via Highway Advisory Radio (HAR)/AM and FM radio/TV/Highway signs
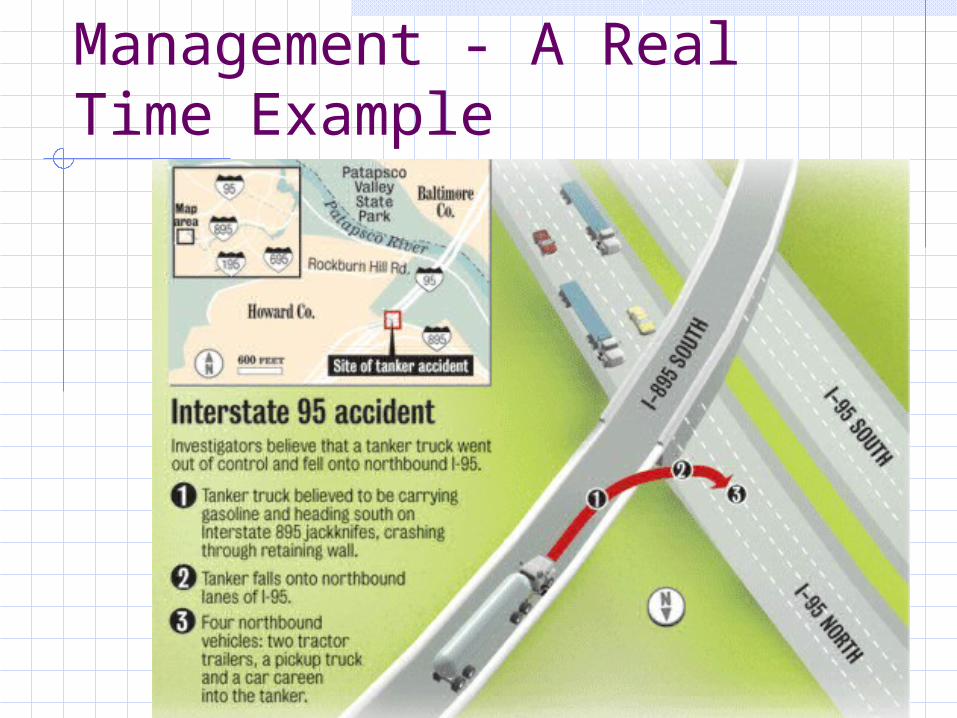
Traffic Incident Management - A Real Time Example

Traffic Incident Management-A Real Time ExampleTimeline of EventsJanuary 13, 2004 - Tuesday2:45 p.m. Tanker truck explodes on I–95, closing interstate in both directions2:46 p.m. Patroller alerts Maryland State Highway Administration (MSHA) of incident2:47 p.m. Patroller begins turning vehicles around at the scene. 2:54 p.m. Electronic message signs changed on I–95 to inform motorists that the interstate near Baltimore is closed. Traffic redirected to alternate routes3:06 p.m. First fire department arrives on the scene 3:45 p.m. The majority of the fire is under control7:00 p.m. Two of the four lanes of southbound I–95 reopen. 11:30 p.m. All lanes of I–895 reopen
January 14, 2004 - Wednesday1:30 a.m. Fire crews wash down roadway2:15 a.m. Southbound lanes of I–95 reopen3:35 a.m. Northbound lanes of I–95 reopen
Two firefighters work to control the flames on a tractor trailer that was caught in the
explosion of the fuel tanker
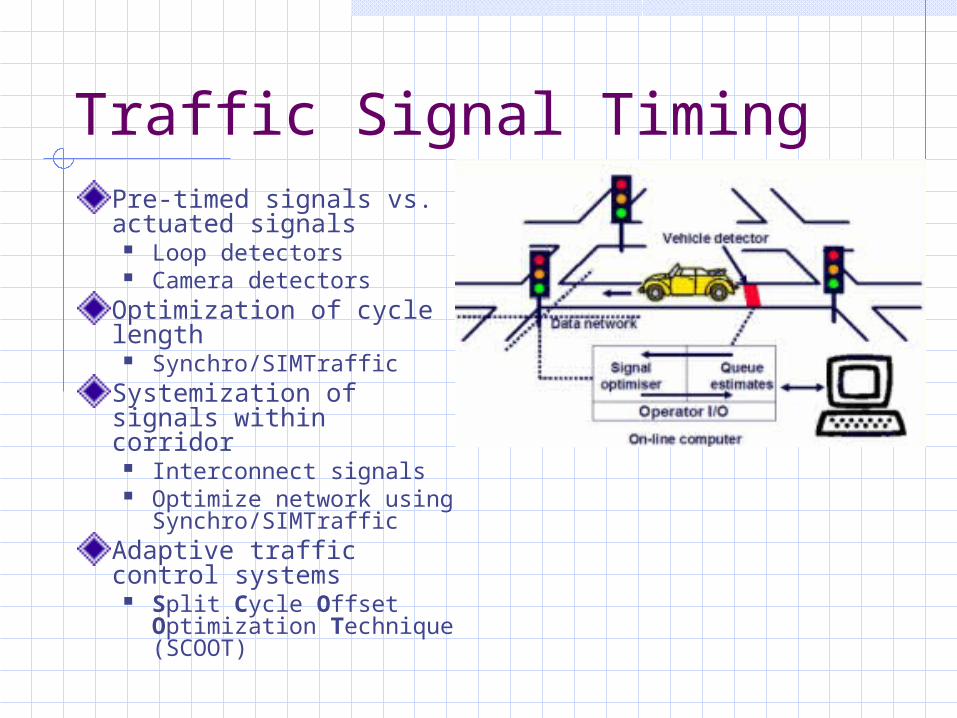
Traffic Signal TimingPre-timed signals vs. actuated signals
Loop detectors Camera detectors
Optimization of cycle length
Synchro/SIMTrafficSystemization of signals within corridor
Interconnect signals Optimize network using
Synchro/SIMTrafficAdaptive traffic control systems
Split Cycle Offset Optimization Technique (SCOOT)

Add Capacity
Construction of additional traffic carrying lanesAdditional freight rail and light rail serviceIncorporate pedestrian paths and trails
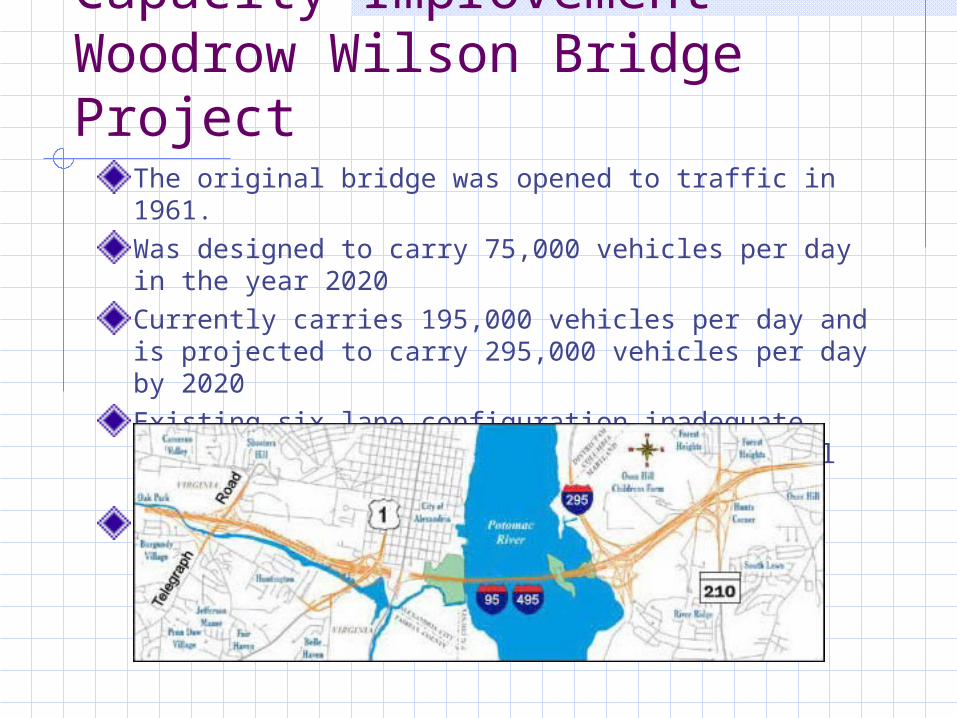
Capacity Improvement – Woodrow Wilson Bridge Project
The original bridge was opened to traffic in 1961.Was designed to carry 75,000 vehicles per day in the year 2020Currently carries 195,000 vehicles per day and is projected to carry 295,000 vehicles per day by 2020Existing six lane configuration inadequate, causes seven hours of congestion and several mile long backups daily The drawbridge opened 260 times a year

Woodrow Wilson Bridge Project
New span will have Ten lanes of traffic to carry I-495 traffic Two lanes for future rail use in the median 20 feet higher, will only open 65 times a year after
completion
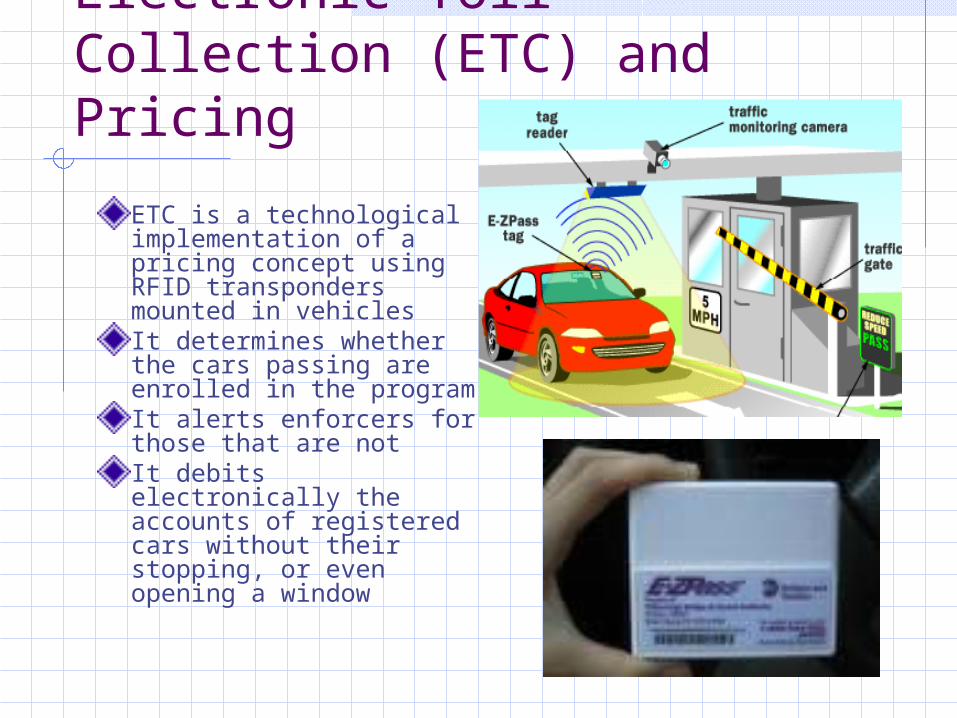
Electronic Toll Collection (ETC) and Pricing
ETC is a technological implementation of a pricing concept using RFID transponders mounted in vehiclesIt determines whether the cars passing are enrolled in the programIt alerts enforcers for those that are notIt debits electronically the accounts of registered cars without their stopping, or even opening a window

Electronic Toll Collection (ETC) and Pricing
High Occupancy Toll (HOT) lanes: On HOT lanes, low-occupancy vehicles are charged a toll, while High-Occupancy Vehicles (HOVs) are allowed to use the lanes for free or at a discounted toll rateVariable Pricing: Pricing on toll
facilities are varied by time of day with the intention of encouraging some travelers to:
use the roadway during less congested periods shift to another mode of transportation change routes

Better Work Zones
Plan aheadUse available traffic models to predict effect of closing traffic lanes on queuesRestrict lane closures to off peak and weekend hoursInvolve the community. Get the word out

Travel Options
Travel Demand Management Special Events Traffic Management

Travel Demand Management
Evaluate the effect of new development on existing roadway systemPlace the onus of mitigating congestion caused by new traffic on developerProject traffic demand based on land use and plan accordinglyProvide traveler with options:
Tax incentive for transit Park and ride Share-a-ride
Transportation Demand
Transportation Facilities
Land Use

Parades, games, seasonal tourism can place a sudden burden on the roadway system
Easy to plan ahead as event is not of an unexpected nature
Community and police involvement essential
Detour traffic through alternate routes
Establish a system of one-way routes
Establish more parking
Special Events Management

Traveler Information
Creation of 511 for traffic, similar to 911 for emergencyDynamic Message SignsReal Time Travel Time Information Web based Radio based TV based

Real Time Travel Time Information
Screenshot of traffic conditions in area highways on September 18th 2007 at 5:00 PM from www.traffic.com
In a Nutshell…
No one strategy can solve the
congestion problem

Questions Anyone?
Useful websites: www.fhwa.dot.gov www.islandnet.com/~litman www.wilsonbridge.com www.chart.state.md.us/ www.trafficware.com/articles.html
Feel free to contact me at [email protected]