relocation assistance - shrm online talent mobility needs were prepared to begin loosening their...
TRANSCRIPT

U.S. Domestic Transferred Employees
Relocation Assistance:
Sponsored By
A comprehensive picture of the programs facilitating employee mobility in the United States.
ExEcutivE DigEst

Copyright©2013 Worldwide ERC®
The Worldwide ERC® Relocation Assistance: U.S. Domestic Transferred Employee Report is intellectual property owned by Worldwide ERC® and protected by copyright law. Purchasing the report creates a one-time license to store, print and use the report for one individual user. No part of the report may be reproduced, stored in an information retrieval system, distributed or transmitted in any form or by any means, electronic, mechanical, photocopying, recording, or otherwise, to any other person or entity without Worldwide ERC®’s prior written permission.

Letter from the President and CEO
The “Relocation Assistance: U.S. Domestic Transferred Employees” survey is conducted every
four years. During the time that data was being collected for this report, the U.S. economy
seemed to be slowly improving. Housing markets in many regions were beginning to recover,
consumer confidence was slowly rising, and Worldwide ERC® members were cautiously optimistic
that their transfer volumes would be increasing.
In light of the improving economy, there were signs that companies seeking to fulfill their U.S.
domestic talent mobility needs were prepared to begin loosening their purse strings, and roll back
a few of the reductions in relocation assistance policies. For example, in this report, you will see an
18 percentage point increase in the provision of temporary living to the family in the new location,
and an increase in organizations paying for in-transit storage costs. The findings also show that
many of the techniques companies employed to make their policies more customizable to business
and transferee needs remain popular, and are likely to continue even in an improved economy.
At the time of this writing, the U.S. government has entered sequestration, and pundits are specu-
lating as to the impact the mandatory government spending cuts will have on the economy; most
likely, there will be some level of continued uncertainty and caution among business leaders, which
will be reflected in the next set of U.S. talent mobility trends.
Worldwide ERC® thanks the many respondents to this survey for their time and feedback. It is
through the generous gift of industry professionals’ participation that we are able to focus strongly
on key areas of interest to our members. We encourage your feedback to this report, and hope that
if you need additional information you will contact us to assist you.
Cheers,
Peggy Smith, SCRP, SGMS
President and Chief Executive Officer
Worldwide ERC®
Relocation assistance: U.s. Domestic tRansfeRReD employees 1

Relocation assistance: U.s. Domestic tRansfeRReD employees2

Relocation assistance: U.s. Domestic tRansfeRReD employees 3
Introduction
When the Relocation Assistance: U.S. Domestic Transferred Employees Survey was last conducted in 2008, the U.S.
economy was in a deep recession. Consumer confidence was low, unemployment was high, and housing markets in many parts of the country were distressed. Organizations’ revenues and profit margins had been severely affected and many were forced to cut back on their operations and reduce costs by downsizing and limiting employee mobility. Two years later, the Worldwide ERC® 2010 Transfer Volume & Cost Survey revealed that the average number of current employees relocated by Worldwide ERC® member companies in 2009 had dropped 22 percent compared to the previous year. Organizations also reported that employees were extremely unwilling to relocate due to the depressed housing market and heightened uncer-tainty resulting from the recession.
The U.S. economy is gradually recovering after a challenging four years. The November 2012 Jobs Report (Bureau of Labor Statistics) reported an unemployment rate of 7.7 percent, which is the lowest rate reported since late 2008. As a result of the uptick in the economy and the gradually improving housing market, businesses are once again increasing operations and consequently relo-cating more employees. Worldwide ERC® member companies will have moved an average of 247 current employees by the end of 2012 an increase of 7 percent over 2011.
Organizations are continuing to exercise discipline around costs and have cut back on assistance provided to their transferees; however, as a result of the real estate crisis, many companies have revised their policies to assist employees with the losses they incur when selling their homes.
This report examines how organizations are responding to the challenges of this slowly recovering economy and grappling with providing adequate mobility assistance to employees while keeping a close watch on their costs. The study provides an in-depth analysis of the current trends in the relocation assistance provided to current employees transferred domestically within the United States.
We would like to express our appreciation to the 154 members who took the time to participate in this project and graciously contributed to the survey. We would also like to extend our gratitude to the sponsor of this survey, Graebel Relocation Services Worldwide.
This Executive Digest comprises highlights of the main report. The complete report is available on the Worldwide ERC® website.

Relocation assistance: U.s. Domestic tRansfeRReD employees4

Relocation assistance: U.s. Domestic tRansfeRReD employees 5
Executive Summary
This comprehensive survey on assistance provided to relocated current employees was conducted in October 2012. Of the 843 orga-
nizations invited to participate in the survey, 154 responded resulting in an 18 percent response rate.
Respondents transferred a total of 35,420 employees in 2012, averaging 230 transferees per organization.
TRANSFEREE DEMOGRAPHICSThe typical transferee is between 36 to 40 years of age with an annual income of between $90,000 and $130,000. These numbers are very similar to those reported in 2008. Employers indicate that on average just over half (55 percent) of the employees they will transfer by the end of 2012 will be first-time transferees and nearly half (45 percent) of today’s transferees are relocated as a result of a promotion rather than a lateral move.
POLICY DELIVERYOnly 16 percent of organizations report having just one policy for all transferees; 84 percent use multiple and/or tiered policies. Additionally, the percentage of organizations with three or more policies has increased from 60 percent in 2008 to 69 percent today. The most often used criterion to differentiate among policies is job or salary level (79 percent) followed by homeowner/renter status (54 percent).
Another approach companies are using to customize their policies is the cafeteria-style or menu-driven policy. Today 16 percent of organiza-tions offer these plans—a decline from 24 percent in 2008.
trend in use of tiered PoliciesPercent of Organizations
90%80%70%60%50%40%30%20%10%
01991 1994 1997 2001 2004 2008 2012
15%21%
34%
52%
67%
73%
84%
Relocation assistance: U.s. Domestic tRansfeRReD employees6
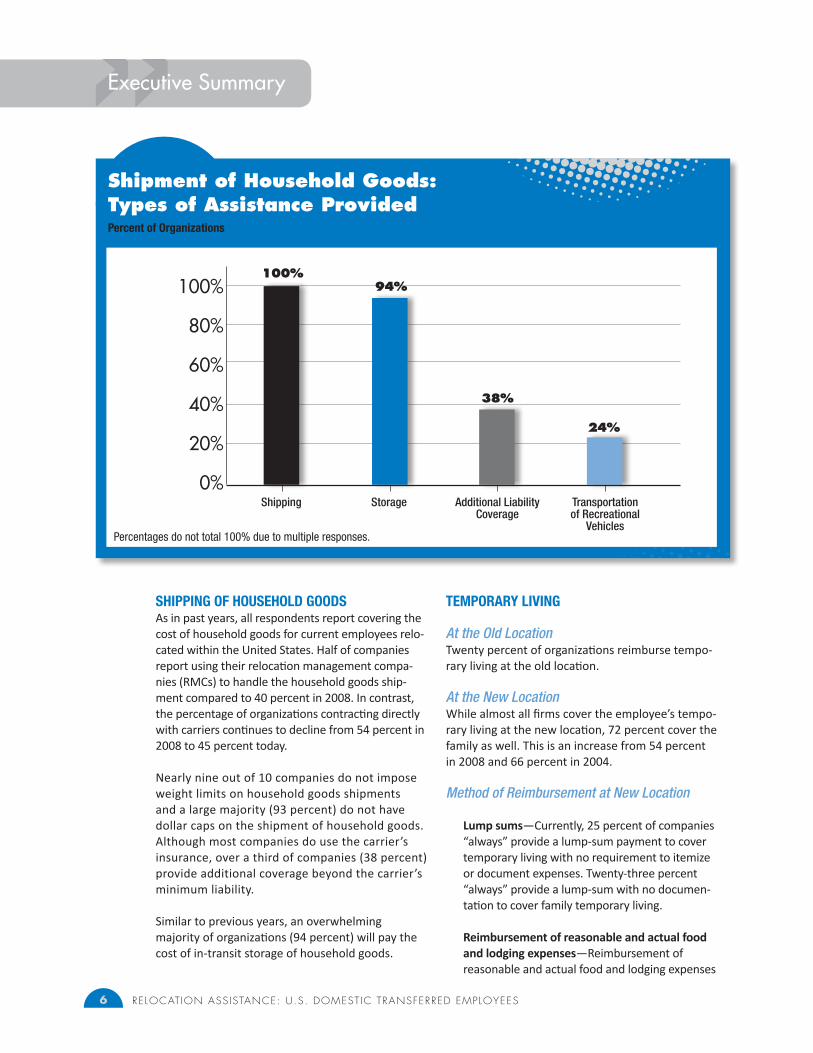
SHIPPING OF HOUSEHOLD GOODSAs in past years, all respondents report covering the cost of household goods for current employees relo-cated within the United States. Half of companies report using their relocation management compa-nies (RMCs) to handle the household goods ship-ment compared to 40 percent in 2008. In contrast, the percentage of organizations contracting directly with carriers continues to decline from 54 percent in 2008 to 45 percent today.
Nearly nine out of 10 companies do not impose weight limits on household goods shipments and a large majority (93 percent) do not have dollar caps on the shipment of household goods. Although most companies do use the carrier’s insurance, over a third of companies (38 percent) provide additional coverage beyond the carrier’s minimum liability.
Similar to previous years, an overwhelming majority of organizations (94 percent) will pay the cost of in-transit storage of household goods.
TEMPORARY LIVING
At the Old Location Twenty percent of organizations reimburse tempo-rary living at the old location.
At the New Location While almost all firms cover the employee’s tempo-rary living at the new location, 72 percent cover the family as well. This is an increase from 54 percent in 2008 and 66 percent in 2004.
Method of Reimbursement at New Location
Lump sums—Currently, 25 percent of companies “always” provide a lump-sum payment to cover temporary living with no requirement to itemize or document expenses. Twenty-three percent “always” provide a lump-sum with no documen-tation to cover family temporary living.
Reimbursement of reasonable and actual food and lodging expenses—Reimbursement of reasonable and actual food and lodging expenses
Executive Summary
shipment of Household goods: types of Assistance ProvidedPercent of Organizations
100%
80%
60%
40%
20%
0%Shipping Storage Additional Liability
CoverageTransportation of Recreational
Vehicles
100%94%
38%
24%
Percentages do not total 100% due to multiple responses.

Relocation assistance: U.s. Domestic tRansfeRReD employees 7
is not prevalent today because it is expensive and companies are still employing cost measures these days. Currently only 18 percent of compa-nies provide full reimbursement of reasonable and actual lodging expenses for the employee.
Per diems—Most companies’ per diems provide full reimbursement for lodging but restrict meals to a daily allowance. Today, 9 percent use this approach to cover the employee and the families’ expenses.
Time Limits Almost all companies place an overall time limit on the temporary living assistance provided in the new location for the employee and family.
HOMEFINDING TRIPSNearly nine out of 10 organizations (86 percent) reimburse both homeowner and renter transferees for homefinding trips. Only 3 percent of compa-
nies limit the coverage to homeowners only and approximately 11 percent of companies choose not to reimburse this cost.
HomeownersSlightly more than two-thirds of employers that reimburse homefinding expenses for homeowners cover both the employee and spouse. An additional 23 percent of these organizations also pay expenses for the employee’s dependent children to accom-pany the employee on the househunting trip.
RentersOnly 65 percent of companies cover homefinding trips for the renting employee and spouse or partner. This is a drop from 98 percent of organiza-tions in 2008 and most likely a cost-saving measure necessitated by a stagnated economy. Just over one-fifth of organizations (21 percent) also cover the expenses for dependent children to join the employee and spouse on the trip.
Reimbursement for Homefinding trips Percent of Organizations
Yes, for homeowners only
Do not provide reimbursement
Yes, for both homeowners and renters
86%
11%
3%

Relocation assistance: U.s. Domestic tRansfeRReD employees8
PURCHASE CLOSING COSTSThe percentage of firms offering transferees assis-tance with purchase closing costs is 90 percent. Although payment of closing costs is a common benefit today, the provision to all transferees is not. Today, nearly one-fourth (23 percent) of companies provide the assistance to all transferees, up slightly from 19 percent in 2008 but still down 3 percentage points from 2004.
Employers most often limit eligibility for purchase closing costs assistance to those who are home-owners.
MISCELLANEOUS EXPENSE ALLOWANCEAlmost all organizations (92 percent) provide their transferees a miscellaneous allowance for inci-dental expenses that are specifically not covered by other reimbursements. A strong majority of these companies provide the allowance with no require-ment to itemize or document expenses and in turn, save time and administrative costs.
Slightly more than 60 percent of companies vary the amount of the miscellaneous allowance based on specific criteria—31 percent of companies vary the allowance by the employee’s homeowner vs. renter status and 30 percent vary the payment by some “other” criteria, often the employee’s job level.
COST-OF-LIVING ASSISTANCEToday just shy of one-third (32 percent) of organi-zations offer a cost-of-living allowance (COLA) to compensate employees for higher living/housing costs in the new location. As has been the case in previous years, the majority of employers (78 percent) are choosing to assess the difference in costs between the old and new locations in their entirety versus focusing solely on housing costs. One-third of employers offering a COLA via formal policy or on a case-by-case basis offer the allowance in all cities with costs higher than the old location, regardless of the amount of the cost
difference—up from 22 percent in 2008. Another 28 percent limit this provision to specific cities, which is down slightly from the 32 percent cited in 2008. Results from this survey indicate a slight drop in the percentage of employers restricting the provision of allowances to those situations in which costs in the new location are a certain percentage above those in the old location. Today, 39 percent of organiza-tions are using this approach to determine eligibility for allowances.
LOSS-ON-SALE ASSISTANCEAs a result of the slump in the real estate market, there has been a significant increase in the percentage of companies offering loss-on-sale assistance to their employees either through their formal policy (49 percent) or on a case-by-case basis (14 percent). In 2004, only 54 percent of the companies chose to assist transferees with a loss-on-sale situation (formal policy and case-by-case). This number increased substantially to 64 percent in 2008 and today nearly the same number (63 percent) offer this provision.
Just over two-thirds (67 percent) of companies offer this assistance via formal policy to all trans-ferees in all locations.
Nearly three out of 10 companies (28 percent) providing formal loss-on-sale assistance consider capital improvements when determining the employee’s investment in the home. Additionally, 15 percent of organizations consider the deprecia-tion on the home when determining the loss-on-sale amount.
DUPLICATE HOUSING ASSISTANCENearly 60 percent of respondents report that their companies reimburse duplicate housing expenses in instances when the employee purchases a home in the new location prior to selling the home in the old location. Most organizations impose a time limit on the assistance.
Executive Summary

Relocation assistance: U.s. Domestic tRansfeRReD employees 9
70%
60%
50%
40%
30%
20%
10%0
1989 1991 1993 1996 2000 2004 2008 2012
40%46%
53%59%
42%
33%
46%49%
Prevalence of Loss-on-sale Assistance Over time (Formal Policy)Percent of Organizations
THIRD PARTY AND CORPORATE-BASED PLANS
Types of Properties Excluded from Homesale ProgramsAs there are significant costs associated with home buy-out programs, it has been common practice for organizations to exclude certain types of properties from their homesale programs. The homes that typically are excluded have extreme marketability issues or represent a legal liability or complication for the company. As these properties are harder to sell, they are more likely to enter the company’s inventory, thus increasing the organization’s program costs. The strong majority of organiza-tions with third party or corporate-based programs exclude mobile homes (94 percent) and co-ops (88 percent) from their homesale programs. Nearly 60 percent of employers exclude duplexes and one-fifth exclude homes with excessive acreage.
Type of Property Percent of Organizations
Mobile Homes 94%
Co-ops 88%
Duplexes 56%
Excessive Acreage (more than 5 acres) 23%
Other* 48%
Percentages do not total 100% due to multiple responses.
*Other responses include: houseboats, farms, homes with synthetic stucco or Chinese drywall, homes used partially for commercial purposes, historic homes, short sales or foreclosures, and homes of high value
types of Properties Excluded from Homesale Program

Relocation assistance: U.s. Domestic tRansfeRReD employees10
Negative Equity SituationsToday, nearly three-fourths of companies will accept negative equity homes into their home-sale programs either on a case-by-case basis or as part of a formal policy. Of the respondents that do accept these homes as part of a formal policy, most (81 percent) require the employee to pay-off the balance at closing with no assistance from the company.
Rejection of Buyout OfferToday 60 percent of employers with either third party or corporate-based homesale programs will assist employees with home selling costs in instances when the employee rejects the company/third party home buy-out offer. All of these employers report assisting their transferees with normal selling closing costs and a large majority assist with broker’s commissions.
Home Marketing Assistance and Bonus ProgramsThe provision of home marketing assistance has shown an overall upward trend throughout the years. Today, 75 percent of respondents with homesale assistance programs always provide a formal home marketing assistance program. Additionally, 11 percent of employers provide a formal home marketing assistance program only to certain employees. Predominantly, the provision of assistance is based on the employee’s job level. The remaining respondents do not offer home marketing assistance at all.
In addition, over two-thirds of employers with third-party or corporate-based homesale programs report offering cash incentives to employees who find a buyer for their home during the self-marketing period.
Executive Summary
Yes, but only for certain employees
Not offered
Yes, always offered75%
14%
11%
Provision of Formal Home Marketing AssistancePercent of Organizations
Relocation assistance: U.s. Domestic tRansfeRReD employees 11
Actelion Pharmaceuticals US, Inc. ADP
AIG Air Products and Chemicals, Inc.
Allianz of America Allstate Insurance Company
Altegrity Altera
American Electric Power American Express
Amerigroup Apple
Ashland,Inc AT&T
AutoZone Aviva USA
Ball Corporation Bayer Business and Technology Services
Bentley Systems, Incorporated Blue Cross Blue Shield Of Illinois
Boehringer-Ingelheim BP America
Brown Brothers Harriman Brown-Forman
Bunge Limited C.H. Robinson Worldwide
Capital Group Companies Cargill Incorporated
Cemex. Inc. Chevron
Chipotle CNA
Comcast ConAgra Foods
Corning Incorporated CSC
CSX Transportation Darden Corporation
DELOITTE Denny’s, Inc.
Dept. of Justice - Alcohol, Tobacco, Firearms & Explosives
DHL Express
Eli Lilly and Company EnergySolutions
Enterprise Holdings, Inc. Enterprise Products Company
Epson America, Inc. Erie Indemnity Co
Ernst & Young Exel Inc.
Ferguson Enterprises Inc. Fidelity Investments
FM Global Foot Locker, Inc.
Freeport McMoRan Copper & Gold Gap Inc.
General Mills Getco LLC
GlaxoSmithKline Halliburton
Harris Corporation Herbalife International
Hitachi HTA Hormel Foods Corporation
Huhtamaki Humana,Inc.
List of Participants
Relocation assistance: U.s. Domestic tRansfeRReD employees12
IAP Worldwide Services IBM
IHS Inc. Ingersoll Rand
International Paper JHU/APL
Johns Manville Jones Day
Kelly Services, Inc. Kimberly-Clark Corporation
Koch Business Solutions Kohl’s Department Stores
Kraft Foods Group, Inc. Land O’Lakes
Lend Lease Linde North America
Lockheed Martin Luxottica Retail North America
Marriott International Mayo Clnic
McCormick & Company, Inc. McLane
Meadwestvaco Medtronic, Inc.
MEMC Eletronics Materials, Inc. MFS Investment Management
Micron Technology, Inc. Mohawk Industries
Monsanto National Gypsum Company
Nationwide Nestle Purina PetCare
NewMarket Corporation Nielsen
Orbital Sciences Corporation Pacific Life Insurance Co.
PCAOB Peabody Energy
PG&E Polymer Group, Inc.
Rio Tinto Russell Investments
Safeway Inc. SAIC
Saint-Gobain Corporation Samson Resources Company
SAS Savvis
SC Johnson & Son, Inc. Schneider Electric
SCI LLC / ON Semiconductor Seagate
ServiceMaster ServiceNow, Inc.
Shire Pharmaceuticals Sonoco
Sony Music Entertainment Starbucks Coffee Company
Sterling Jewelers, Inc. Stryker
Tennessee Valley Authority Tesoro Corporation, Inc.
Textron The Brookings Institution
The Coca-Cola Company The Dow Chemical Company
The Hartford The Manitowoc Company
Thermo Fisher Scientific TIC-The Industrial Company
Time Warner Cable Toyota Motor Sales U.S.A., Inc.
Toys”R”Us Transamerica
Travelers Tupperware Brands Corporation
List of Participants

Relocation assistance: U.s. Domestic tRansfeRReD employees 13
Union Bank UPS
Veolia Environnement North America Walgreen Co.
Warner Bros. Entertainment Inc. Wegmans Food Markets, Inc.
Westinghouse Electric Company Whirlpool
WPP Yazaki North Amercia, Inc.
ZS Associates, Inc.

Sponsored By
Worldwide ERC® Headquarters
4401 Wilson Boulevard, Suite 510
Arlington, VA 22203 USA
Phone: +1 703 842 3400
www.WorldwideERC.org