remedial action progress report fourth quarter, 2017
TRANSCRIPT
Remedial Action Progress Report
Fourth Quarter, 2017
Chiquita Holdings - Fuel On Service Station
208 Filbert Street,
Curwensville, Clearfield County, Pennsylvania
PADEP Facility ID # 17-31221
USTIF Claim No.2012-0156
Prepared for:
Chiquita Holdings
Prepared by:
P.O Box 44
Delmont, PA 15626
888-316-0211
January 30th, 2018
Robert Botterman P.G.
Sr. Hydrogeologist

Table of Contents
Remedial Action Progress Report
Fourth Quarter 2017
Chiquita Holdings, Fuel On Service Station
Curwensville, Clearfield County, Pennsylvania
PADEP Facility I.D #17-31221
1.0 Introduction ..............................................................................................................................1
2.0 Quarterly Groundwater Monitoring Activities .........................................................................4
2.1 Static Water Level Measurements ......................................................................................4
2.2 Groundwater Sampling Activities ......................................................................................4
2.3 Purge Water Disposal .........................................................................................................4
3.0 Monitoring Results ...................................................................................................................5
3.1 Groundwater Elevations and Flow Directions ....................................................................5
3.2 Groundwater Analytical Results .........................................................................................5
4.0 Summary ...................................................................................................................................6
5.0 Recommendations ....................................................................................................................7
Figures
Figure 1 - Site Location Map
Figure 2 - Site Plan
Figure 3 - Groundwater Contour Map
Figure 4 - Groundwater Concentration Map
Tables
Table 1 - Groundwater Elevation Data
Table 2 - Historical Groundwater Analytical Data
Appendices
Appendix A - Pace Laboratories, Groundwater Analytical Report
Appendix B - Trend Graphs

Remedial Action Progress ReportFourth Quarter 2017
Chiquita Holdings, Fuel On Service StationPADEP Facility I.D #17-31221
Page 1
1.0 Introduction
The Fuel On Service Station is located at 208 Filbert Street in Curwensville, Clearfield County,
Pennsylvania (Site or Subject Property). A Site Location Map is provided as Figure 1, and a Site
Plan is provided as Figure 2. The Site is located on the western side of Filbert Street,
approximately 2 1/2 blocks to the southwest of the intersection with State Street (S.R. 0879). The
property is approximately rectangular in shape with a small rectangle cut out of the northeast
corner. The Site is currently used as a retail gasoline station and convenience store.
The Fuel On Service Station occupies two parcels: Tax Parcel Nos. 006.1-H10-287-00085 (0.336
acres) and 006.1-H10-278-077.1 (0.4 acres), which total approximately 0.736 acres in area. The
only building on the Site property is a slab-on-grade, brick structure with a flat roof of
approximately 5,500 square feet in area. A 750-square foot canopy is located over two dispenser
islands. Roughly 50% of the property is asphalt or concrete paved roadways and parking areas.
Concrete covers the area surrounding the dispensers and the UST basins.
Four underground storage tanks (USTs) are currently present at the Site. The tanks are located in
two separate tank basins. Three 8,000-gallon USTs containing unleaded gasoline are located in a
common basin located on the south side of the Site building. A single 4,000-gallon kerosene UST
is located in a separate tank basin, located on the northeast corner of the building. The USTs were
reportedly installed (registered) on December 1, 1987.
Soil and groundwater impacts were discovered during the installation of cathodic protection
anodes by George I. Reitz & Sons, Inc. of East Pittsburgh, Pennsylvania and Cribbs & Associates,
Inc. (Cribbs & Associates) (drilling sub-contractor) of Delmont, Pennsylvania on September 25th,
2012. During the anode installation, contamination was observed in the form of strong petroleum
odors and visible petroleum sheens on the augers. The observed impacts were limited to the boring
located east of the UST basin, towards the dispenser island. The other three borings to the north,
west, and south of the UST basin did not exhibit any signs of petroleum impacts.
The Pennsylvania Department of Environmental Protection (PADEP) was informed of the release
on September 25th, 2012. A Notification of Reportable Release Form was prepared by Cribbs &
Associates and submitted to the PADEP on October 8th, 2012. The impacts associated with the
UST system are being addressed under the Title 25–Environmental Protection (25 PA Code),
Chapter 245 (Administration of the Storage Tank and Spill Prevention Program). A Site
Characterization Report (SCR), documenting the site investigation activities since the discovery
of the release, was submitted to the PADEP on February 19th, 2015.
Review of the Veeder-Root automatic tank gauging and mechanical leak detection did not indicate
any discrepancies with inventory control; therefore, the tanks themselves appear to be intact. The
UST system is equipped with double-wall lines and sumps that also indicated no signs of leakage.
With no loss of inventory and the product lined being tight as no product was observed in the
sumps, the exact cause of the release was not determined.

Remedial Action Progress ReportFourth Quarter 2017
Chiquita Holdings, Fuel On Service StationPADEP Facility I.D #17-31221
Page 2
The site characterization investigation was initiated with the installation and sampling of four
monitoring wells (MW-1 through MW-4) on August 27th, 2013. Based on the initial findings, four
vapor points, two off-site monitoring wells and nine soil borings were installed in May 2014. A
monitoring well, a vapor point and four additional soil borings were installed in November 2014
in order to complete the delineation of the impacts in the soil and groundwater. Soil samples were
obtained from the monitoring well borings and soil borings as they were installed. Three
groundwater samples were collected from the monitoring wells, with the exception of MW-7.
Well MW-7 is the most recently installed monitoring well and was only sampled once through the
Fourth Quarter of 2014. Cribbs & Associates submitted an SCR to PADEP in February 2015. The
following conclusions were provided:
A total of thirteen subsurface soil borings (SB-1 through SB-13), seven monitoring wells
(MW-1 through MW-7) and five vapor points (VP-1 through VP-5) were used to
characterize the Site.
The Site lithology is comprised of fill material consisting of silty to clayey rock fragments,
with sand and wood fragments overlaying brown to gray to dark gray silty clay and silty
fine sand with some gravel.
The depth of the soil borings and monitoring well borings ranged from 4 to 12 feet below
ground surface (bgs). Bedrock was not encountered at the site.
Soil samples collected from each of the soil borings and monitoring well borings were
analyzed for the post-March 2008 Pennsylvania Shortlist for Petroleum Hydrocarbons for
Unleaded Gasoline parameters (benzene, cumene, ethylbenzene, methyl-tert-butyl ether
(MTBE), naphthalene, toluene, total xylenes, 1,2,4-trimethylbenzene (1,2,4-TMB) and
1,3,5-trimethylbenzene (1,3,5-TMB).
Soil samples obtained from MW-3 and SB-1/MW-4 indicated concentrations above the
Statewide Health Standards (SHS) Medium-Specific Concentrations (MSCs) for
Residential, Used Aquifer (TDS≤2500)(RU) Soil-to-Groundwater for benzene,
naphthalene, 1,2,4-TMB and 1,3,5-TMB.
Changes to the SHS MSCs published in April 2016 raised the MSCs for 1,3,5-TMB;
therefore, 1,3,5-TMB concentrations in the soil no longer exceeds the SHS MSC.
Slight mounding of the groundwater in the vicinity of MW-1 resulted in a radial
groundwater flow pattern from that location.
Generally, the groundwater flow direction in the shallow, overburden aquifer is towards
the south and southeast, influenced partly by the surface topography with flow generally
towards Anderson Creek and the West Branch of the Susquehanna River. A summary of
historical groundwater elevations is presented on Table 1.
Four groundwater sampling events were conducted on monitoring wells MW-1 through
MW-6, and MW-7 was sampled twice.

Remedial Action Progress ReportFourth Quarter 2017
Chiquita Holdings, Fuel On Service StationPADEP Facility I.D #17-31221
Page 3
Benzene, MTBE, naphthalene, 1,2,4-TMB and 1,3,5-TMB concentrations were detected
in monitoring wells MW-1, MW-2, MW-3 and MW-4 one or more times at concentrations
above their respective RU SHS MSCs.
No sampling events exhibited concentrations of any compounds exceeding the RU SHC
MSCs in Off-Site monitoring wells MW-5, MW-6 or MW-7.
Changes to the SHS MSCs published in April 2016 raised the MSCs for 1,3,5-TMB;
therefore, 1,3,5-TMB concentrations in the groundwater no longer exceeds the SHS MSC.
A summary of historical analytical results are presented on Table 2.
A Remedial Action Plan (RAP) is required for facilities with a confirmed release of a regulated
substance as per the guidelines set forth within the PADEP Corrective Action Process Regulations
25 Pa Code Subchapter D, 245.311. Following the completion of a Pilot Study, a RAP was
submitted to the PADEP in May 2016. The attainment of the SHS MSCs had not been
demonstrated for both soil and groundwater as presented in the SCR and RAP. As such, Cribbs &
Associates recommended remedial actions be undertaken as part of the RAP.
The RAP recommended air sparging with soil vapor extraction (SVE) for restoring soil and
groundwater conditions by injecting atmospheric air with oxygen below the groundwater table
elevation. The injected oxygen increases the volatilization activity of the petroleum hydrocarbons
and transports the gas-phase hydrocarbons into the vadose zone from the groundwater. The
volatilized hydrocarbons are then removed by the influence of a vacuum extraction system which
is used in conjunction with the sparging injection system. This technology is effective in highly
permeable soil conditions, and has demonstrated to be capable of low part per billion clean-up
levels. Additionally, the resulting increased oxygen levels have proven to enhance the natural
degradation process by providing an additional nutrient source.
The PADEP approved the SCR and RAP on July 25th, 2016 with one modification:
“Soil excavation above the ful1y saturated zone should be undertaken in the areas (MW-3 and SB-
1) that were identified during the site characterization. The proposed treatment system shall be
installed based upon the submitted schedule.”
However, in 2017, the Underground Storage Tank Indemnification Fund’s (USTIF) Third Party
Reviewer for the Site (Excalibur Group, LLC [Excalibur]), contacted Cribbs & Associates. They
expressed concern regarding the applicability of the selected remedial action (Air Sparging/Soil
Vapor Extraction). It was therefore determined by Excalibur’s Case Manager (Mike Lowe) that
the preferred remedial technology for the Site was Soil Excavation and Off-site Disposal, including
the removal of upper saturated zone of the aquifer in the contaminated areas. Therefore, a Revised
Remedial Action Plan is currently being prepared for submittal to USTIF and for review and
comment/approval prior to submittal to PADEP.

Remedial Action Progress ReportFourth Quarter 2017
Chiquita Holdings, Fuel On Service StationPADEP Facility I.D #17-31221
Page 4
2.0 Quarterly Groundwater Monitoring Activities
All seven Site monitoring wells have been sampled on a quarterly basis since the SCR was
submitted in February 2015. Seven monitoring wells (MW-1 through MW-7) were sampled
during this quarter’s groundwater monitoring event. The location of the wells and other pertinent
site features are presented on Figure 2. Monitoring activities for the Fourth Quarter 2017 were
conducted on November 2nd, 2017.
2.1 Static Water Level Measurements
Prior to conducting groundwater sampling activities, static groundwater level measurements were
obtained from each monitoring well in order to calculate groundwater elevations. These
groundwater elevations were used to determine the volume of water in the well, as well as for the
construction of groundwater flow maps. Table 1 presents the historic depth to groundwater
measurements and the calculated groundwater elevations.
2.2 Groundwater Sampling Activities
As part of the groundwater monitoring activities, groundwater samples were collected from the
monitoring wells using low-flow sampling techniques as presented in the technical guidance
manual “Standard Operating Procedure for Low-Stress (Low-Flow)/Minimal Drawdown Ground-
Water Sample Collection” and referenced from the USEPA Groundwater Issue Paper “Low-Flow
(Minimal Drawdown) Groundwater Sampling Procedure”, by Robert W. Puls and Michael J.
Barcelona.
Prior to sampling, the monitoring wells were purged using a micro-purge low flow stainless steel
submersible air lift (bladder) pump. Each well was purged and sampled using dedicated
polyethylene tubing and a dedicated pump bladder. As the wells were purged, the discharge water
was pumped through a low-flow analysis chamber with a multi-parameter water quality sensor
until all parameters (temperature, specific conductance, dissolved oxygen, pH, and oxygen
reduction potential) had stabilized. Once the parameters had stabilized, the low-flow analysis
chamber was removed and samples were collected directly into laboratory supplied sample
containers with the appropriate preservatives. The samples were immediately placed on ice and
delivered to Pace Analytical Services (Pace) in Greensburg, Pennsylvania under proper chain of
custody. The samples were received by Pace in acceptable condition and ice was present in the
cooler at the time of delivery. The samples were subsequently analyzed for the current PADEP
Petroleum Shortlist of Unleaded Gasoline parameters including benzene, ethylbenzene, cumene,
MTBE, naphthalene, toluene, 1,2,4-TMB, 1,3,5-TMB, and total xylenes.
2.3 Purge Water Disposal
Purge water from the First through the Fourth Quarter 2017 groundwater sampling events has been
placed into a 55-gallon, DOT-approved, steel drums. Because low-flow sampling techniques were
used, less than one drum of purge water is generated per event. The partial drum of purge water

Remedial Action Progress ReportFourth Quarter 2017
Chiquita Holdings, Fuel On Service StationPADEP Facility I.D #17-31221
Page 5
remains on the Subject Property, however as the drum becomes full, it will be disposed at Petromax
Ltd. in Carnegie, Pennsylvania. An empty drum will be left on-Site to be used containing water
from the future sampling events.
3.0 Monitoring Results
3.1 Groundwater Elevations and Flow Directions
Depth to groundwater measurements were used to calculate groundwater elevations for each
monitoring well. These groundwater elevations are presented in Table 1. A Groundwater Contour
Map was constructed for the overburden aquifer. This map is included as Figure 3.
The Site is located in the alluvial flood plains of Anderson Creek and the West Branch of the
Susquehanna, which are the primary groundwater discharge features in the area. Anderson Creek is
located approximately 300 feet south of the Site and its confluence with the West Branch of the
Susquehanna is located approximately 1,800 feet southeast of the Site. Therefore, groundwater flow
is generally to the southeast towards the West Branch of the Susquehanna River and southwest
towards Anderson Creek. As shown in Figure 3, the highest groundwater elevation has been found
in MW-1, depicting a semi-radial flow from MW-1 towards the other nearby wells (MW-2, MW-
3, and MW-4).
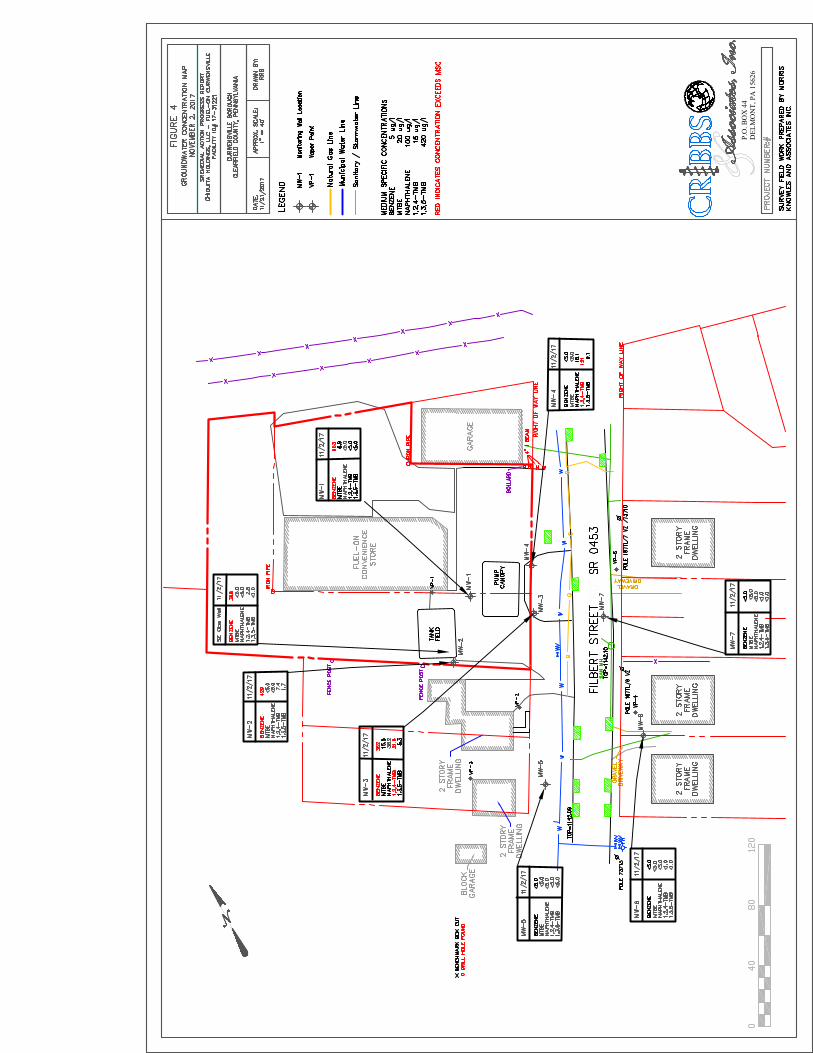
3.2 Groundwater Analytical Results
Each groundwater sample was analyzed for the current PADEP Petroleum Shortlist of Unleaded
Gasoline Parameters including benzene, ethylbenzene, cumene, MTBE, naphthalene, toluene,
1,2,4-TMB, 1,3,5-TMB, and total xylenes. The results of the analysis are summarized in Table 2,
and the associated laboratory analytical reports are provided in Appendix A. A Groundwater
Analytical Map with the quarterly results is presented as Figure 4.
The most recent quarterly groundwater monitoring event was conducted on November 2nd, 2017.
This event marks the fifteenth sampling event performed at the Site for on-Site monitoring wells
MW-1 through MW-4, and the first two off-Site monitoring wells (MW-5 and MW-6). It also
marks the thirteenth sampling event for off-Site monitoring well MW-7.
Benzene concentrations exceeded its RU SHS MSC of 5 g/l in monitoring wells MW-1 (663
g/l), MW-2 (429 g/l), and MW-3 (362 g/l). All three wells showed an increase in benzene
concentrations from the last quarterly sampling event. The benzene concentration observed in
MW-1 is greater than two times the previous high benzene concentration of 327 mg/l recorded on
August 23rd, 2016 for this well. The benzene concentrations in MW-2 and MW-3 are below their
highest historical concentrations of benzene in each of these wells, both observed during the Third
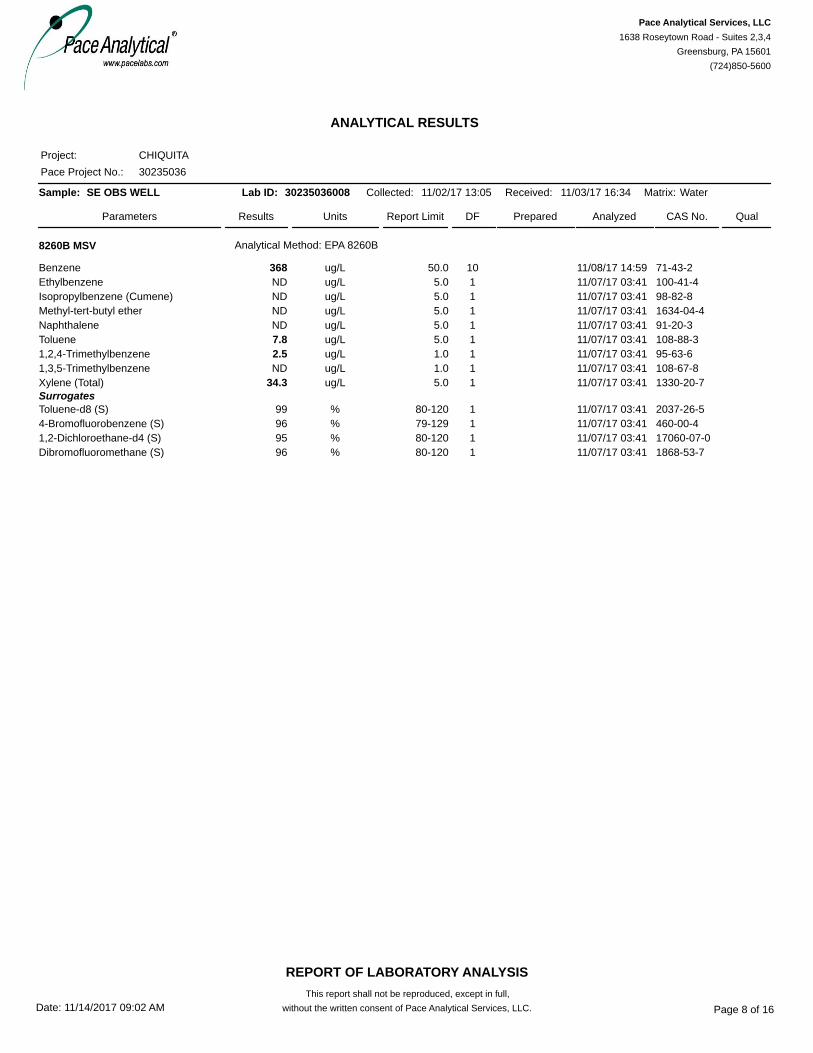
Quarter 2016 sampling event. Benzene was also detected at a concentration of 368 g/l in the tank
field observation well OW-2 in the southern corner of the UST basin. Benzene concentrations
were below the laboratory detection limits and the RU SHS MSC in monitoring wells MW-4
through MW-7.

Remedial Action Progress ReportFourth Quarter 2017
Chiquita Holdings, Fuel On Service StationPADEP Facility I.D #17-31221
Page 6
Concentrations of 1,2,4-TMB was detected in monitoring wells MW-3 (21.6 g/l) and MW-4 (121
g/l), both exceeding the RU SHS MSC of 15 g/l. 1,2,4-TMB was detected in monitoring well
MW-2 at 7.4 g/l and in OW-2 at 2.5 g/l. 1,2,4-TMB concentrations were below the laboratory
method detection limit and SHS MSC in the other four monitoring wells.
Concentrations of MTBE have not exceeded its RU SHS MSC of 20 g/l since the initial sampling
event for MW-1 and MW-3. However, during the Fourth Quarter 2016 groundwater sampling
event the MTBE concentration was reported using an elevated laboratory method detection limit
of <250 g/l in MW-3. The only quantifiable MTBE concentrations were 6.9 g/l and 15.5 g/l
in MW-1 and MW-3, respectively. MTBE concentrations were below laboratory detection limits
(<5.0 g/l) in the other five monitoring wells.
Naphthalene has historically exceeded its RU SHS MSC of 100 mg/l in MW-3 and MW-4.
Naphthalene was below the RU SHS MSC in MW-3 (38.2 g/l), and MW-4 (16.1 g/l), and below
the laboratory methods detection limits in the other five monitoring wells for this sampling event.
Ethylbenzene, cumene, toluene, 1,3,5-TMB and total xylenes have been occasionally detected at
concentrations above the laboratory method detection limits, but have never exceeded their
respective RU SHS MSCs.
4.0 Summary
In general, the analytical data obtained during the Fourth Quarter 2017 monitoring event is
consistent with the historical groundwater data, with the exception of a historic high benzene
concentration observed in monitoring well MW-1. Benzene concentrations observed in MW-2
and MW-3 also exceeded its RU SHS MSC. The observed benzene concentrations in MW-2 and
MW-3 increased, compared to the previous quarter, but remained below the historic high
concentrations observed in these wells during the Third Quarter 2016 sampling event. Benzene
was also detected at a concentration of 368 g/l in the observation well OW-2 in the southern
corner of the UST basin. 1,2,4-TMB concentrations also exceeded the RU SHS MSC of 15 g/l
in monitoring wells MW-3 (21.6 g/l) and MW-4 (121 g/l). All other parameters analyzed were
below their respective RU SHS MSCs in the other monitoring wells.
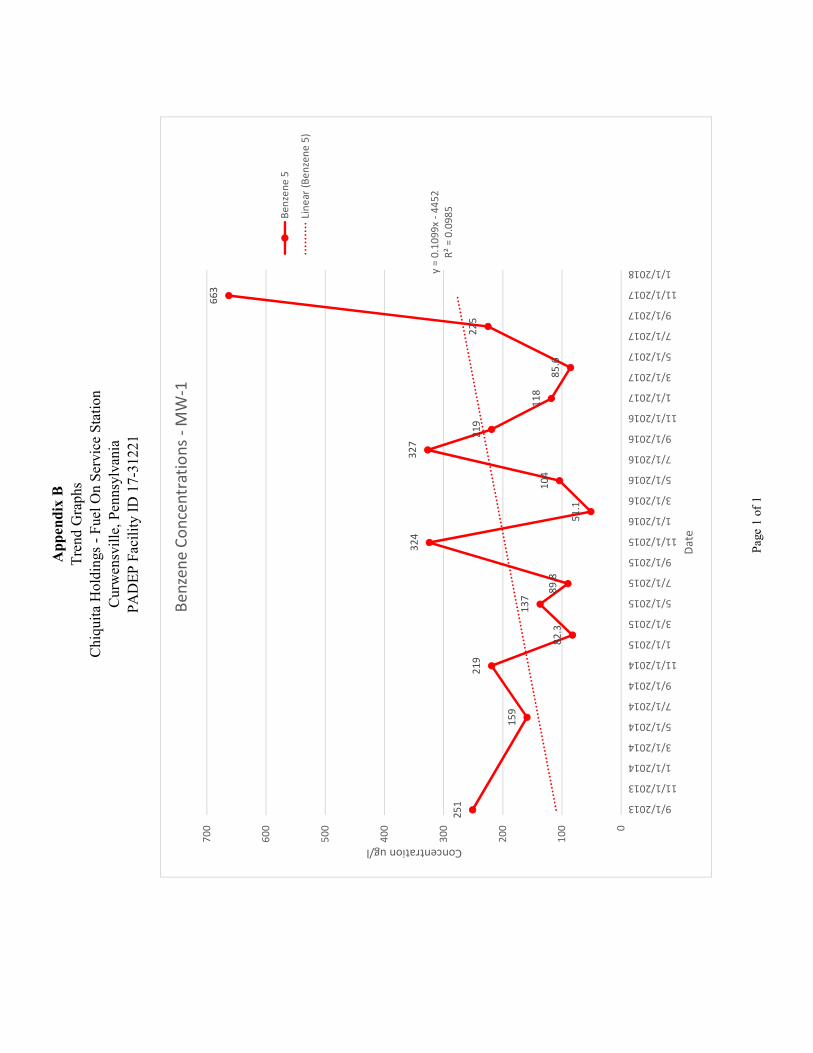
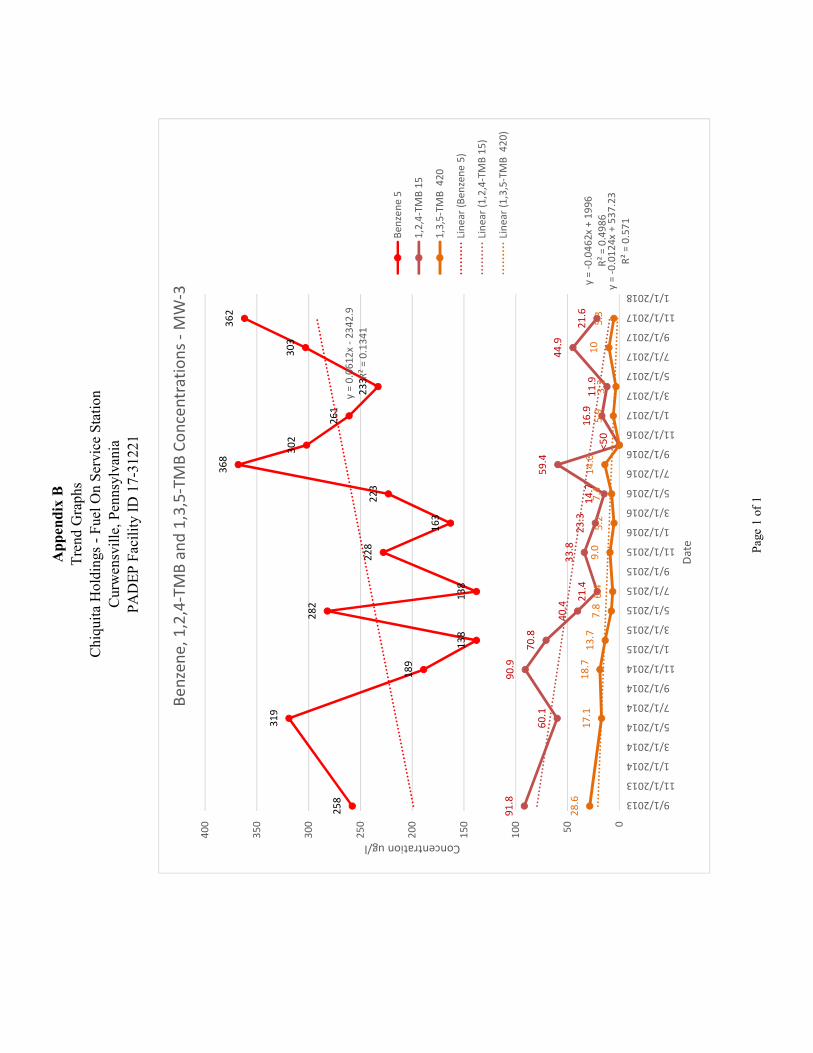
Appendix B presents the trend graphs for concentrations of contaminants of concern over time.
Individual trend graphs are provided for monitoring wells MW-1 (benzene), MW-2 (benzene),
MW-3 (benzene, 1,2,4-TMB and 1,3,5-TMB) and MW-4 (1,3,4-TMB and 1,3,5-TMB). The
benzene concentration in MW-1 now indicates an increasing trend because the historic high
benzene concentration of 663 g/l observed this quarter. The benzene concentration in MW-1
increasing from 225 g/l to 663 g/l this quarter reversed the previous decreasing trend. Benzene
concentrations in MW-2 and MW-3 indicate increasing trends mostly because the historic high
concentrations observed during the Third Quarter of 2016, followed by three decreasing quarters
prior to the increasing concentrations recorded during the third and fourth quarter of 2017 sampling
events.

Remedial Action Progress ReportFourth Quarter 2017
Chiquita Holdings, Fuel On Service StationPADEP Facility I.D #17-31221
Page 7
The overall historic trends for 1,2,4-TMB and 1,3,5-TMB for monitoring wells MW-3 and MW-4
indicate decreasing trends, although increases were observed for the concentrations of both
parameters in MW-4 during the Fourth Quarter 2017 sampling event.
The Third-Party Oversight Consultant for USTIF requested that a pilot study for the air sparge and
soil vacuum extraction system technologies called for in the RAP be conducted for the purpose of
providing additional design information to supplement the data collected during the initial dual
phase extraction pilot study. The Third-Party Oversight Consultant for USTIF also requested a
work plan for the air sparge and soil vacuum extraction pilot study. The pilot study work plan was
submitted to the Third-Party Consultant on July 7th, 2017. After reviewing the pilot study work
plan the Third-Party Oversight Consultant determined that the proposed air sparge/soil vacuum
extraction technology was not appropriate and recommended eliminating the active remediation
system and addressing the contamination on the Subject Property through the excavation of
contaminated soil and reducing the secondary source of groundwater contamination. The Third-
Party Oversight Consultant for USTIF also recommended extending the depth of the proposed soil
dig two to three feet into the zone of permanent saturation.
5.0 Recommendations
In light of the recent increase in benzene concentrations observed in monitoring wells MW-1,
MW-2, MW-3, and the change in the proposed remedial technology, a revised RAP is currently
being prepared and will be submitted to the PADEP during the First Quarter of 2018. The revision
to the RAP will require additional soil delineation on the site to refine the proposed soil excavation
area. Additional soil sampling will be conducted during the First Quarter of 2018. The additional
soil investigation will include advancing approximately 10 Geoprobe® soil borings to acquire data
downgradient of the UST basin and in areas between the soil borings completed as part of the site
characterization activities. The results will be used to designate the footprint of the proposed
excavation.
The soil samples will be screened with a PID and the materials encountered logged by a Cribbs &
Associates geologist. At least one soil sample from each location will be submitted to the
laboratory and analyzed for PADEP Petroleum Shortlist of Unleaded Gasoline parameters. Two
samples from each soil boring may be submitted for analysis in order to better delineate the
horizontal and vertical limits of contamination. The soil excavation will occur likely during the
summer of 2018, when the groundwater table elevation is at a low point (preferably during
dry/draught conditions). The paved parking lot will be restored following excavation, backfilling
and compaction has occurred.
A highway occupancy permit (HOP) has been obtained from the PennDOT Engineering District
02-0, covering Clearfield County in order to conduct the requested soil dig to the southeast of the
dispenser islands because a portion of the proposed excavation will be in the Right of Way for

Remedial Action Progress ReportFourth Quarter 2017
Chiquita Holdings, Fuel On Service StationPADEP Facility I.D #17-31221
Page 8
State Route 453 (Filbert Street). This permit expires on April 3rd, 2018 and may have to be
renewed or extended.
Quarterly groundwater monitoring will continue until attainment of the RU SHS MSCs has been
documented. Remedial Action Progress Reports (RAPRs) detailing the findings of the quarterly
groundwater sampling events and the remedial activities will be submitted to the PADEP by the
30th of the month following the month ending the quarter of sampling.

Remedial Action Progress Report Fourth Quarter 2017
Chiquita Holdings, Fuel On Service Station PADEP Facility I.D #17-31221
FIGURES

FIGURE 1SITE LOCATION MAP
SCALE:
1 inch equals 2080 feet
REFERENCE:
CURWENSVILLE, PENNSYLVANIAUSGS 7.5-Minute Quadrangle
CHIQUITA HOLDINGSFUEL ON SERVICE STATION
CURWENSVILLE., PENNSYLVANIAPADEP FACILITY I.D. # 17-31221
P.O. BOX 44 DELMONT, PA 15626724.454.2310

P.O
. BO
X 4
4D
EL
MO
NT
, PA
156
26

P.O
. BO
X 4
4D
EL
MO
NT
, PA
156
26
P.O
. BO
X 4
4D
EL
MO
NT
, PA
156
26

Remedial Action Progress Report Fourth Quarter 2017
Chiquita Holdings, Fuel On Service Station PADEP Facility I.D #17-31221
TABLES
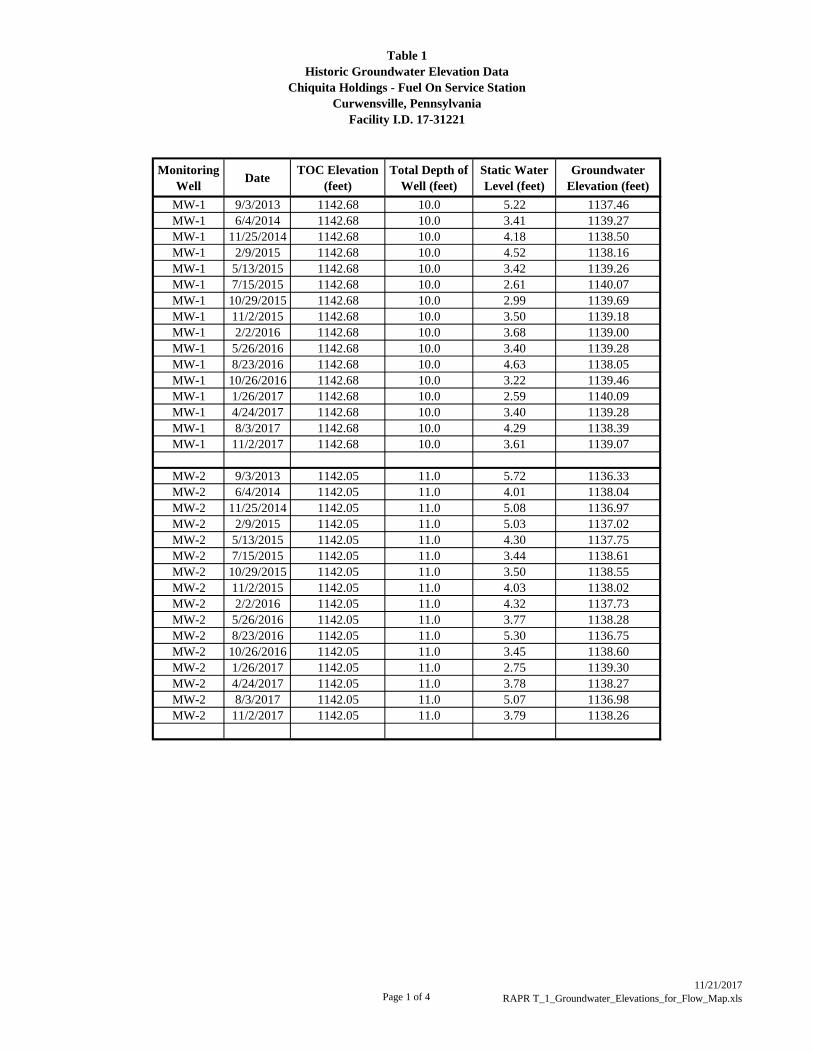
Table 1
Historic Groundwater Elevation Data
Chiquita Holdings - Fuel On Service Station
Curwensville, Pennsylvania
Facility I.D. 17-31221
Monitoring
WellDate
TOC Elevation
(feet)
Total Depth of
Well (feet)
Static Water
Level (feet)
Groundwater
Elevation (feet)
MW-1 9/3/2013 1142.68 10.0 5.22 1137.46
MW-1 6/4/2014 1142.68 10.0 3.41 1139.27
MW-1 11/25/2014 1142.68 10.0 4.18 1138.50
MW-1 2/9/2015 1142.68 10.0 4.52 1138.16
MW-1 5/13/2015 1142.68 10.0 3.42 1139.26
MW-1 7/15/2015 1142.68 10.0 2.61 1140.07
MW-1 10/29/2015 1142.68 10.0 2.99 1139.69
MW-1 11/2/2015 1142.68 10.0 3.50 1139.18
MW-1 2/2/2016 1142.68 10.0 3.68 1139.00
MW-1 5/26/2016 1142.68 10.0 3.40 1139.28
MW-1 8/23/2016 1142.68 10.0 4.63 1138.05
MW-1 10/26/2016 1142.68 10.0 3.22 1139.46
MW-1 1/26/2017 1142.68 10.0 2.59 1140.09
MW-1 4/24/2017 1142.68 10.0 3.40 1139.28
MW-1 8/3/2017 1142.68 10.0 4.29 1138.39
MW-1 11/2/2017 1142.68 10.0 3.61 1139.07
MW-2 9/3/2013 1142.05 11.0 5.72 1136.33
MW-2 6/4/2014 1142.05 11.0 4.01 1138.04
MW-2 11/25/2014 1142.05 11.0 5.08 1136.97
MW-2 2/9/2015 1142.05 11.0 5.03 1137.02
MW-2 5/13/2015 1142.05 11.0 4.30 1137.75
MW-2 7/15/2015 1142.05 11.0 3.44 1138.61
MW-2 10/29/2015 1142.05 11.0 3.50 1138.55
MW-2 11/2/2015 1142.05 11.0 4.03 1138.02
MW-2 2/2/2016 1142.05 11.0 4.32 1137.73
MW-2 5/26/2016 1142.05 11.0 3.77 1138.28
MW-2 8/23/2016 1142.05 11.0 5.30 1136.75
MW-2 10/26/2016 1142.05 11.0 3.45 1138.60
MW-2 1/26/2017 1142.05 11.0 2.75 1139.30
MW-2 4/24/2017 1142.05 11.0 3.78 1138.27
MW-2 8/3/2017 1142.05 11.0 5.07 1136.98
MW-2 11/2/2017 1142.05 11.0 3.79 1138.26
Page 1 of 411/21/2017
RAPR T_1_Groundwater_Elevations_for_Flow_Map.xls

Table 1
Historic Groundwater Elevation Data
Chiquita Holdings - Fuel On Service Station
Curwensville, Pennsylvania
Facility I.D. 17-31221
Monitoring
WellDate
TOC Elevation
(feet)
Total Depth of
Well (feet)
Static Water
Level (feet)
Groundwater
Elevation (feet)
MW-3 9/3/2013 1142.51 10.0 6.24 1136.27
MW-3 6/4/2014 1142.51 10.0 3.98 1138.53
MW-3 11/25/2014 1142.51 10.0 4.42 1138.09
MW-3 2/9/2015 1142.51 10.0 4.71 1137.80
MW-3 5/13/2015 1142.51 10.0 3.43 1139.08
MW-3 7/15/2015 1142.51 10.0 4.17 1138.34
MW-3 10/29/2015 1142.51 10.0 3.22 1139.29
MW-3 11/2/2015 1142.51 10.0 3.69 1138.82
MW-3 2/2/2016 1142.51 10.0 3.89 1138.62
MW-3 5/26/2016 1142.51 10.0 3.71 1138.80
MW-3 8/23/2016 1142.51 10.0 5.13 1137.38
MW-3 10/26/2016 1142.51 10.0 3.48 1139.03
MW-3 1/26/2017 1142.51 10.0 2.76 1139.75
MW-3 4/24/2017 1142.51 10.0 3.60 1138.91
MW-3 8/3/2017 1142.51 10.0 4.23 1138.28
MW-3 11/2/2017 1142.51 10.0 3.71 1138.80
MW-4 9/3/2013 1142.53 10.0 6.03 1136.50
MW-4 6/4/2014 1142.53 10.0 3.80 1138.73
MW-4 11/25/2014 1142.53 10.0 5.72 1136.81
MW-4 2/9/2015 1142.53 10.0 5.99 1136.54
MW-4 5/13/2015 1142.53 10.0 4.09 1138.44
MW-4 7/15/2015 1142.53 10.0 4.23 1138.30
MW-4 10/29/2015 1142.53 10.0 4.95 1137.58
MW-4 11/2/2015 1142.53 10.0 4.18 1138.35
MW-4 2/2/2016 1142.53 10.0 5.15 1137.38
MW-4 5/26/2016 1142.53 10.0 4.05 1138.48
MW-4 8/23/2016 1142.53 10.0 5.90 1136.63
MW-4 10/26/2016 1142.53 10.0 3.95 1138.58
MW-4 1/26/2017 1142.53 10.0 2.51 1140.02
MW-4 4/24/2017 1142.53 10.0 3.79 1138.74
MW-4 8/3/2017 1142.53 10.0 5.47 1137.06
MW-4 11/2/2017 1142.53 10.0 5.09 1137.44
Page 2 of 411/21/2017
RAPR T_1_Groundwater_Elevations_for_Flow_Map.xls

Table 1
Historic Groundwater Elevation Data
Chiquita Holdings - Fuel On Service Station
Curwensville, Pennsylvania
Facility I.D. 17-31221
Monitoring
WellDate
TOC Elevation
(feet)
Total Depth of
Well (feet)
Static Water
Level (feet)
Groundwater
Elevation (feet)
MW-5 6/4/2014 1140.87 12.0 4.40 1136.47
MW-5 7/24/2014 1140.87 12.0 5.88 1134.99
MW-5 11/25/2014 1140.87 12.0 5.44 1135.43
MW-5 2/9/2015 1140.87 12.0 6.19 1134.68
MW-5 5/13/2015 1140.87 12.0 5.20 1135.67
MW-5 7/15/2015 1140.87 12.0 5.82 1135.05
MW-5 10/29/2015 1140.87 12.0 4.64 1136.23
MW-5 11/2/2015 1140.87 12.0 5.20 1135.67
MW-5 2/2/2016 1140.87 12.0 5.14 1135.73
MW-5 5/26/2016 1140.87 12.0 5.09 1135.78
MW-5 8/23/2016 1140.87 12.0 5.49 1135.38
MW-5 10/26/2016 1140.87 12.0 4.63 1136.24
MW-5 1/26/2017 1140.87 12.0 3.97 1136.90
MW-5 4/24/2017 1140.87 12.0 5.09 1135.78
MW-5 8/3/2017 1140.87 12.0 5.42 1135.45
MW-5 11/2/2017 1140.87 12.0 4.87 1136.00
MW-6 6/4/2014 1140.35 12.0 NM NM
MW-6 7/24/2014 1140.35 12.0 5.22 1135.13
MW-6 11/25/2014 1140.35 12.0 4.82 1135.53
MW-6 2/9/2015 1140.35 12.0 5.91 1134.44
MW-6 5/13/2015 1140.35 12.0 4.73 1135.62
MW-6 7/15/2015 1140.35 12.0 5.62 1134.73
MW-6 10/29/2015 1140.35 12.0 4.15 1136.20
MW-6 11/2/2015 1140.35 12.0 4.58 1135.77
MW-6 2/2/2016 1140.35 12.0 5.45 1134.90
MW-6 5/26/2016 1140.35 12.0 4.59 1135.76
MW-6 8/23/2016 1140.35 12.0 4.97 1135.38
MW-6 10/26/2016 1140.35 12.0 4.40 1135.95
MW-6 1/26/2017 1140.35 12.0 3.89 1136.46
MW-6 4/24/2017 1140.35 12.0 4.67 1135.68
MW-6 8/3/2017 1140.35 12.0 4.93 1135.42
MW-6 11/2/2017 1140.35 12.0 4.48 1135.87
Page 3 of 411/21/2017
RAPR T_1_Groundwater_Elevations_for_Flow_Map.xls

Table 1
Historic Groundwater Elevation Data
Chiquita Holdings - Fuel On Service Station
Curwensville, Pennsylvania
Facility I.D. 17-31221
Monitoring
WellDate
TOC Elevation
(feet)
Total Depth of
Well (feet)
Static Water
Level (feet)
Groundwater
Elevation (feet)
MW-7 11/21/2014 1141.61 10.0 6.18 1135.43
MW-7 2/9/2015 1141.61 10.0 5.81 1135.80
MW-7 5/13/2015 1141.61 10.0 5.92 1135.69
MW-7 7/15/2015 1141.61 10.0 5.26 1136.35
MW-7 10/29/2015 1141.61 10.0 5.86 1135.75
MW-7 11/2/2015 1141.61 10.0 5.17 1136.44
MW-7 2/2/2016 1141.61 10.0 4.24 1137.37
MW-7 5/26/2016 1141.61 10.0 5.92 1135.69
MW-7 8/23/2016 1141.61 10.0 6.21 1135.40
MW-7 10/26/2016 1141.61 10.0 5.74 1135.87
MW-7 1/26/2017 1141.61 10.0 5.52 1136.09
MW-7 4/24/2017 1141.61 10.0 5.96 1135.65
MW-7 8/3/2017 1141.61 10.0 6.13 1135.48
MW-7 11/2/2017 1141.61 10.0 5.89 1135.72
OW-1 11/2/2017 1142.90 10.0 3.79 1139.11
OW-2 11/2/2017 1142.75 10.0 3.6 1139.15
OW-3 11/2/2017 1142.41 10.0 3.24 1139.17
OW-4 11/2/2017 1142.72 10.0 3.59 1139.13
RW-1 10/29/2015 15.0 5.1 -5.10
PT-1 10/29/2015 10.0 3.91 -3.91
Notes:
TOC = Top of Casing
NM = Not measured
10/29/2015 are Pilot Study water level readings
Page 4 of 411/21/2017
RAPR T_1_Groundwater_Elevations_for_Flow_Map.xls
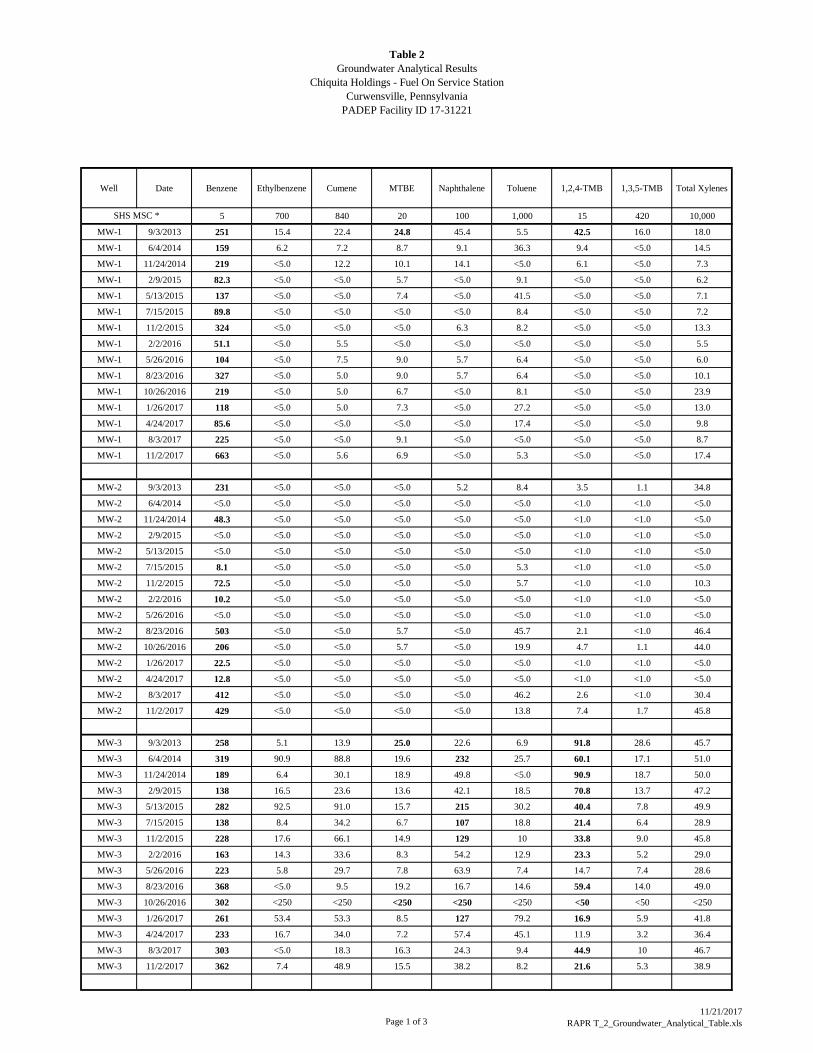
Table 2
Groundwater Analytical Results
Chiquita Holdings - Fuel On Service Station
Curwensville, Pennsylvania
PADEP Facility ID 17-31221
Well Date Benzene Ethylbenzene Cumene MTBE Naphthalene Toluene 1,2,4-TMB 1,3,5-TMB Total Xylenes
5 700 840 20 100 1,000 15 420 10,000
MW-1 9/3/2013 251 15.4 22.4 24.8 45.4 5.5 42.5 16.0 18.0
MW-1 6/4/2014 159 6.2 7.2 8.7 9.1 36.3 9.4 <5.0 14.5
MW-1 11/24/2014 219 <5.0 12.2 10.1 14.1 <5.0 6.1 <5.0 7.3
MW-1 2/9/2015 82.3 <5.0 <5.0 5.7 <5.0 9.1 <5.0 <5.0 6.2
MW-1 5/13/2015 137 <5.0 <5.0 7.4 <5.0 41.5 <5.0 <5.0 7.1
MW-1 7/15/2015 89.8 <5.0 <5.0 <5.0 <5.0 8.4 <5.0 <5.0 7.2
MW-1 11/2/2015 324 <5.0 <5.0 <5.0 6.3 8.2 <5.0 <5.0 13.3
MW-1 2/2/2016 51.1 <5.0 5.5 <5.0 <5.0 <5.0 <5.0 <5.0 5.5
MW-1 5/26/2016 104 <5.0 7.5 9.0 5.7 6.4 <5.0 <5.0 6.0
MW-1 8/23/2016 327 <5.0 5.0 9.0 5.7 6.4 <5.0 <5.0 10.1
MW-1 10/26/2016 219 <5.0 5.0 6.7 <5.0 8.1 <5.0 <5.0 23.9
MW-1 1/26/2017 118 <5.0 5.0 7.3 <5.0 27.2 <5.0 <5.0 13.0
MW-1 4/24/2017 85.6 <5.0 <5.0 <5.0 <5.0 17.4 <5.0 <5.0 9.8
MW-1 8/3/2017 225 <5.0 <5.0 9.1 <5.0 <5.0 <5.0 <5.0 8.7
MW-1 11/2/2017 663 <5.0 5.6 6.9 <5.0 5.3 <5.0 <5.0 17.4
MW-2 9/3/2013 231 <5.0 <5.0 <5.0 5.2 8.4 3.5 1.1 34.8
MW-2 6/4/2014 <5.0 <5.0 <5.0 <5.0 <5.0 <5.0 <1.0 <1.0 <5.0
MW-2 11/24/2014 48.3 <5.0 <5.0 <5.0 <5.0 <5.0 <1.0 <1.0 <5.0
MW-2 2/9/2015 <5.0 <5.0 <5.0 <5.0 <5.0 <5.0 <1.0 <1.0 <5.0
MW-2 5/13/2015 <5.0 <5.0 <5.0 <5.0 <5.0 <5.0 <1.0 <1.0 <5.0
MW-2 7/15/2015 8.1 <5.0 <5.0 <5.0 <5.0 5.3 <1.0 <1.0 <5.0
MW-2 11/2/2015 72.5 <5.0 <5.0 <5.0 <5.0 5.7 <1.0 <1.0 10.3
MW-2 2/2/2016 10.2 <5.0 <5.0 <5.0 <5.0 <5.0 <1.0 <1.0 <5.0
MW-2 5/26/2016 <5.0 <5.0 <5.0 <5.0 <5.0 <5.0 <1.0 <1.0 <5.0
MW-2 8/23/2016 503 <5.0 <5.0 5.7 <5.0 45.7 2.1 <1.0 46.4
MW-2 10/26/2016 206 <5.0 <5.0 5.7 <5.0 19.9 4.7 1.1 44.0
MW-2 1/26/2017 22.5 <5.0 <5.0 <5.0 <5.0 <5.0 <1.0 <1.0 <5.0
MW-2 4/24/2017 12.8 <5.0 <5.0 <5.0 <5.0 <5.0 <1.0 <1.0 <5.0
MW-2 8/3/2017 412 <5.0 <5.0 <5.0 <5.0 46.2 2.6 <1.0 30.4
MW-2 11/2/2017 429 <5.0 <5.0 <5.0 <5.0 13.8 7.4 1.7 45.8
MW-3 9/3/2013 258 5.1 13.9 25.0 22.6 6.9 91.8 28.6 45.7
MW-3 6/4/2014 319 90.9 88.8 19.6 232 25.7 60.1 17.1 51.0
MW-3 11/24/2014 189 6.4 30.1 18.9 49.8 <5.0 90.9 18.7 50.0
MW-3 2/9/2015 138 16.5 23.6 13.6 42.1 18.5 70.8 13.7 47.2
MW-3 5/13/2015 282 92.5 91.0 15.7 215 30.2 40.4 7.8 49.9
MW-3 7/15/2015 138 8.4 34.2 6.7 107 18.8 21.4 6.4 28.9
MW-3 11/2/2015 228 17.6 66.1 14.9 129 10 33.8 9.0 45.8
MW-3 2/2/2016 163 14.3 33.6 8.3 54.2 12.9 23.3 5.2 29.0
MW-3 5/26/2016 223 5.8 29.7 7.8 63.9 7.4 14.7 7.4 28.6
MW-3 8/23/2016 368 <5.0 9.5 19.2 16.7 14.6 59.4 14.0 49.0
MW-3 10/26/2016 302 <250 <250 <250 <250 <250 <50 <50 <250
MW-3 1/26/2017 261 53.4 53.3 8.5 127 79.2 16.9 5.9 41.8
MW-3 4/24/2017 233 16.7 34.0 7.2 57.4 45.1 11.9 3.2 36.4
MW-3 8/3/2017 303 <5.0 18.3 16.3 24.3 9.4 44.9 10 46.7
MW-3 11/2/2017 362 7.4 48.9 15.5 38.2 8.2 21.6 5.3 38.9
SHS MSC *
Page 1 of 311/21/2017
RAPR T_2_Groundwater_Analytical_Table.xls

Table 2
Groundwater Analytical Results
Chiquita Holdings - Fuel On Service Station
Curwensville, Pennsylvania
PADEP Facility ID 17-31221
Well Date Benzene Ethylbenzene Cumene MTBE Naphthalene Toluene 1,2,4-TMB 1,3,5-TMB Total Xylenes
5 700 840 20 100 1,000 15 420 10,000SHS MSC *
MW-4 9/3/2013 <5.0 110 111 <5.0 134 <5.0 1,240 359 180
MW-4 6/4/2014 <5.0 <5.0 <5.0 <5.0 <5.0 <5.0 9.4 3.9 <5.0
MW-4 11/24/2014 <5.0 45.6 28.6 <5.0 41.0 <5.0 363 77.2 42.5
MW-4 2/9/2015 <5.0 37.9 34.3 <5.0 36.0 <5.0 500 141 77.6
MW-4 5/13/2015 <5.0 <5.0 <5.0 <5.0 <5.0 <5.0 7.0 1.9 <5.0
MW-4 7/15/2015 <5.0 <5.0 <5.0 <5.0 <5.0 <5.0 <1.0 <1.0 <5.0
MW-4 11/2/2015 <5.0 <5.0 <5.0 <5.0 <5.0 <5.0 1.3 <1.0 <5.0
MW-4 2/2/2016 <5.0 <5.0 5.7 <5.0 <5.0 <5.0 84.2 19.8 5.9
MW-4 5/26/2016 <5.0 <5.0 <5.0 <5.0 <5.0 <5.0 <1.0 <1.0 <5.0
MW-4 8/23/2016 <5.0 47.8 26.8 <5.0 31.8 <5.0 306 46.7 42.2
MW-4 10/26/2016 <5.0 <5.0 <5.0 <5.0 <5.0 <5.0 4.9 <1.0 <5.0
MW-4 1/26/2017 <5.0 <5.0 <5.0 <5.0 <5.0 <5.0 1.1 <1.0 <5.0
MW-4 4/24/2017 <5.0 <5.0 <5.0 <5.0 <5.0 <5.0 <1.0 <1.0 <5.0
MW-4 8/3/2017 <5.0 <5.0 <5.0 <5.0 <5.0 <5.0 25.8 3.5 <5.0
MW-4 11/2/2017 <5.0 18.5 11.8 <5.0 16.1 <5.0 121 9.1 19.8
MW-5 6/4/2014 <5.0 <5.0 <5.0 <5.0 <5.0 <5.0 <5.0 <5.0 <5.0
MW-5 7/25/2014 <5.0 <5.0 <5.0 <5.0 <5.0 <5.0 <5.0 <5.0 <5.0
MW-5 11/24/2014 <5.0 <5.0 <5.0 <5.0 <5.0 <5.0 <5.0 <5.0 <5.0
MW-5 2/9/2015 <5.0 <5.0 <5.0 <5.0 <5.0 <5.0 <5.0 <5.0 <5.0
MW-5 5/13/2015 <5.0 <5.0 <5.0 <5.0 <5.0 <5.0 <5.0 <5.0 <5.0
MW-5 7/15/2015 <5.0 <5.0 <5.0 <5.0 <5.0 <5.0 <5.0 <5.0 <5.0
MW-5 11/2/2015 <5.0 <5.0 <5.0 <5.0 <5.0 <5.0 <5.0 <5.0 <5.0
MW-5 2/2/2016 <5.0 <5.0 <5.0 <5.0 <5.0 <5.0 <5.0 <5.0 <5.0
MW-5 5/26/2016 <5.0 <5.0 <5.0 <5.0 <5.0 <5.0 <5.0 <5.0 <5.0
MW-5 8/23/2016 <5.0 <5.0 <5.0 <5.0 <5.0 <5.0 <5.0 <5.0 <5.0
MW-5 10/26/2016 <5.0 <5.0 <5.0 <5.0 <5.0 <5.0 <5.0 <5.0 <5.0
MW-5 1/26/2017 <5.0 <5.0 <5.0 <5.0 <5.0 <5.0 <5.0 <5.0 <5.0
MW-5 4/24/2017 <5.0 <5.0 <5.0 <5.0 <5.0 <5.0 <5.0 <5.0 <5.0
MW-5 8/3/2017 <5.0 <5.0 <5.0 <5.0 <5.0 <5.0 <5.0 <5.0 <5.0
MW-5 11/2/2017 <5.0 <5.0 <5.0 <5.0 <5.0 <5.0 <5.0 <5.0 <5.0
MW-6 6/4/2014 <5.0 <5.0 <5.0 <5.0 <5.0 <5.0 <1.0 <1.0 <5.0
MW-6 7/25/2014 <5.0 <5.0 <5.0 <5.0 <5.0 <5.0 <1.0 <1.0 <5.0
MW-6 11/24/2014 <5.0 <5.0 <5.0 <5.0 <5.0 <5.0 <1.0 <1.0 <5.0
MW-6 2/9/2015 <5.0 <5.0 <5.0 <5.0 <5.0 <5.0 10.9 1.8 <5.0
MW-6 5/13/2015 <5.0 <5.0 <5.0 <5.0 <5.0 <5.0 <1.0 <1.0 <5.0
MW-6 7/15/2015 <5.0 <5.0 <5.0 <5.0 <5.0 <5.0 <1.0 <1.0 <5.0
MW-6 11/2/2015 <5.0 <5.0 <5.0 <5.0 <5.0 <5.0 <1.0 <1.0 <5.0
MW-6 2/2/2016 <5.0 <5.0 <5.0 <5.0 <5.0 <5.0 <1.0 <1.0 <5.0
MW-6 5/26/2016 <5.0 <5.0 <5.0 <5.0 <5.0 <5.0 <1.0 <1.0 <5.0
MW-6 8/23/2016 <5.0 <5.0 <5.0 <5.0 <5.0 <5.0 <1.0 <1.0 <5.0
MW-6 10/26/2016 <5.0 <5.0 <5.0 <5.0 <5.0 <5.0 <1.0 <1.0 <5.0
MW-6 1/26/2017 <5.0 <5.0 <5.0 <5.0 <5.0 <5.0 <1.0 <1.0 <5.0
MW-6 4/24/2017 <5.0 <5.0 <5.0 <5.0 <5.0 <5.0 <1.0 <1.0 <5.0
MW-6 8/3/2017 <5.0 <5.0 <5.0 <5.0 <5.0 <5.0 <1.0 <1.0 <5.0
MW-6 11/2/2017 <5.0 <5.0 <5.0 <5.0 <5.0 <5.0 <1.0 <1.0 <5.0
Page 2 of 311/21/2017
RAPR T_2_Groundwater_Analytical_Table.xls
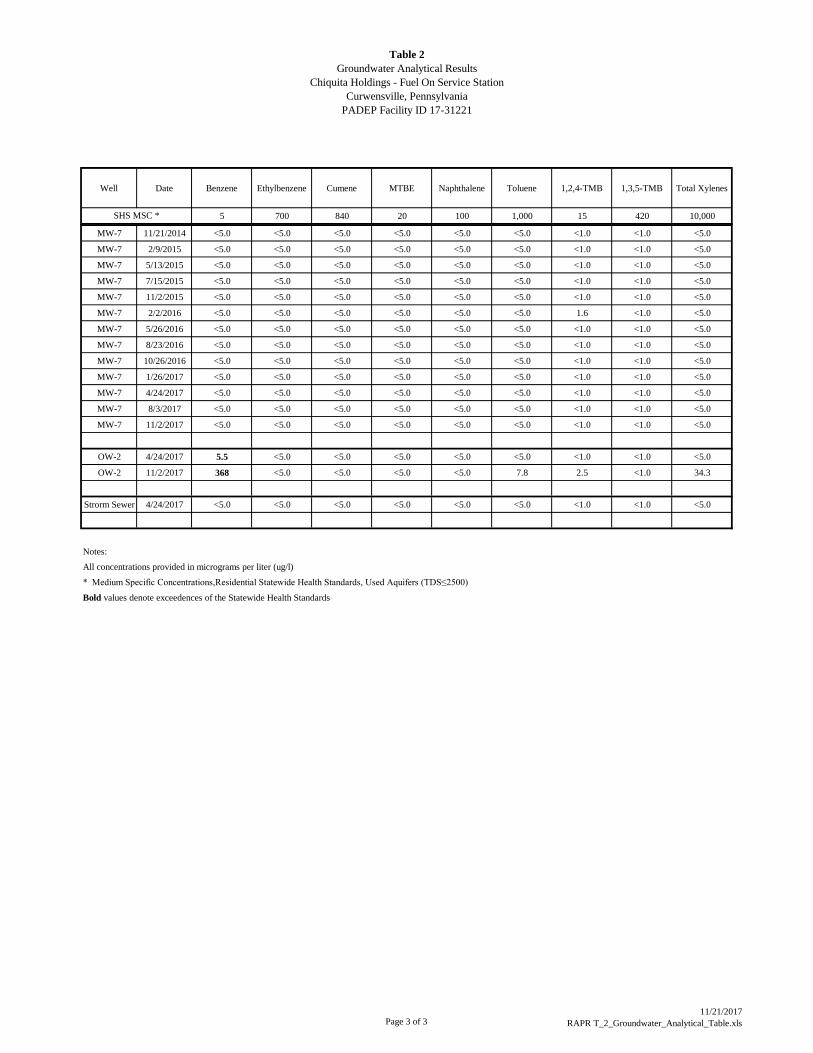
Table 2
Groundwater Analytical Results
Chiquita Holdings - Fuel On Service Station
Curwensville, Pennsylvania
PADEP Facility ID 17-31221
Well Date Benzene Ethylbenzene Cumene MTBE Naphthalene Toluene 1,2,4-TMB 1,3,5-TMB Total Xylenes
5 700 840 20 100 1,000 15 420 10,000SHS MSC *
MW-7 11/21/2014 <5.0 <5.0 <5.0 <5.0 <5.0 <5.0 <1.0 <1.0 <5.0
MW-7 2/9/2015 <5.0 <5.0 <5.0 <5.0 <5.0 <5.0 <1.0 <1.0 <5.0
MW-7 5/13/2015 <5.0 <5.0 <5.0 <5.0 <5.0 <5.0 <1.0 <1.0 <5.0
MW-7 7/15/2015 <5.0 <5.0 <5.0 <5.0 <5.0 <5.0 <1.0 <1.0 <5.0
MW-7 11/2/2015 <5.0 <5.0 <5.0 <5.0 <5.0 <5.0 <1.0 <1.0 <5.0
MW-7 2/2/2016 <5.0 <5.0 <5.0 <5.0 <5.0 <5.0 1.6 <1.0 <5.0
MW-7 5/26/2016 <5.0 <5.0 <5.0 <5.0 <5.0 <5.0 <1.0 <1.0 <5.0
MW-7 8/23/2016 <5.0 <5.0 <5.0 <5.0 <5.0 <5.0 <1.0 <1.0 <5.0
MW-7 10/26/2016 <5.0 <5.0 <5.0 <5.0 <5.0 <5.0 <1.0 <1.0 <5.0
MW-7 1/26/2017 <5.0 <5.0 <5.0 <5.0 <5.0 <5.0 <1.0 <1.0 <5.0
MW-7 4/24/2017 <5.0 <5.0 <5.0 <5.0 <5.0 <5.0 <1.0 <1.0 <5.0
MW-7 8/3/2017 <5.0 <5.0 <5.0 <5.0 <5.0 <5.0 <1.0 <1.0 <5.0
MW-7 11/2/2017 <5.0 <5.0 <5.0 <5.0 <5.0 <5.0 <1.0 <1.0 <5.0
OW-2 4/24/2017 5.5 <5.0 <5.0 <5.0 <5.0 <5.0 <1.0 <1.0 <5.0
OW-2 11/2/2017 368 <5.0 <5.0 <5.0 <5.0 7.8 2.5 <1.0 34.3
Strorm Sewer 4/24/2017 <5.0 <5.0 <5.0 <5.0 <5.0 <5.0 <1.0 <1.0 <5.0
Notes:
All concentrations provided in micrograms per liter (ug/l)
* Medium Specific Concentrations,Residential Statewide Health Standards, Used Aquifers (TDS≤2500)
Bold values denote exceedences of the Statewide Health Standards
Page 3 of 311/21/2017
RAPR T_2_Groundwater_Analytical_Table.xls

Remedial Action Progress Report Fourth Quarter 2017
Chiquita Holdings, Fuel On Service Station PADEP Facility I.D #17-31221
APPENDICES

Remedial Action Progress Report Fourth Quarter 2017
Chiquita Holdings, Fuel On Service Station PADEP Facility I.D #17-31221
APPENDIX A
Laboratory Analytical Reports
#=CL#
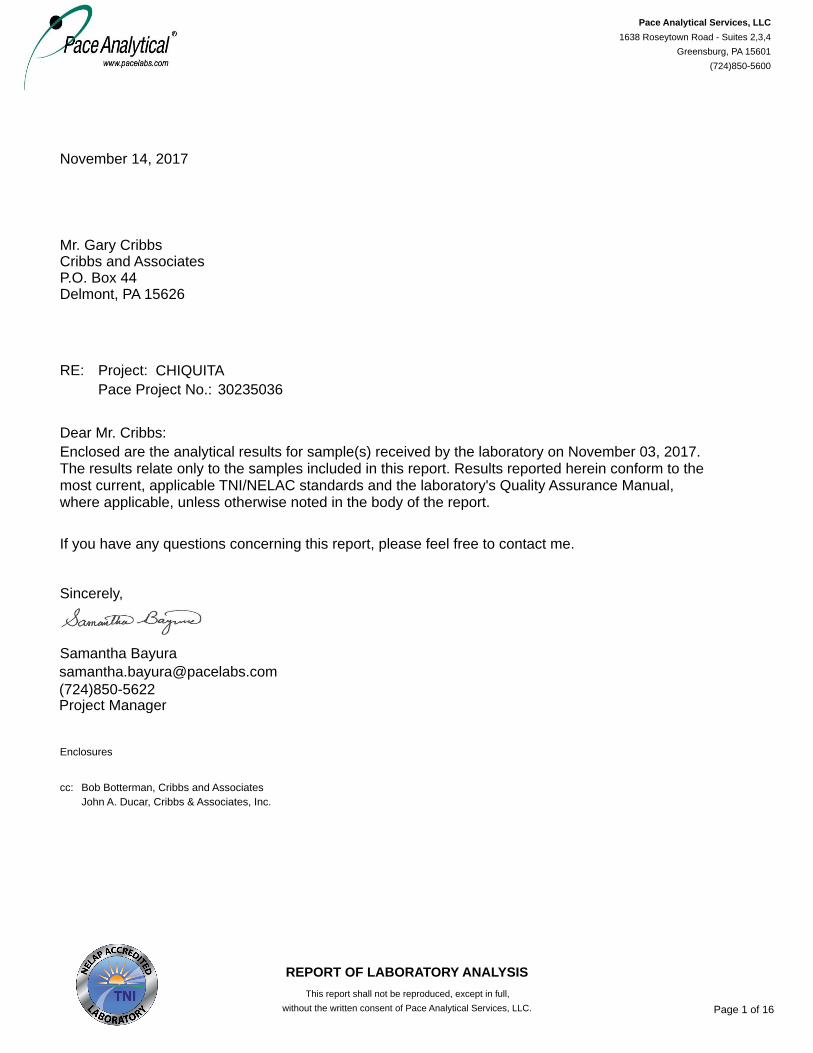
November 14, 2017
LIMS USE: FR - GARY CRIBBSLIMS OBJECT ID: 30235036
30235036Project:Pace Project No.:
RE:
Mr. Gary CribbsCribbs and AssociatesP.O. Box 44Delmont, PA 15626
CHIQUITA
Dear Mr. Cribbs:Enclosed are the analytical results for sample(s) received by the laboratory on November 03, 2017.The results relate only to the samples included in this report. Results reported herein conform to themost current, applicable TNI/NELAC standards and the laboratory's Quality Assurance Manual,where applicable, unless otherwise noted in the body of the report.
If you have any questions concerning this report, please feel free to contact me.
Sincerely,
Samantha [email protected]
Project Manager(724)850-5622
Enclosures
cc: Bob Botterman, Cribbs and AssociatesJohn A. Ducar, Cribbs & Associates, Inc.
REPORT OF LABORATORY ANALYSISThis report shall not be reproduced, except in full,
without the written consent of Pace Analytical Services, LLC.
Pace Analytical Services, LLC1638 Roseytown Road - Suites 2,3,4
Greensburg, PA 15601(724)850-5600
Page 1 of 16

#=CP#
CERTIFICATIONS
Pace Project No.:Project:
30235036CHIQUITA
Pennsylvania Certification IDs1638 Roseytown Rd Suites 2,3&4, Greensburg, PA 15601L-A-B DOD-ELAP Accreditation #: L2417Alabama Certification #: 41590Arizona Certification #: AZ0734Arkansas CertificationCalifornia Certification #: 04222CAColorado CertificationConnecticut Certification #: PH-0694Delaware CertificationFlorida/TNI Certification #: E87683Georgia Certification #: C040Guam CertificationHawaii CertificationIdaho CertificationIllinois CertificationIndiana CertificationIowa Certification #: 391Kansas/TNI Certification #: E-10358Kentucky Certification #: 90133Louisiana DHH/TNI Certification #: LA140008Louisiana DEQ/TNI Certification #: 4086Maine Certification #: PA00091Maryland Certification #: 308Massachusetts Certification #: M-PA1457Michigan/PADEP CertificationMissouri Certification #: 235
Montana Certification #: Cert 0082Nebraska Certification #: NE-05-29-14Nevada Certification #: PA014572015-1New Hampshire/TNI Certification #: 2976New Jersey/TNI Certification #: PA 051New Mexico Certification #: PA01457New York/TNI Certification #: 10888North Carolina Certification #: 42706North Dakota Certification #: R-190Oregon/TNI Certification #: PA200002Pennsylvania/TNI Certification #: 65-00282Puerto Rico Certification #: PA01457Rhode Island Certification #: 65-00282South Dakota CertificationTennessee Certification #: TN2867Texas/TNI Certification #: T104704188-14-8Utah/TNI Certification #: PA014572015-5USDA Soil Permit #: P330-14-00213Vermont Dept. of Health: ID# VT-0282Virgin Island/PADEP CertificationVirginia/VELAP Certification #: 460198Washington Certification #: C868West Virginia DEP Certification #: 143West Virginia DHHR Certification #: 9964CWisconsin CertificationWyoming Certification #: 8TMS-L
REPORT OF LABORATORY ANALYSISThis report shall not be reproduced, except in full,
without the written consent of Pace Analytical Services, LLC.
Pace Analytical Services, LLC1638 Roseytown Road - Suites 2,3,4
Greensburg, PA 15601(724)850-5600
Page 2 of 16

#=SA#
SAMPLE ANALYTE COUNT
Pace Project No.:Project:
30235036CHIQUITA
Lab ID Sample ID MethodAnalytesReported LaboratoryAnalysts
30235036001 MW-1 EPA 8260B 13 PASI-PARES
30235036002 MW-2 EPA 8260B 13 PASI-PAJAS
30235036003 MW-3 EPA 8260B 13 PASI-PAJAS
30235036004 MW-4 EPA 8260B 13 PASI-PAJAS
30235036005 MW-5 EPA 8260B 13 PASI-PAJAS
30235036006 MW-6 EPA 8260B 13 PASI-PAJAS
30235036007 MW-7 EPA 8260B 13 PASI-PAJAS
30235036008 SE OBS WELL EPA 8260B 13 PASI-PAJAS
REPORT OF LABORATORY ANALYSISThis report shall not be reproduced, except in full,
without the written consent of Pace Analytical Services, LLC.
Pace Analytical Services, LLC1638 Roseytown Road - Suites 2,3,4
Greensburg, PA 15601(724)850-5600
Page 3 of 16

#=NA#
PROJECT NARRATIVE
Pace Project No.:Project:
30235036CHIQUITA
Method:
Client: Cribbs and Associates
EPA 8260B
Date: November 14, 2017
Description: 8260B MSV
General Information:8 samples were analyzed for EPA 8260B. All samples were received in acceptable condition with any exceptions noted below or on thechain-of custody and/or the sample condition upon receipt form (SCUR) attached at the end of this report.
Hold Time:The samples were analyzed within the method required hold times with any exceptions noted below.
Initial Calibrations (including MS Tune as applicable):All criteria were within method requirements with any exceptions noted below.
Continuing Calibration:All criteria were within method requirements with any exceptions noted below.
Internal Standards:All internal standards were within QC limits with any exceptions noted below.
Surrogates:All surrogates were within QC limits with any exceptions noted below.
Method Blank:All analytes were below the report limit in the method blank, where applicable, with any exceptions noted below.
Laboratory Control Spike:All laboratory control spike compounds were within QC limits with any exceptions noted below.
Matrix Spikes:All percent recoveries and relative percent differences (RPDs) were within acceptance criteria with any exceptions noted below.
Additional Comments:
This data package has been reviewed for quality and completeness and is approved for release.
REPORT OF LABORATORY ANALYSISThis report shall not be reproduced, except in full,
without the written consent of Pace Analytical Services, LLC.
Pace Analytical Services, LLC1638 Roseytown Road - Suites 2,3,4
Greensburg, PA 15601(724)850-5600
Page 4 of 16

#=AR#
ANALYTICAL RESULTS
Pace Project No.:Project:
30235036CHIQUITA
Sample: MW-1 Lab ID: 30235036001 Collected: 11/02/17 11:40 Received: 11/03/17 16:34 Matrix: Water
Parameters Results Units DF Prepared Analyzed CAS No. QualReport Limit
Analytical Method: EPA 8260B8260B MSV
Benzene 663 ug/L 11/08/17 20:44 71-43-250.0 10Ethylbenzene ND ug/L 11/08/17 20:16 100-41-45.0 1Isopropylbenzene (Cumene) 5.6 ug/L 11/08/17 20:16 98-82-85.0 1Methyl-tert-butyl ether 6.9 ug/L 11/08/17 20:16 1634-04-45.0 1Naphthalene ND ug/L 11/08/17 20:16 91-20-35.0 1Toluene 5.3 ug/L 11/08/17 20:16 108-88-35.0 11,2,4-Trimethylbenzene ND ug/L 11/08/17 20:16 95-63-65.0 11,3,5-Trimethylbenzene ND ug/L 11/08/17 20:16 108-67-85.0 1Xylene (Total) 17.4 ug/L 11/08/17 20:16 1330-20-75.0 1SurrogatesToluene-d8 (S) 96 % 11/08/17 20:16 2037-26-580-120 14-Bromofluorobenzene (S) 100 % 11/08/17 20:16 460-00-479-129 11,2-Dichloroethane-d4 (S) 99 % 11/08/17 20:16 17060-07-080-120 1Dibromofluoromethane (S) 92 % 11/08/17 20:16 1868-53-780-120 1
Sample: MW-2 Lab ID: 30235036002 Collected: 11/02/17 13:00 Received: 11/03/17 16:34 Matrix: Water
Parameters Results Units DF Prepared Analyzed CAS No. QualReport Limit
Analytical Method: EPA 8260B8260B MSV
Benzene 429 ug/L 11/07/17 08:06 71-43-250.0 10Ethylbenzene ND ug/L 11/07/17 07:41 100-41-45.0 1Isopropylbenzene (Cumene) ND ug/L 11/07/17 07:41 98-82-85.0 1Methyl-tert-butyl ether ND ug/L 11/07/17 07:41 1634-04-45.0 1Naphthalene ND ug/L 11/07/17 07:41 91-20-35.0 1Toluene 13.8 ug/L 11/07/17 07:41 108-88-35.0 11,2,4-Trimethylbenzene 7.4 ug/L 11/07/17 07:41 95-63-61.0 11,3,5-Trimethylbenzene 1.7 ug/L 11/07/17 07:41 108-67-81.0 1Xylene (Total) 45.8 ug/L 11/07/17 07:41 1330-20-75.0 1SurrogatesToluene-d8 (S) 100 % 11/07/17 07:41 2037-26-580-120 14-Bromofluorobenzene (S) 94 % 11/07/17 07:41 460-00-479-129 11,2-Dichloroethane-d4 (S) 95 % 11/07/17 07:41 17060-07-080-120 1Dibromofluoromethane (S) 95 % 11/07/17 07:41 1868-53-780-120 1
Sample: MW-3 Lab ID: 30235036003 Collected: 11/02/17 14:00 Received: 11/03/17 16:34 Matrix: Water
Parameters Results Units DF Prepared Analyzed CAS No. QualReport Limit
Analytical Method: EPA 8260B8260B MSV
Benzene 362 ug/L 11/07/17 08:31 71-43-25.0 1Ethylbenzene 7.4 ug/L 11/07/17 08:31 100-41-45.0 1Isopropylbenzene (Cumene) 48.9 ug/L 11/07/17 08:31 98-82-85.0 1Methyl-tert-butyl ether 15.5 ug/L 11/07/17 08:31 1634-04-45.0 1Naphthalene 38.2 ug/L 11/07/17 08:31 91-20-35.0 1
REPORT OF LABORATORY ANALYSISThis report shall not be reproduced, except in full,
without the written consent of Pace Analytical Services, LLC.Date: 11/14/2017 09:02 AM
Pace Analytical Services, LLC1638 Roseytown Road - Suites 2,3,4
Greensburg, PA 15601(724)850-5600
Page 5 of 16

#=AR#
ANALYTICAL RESULTS
Pace Project No.:Project:
30235036CHIQUITA
Sample: MW-3 Lab ID: 30235036003 Collected: 11/02/17 14:00 Received: 11/03/17 16:34 Matrix: Water
Parameters Results Units DF Prepared Analyzed CAS No. QualReport Limit
Analytical Method: EPA 8260B8260B MSV
Toluene 8.2 ug/L 11/07/17 08:31 108-88-35.0 11,2,4-Trimethylbenzene 21.6 ug/L 11/07/17 08:31 95-63-61.0 11,3,5-Trimethylbenzene 5.3 ug/L 11/07/17 08:31 108-67-81.0 1Xylene (Total) 38.9 ug/L 11/07/17 08:31 1330-20-75.0 1SurrogatesToluene-d8 (S) 96 % 11/07/17 08:31 2037-26-580-120 14-Bromofluorobenzene (S) 94 % 11/07/17 08:31 460-00-479-129 11,2-Dichloroethane-d4 (S) 99 % 11/07/17 08:31 17060-07-080-120 1Dibromofluoromethane (S) 96 % 11/07/17 08:31 1868-53-780-120 1
Sample: MW-4 Lab ID: 30235036004 Collected: 11/02/17 15:10 Received: 11/03/17 16:34 Matrix: Water
Parameters Results Units DF Prepared Analyzed CAS No. QualReport Limit
Analytical Method: EPA 8260B8260B MSV
Benzene ND ug/L 11/07/17 02:00 71-43-25.0 1Ethylbenzene 18.5 ug/L 11/07/17 02:00 100-41-45.0 1Isopropylbenzene (Cumene) 11.8 ug/L 11/07/17 02:00 98-82-85.0 1Methyl-tert-butyl ether ND ug/L 11/07/17 02:00 1634-04-45.0 1Naphthalene 16.1 ug/L 11/07/17 02:00 91-20-35.0 1Toluene ND ug/L 11/07/17 02:00 108-88-35.0 11,2,4-Trimethylbenzene 121 ug/L 11/07/17 02:00 95-63-61.0 11,3,5-Trimethylbenzene 9.1 ug/L 11/07/17 02:00 108-67-81.0 1Xylene (Total) 19.8 ug/L 11/07/17 02:00 1330-20-75.0 1SurrogatesToluene-d8 (S) 99 % 11/07/17 02:00 2037-26-580-120 14-Bromofluorobenzene (S) 95 % 11/07/17 02:00 460-00-479-129 11,2-Dichloroethane-d4 (S) 96 % 11/07/17 02:00 17060-07-080-120 1Dibromofluoromethane (S) 98 % 11/07/17 02:00 1868-53-780-120 1
Sample: MW-5 Lab ID: 30235036005 Collected: 11/02/17 14:20 Received: 11/03/17 16:34 Matrix: Water
Parameters Results Units DF Prepared Analyzed CAS No. QualReport Limit
Analytical Method: EPA 8260B8260B MSV
Benzene ND ug/L 11/07/17 02:25 71-43-25.0 1Ethylbenzene ND ug/L 11/07/17 02:25 100-41-45.0 1Isopropylbenzene (Cumene) ND ug/L 11/07/17 02:25 98-82-85.0 1Methyl-tert-butyl ether ND ug/L 11/07/17 02:25 1634-04-45.0 1Naphthalene ND ug/L 11/07/17 02:25 91-20-35.0 1Toluene ND ug/L 11/07/17 02:25 108-88-35.0 11,2,4-Trimethylbenzene ND ug/L 11/07/17 02:25 95-63-65.0 11,3,5-Trimethylbenzene ND ug/L 11/07/17 02:25 108-67-85.0 1Xylene (Total) ND ug/L 11/07/17 02:25 1330-20-75.0 1
REPORT OF LABORATORY ANALYSISThis report shall not be reproduced, except in full,
without the written consent of Pace Analytical Services, LLC.Date: 11/14/2017 09:02 AM
Pace Analytical Services, LLC1638 Roseytown Road - Suites 2,3,4
Greensburg, PA 15601(724)850-5600
Page 6 of 16

#=AR#
ANALYTICAL RESULTS
Pace Project No.:Project:
30235036CHIQUITA
Sample: MW-5 Lab ID: 30235036005 Collected: 11/02/17 14:20 Received: 11/03/17 16:34 Matrix: Water
Parameters Results Units DF Prepared Analyzed CAS No. QualReport Limit
Analytical Method: EPA 8260B8260B MSV
SurrogatesToluene-d8 (S) 98 % 11/07/17 02:25 2037-26-580-120 14-Bromofluorobenzene (S) 97 % 11/07/17 02:25 460-00-479-129 11,2-Dichloroethane-d4 (S) 99 % 11/07/17 02:25 17060-07-080-120 1Dibromofluoromethane (S) 98 % 11/07/17 02:25 1868-53-780-120 1
Sample: MW-6 Lab ID: 30235036006 Collected: 11/02/17 11:30 Received: 11/03/17 16:34 Matrix: Water
Parameters Results Units DF Prepared Analyzed CAS No. QualReport Limit
Analytical Method: EPA 8260B8260B MSV
Benzene ND ug/L 11/07/17 02:50 71-43-25.0 1Ethylbenzene ND ug/L 11/07/17 02:50 100-41-45.0 1Isopropylbenzene (Cumene) ND ug/L 11/07/17 02:50 98-82-85.0 1Methyl-tert-butyl ether ND ug/L 11/07/17 02:50 1634-04-45.0 1Naphthalene ND ug/L 11/07/17 02:50 91-20-35.0 1Toluene ND ug/L 11/07/17 02:50 108-88-35.0 11,2,4-Trimethylbenzene ND ug/L 11/07/17 02:50 95-63-61.0 11,3,5-Trimethylbenzene ND ug/L 11/07/17 02:50 108-67-81.0 1Xylene (Total) ND ug/L 11/07/17 02:50 1330-20-75.0 1SurrogatesToluene-d8 (S) 98 % 11/07/17 02:50 2037-26-580-120 14-Bromofluorobenzene (S) 95 % 11/07/17 02:50 460-00-479-129 11,2-Dichloroethane-d4 (S) 100 % 11/07/17 02:50 17060-07-080-120 1Dibromofluoromethane (S) 98 % 11/07/17 02:50 1868-53-780-120 1
Sample: MW-7 Lab ID: 30235036007 Collected: 11/02/17 10:35 Received: 11/03/17 16:34 Matrix: Water
Parameters Results Units DF Prepared Analyzed CAS No. QualReport Limit
Analytical Method: EPA 8260B8260B MSV
Benzene ND ug/L 11/07/17 03:16 71-43-25.0 1Ethylbenzene ND ug/L 11/07/17 03:16 100-41-45.0 1Isopropylbenzene (Cumene) ND ug/L 11/07/17 03:16 98-82-85.0 1Methyl-tert-butyl ether ND ug/L 11/07/17 03:16 1634-04-45.0 1Naphthalene ND ug/L 11/07/17 03:16 91-20-35.0 1Toluene ND ug/L 11/07/17 03:16 108-88-35.0 11,2,4-Trimethylbenzene ND ug/L 11/07/17 03:16 95-63-61.0 11,3,5-Trimethylbenzene ND ug/L 11/07/17 03:16 108-67-81.0 1Xylene (Total) ND ug/L 11/07/17 03:16 1330-20-75.0 1SurrogatesToluene-d8 (S) 98 % 11/07/17 03:16 2037-26-580-120 14-Bromofluorobenzene (S) 96 % 11/07/17 03:16 460-00-479-129 11,2-Dichloroethane-d4 (S) 98 % 11/07/17 03:16 17060-07-080-120 1Dibromofluoromethane (S) 97 % 11/07/17 03:16 1868-53-780-120 1
REPORT OF LABORATORY ANALYSISThis report shall not be reproduced, except in full,
without the written consent of Pace Analytical Services, LLC.Date: 11/14/2017 09:02 AM
Pace Analytical Services, LLC1638 Roseytown Road - Suites 2,3,4
Greensburg, PA 15601(724)850-5600
Page 7 of 16
#=AR#
ANALYTICAL RESULTS
Pace Project No.:Project:
30235036CHIQUITA
Sample: SE OBS WELL Lab ID: 30235036008 Collected: 11/02/17 13:05 Received: 11/03/17 16:34 Matrix: Water
Parameters Results Units DF Prepared Analyzed CAS No. QualReport Limit
Analytical Method: EPA 8260B8260B MSV
Benzene 368 ug/L 11/08/17 14:59 71-43-250.0 10Ethylbenzene ND ug/L 11/07/17 03:41 100-41-45.0 1Isopropylbenzene (Cumene) ND ug/L 11/07/17 03:41 98-82-85.0 1Methyl-tert-butyl ether ND ug/L 11/07/17 03:41 1634-04-45.0 1Naphthalene ND ug/L 11/07/17 03:41 91-20-35.0 1Toluene 7.8 ug/L 11/07/17 03:41 108-88-35.0 11,2,4-Trimethylbenzene 2.5 ug/L 11/07/17 03:41 95-63-61.0 11,3,5-Trimethylbenzene ND ug/L 11/07/17 03:41 108-67-81.0 1Xylene (Total) 34.3 ug/L 11/07/17 03:41 1330-20-75.0 1SurrogatesToluene-d8 (S) 99 % 11/07/17 03:41 2037-26-580-120 14-Bromofluorobenzene (S) 96 % 11/07/17 03:41 460-00-479-129 11,2-Dichloroethane-d4 (S) 95 % 11/07/17 03:41 17060-07-080-120 1Dibromofluoromethane (S) 96 % 11/07/17 03:41 1868-53-780-120 1
REPORT OF LABORATORY ANALYSISThis report shall not be reproduced, except in full,
without the written consent of Pace Analytical Services, LLC.Date: 11/14/2017 09:02 AM
Pace Analytical Services, LLC1638 Roseytown Road - Suites 2,3,4
Greensburg, PA 15601(724)850-5600
Page 8 of 16

#=QC#
QUALITY CONTROL DATA
Pace Project No.:Project:
30235036CHIQUITA
Results presented on this page are in the units indicated by the "Units" column except where an alternate unit is presented to the right of the result.
QC Batch:QC Batch Method:
Analysis Method:Analysis Description:
278138EPA 8260B
EPA 8260B8260B MSV UST-WATER
Associated Lab Samples: 30235036002, 30235036003, 30235036004, 30235036005, 30235036006, 30235036007, 30235036008
Parameter UnitsBlankResult
ReportingLimit Qualifiers
METHOD BLANK: 1366417Associated Lab Samples: 30235036002, 30235036003, 30235036004, 30235036005, 30235036006, 30235036007, 30235036008
Matrix: Water
Analyzed
1,2,4-Trimethylbenzene ug/L ND 1.0 11/07/17 00:181,3,5-Trimethylbenzene ug/L ND 1.0 11/07/17 00:18Benzene ug/L ND 1.0 11/07/17 00:18Ethylbenzene ug/L ND 1.0 11/07/17 00:18Isopropylbenzene (Cumene) ug/L ND 1.0 11/07/17 00:18Methyl-tert-butyl ether ug/L ND 1.0 11/07/17 00:18Naphthalene ug/L ND 2.0 11/07/17 00:18Toluene ug/L ND 1.0 11/07/17 00:18Xylene (Total) ug/L ND 3.0 11/07/17 00:181,2-Dichloroethane-d4 (S) % 94 80-120 11/07/17 00:184-Bromofluorobenzene (S) % 97 79-129 11/07/17 00:18Dibromofluoromethane (S) % 97 80-120 11/07/17 00:18Toluene-d8 (S) % 98 80-120 11/07/17 00:18
Parameter UnitsLCS
Result% RecLimits Qualifiers% RecConc.
1366418LABORATORY CONTROL SAMPLE:LCSSpike
1,2,4-Trimethylbenzene ug/L 18.420 92 70-1301,3,5-Trimethylbenzene ug/L 18.520 92 70-130Benzene ug/L 19.220 96 70-130Ethylbenzene ug/L 20.320 101 70-130Isopropylbenzene (Cumene) ug/L 18.820 94 70-130Methyl-tert-butyl ether ug/L 21.820 109 70-130Naphthalene ug/L 18.820 94 70-130Toluene ug/L 19.420 97 70-130Xylene (Total) ug/L 60.560 101 70-1301,2-Dichloroethane-d4 (S) % 95 80-1204-Bromofluorobenzene (S) % 97 79-129Dibromofluoromethane (S) % 96 80-120Toluene-d8 (S) % 99 80-120
Parameter UnitsMS
Result% RecLimits Qual% RecConc.
1366419MATRIX SPIKE & MATRIX SPIKE DUPLICATE:
MSSpikeResult
30234955001
1366420
MSDResult
MSD% Rec RPD
MSDMSSpikeConc.
1,2,4-Trimethylbenzene ug/L 20 98 75-125106 720ND 19.6 21.11,3,5-Trimethylbenzene ug/L 20 99 76-121107 820ND 19.9 21.5Benzene ug/L 20 108 67-121113 420ND 21.6 22.5
REPORT OF LABORATORY ANALYSISThis report shall not be reproduced, except in full,
without the written consent of Pace Analytical Services, LLC.Date: 11/14/2017 09:02 AM
Pace Analytical Services, LLC1638 Roseytown Road - Suites 2,3,4
Greensburg, PA 15601(724)850-5600
Page 9 of 16

#=QC#
QUALITY CONTROL DATA
Pace Project No.:Project:
30235036CHIQUITA
Results presented on this page are in the units indicated by the "Units" column except where an alternate unit is presented to the right of the result.
Parameter UnitsMS
Result% RecLimits Qual% RecConc.
1366419MATRIX SPIKE & MATRIX SPIKE DUPLICATE:
MSSpikeResult
30234955001
1366420
MSDResult
MSD% Rec RPD
MSDMSSpikeConc.
Ethylbenzene ug/L 20 115 70-127117 220ND 23.0 23.3Isopropylbenzene (Cumene) ug/L 20 106 80-122110 420ND 21.1 22.0Methyl-tert-butyl ether ug/L 20 114 79-135113 020ND 22.7 22.7Naphthalene ug/L 20 91 62-13197 720ND 18.2 19.5Toluene ug/L 20 110 77-125111 020ND 22.1 22.1Xylene (Total) ug/L 60 114 69-128113 060ND 68.1 68.01,2-Dichloroethane-d4 (S) % 95 80-120984-Bromofluorobenzene (S) % 98 79-12996Dibromofluoromethane (S) % 96 80-12099Toluene-d8 (S) % 100 80-12097
REPORT OF LABORATORY ANALYSISThis report shall not be reproduced, except in full,
without the written consent of Pace Analytical Services, LLC.Date: 11/14/2017 09:02 AM
Pace Analytical Services, LLC1638 Roseytown Road - Suites 2,3,4
Greensburg, PA 15601(724)850-5600
Page 10 of 16

#=QC#
QUALITY CONTROL DATA
Pace Project No.:Project:
30235036CHIQUITA
Results presented on this page are in the units indicated by the "Units" column except where an alternate unit is presented to the right of the result.
QC Batch:QC Batch Method:
Analysis Method:Analysis Description:
278391EPA 8260B
EPA 8260B8260B MSV UST-WATER
Associated Lab Samples: 30235036001
Parameter UnitsBlankResult
ReportingLimit Qualifiers
METHOD BLANK: 1367426Associated Lab Samples: 30235036001
Matrix: Water
Analyzed
1,2,4-Trimethylbenzene ug/L ND 1.0 11/08/17 13:301,3,5-Trimethylbenzene ug/L ND 1.0 11/08/17 13:30Benzene ug/L ND 1.0 11/08/17 13:30Ethylbenzene ug/L ND 1.0 11/08/17 13:30Isopropylbenzene (Cumene) ug/L ND 1.0 11/08/17 13:30Methyl-tert-butyl ether ug/L ND 1.0 11/08/17 13:30Naphthalene ug/L ND 2.0 11/08/17 13:30Toluene ug/L ND 1.0 11/08/17 13:30Xylene (Total) ug/L ND 3.0 11/08/17 13:301,2-Dichloroethane-d4 (S) % 105 80-120 11/08/17 13:304-Bromofluorobenzene (S) % 101 79-129 11/08/17 13:30Dibromofluoromethane (S) % 100 80-120 11/08/17 13:30Toluene-d8 (S) % 96 80-120 11/08/17 13:30
Parameter UnitsLCS
Result% RecLimits Qualifiers% RecConc.
1367427LABORATORY CONTROL SAMPLE:LCSSpike
1,2,4-Trimethylbenzene ug/L 19.420 97 70-1301,3,5-Trimethylbenzene ug/L 18.820 94 70-130Benzene ug/L 18.420 92 70-130Ethylbenzene ug/L 18.420 92 70-130Isopropylbenzene (Cumene) ug/L 18.820 94 70-130Methyl-tert-butyl ether ug/L 21.520 108 70-130Naphthalene ug/L 19.920 99 70-130Toluene ug/L 18.020 90 70-130Xylene (Total) ug/L 55.460 92 70-1301,2-Dichloroethane-d4 (S) % 99 80-1204-Bromofluorobenzene (S) % 100 79-129Dibromofluoromethane (S) % 97 80-120Toluene-d8 (S) % 97 80-120
Parameter UnitsMS
Result% RecLimits Qual% RecConc.
1367540MATRIX SPIKE & MATRIX SPIKE DUPLICATE:
MSSpikeResult
30235195001
1367541
MSDResult
MSD% Rec RPD
MSDMSSpikeConc.
1,2,4-Trimethylbenzene ug/L 20 112 75-125107 520ND 22.5 21.51,3,5-Trimethylbenzene ug/L 20 111 76-121106 420ND 22.1 21.2Benzene ug/L 20 111 67-121106 420ND 22.1 21.2
REPORT OF LABORATORY ANALYSISThis report shall not be reproduced, except in full,
without the written consent of Pace Analytical Services, LLC.Date: 11/14/2017 09:02 AM
Pace Analytical Services, LLC1638 Roseytown Road - Suites 2,3,4
Greensburg, PA 15601(724)850-5600
Page 11 of 16

#=QC#
QUALITY CONTROL DATA
Pace Project No.:Project:
30235036CHIQUITA
Results presented on this page are in the units indicated by the "Units" column except where an alternate unit is presented to the right of the result.
Parameter UnitsMS
Result% RecLimits Qual% RecConc.
1367540MATRIX SPIKE & MATRIX SPIKE DUPLICATE:
MSSpikeResult
30235195001
1367541
MSDResult
MSD% Rec RPD
MSDMSSpikeConc.
Ethylbenzene ug/L 20 112 70-127106 520ND 22.3 21.2Isopropylbenzene (Cumene) ug/L 20 113 80-122109 320ND 22.6 21.9Methyl-tert-butyl ether ug/L 20 109 79-135115 520ND 21.9 22.9Naphthalene ug/L 20 100 62-13192 820ND 19.9 18.4Toluene ug/L 20 111 77-125106 420ND 22.2 21.3Xylene (Total) ug/L 60 112 69-128106 560ND 67.3 63.91,2-Dichloroethane-d4 (S) % 101 80-1201024-Bromofluorobenzene (S) % 98 79-12999Dibromofluoromethane (S) % 98 80-12098Toluene-d8 (S) % 98 80-12097
REPORT OF LABORATORY ANALYSISThis report shall not be reproduced, except in full,
without the written consent of Pace Analytical Services, LLC.Date: 11/14/2017 09:02 AM
Pace Analytical Services, LLC1638 Roseytown Road - Suites 2,3,4
Greensburg, PA 15601(724)850-5600
Page 12 of 16
#=QL#
QUALIFIERS
Pace Project No.:Project:
30235036CHIQUITA
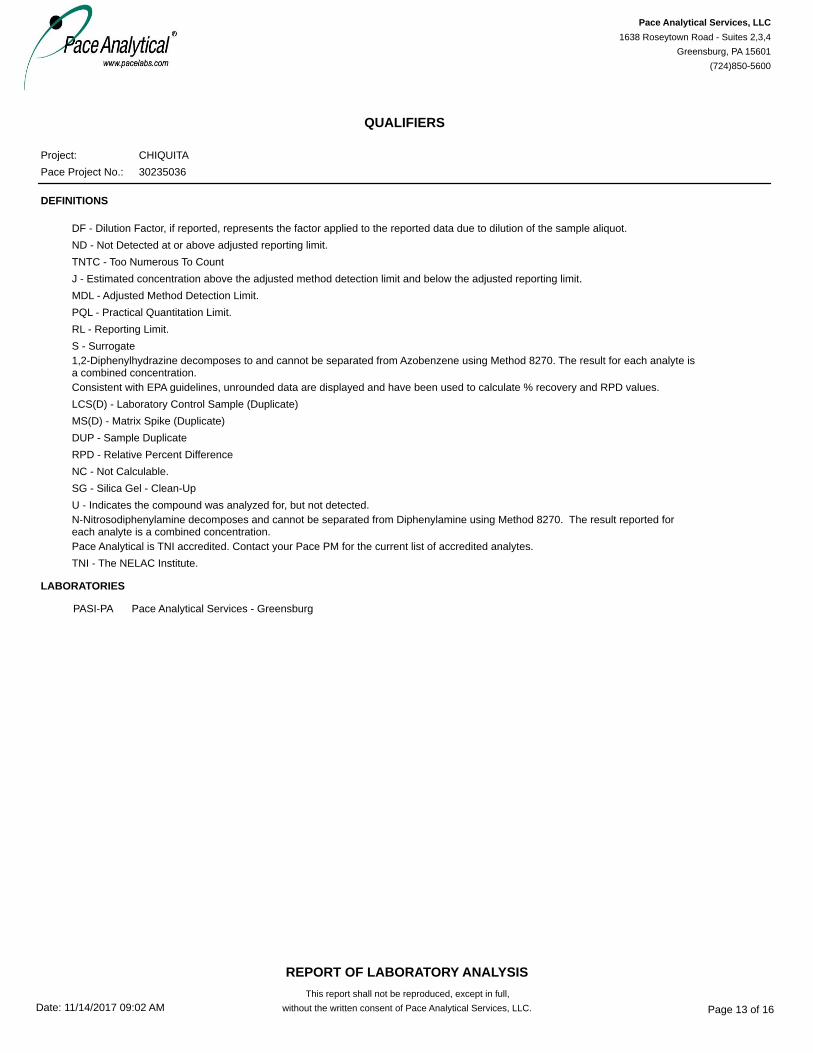
DEFINITIONS
DF - Dilution Factor, if reported, represents the factor applied to the reported data due to dilution of the sample aliquot.ND - Not Detected at or above adjusted reporting limit.TNTC - Too Numerous To CountJ - Estimated concentration above the adjusted method detection limit and below the adjusted reporting limit.MDL - Adjusted Method Detection Limit.PQL - Practical Quantitation Limit.RL - Reporting Limit.S - Surrogate1,2-Diphenylhydrazine decomposes to and cannot be separated from Azobenzene using Method 8270. The result for each analyte isa combined concentration.Consistent with EPA guidelines, unrounded data are displayed and have been used to calculate % recovery and RPD values.LCS(D) - Laboratory Control Sample (Duplicate)MS(D) - Matrix Spike (Duplicate)DUP - Sample DuplicateRPD - Relative Percent DifferenceNC - Not Calculable.SG - Silica Gel - Clean-UpU - Indicates the compound was analyzed for, but not detected.N-Nitrosodiphenylamine decomposes and cannot be separated from Diphenylamine using Method 8270. The result reported foreach analyte is a combined concentration.Pace Analytical is TNI accredited. Contact your Pace PM for the current list of accredited analytes.TNI - The NELAC Institute.
LABORATORIES
Pace Analytical Services - GreensburgPASI-PA
REPORT OF LABORATORY ANALYSISThis report shall not be reproduced, except in full,
without the written consent of Pace Analytical Services, LLC.Date: 11/14/2017 09:02 AM
Pace Analytical Services, LLC1638 Roseytown Road - Suites 2,3,4
Greensburg, PA 15601(724)850-5600
Page 13 of 16

#=CR#
QUALITY CONTROL DATA CROSS REFERENCE TABLE
Pace Project No.:Project:
30235036CHIQUITA
Lab ID Sample ID QC Batch Method QC Batch Analytical MethodAnalyticalBatch
30235036001 278391MW-1 EPA 8260B
30235036002 278138MW-2 EPA 8260B30235036003 278138MW-3 EPA 8260B30235036004 278138MW-4 EPA 8260B30235036005 278138MW-5 EPA 8260B30235036006 278138MW-6 EPA 8260B30235036007 278138MW-7 EPA 8260B30235036008 278138SE OBS WELL EPA 8260B
REPORT OF LABORATORY ANALYSISThis report shall not be reproduced, except in full,
without the written consent of Pace Analytical Services, LLC.Date: 11/14/2017 09:02 AM
Pace Analytical Services, LLC1638 Roseytown Road - Suites 2,3,4
Greensburg, PA 15601(724)850-5600
Page 14 of 16

Page 15 of 16

Page 16 of 16

Remedial Action Progress Report Fourth Quarter 2017
Chiquita Holdings, Fuel On Service Station PADEP Facility I.D #17-31221
APPENDIX B
Trend Graphs
App
endi
x B
Tre
nd G
raph
sC
hiqu
ita
Hol
ding
s -
Fuel
On
Ser
vice
Sta
tion
Cur
wen
svill
e, P
enns
ylva
nia
PAD
EP
Faci
lity
ID
17-
3122
1
251
159
219
82.3
137
89.8
324
51.1
104
327
219
118
85.6
225
663
y =
0.10
99x
-445
2R²
= 0
.098
5
0
100
200
300
400
500
600
700
9/1/2013
11/1/2013
1/1/2014
3/1/2014
5/1/2014
7/1/2014
9/1/2014
11/1/2014
1/1/2015
3/1/2015
5/1/2015
7/1/2015
9/1/2015
11/1/2015
1/1/2016
3/1/2016
5/1/2016
7/1/2016
9/1/2016
11/1/2016
1/1/2017
3/1/2017
5/1/2017
7/1/2017
9/1/2017
11/1/2017
1/1/2018
Concentration ug/l
Dat
e
Benz
ene
Conc
entr
atio
ns -
MW
-1
Benz
ene
5
Line
ar (B
enze
ne 5
)
Pag
e 1
of 1

App
endi
x B
Tre
nd G
raph
sC
hiqu
ita
Hol
ding
s -
Fuel
On
Ser
vice
Sta
tion
Cur
wen
svill
e, P
enns
ylva
nia
PAD
EP
Faci
lity
ID
17-
3122
1
231
<5.0
48.3
<5.0
<5.0
8.1
72.5
10.2
<5.0
503
206
22.5
12.8
412
429
y =
0.17
57x
-731
4R²
= 0
.183
6
0
100
200
300
400
500
600
9/1/2013
11/1/2013
1/1/2014
3/1/2014
5/1/2014
7/1/2014
9/1/2014
11/1/2014
1/1/2015
3/1/2015
5/1/2015
7/1/2015
9/1/2015
11/1/2015
1/1/2016
3/1/2016
5/1/2016
7/1/2016
9/1/2016
11/1/2016
1/1/2017
3/1/2017
5/1/2017
7/1/2017
9/1/2017
11/1/2017
1/1/2018
Concentration ug/l
Dat
e
Benz
ene
Conc
entr
atio
ns -
MW
-2
Benz
ene
5
Line
ar (B
enze
ne 5
)
Pag
e 1
of 1
App
endi
x B
Tre
nd G
raph
sC
hiqu
ita
Hol
ding
s -
Fuel
On
Ser
vice
Sta
tion
Cur
wen
svill
e, P
enns
ylva
nia
PAD
EP
Faci
lity
ID
17-
3122
1
258
319
189
138
282
138
228
163
223
368
302
261
233
303
362
91.8
60.1
90.9
70.8
40.4
21.4
33.8
23.3
14.7
59.4
<50
16.9
11.9
44.9
21.6
28.6
17.1
18.7
13.7
7.8
6.4
9.0
5.2
7.4
14.0
5.9
3.2
105.
3
y =
0.06
12x
-234
2.9
R² =
0.1
341
y =
-0.0
462x
+ 1
996
R² =
0.4
986
y =
-0.0
124x
+ 5
37.2
3R²
= 0
.571
050100
150
200
250
300
350
400
9/1/2013
11/1/2013
1/1/2014
3/1/2014
5/1/2014
7/1/2014
9/1/2014
11/1/2014
1/1/2015
3/1/2015
5/1/2015
7/1/2015
9/1/2015
11/1/2015
1/1/2016
3/1/2016
5/1/2016
7/1/2016
9/1/2016
11/1/2016
1/1/2017
3/1/2017
5/1/2017
7/1/2017
9/1/2017
11/1/2017
1/1/2018
Concentration ug/l
Dat
e
Benz
ene,
1,2
,4-T
MB
and
1,3,
5-TM
B Co
ncen
trat
ions
-M
W-3
Benz
ene
5
1,2,
4-TM
B 15
1,3,
5-TM
B 4
20
Line
ar (B
enze
ne 5
)
Line
ar (1
,2,4
-TM
B 15
)
Line
ar (1
,3,5
-TM
B 4
20)
Pag
e 1
of 1

App
endi
x B
Tre
nd G
raph
sC
hiqu
ita
Hol
ding
s -
Fuel
On
Ser
vice
Sta
tion
Cur
wen
svill
e, P
enns
ylva
nia
PAD
EP
Faci
lity
ID
17-
3122
1
1,24
0
9.4
363
500
7.0
1.3
84.2
<1.0
306
4.9
1.1
25.8
121
359
3.9
77.2
141 1.
9<1
.0<1
.019
.8<1
.0
46.7
<1.0
<1.0
3.5
9.1
y =
-0.4
515x
+ 1
9309
R² =
0.3
539
y =
-0.1
368x
+ 5
841.
2R²
= 0
.396
1
0
200
400
600
800
1,00
0
1,20
0
1,40
0
9/1/2013
11/1/2013
1/1/2014
3/1/2014
5/1/2014
7/1/2014
9/1/2014
11/1/2014
1/1/2015
3/1/2015
5/1/2015
7/1/2015
9/1/2015
11/1/2015
1/1/2016
3/1/2016
5/1/2016
7/1/2016
9/1/2016
11/1/2016
1/1/2017
3/1/2017
5/1/2017
7/1/2017
9/1/2017
11/1/2017
1/1/2018
Concentration ug/l
Dat
e
1,2,
4-TM
B an
d 1,
3,5-
TMB
Conc
entr
atio
ns -
MW
-4 1,2,
4-TM
B 15
1,3,
5-TM
B 4
20
Line
ar (1
,2,4
-TM
B 15
)
Line
ar (1
,3,5
-TM
B 4
20)
Pag
e 1
of 1