remedial interventions for students with dyslexia:...
TRANSCRIPT
Remedial Interventions for Students with Dyslexia: National Goals and Current
Accomplishments
Joseph K. Torgesen
Florida Center for Reading Research at Florida State University
In Richardson, S., & Gilger, J. (Eds.) Research-Based Education and Intervention: What We Need to Know. (pp. 103-124) Boston: Intenational Dyslexia Association, 2005
The author’s research reported in this chapter was supported by grant HD30988 “Prevention and Remediation of Reading Disabilities,” from the National Institute of Child Health and Human Development. Please address all inquiries about this chapter to Joseph Torgesen, Florida Center for Reading Research, 227 N. Bronough St., Suite 7250, Tallahassee, FL 32301. E-mail: [email protected]
More than at any time before in our history, educators at the local, state, and national levels are focusing on the challenge of helping all children acquire proficiency in reading. The energy and direction behind this focus comes from a number of sources, with one of the most important being changes in society that are requiring ever higher levels of literacy in order to successfully enter and progress within the job market in our country. In a recent and influential consensus report about reading and reading instruction, the writers began with the introductory comment, “Current difficulties in reading largely originate from rising demands for literacy, not from declining absolute levels of literacy” (p. 1, Snow, Burns, & Griffin, 1998). It is widely acknowledged that these increasing demands for higher levels of literacy in the workforce require that we do better than we have ever done before in teaching all children to read well. Another source of motivation for the current focus on improving reading skills of students in the United States comes from heightened awareness that relatively large numbers of students in this country are struggling to become proficient readers by fourth grade. This heightened awareness is largely the result of the widely publicized results from the National Assessment of Educational Progress (NAEP), which has been administered to 4th and 8th grade students since 1971. A part of this test has been stable over almost a 30-year period, and Figure 1 shows how extremely stable student performance in reading has been over that period of time. On the 2003 assessment, 37% of all fourth graders performed below the basic level, which
- - - - - - - - - - - - - - - - - - - - - - - - - - - - - -- insert Figure 1 about here
- - - - - - - - - - - - - - - - - - - - - - - - - - - - - -- indicates that they do not have sufficient reading skills to adequately support grade level work that involves reading. Equally alarming is the fact that poor and minority students perform much more poorly on this test than national averages. For example, 60% of African American students performed below the basic level, while 55% of poor students (those who qualify for free or reduced price lunch) also performed at that level. Another important stimulus for the currently intense focus on reading instruction in the United states is the No Child Left Behind Act of 2002 which requires that the reading proficiency of all students be examined by a comprehensive reading assessment at the end of third grade. An important feature of this law is that schools must report their progress in teaching children to read in a way that disaggregates the performance of poor and non-poor, minority and non-minority, and handicapped and non-handicapped students. Schools are evaluated within this law by the reading gains of students in all these separate groups, so that they now must actively address the needs of all students. This law, and the sanctions that result from poor performance within its provisions are influencing district and school level administrators ask questions like “What works to improve performance for which students?” and “How much improvement can we expect for which students?” with greater frequency than ever before. A final significant report that is raising new questions for educators in the field of special education is the report of the President’s Commission on Special Education (2002). One of the most significant statements in this report, which is consistent with the general philosophy of the No Child Left Behind Act, is that, “The ultimate test of the value of special education is that, once identified, children close the gap with their peers.” (p.4). The report suggested that one of the most serious problems for special education programs as they are currently implemented is that they tend to stabilize the level of student’s academic impairments rather than remediate them.
What is meant by “closing the gap”? If special education is to respond to the challenge of the President’s Commission to “close the gap” between the academic performance of students receiving special education and their grade level peers, it is important to have a clear understanding of what is meant by this phrase. For example, one interpretation for children with reading disabilities is that it means narrowing the gap between a student’s current level of performance and grade level reading skills. This requires instruction and support that can accelerate the growth of reading ability, and the best objective evidence that sufficient acceleration is taking place to narrow the gap is a change in the student’s standard score or percentile rank on a valid and well-standardized measure of reading. Standard scores are an excellent metric for determining the “success” or “ failure” of interventions for children with reading disabilities, because they describe the child’s relative position within the distribution of reading skills in a large standardization sample. If standard scores improve, it means the child has narrowed the gap with age or grade level peers. By the same token, if standard scores stay the same over time, or decrease, it means that the reading gap has remained stable or increased. A second, and more stringent meaning for the phrase “closing the gap” involves bringing a student’s reading skills to within grade level standards. For children with reading disabilities, this will always involve an acceleration of development over a sufficient period of time. The most important and widely accepted grade level standards in reading always involve reading comprehension. Grade level standards in other reading skills such as phonemic decoding or text reading fluency are a means to an end, with the end being the ability to accurately construct the meaning of grade level text. Increasingly in the United States, whether or not the reading skills of struggling readers meet grade level standards will be determined by their performance on a group administered measure of reading comprehension. As we think about the challenges of working to “close the gap” through special interventions for children with reading disabilities, it is important to understand the reading, language, and cognitive skills required for good performance on these tests and how these skills might change with age. Recently, my colleagues and I at the Florida Center for Reading Research (Schatschneider, et al., 2004) undertook a study of the reading portion of Florida’s Comprehensive Assessment Test (FCAT) in order to answer two broad questions: 1) what reading, language, and cognitive skills are most important in accounting for individual differences in performance on the test at grades 3, 7, and 10; and, 2) what are the areas of greatest difficulty for students who struggle on the test at various ages? State level accountability measures in reading are not all alike, and the FCAT has two features that may present special challenges to many students with reading disabilities. First, it was specifically created to place high demands on “higher level thinking skills” such as verbal reasoning and inference making. The proportion of questions requiring “higher order thinking skills” increases from roughly 30% in third grade to 70% in 10th grade. Second, the FCAT requires students to read relatively long passages before asking them to answer questions about the text they have just read. The average length of passages in 3rd, 7th, and 10th grade is 325, 820, and 1000 words, respectively. Although the test does not have strict time limits, passages of this length place special demands on reading fluency. At fourth grade, the standards set for “grade level” performance on the FCAT are roughly equivalent to the NAEP test. For example, in 2003, 37% of 4th grade students in Florida performed below basic on the NAEP, while 40% of 4th graders performed below grade level on the FCAT.
In conducting this study, we gave a 2 hour battery of language, reading, nonverbal reasoning, and memory tests to approximately 200 children in 3rd, 7th, and 10th grade who were randomly selected within three locations across the state. We worked to identify a sample that would be roughly representative of the overall student population in Florida.
At third grade, oral reading rate was the dominant factor in accounting for individual differences in performance on the FCAT, with the fluency factor accounting for 56% of the variance, the verbal knowledge/reasoning factor accounting for 44%, and the nonverbal reasoning and working memory factors accounting for 25 and 14% of the variance respectively. At seventh grade, fluency and verbal knowledge/reasoning were equally dominant in accounting for variance on the FCAT, and at 10th grade verbal knowledge/reasoning was the dominant factor (52% of the variance), with fluency (32% of the variance) being second, and the other variables being less important. The findings for 10th grade do not mean that reading fluency is no longer important for good performance on the test. Rather, they mean that the level of thinking and verbal knowledge required for good performance on the test have now become so high that many children struggle on the test because they cannot meet these demands. Although the fluency levels of students who performed at level 1 on the test were still substantially lower than those performing at level 5 (130 vs. 199 words per minute on FCAT passages), they were apparently high enough that fluency was not as important a factor in limiting their performance on the FCAT as it was in third grade. Performance on the FCAT is categorized in five levels (1-5), with level 3 being considered grade level performance. Students must perform at level 2 or higher on the FCAT to be eligible for promotion from 3rd to 4th. grade, and they must also attain a given level of proficiency on the test in order to be eligible for a regular high school diploma. Table 1 presents the average performance levels on a number of our tests for students who performed at each of the levels on the FCAT in third grade. The most striking finding from Table 1 is the extremely
- - - - - - - - - - - - - - - - - - - - - - - - - - - - - -- insert Table 1 about here
- - - - - - - - - - - - - - - - - - - - - - - - - - - - - -- low performance of students at Level 1 on measures of reading fluency. When we asked the students to read FCAT-level passages orally, Level 1 students read them at half the rate of students who performed at the average level on the FCAT, and they achieved an average reading fluency score at the 6th percentile on a nationally standardized measure of reading fluency. These findings concerning the problems in reading fluency manifest by students performing at Level 1 on the FCAT were particularly troubling to us because of our knowledge about difficulties in reading fluency for children with reading disabilities. We turn now to an assessment of our current knowledge about effective remedial procedures or “special education” for older students with reading disabilities. What do we know about “closing the gap” for students with reading disabilities? In order to aggregate data across studies to answer questions about the power of currently available interventions, we need a common metric that can be applied across studies. One such metric can be calculated by dividing the amount of gain in standard score units by the number of hours of instruction that are provided, so rate of growth is expressed as the number of standard score points gained per hour of instruction. Of course, this metric depends on the common use across studies of standardized measures that have the same standard deviation, but there are a
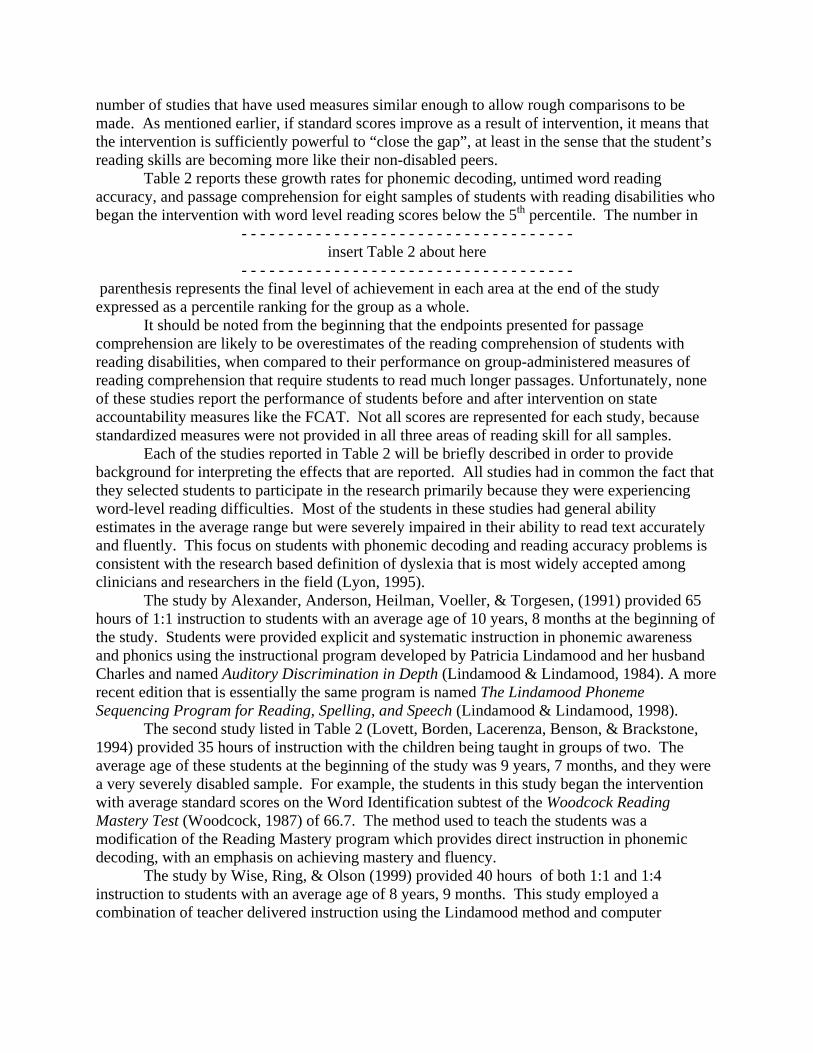
number of studies that have used measures similar enough to allow rough comparisons to be made. As mentioned earlier, if standard scores improve as a result of intervention, it means that the intervention is sufficiently powerful to “close the gap”, at least in the sense that the student’s reading skills are becoming more like their non-disabled peers. Table 2 reports these growth rates for phonemic decoding, untimed word reading accuracy, and passage comprehension for eight samples of students with reading disabilities who began the intervention with word level reading scores below the 5th percentile. The number in
- - - - - - - - - - - - - - - - - - - - - - - - - - - - - - - - - - - - insert Table 2 about here
- - - - - - - - - - - - - - - - - - - - - - - - - - - - - - - - - - - - parenthesis represents the final level of achievement in each area at the end of the study expressed as a percentile ranking for the group as a whole.
It should be noted from the beginning that the endpoints presented for passage comprehension are likely to be overestimates of the reading comprehension of students with reading disabilities, when compared to their performance on group-administered measures of reading comprehension that require students to read much longer passages. Unfortunately, none of these studies report the performance of students before and after intervention on state accountability measures like the FCAT. Not all scores are represented for each study, because standardized measures were not provided in all three areas of reading skill for all samples. Each of the studies reported in Table 2 will be briefly described in order to provide background for interpreting the effects that are reported. All studies had in common the fact that they selected students to participate in the research primarily because they were experiencing word-level reading difficulties. Most of the students in these studies had general ability estimates in the average range but were severely impaired in their ability to read text accurately and fluently. This focus on students with phonemic decoding and reading accuracy problems is consistent with the research based definition of dyslexia that is most widely accepted among clinicians and researchers in the field (Lyon, 1995).
The study by Alexander, Anderson, Heilman, Voeller, & Torgesen, (1991) provided 65 hours of 1:1 instruction to students with an average age of 10 years, 8 months at the beginning of the study. Students were provided explicit and systematic instruction in phonemic awareness and phonics using the instructional program developed by Patricia Lindamood and her husband Charles and named Auditory Discrimination in Depth (Lindamood & Lindamood, 1984). A more recent edition that is essentially the same program is named The Lindamood Phoneme Sequencing Program for Reading, Spelling, and Speech (Lindamood & Lindamood, 1998). The second study listed in Table 2 (Lovett, Borden, Lacerenza, Benson, & Brackstone, 1994) provided 35 hours of instruction with the children being taught in groups of two. The average age of these students at the beginning of the study was 9 years, 7 months, and they were a very severely disabled sample. For example, the students in this study began the intervention with average standard scores on the Word Identification subtest of the Woodcock Reading Mastery Test (Woodcock, 1987) of 66.7. The method used to teach the students was a modification of the Reading Mastery program which provides direct instruction in phonemic decoding, with an emphasis on achieving mastery and fluency. The study by Wise, Ring, & Olson (1999) provided 40 hours of both 1:1 and 1:4 instruction to students with an average age of 8 years, 9 months. This study employed a combination of teacher delivered instruction using the Lindamood method and computer
administered instruction that provided extensive practice in reading text with the computer providing support for reading accuracy.
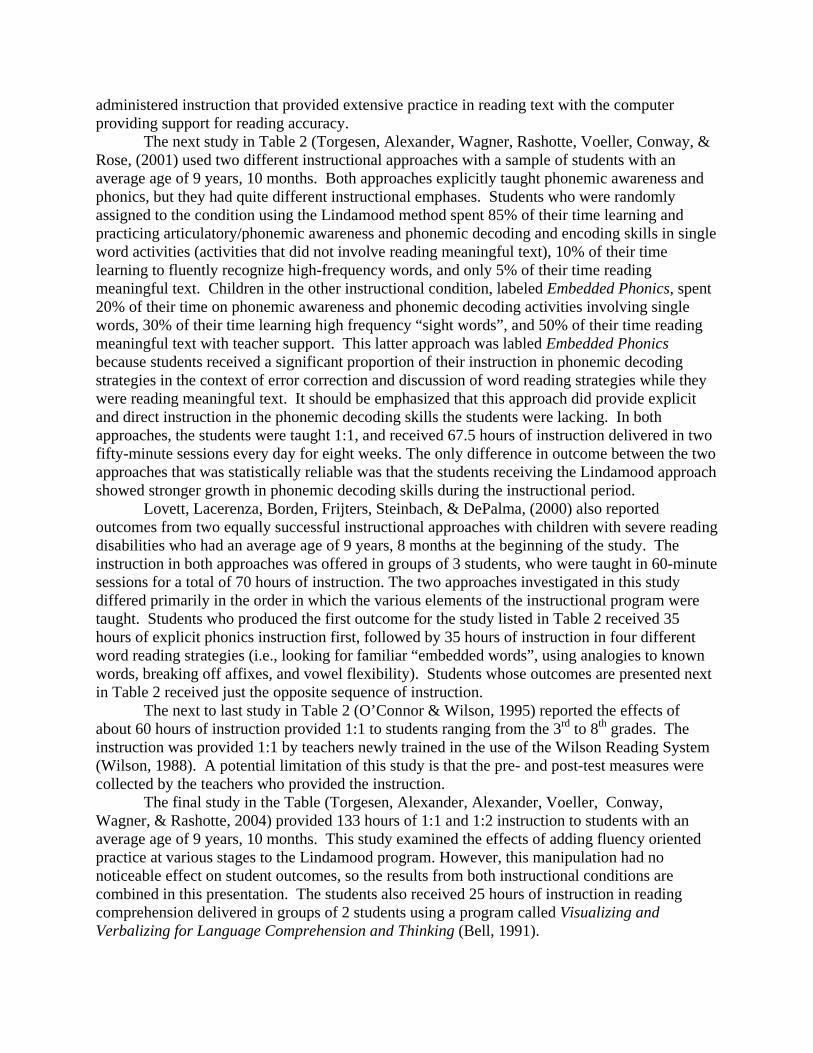
The next study in Table 2 (Torgesen, Alexander, Wagner, Rashotte, Voeller, Conway, & Rose, (2001) used two different instructional approaches with a sample of students with an average age of 9 years, 10 months. Both approaches explicitly taught phonemic awareness and phonics, but they had quite different instructional emphases. Students who were randomly assigned to the condition using the Lindamood method spent 85% of their time learning and practicing articulatory/phonemic awareness and phonemic decoding and encoding skills in single word activities (activities that did not involve reading meaningful text), 10% of their time learning to fluently recognize high-frequency words, and only 5% of their time reading meaningful text. Children in the other instructional condition, labeled Embedded Phonics, spent 20% of their time on phonemic awareness and phonemic decoding activities involving single words, 30% of their time learning high frequency “sight words”, and 50% of their time reading meaningful text with teacher support. This latter approach was labled Embedded Phonics because students received a significant proportion of their instruction in phonemic decoding strategies in the context of error correction and discussion of word reading strategies while they were reading meaningful text. It should be emphasized that this approach did provide explicit and direct instruction in the phonemic decoding skills the students were lacking. In both approaches, the students were taught 1:1, and received 67.5 hours of instruction delivered in two fifty-minute sessions every day for eight weeks. The only difference in outcome between the two approaches that was statistically reliable was that the students receiving the Lindamood approach showed stronger growth in phonemic decoding skills during the instructional period. Lovett, Lacerenza, Borden, Frijters, Steinbach, & DePalma, (2000) also reported outcomes from two equally successful instructional approaches with children with severe reading disabilities who had an average age of 9 years, 8 months at the beginning of the study. The instruction in both approaches was offered in groups of 3 students, who were taught in 60-minute sessions for a total of 70 hours of instruction. The two approaches investigated in this study differed primarily in the order in which the various elements of the instructional program were taught. Students who produced the first outcome for the study listed in Table 2 received 35 hours of explicit phonics instruction first, followed by 35 hours of instruction in four different word reading strategies (i.e., looking for familiar “embedded words”, using analogies to known words, breaking off affixes, and vowel flexibility). Students whose outcomes are presented next in Table 2 received just the opposite sequence of instruction. The next to last study in Table 2 (O’Connor & Wilson, 1995) reported the effects of about 60 hours of instruction provided 1:1 to students ranging from the 3rd to 8th grades. The instruction was provided 1:1 by teachers newly trained in the use of the Wilson Reading System (Wilson, 1988). A potential limitation of this study is that the pre- and post-test measures were collected by the teachers who provided the instruction. The final study in the Table (Torgesen, Alexander, Alexander, Voeller, Conway, Wagner, & Rashotte, 2004) provided 133 hours of 1:1 and 1:2 instruction to students with an average age of 9 years, 10 months. This study examined the effects of adding fluency oriented practice at various stages to the Lindamood program. However, this manipulation had no noticeable effect on student outcomes, so the results from both instructional conditions are combined in this presentation. The students also received 25 hours of instruction in reading comprehension delivered in groups of 2 students using a program called Visualizing and Verbalizing for Language Comprehension and Thinking (Bell, 1991).
Several aspects of the data reported in Table 2 are worthy of specific discussion. First, there is remarkable consistency in the rates of growth for phonemic decoding skills, word reading accuracy, and passage comprehension skills reported across the studies, except for the last study reported. The similarities in growth rate between the LIPS (The Lindamood Phoneme Sequencing Program for Reading, Spelling, and Speech) and EP (Embedded Phonics) conditions in the Torgesen, et al., (2001a) study, along with the consistencies across other studies that did not use the Lindamood method, suggests that, given the right level of intensity and teacher skill, it may be possible to obtain strong positive rates of growth using a variety of approaches to direct instruction in reading. The most obvious conclusion from these rates of growth is that current interventions, when properly applied, are sufficiently powerful to narrow the reading gap for students with severe reading disabilities in these three areas of reading skill.
Another point to note from Table 2 is that growth rates for phonemic decoding skills are consistently higher than they are for word reading accuracy and passage comprehension. Not only the substantial growth rate, but also the essential “normalization” of phonemic decoding skills reported in a number of these studies indicates that even children with severe difficulties in the phonological domain can acquire productive and generative phonemic decoding skills if they are taught with intensity and skill.
The final point of interest from Table 2 is that the ending points for students in the ability to accurately identify real words are consistently low across these studies. Of the three measures reported in Table 2, Word Identification is most highly correlated with text reading fluency and, for samples like this, standard scores on the Word Identification test are usually substantially higher than standard scores on tests of reading fluency (Torgesen, Rashotte, & Alexander, 2001). Of all the studies reported in Table 2, the two reported by Torgesen, et al., are the only ones that reported standard scores for fluency. Whereas the standard scores for Word Identification at the end of the intervention in the first study (2001) were 82 and 80, the corresponding scores for fluency were 75 and 72. These latter standard scores convert to percentile ranks of 5 and 3, respectively. In the second study (2004), the ending percentile rank for accuracy was the 16th, but the corresponding score for fluency was the 3rd percentile.
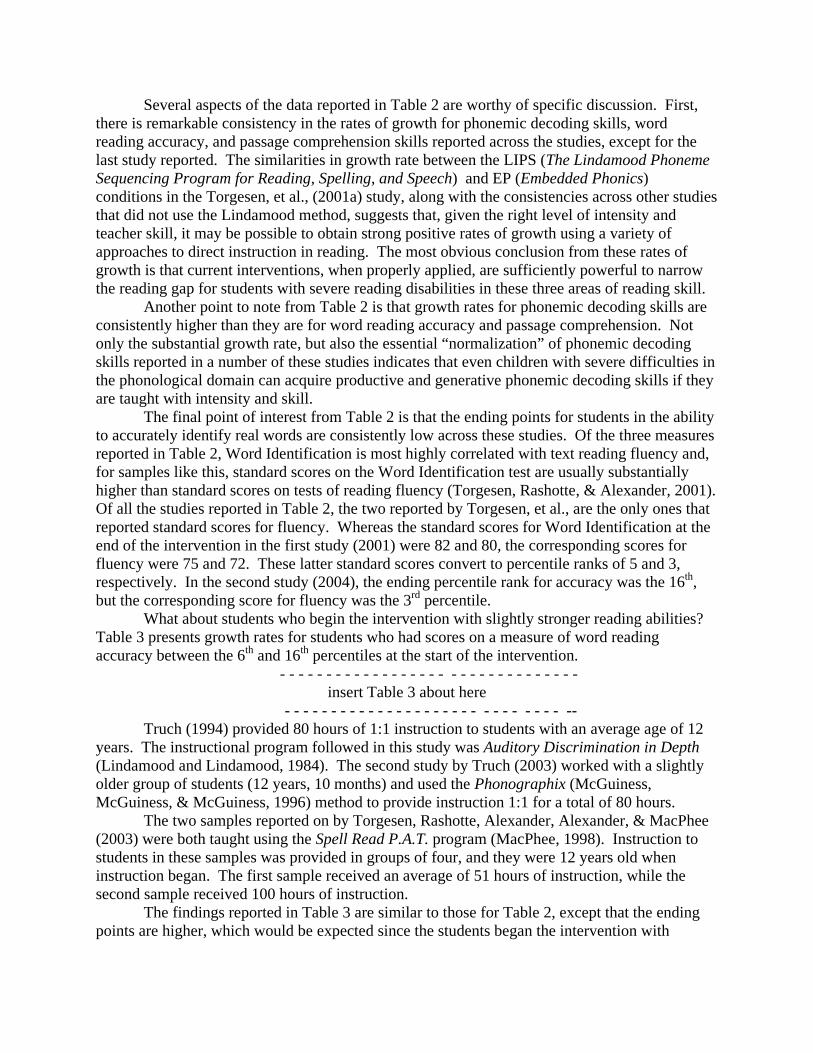
What about students who begin the intervention with slightly stronger reading abilities? Table 3 presents growth rates for students who had scores on a measure of word reading accuracy between the 6th and 16th percentiles at the start of the intervention.
- - - - - - - - - - - - - - - - - - - - - - - - - - - - - - - - insert Table 3 about here
- - - - - - - - - - - - - - - - - - - - - - - - - - - - - -- Truch (1994) provided 80 hours of 1:1 instruction to students with an average age of 12
years. The instructional program followed in this study was Auditory Discrimination in Depth (Lindamood and Lindamood, 1984). The second study by Truch (2003) worked with a slightly older group of students (12 years, 10 months) and used the Phonographix (McGuiness, McGuiness, & McGuiness, 1996) method to provide instruction 1:1 for a total of 80 hours. The two samples reported on by Torgesen, Rashotte, Alexander, Alexander, & MacPhee (2003) were both taught using the Spell Read P.A.T. program (MacPhee, 1998). Instruction to students in these samples was provided in groups of four, and they were 12 years old when instruction began. The first sample received an average of 51 hours of instruction, while the second sample received 100 hours of instruction. The findings reported in Table 3 are similar to those for Table 2, except that the ending points are higher, which would be expected since the students began the intervention with
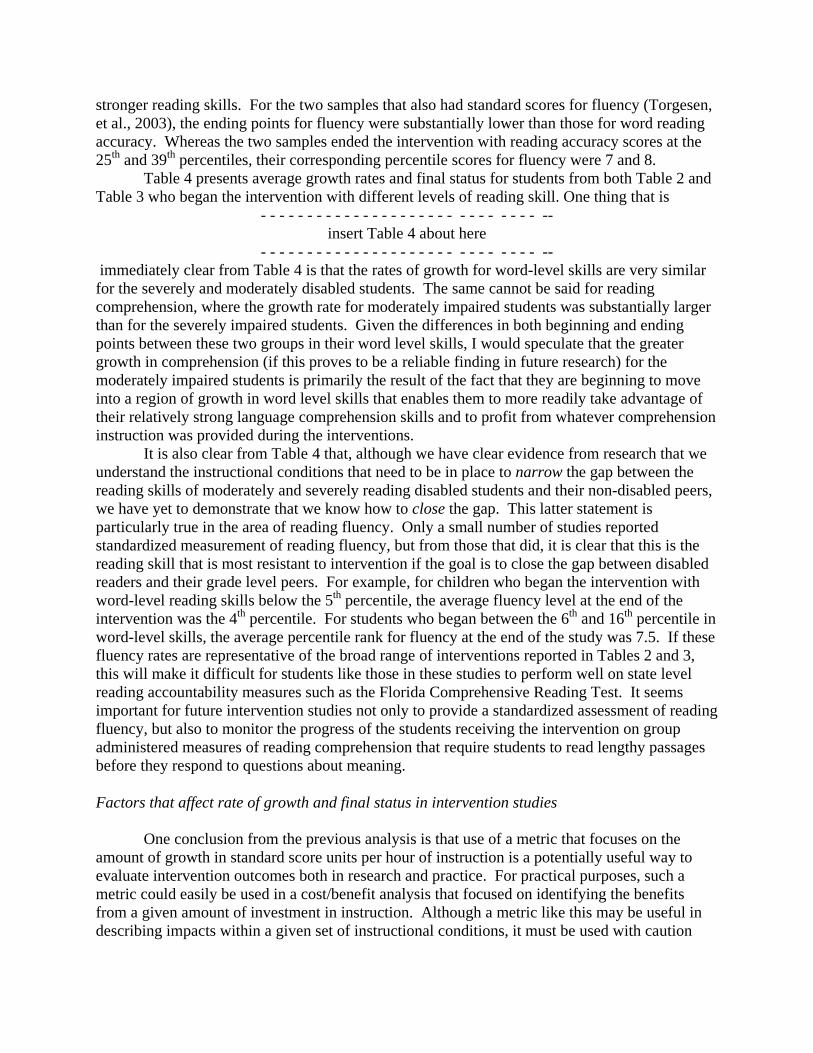
stronger reading skills. For the two samples that also had standard scores for fluency (Torgesen, et al., 2003), the ending points for fluency were substantially lower than those for word reading accuracy. Whereas the two samples ended the intervention with reading accuracy scores at the 25th and 39th percentiles, their corresponding percentile scores for fluency were 7 and 8. Table 4 presents average growth rates and final status for students from both Table 2 and Table 3 who began the intervention with different levels of reading skill. One thing that is
- - - - - - - - - - - - - - - - - - - - - - - - - - - - - -- insert Table 4 about here
- - - - - - - - - - - - - - - - - - - - - - - - - - - - - -- immediately clear from Table 4 is that the rates of growth for word-level skills are very similar for the severely and moderately disabled students. The same cannot be said for reading comprehension, where the growth rate for moderately impaired students was substantially larger than for the severely impaired students. Given the differences in both beginning and ending points between these two groups in their word level skills, I would speculate that the greater growth in comprehension (if this proves to be a reliable finding in future research) for the moderately impaired students is primarily the result of the fact that they are beginning to move into a region of growth in word level skills that enables them to more readily take advantage of their relatively strong language comprehension skills and to profit from whatever comprehension instruction was provided during the interventions. It is also clear from Table 4 that, although we have clear evidence from research that we understand the instructional conditions that need to be in place to narrow the gap between the reading skills of moderately and severely reading disabled students and their non-disabled peers, we have yet to demonstrate that we know how to close the gap. This latter statement is particularly true in the area of reading fluency. Only a small number of studies reported standardized measurement of reading fluency, but from those that did, it is clear that this is the reading skill that is most resistant to intervention if the goal is to close the gap between disabled readers and their grade level peers. For example, for children who began the intervention with word-level reading skills below the 5th percentile, the average fluency level at the end of the intervention was the 4th percentile. For students who began between the 6th and 16th percentile in word-level skills, the average percentile rank for fluency at the end of the study was 7.5. If these fluency rates are representative of the broad range of interventions reported in Tables 2 and 3, this will make it difficult for students like those in these studies to perform well on state level reading accountability measures such as the Florida Comprehensive Reading Test. It seems important for future intervention studies not only to provide a standardized assessment of reading fluency, but also to monitor the progress of the students receiving the intervention on group administered measures of reading comprehension that require students to read lengthy passages before they respond to questions about meaning. Factors that affect rate of growth and final status in intervention studies
One conclusion from the previous analysis is that use of a metric that focuses on the amount of growth in standard score units per hour of instruction is a potentially useful way to evaluate intervention outcomes both in research and practice. For practical purposes, such a metric could easily be used in a cost/benefit analysis that focused on identifying the benefits from a given amount of investment in instruction. Although a metric like this may be useful in describing impacts within a given set of instructional conditions, it must be used with caution
when comparing results across studies. A number of factors can influence both growth rates and final status after an intervention is completed that are independent from the nature of the actual instructional program used. These factors range from obvious things such as the particular measure of word reading accuracy that was used, to more subtle things such as the hours of intervention that were provided. For example, in our studies, we find that estimates of word reading accuracy are consistently higher when a measure of text reading accuracy (such as the Gray Oral Reading Test) is used rather than a measure of single word reading accuracy (such as the Word Identification subtest from the Woodcock Reading Mastery Test).
The particular test used to assess word reading accuracy affects the estimate of final status more than it does the estimate of growth rate. For example, in the Torgesen, et al., (2001a) intervention study, post-test standard scores for word reading accuracy as measured by the Woodcock were 82.4 and 80.5 for the LIPS and EP programs, respectively. In contrast, post-test scores for word reading accuracy from the Gray (Wiederholt & Bryant, 1992) were 89.4 and 87.5, respectively. The higher scores for the Gray undoubtedly reflect the student’s ability to use passage level context as an aid to more accurate identification of words (Share & Stanovich, 1995).
Another factor that is likely to influence the estimate of growth rate obtained within any single study is the number of hours of intervention that were provided. Truch (2003) has recently documented that rate of gain may decelerate quite rapidly for intensive interventions after the first 12 hours of the intervention. In his study, 80 hours of intensive instruction using the Phono-Graphix method (McGuinness, McGuinness, & McGuinness, 1996) were provided to 202 students ranging in age from 6 years old to over 17 years old. For students ranging in age from 10-16, the average gains per hour of instruction for single word reading accuracy was .74 standard score points per hour of instruction for the first 12 hours of instruction. For the next twelve hours, the rate was .11, and for the final 56 hours, it was .10 standard score points per hour. Although this study did not calculate standard scores for their phonemic decoding measure, the findings were similar, but expressed in terms of grade level units per hour of instruction. For phonemic decoding, the growth rate for the first 12 hours of instruction was .25 grade level units per hour of instruction, for the next 12 hours it was .07, and for the final 56 hours, it was .04. This deceleration in growth rate across time within intensive interventions is probably part of the explanation for the particularly low growth rates observed in the 133 hour intervention study reported by Torgesen, et al., (2003a). However, another factor may have also been operating in this latter study to moderate the growth rates that were observed.
This study was conducted in the same school district, and within many of the same schools, as a previously reported (Torgesen, et al., 2001a) study of intensive interventions. In spite of the fact that children in the second study received twice as much instruction as those in the first study, they actually improved less in text reading accuracy and comprehension than the first group. Since both the first and second groups had received very similar interventions and had been selected by the same criteria, the most likely explanation for this unexpected finding is that the latter group had more severe reading disabilities than the first one. Our primary evidence for this assertion is that the special education classes from which the children were selected had improved substantially during the three years that intervened between the selections of the two samples. It was actually more difficult to find students who read poorly enough to meet our selection criteria when we selected the second sample than it was when we identified children for the first study. Teachers who had worked in both studies also noticed immediately that the second group was “much more difficult to teach” than children in the first sample.
This finding introduces an important moderating variable that must be kept in mind when looking at the results of intervention studies. The actual reading impairment a child shows at any point is always the result of an interaction between the child’s degree of disability and the strength of instruction that has already been provided. Children with a mild reading disability who are provided only weak instruction (in the regular classroom or in a special education setting) will show larger reading impairments when tested than will children with the same degree of reading disability who have had stronger instruction. In fact, if the instruction received by this latter group was sufficiently strong, they might not even qualify to be part of the study! By the same token, children who remain severely reading impaired within a strong instructional environment are likely to have a more serious reading disability than those who have remained impaired after receiving only weak instruction. Thus, if researchers select their intervention samples from among children who have already received a good dose of appropriate and reasonably intensive instruction, the children in those samples will be more difficult to teach than children who are selected by the same reading criteria from a weaker instructional environment. This moderating factor raises the clear possibility that, if schools are successful in organizing instruction to provide powerful support for the initial acquisition of reading skills in young children (Foorman & Torgesen, 2001; Torgesen, 2002), growth rates for students in special education may not show the improvement one might expect, even with better models of intervention.
This latter point is important in thinking about the rates of improvement we might expect from effective special education within schools that operate a well developed “three tier” system of intervention for students with learning difficulties. Within such a system, students first receive explicit and responsive classroom instruction, and if they do not respond well within that environment, they are to receive a secondary level of intervention that provides more powerful and explicit instruction focused on their specific needs (Vaughn, et al., in press). Finally, if this more powerful secondary level of intervention is not successful in “closing the reading gap” for these students, they will be referred for a tertiary intervention, which is sometimes considered to be synonymous with special education (Gresham, 2002). This method for identifying students with reading disabilities theoretically has the potential to identify for special education only students who have not profited from effective instruction in the first and second tiers. If these earlier tiers are sufficiently powerful, it will dramatically reduce the number of students requiring tertiary intervention, but it will also identify a group of students who may show relatively slow rates of change, even under very powerful instructional conditions.
Conclusions and future directions At the beginning of this paper, I discussed two possible meanings of the phrase “closing the gap” for students with reading disabilities. In one of the meanings, the word “closing” is synonymous with “narrowing”, while in the other meaning the word “closing” means the same thing as “eliminating”. Using these two synonyms, the intervention research reviewed in this paper can be summarized in the following way: We currently have available reading interventions that can narrow the gap between older students with reading disabilities and their non-disabled peers, but we have not yet demonstrated that we understand the conditions required to eliminate this gap. We can come closest to eliminating the gap in the area of phonemic decoding skills, which has traditionally been seen as an area of particular difficulty for students with reading disabilities (Share & Stanovich, 1995, Torgesen, 1999). Eliminating gaps in this
area is important, because it provides children with reading disabilities a new level of access to text, and it is one of the critical skills required for reading independently. For severely disabled readers (those who begin the intervention with word-level skills below the 5th percentile), rates of growth in word reading accuracy are generally stronger than for reading comprehension, but final status for reading comprehension skills at the end of the intervention is generally higher than scores for word reading accuracy. The most likely explanation for this finding is that the samples of children with reading disabilities used in current research have broad verbal ability and language comprehension skills that are roughly in the average range. Thus, because of their good general comprehension skills, these students can often “fill in the gaps” to build reading comprehension by relying on their background knowledge and reasoning ability. In a sense, they compensate for their weak word-level reading abilities by relying on their more strongly developed language comprehension skills (Stanovich, 1984). What is currently unknown is whether children with reading disabilities who receive effective remediation as we currently understand it will improve significantly in their performance on the kinds of “high stakes” reading accountability measures currently being used in the United States to evaluate both individual student progress and the effectiveness of school programs. These accountability measures of reading are different from the measures of reading comprehension that have typically been used in intervention research, in that they involve longer passages and more complex questions about the meaning and interpretation of text. Future intervention studies with older students should include as one of their outcome measures a test of reading comprehension that is more similar to widely used State accountability measures than the individually administered tests that have been used previously.
Particularly troubling at this point are the outcomes from intervention research with older students in the area of reading fluency. The effective interventions that have been used thus far have had little impact on either narrowing or eliminating the gap in reading fluency between students with disabilities and their non-disabled peers. Given what we know about the importance of reading fluency in explaining individual differences in performance on group administered tests of reading comprehension like the Florida Comprehensive Assessment Test, this finding suggests an immediate need for more research on ways to accelerate reading fluency as part of an intervention program for older struggling readers. If our previous analysis of this problem is correct (Torgesen, et al., 2001), closing the gap in this area represents a formidable problem for practitioners and researchers. Although promising techniques for reducing the fluency gap are available (Hiebert, 2004, Levy, 2001, Meyer & Felton, 1999), there is no evidence currently available that these techniques can produce “normalization” of fluency in children who have struggled in learning to read for several years. Wolf and her colleagues (Wolf, Miller, & Donnelly, 2000) are currently investigating interventions specifically targeted on fluency issues that extend considerably beyond word level problems, but as yet there are no reports of findings available from these studies.
As a final point for future research, it seems important to plan studies that include sufficient instructional time so that we can obtain better answers as to whether it is possible to eliminate the gap between the reading skills of older students with reading disabilities and their non-disabled peers. It is possible to obtain evidence about the ability of interventions to narrow the gap within a relatively short period of time, but elimination of the gap requires powerful instruction over a sufficient period of time to close the gap. Given the evidence provided earlier (Truch, 2003) on the decelerating effects of interventions as the number of intervention hours increase, we should avoid directly extrapolating findings from short-term studies in estimating

long-term growth. In other words, we should not assume that, if 60 hours of an intervention produces a given growth rate in terms of standard score points per hour of intervention, that extending that particular intervention for another 60 or 100, or 200 hours will completely close the gap. We will only discover the conditions necessary to eliminate reading deficiencies when we actually include enough instructional time to accomplish the feat empirically.
References Alexander, A., Anderson, H., Heilman, P.C., Voeller, K.S., and Torgesen, J.K. 1991.
Phonological awareness training and remediation of analytic decoding deficits in a group of severe dyslexics. Annals of Dyslexia 41: 193-206.
Bell, N. (1991). Visualizing and verbalizing for language comprehension and thinking. San Luis Obispo, CA: Gander Publishing.
Foorman, B. & Torgesen, J.K. (2001), Critical elements of classroom and small-group instruction to promote reading success in all children. Learning Disabilities Research and Practice, 16, 203-121.
Gresham, 2002. Responsiveness to intervention: An alternative approach to the identification of learning disabilities. In Bradley, R., Danielson, L., & Hallahan, D. (Eds.) Identification of Learning Disabilities: Research to practice.(pp.467-519). Mahwah, NJ: Lawrence Erlbaum Associates.
Hiebert, E. (2004). Effects of daily reading of information text on young reader’s fluency. Presented as part of a symposium titled “Informational Text and Young Readers: Findings from Research” at the International Reading Association Annual Convention, May 5, 2004 in Reno-Tahoe, NV.
Levy, B.A. (2001). Moving the bottom: Improving reading fluency. In M. Wolf (Ed.), Dyslexia, fluency, and the brain. (pp. 357-382). Parkton, MD: York Press.
Lindamood, P. & Lindamood, P. (l998). The Lindamood Phoneme Sequencing Program for Reading, Spelling, and Speech, Austin, TX: PRO-ED, Inc.
Lindamood, C. H., & Lindamood, P. C. (l984). Auditory Discrimination in Depth. Austin, TX: PRO-ED, Inc.
Lovett, M.W., Borden, S. L., Lacerenza, L., Benson, N. J., & Brackstone, D. (1994). Treating the core deficits of developmental dyslexia: Evidence of transfer of learning after phonologically-and strategy-based reading training programs. Journal of Educational Psychology, 30, 805-822.
Lovett, M.W., Lacerenza, L., Borden, S.L., Frijters, J.C., Steinbach, K.A., & DePalma, M. (2000). Components of effective remediation for developmental reading disabilities: combining phonological and strategy-based instruction to improve outcomes. Journal of Educational Psychology, 92, 263-283.
Lyon, G.R. (1995). Towards a definition of dyslexia. Annals of Dyslexia, 45, 3-27. MacPhee, K. (1998). Spell Read P.A.T. Spell Read P.A.T. Learning Systems, Inc.:
Charlottetown, Canada. McGuinness,C., McGuinness, D., & McGuinness, G. (1996). Phono-Graphix: A new method
for remediating reading difficulties. Annals of Dyslexia, 46, 73-96. Meyer, M. S., & Felton, R. H. (1999). Repeated reading to enhance fluency: Old approaches
and new directions. Annals of Dyslexia, 49, 283-306. O’Connor, J. & Wilson, B. (1995). Effectiveness of the Wilson Reading System used in Public
School Training. In McIntyre, C., and Pickering, J. (eds). Clinical studies of Multisensory Structured Language Education. Salem, OR: International Multisensory Structured Language Education Council.
Schatschneider, C., Buck, J., Torgesen, J.K., Wagner, R.K., Hassler, L., Hecht, S., & Powell-Smith, K. (2004). A multivariate study of factors that contribute to individual differences in
performance on the Florida Comprehensive Reading Assessment Test. Technical Report # 5, Florida Center for Reading Research, Tallahassee, FL.
Share, D. L., & Stanovich, K. E. (1995). Cognitive processes in early reading development: A model of acquisition and individual differences. Issues in Education: Contributions from Educational Psychology, 1, 1-57.
Snow, C.E., Burns, M.S. & Griffin, P. (1998). Preventing reading difficulties in young children. Washington, DC: National Academy Press.
Stanovich,K. (1984). The interactive-compensatory model of reading: a confluence of developmental, experimental, and educational psychology. Remedial and Special Education, 5, 11-19.
Torgesen, J.K. (1999). Phonologically based reading disabilities: Toward a coherent theory of one kind of learning disability. In R.J. Sternberg & L. Spear-Swerling (Eds.), Perspectives on Learning Disabilities. (pp. 231-262). New Haven: Westview Press.
Torgesen, J.K. (2002). The prevention of reading difficulties. Journal of School Psychology, 40, 7-26.
Torgesen, J.K., Alexander, A. W., Alexander, J., Voeller, K., Conway, T., Wagner, R.K., & Rashotte, C.A. (2004). Accuracy oriented vs. Accuracy plus fluency interventions: A study of intensive instruction with older students with severe reading disabilities. Unpublished manuscript, Florida Center for Reading Research, Tallahassee, FL.
Torgesen, J.K., Alexander, A. W., Wagner, R.K., Rashotte, C.A., Voeller, K., Conway, T. & Rose, E. (2001). Intensive remedial instruction for children with severe reading disabilities: Immediate and long-term outcomes from two instructional approaches. Journal of Learning Disabilities, 34, 33-58.Torgesen, Rashotte, & Alexander, 2001
Torgesen, J.K., Rashotte, C.A., Alexander, A., Alexander, J., & MacPhee, K. (2003). Progress towards understanding the instructional conditions necessary for remediating reading difficulties in older children. In B. Foorman (Ed.). Preventing and Remediating Reading Difficulties: Bringing Science to Scale.(pp. 275-298). Parkton, MD: York Press.
Torgesen, J.K., Wagner, R. K., & Rashotte, C.A. (1999). Test of Word Reading Efficiency. Austin, TX: PRO-ED Publishing, Inc.
Truch, S. (1994). Stimulating basic reading processes using Auditory Discrimination in Depth, Annals of Dyslexia, 44, 60-80.
Truch, S. (2003). Comparing remedial outcomes using LIPS and Phono-Graphix: An in-depth look from a clinical perspective. Unpublished manuscript. The Reading Foundation, Calgary, Alberta, Canada.
U.S. Department of Education Office of Special Education and Rehabilitative Services (2002). A New Era: Revitalizing Special Education for Children and Their Families, Washington, DC.
Vaughn, S. , Linan-Thompson, S., Wanzek, J., Rodriguez, K., Sanderson, C., Cavanaugh, C., Roberts, G., Elbaum, B., & Torgesen, J. (in press). Effectiveness of Tier I and Tier II Reading Interventions for At-Risk Kindergarten Students, Exceptional Children.
Wechsler,D. (1974). Wechsler Intelligence Scale for Children: Revised. New York: The Psychological Corporation.
Wiederholt, J.L. & Bryant, B.R. (l992). Gray Oral Reading Tests--III. Austin, TX: PRO-ED. Wilson, B. (1988). Wilson reading system. Wilson Language Training: Milbury, MA. Wiederholt, J.L. & Bryant, B.R. (l992). Gray Oral Reading Tests-4th Edition. Austin, TX: PRO-
ED.
Wiederholt, J.L. & Bryant, B.R. (l992). Gray Oral Reading Tests-4th Edition. Austin, TX: PRO-ED.
Wise, B.W., Ring, J. , & Olson, R.K. (1999). Training phonological awareness with and without explicit attention to articulation. Journal of Experimental Child Psychology, 72, 271-304.
Wolf, M., Miller, L., & Donnelly, K. (2000). Retrieval, Automaticiy, Vocabulary Elaboration, Orthography (RAVE-O): A comprehensive, fluency-based reading intervention program. Journal of Learning Disabilities 33:322-24.
Woodcock, R.W. (l987). Woodcock Reading Mastery Tests-Revised. Circle Pines, Minn.: American Guidance Service
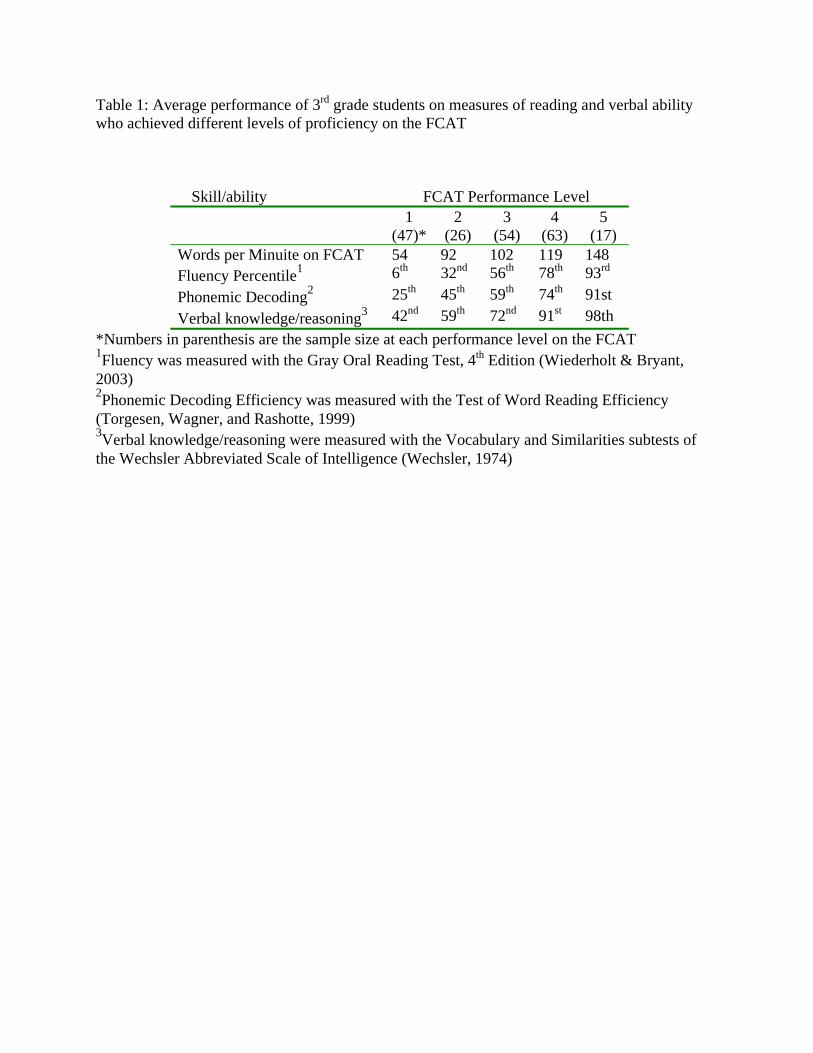
Table 1: Average performance of 3rd grade students on measures of reading and verbal ability who achieved different levels of proficiency on the FCAT
Skill/ability FCAT Performance Level
1 (47)*
2 (26)
3 (54)
4 (63)
5 (17)
Words per Minuite on FCAT 54 92 102 119 148 Fluency Percentile1 6th 32nd 56th 78th 93rd Phonemic Decoding2 25th 45th 59th 74th 91st Verbal knowledge/reasoning3 42nd 59th 72nd 91st 98th
*Numbers in parenthesis are the sample size at each performance level on the FCAT 1Fluency was measured with the Gray Oral Reading Test, 4th Edition (Wiederholt & Bryant, 2003) 2Phonemic Decoding Efficiency was measured with the Test of Word Reading Efficiency (Torgesen, Wagner, and Rashotte, 1999) 3Verbal knowledge/reasoning were measured with the Vocabulary and Similarities subtests of the Wechsler Abbreviated Scale of Intelligence (Wechsler, 1974)
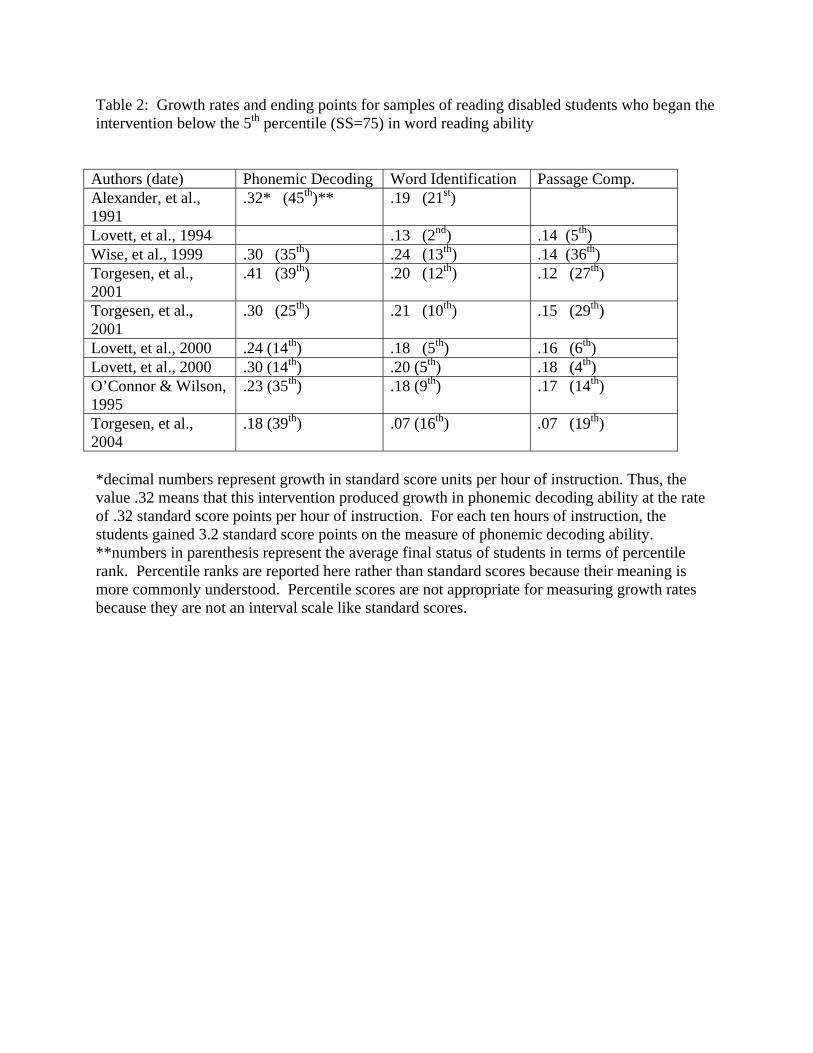
Table 2: Growth rates and ending points for samples of reading disabled students who began the intervention below the 5th percentile (SS=75) in word reading ability
Authors (date) Phonemic Decoding Word Identification Passage Comp. Alexander, et al., 1991
.32* (45th)** .19 (21st)
Lovett, et al., 1994 .13 (2nd) .14 (5th) Wise, et al., 1999 .30 (35th) .24 (13th) .14 (36th) Torgesen, et al., 2001
.41 (39th) .20 (12th) .12 (27th)
Torgesen, et al., 2001
.30 (25th) .21 (10th) .15 (29th)
Lovett, et al., 2000 .24 (14th) .18 (5th) .16 (6th) Lovett, et al., 2000 .30 (14th) .20 (5th) .18 (4th) O’Connor & Wilson, 1995
.23 (35th) .18 (9th) .17 (14th)
Torgesen, et al., 2004
.18 (39th) .07 (16th) .07 (19th)
*decimal numbers represent growth in standard score units per hour of instruction. Thus, the value .32 means that this intervention produced growth in phonemic decoding ability at the rate of .32 standard score points per hour of instruction. For each ten hours of instruction, the students gained 3.2 standard score points on the measure of phonemic decoding ability. **numbers in parenthesis represent the average final status of students in terms of percentile rank. Percentile ranks are reported here rather than standard scores because their meaning is more commonly understood. Percentile scores are not appropriate for measuring growth rates because they are not an interval scale like standard scores.
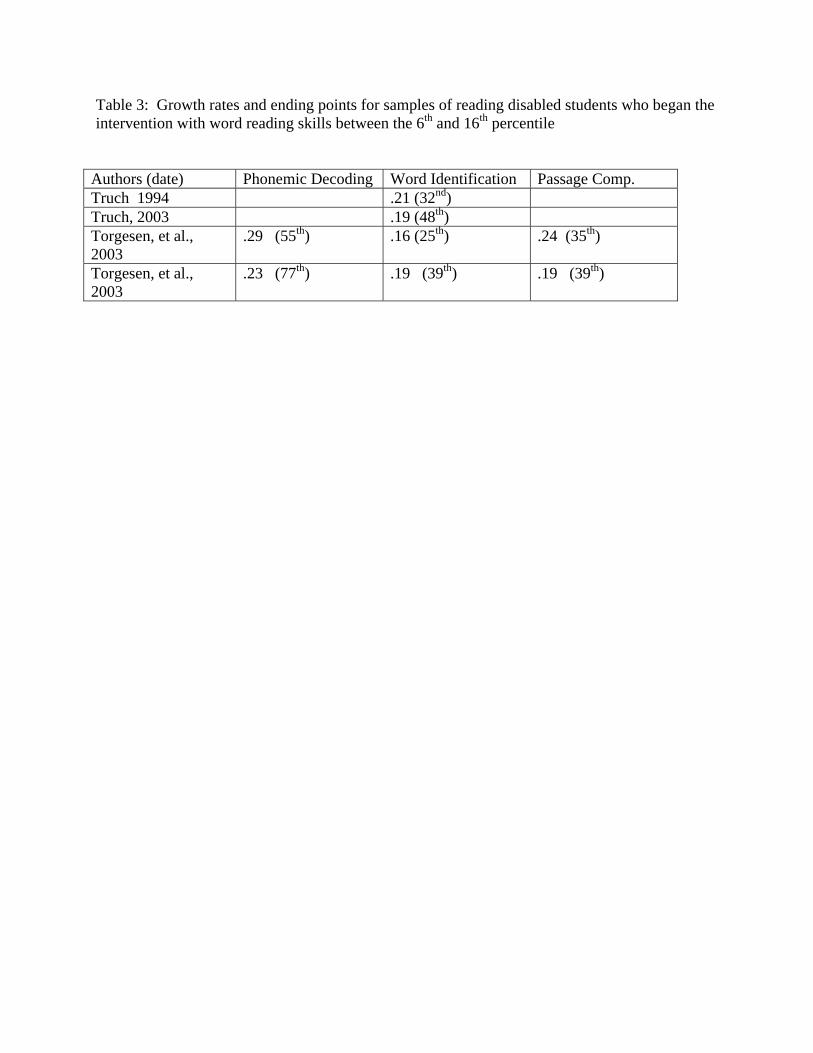
Table 3: Growth rates and ending points for samples of reading disabled students who began the intervention with word reading skills between the 6th and 16th percentile
Authors (date) Phonemic Decoding Word Identification Passage Comp. Truch 1994 .21 (32nd) Truch, 2003 .19 (48th) Torgesen, et al., 2003
.29 (55th) .16 (25th) .24 (35th)
Torgesen, et al., 2003
.23 (77th) .19 (39th) .19 (39th)
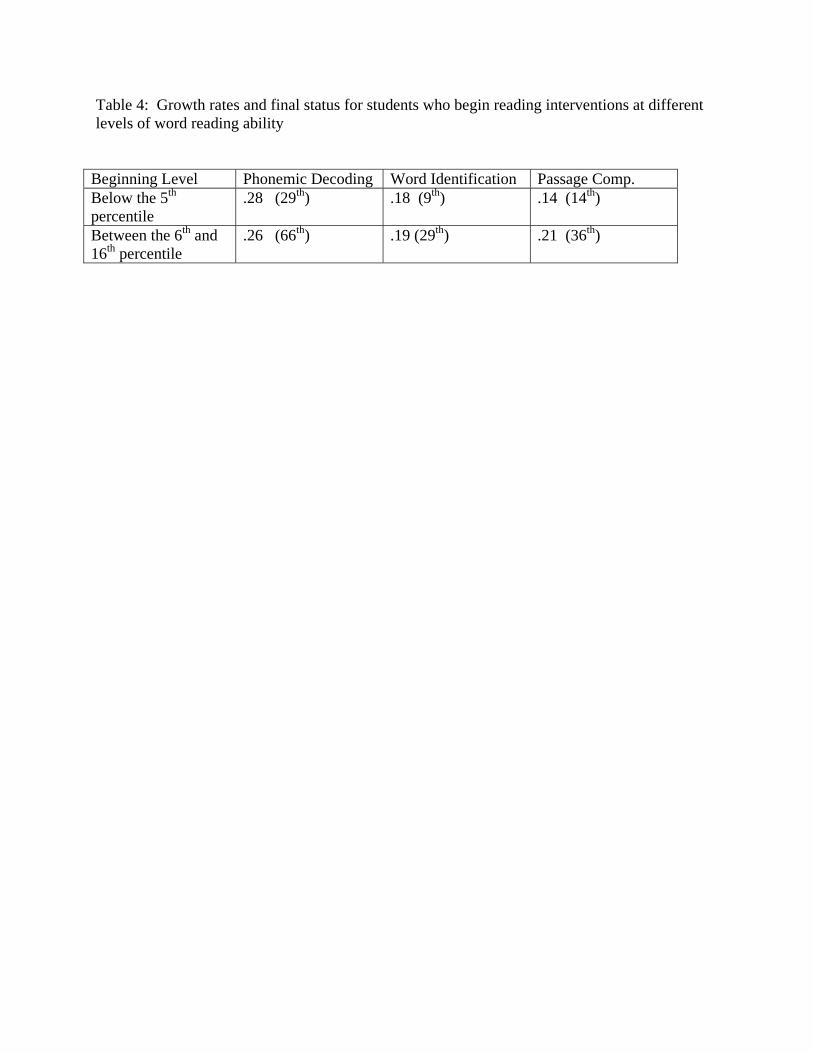
Table 4: Growth rates and final status for students who begin reading interventions at different levels of word reading ability
Beginning Level Phonemic Decoding Word Identification Passage Comp. Below the 5th percentile
.28 (29th) .18 (9th) .14 (14th)
Between the 6th and 16th percentile
.26 (66th) .19 (29th) .21 (36th)

Figure Captions Figure 1: Trends in Average Scale Scores for the Nation in Reading
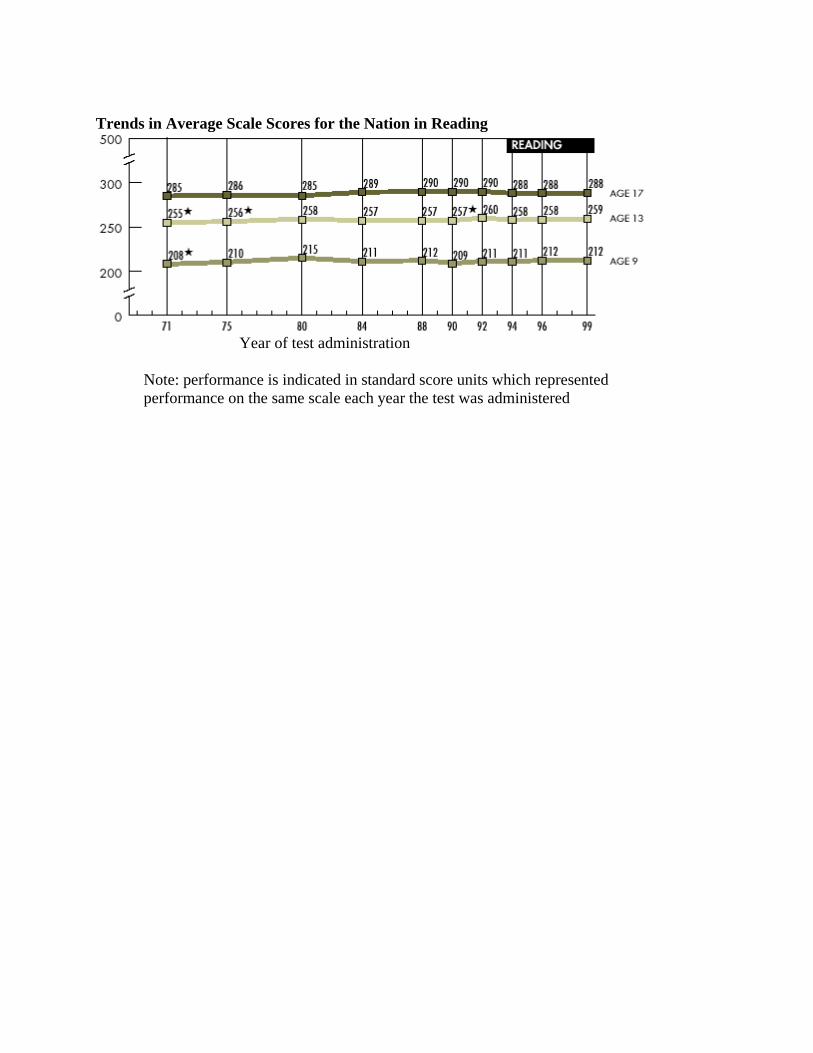
Trends in Average Scale Scores for the Nation in Reading
Year of test administration Note: performance is indicated in standard score units which represented performance on the same scale each year the test was administered