remedy evaluation work plan units 1 & 2 stage i and ii
TRANSCRIPT
Prepared for
Talen Montana, LLC
P.O. Box 23 Colstrip, Montana 59323
Remedy Evaluation Work Plan
Units 1 & 2 Stage I and II Evaporation
Ponds Site
Colstrip Steam Electric Station, Colstrip, Montana
Prepared by
10211 Wincopin Circle, 4th Floor Columbia, Maryland 21044
Project Number MR1149D
July 2016
i 7/29/2016 MR1149D/Remedy Evaluation Work Plan - SOEP STEP
TABLE OF CONTENTS
ABBREVIATIONS AND ACRONYMS…………………………………………….....iv
1. INTRODUCTION ................................................................................................... 1
1.1 Purpose ........................................................................................................... 1
1.2 Work Plan Organization ................................................................................. 1
2. BACKGROUND ..................................................................................................... 3
2.1 Facility Description ........................................................................................ 3
2.1.1 Construction/Operations .................................................................... 3
2.1.2 Prior Releases and Response Actions ................................................ 5
2.2 Physical Setting .............................................................................................. 7
2.3 Geology .......................................................................................................... 8
2.4 Hydrogeology ................................................................................................. 8
2.4.1 Hydrostratigraphic Units .................................................................... 8
2.4.2 Groundwater Flow ............................................................................. 9
2.4.3 Numerical Groundwater Flow Model .............................................. 10
2.5 Process Water Indicator Parameters ............................................................. 11
3. CONCEPTUAL SITE MODEL ............................................................................ 12
3.1 Source Area(s) and Constituents of Interest ................................................. 12
3.2 Release Mechanism ...................................................................................... 14
3.3 Transport Pathways ...................................................................................... 14
3.4 Environmental Fate ...................................................................................... 15
3.5 Potential Exposure Point(s) .......................................................................... 15
3.6 Potential Receptors/Health Risks ................................................................. 15
4. REMEDIAL ACTION OBJECTIVES .................................................................. 16
4.1 Objectives and Implementation of the AOC ................................................ 16
4.2 Compliance Evaluation ................................................................................ 17
4.3 Source Control Upgrade Remedial Action Objectives ................................. 18
4.4 Migration Management Upgrade Remedial Action Objectives ................... 18
4.5 Institutional Controls .................................................................................... 18
5. PRELIMINARY SCREENING OF REMEDIAL ACTION TECHNOLOGIES . 19
6. ASSEMBLING REMEDIAL ACTION ALTERNATIVES ................................. 22
7. EVALUATING REMEDIAL ACTION ALTERNATIVES ................................ 24
7.1 General Standards ......................................................................................... 24
ii 7/29/2016 MR1149D/Remedy Evaluation Work Plan - SOEP STEP
7.1.1 Protection of Human Health and the Environment .......................... 24
7.1.2 Attainment of Cleanup Criteria ........................................................ 25
7.1.3 Source Control ................................................................................. 25
7.1.4 Compliance with Standards for Management of Wastes ................. 25
7.2 Detailed Evaluation Factors ......................................................................... 25
7.2.1 Performance ..................................................................................... 26
7.2.2 Reliability ......................................................................................... 27
7.2.3 Ease of Implementation ................................................................... 27
7.2.4 Potential Impacts .............................................................................. 28
7.2.5 Time to Start/Complete .................................................................... 28
7.2.6 Cost .................................................................................................. 29
7.2.7 Permits and Approvals ..................................................................... 29
7.2.8 Community Concerns ...................................................................... 30
8. PREFERRED REMEDIAL ACTION ALTERNATIVE ...................................... 31
9. NEED FOR ADDITIONAL DATA OR TREATABILITY STUDIES ................ 32
10. SCHEDULE AND DELIVERABLES .................................................................. 33
11. REFERENCES ...................................................................................................... 34
LIST OF TABLES
Table 2-1 List of Process Ponds – SOEP/STEP Site
Table 2-2 List of Geologic Units – SOEP/STEP Site
Table 2-3 Preliminary List of Constituents of Interest and Indicator Parameters – SOEP/STEP SiteTE
Table 5-1 Preliminary Screening of Remediation Technologies – SOEP/STEP
Table 6-1 Preliminary Assembly of Remedial Action Alternatives – SOEP/STEP
iii 7/29/2016 MR1149D/Remedy Evaluation Work Plan - SOEP STEP
LIST OF FIGURES
Figure 1-1 Administrative Order on Consent Site Areas
Figure 2-1 SOEP/STEP Process Ponds and Capture Wells
Figure 2-3 Hydrologic Regime East Fork Armells Creek
Figure 3-1 SOEP/STEP Site Conceptual Site Model
LIST OF APPENDICES
Appendix A SOEP/STEP Site Geologic Cross Sections
Appendix B SOEP/STEP Figures Showing Interpreted Extent of Indicator Parameters
Appendix C SOEP/STEP Figures Showing Uncaptured Areas
iv 7/29/2016 MR1149D/Remedy Evaluation Work Plan - SOEP STEP
ABBREVIATIONS AND ACRONYMS
amsl above mean sea level AOC administrative order on consent BSL baseline screening level CAA corrective action alternative CAO corrective action objective CCR coal combustion residuals CCRA cleanup criteria and risk assessment COI constituent of interest CQA construction quality assurance Creek East Fork Armells Creek CSES Colstrip Steam Electric Station CSM conceptual site model DEQ-7 Montana numerical water quality standards, Circular 7 EHP evaporation holding pond gpm gallons per minute HDPE high-density polyethylene MCL maximum contaminant level MDEQ Montana Department of Environmental Quality MW megawatt POC point of compliance Talen Talen Montana, LLC RAA remedial action alternative RAO remedial action objective RFP/RPP reinforced polypropylene SC specific conductance SCEM site conceptual exposure model SOEP Stage I Evaporation Pond STEP Stage II Evaporation Pond TDS total dissolved solids USEPA U.S. Environmental Protection Agency VSEP vibratory shear-enhanced process
1 7/29/2016 MR1149D\Remedy Evaluation Work Plan - SOEP STEP
1. INTRODUCTION
1.1 Purpose
This Remedy Evaluation Work Plan (work plan) has been prepared by Geosyntec Consultants, Inc. (Geosyntec) on behalf of Talen Montana, LLC (Talen), the successor of PPL Montana, LLC, pursuant to Article VI.C of the Administrative Order on Consent (AOC) Regarding Impacts Related to Wastewater Facilities Comprising the Closed-Loop System at the Colstrip Steam Electric Station (CSES) located in Colstrip, Montana (MDEQ, 2012). It addresses the constituents of interest (COIs) in groundwater at the Units 1 & 2 Stage I and II Evaporation Ponds Site (a.k.a., the SOEP/STEP). A map of the Colstrip area, including the SOEP/STEP site, is shown on Figure 1-1.
The AOC for the CSES comprises three areas: i) the Plant Site; ii) the SOEP/STEP Site; and iii) Units 3 & 4 Effluent Holding Pond Site (Units 3 & 4 EHP). A fourth area identified in the AOC, process water pipeline spills, is addressed as part of each of these three areas. The Plant Site and the SOEP/STEP Site are largely located within the East Fork Armells Creek drainage basin. The Units 3 & 4 EHP Site is located in the Cow Creek drainage basin. The Plant Site and Units 3 & 4 EHP Site are addressed in separate work plans.
Several remedial actions have already been completed and/or are ongoing at the SOEP/STEP Site. Those include, but have not been limited to: i) the upgrade or closure of certain process ponds (also called cells and clearwells) (Geosyntec, 2015); ii) the installation and operation of a groundwater capture system; and iii) cleanup response actions for pipeline spills. A significant component of the remedy evaluation will include an evaluation of the performance of the current process cell liner systems and the current groundwater capture system, with a focus on their adequacy and the need for enhancements and/or replacement by other technologies.
A multiple lines of evidence approach, including an evaluation of mass flux and fate and transport modeling, will be used in the remedy evaluation for the SOEP/STEP site. The evaluation techniques will be presented in the remedy evaluation report for the SOEP/STEP Site along with performance metrics and an explanation of their intended use.
1.2 Work Plan Organization
This work plan describes the approach for identifying and evaluating potential remedial actions for releases from the process water/scrubber systems at the SOEP/STEP Site. Background information is provided in Section 2 and the Conceptual Site Model (CSM) is presented in Section 3. The Remedial Action Objectives (RAOs) are defined in Section 4. The rationale that will be used to identify and screen remedial action technologies for the SOEP/STEP Site is described in Section 5 and a preliminary screening (subject to revision during implementation of this work plan) is included. Section 6 describes how those remedial action technologies that are retained will be assembled into Remedial Action Alternatives (RAA) to achieve the RAOs. A preliminary assembly of alternatives (subject to revision during implementation of this work plan) is provided. Section 7 describes the planned approach for detailed evaluation of the

2 7/29/2016 MR1149D\Remedy Evaluation Work Plan - SOEP STEP
assembled remedial alternatives. Section 8 describes how the preferred remedial action alternative will be identified. Section 9 describes the planned approach for identifying additional data gaps (if any) including the potential need for treatability studies. The schedule for completion of the work and contents of the Remedy Evaluation Report are discussed in Section 10. References are listed in Section 11. Supporting information is provided in tables, figures, and appendices that follow the text.
3 7/29/2016 MR1149D\Remedy Evaluation Work Plan - SOEP STEP
2. BACKGROUND
2.1 Facility Description
2.1.1 Construction/Operations
The CSES consists of four operating coal-fired electric generating units. Units 1 and 2 are 333 megawatts (MW) each and have been operating since 1975. Units 3 and 4 are 805 MW each and have been operating since 1983 and 1986, respectively. The CSES is co-owned by Talen; PacifiCorp; Puget Sound Energy, Inc.; Portland General Electric Company; Avista Corporation; and NorthWestern Corporation. Talen is also the operator of the CSES (Hydrometrics, 2016).
The CSES uses a closed-loop process water/scrubber system. Castle Rock Lake serves as a reservoir for the City of Colstrip and CSES. Water is piped from the Yellowstone River to Castle Rock Lake (a.k.a., the Surge Pond) via a 29-mile long pipeline. From Castle Rock Lake, water is piped to holding tanks at the Plant Site for use in the boilers, cooling towers, and scrubber systems for Units 1 through 4. Slurries of fly ash are transported to disposal ponds at SOEP/STEP and the 3&4 EHP areas. Bottom ash is slurried to holding ponds on the Plant Site, dewatered, and then transported to the 3&4 EHP area for disposal. Previously, the SOEP/STEP ponds were used for fly ash settling/decanting and evaporation of excess water. However, a paste plant was constructed in 2008 that dewaters scrubber slurry prior to fly ash (paste) disposal in the ponds. Clear water has always been recirculated and is re-used at the Plant Site for various purposes including scrubbing (Hydrometrics, 2016).
There are three general areas where process water is stored in ponds at the CSES:
1. The Plant Site contains Units 1 through 4 and several associated process ponds;
2. The SOEP/STEP Site is used for disposal of scrubber slurry (fly ash) from Units 1 and 2 and is located approximately 2 miles northwest of the Plant Site; and
3. The Units 3 & 4 EHP Site is used for disposal of scrubber slurry (fly ash) from Units 3 and 4 and bottom ash from all four generating units and is located approximately 2.5 miles southeast of the Plant Site.
The Plant Site and Units 3&4 EHP are addressed in separate work plans. The SOEP and STEP were constructed behind earthen dams built across a tributary drainage to East Fork Armells Creek. Fly ash scrubber slurry from Units 1 and 2 is transported via a pipeline to the SOEP/STEP. Clear water from the process ponds is then piped back to the Plant Site for re-use. The pond system at the SOEP/STEP Site has been operating since 1975 (Hydrometrics, 2016). A paste plant was constructed on the south side of STEP in 2008 to remove water from the fly ash scrubber slurry and began operating in 2009. The historic and current process ponds at the SOEP/STEP Site, including the current and future status of each pond, are summarized in Table 2-1. The locations of the historic and current process ponds at the SOEP/STEP Site are shown on Figure 2-1.
4 7/29/2016 MR1149D\Remedy Evaluation Work Plan - SOEP STEP
The SOEP received fly ash slurry from the Plant Site Units 1 & 2 A/B Pond between 1975 and 1997. The SOEP was constructed with the approximately 70-foot high Stage I Dam and a partial liner consisting of natural clay. With the partial clay liner, the seepage rate was estimated by the Bechtel design to be between 85 and 115 gallons per minute (gpm) assuming a full pond, saturated conditions, limited fractures in bedrock, and steady state conditions. The Stage I Main Dam was constructed with chimney drains, a blanket drain, and a toe drain. Water from those drains was routed to a sump that returned seepage water to the SOEP (Hydrometrics, 2016). The SOEP was full in 1997 and completely reclaimed in 2002. An engineered evapotranspiration cap has been constructed over the SOEP to reduce infiltration and leachate generation. Groundwater capture systems, which are generally located north and south of SOEP, are used to intercept seepage to groundwater from the SOEP area.
The STEP was constructed in 1992 directly down the drainage (east) from the SOEP (Figure
2-1). The STEP was constructed via the Stage II Main Dam that is approximately 88 feet high. The Stage II Main Dam was constructed with a central core grout curtain that extends horizontally along the entire length of the dam, and vertically through the alluvium where it is keyed into the underlying siltstone. The Stage II Main Dam was also constructed with chimney drains and toe drains that discharge to a sump that conveys water to Cell E (Hydrometrics, 2016).
The STEP currently consists of five cells (A, B [New Clearwell], D, E, and Old Clearwell). The Stage II Main Dam forms the east sides of Cell E, the Old Clearwell, and Cell D. The STEP cells are lined with either high-density polyethylene (HDPE) or reinforced polypropylene (RFP or RPP). The cumulative seepage from the STEP cells is estimated at approximately 21.5 gpm (Hydrometrics, 2016). The current use of the STEP cells is as follows:
1. Cell A, commissioned in 1992, is full and no longer receives fly ash scrubber slurry/paste, captured groundwater, or process water;
2. Cell E, commissioned in 2003, is currently the only cell receiving paste from the paste plant. Cell E also receives water from the STEP Main Dam Sump;
3. Cell B was constructed in 2006 to provide additional volume to store process water. In 2011, Cell B was equipped with pumps and converted to the New Clearwell. The New Clearwell receives clear water from the paste plant and returns it to the Plant Site for re-use in the scrubbers. The New Clearwell also receives captured groundwater. The New Clearwell was constructed with an underdrain collection system – no water was not detected in the underdrain in 2015;
4. The Old Clearwell, commissioned in 1992, is now used to store clear water from Cell E, but has also received some flyash in the past. The Old Clearwell is planned to be filled with paste; and
5. Cell D was constructed in 2011 to provide additional volume to store clear water and paste as needed. Cell D was constructed with an underdrain collection system – no water was detected in the underdrain in 2015.
5 7/29/2016 MR1149D\Remedy Evaluation Work Plan - SOEP STEP
In addition to the five existing cells listed above, a future Cell (Cell C) is planned for construction north of Cell E, when needed.
2.1.2 Prior Releases and Response Actions
The closed-loop process water/scrubber system was designed to minimize impacts to water resources; however, process pond seepage, pipeline spills and incidental tears in pond liners have resulted in releases of process water to groundwater and surface water in various portions of the CSES. Summaries of past releases and investigations can be found in the Units 1 & 2 SOEP/STEP Evaporation Ponds Site Report (Hydrometrics, 2016).
Talen has implemented several completed and ongoing remedial actions at the SOEP/STEP Site in response to changes in groundwater quality and/or in response to past spills or releases. Those remedial actions have included, but are not limited to: i) operational (groundwater and surface water) monitoring; ii) groundwater capture and re-use; iii) operational changes (pond upgrade/closure and paste production); and iv) additional best management practices (BMPs) for process water management. Captured groundwater at the SOEP/STEP site is pumped to the STEP. The paste plant removes approximately 90% of the free available water in the fly ash scrubber slurry (Geosyntec, 2015). Captured groundwater and clear water from the paste plant are piped to the Plant Site, treated using a vibratory shear-enhanced process (VSEP), and then re-used at the Plant Site (Hydrometrics, 2016).
Process water in the ponds has some of the chemical characteristics of the ash with which it has had contact. To track those chemical characteristics, grab samples for water quality testing are collected near the surface of active process ponds at a minimum frequency of once every three years. Water seeping from the ponds migrates downward and may eventually reach and mix with groundwater if not contained by the pond liners, underdrains, and main dam seepage control structures (chimney drains, toe drains, valley drain, main dam sump). Groundwater beneath the ponds has some of the chemical characteristics of the local soil, coal, and rock through which it has flowed. Some COIs in process water also occur naturally in local strata at, or above, background concentrations. Several indicator parameters have been used at the SOEP/STEP Site to differentiate between groundwater that has been impacted by process water and the native groundwater quality. Indicator parameters include specific conductance (SC), dissolved boron, chloride, sulfate, and the ratio of calcium to magnesium. Those indicator parameters, together with the respective background concentrations (Background Screening Levels [BSLs], Neptune, 2016), are useful in evaluating the potential presence of process water COIs in groundwater and have been accepted as an evaluation method for water quality evaluation by Talen and the Montana Department of Environmental Quality (MDEQ) (Hydrometrics, 2016).
Routine groundwater quality monitoring is conducted in and around the SOEP/STEP Site via a network of monitoring wells and capture wells. The MDEQ-approved monitoring program is outlined in the Water Resources Monitoring Plan (Talen, 2015). Biannual groundwater monitoring is conducted to document seasonal variability. For example, in 2015, 214 wells
6 7/29/2016 MR1149D\Remedy Evaluation Work Plan - SOEP STEP
were sampled during the first half of the year and 168 wells were sampled during the second half of the year.
Synoptic surface water monitoring is conducted at multiple stations along East Fork Armells Creek. Synoptic surface water/groundwater monitoring was conducted in March and October 2015. Surface water and streambed soil/sediment was sampled at twelve locations, and groundwater elevations were measured at nineteen locations immediately adjacent to East Fork Armells Creek.
Where indicator parameters in groundwater have been interpreted to indicate the presence of process water COIs at the SOEP/STEP Site, Talen operates and maintains a groundwater capture system consisting of sixty wells. The majority of groundwater capture wells are located on the east side of the STEP Main Dam (see Figure 2-1).
Groundwater capture wells are routinely monitored for flow, hours pumps operated, water level, and SC. Monitoring is conducted to: i) measure water levels and flow rates; ii) make adjustments to drawdown; iii) estimate capture volumes; and iii) to identify problems. One problem is scale build-up inside some of the conveyance piping, which increases water pressure and renders flow meters inoperable. Flow rates are measured through sample ports at the wellheads under atmospheric pressure, and are higher than the actual flow within the pipelines which operate under greater than atmospheric pressure. To compensate, the flow rates measured at the wellheads are reduced by 25 percent beginning with the SOEP/STEP Site Report (Hydrometrics, 2016). Modeling of future groundwater capture systems as part of the remedy evaluation will continue to include the adjustment of 0.75 times the measured flow rate and will also include sensitivity analyses of flow rate measurements. The 0.75 adjustment potentially results in a conservative assessment (i.e., potentially under-predicts actual capture). In 2015, the average total adjusted flow rate for the groundwater capture system at the SOEP/STEP site was 183 gpm, and an additional 4 gpm was collected from the STEP Main Dam Sump (Hydrometrics, 2016).
Additional mitigation measures that have been completed in the SOEP/STEP site (Hydrometrics, 2016) include the following:
Installation of an engineered vegetated cap during reclamation of the SOEP in 2002 to limit infiltration and provide evapotranspiration of precipitation;
Installation (in 2006) of RPP double-lined cells for the New Clearwell (Cell B) and Cell D with underdrain collection systems between the primary and secondary liners, and beneath the secondary liners. Cell A, Cell E and the Old Clearwell were single-lined with HDPE in 1992;
Utilization of paste technology (beginning in 2009), forced evaporation and water management practices (re-use) to reduce the volume of water (and hydraulic head) in the ponds;
7 7/29/2016 MR1149D\Remedy Evaluation Work Plan - SOEP STEP
Supplying municipal water to residences and businesses east of the STEP Main Dam, and the planned sealing of private wells without well logs or with questionable annular seals (PW-704 was sealed and replaced in 2012); and
Installation of new scrubber slurry and clearwater return pipelines to replace the original pipeline.
The adequacy of these systems will be investigated as part of the Remedy Evaluation.
2.2 Physical Setting
The SOEP/STEP Site is located north of the City of Colstrip, which lies within Rosebud County in south central Montana. The location of SOEP/STEP Site is depicted on Figure 1-1. The nearest surface water features are East Fork Armells Creek to the east and Castle Rock Lake to the south. Other nearby surface water features include treated sewage lagoons and a golf course storage pond using water from the Colstrip Sewage Treatment Plant. Farther north is Stocker Creek, which flows intermittently to the east and into East Fork Armells Creek. The average annual precipitation in the Colstrip area over the last 40 years, which roughly coincides with the operating life of the SOEP/STEP Site, is approximately 15.2 inches (NewFields, 2016).
Regionally, East Fork Armells Creek is an intermittent stream, but it generally flows continuously through the City of Colstrip and along the eastern edge of the SOEP/STEP Site. Overall, East Fork Armells Creek is a gaining (increasing in flow) stream along this reach, but it does have localized losing (decreasing in flow) reaches (Hydrometrics, 2016). Figure 2-3
shows the reaches that are gaining and losing and hydrographs for each monitoring station. The gaining and losing reaches were determined based on the period-of-record harmonic mean discharge values at monitoring stations. The stream discharge measurements shown in the hydrographs on Figure 2-3 were collected during spring synoptic runs.
The CSES is a zero discharge facility, which means there is no direct process water discharge from the process ponds to surface water. The ground surface topography slopes downward from the SOEP/STEP Site toward East Fork Armells Creek. Groundwater from most of the SOEP/STEP Site flows in the direction of East Fork Armells Creek, although capture wells at the SOEP/STEP Site limit the migration of groundwater (Hydrometrics, 2016). Surface water in East Fork Armells Creek varies with respect to depth and flow rate throughout the year. East Fork Armells Creek adjacent to the SOEP/STEP Site is generally shallow and slow moving (Ford Canty & Associates, 2015).
Castle Rock Lake is located south of the SOEP/STEP Site and west of East Fork Armells Creek. Castle Rock Lake was constructed via a main dam across a tributary drainage to East Fork Armells Creek. Castle Rock Lake was constructed with natural clay soils. Water for Castle Rock Lake is supplied by the Yellowstone River via a 29-mile long pipeline originating at the Nicols pump station west of Forsyth, Montana. Water in Castle Rock Lake is either routed to the City of Colstrip Water Treatment Plant and distributed to residents and businesses, or piped to the Plant Site as “raw” water. Water levels in Castle Rock Lake are regulated between an
8 7/29/2016 MR1149D\Remedy Evaluation Work Plan - SOEP STEP
elevation of about 3,280 feet above mean sea level (amsl) in the summer and 3,284 feet amsl in the winter months. The quality of the water is generally good and reflects that of the Yellowstone River (Hydrometrics, 2016).
2.3 Geology
The uppermost bedrock formation in the SOEP/STEP Site area is the Tongue River Member of the Fort Union Formation. Overall, the Fort Union Formation in the Colstrip area is approximately 650 feet thick. The Tongue River Member, which is exposed at the ground surface in some areas of Colstrip, has a maximum thickness of about 350 feet. The Tongue River Member is comprised of claystone, siltstone, fine-grained sandstone, and coal. The two main near-surface coal seams in the Colstrip area are the Rosebud Coal and McKay Coal; a third seam called the Robinson Coal is found at depth. Only the Rosebud Coal is mined in the Colstrip area because the McKay Coal may cause boiler scaling (NewFields, 2016). Strata beneath the McKay Coal are referred to as the Sub-McKay. Clinker is present in the SOEP/STEP Site area. Clinker is thermally altered and collapsed overburden rock that forms when a coal seam burns in situ (Hydrometrics, 2016).
Where the bedrock is not exposed, it is overlain by unconsolidated deposits and anthropogenic materials (i.e., fill and mining spoils). The unconsolidated deposits include fine-grained and coarse-grained alluvium and associated colluvium along and beneath East Fork Armells Creek, fill, and mine spoils (Hydrometrics, 2016).
The thicknesses and extents of the geologic units vary across the SOEP/STEP Site area, andindividual depositional units may be discontinuous (Hydrometrics, 2016). Descriptions of the main geologic units in the SOEP/STEP Site area are provided in Table 2-2.
2.4 Hydrogeology
2.4.1 Hydrostratigraphic Units
The primary water-bearing units at the SOEP/STEP Site are: (i) alluvium deposits associated with East Fork Armells Creek and its tributary drainage bottoms beneath the SOEP/STEP Site ponds and Castle Rock Lake; (ii) McKay Coal; and (iii) Sub-McKay siltstones and sandstones (NewFields, 2016). Of these units, the most permeable layers are basal (alluvial) gravels along East Fork Armells Creek, cleated McKay Coal, and fractured Sub-McKay sandstones facies. Groundwater also flows through fractures in the interburden (where saturated) and the Sub-McKay siltstones, claystones, and shales. Due to erosion, the Rosebud coal/clinker and interburden are absent in most areas of the SOEP/STEP Site except for a few locations where the Rosebud coal/clinker forms a cap rock on hilltops and ridges (NewFields, 2016). Where present, clinker has a higher hydraulic conductivity compared to the other bedrock units. However, groundwater is rarely found in clinker due to its occurrence as a cap rock and its ability to transmit groundwater to underlying units. Groundwater is also present in the spoils west (upgradient) of the SOEP/STEP site (Hydrometrics, 2016).
9 7/29/2016 MR1149D\Remedy Evaluation Work Plan - SOEP STEP
Hydrogeologic cross sections of the SOEP/STEP are shown in Appendix A (NewFields, 2016). Note that hydrostratigrahic units at the SOEP/STEP Site are variable, and cross sections along other transects may show significant differences.
2.4.2 Groundwater Flow
Groundwater flow patterns within the hydrostratigraphic units at the SOEP/STEP Site are a function of: (i) geology; (ii) areas of recharge and discharge; (iii) ground surface topography; (iv) process ponds and dams; and (v) groundwater capture. Recharge to the groundwater system is through infiltration of precipitation, seepage from process ponds and Castle Rock Lake, and residential lawn and garden watering. The recharge rate is a function of ground cover, geology, process pond liner systems, and Castle Rock Lake bottom sediments. The background recharge is estimated to be 0.22 to 0.44 inches/year, which is approximately 1.5 percent of average annual precipitation (NewFields, 2016).
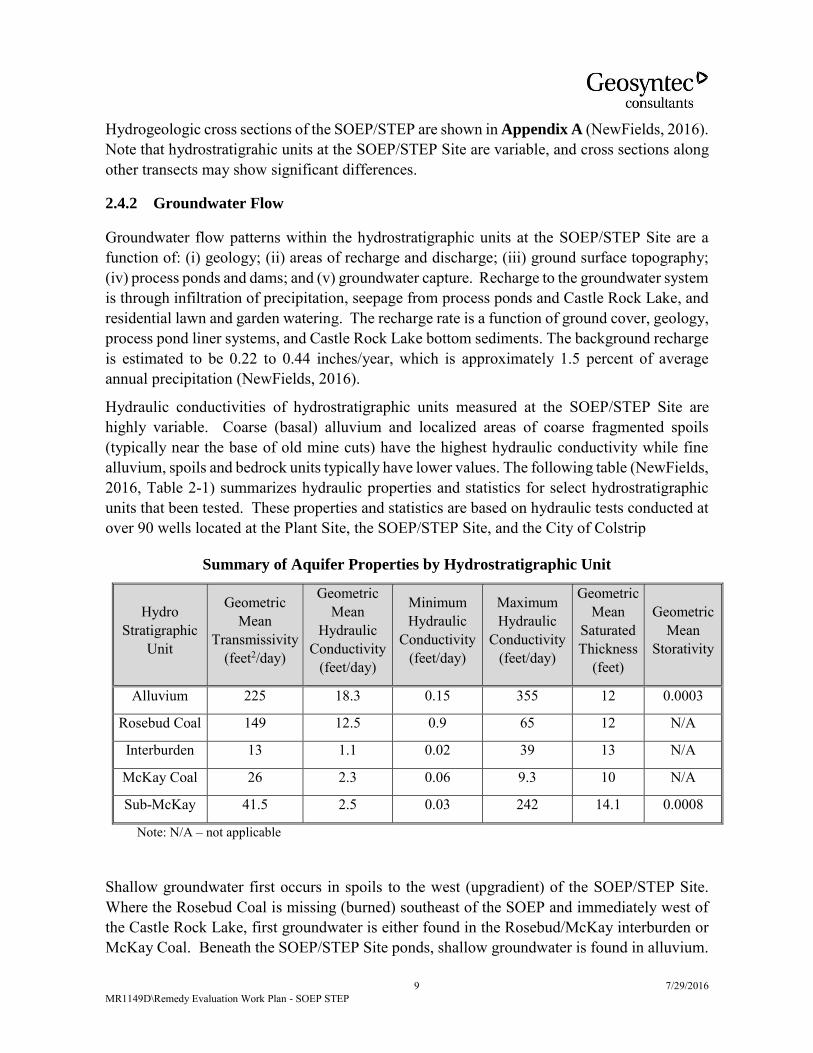
Hydraulic conductivities of hydrostratigraphic units measured at the SOEP/STEP Site are highly variable. Coarse (basal) alluvium and localized areas of coarse fragmented spoils (typically near the base of old mine cuts) have the highest hydraulic conductivity while fine alluvium, spoils and bedrock units typically have lower values. The following table (NewFields, 2016, Table 2-1) summarizes hydraulic properties and statistics for select hydrostratigraphic units that been tested. These properties and statistics are based on hydraulic tests conducted at over 90 wells located at the Plant Site, the SOEP/STEP Site, and the City of Colstrip
Summary of Aquifer Properties by Hydrostratigraphic Unit
Hydro Stratigraphic
Unit
Geometric Mean
Transmissivity (feet2/day)
Geometric Mean
Hydraulic Conductivity
(feet/day)
Minimum Hydraulic
Conductivity (feet/day)
Maximum Hydraulic
Conductivity (feet/day)
Geometric Mean
Saturated Thickness
(feet)
Geometric Mean
Storativity
Alluvium 225 18.3 0.15 355 12 0.0003
Rosebud Coal 149 12.5 0.9 65 12 N/A
Interburden 13 1.1 0.02 39 13 N/A
McKay Coal 26 2.3 0.06 9.3 10 N/A
Sub-McKay 41.5 2.5 0.03 242 14.1 0.0008
Note: N/A – not applicable
Shallow groundwater first occurs in spoils to the west (upgradient) of the SOEP/STEP Site. Where the Rosebud Coal is missing (burned) southeast of the SOEP and immediately west of the Castle Rock Lake, first groundwater is either found in the Rosebud/McKay interburden or McKay Coal. Beneath the SOEP/STEP Site ponds, shallow groundwater is found in alluvium.
10 7/29/2016 MR1149D\Remedy Evaluation Work Plan - SOEP STEP
Shallow bedrock and alluvial groundwater elevations are highest west of Castle Rock Lake and southeast of the SOEP. Groundwater elevations west of Castle Rock Lake indicate flow towards the SOEP (Hydrometrics, 2016).
Alluvial groundwater flows eastward under the SOEP and STEP, but is interrupted by the Stage I and Stage II Dams (Figure 2-1). Alluvial groundwater directly east of the Stage II Dam flows eastward until it reaches East Fork Armells Creek alluvium (unless interrupted by the capture system). Groundwater in the East Fork Armells Creek alluvium then flows northward (Hydrometrics, 2016).
Downward vertical gradients are observed at the SOEP/STEP Site. Reductions in hydraulic head caused by capture system pumping may potentially reduce the downward gradients (Hydrometrics, 2016).
Groundwater in the Sub-McKay generally flows to the northeast under a regional gradient from the Bighorn Mountains approximately 75 miles to the south toward the Yellowstone River located about 30 miles to the north. The Yellowstone River and lower reach of Rosebud Creek are thought to be the regional discharge points for this deep regional flow system. Groundwater flow from the upper sub-McKay bedrock flows to the alluvium where it sub-crops in East Fork Armells Creek alluvium.
2.4.3 Numerical Groundwater Flow Model
A calibrated numerical groundwater model was prepared for the SOEP/STEP Site (NewFields, 2016) to simulate groundwater flow and advective transport under a variety of hydrologic conditions. The model is able to distinguish flow within and between spoils, fine and coarse alluvium, overburden, Rosebud Coal, interburden, McKay Coal, and shallow/deep Sub-McKay (NewFields, 2016).
The calibrated model may be used as an interpretive and predictive tool for evaluating: (i) groundwater flow; (ii) capture system effectiveness; and (iii) effects of contemplated remedial alternatives. The model can be used to predict the effects of modifying current pumping rates, turning capture wells on or off, or adding capture wells, to modify capture. The model can also be used to predict the effects of planned pond upgrades or closures as source control measures, and to evaluate fate and transport. As these types of model runs are predictive in nature, no changes will be made to the model calibration.
Inherent in any model is a degree of uncertainty. Results of capture zone analyses, together with groundwater monitoring data, provide an understanding of the efficacy of the capture system at the present time. However, capture analyses do not take into account operational down time of capture wells for maintenance/repairs, or variability in flow from unusual seasonal climatic patterns. In addition, the flow rates from the groundwater capture wells have some uncertainty as do the seepage rates from the process pond liner systems (NewFields, 2016). The model simulates groundwater flow as a porous media whereas it is actually a combination of porous media flow and fracture flow for the bedrock units.
11 7/29/2016 MR1149D\Remedy Evaluation Work Plan - SOEP STEP
Groundwater capture wells have been installed in areas of the SOEP/STEP Site with identified process water impacts. A majority of the groundwater capture wells are located on the east side of the Stage II Dam. Overall, groundwater quality in remedial areas of the SOEP and STEP has shown an improvement (Hydrometrics, 2016). Other areas where the calibrated flow model indicates impacted groundwater may be leaving the SOEP/STEP Site or where groundwater capture may not be effective (NewFields, 2016, Section 8.0) will be considered in the remedy evaluation. Figures from the calibrated flow model showing uncaptured areas (NewFields, 2016) are included in Appendix C.
2.5 Process Water Indicator Parameters
Article IV.B of the AOC states that the COIs include, but are not limited to, sulfate, boron, selenium, potassium, sodium, magnesium, total dissolved solids (TDS), and salinity as measured by specific conductance (SC) (Table 2-3). TDS and SC are essentially two measures of the same underlying property. Of these, several indicator parameters are used along with the BSLs to evaluate the potential presence of process water COIs in groundwater at the SOEP/STEP Site (Hydrometrics, 2016). These include TDS, SC, dissolved boron, chloride, sulfate, and the ratio of calcium to magnesium. Groundwater affected by process water contains TDS, sulfate, chloride and boron concentrations that are elevated relative to background or unaffected reference areas concentrations. In most cases, the water also exhibits low ratios of calcium to magnesium. Chloride is given less weight compared to the other indicator parameters because the chloride BSL appears to be erroneously low.
12 7/29/2016 MR1149D\Remedy Evaluation Work Plan - SOEP STEP
3. CONCEPTUAL SITE MODEL
This section describes the current Conceptual Site Model (CSM) that provides the foundation for the remedy evaluation at the SOEP/STEP Site. The initial hydrogeologic CSM was developed by Maxim (2004) in preparation for the development of a numerical groundwater flow model. The hydrogeologic CSM for the SOEP/STEP Site was updated by Maxim (2005), Geomatrix (2007) and Newfields (2016).
For purposes of the remedy evaluation, the CSM includes the following components:
Source Area(s) and COIs; Release Mechanisms; Transport Pathways; Environmental Fate along Pathways; Potential Exposure Point(s); and Potential Receptor and Associated Potential Health Risk.
The CSM for the SOEP/STEP Site is described below and summarized on Figure 3-1.
3.1 Source Area(s) and Constituents of Interest
The main source areas are the process water ponds at the SOEP/STEP Site and associated pipelines. As described on Table 2-1, the SOEP has been reclaimed, and Cell A (STEP) is full and no longer receives flyash scrubber slurry. In some cases, there might be salts in the unsaturated zone soils (e.g., below the pond liners or where there have previously been flyash pipeline failures) that act as secondary source areas. Historical releases outside the footprint of the ponds, mainly due to accidental releases from the process water pipelines at the SOEP/STEP Site, are documented in in “Table 3-1, Summary of Releases of Actions Taken, Units 1 & 2 SOEP/STEP Evaporation Ponds” (Hydrometrics, 2016).
Implementation of the Master Plan (Geosyntec, 2015) in response to the Federal CCR Rule is occurring in a phased approach over several years. As a comparative metric for possible source control measures for the remedy evaluation, Geosyntec will use mass flux estimates before and after planned cell modifications to predict groundwater quality improvements arising from planned cell upgrades or closures, or changes in process water chemical profiles.
The baseline mass flux for the COIs from each pond or cell to the groundwater will be calculated by multiplying the concentrations of COIs in the process ponds (Table 2-3) by the seepage estimates for the ponds (Tables 2-6A through 2-6B) presented in the SOEP/STEP Site Report (Hydrometrics, March 2016). If a pond is currently planned to be upgraded or closed, a new seepage rate will be estimated. For a pond that has a new chemical profile or a new seepage rate, those data will be used to calculate the new (future) mass flux for that pond to groundwater. The new mass flux will be compared to the baseline mass flux for each pond to evaluate if there is a change (i.e. a decrease) in mass flux to groundwater. The new mass flux at a given pond will be evaluated in terms of its effectiveness as a source control measure in the remedy
13 7/29/2016 MR1149D\Remedy Evaluation Work Plan - SOEP STEP
evaluation. Fate and transport modeling might be used, potentially along with other tools and lines of evidence, to evaluate whether additional source control measures, beyond those envisioned in the Master Plan, are necessary to achieve Cleanup Criteria.
If some of the process ponds or cells contribute the greatest load (i.e., mass flux) of indicator parameters to the shallow groundwater system, after accounting for uncertainty in the estimated mass flux, then they should receive a greater degree of source control compared to other ponds. Those COIs that are present at higher concentrations in groundwater and highly mobile in water should serve as good indicator parameters for evaluating mass flux. Limitations or assumptions that are used in the evaluation of mass flux will be documented in the Remedy Evaluation Report. The load for an individual cell depends upon both the seepage rate of the contained process water and the concentration of its dissolved solutes. For example, the dissolved solute flux to groundwater from a cell with a low seepage rate but very high solute concentrations might be more significant than that from a storm water detention pond with a higher seepage rate but much lower solute concentrations. The effect of implementation of the Master Plan (Geosyntec, 2015) on the cells and preferred remedy will be described in the Remedy Evaluation Report.
Since mass flux will be used to evaluate the source control effects of cell upgrades or closures, or changes in chemical profiles, it will also prove useful to evaluate the source control effects in the groundwater flow regime. The calibrated groundwater flow model and the COI concentrations in groundwater will be used to calculate the mass flux of COIs through a vertical plane downgradient from the ponds in the groundwater flow regime. The background mass flux will then be calculated using the MDEQ-approved 2015 BSLs. The difference will be the reduction that is needed to attain the MDEQ-approved 2015 BSLs. The reduction in mass flux needed in groundwater will then be compared to the reduction in mass loading achieved from the planned cell upgrades/closures. The difference between the reduction in mass flux needed in groundwater and the reduction in mass loading achieved from the cells will then be used to predict the locations where compliance with Cleanup Criteria may be achieved, and the locations where additional remediation may be needed. As part of a multiple lines of evidence approach, changes in center of mass over time, or other techniques, may also prove useful to visualize source control effects, groundwater capture, or natural attenuation in certain areas of the SOEP/STEP Site.
The COIs are defined in Article IV.F. of the AOC as “…those parameters found in soil, groundwater or surface water that (1) result from Site operations and the wastewater facilities and (2) exceed background or unaffected reference area concentrations.” Article IV.B of the AOC states that COIs (‘regulated substances’) include, but are not limited to, sulfate, boron, selenium, potassium, sodium, magnesium, TDS, and salinity as measured by SC (Table 2-3). It should be noted that COIs will also be addressed in the risk assessment currently being prepared by Ford Canty & Associates for the SOEP/STEP Site. It is anticipated that the risk assessment will narrow the COIs to a list of constituents of potential concern (COPCs) strictly from a risk assessment perspective. The use of the term COIs in this work plan should not be confused with the term COPCs that will be used in the risk assessment.
14 7/29/2016 MR1149D\Remedy Evaluation Work Plan - SOEP STEP
3.2 Release Mechanism
For the process ponds, the primary release mechanism is potential seepage through the engineered pond liner system and the dam sumps by solutes that are already in a dissolved state in the process water contained in the pond. This is the main release mechanism to be addressed by source control technologies in the remedial alternatives. It is possible that there are salts of these solutes in the soils beneath the ponds (Hydrometrics, 2016). In such cases, dissolution of those salts would be an additional release mechanism. Potential release by volatilization or entrainment of process water droplets into ambient air from the pond water surface is considered to be insignificant and is therefore not included as a release mechanism to be addressed by the remedy.
For the accidental releases from the process water pipelines, loss of containment is the relevant release mechanism. This release mechanism has been, and continues to be, addressed by system repairs, operator training, and operation and maintenance procedures.
3.3 Transport Pathways
For releases from the ponds, migration by groundwater advection is the main transport pathway. Several indicator parameters have been established for the SOEP/STEP Site. They include SC, boron, sulfate, chloride, and calcium-to-magnesium ratio. The indicator parameters are highly mobile in groundwater and have a higher concentration in impounded process water versus background (i.e., BSLs) and therefore are more useful than relatively immobile constituents for evaluating the extent of process water migration. The figures provided in Appendix B are from the Site Report and show the interpreted extent of indicator parameters above the MDEQ-approved BSLs for the SOEP/STEP Site (Neptune, 2015). For the SOEP/STEP Site, groundwater transport pathways are mostly toward East Fork Armells Creek in the shallow groundwater system and to the northeast in the deeper (Sub-McKay) groundwater system. The existing groundwater monitoring data indicate that the COIs have migrated farther (laterally) from the ponds in the shallow groundwater zones compared to the deeper zones. These transport pathways are mitigated by the existing groundwater capture systems. This remedy evaluation will address whether the existing capture systems adequately contain affected groundwater.
Transport pathways for accidental releases from the pipelines are via overland flow (controlled by ground surface topography) toward East Fork Armells Creek, and via infiltration to groundwater. If there are COIs remaining in the affected soils following emergency response actions, then leaching by infiltration of precipitation is another possible transport pathway. This is also potentially applicable to salts in soils of the unsaturated zone beneath the ponds (if any).
For both the ponds and accidental pipeline releases, if COIs enter East Fork Armells Creek, they are transported by surface water in the downstream direction (to the north). If COIs enter the alluvium associated with East Fork Armells Creek but do not reach the creek, they are transported downgradient (to the north) by groundwater advection.
15 7/29/2016 MR1149D\Remedy Evaluation Work Plan - SOEP STEP
3.4 Environmental Fate
Some of the COIs are highly mobile in groundwater and surface water and hence undergo little attenuation other than dilution and dispersion. Some adsorption to aquifer solids is possible for some constituents. It is possible that some mineral precipitation occurs (e.g. gypsum) when the magnesium sulfate-rich pond water mixes with more calcium-rich groundwater. Gypsum precipitation might also be facilitated by calcium-magnesium ion exchange reactions with clays in the aquifer solids. No volatilization, decay, or biodegradation of these constituents is expected. Detailed discussion on the environmental fate of COIs will be provided in the Remedy Evaluation Report, including: (i) the results of fate and transport modeling to be performed using the calibrated groundwater flow model; and (ii) an evaluation of potential natural attenuation processes including adsorption, chemical reactions and biodegradation.
3.5 Potential Exposure Point(s)
Potential exposure points include groundwater wells and East Fork Armells Creek. Talen has decommissioned a number of private water supply wells and provided alternative water supplies to those residents.
The reach of the East Fork Armells Creek downstream of the SOEP/STEP Site may have received loading of COIs via groundwater seepage in the past. The groundwater capture system and source control upgrades are intended to mitigate future migration to these potential exposure points. The Remedy Evaluation will consider whether the existing system adequately captures current seepage from the ponds, thus mitigating these potential exposure points.
3.6 Potential Receptors/Health Risks
A Site Conceptual Exposure Model (SCEM) will be prepared as the first step in the Exposure Assessment conducted as part of the Cleanup Criteria and Risk Assessment (CCRA) by Ford Canty & Associates, and could list the following as potential receptors: residents, outdoor workers, trespassers, trench workers, and terrestrial and aquatic ecological receptors. The identification of chemicals of potential concern and consequent evaluation of health and ecological risks will be completed during the CCRA following guidance from the U.S. Environmental Protection Agency (USEPA), AOC and MDEQ.
16 7/29/2016 MR1149D\Remedy Evaluation Work Plan - SOEP STEP
4. REMEDIAL ACTION OBJECTIVES
This section presents the Remedial Action Objectives (RAOs) that will be used to screen remedial action technologies and evaluate remedial action alternatives for the SOEP/STEP Site.
4.1 Objectives and Implementation of the AOC
The AOC embraced a risk-based remediation approach for the process water systems at the CSES. The AOC states “…the Department and Talen have concluded that a comprehensive, risk-based approach incorporating all tools and requirements applicable under Montana’s generally applicable environmental laws, including adaptive management practices available thereunder, is needed to address groundwater contamination and seepage.”
The AOC includes requirements for a Cleanup Criteria and Risk Assessment Report (CCRA) to be completed prior to, or in parallel with, the Remedy Evaluation Report. The CCRA will establish risk-based cleanup criteria for the remedy under the AOC and will address COIs that include “parameters found in soil, ground water or surface water that (1) result from Site operations and the process water facilities and (2) exceed background or unaffected reference areas concentrations.”
The AOC indicates that the applicable cleanup criteria for COIs in groundwater and surface water (except for the evaluation of ecological receptors) are the most current version of Circular DEQ-7 (Montana Numeric Water Quality Standards), the USEPA MCLs, or the risk-based screening levels contained in the most current version of Montana Risk-Based Guidance for Petroleum Releases, whichever is more stringent. For constituents where there is not a value given in the above sources, the cleanup standard is the tap water screening level contained in the most current version of the USEPA Regional Screening Levels for Chemical Constituents at Superfund Sites. If the above criteria are not adequate to protect ecological receptors, then a cleanup value that results in an acceptable ecological risk, determined using the most current versions of standard USEPA ecological risk assessment guidance, is the cleanup standard. The Cleanup Criteria may not be more stringent than the background or unaffected reference area concentrations.
For COIs in soil, the cleanup value is the most stringent of a cumulative human health risk of 1E-05 for carcinogens or a cumulative hazard index of one for non-carcinogenic COIs. If the above value is not protective of potential ecological receptors, then the cleanup level is a value that results in acceptable ecological risk as determined using the most current version of standard USEPA ecological risk assessment guidance, or the risk-based screening level contained in the most current version of Montana’s Risk-Based Guidance for Petroleum Releases. The Cleanup Criteria may not be more stringent than the background or unaffected reference area concentrations.
17 7/29/2016 MR1149D\Remedy Evaluation Work Plan - SOEP STEP
While the AOC does not specify the point of compliance (POC) for groundwater remediation, Paragraph 1.I of the AOC (MDEQ, 2012) indicates that [Talen] must ‘contain any impacts on [Talen] land’. For surface impoundments that are subject to the USEPA’s Federal CCR Rule1, the POC will be the edge of the impoundment when that POC becomes effective. The SOEP and Cell A were full and stopped receiving CCR prior to the effective date, and thus are not subject to the Federal CCR Rule. Therefore, a consistent POC among all the cells at the SOEP/STEP Site is not necessarily appropriate. Geosyntec will initiate the remedy evaluation for the SOEP and Cell A assuming the initial POC is the same as that for non-hazardous solid waste facilities, i.e. up to 150 meters downgradient from the cell boundary (but on Talen property and not beyond the property boundary or the nearest receptor.
For COIs that are also regulated by the Federal CCR Rule, and have been released from cells that are subject to the Federal CCR Rule groundwater monitoring and corrective action requirements, the POC will be the downgradient edge of the cell, but that POC will not be effective until October 2017. The New Clearwell (Cell B), the proposed Cell C, Cell D, Cell E, and the Old Clearwell are subject to the Federal CCR Rule.
4.2 Compliance Evaluation
The CCRA will be completed in parallel with the Remedy Evaluation. For purposes of this work plan, it is assumed that cleanup levels will need to be established for several parameters, likely to include boron, sulfate, TDS, and selenium. It is also assumed that the cleanup level for boron, sulfate, and TDS will be based upon DEQ-approved 2015 BSLs because they are greater than the values identified in the AOC, or no values are available. The selenium cleanup levels will be based upon the MCL because the DEQ-approved 2015 BSLs for this metalloid are below the MCL. It is also assumed that there are currently no complete exposure pathways to groundwater for potential human receptors, and that little if any impact to East Fork Armells Creek is occurring. The CCRA will address potential future groundwater exposure, and may result in Cleanup Criteria above the DEQ-approved 2015 BSLs at specific locations. The POC for attaining the Cleanup Criteria in groundwater for non-CCR Rule cells is based upon the Federal RCRA Subtitle D program and is set no more than 150 meters downgradient from the edge of each cell, but cannot extend beyond the downgradient property boundary and the nearest receptor. For COIs that are also regulated by the Federal CCR Rule, and have been released from cells that are subject to the Federal CCR Rule groundwater monitoring and corrective action requirements, the POC will be the downgradient edge of the cell footprint, but that POC will not be effective until October 2017.
1 “Hazardous and Solid Waste Management System; Disposal of Coal Combustion Residuals from Electric Utilities; Final Rule.” 40 CFR Parts 257 and 261. April 17, 2015.
18 7/29/2016 MR1149D\Remedy Evaluation Work Plan - SOEP STEP
4.3 Source Control Upgrade Remedial Action Objectives
The RAOs for Source Control Components of the overall remedy are to:
“control future release of COIs to the groundwater to the extent necessary to achieve the cleanup levels at the downgradient point of compliance in a reasonable period of time.”
During implementation of this work plan, calculations of the expected timeframes to achieve the cleanup goals at the POC will be provided along with a justification as to whether or not they are reasonable. Depending upon the existing mass loading of solutes to the groundwater system from various ponds, more aggressive source control actions may be necessary at some source areas compared to others.
4.4 Migration Management Upgrade Remedial Action Objectives
The RAOs for Migration Management Components of the overall remedy are to:
“Prevent potential current and future exposure of human and ecological receptors to COIs at concentrations greater than cleanup criteria in groundwater beyond the point of compliance, and in surface water in East Fork Armells Creek, and to restore water quality to Cleanup Criteria or background, whichever is greater, in a reasonable period of time.”
4.5 Institutional Controls
Existing or new institutional controls might contribute to controlling potential exposure to COIs in the short term until such time that the remedy has achieved the cleanup goals. The RAOs for institutional controls, if included as a remedy component, would be to alert potential receptors to the presence of COIs and to reduce or eliminate potential exposure. An implementation plan for institutional controls, if included as a part of the preferred remedy, will be included in the Remedy Evaluation Report.
19 7/29/2016 MR1149D\Remedy Evaluation Work Plan - SOEP STEP
5. PRELIMINARY SCREENING OF REMEDIAL ACTION TECHNOLOGIES
This section describes the approach for initial identification and screening of remedial technologies. In this evaluation, a “technology” might include a:
Component, such as a capture well or a process water pond or cell liner upgrade; Activity, such as groundwater flow and transport modeling; or
Institutional control, such as a property deed restriction to control or eliminate a potential exposure pathway.
Potential technologies will be identified based on their applicability to the physical setting and subsurface conditions described in Section 2.0, and the ability of the technologies to address the RAOs described in Section 4.0. Technologies will be eliminated from consideration if their use is reasonably precluded by Site and/or COI characteristics.
Technologies will be screened using the following criteria:
Effectiveness; Implementability; and Qualitative cost.
These three screening criteria effectively combine the remedy evaluation criteria discussed in Article VI.C. in the AOC. The objective of the screening is to identify and retain technologies that alone or in combination provide a workable number of alternatives for detailed evaluation.
Each criterion will be scored as above average, average, or below average to facilitate comparison between technologies and decision making regarding assembly of remedial action alternatives. In some cases, the result of such scoring would be highly dependent on the specific COI and the application and design of the technology, and these will be marked accordingly. In other cases, the criteria may not apply, and these will be so marked. Note that some technologies may perform better when combined in a remedial alternative than as the sole technology.
Effectiveness will be assessed by considering the ability of the technology to achieve the RAOs. As previously stated, several remedial technologies have already been implemented and/or are ongoing at the SOEP/STEP. For technologies that have already been implemented at the SOEP/STEP, their effectiveness to date and their potential for enhancement will be evaluated.
In regard to implementability, ratings will be applied based on availability, maintenance needs, and ease of implementation (e.g. site infrastructure obstructions). Above average ratings will be applied where there are many vendors/suppliers, the technology is relatively low maintenance, and would be easily implemented. Conversely, below average ratings will be applied where the technology has few vendors/suppliers, the technology has high maintenance
20 7/29/2016 MR1149D\Remedy Evaluation Work Plan - SOEP STEP
and would be difficult to implement. Average ratings will be applied for those technologies where these factors fall at a relative midpoint.
For qualitative cost, consideration will be given to both capital and operation and maintenance costs. In this manner, total costs will be compared as either lower or higher than the current average site remediation costs.
A preliminary screening of technologies has been completed for this work plan and the results are illustrated in Table 5-1. This preliminary screening is subject to revision during implementation of this work plan. In Table 5-1 and in the following section, the technologies are grouped to facilitate assembling the technologies into remedial action alternatives (RAAs). Technologies are grouped together by:
Source control; Groundwater migration management; and Institutional controls.
Potential source control technologies include:
1. Install or upgrade liners in the process ponds; 2. Dewatering ash prior to placement in ponds using paste technology or dry stacking; 3. Cap/close process ponds; 4. Slurry wall/grout curtain/sheet pile; 5. Sumps/interceptor trenches; 6. Horizontal capture wells; 7. Perimeter (vertical) capture wells; and
8. Excavation of source material.
Groundwater migration management technologies include:
1. Capture wells/trenches; 2. Recharge barriers (gradient control); 3. Permeable reactive barriers; 4. Natural attenuation; and 5. Point of use monitoring/treatment.
Institutional control technologies that restrict potential groundwater exposure include:
1. Town ordinances; 2. Deed restrictions; 3. Easements;

21 7/29/2016 MR1149D\Remedy Evaluation Work Plan - SOEP STEP
4. Reservations; 5. Covenants; 6. Controlled groundwater areas; and 7. Zoning.
These are a mix of proprietary controls (pertaining to controls tied to specific land and ownership) and governmental controls (pertaining to controls on land use in areas under jurisdiction of an empowered governmental body).
Table 5-1 is marked as appropriate where a factor is inapplicable, or if consideration of a particular factor would be highly dependent on the specific COI and the application/design of the technology.
The screening shows that most of the listed technologies are feasible, with a degree of variability in effectiveness, implementability, and cost. During implementation of this work plan, other technologies might be identified and considered that are not included in this preliminary screening. The actual technologies might vary somewhat.
22 7/29/2016 MR1149D\Remedy Evaluation Work Plan - SOEP STEP
6. ASSEMBLING REMEDIAL ACTION ALTERNATIVES
Remedial action alternatives will be assembled from the technologies listed in Table 5-1 along with other promising technologies identified during implementation of this work plan, based on professional judgment. A remedial action alternative may be comprised of either an individual technology or remedial approach, or a combination of multiple technologies or remedial approaches. No further action (i.e. continuing the existing remedial systems as currently operated) will be included in the evaluation as a baseline for comparison. A range of ‘aggressiveness’ of the alternatives will be included such as No Further Action, Source Control upgrades only, Source Control upgrades plus additional distal groundwater plume management.
The assembly of remedial action alternatives will depend on multiple factors such as:
Nature and extent of COIs – Some technologies (or remedial approaches) may be effective for some COIs but not for others. If multiple COIs are identified, then it is possible that more than one type of remedial technology (or approach) may be required.
Targeted media – The technologies (or remedial approaches) to control migration of COIs may vary depending whether the COIs are observed in soil, surface water, or groundwater. For groundwater, the technologies (or remedial approaches) for source control may differ from those for migration management or for institutional controls.
RAOs - One technology (or remedial approach) may be sufficient for meeting some or all of the RAOs but if not, then use of multiple technologies (or remedial approaches) may be required either spatially, temporally, or both. Each assembled alternative will need to meet the general standards of the AOC: i) protect human health and the environment, ii) attain Cleanup Critiera, iii) control the source(s) of release so as to reduce or eliminate further release of COIs, and iv) comply with standards for management of wastes. Remedial actions that meet these general standards are consistent with the requirements of the AOC.
Performance and regulatory standards – Depending on the COIs, one or multiple technologies (or remedial approaches) may be required to meet the performance and regulatory standards. Other metrics (e.g., RAOs, time) besides regulatory standards (i.e., Cleanup Criteria, POC) will be considered as performance standards for remedy evaluation.
The assembled remedial action alternatives will be documented in tabular format in the Remedy Evaluation Report. There will likely be several alternatives that include groundwater capture since that technology is already in place and functioning at the site. Various configurations of groundwater capture may be included as distinct alternatives, such as addition of capture wells to the existing capture well field in appropriate locations to improve COI capture, as well as reconfiguration of the existing capture well field (potentially including decommissioning of
23 7/29/2016 MR1149D\Remedy Evaluation Work Plan - SOEP STEP
select wells) to improve system efficiency while meeting RAOs. Alternatives that rely more on source control upgrades along with institutional controls and/or alternative water supplies for distal plume areas (rather than capture wells) will also be included. Where appropriate, innovative in situ technologies such as permeable reactive barriers may be included in certain areas such as shallow alluvium, along with capture wells for deeper fractured bedrock areas.
A preliminary assembly of remedial alternatives is included in Table 6-1. This table was developed based upon the considerations described above and are intended to convey the general approach to be used for assembling a long list of potential remedial alternatives that will be screened using the criteria described in Section 7 below. During implementation of this work plan, other alternatives might be assembled and considered that are not included in this preliminary list. Also, different alternatives might be considered for different portions of the SOEP/STEP Site based upon varying site conditions.
24 7/29/2016 MR1149D\Remedy Evaluation Work Plan - SOEP STEP
7. EVALUATING REMEDIAL ACTION ALTERNATIVES
This section describes how the assembled RAAs will be evaluated with respect to the applicable requirements in the AOC. First, the assembled RAAs will be evaluated based on general standards (described in Section 7.1 below) to demonstrate that the assembled alternatives meet basic requirements such as protecting public health and the environment, controlling human and ecological exposure to hazardous substances, and achieving compliance with applicable state and federal regulations.
Next, the assembled remedial action alternatives will be evaluated in more detail considering their ability to achieve the RAOs presented in Section 4.0 of this work plan in the context of the Site and COI characteristics. Site and COI characteristics affect areas and depths of installation, material volumes, methods and sequence of construction, flow and reaction rates, sampling and analysis, effort to optimize, energy use, waste management and other relevant issues that require consideration for the alternative to be effective. Tables listing the total areas and volumes of media impacted by COIs exceeding Cleanup Criteria, and table(s) presenting a written summary of the evaluation of each remedial alternative will be included in the Remedy Evaluation Report.
These evaluations will be used to identify the preferred remedial action alternatives for the Site.
7.1 General Standards
The Remedy Evaluation will include a demonstration of how each assembled remedial action alternative will:
Protect human health and the environment;
Attain cleanup criteria;
Control the source(s) of release so as to reduce or eliminate further release of COIs; and
Comply with standards for management of wastes.
Remedial actions that meet these standards are generally consistent with the AOC.
7.1.1 Protection of Human Health and the Environment
Each alternative will be evaluated in terms of demonstrable mitigation of potential risk to public health, safety or welfare and the environment from the Site. The evaluation will include an estimation of the relative degree to which each alternative will eliminate, reduce or control potential risk. For example, in the case of source control actions, such as the upgrade of a liner, this demonstration will include construction quality assurance (CQA) documentation of liner construction. For groundwater migration management, this will include an evaluation of capture zone for hydraulic control systems and identification of potential data gaps.
25 7/29/2016 MR1149D\Remedy Evaluation Work Plan - SOEP STEP
7.1.2 Attainment of Cleanup Criteria
The manner and rate in which each alternative attains cleanup criteria (listed in Section 4.0 of this work plan) will be described. The evaluation will include the monitoring network required for each alternative. It will also evaluate whether installation of additional capture wells might accelerate the overall cleanup timeframe in a cost-effective manner.
It should be noted that Site-Specific Cleanup Criteria and a list of constituents of COPCs will be provided in the CCRA, which is anticipated completed by Ford Canty & Associates in parallel with the Remedy Evaluation. The Remedy Evaluation will be based on the MDEQ-approved BSLs, the Circular DEQ-7 values, and the draft cleanup criteria report values. Per the AOC, the MDEQ-approved BSLs serve as the Cleanup Criteria for certain COIs where the BSLs are greater than the DEQ-7 values and the risk-based concentrations.
7.1.3 Source Control
The evaluation will include an estimation of the relative degree to which each alternative will reduce or eliminate, to the extent feasible, further releases of COIs. In the case of an engineered cap or cover system, this evaluation may include CQA documentation of cap construction. In the case of groundwater capture, this evaluation may include potentiometric surface maps and evaluation of improvement in water quality at areas downgradient of the capture well capture zone, as well as the results of numerical groundwater flow modeling.
7.1.4 Compliance with Standards for Management of Wastes
The evaluation will demonstrate that the alternative is capable of complying with standards for management of wastes, which is that wastes shall be managed in a manner that complies with applicable regulatory requirements. This will be done by identifying the compliance requirements for the RAAs and demonstrating how each alternative would meet these requirements.
7.2 Detailed Evaluation Factors
The Remedy Evaluation will include a detailed comparative evaluation of each assembled RAA based on:
Performance; Reliability; Ease of implementation; Potential impacts; Time to start/complete; Cost; Permits and approvals; and Community concerns.
26 7/29/2016 MR1149D\Remedy Evaluation Work Plan - SOEP STEP
Consideration of these factors in selection of remedial actions is consistent with the requirements of the AOC.
7.2.1 Performance
The performance of each assembled remedial action alternative will be evaluated in terms of long and short-term effectiveness and protectiveness. The performance of an assembled remedial action alternative is defined by its ability to eliminate or substantially reduce the inherent potential for the wastes in the contaminated media to cause future environmental releases or other risks to human health and the environment. Changes to ponds at a result of the implementation of the Master Plan will be incorporated into the evaluation of each remedial action alternative. The evaluation will be based on consideration of the following:
i) Ability to achieve the RAOs within a reasonable period of time under the specific circumstances for the SOEP/STEP Site;
ii) Magnitude of reduction of existing risks and magnitude of residual risks in terms of likelihood of further releases;
iii) Type and degree of long-term management required, including monitoring, operation and maintenance;
iv) Short-term risks that might be posed to workers, the community or the environment during implementation, including potential threats to human health and the environment associated with construction, excavation/extraction, transportation and disposal;
v) Estimated time until RAOs, performance standards, and regulatory standards are achieved;
vi) Long-term reliability of the engineering and institutional controls; and vii) Potential need for replacement of the remedy.
Alternatives that include groundwater capture will require consideration of site specific conditions such as the uncertainty of pumping rates from the capture wells due to scaling, uncertainty in the amount of time that capture wells are off line for maintenance and repairs, and uncertainty of seepage rates from the process ponds on the reliability of the groundwater model calibration. The evaluation of groundwater capture alternatives will be based on the groundwater conceptual model developed by NewFields in the Site Report (Hydrometrics, 2016) It is also recognized that the performance of some alternatives such as the groundwater capture systems may not have been fully optimized at the SOEP/STEP Site and may be evaluated based on the USEPA guidance on Methods for Monitoring Pump-and-Treat Performance and A Systematic Approach for Evaluation of Capture Zones at Pump and Treat Systems (USEPA, 1994; 2008). As previously stated, a significant component of the remedy evaluation will include an evaluation of the current groundwater capture systems with a focus on enhancement, if appropriate. This will be done largely using the groundwater model developed by NewFields
27 7/29/2016 MR1149D\Remedy Evaluation Work Plan - SOEP STEP
in the Site Report. If deemed appropriate, a revised groundwater capture system may be considered as the preferred remedial technology, either alone or coupled with another remedial technology. 7.2.2 Reliability
The reliability criterion refers to an assembled remedial action alternative’s certainty of success in both the short- and long-term, as well as under changing environmental conditions. Inherent in its success is the ability of the assembled RAA to control the source. The evaluation of reliability will consider the following factors:
How frequently and successfully a particular RAA has been implemented at other sites with similar geology, hydrogeology and COIs conditions;
Potential impacts, if any, on immediate receptor(s) in case a technology in a RAA fails; How the technologies in the RAA will respond to environmental changes such as storm
events, earthquakes, groundwater flow changes from changes in off-site land use, etc.; The extent of long-term operation and management required after implementation; The extent to which the remedial action technology will control the source and reduce
further releases; and The extent to which remedial technologies may be used and the extent to which
treatment is reversible.
The assembled RAAs will be evaluated in terms of their overall projected useful life as well as their effectiveness in source control. A RAA that reliably meets RAOs and controls the source(s) with little long-term management may be preferred.
7.2.3 Ease of Implementation
The Remedy Evaluation will include an estimation of the relative ease or difficulty of implementing the assembled RAA. This criterion refers to the physical, technical, and administrative ease of implementing a remedial action alternative. It includes a consideration for time and resources needed to obtain necessary approvals, a consideration of how readily the remedial components are available, and a consideration of how much disturbance/interruption the remedial action alternative will cause at the site and on the surroundings. This evaluation will be based on consideration of the following:
Administrative activities required for implementation such as permits, approvals, access agreements, etc. and the time requirement for these activities;
The availability of components, equipment, and technical services, and disposal facilities, if needed;
The time and resources for construction and startup, and the ease of operation and maintenance;
28 7/29/2016 MR1149D\Remedy Evaluation Work Plan - SOEP STEP
Suitability of the spatial footprint of the remedial action alternative. In some cases, the use of a certain technology may be precluded by the site-specific terrain, buildings, roads, and underground and overhead utility lines;
Degree of difficulty associated with constructing the technology; Expected operational reliability; Need to coordinate with and obtain necessary approvals and permits from other
agencies; Availability of necessary equipment and specialists; The disturbances or concerns to the site and surrounding areas/communities; and Available capacity and location of needed treatment, storage and disposal services.
An assembled RAA that is the relatively easy to implement and sustain in order to meet RAOs and performance/regulatory standards may be preferred.
7.2.4 Potential Impacts
The potential impacts of an assembled RAA refer to unintended effects that may occur during implementation. The factors to be considered in evaluation of potential impacts of an assembled remedial action alternative include the following:
Exposure to hazardous substances; Safety measures associated with remedial action alternative construction and operation; Risk of cross-media contamination; and Risk of exposure to residual levels in environmental media in case it may not be
possible to remove all of the COIs even with the best available technologies, or exposure to treatment residuals.
Potential impacts will also be evaluated as part of the reliability criterion. An assembled RAA that has fewer potential negative impacts on the site and its surroundings while meeting RAOs and performance/regulatory standards may be preferred.
7.2.5 Time to Start/Complete
The time to start refers to the time, after MDEQ approval of the remedy, that will be required to: (1) conduct sampling to fill data gaps if required; (2) design, construct, run and analyze required treatability studies either at the benchtop or pilot scale; (3) design and construct either source control or mitigation management technologies; and (4) implement institutional controls, if applicable. The time to complete refers to the time that will be required to meet RAOs and performance/regulatory standards. All calculations of the estimated time required for each alternative to achieve Cleanup Criteria and RAOs will be documented in the Remedy Evaluation Report. The time to start and complete a remedial action alternative will be
29 7/29/2016 MR1149D\Remedy Evaluation Work Plan - SOEP STEP
evaluated as part of the ease-of-implementation criterion and also by considering the following factors:
Time required to obtain the necessary permits and approvals for RAA implementation; Ease of construction and availability of materials, resources, and technical services; and Processes such as natural attenuation of COIs that may affect estimated cleanup times.
Some RAAs may require more time to start but may achieve RAOs sooner than other RAOs. An assembled RAA that has shorter start and completion times or that provides a good balance between the start and completion times may be preferred.
7.2.6 Cost
The cost of an assembled RAA is an important distinguishing consideration, particularly when multiple RAAs provide the same level of performance and reliability, and offer equivalent protection of human health and environment. An estimate of the cost of each RAA will be developed, including both capital and operation and maintenance costs over an estimated timeframe required to achieve Cleanup Criteria. The cost of each alternative will be expressed in current US dollars. The costs may vary amongst RAAs depending on the technology(ies) included in the RAAs. The cost is not a consideration if only one RAA is evaluated or in the case where one RAA is the only one that is effective and protective. Evaluation of RAA cost will include the following components:
Cost of design, permitting and site preparation; Cost of materials, construction, and engineering; Cost operation and maintenance, and disposal of treatment residuals; Cost of sampling, monitoring, and reporting; Cost of system decommissioning; and Other miscellaneous costs such as project management, health and safety, training, etc.
An RAA that meets the RAOs and performance/regulatory standards with a lower overall cost of implementation and operation may be preferred.
7.2.7 Permits and Approvals
The anticipated permits and approvals, and applicable statutes and regulations, will be listed in the Remedy Evaluation Report and classified as federal, state or local. As discussed above in the ease-of-implementation and time-to-start criteria, the RAAs will be evaluated for the ease of obtaining necessary approvals and permits for implementation and operation. The criterion will consider the time and resources required to obtain necessary approvals and permits, and how the RAAs will comply with the listed statues and regulations. A RAA that meets the RAOs and performance/regulatory standards with fewer requirements for obtaining approvals and permits may be preferred.
30 7/29/2016 MR1149D\Remedy Evaluation Work Plan - SOEP STEP
7.2.8 Community Concerns
The evaluation will include an estimation of the relative degree to which community concerns are addressed by each RAA. An initial scoping meeting with MDEQ may provide some insight on community concerns. As provided in the AOC, MDEQ will solicit and consider public comment on the Remedy Evaluation Report. For a given RAA, the community concerns may stem from the following:
Risk of exposure to hazardous substances during construction and/or operation; Disturbances during implementation and operation such as noise, dust, odor, increased
traffic, etc; Risk of exposure to residual levels of COIs in case it may not be possible to remove all
of the COIs even with the best available technologies; Potential side effects to other environmental media; and Aesthetics and other socio-economic concerns.
In addition to the above factors, the evaluation of remedial action alternatives will consider community acceptance and opportunities for ongoing community participation. A RAA that meets the RAOs and performance/regulatory standards and is capable of achieving community acceptance may be preferred.
31 7/29/2016 MR1149D\Remedy Evaluation Work Plan - SOEP STEP
8. PREFERRED REMEDIAL ACTION ALTERNATIVE
The preferred RAA will be identified based on the results of the evaluation described in Section 7.0 of this work plan. A table or tables will be prepared summarizing: i) the advantages and disadvantages of each alternative; ii) how each alternative satisfies the RAOs, including cleanup criteria in Article IV. G. of the AOC; iii) rationale for the identification of a preferred remedy; and iv) identification of sampling or treatability studies that are needed, if any. The table or tables will include a written discussion of each alternative including the No Further Action alternative. Sampling or treatability studies recommended would be discussed in the Remedy Evaluation Report and details (and laboratory selection) of the treatability studies should be specified by the designer at the remedial design stage. Treatability studies for unproven/innovative technologies may be warranted at the remedy evaluation stage and a separate work plan would be prepared for MDEQ review in that case.
This information along with a schedule for submission of a Remedial Design/Remediation Action Work Plan will be compiled and submitted in a Remedy Evaluation Report to document this effort.
32 7/29/2016 MR1149D\Remedy Evaluation Work Plan - SOEP STEP
9. NEED FOR ADDITIONAL DATA OR TREATABILITY STUDIES
The Remedy Evaluation process will include identification of data gaps to be addressed either during remedy evaluation or during remedy design.
The Remedy Evaluation Report will also include, as necessary, identification of information regarding the need for treatability studies to support the design of the preferred remedial measure alternative. Sampling or treatability studies recommended prior to submittal of the Remedy Evaluation Report will be presented in the form of work plans for DEQ to review.
33 7/29/2016 MR1149D\Remedy Evaluation Work Plan - SOEP STEP
10. SCHEDULE AND DELIVERABLES
A preliminary schedule for completion of the work described herein and delivery of the Remedy Evaluation Report to MDEQ is December 2016, or three months after MDEQ approval of any predecessor report. The schedule for the implementation of this work plan assumes that no additional site characterization or treatability studies are needed prior to the remedial design stage.
A Remedy Evaluation Report will be prepared. The report will document the screening of technologies, assembling of RAAs, and the evaluation of RAAs, leading to the identification of a preferred alternative. The report will include the following:
1. An introduction describing the purpose and organization of the report, including reference to the extensive list of interim actions listed in the SOEP/STEP Site Report (Hydrometrics, 2016) and an identification/description of significant interim actions that may have occurred in the past 5 to 10 years and how they have addressed the RAOs.
2. Presentation and discussion of results of data that support the rationale for the remedy selection, such as groundwater modeling results, mass flux estimates and cleanup timeframe estimates (including data and estimates used) that may have been developed for the Site Report, CCRA or for the remedy evaluation itself.
3. A summary of changes to the work described in this work plan, if any.
4. A presentation and discussion of the results of the detailed alternatives analysis.
5. Figure(s) illustrating the anticipated location of elements of the preferred alternative based on the information that is available at the time of the Remedy Evaluation Report. The anticipated location may be subject to change as new information may become available from sampling or treatability studies, or during remedial design.
6. A discussion of estimated time to meet the RAOs.
Supporting information such as engineering calculations, cost estimate backup, data collected during the implementation of the Work Plan to fill data gaps, and applicable reports concerning treatability studies for potential remedy technologies evaluation will be provided in appendices.
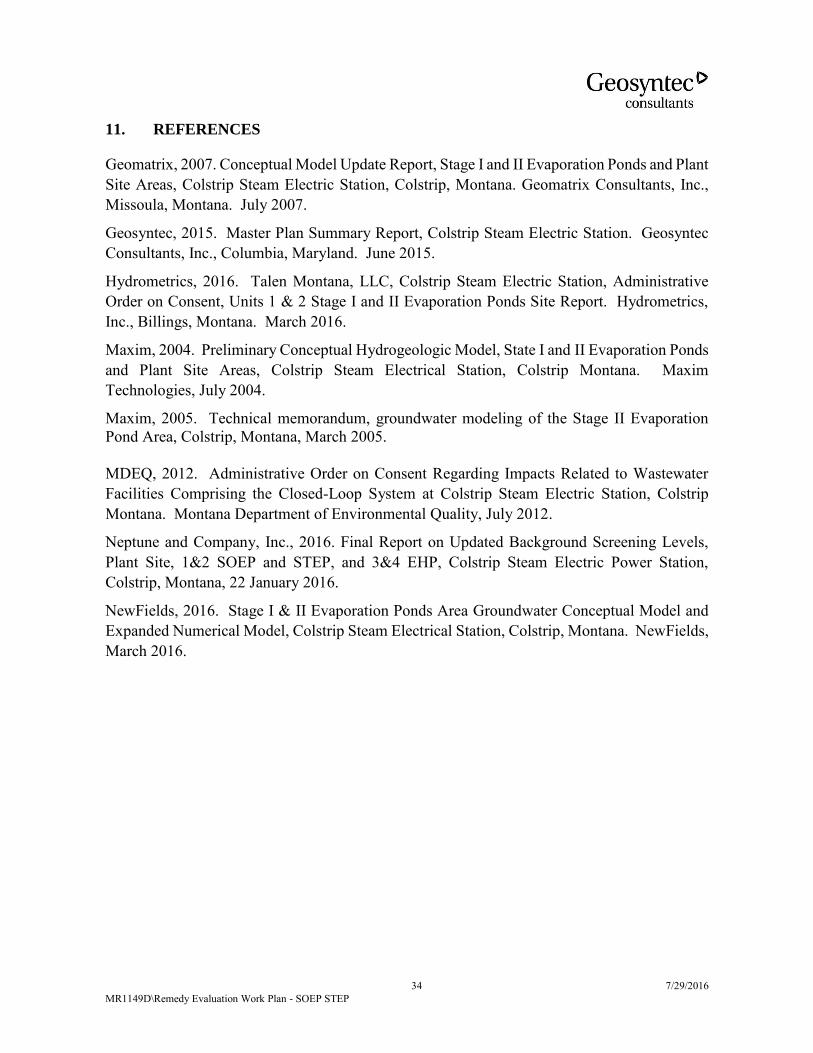
34 7/29/2016 MR1149D\Remedy Evaluation Work Plan - SOEP STEP
11. REFERENCES
Geomatrix, 2007. Conceptual Model Update Report, Stage I and II Evaporation Ponds and Plant Site Areas, Colstrip Steam Electric Station, Colstrip, Montana. Geomatrix Consultants, Inc., Missoula, Montana. July 2007.
Geosyntec, 2015. Master Plan Summary Report, Colstrip Steam Electric Station. Geosyntec Consultants, Inc., Columbia, Maryland. June 2015.
Hydrometrics, 2016. Talen Montana, LLC, Colstrip Steam Electric Station, Administrative Order on Consent, Units 1 & 2 Stage I and II Evaporation Ponds Site Report. Hydrometrics, Inc., Billings, Montana. March 2016.
Maxim, 2004. Preliminary Conceptual Hydrogeologic Model, State I and II Evaporation Ponds and Plant Site Areas, Colstrip Steam Electrical Station, Colstrip Montana. Maxim Technologies, July 2004.
Maxim, 2005. Technical memorandum, groundwater modeling of the Stage II Evaporation Pond Area, Colstrip, Montana, March 2005. MDEQ, 2012. Administrative Order on Consent Regarding Impacts Related to Wastewater Facilities Comprising the Closed-Loop System at Colstrip Steam Electric Station, Colstrip Montana. Montana Department of Environmental Quality, July 2012.
Neptune and Company, Inc., 2016. Final Report on Updated Background Screening Levels, Plant Site, 1&2 SOEP and STEP, and 3&4 EHP, Colstrip Steam Electric Power Station, Colstrip, Montana, 22 January 2016.
NewFields, 2016. Stage I & II Evaporation Ponds Area Groundwater Conceptual Model and Expanded Numerical Model, Colstrip Steam Electrical Station, Colstrip, Montana. NewFields, March 2016.

35 7/29/2016 MR1149D\Remedy Evaluation Work Plan - SOEP STEP
TABLES
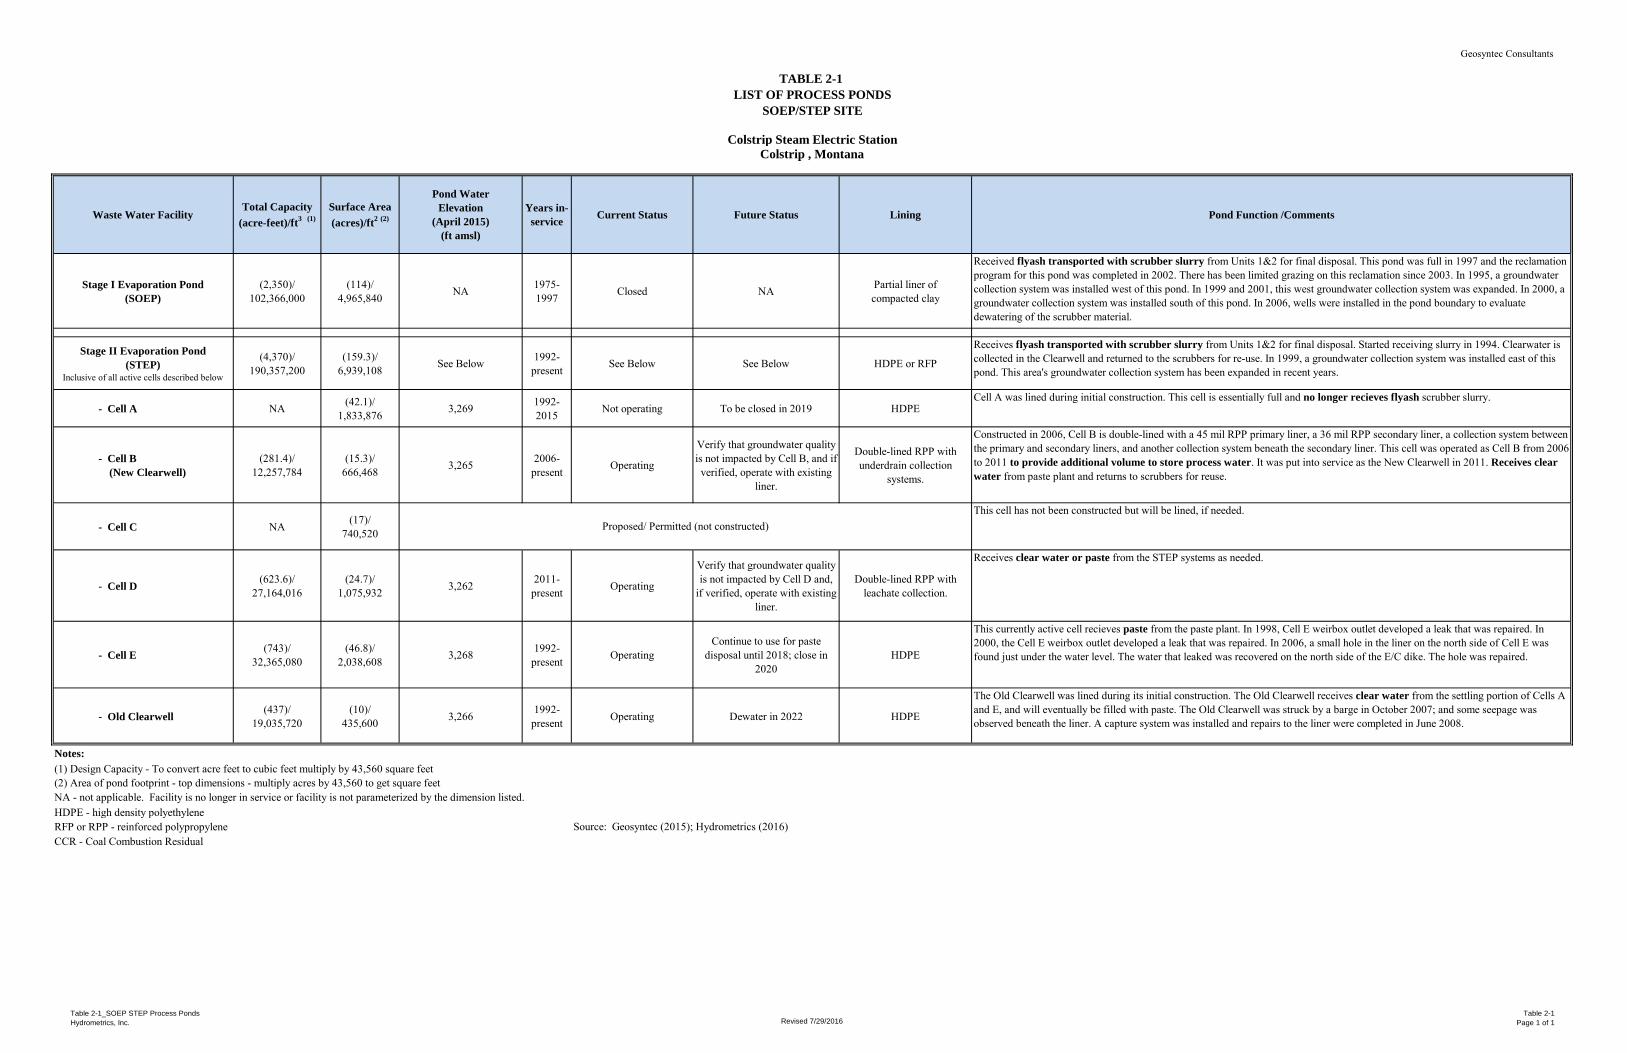
Geosyntec Consultants
Table 2-1_SOEP STEP Process Ponds
Hydrometrics, Inc. Revised 7/29/2016Table 2-1
Page 1 of 1
Waste Water FacilityTotal Capacity
(acre-feet)/ft3 (1)Surface Area (acres)/ft2 (2)
Pond WaterElevation
(April 2015)(ft amsl)
Years in-service Current Status Future Status Lining Pond Function /Comments
Stage I Evaporation Pond(SOEP)
(2,350)/102,366,000
(114)/4,965,840 NA 1975-
1997 Closed NA Partial liner of compacted clay
Received flyash transported with scrubber slurry from Units 1&2 for final disposal. This pond was full in 1997 and the reclamation program for this pond was completed in 2002. There has been limited grazing on this reclamation since 2003. In 1995, a groundwater collection system was installed west of this pond. In 1999 and 2001, this west groundwater collection system was expanded. In 2000, a groundwater collection system was installed south of this pond. In 2006, wells were installed in the pond boundary to evaluate dewatering of the scrubber material.
Stage II Evaporation Pond(STEP)
Inclusive of all active cells described below
(4,370)/190,357,200
(159.3)/6,939,108 See Below 1992-
present See Below See Below HDPE or RFP
Receives flyash transported with scrubber slurry from Units 1&2 for final disposal. Started receiving slurry in 1994. Clearwater is collected in the Clearwell and returned to the scrubbers for re-use. In 1999, a groundwater collection system was installed east of this pond. This area's groundwater collection system has been expanded in recent years.
- Cell A NA (42.1)/1,833,876 3,269 1992-
2015 Not operating To be closed in 2019 HDPECell A was lined during initial construction. This cell is essentially full and no longer recieves flyash scrubber slurry.
- Cell B (New Clearwell)
(281.4)/12,257,784
(15.3)/666,468 3,265 2006-
present Operating
Verify that groundwater quality is not impacted by Cell B, and if verified, operate with existing
liner.
Double-lined RPP withunderdrain collection
systems.
Constructed in 2006, Cell B is double-lined with a 45 mil RPP primary liner, a 36 mil RPP secondary liner, a collection system between the primary and secondary liners, and another collection system beneath the secondary liner. This cell was operated as Cell B from 2006 to 2011 to provide additional volume to store process water. It was put into service as the New Clearwell in 2011. Receives clear water from paste plant and returns to scrubbers for reuse.
- Cell C NA (17)/740,520
This cell has not been constructed but will be lined, if needed.
- Cell D (623.6)/27,164,016
(24.7)/ 1,075,932 3,262 2011-
present Operating
Verify that groundwater quality is not impacted by Cell D and,
if verified, operate with existing liner.
Double-lined RPP withleachate collection.
Receives clear water or paste from the STEP systems as needed.
- Cell E (743)/32,365,080
(46.8)/ 2,038,608 3,268 1992-
present OperatingContinue to use for paste
disposal until 2018; close in 2020
HDPE
This currently active cell recieves paste from the paste plant. In 1998, Cell E weirbox outlet developed a leak that was repaired. In 2000, the Cell E weirbox outlet developed a leak that was repaired. In 2006, a small hole in the liner on the north side of Cell E was found just under the water level. The water that leaked was recovered on the north side of the E/C dike. The hole was repaired.
- Old Clearwell (437)/19,035,720
(10)/435,600 3,266 1992-
present Operating Dewater in 2022 HDPE
The Old Clearwell was lined during its initial construction. The Old Clearwell receives clear water from the settling portion of Cells A and E, and will eventually be filled with paste. The Old Clearwell was struck by a barge in October 2007; and some seepage was observed beneath the liner. A capture system was installed and repairs to the liner were completed in June 2008.
Notes:
HDPE - high density polyethyleneRFP or RPP - reinforced polypropylene Source: Geosyntec (2015); Hydrometrics (2016)
NA - not applicable. Facility is no longer in service or facility is not parameterized by the dimension listed.
CCR - Coal Combustion Residual
(1) Design Capacity - To convert acre feet to cubic feet multiply by 43,560 square feet(2) Area of pond footprint - top dimensions - multiply acres by 43,560 to get square feet
TABLE 2-1 LIST OF PROCESS PONDS
Colstrip Steam Electric StationColstrip , Montana
Proposed/ Permitted (not constructed)
SOEP/STEP SITE
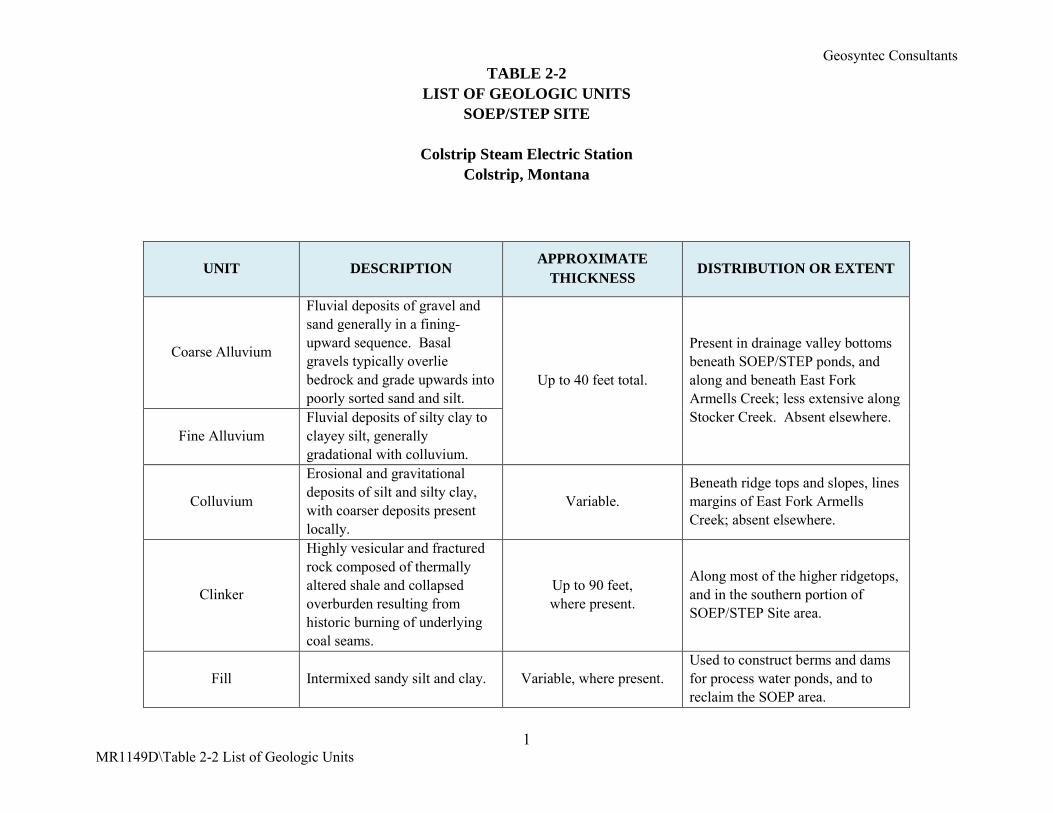
Geosyntec Consultants TABLE 2-2
LIST OF GEOLOGIC UNITS SOEP/STEP SITE
Colstrip Steam Electric Station
Colstrip, Montana
1 MR1149D\Table 2-2 List of Geologic Units
UNIT DESCRIPTION APPROXIMATE
THICKNESS DISTRIBUTION OR EXTENT
Coarse Alluvium
Fluvial deposits of gravel and sand generally in a fining-upward sequence. Basal gravels typically overlie bedrock and grade upwards into poorly sorted sand and silt.
Up to 40 feet total.
Present in drainage valley bottoms beneath SOEP/STEP ponds, and along and beneath East Fork Armells Creek; less extensive along Stocker Creek. Absent elsewhere.
Fine Alluvium Fluvial deposits of silty clay to clayey silt, generally gradational with colluvium.
Colluvium
Erosional and gravitational deposits of silt and silty clay, with coarser deposits present locally.
Variable. Beneath ridge tops and slopes, lines margins of East Fork Armells Creek; absent elsewhere.
Clinker
Highly vesicular and fractured rock composed of thermally altered shale and collapsed overburden resulting from historic burning of underlying coal seams.
Up to 90 feet, where present.
Along most of the higher ridgetops, and in the southern portion of SOEP/STEP Site area.
Fill Intermixed sandy silt and clay. Variable, where present. Used to construct berms and dams for process water ponds, and to reclaim the SOEP area.
Geosyntec Consultants TABLE 2-2
LIST OF GEOLOGIC UNITS SOEP/STEP SITE
Colstrip Steam Electric Station
Colstrip, Montana
2 MR1149D\Table 2-2 List of Geologic Units
UNIT DESCRIPTION APPROXIMATE
THICKNESS DISTRIBUTION OR EXTENT
Spoils (former Overburden)
Silt, clay, sandstone and coal fragments used to backfill areas where Rosebud Coal was mined.
0 feet. Absent in the SOEP/STEP Site Area (present west of the SOEP).
Rosebud Coal
Cleated (fractured) coal. Only coal seam that is mined. Historical burning in situ has formed Clinker in some areas.
20 to 25 feet, where present.
Absent north of the SOEP/STEP ponds due to the dip and/or fault that may exist in the drainage valley bottom. Absent in the East Fork Armells Creek and Stocker Creek valleys due to erosion.
Interburden
Siltstone and claystone with some minor fine sandstone; may be fractured. Separates Rosebud Coal and underlying McKay Coal.
10 to 20 feet, with a maximum of 50 feet.
Present south of the SOEP/STEP ponds; likely absent north of the SOEP/STEP ponds due to the dip and/or fault that may exist in the drainage valley bottom. Absent in the East Fork Armells Creek and Stocker Creek valleys due to erosion.
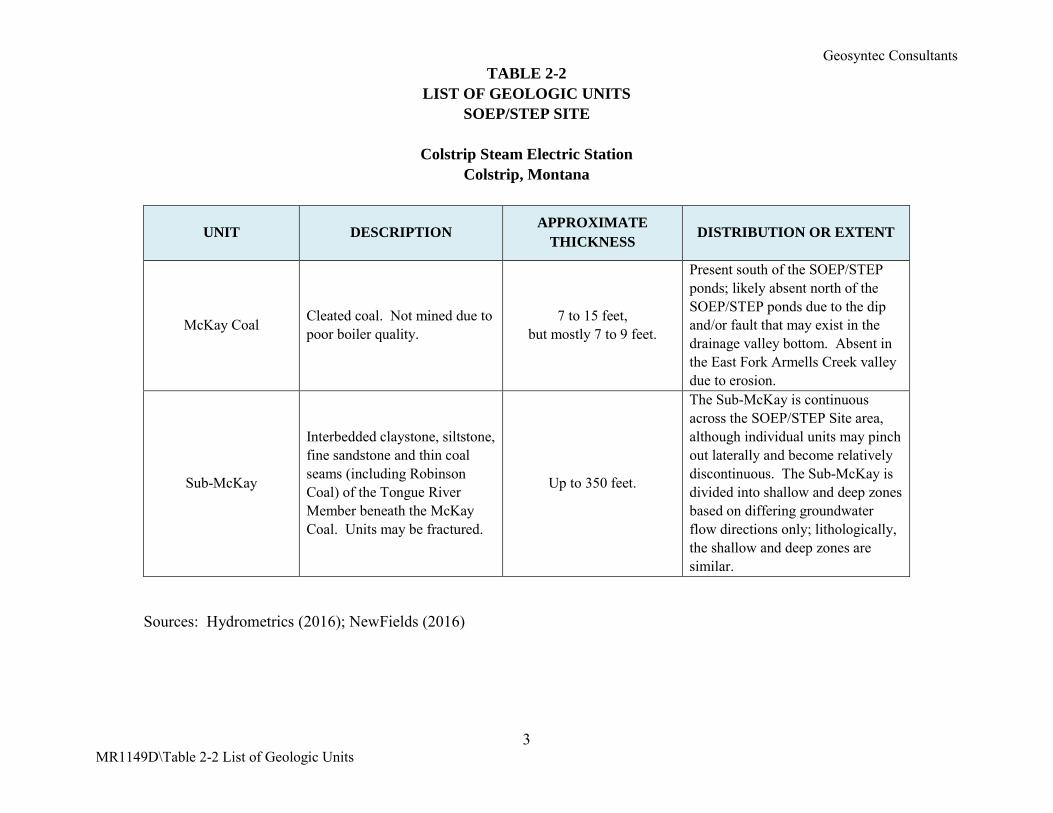
Geosyntec Consultants TABLE 2-2
LIST OF GEOLOGIC UNITS SOEP/STEP SITE
Colstrip Steam Electric Station
Colstrip, Montana
3 MR1149D\Table 2-2 List of Geologic Units
UNIT DESCRIPTION APPROXIMATE
THICKNESS DISTRIBUTION OR EXTENT
McKay Coal Cleated coal. Not mined due to poor boiler quality.
7 to 15 feet, but mostly 7 to 9 feet.
Present south of the SOEP/STEP ponds; likely absent north of the SOEP/STEP ponds due to the dip and/or fault that may exist in the drainage valley bottom. Absent in the East Fork Armells Creek valley due to erosion.
Sub-McKay
Interbedded claystone, siltstone, fine sandstone and thin coal seams (including Robinson Coal) of the Tongue River Member beneath the McKay Coal. Units may be fractured.
Up to 350 feet.
The Sub-McKay is continuous across the SOEP/STEP Site area, although individual units may pinch out laterally and become relatively discontinuous. The Sub-McKay is divided into shallow and deep zones based on differing groundwater flow directions only; lithologically, the shallow and deep zones are similar.
Sources: Hydrometrics (2016); NewFields (2016)
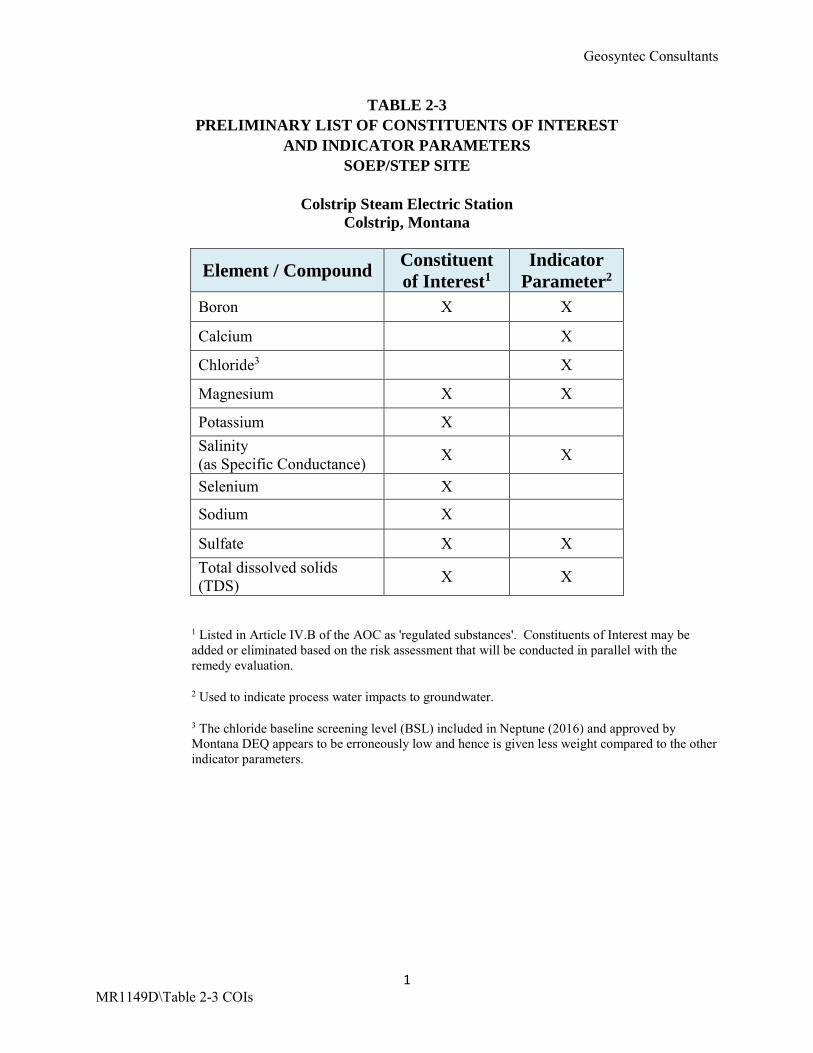
Geosyntec Consultants
1 MR1149D\Table 2-3 COIs
TABLE 2-3 PRELIMINARY LIST OF CONSTITUENTS OF INTEREST
AND INDICATOR PARAMETERS SOEP/STEP SITE
Colstrip Steam Electric Station
Colstrip, Montana
1 Listed in Article IV.B of the AOC as 'regulated substances'. Constituents of Interest may be added or eliminated based on the risk assessment that will be conducted in parallel with the remedy evaluation. 2 Used to indicate process water impacts to groundwater. 3 The chloride baseline screening level (BSL) included in Neptune (2016) and approved by Montana DEQ appears to be erroneously low and hence is given less weight compared to the other indicator parameters.
Element / Compound Constituent of Interest1
Indicator Parameter2
Boron X X
Calcium X
Chloride3 X
Magnesium X X
Potassium X Salinity (as Specific Conductance) X X
Selenium X
Sodium X
Sulfate X X Total dissolved solids (TDS) X X
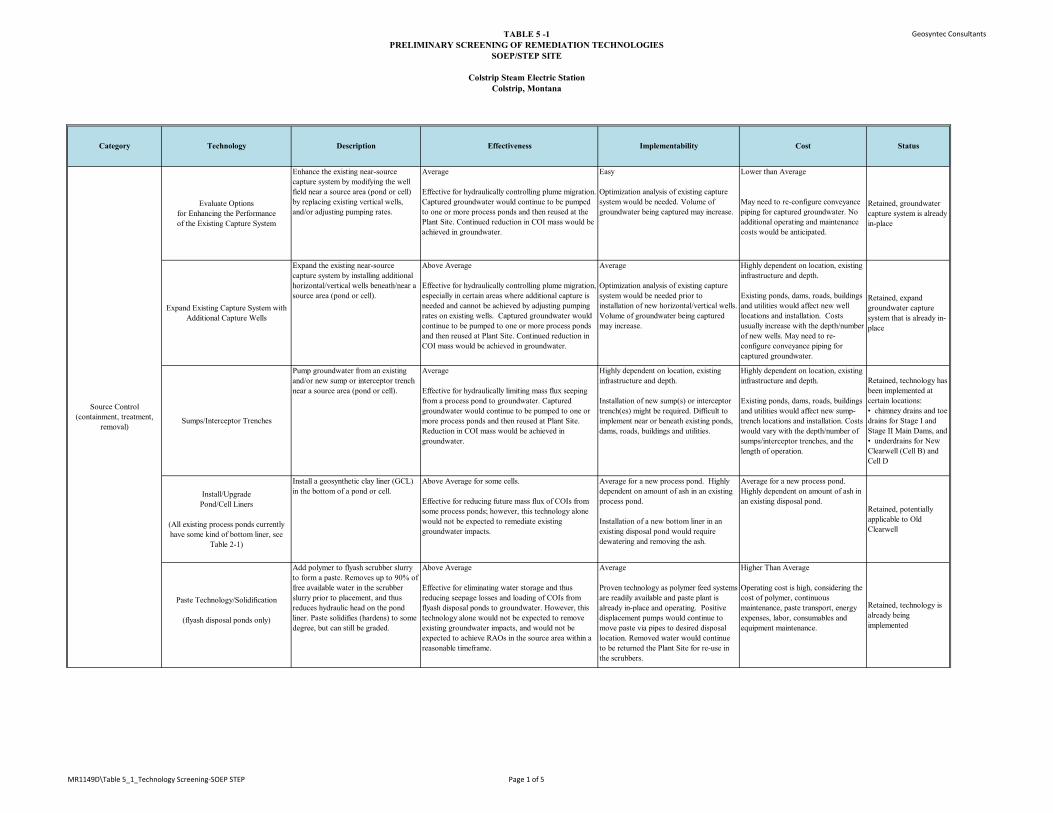
TABLE 5 -1 PRELIMINARY SCREENING OF REMEDIATION TECHNOLOGIES
SOEP/STEP SITE
Colstrip Steam Electric StationColstrip, Montana
Geosyntec Consultants
Evaluate Optionsfor Enhancing the Performanceof the Existing Capture System
Enhance the existing near-source capture system by modifying the well field near a source area (pond or cell) by replacing existing vertical wells, and/or adjusting pumping rates.
Average
Effective for hydraulically controlling plume migration. Captured groundwater would continue to be pumped to one or more process ponds and then reused at the Plant Site. Continued reduction in COI mass would be achieved in groundwater.
Easy
Optimization analysis of existing capture system would be needed. Volume of groundwater being captured may increase.
Lower than Average
May need to re-configure conveyance piping for captured groundwater. No additional operating and maintenance costs would be anticipated.
Retained, groundwater capture system is already in-place
Expand Existing Capture System with Additional Capture Wells
Expand the existing near-source capture system by installing additional horizontal/vertical wells beneath/near a source area (pond or cell).
Above Average
Effective for hydraulically controlling plume migration, especially in certain areas where additional capture is needed and cannot be achieved by adjusting pumping rates on existing wells. Captured groundwater would continue to be pumped to one or more process ponds and then reused at Plant Site. Continued reduction in COI mass would be achieved in groundwater.
Average
Optimization analysis of existing capture system would be needed prior to installation of new horizontal/vertical wells. Volume of groundwater being captured may increase.
Highly dependent on location, existing infrastructure and depth.
Existing ponds, dams, roads, buildings and utilities would affect new well locations and installation. Costs usually increase with the depth/number of new wells. May need to re-configure conveyance piping for captured groundwater.
Retained, expand groundwater capture system that is already in-place
Sumps/Interceptor Trenches
Pump groundwater from an existing and/or new sump or interceptor trench near a source area (pond or cell).
Average
Effective for hydraulically limiting mass flux seeping from a process pond to groundwater. Captured groundwater would continue to be pumped to one or more process ponds and then reused at Plant Site. Reduction in COI mass would be achieved in groundwater.
Highly dependent on location, existing infrastructure and depth.
Installation of new sump(s) or interceptor trench(es) might be required. Difficult to implement near or beneath existing ponds, dams, roads, buildings and utilities.
Highly dependent on location, existing infrastructure and depth.
Existing ponds, dams, roads, buildings and utilities would affect new sump-trench locations and installation. Costs would vary with the depth/number of sumps/interceptor trenches, and the length of operation.
Retained, technology has been implemented at certain locations:• chimney drains and toe drains for Stage I and Stage II Main Dams, and• underdrains for New Clearwell (Cell B) and Cell D
Install/UpgradePond/Cell Liners
(All existing process ponds currently have some kind of bottom liner, see
Table 2-1)
Install a geosynthetic clay liner (GCL) in the bottom of a pond or cell.
Above Average for some cells.
Effective for reducing future mass flux of COIs from some process ponds; however, this technology alone would not be expected to remediate existing groundwater impacts.
Average for a new process pond. Highly dependent on amount of ash in an existing process pond.
Installation of a new bottom liner in an existing disposal pond would require dewatering and removing the ash.
Average for a new process pond. Highly dependent on amount of ash in an existing disposal pond.
Retained, potentially applicable to Old Clearwell
Paste Technology/Solidification
(flyash disposal ponds only)
Add polymer to flyash scrubber slurry to form a paste. Removes up to 90% of free available water in the scrubber slurry prior to placement, and thus reduces hydraulic head on the pond liner. Paste solidifies (hardens) to some degree, but can still be graded.
Above Average
Effective for eliminating water storage and thus reducing seepage losses and loading of COIs from flyash disposal ponds to groundwater. However, this technology alone would not be expected to remove existing groundwater impacts, and would not be expected to achieve RAOs in the source area within a reasonable timeframe.
Average
Proven technology as polymer feed systems are readily available and paste plant is already in-place and operating. Positive displacement pumps would continue to move paste via pipes to desired disposal location. Removed water would continue to be returned the Plant Site for re-use in the scrubbers.
Higher Than Average
Operating cost is high, considering the cost of polymer, continuous maintenance, paste transport, energy expenses, labor, consumables and equipment maintenance.
Retained, technology is already being implemented
StatusCategory Technology Description Effectiveness Implementability Cost
Source Control(containment, treatment,
removal)
MR1149D\Table 5_1_Technology Screening-SOEP STEP Page 1 of 5
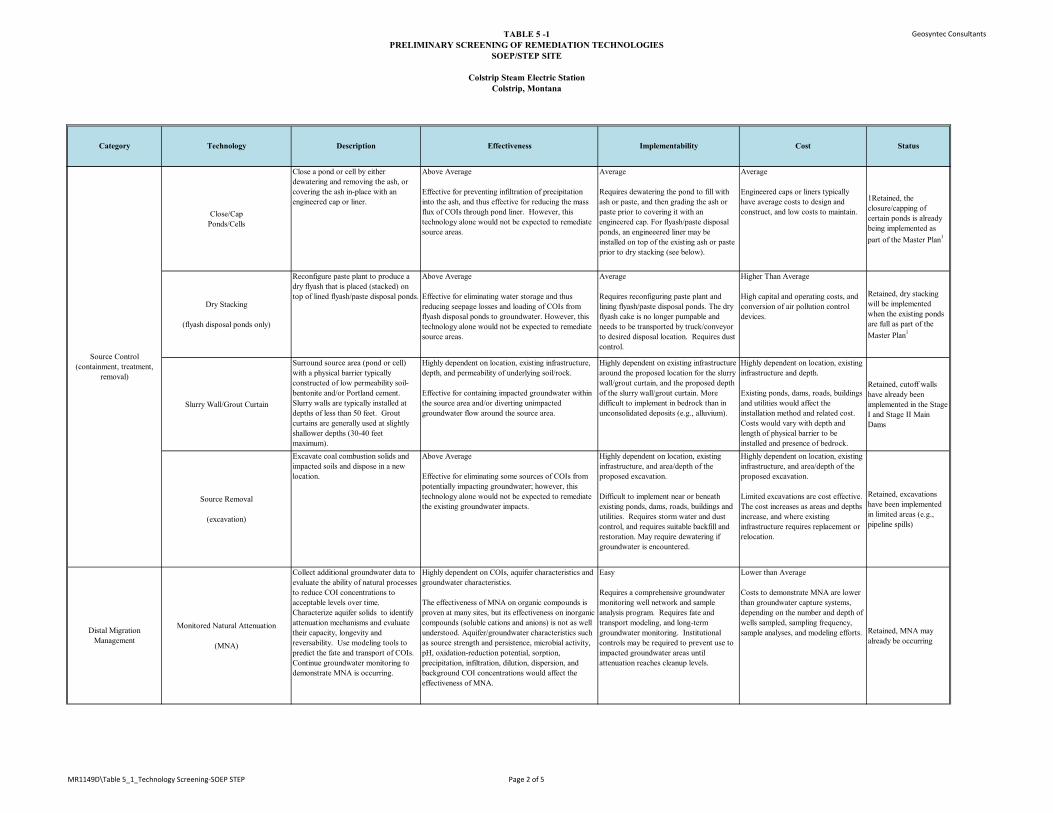
TABLE 5 -1 PRELIMINARY SCREENING OF REMEDIATION TECHNOLOGIES
SOEP/STEP SITE
Colstrip Steam Electric StationColstrip, Montana
Geosyntec Consultants
StatusCategory Technology Description Effectiveness Implementability Cost
Close/CapPonds/Cells
Close a pond or cell by either dewatering and removing the ash, or covering the ash in-place with an engineered cap or liner.
Above Average
Effective for preventing infiltration of precipitation into the ash, and thus effective for reducing the mass flux of COIs through pond liner. However, this technology alone would not be expected to remediate source areas.
Average
Requires dewatering the pond to fill with ash or paste, and then grading the ash or paste prior to covering it with an engineered cap. For flyash/paste disposal ponds, an engineeered liner may be installed on top of the existing ash or paste prior to dry stacking (see below).
Average
Engineered caps or liners typically have average costs to design and construct, and low costs to maintain.
1Retained, the closure/capping of certain ponds is already being implemented as part of the Master Plan1
Dry Stacking
(flyash disposal ponds only)
Reconfigure paste plant to produce a dry flyash that is placed (stacked) on top of lined flyash/paste disposal ponds.
Above Average
Effective for eliminating water storage and thus reducing seepage losses and loading of COIs from flyash disposal ponds to groundwater. However, this technology alone would not be expected to remediate source areas.
Average
Requires reconfiguring paste plant and lining flyash/paste disposal ponds. The dry flyash cake is no longer pumpable and needs to be transported by truck/conveyor to desired disposal location. Requires dust control.
Higher Than Average
High capital and operating costs, and conversion of air pollution control devices.
Retained, dry stacking will be implemented when the existing ponds are full as part of the Master Plan1
Slurry Wall/Grout Curtain
Surround source area (pond or cell) with a physical barrier typically constructed of low permeability soil-bentonite and/or Portland cement. Slurry walls are typically installed at depths of less than 50 feet. Grout curtains are generally used at slightly shallower depths (30-40 feet maximum).
Highly dependent on location, existing infrastructure, depth, and permeability of underlying soil/rock.
Effective for containing impacted groundwater within the source area and/or diverting unimpacted groundwater flow around the source area.
Highly dependent on existing infrastructure around the proposed location for the slurry wall/grout curtain, and the proposed depth of the slurry wall/grout curtain. More difficult to implement in bedrock than in unconsolidated deposits (e.g., alluvium).
Highly dependent on location, existing infrastructure and depth.
Existing ponds, dams, roads, buildings and utilities would affect the installation method and related cost. Costs would vary with depth and length of physical barrier to be installed and presence of bedrock.
Retained, cutoff walls have already been implemented in the Stage I and Stage II Main Dams
Source Removal
(excavation)
Excavate coal combustion solids and impacted soils and dispose in a new location.
Above Average
Effective for eliminating some sources of COIs from potentially impacting groundwater; however, this technology alone would not be expected to remediate the existing groundwater impacts.
Highly dependent on location, existing infrastructure, and area/depth of the proposed excavation.
Difficult to implement near or beneath existing ponds, dams, roads, buildings and utilities. Requires storm water and dust control, and requires suitable backfill and restoration. May require dewatering if groundwater is encountered.
Highly dependent on location, existing infrastructure, and area/depth of the proposed excavation.
Limited excavations are cost effective. The cost increases as areas and depths increase, and where existing infrastructure requires replacement or relocation.
Retained, excavations have been implemented in limited areas (e.g., pipeline spills)
Monitored Natural Attenuation
(MNA)
Collect additional groundwater data to evaluate the ability of natural processes to reduce COI concentrations to acceptable levels over time. Characterize aquifer solids to identify attenuation mechanisms and evaluate their capacity, longevity and reversability. Use modeling tools to predict the fate and transport of COIs. Continue groundwater monitoring to demonstrate MNA is occurring.
Highly dependent on COIs, aquifer characteristics and groundwater characteristics.
The effectiveness of MNA on organic compounds is proven at many sites, but its effectiveness on inorganic compounds (soluble cations and anions) is not as well understood. Aquifer/groundwater characteristics such as source strength and persistence, microbial activity, pH, oxidation-reduction potential, sorption, precipitation, infiltration, dilution, dispersion, and background COI concentrations would affect the effectiveness of MNA.
Easy
Requires a comprehensive groundwater monitoring well network and sample analysis program. Requires fate and transport modeling, and long-term groundwater monitoring. Institutional controls may be required to prevent use to impacted groundwater areas until attenuation reaches cleanup levels.
Lower than Average
Costs to demonstrate MNA are lower than groundwater capture systems, depending on the number and depth of wells sampled, sampling frequency, sample analyses, and modeling efforts. Retained, MNA may
already be occurringDistal Migration
Management
Source Control(containment, treatment,
removal)
MR1149D\Table 5_1_Technology Screening-SOEP STEP Page 2 of 5
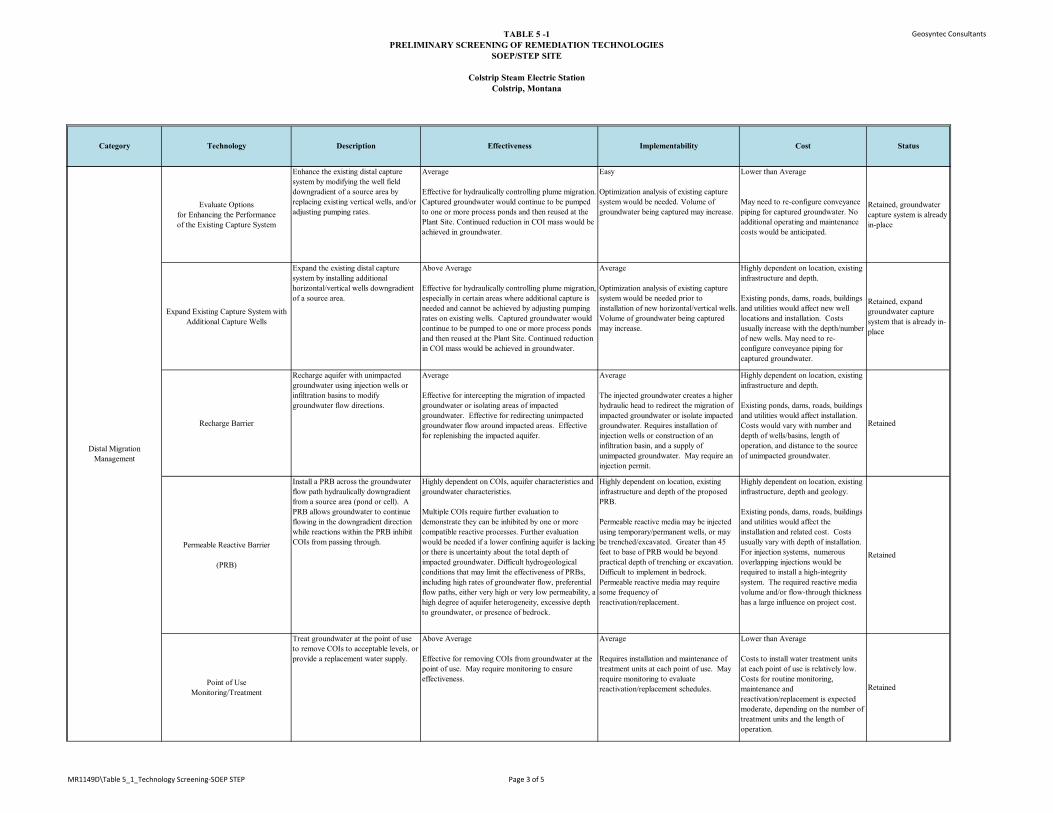
TABLE 5 -1 PRELIMINARY SCREENING OF REMEDIATION TECHNOLOGIES
SOEP/STEP SITE
Colstrip Steam Electric StationColstrip, Montana
Geosyntec Consultants
StatusCategory Technology Description Effectiveness Implementability Cost
Evaluate Optionsfor Enhancing the Performanceof the Existing Capture System
Enhance the existing distal capture system by modifying the well field downgradient of a source area by replacing existing vertical wells, and/or adjusting pumping rates.
Average
Effective for hydraulically controlling plume migration. Captured groundwater would continue to be pumped to one or more process ponds and then reused at the Plant Site. Continued reduction in COI mass would be achieved in groundwater.
Easy
Optimization analysis of existing capture system would be needed. Volume of groundwater being captured may increase.
Lower than Average
May need to re-configure conveyance piping for captured groundwater. No additional operating and maintenance costs would be anticipated.
Retained, groundwater capture system is already in-place
Expand Existing Capture System with Additional Capture Wells
Expand the existing distal capture system by installing additional horizontal/vertical wells downgradient of a source area.
Above Average
Effective for hydraulically controlling plume migration, especially in certain areas where additional capture is needed and cannot be achieved by adjusting pumping rates on existing wells. Captured groundwater would continue to be pumped to one or more process ponds and then reused at the Plant Site. Continued reduction in COI mass would be achieved in groundwater.
Average
Optimization analysis of existing capture system would be needed prior to installation of new horizontal/vertical wells. Volume of groundwater being captured may increase.
Highly dependent on location, existing infrastructure and depth.
Existing ponds, dams, roads, buildings and utilities would affect new well locations and installation. Costs usually increase with the depth/number of new wells. May need to re-configure conveyance piping for captured groundwater.
Retained, expand groundwater capture system that is already in-place
Recharge Barrier
Recharge aquifer with unimpacted groundwater using injection wells or infiltration basins to modify groundwater flow directions.
Average
Effective for intercepting the migration of impacted groundwater or isolating areas of impacted groundwater. Effective for redirecting unimpacted groundwater flow around impacted areas. Effective for replenishing the impacted aquifer.
Average
The injected groundwater creates a higher hydraulic head to redirect the migration of impacted groundwater or isolate impacted groundwater. Requires installation of injection wells or construction of an infiltration basin, and a supply of unimpacted groundwater. May require an injection permit.
Highly dependent on location, existing infrastructure and depth.
Existing ponds, dams, roads, buildings and utilities would affect installation. Costs would vary with number and depth of wells/basins, length of operation, and distance to the source of unimpacted groundwater.
Retained
Permeable Reactive Barrier
(PRB)
Install a PRB across the groundwater flow path hydraulically downgradient from a source area (pond or cell). A PRB allows groundwater to continue flowing in the downgradient direction while reactions within the PRB inhibit COIs from passing through.
Highly dependent on COIs, aquifer characteristics and groundwater characteristics.
Multiple COIs require further evaluation to demonstrate they can be inhibited by one or more compatible reactive processes. Further evaluation would be needed if a lower confining aquifer is lacking or there is uncertainty about the total depth of impacted groundwater. Difficult hydrogeological conditions that may limit the effectiveness of PRBs, including high rates of groundwater flow, preferential flow paths, either very high or very low permeability, a high degree of aquifer heterogeneity, excessive depth to groundwater, or presence of bedrock.
Highly dependent on location, existing infrastructure and depth of the proposed PRB.
Permeable reactive media may be injected using temporary/permanent wells, or may be trenched/excavated. Greater than 45 feet to base of PRB would be beyond practical depth of trenching or excavation. Difficult to implement in bedrock. Permeable reactive media may require some frequency of reactivation/replacement.
Highly dependent on location, existing infrastructure, depth and geology.
Existing ponds, dams, roads, buildings and utilities would affect the installation and related cost. Costs usually vary with depth of installation. For injection systems, numerous overlapping injections would be required to install a high-integrity system. The required reactive media volume and/or flow-through thickness has a large influence on project cost.
Retained
Point of UseMonitoring/Treatment
Treat groundwater at the point of use to remove COIs to acceptable levels, or provide a replacement water supply.
Above Average
Effective for removing COIs from groundwater at the point of use. May require monitoring to ensure effectiveness.
Average
Requires installation and maintenance of treatment units at each point of use. May require monitoring to evaluate reactivation/replacement schedules.
Lower than Average
Costs to install water treatment units at each point of use is relatively low. Costs for routine monitoring, maintenance and reactivation/replacement is expected moderate, depending on the number of treatment units and the length of operation.
Retained
Distal Migration Management
MR1149D\Table 5_1_Technology Screening-SOEP STEP Page 3 of 5
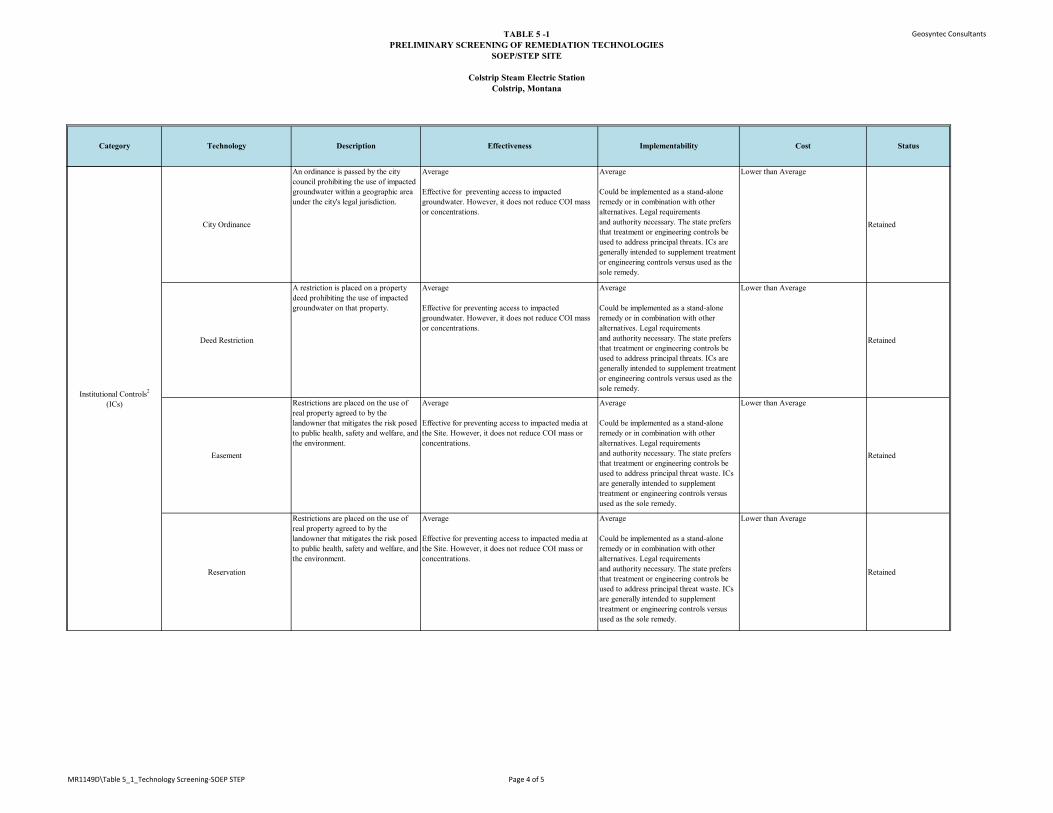
TABLE 5 -1 PRELIMINARY SCREENING OF REMEDIATION TECHNOLOGIES
SOEP/STEP SITE
Colstrip Steam Electric StationColstrip, Montana
Geosyntec Consultants
StatusCategory Technology Description Effectiveness Implementability Cost
City Ordinance
An ordinance is passed by the city council prohibiting the use of impacted groundwater within a geographic area under the city's legal jurisdiction.
Average
Effective for preventing access to impacted groundwater. However, it does not reduce COI mass or concentrations.
Average
Could be implemented as a stand-alone remedy or in combination with other alternatives. Legal requirementsand authority necessary. The state prefers that treatment or engineering controls be used to address principal threats. ICs are generally intended to supplement treatment or engineering controls versus used as the sole remedy.
Lower than Average
Retained
Deed Restriction
A restriction is placed on a property deed prohibiting the use of impacted groundwater on that property.
Average
Effective for preventing access to impacted groundwater. However, it does not reduce COI mass or concentrations.
Average
Could be implemented as a stand-alone remedy or in combination with other alternatives. Legal requirementsand authority necessary. The state prefers that treatment or engineering controls be used to address principal threats. ICs are generally intended to supplement treatment or engineering controls versus used as the sole remedy.
Lower than Average
Retained
Easement
Restrictions are placed on the use of real property agreed to by the landowner that mitigates the risk posed to public health, safety and welfare, and the environment.
Average
Effective for preventing access to impacted media at the Site. However, it does not reduce COI mass or concentrations.
Average
Could be implemented as a stand-alone remedy or in combination with other alternatives. Legal requirementsand authority necessary. The state prefers that treatment or engineering controls be used to address principal threat waste. ICs are generally intended to supplement treatment or engineering controls versus used as the sole remedy.
Lower than Average
Retained
Reservation
Restrictions are placed on the use of real property agreed to by the landowner that mitigates the risk posed to public health, safety and welfare, and the environment.
Average
Effective for preventing access to impacted media at the Site. However, it does not reduce COI mass or concentrations.
Average
Could be implemented as a stand-alone remedy or in combination with other alternatives. Legal requirementsand authority necessary. The state prefers that treatment or engineering controls be used to address principal threat waste. ICs are generally intended to supplement treatment or engineering controls versus used as the sole remedy.
Lower than Average
Retained
Institutional Controls2
(ICs)
MR1149D\Table 5_1_Technology Screening-SOEP STEP Page 4 of 5
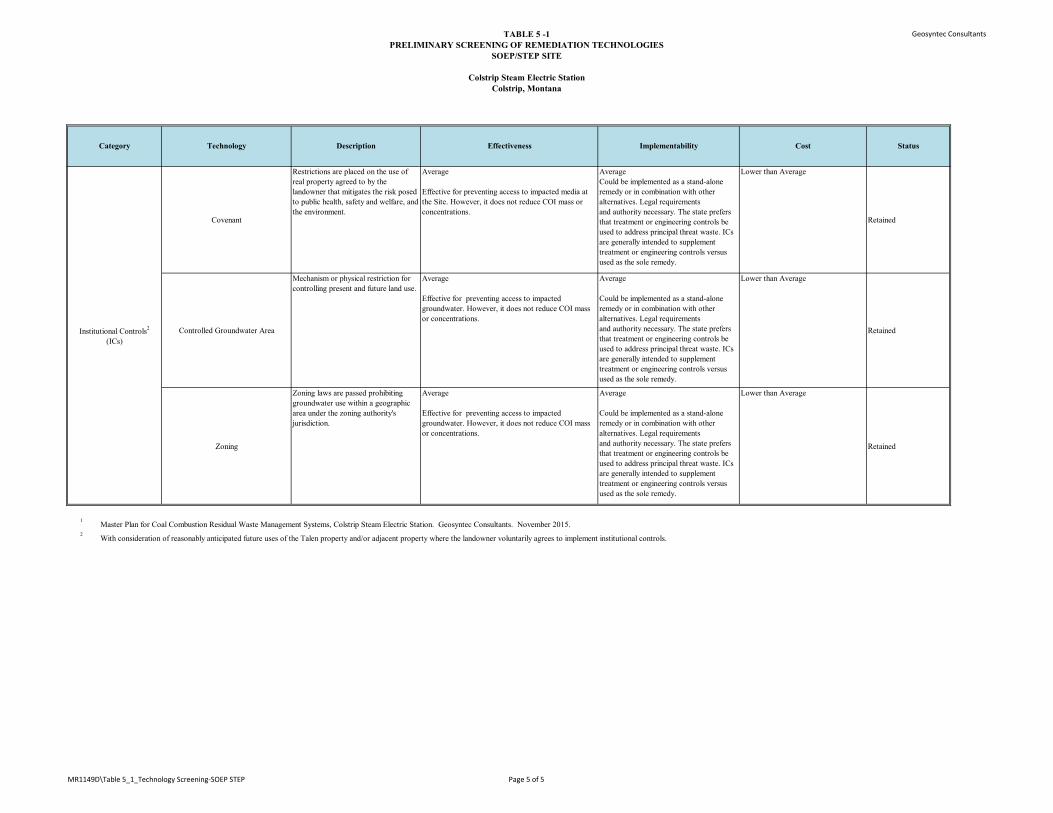
TABLE 5 -1 PRELIMINARY SCREENING OF REMEDIATION TECHNOLOGIES
SOEP/STEP SITE
Colstrip Steam Electric StationColstrip, Montana
Geosyntec Consultants
StatusCategory Technology Description Effectiveness Implementability Cost
Covenant
Restrictions are placed on the use of real property agreed to by the landowner that mitigates the risk posed to public health, safety and welfare, and the environment.
Average
Effective for preventing access to impacted media at the Site. However, it does not reduce COI mass or concentrations.
AverageCould be implemented as a stand-alone remedy or in combination with other alternatives. Legal requirementsand authority necessary. The state prefers that treatment or engineering controls be used to address principal threat waste. ICs are generally intended to supplement treatment or engineering controls versus used as the sole remedy.
Lower than Average
Retained
Controlled Groundwater Area
Mechanism or physical restriction for controlling present and future land use.
Average
Effective for preventing access to impacted groundwater. However, it does not reduce COI mass or concentrations.
Average
Could be implemented as a stand-alone remedy or in combination with other alternatives. Legal requirementsand authority necessary. The state prefers that treatment or engineering controls be used to address principal threat waste. ICs are generally intended to supplement treatment or engineering controls versus used as the sole remedy.
Lower than Average
Retained
Zoning
Zoning laws are passed prohibiting groundwater use within a geographic area under the zoning authority's jurisdiction.
Average
Effective for preventing access to impacted groundwater. However, it does not reduce COI mass or concentrations.
Average
Could be implemented as a stand-alone remedy or in combination with other alternatives. Legal requirementsand authority necessary. The state prefers that treatment or engineering controls be used to address principal threat waste. ICs are generally intended to supplement treatment or engineering controls versus used as the sole remedy.
Lower than Average
Retained
1 Master Plan for Coal Combustion Residual Waste Management Systems, Colstrip Steam Electric Station. Geosyntec Consultants. November 2015.2 With consideration of reasonably anticipated future uses of the Talen property and/or adjacent property where the landowner voluntarily agrees to implement institutional controls.
Institutional Controls2
(ICs)
MR1149D\Table 5_1_Technology Screening-SOEP STEP Page 5 of 5
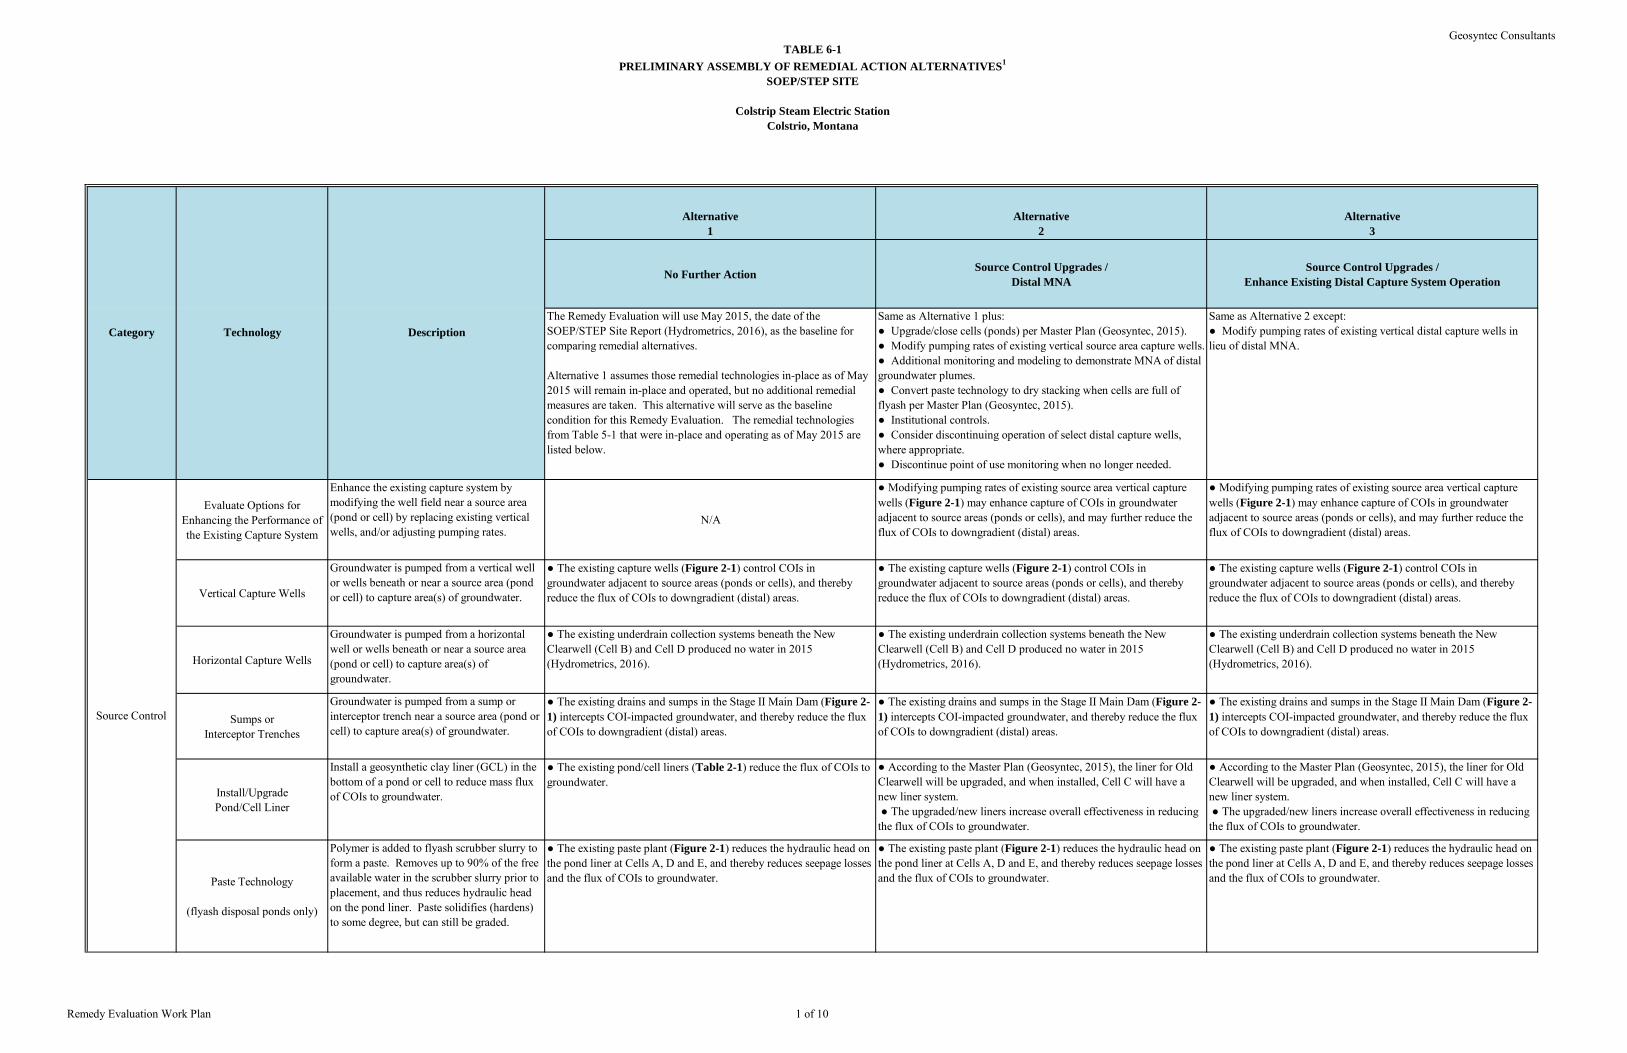
TABLE 6-1PRELIMINARY ASSEMBLY OF REMEDIAL ACTION ALTERNATIVES1
SOEP/STEP SITE
Colstrip Steam Electric StationColstrio, Montana
Geosyntec Consultants
Remedy Evaluation Work Plan 1 of 10
Alternative 1
Alternative 2
Alternative 3
No Further Action Source Control Upgrades / Distal MNA
Source Control Upgrades /Enhance Existing Distal Capture System Operation
The Remedy Evaluation will use May 2015, the date of the SOEP/STEP Site Report (Hydrometrics, 2016), as the baseline for comparing remedial alternatives.
Alternative 1 assumes those remedial technologies in-place as of May 2015 will remain in-place and operated, but no additional remedial measures are taken. This alternative will serve as the baseline condition for this Remedy Evaluation. The remedial technologies from Table 5-1 that were in-place and operating as of May 2015 are listed below.
Same as Alternative 1 plus:● Upgrade/close cells (ponds) per Master Plan (Geosyntec, 2015).● Modify pumping rates of existing vertical source area capture wells.● Additional monitoring and modeling to demonstrate MNA of distal groundwater plumes.● Convert paste technology to dry stacking when cells are full of flyash per Master Plan (Geosyntec, 2015). ● Institutional controls.● Consider discontinuing operation of select distal capture wells, where appropriate.● Discontinue point of use monitoring when no longer needed.
Same as Alternative 2 except:● Modify pumping rates of existing vertical distal capture wells in lieu of distal MNA.
Evaluate Options for Enhancing the Performance of the Existing Capture System
Enhance the existing capture system by modifying the well field near a source area (pond or cell) by replacing existing vertical wells, and/or adjusting pumping rates.
N/A
● Modifying pumping rates of existing source area vertical capture wells (Figure 2-1) may enhance capture of COIs in groundwater adjacent to source areas (ponds or cells), and may further reduce the flux of COIs to downgradient (distal) areas.
● Modifying pumping rates of existing source area vertical capture wells (Figure 2-1) may enhance capture of COIs in groundwater adjacent to source areas (ponds or cells), and may further reduce the flux of COIs to downgradient (distal) areas.
Vertical Capture Wells
Groundwater is pumped from a vertical well or wells beneath or near a source area (pond or cell) to capture area(s) of groundwater.
● The existing capture wells (Figure 2-1) control COIs in groundwater adjacent to source areas (ponds or cells), and thereby reduce the flux of COIs to downgradient (distal) areas.
● The existing capture wells (Figure 2-1) control COIs in groundwater adjacent to source areas (ponds or cells), and thereby reduce the flux of COIs to downgradient (distal) areas.
● The existing capture wells (Figure 2-1) control COIs in groundwater adjacent to source areas (ponds or cells), and thereby reduce the flux of COIs to downgradient (distal) areas.
Horizontal Capture Wells
Groundwater is pumped from a horizontal well or wells beneath or near a source area (pond or cell) to capture area(s) of groundwater.
● The existing underdrain collection systems beneath the New Clearwell (Cell B) and Cell D produced no water in 2015(Hydrometrics, 2016).
● The existing underdrain collection systems beneath the New Clearwell (Cell B) and Cell D produced no water in 2015(Hydrometrics, 2016).
● The existing underdrain collection systems beneath the New Clearwell (Cell B) and Cell D produced no water in 2015(Hydrometrics, 2016).
Sumps or Interceptor Trenches
Groundwater is pumped from a sump or interceptor trench near a source area (pond or cell) to capture area(s) of groundwater.
● The existing drains and sumps in the Stage II Main Dam (Figure 2-1) intercepts COI-impacted groundwater, and thereby reduce the flux of COIs to downgradient (distal) areas.
● The existing drains and sumps in the Stage II Main Dam (Figure 2-1) intercepts COI-impacted groundwater, and thereby reduce the flux of COIs to downgradient (distal) areas.
● The existing drains and sumps in the Stage II Main Dam (Figure 2-1) intercepts COI-impacted groundwater, and thereby reduce the flux of COIs to downgradient (distal) areas.
Install/UpgradePond/Cell Liner
Install a geosynthetic clay liner (GCL) in the bottom of a pond or cell to reduce mass flux of COIs to groundwater.
● The existing pond/cell liners (Table 2-1) reduce the flux of COIs to groundwater.
● According to the Master Plan (Geosyntec, 2015), the liner for Old Clearwell will be upgraded, and when installed, Cell C will have a new liner system. ● The upgraded/new liners increase overall effectiveness in reducing the flux of COIs to groundwater.
● According to the Master Plan (Geosyntec, 2015), the liner for Old Clearwell will be upgraded, and when installed, Cell C will have a new liner system. ● The upgraded/new liners increase overall effectiveness in reducing the flux of COIs to groundwater.
Paste Technology
(flyash disposal ponds only)
Polymer is added to flyash scrubber slurry to form a paste. Removes up to 90% of the free available water in the scrubber slurry prior to placement, and thus reduces hydraulic head on the pond liner. Paste solidifies (hardens) to some degree, but can still be graded.
● The existing paste plant (Figure 2-1) reduces the hydraulic head on the pond liner at Cells A, D and E, and thereby reduces seepage losses and the flux of COIs to groundwater.
● The existing paste plant (Figure 2-1) reduces the hydraulic head on the pond liner at Cells A, D and E, and thereby reduces seepage losses and the flux of COIs to groundwater.
● The existing paste plant (Figure 2-1) reduces the hydraulic head on the pond liner at Cells A, D and E, and thereby reduces seepage losses and the flux of COIs to groundwater.
Category Technology Description
Source Control
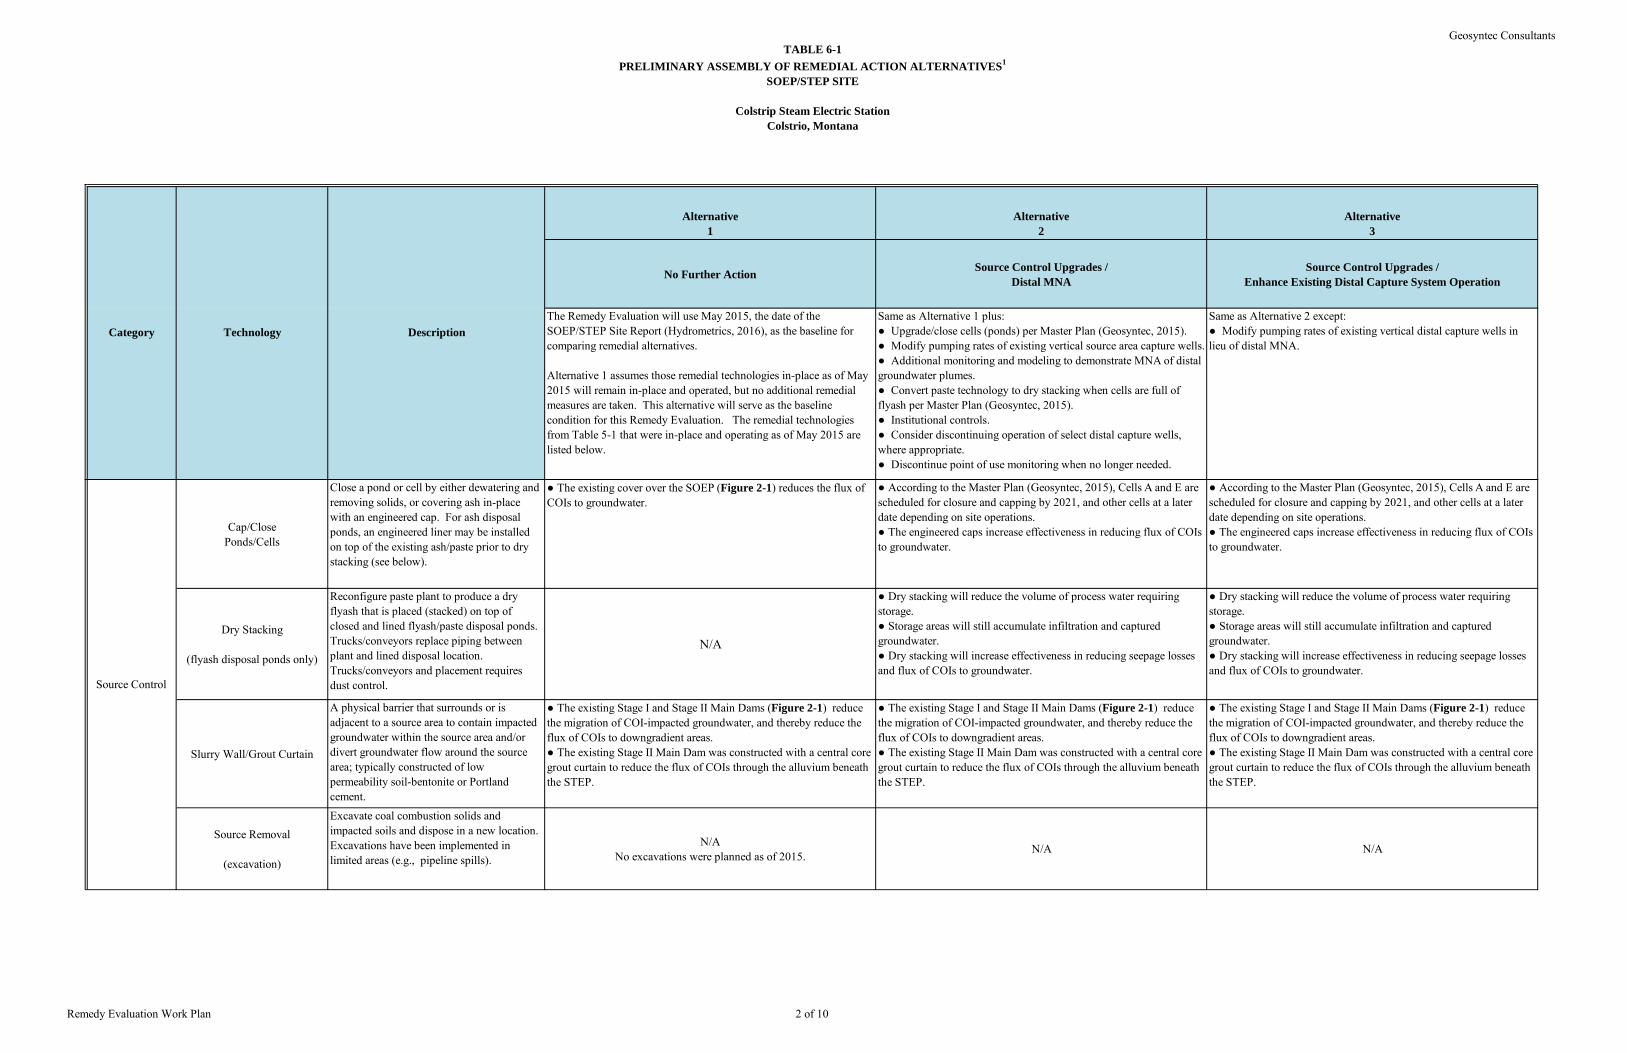
TABLE 6-1PRELIMINARY ASSEMBLY OF REMEDIAL ACTION ALTERNATIVES1
SOEP/STEP SITE
Colstrip Steam Electric StationColstrio, Montana
Geosyntec Consultants
Remedy Evaluation Work Plan 2 of 10
Alternative 1
Alternative 2
Alternative 3
No Further Action Source Control Upgrades / Distal MNA
Source Control Upgrades /Enhance Existing Distal Capture System Operation
The Remedy Evaluation will use May 2015, the date of the SOEP/STEP Site Report (Hydrometrics, 2016), as the baseline for comparing remedial alternatives.
Alternative 1 assumes those remedial technologies in-place as of May 2015 will remain in-place and operated, but no additional remedial measures are taken. This alternative will serve as the baseline condition for this Remedy Evaluation. The remedial technologies from Table 5-1 that were in-place and operating as of May 2015 are listed below.
Same as Alternative 1 plus:● Upgrade/close cells (ponds) per Master Plan (Geosyntec, 2015).● Modify pumping rates of existing vertical source area capture wells.● Additional monitoring and modeling to demonstrate MNA of distal groundwater plumes.● Convert paste technology to dry stacking when cells are full of flyash per Master Plan (Geosyntec, 2015). ● Institutional controls.● Consider discontinuing operation of select distal capture wells, where appropriate.● Discontinue point of use monitoring when no longer needed.
Same as Alternative 2 except:● Modify pumping rates of existing vertical distal capture wells in lieu of distal MNA.
Category Technology Description
Cap/ClosePonds/Cells
Close a pond or cell by either dewatering and removing solids, or covering ash in-place with an engineered cap. For ash disposal ponds, an engineered liner may be installed on top of the existing ash/paste prior to dry stacking (see below).
● The existing cover over the SOEP (Figure 2-1) reduces the flux of COIs to groundwater.
● According to the Master Plan (Geosyntec, 2015), Cells A and E are scheduled for closure and capping by 2021, and other cells at a later date depending on site operations.● The engineered caps increase effectiveness in reducing flux of COIs to groundwater.
● According to the Master Plan (Geosyntec, 2015), Cells A and E are scheduled for closure and capping by 2021, and other cells at a later date depending on site operations.● The engineered caps increase effectiveness in reducing flux of COIs to groundwater.
Dry Stacking
(flyash disposal ponds only)
Reconfigure paste plant to produce a dry flyash that is placed (stacked) on top of closed and lined flyash/paste disposal ponds. Trucks/conveyors replace piping between plant and lined disposal location. Trucks/conveyors and placement requires dust control.
N/A
● Dry stacking will reduce the volume of process water requiring storage.● Storage areas will still accumulate infiltration and captured groundwater.● Dry stacking will increase effectiveness in reducing seepage losses and flux of COIs to groundwater.
● Dry stacking will reduce the volume of process water requiring storage.● Storage areas will still accumulate infiltration and captured groundwater.● Dry stacking will increase effectiveness in reducing seepage losses and flux of COIs to groundwater.
Slurry Wall/Grout Curtain
A physical barrier that surrounds or is adjacent to a source area to contain impacted groundwater within the source area and/or divert groundwater flow around the source area; typically constructed of low permeability soil-bentonite or Portland cement.
● The existing Stage I and Stage II Main Dams (Figure 2-1) reduce the migration of COI-impacted groundwater, and thereby reduce the flux of COIs to downgradient areas.● The existing Stage II Main Dam was constructed with a central core grout curtain to reduce the flux of COIs through the alluvium beneath the STEP.
● The existing Stage I and Stage II Main Dams (Figure 2-1) reduce the migration of COI-impacted groundwater, and thereby reduce the flux of COIs to downgradient areas.● The existing Stage II Main Dam was constructed with a central core grout curtain to reduce the flux of COIs through the alluvium beneath the STEP.
● The existing Stage I and Stage II Main Dams (Figure 2-1) reduce the migration of COI-impacted groundwater, and thereby reduce the flux of COIs to downgradient areas.● The existing Stage II Main Dam was constructed with a central core grout curtain to reduce the flux of COIs through the alluvium beneath the STEP.
Source Removal
(excavation)
Excavate coal combustion solids and impacted soils and dispose in a new location. Excavations have been implemented in limited areas (e.g., pipeline spills).
N/ANo excavations were planned as of 2015.
N/A N/A
Source Control
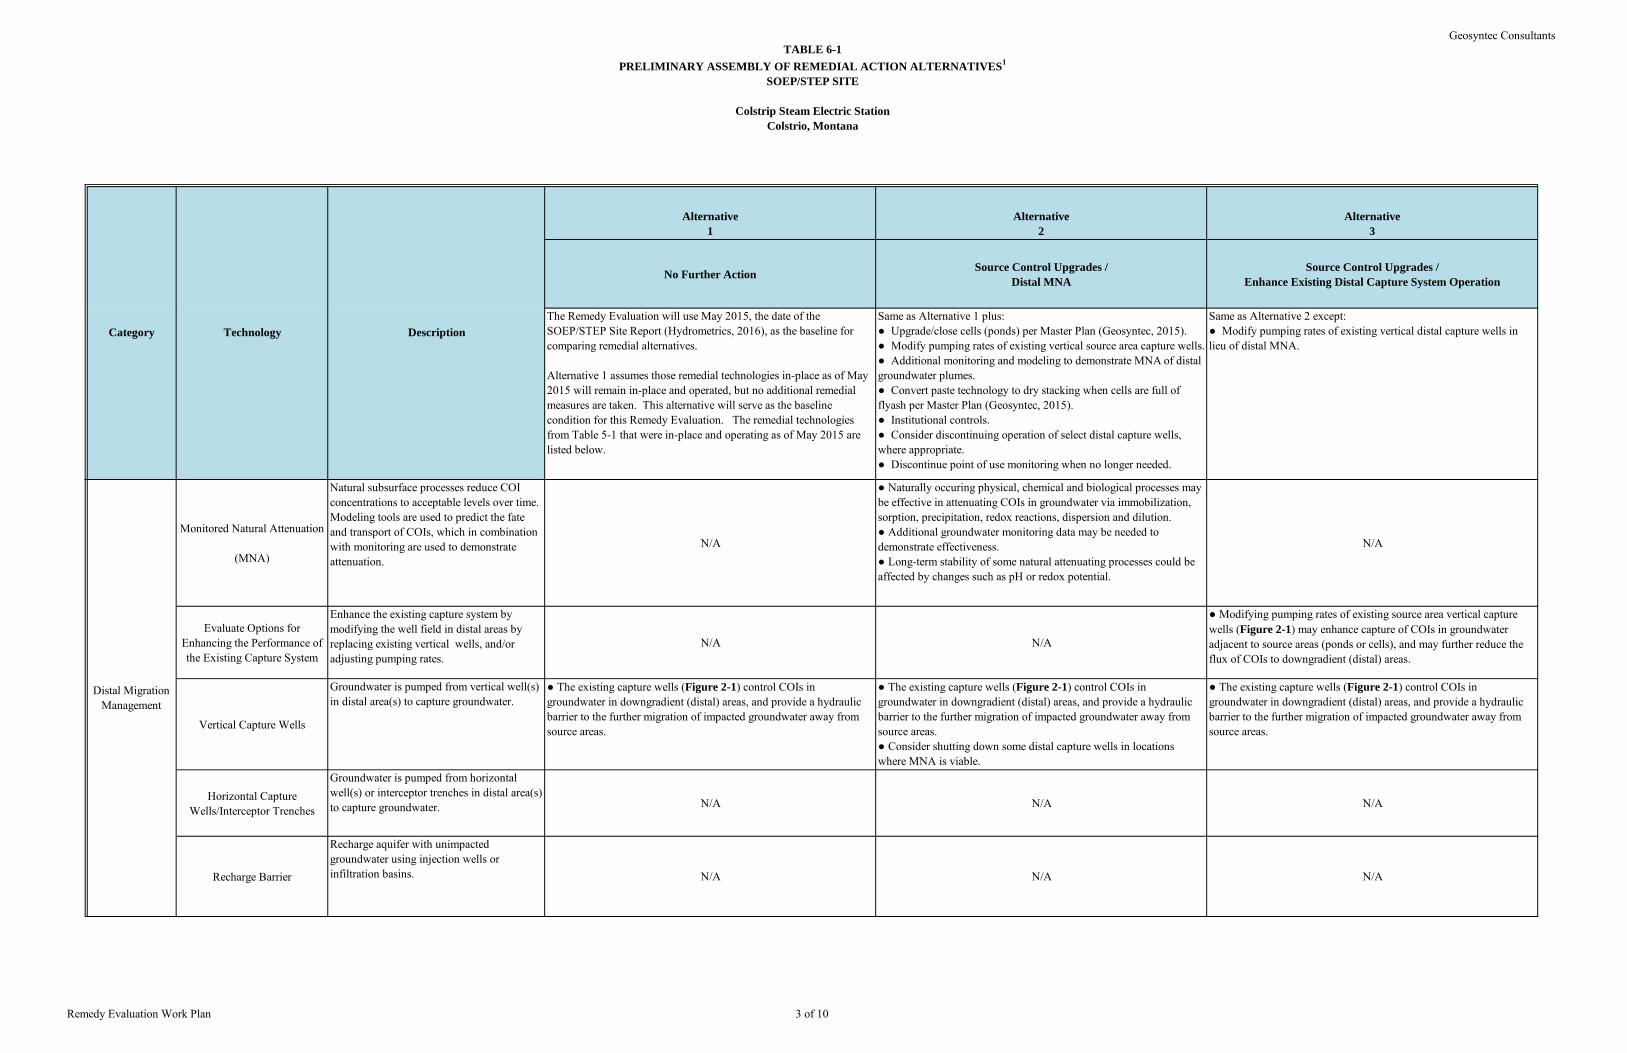
TABLE 6-1PRELIMINARY ASSEMBLY OF REMEDIAL ACTION ALTERNATIVES1
SOEP/STEP SITE
Colstrip Steam Electric StationColstrio, Montana
Geosyntec Consultants
Remedy Evaluation Work Plan 3 of 10
Alternative 1
Alternative 2
Alternative 3
No Further Action Source Control Upgrades / Distal MNA
Source Control Upgrades /Enhance Existing Distal Capture System Operation
The Remedy Evaluation will use May 2015, the date of the SOEP/STEP Site Report (Hydrometrics, 2016), as the baseline for comparing remedial alternatives.
Alternative 1 assumes those remedial technologies in-place as of May 2015 will remain in-place and operated, but no additional remedial measures are taken. This alternative will serve as the baseline condition for this Remedy Evaluation. The remedial technologies from Table 5-1 that were in-place and operating as of May 2015 are listed below.
Same as Alternative 1 plus:● Upgrade/close cells (ponds) per Master Plan (Geosyntec, 2015).● Modify pumping rates of existing vertical source area capture wells.● Additional monitoring and modeling to demonstrate MNA of distal groundwater plumes.● Convert paste technology to dry stacking when cells are full of flyash per Master Plan (Geosyntec, 2015). ● Institutional controls.● Consider discontinuing operation of select distal capture wells, where appropriate.● Discontinue point of use monitoring when no longer needed.
Same as Alternative 2 except:● Modify pumping rates of existing vertical distal capture wells in lieu of distal MNA.
Category Technology Description
Monitored Natural Attenuation
(MNA)
Natural subsurface processes reduce COI concentrations to acceptable levels over time. Modeling tools are used to predict the fate and transport of COIs, which in combination with monitoring are used to demonstrate attenuation.
N/A
● Naturally occuring physical, chemical and biological processes may be effective in attenuating COIs in groundwater via immobilization, sorption, precipitation, redox reactions, dispersion and dilution.● Additional groundwater monitoring data may be needed to demonstrate effectiveness.● Long-term stability of some natural attenuating processes could be affected by changes such as pH or redox potential.
N/A
Evaluate Options for Enhancing the Performance of the Existing Capture System
Enhance the existing capture system by modifying the well field in distal areas by replacing existing vertical wells, and/or adjusting pumping rates.
N/A N/A
● Modifying pumping rates of existing source area vertical capture wells (Figure 2-1) may enhance capture of COIs in groundwater adjacent to source areas (ponds or cells), and may further reduce the flux of COIs to downgradient (distal) areas.
Vertical Capture Wells
Groundwater is pumped from vertical well(s) in distal area(s) to capture groundwater.
● The existing capture wells (Figure 2-1) control COIs in groundwater in downgradient (distal) areas, and provide a hydraulic barrier to the further migration of impacted groundwater away from source areas.
● The existing capture wells (Figure 2-1) control COIs in groundwater in downgradient (distal) areas, and provide a hydraulic barrier to the further migration of impacted groundwater away from source areas.● Consider shutting down some distal capture wells in locations where MNA is viable.
● The existing capture wells (Figure 2-1) control COIs in groundwater in downgradient (distal) areas, and provide a hydraulic barrier to the further migration of impacted groundwater away from source areas.
Horizontal Capture Wells/Interceptor Trenches
Groundwater is pumped from horizontal well(s) or interceptor trenches in distal area(s) to capture groundwater. N/A N/A N/A
Recharge Barrier
Recharge aquifer with unimpacted groundwater using injection wells or infiltration basins. N/A N/A N/A
Distal Migration Management
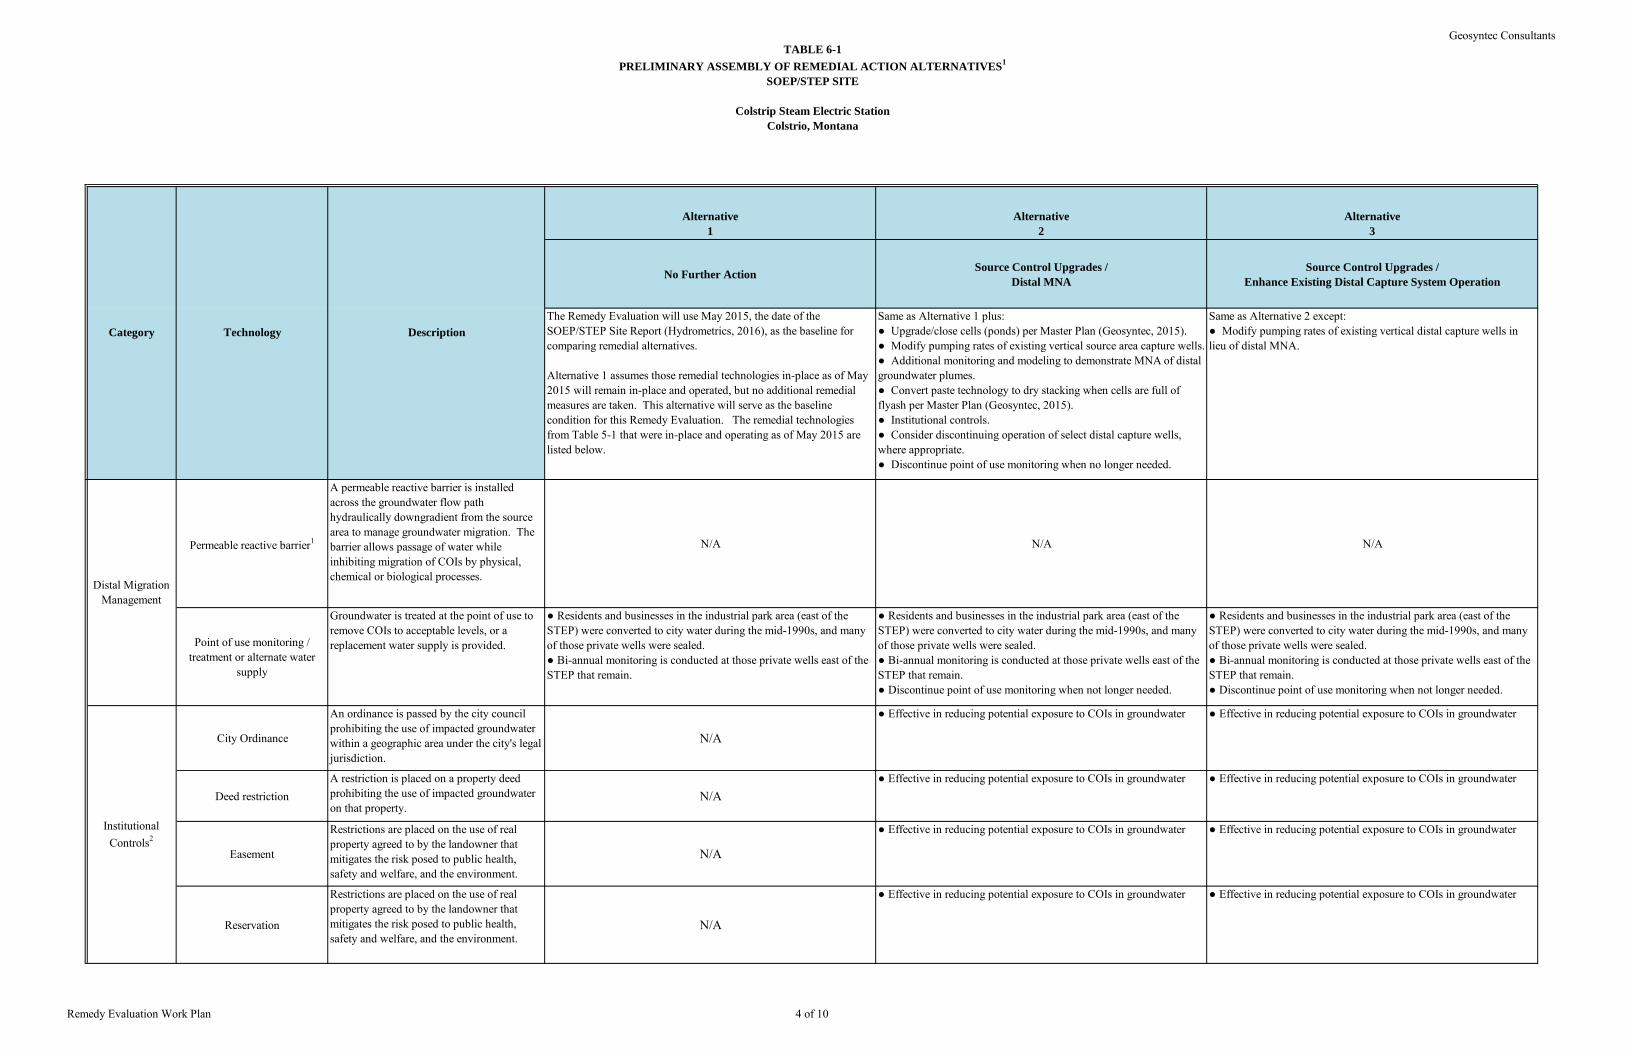
TABLE 6-1PRELIMINARY ASSEMBLY OF REMEDIAL ACTION ALTERNATIVES1
SOEP/STEP SITE
Colstrip Steam Electric StationColstrio, Montana
Geosyntec Consultants
Remedy Evaluation Work Plan 4 of 10
Alternative 1
Alternative 2
Alternative 3
No Further Action Source Control Upgrades / Distal MNA
Source Control Upgrades /Enhance Existing Distal Capture System Operation
The Remedy Evaluation will use May 2015, the date of the SOEP/STEP Site Report (Hydrometrics, 2016), as the baseline for comparing remedial alternatives.
Alternative 1 assumes those remedial technologies in-place as of May 2015 will remain in-place and operated, but no additional remedial measures are taken. This alternative will serve as the baseline condition for this Remedy Evaluation. The remedial technologies from Table 5-1 that were in-place and operating as of May 2015 are listed below.
Same as Alternative 1 plus:● Upgrade/close cells (ponds) per Master Plan (Geosyntec, 2015).● Modify pumping rates of existing vertical source area capture wells.● Additional monitoring and modeling to demonstrate MNA of distal groundwater plumes.● Convert paste technology to dry stacking when cells are full of flyash per Master Plan (Geosyntec, 2015). ● Institutional controls.● Consider discontinuing operation of select distal capture wells, where appropriate.● Discontinue point of use monitoring when no longer needed.
Same as Alternative 2 except:● Modify pumping rates of existing vertical distal capture wells in lieu of distal MNA.
Category Technology Description
Permeable reactive barrier1
A permeable reactive barrier is installed across the groundwater flow path hydraulically downgradient from the source area to manage groundwater migration. The barrier allows passage of water while inhibiting migration of COIs by physical, chemical or biological processes.
N/A N/A N/A
Point of use monitoring / treatment or alternate water
supply
Groundwater is treated at the point of use to remove COIs to acceptable levels, or a replacement water supply is provided.
● Residents and businesses in the industrial park area (east of the STEP) were converted to city water during the mid-1990s, and many of those private wells were sealed.● Bi-annual monitoring is conducted at those private wells east of the STEP that remain.
● Residents and businesses in the industrial park area (east of the STEP) were converted to city water during the mid-1990s, and many of those private wells were sealed.● Bi-annual monitoring is conducted at those private wells east of the STEP that remain.● Discontinue point of use monitoring when not longer needed.
● Residents and businesses in the industrial park area (east of the STEP) were converted to city water during the mid-1990s, and many of those private wells were sealed.● Bi-annual monitoring is conducted at those private wells east of the STEP that remain.● Discontinue point of use monitoring when not longer needed.
City Ordinance
An ordinance is passed by the city council prohibiting the use of impacted groundwater within a geographic area under the city's legal jurisdiction.
N/A
● Effective in reducing potential exposure to COIs in groundwater ● Effective in reducing potential exposure to COIs in groundwater
Deed restrictionA restriction is placed on a property deed prohibiting the use of impacted groundwater on that property.
N/A● Effective in reducing potential exposure to COIs in groundwater ● Effective in reducing potential exposure to COIs in groundwater
Easement
Restrictions are placed on the use of real property agreed to by the landowner that mitigates the risk posed to public health, safety and welfare, and the environment.
N/A
● Effective in reducing potential exposure to COIs in groundwater ● Effective in reducing potential exposure to COIs in groundwater
Reservation
Restrictions are placed on the use of real property agreed to by the landowner that mitigates the risk posed to public health, safety and welfare, and the environment.
N/A
● Effective in reducing potential exposure to COIs in groundwater ● Effective in reducing potential exposure to COIs in groundwater
Distal Migration Management
Institutional Controls2
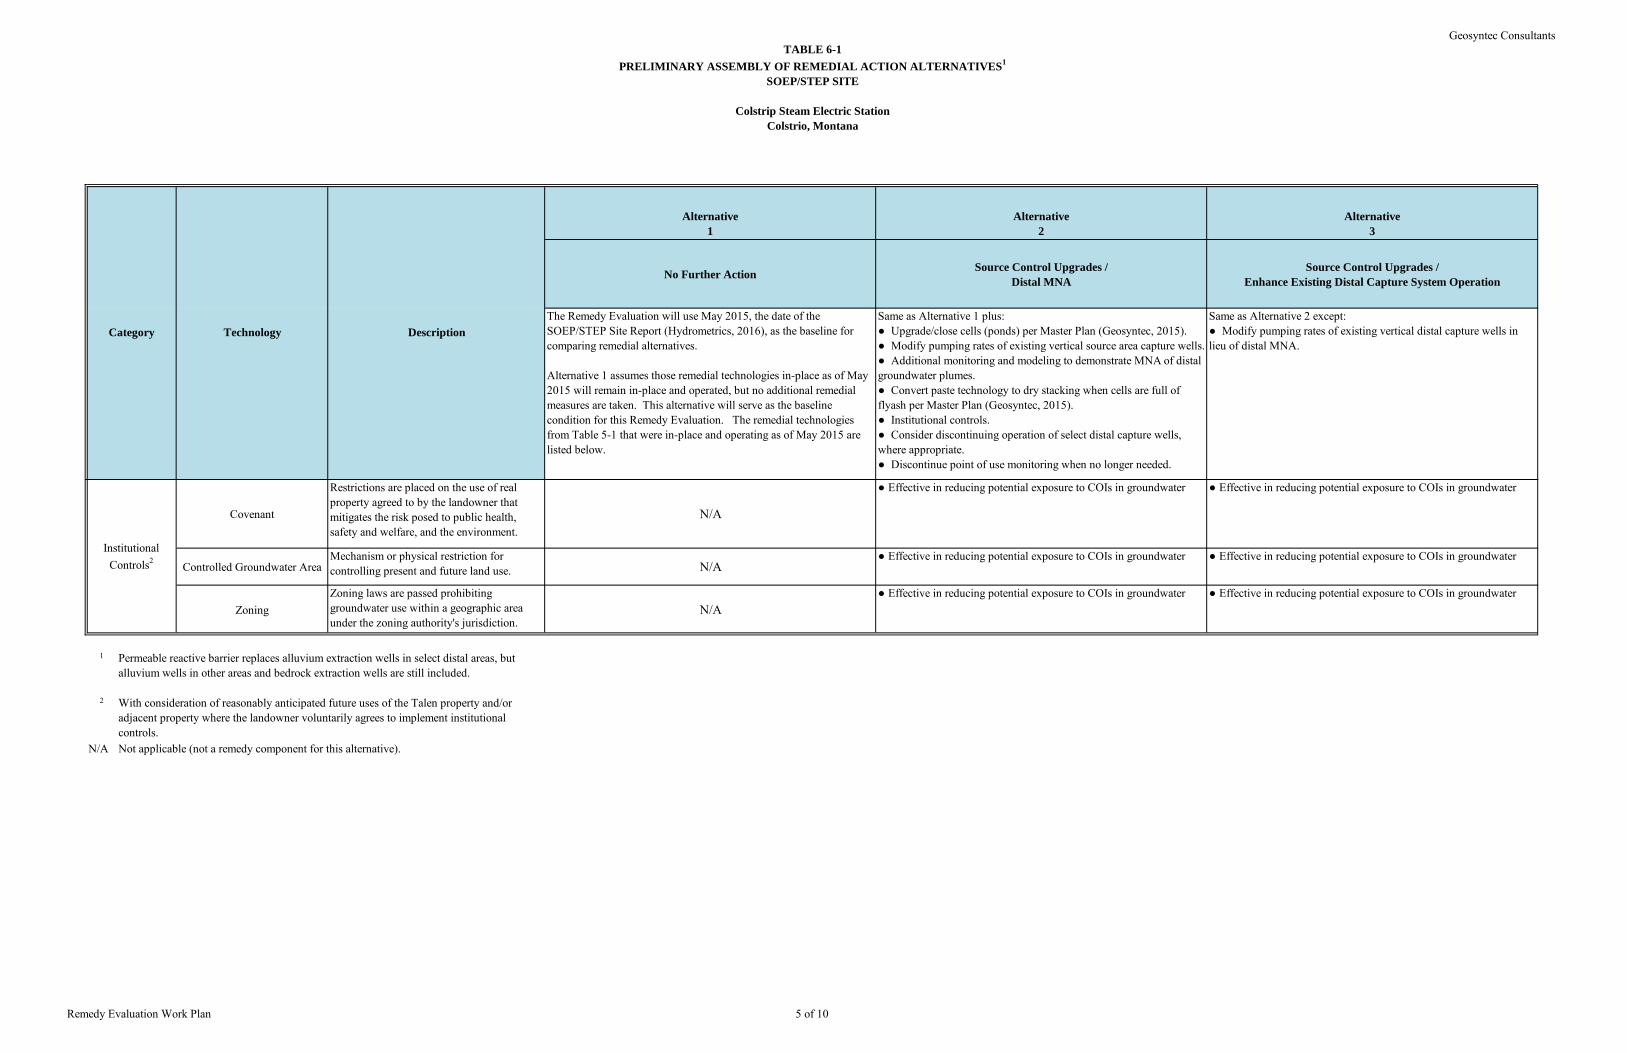
TABLE 6-1PRELIMINARY ASSEMBLY OF REMEDIAL ACTION ALTERNATIVES1
SOEP/STEP SITE
Colstrip Steam Electric StationColstrio, Montana
Geosyntec Consultants
Remedy Evaluation Work Plan 5 of 10
Alternative 1
Alternative 2
Alternative 3
No Further Action Source Control Upgrades / Distal MNA
Source Control Upgrades /Enhance Existing Distal Capture System Operation
The Remedy Evaluation will use May 2015, the date of the SOEP/STEP Site Report (Hydrometrics, 2016), as the baseline for comparing remedial alternatives.
Alternative 1 assumes those remedial technologies in-place as of May 2015 will remain in-place and operated, but no additional remedial measures are taken. This alternative will serve as the baseline condition for this Remedy Evaluation. The remedial technologies from Table 5-1 that were in-place and operating as of May 2015 are listed below.
Same as Alternative 1 plus:● Upgrade/close cells (ponds) per Master Plan (Geosyntec, 2015).● Modify pumping rates of existing vertical source area capture wells.● Additional monitoring and modeling to demonstrate MNA of distal groundwater plumes.● Convert paste technology to dry stacking when cells are full of flyash per Master Plan (Geosyntec, 2015). ● Institutional controls.● Consider discontinuing operation of select distal capture wells, where appropriate.● Discontinue point of use monitoring when no longer needed.
Same as Alternative 2 except:● Modify pumping rates of existing vertical distal capture wells in lieu of distal MNA.
Category Technology Description
Covenant
Restrictions are placed on the use of real property agreed to by the landowner that mitigates the risk posed to public health, safety and welfare, and the environment.
N/A
● Effective in reducing potential exposure to COIs in groundwater ● Effective in reducing potential exposure to COIs in groundwater
Controlled Groundwater AreaMechanism or physical restriction for controlling present and future land use. N/A
● Effective in reducing potential exposure to COIs in groundwater ● Effective in reducing potential exposure to COIs in groundwater
ZoningZoning laws are passed prohibiting groundwater use within a geographic area under the zoning authority's jurisdiction.
N/A● Effective in reducing potential exposure to COIs in groundwater ● Effective in reducing potential exposure to COIs in groundwater
1
2
N/A
With consideration of reasonably anticipated future uses of the Talen property and/or adjacent property where the landowner voluntarily agrees to implement institutional controls.Not applicable (not a remedy component for this alternative).
Institutional Controls2
Permeable reactive barrier replaces alluvium extraction wells in select distal areas, but alluvium wells in other areas and bedrock extraction wells are still included.
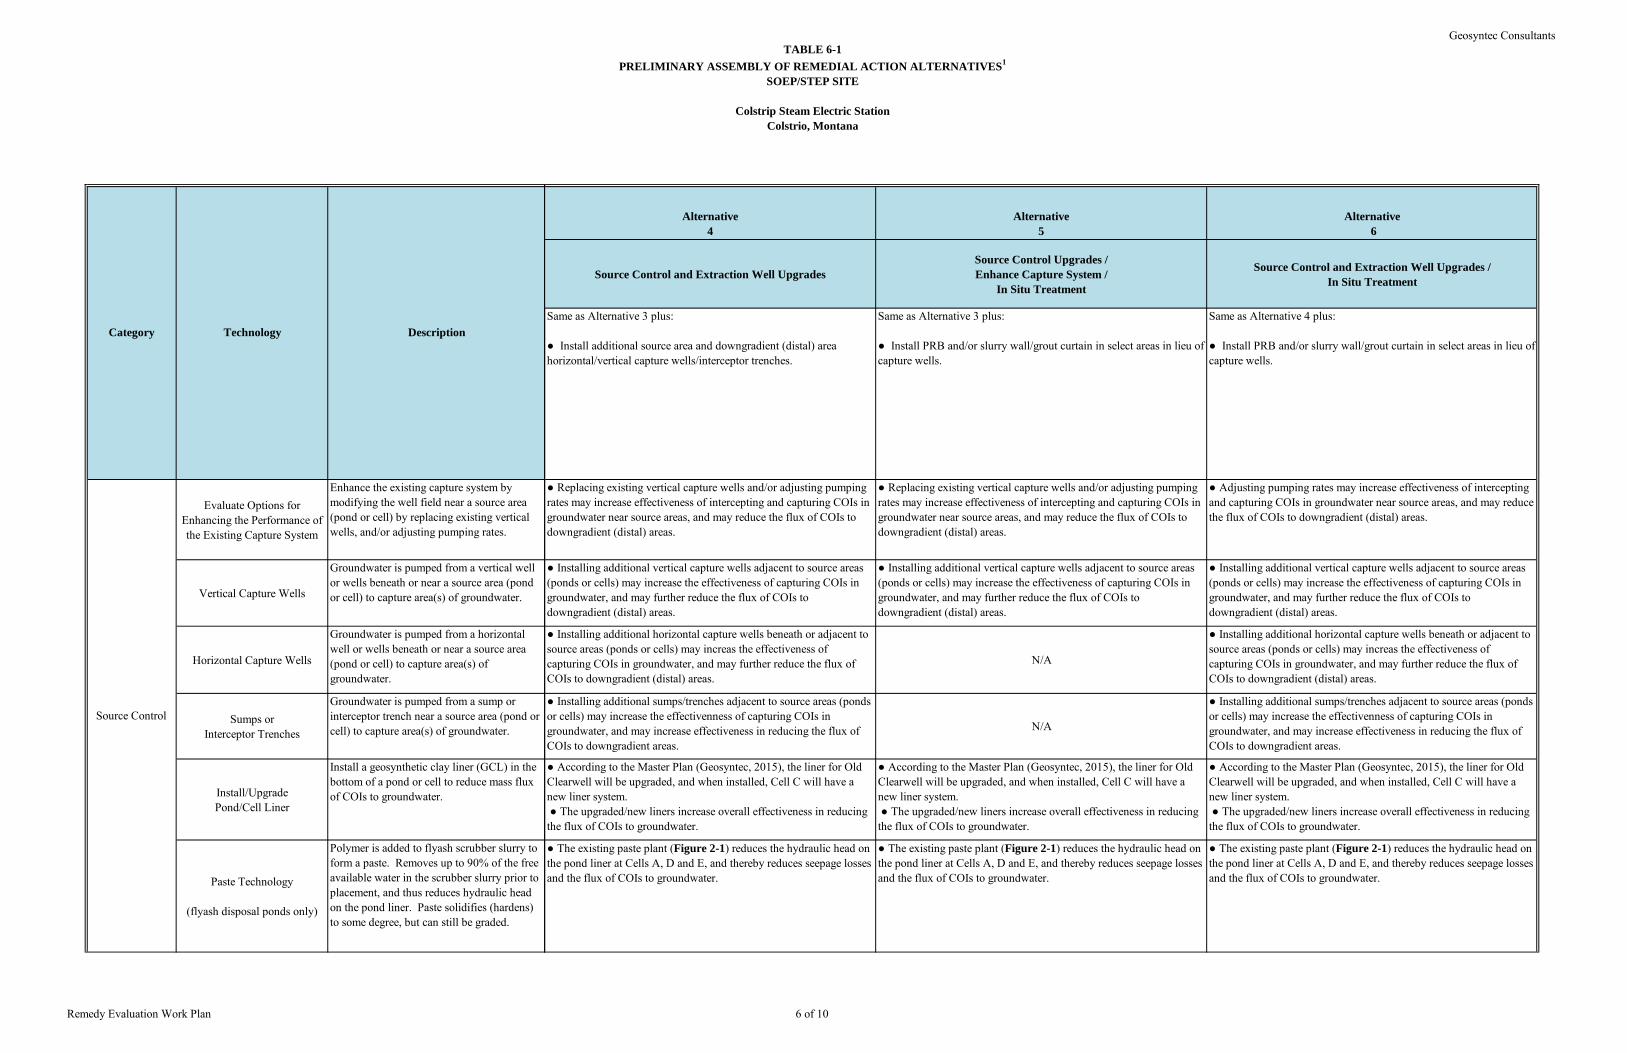
TABLE 6-1PRELIMINARY ASSEMBLY OF REMEDIAL ACTION ALTERNATIVES1
SOEP/STEP SITE
Colstrip Steam Electric StationColstrio, Montana
Geosyntec Consultants
Remedy Evaluation Work Plan 6 of 10
Evaluate Options for Enhancing the Performance of the Existing Capture System
Enhance the existing capture system by modifying the well field near a source area (pond or cell) by replacing existing vertical wells, and/or adjusting pumping rates.
Vertical Capture Wells
Groundwater is pumped from a vertical well or wells beneath or near a source area (pond or cell) to capture area(s) of groundwater.
Horizontal Capture Wells
Groundwater is pumped from a horizontal well or wells beneath or near a source area (pond or cell) to capture area(s) of groundwater.
Sumps or Interceptor Trenches
Groundwater is pumped from a sump or interceptor trench near a source area (pond or cell) to capture area(s) of groundwater.
Install/UpgradePond/Cell Liner
Install a geosynthetic clay liner (GCL) in the bottom of a pond or cell to reduce mass flux of COIs to groundwater.
Paste Technology
(flyash disposal ponds only)
Polymer is added to flyash scrubber slurry to form a paste. Removes up to 90% of the free available water in the scrubber slurry prior to placement, and thus reduces hydraulic head on the pond liner. Paste solidifies (hardens) to some degree, but can still be graded.
Category Technology Description
Source Control
Alternative 4
Alternative 5
Alternative 6
Source Control and Extraction Well UpgradesSource Control Upgrades / Enhance Capture System /
In Situ Treatment
Source Control and Extraction Well Upgrades / In Situ Treatment
Same as Alternative 3 plus:
● Install additional source area and downgradient (distal) area horizontal/vertical capture wells/interceptor trenches.
Same as Alternative 3 plus:
● Install PRB and/or slurry wall/grout curtain in select areas in lieu of capture wells.
Same as Alternative 4 plus:
● Install PRB and/or slurry wall/grout curtain in select areas in lieu of capture wells.
● Replacing existing vertical capture wells and/or adjusting pumping rates may increase effectiveness of intercepting and capturing COIs in groundwater near source areas, and may reduce the flux of COIs to downgradient (distal) areas.
● Replacing existing vertical capture wells and/or adjusting pumping rates may increase effectiveness of intercepting and capturing COIs in groundwater near source areas, and may reduce the flux of COIs to downgradient (distal) areas.
● Adjusting pumping rates may increase effectiveness of intercepting and capturing COIs in groundwater near source areas, and may reduce the flux of COIs to downgradient (distal) areas.
● Installing additional vertical capture wells adjacent to source areas (ponds or cells) may increase the effectiveness of capturing COIs in groundwater, and may further reduce the flux of COIs to downgradient (distal) areas.
● Installing additional vertical capture wells adjacent to source areas (ponds or cells) may increase the effectiveness of capturing COIs in groundwater, and may further reduce the flux of COIs to downgradient (distal) areas.
● Installing additional vertical capture wells adjacent to source areas (ponds or cells) may increase the effectiveness of capturing COIs in groundwater, and may further reduce the flux of COIs to downgradient (distal) areas.
● Installing additional horizontal capture wells beneath or adjacent to source areas (ponds or cells) may increas the effectiveness of capturing COIs in groundwater, and may further reduce the flux of COIs to downgradient (distal) areas.
N/A
● Installing additional horizontal capture wells beneath or adjacent to source areas (ponds or cells) may increas the effectiveness of capturing COIs in groundwater, and may further reduce the flux of COIs to downgradient (distal) areas.
● Installing additional sumps/trenches adjacent to source areas (ponds or cells) may increase the effectivenness of capturing COIs in groundwater, and may increase effectiveness in reducing the flux of COIs to downgradient areas.
N/A
● Installing additional sumps/trenches adjacent to source areas (ponds or cells) may increase the effectivenness of capturing COIs in groundwater, and may increase effectiveness in reducing the flux of COIs to downgradient areas.
● According to the Master Plan (Geosyntec, 2015), the liner for Old Clearwell will be upgraded, and when installed, Cell C will have a new liner system. ● The upgraded/new liners increase overall effectiveness in reducing the flux of COIs to groundwater.
● According to the Master Plan (Geosyntec, 2015), the liner for Old Clearwell will be upgraded, and when installed, Cell C will have a new liner system. ● The upgraded/new liners increase overall effectiveness in reducing the flux of COIs to groundwater.
● According to the Master Plan (Geosyntec, 2015), the liner for Old Clearwell will be upgraded, and when installed, Cell C will have a new liner system. ● The upgraded/new liners increase overall effectiveness in reducing the flux of COIs to groundwater.
● The existing paste plant (Figure 2-1) reduces the hydraulic head on the pond liner at Cells A, D and E, and thereby reduces seepage losses and the flux of COIs to groundwater.
● The existing paste plant (Figure 2-1) reduces the hydraulic head on the pond liner at Cells A, D and E, and thereby reduces seepage losses and the flux of COIs to groundwater.
● The existing paste plant (Figure 2-1) reduces the hydraulic head on the pond liner at Cells A, D and E, and thereby reduces seepage losses and the flux of COIs to groundwater.
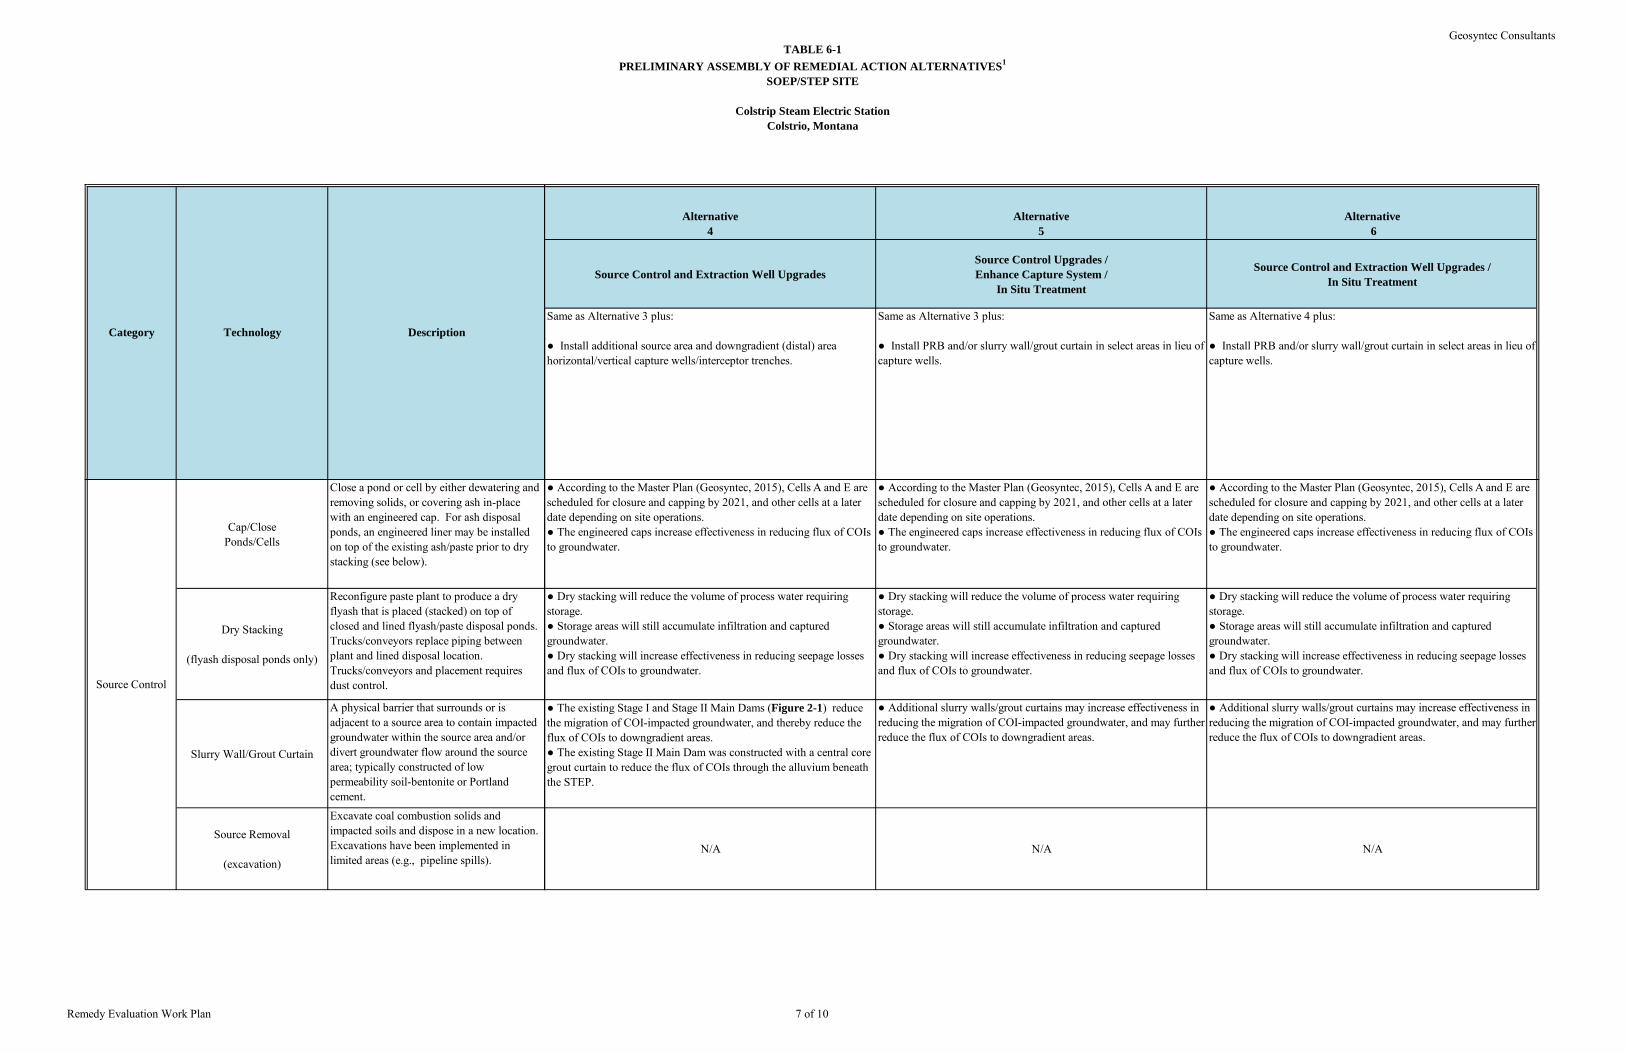
TABLE 6-1PRELIMINARY ASSEMBLY OF REMEDIAL ACTION ALTERNATIVES1
SOEP/STEP SITE
Colstrip Steam Electric StationColstrio, Montana
Geosyntec Consultants
Remedy Evaluation Work Plan 7 of 10
Category Technology Description
Cap/ClosePonds/Cells
Close a pond or cell by either dewatering and removing solids, or covering ash in-place with an engineered cap. For ash disposal ponds, an engineered liner may be installed on top of the existing ash/paste prior to dry stacking (see below).
Dry Stacking
(flyash disposal ponds only)
Reconfigure paste plant to produce a dry flyash that is placed (stacked) on top of closed and lined flyash/paste disposal ponds. Trucks/conveyors replace piping between plant and lined disposal location. Trucks/conveyors and placement requires dust control.
Slurry Wall/Grout Curtain
A physical barrier that surrounds or is adjacent to a source area to contain impacted groundwater within the source area and/or divert groundwater flow around the source area; typically constructed of low permeability soil-bentonite or Portland cement.
Source Removal
(excavation)
Excavate coal combustion solids and impacted soils and dispose in a new location. Excavations have been implemented in limited areas (e.g., pipeline spills).
Source Control
Alternative 4
Alternative 5
Alternative 6
Source Control and Extraction Well UpgradesSource Control Upgrades / Enhance Capture System /
In Situ Treatment
Source Control and Extraction Well Upgrades / In Situ Treatment
Same as Alternative 3 plus:
● Install additional source area and downgradient (distal) area horizontal/vertical capture wells/interceptor trenches.
Same as Alternative 3 plus:
● Install PRB and/or slurry wall/grout curtain in select areas in lieu of capture wells.
Same as Alternative 4 plus:
● Install PRB and/or slurry wall/grout curtain in select areas in lieu of capture wells.
● According to the Master Plan (Geosyntec, 2015), Cells A and E are scheduled for closure and capping by 2021, and other cells at a later date depending on site operations.● The engineered caps increase effectiveness in reducing flux of COIs to groundwater.
● According to the Master Plan (Geosyntec, 2015), Cells A and E are scheduled for closure and capping by 2021, and other cells at a later date depending on site operations.● The engineered caps increase effectiveness in reducing flux of COIs to groundwater.
● According to the Master Plan (Geosyntec, 2015), Cells A and E are scheduled for closure and capping by 2021, and other cells at a later date depending on site operations.● The engineered caps increase effectiveness in reducing flux of COIs to groundwater.
● Dry stacking will reduce the volume of process water requiring storage.● Storage areas will still accumulate infiltration and captured groundwater.● Dry stacking will increase effectiveness in reducing seepage losses and flux of COIs to groundwater.
● Dry stacking will reduce the volume of process water requiring storage.● Storage areas will still accumulate infiltration and captured groundwater.● Dry stacking will increase effectiveness in reducing seepage losses and flux of COIs to groundwater.
● Dry stacking will reduce the volume of process water requiring storage.● Storage areas will still accumulate infiltration and captured groundwater.● Dry stacking will increase effectiveness in reducing seepage losses and flux of COIs to groundwater.
● The existing Stage I and Stage II Main Dams (Figure 2-1) reduce the migration of COI-impacted groundwater, and thereby reduce the flux of COIs to downgradient areas.● The existing Stage II Main Dam was constructed with a central core grout curtain to reduce the flux of COIs through the alluvium beneath the STEP.
● Additional slurry walls/grout curtains may increase effectiveness in reducing the migration of COI-impacted groundwater, and may further reduce the flux of COIs to downgradient areas.
● Additional slurry walls/grout curtains may increase effectiveness in reducing the migration of COI-impacted groundwater, and may further reduce the flux of COIs to downgradient areas.
N/A N/A N/A
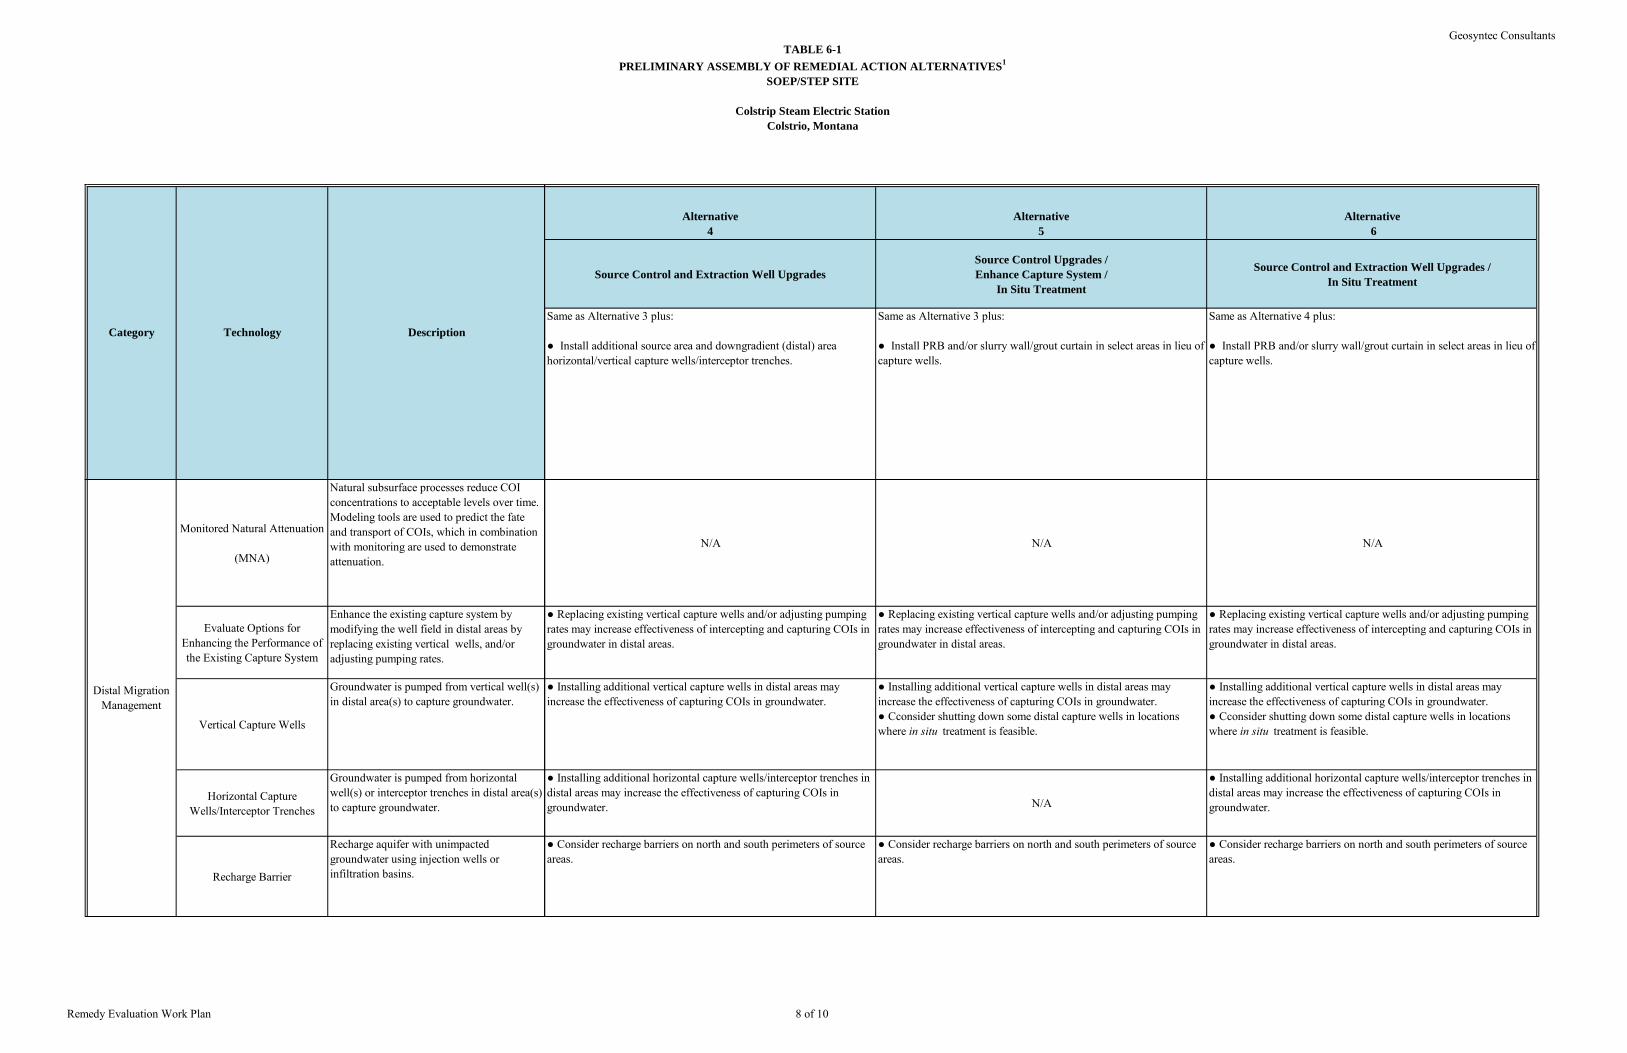
TABLE 6-1PRELIMINARY ASSEMBLY OF REMEDIAL ACTION ALTERNATIVES1
SOEP/STEP SITE
Colstrip Steam Electric StationColstrio, Montana
Geosyntec Consultants
Remedy Evaluation Work Plan 8 of 10
Category Technology Description
Monitored Natural Attenuation
(MNA)
Natural subsurface processes reduce COI concentrations to acceptable levels over time. Modeling tools are used to predict the fate and transport of COIs, which in combination with monitoring are used to demonstrate attenuation.
Evaluate Options for Enhancing the Performance of the Existing Capture System
Enhance the existing capture system by modifying the well field in distal areas by replacing existing vertical wells, and/or adjusting pumping rates.
Vertical Capture Wells
Groundwater is pumped from vertical well(s) in distal area(s) to capture groundwater.
Horizontal Capture Wells/Interceptor Trenches
Groundwater is pumped from horizontal well(s) or interceptor trenches in distal area(s) to capture groundwater.
Recharge Barrier
Recharge aquifer with unimpacted groundwater using injection wells or infiltration basins.
Distal Migration Management
Alternative 4
Alternative 5
Alternative 6
Source Control and Extraction Well UpgradesSource Control Upgrades / Enhance Capture System /
In Situ Treatment
Source Control and Extraction Well Upgrades / In Situ Treatment
Same as Alternative 3 plus:
● Install additional source area and downgradient (distal) area horizontal/vertical capture wells/interceptor trenches.
Same as Alternative 3 plus:
● Install PRB and/or slurry wall/grout curtain in select areas in lieu of capture wells.
Same as Alternative 4 plus:
● Install PRB and/or slurry wall/grout curtain in select areas in lieu of capture wells.
N/A N/A N/A
● Replacing existing vertical capture wells and/or adjusting pumping rates may increase effectiveness of intercepting and capturing COIs in groundwater in distal areas.
● Replacing existing vertical capture wells and/or adjusting pumping rates may increase effectiveness of intercepting and capturing COIs in groundwater in distal areas.
● Replacing existing vertical capture wells and/or adjusting pumping rates may increase effectiveness of intercepting and capturing COIs in groundwater in distal areas.
● Installing additional vertical capture wells in distal areas may increase the effectiveness of capturing COIs in groundwater.
● Installing additional vertical capture wells in distal areas may increase the effectiveness of capturing COIs in groundwater.● Cconsider shutting down some distal capture wells in locations where in situ treatment is feasible.
● Installing additional vertical capture wells in distal areas may increase the effectiveness of capturing COIs in groundwater.● Cconsider shutting down some distal capture wells in locations where in situ treatment is feasible.
● Installing additional horizontal capture wells/interceptor trenches in distal areas may increase the effectiveness of capturing COIs in groundwater. N/A
● Installing additional horizontal capture wells/interceptor trenches in distal areas may increase the effectiveness of capturing COIs in groundwater.
● Consider recharge barriers on north and south perimeters of source areas.
● Consider recharge barriers on north and south perimeters of source areas.
● Consider recharge barriers on north and south perimeters of source areas.
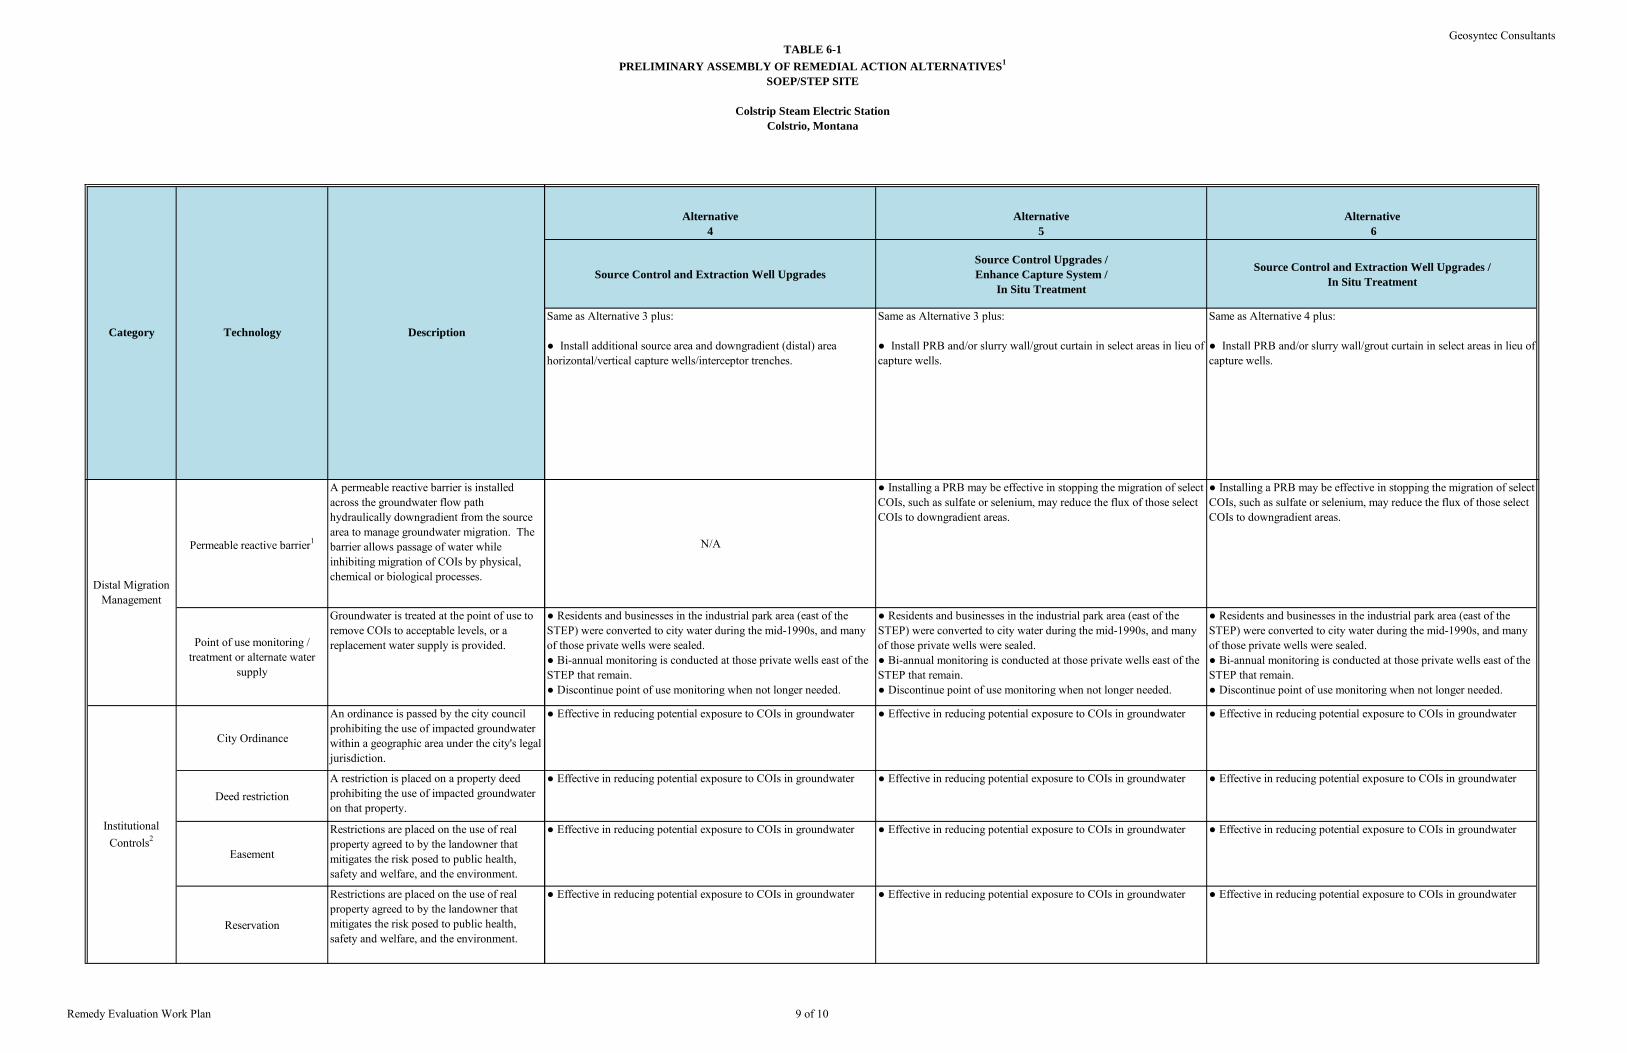
TABLE 6-1PRELIMINARY ASSEMBLY OF REMEDIAL ACTION ALTERNATIVES1
SOEP/STEP SITE
Colstrip Steam Electric StationColstrio, Montana
Geosyntec Consultants
Remedy Evaluation Work Plan 9 of 10
Category Technology Description
Permeable reactive barrier1
A permeable reactive barrier is installed across the groundwater flow path hydraulically downgradient from the source area to manage groundwater migration. The barrier allows passage of water while inhibiting migration of COIs by physical, chemical or biological processes.
Point of use monitoring / treatment or alternate water
supply
Groundwater is treated at the point of use to remove COIs to acceptable levels, or a replacement water supply is provided.
City Ordinance
An ordinance is passed by the city council prohibiting the use of impacted groundwater within a geographic area under the city's legal jurisdiction.
Deed restrictionA restriction is placed on a property deed prohibiting the use of impacted groundwater on that property.
Easement
Restrictions are placed on the use of real property agreed to by the landowner that mitigates the risk posed to public health, safety and welfare, and the environment.
Reservation
Restrictions are placed on the use of real property agreed to by the landowner that mitigates the risk posed to public health, safety and welfare, and the environment.
Distal Migration Management
Institutional Controls2
Alternative 4
Alternative 5
Alternative 6
Source Control and Extraction Well UpgradesSource Control Upgrades / Enhance Capture System /
In Situ Treatment
Source Control and Extraction Well Upgrades / In Situ Treatment
Same as Alternative 3 plus:
● Install additional source area and downgradient (distal) area horizontal/vertical capture wells/interceptor trenches.
Same as Alternative 3 plus:
● Install PRB and/or slurry wall/grout curtain in select areas in lieu of capture wells.
Same as Alternative 4 plus:
● Install PRB and/or slurry wall/grout curtain in select areas in lieu of capture wells.
N/A
● Installing a PRB may be effective in stopping the migration of select COIs, such as sulfate or selenium, may reduce the flux of those select COIs to downgradient areas.
● Installing a PRB may be effective in stopping the migration of select COIs, such as sulfate or selenium, may reduce the flux of those select COIs to downgradient areas.
● Residents and businesses in the industrial park area (east of the STEP) were converted to city water during the mid-1990s, and many of those private wells were sealed.● Bi-annual monitoring is conducted at those private wells east of the STEP that remain.● Discontinue point of use monitoring when not longer needed.
● Residents and businesses in the industrial park area (east of the STEP) were converted to city water during the mid-1990s, and many of those private wells were sealed.● Bi-annual monitoring is conducted at those private wells east of the STEP that remain.● Discontinue point of use monitoring when not longer needed.
● Residents and businesses in the industrial park area (east of the STEP) were converted to city water during the mid-1990s, and many of those private wells were sealed.● Bi-annual monitoring is conducted at those private wells east of the STEP that remain.● Discontinue point of use monitoring when not longer needed.
● Effective in reducing potential exposure to COIs in groundwater ● Effective in reducing potential exposure to COIs in groundwater ● Effective in reducing potential exposure to COIs in groundwater
● Effective in reducing potential exposure to COIs in groundwater ● Effective in reducing potential exposure to COIs in groundwater ● Effective in reducing potential exposure to COIs in groundwater
● Effective in reducing potential exposure to COIs in groundwater ● Effective in reducing potential exposure to COIs in groundwater ● Effective in reducing potential exposure to COIs in groundwater
● Effective in reducing potential exposure to COIs in groundwater ● Effective in reducing potential exposure to COIs in groundwater ● Effective in reducing potential exposure to COIs in groundwater
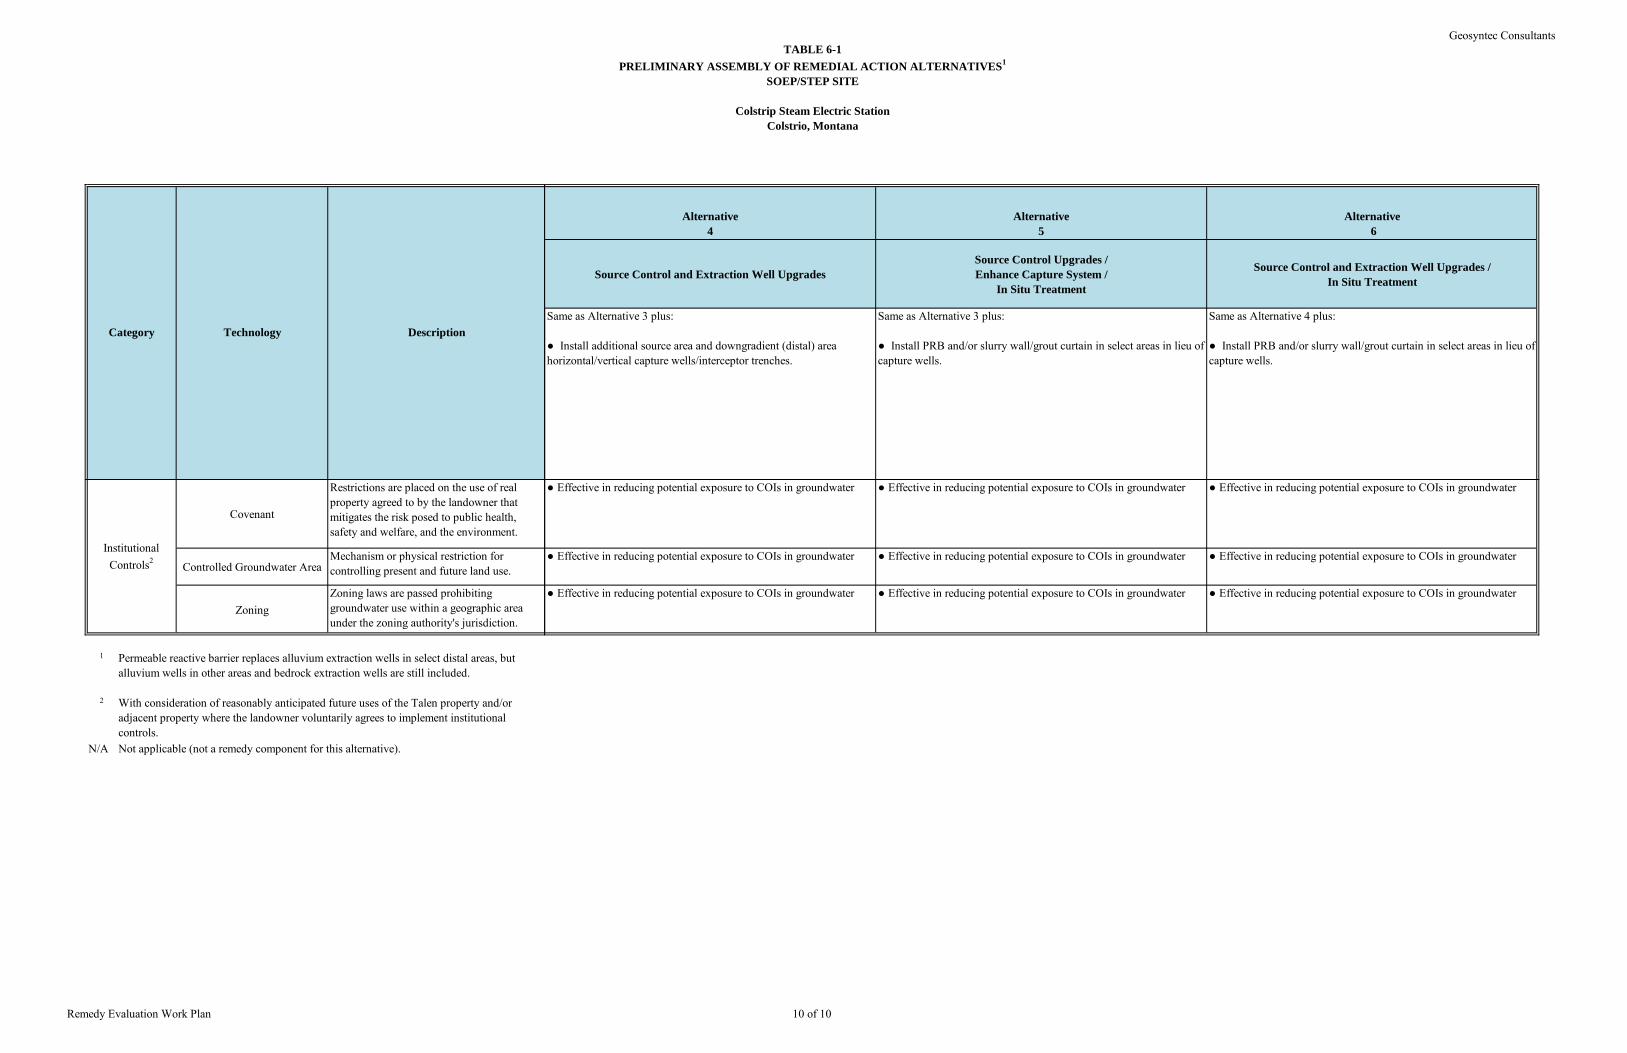
TABLE 6-1PRELIMINARY ASSEMBLY OF REMEDIAL ACTION ALTERNATIVES1
SOEP/STEP SITE
Colstrip Steam Electric StationColstrio, Montana
Geosyntec Consultants
Remedy Evaluation Work Plan 10 of 10
Category Technology Description
Covenant
Restrictions are placed on the use of real property agreed to by the landowner that mitigates the risk posed to public health, safety and welfare, and the environment.
Controlled Groundwater AreaMechanism or physical restriction for controlling present and future land use.
ZoningZoning laws are passed prohibiting groundwater use within a geographic area under the zoning authority's jurisdiction.
1
2
N/A
With consideration of reasonably anticipated future uses of the Talen property and/or adjacent property where the landowner voluntarily agrees to implement institutional controls.Not applicable (not a remedy component for this alternative).
Institutional Controls2
Permeable reactive barrier replaces alluvium extraction wells in select distal areas, but alluvium wells in other areas and bedrock extraction wells are still included.
Alternative 4
Alternative 5
Alternative 6
Source Control and Extraction Well UpgradesSource Control Upgrades / Enhance Capture System /
In Situ Treatment
Source Control and Extraction Well Upgrades / In Situ Treatment
Same as Alternative 3 plus:
● Install additional source area and downgradient (distal) area horizontal/vertical capture wells/interceptor trenches.
Same as Alternative 3 plus:
● Install PRB and/or slurry wall/grout curtain in select areas in lieu of capture wells.
Same as Alternative 4 plus:
● Install PRB and/or slurry wall/grout curtain in select areas in lieu of capture wells.
● Effective in reducing potential exposure to COIs in groundwater ● Effective in reducing potential exposure to COIs in groundwater ● Effective in reducing potential exposure to COIs in groundwater
● Effective in reducing potential exposure to COIs in groundwater ● Effective in reducing potential exposure to COIs in groundwater ● Effective in reducing potential exposure to COIs in groundwater
● Effective in reducing potential exposure to COIs in groundwater ● Effective in reducing potential exposure to COIs in groundwater ● Effective in reducing potential exposure to COIs in groundwater

36 7/29/2016 MR1149D\Remedy Evaluation Work Plan - SOEP STEP
FIGURES
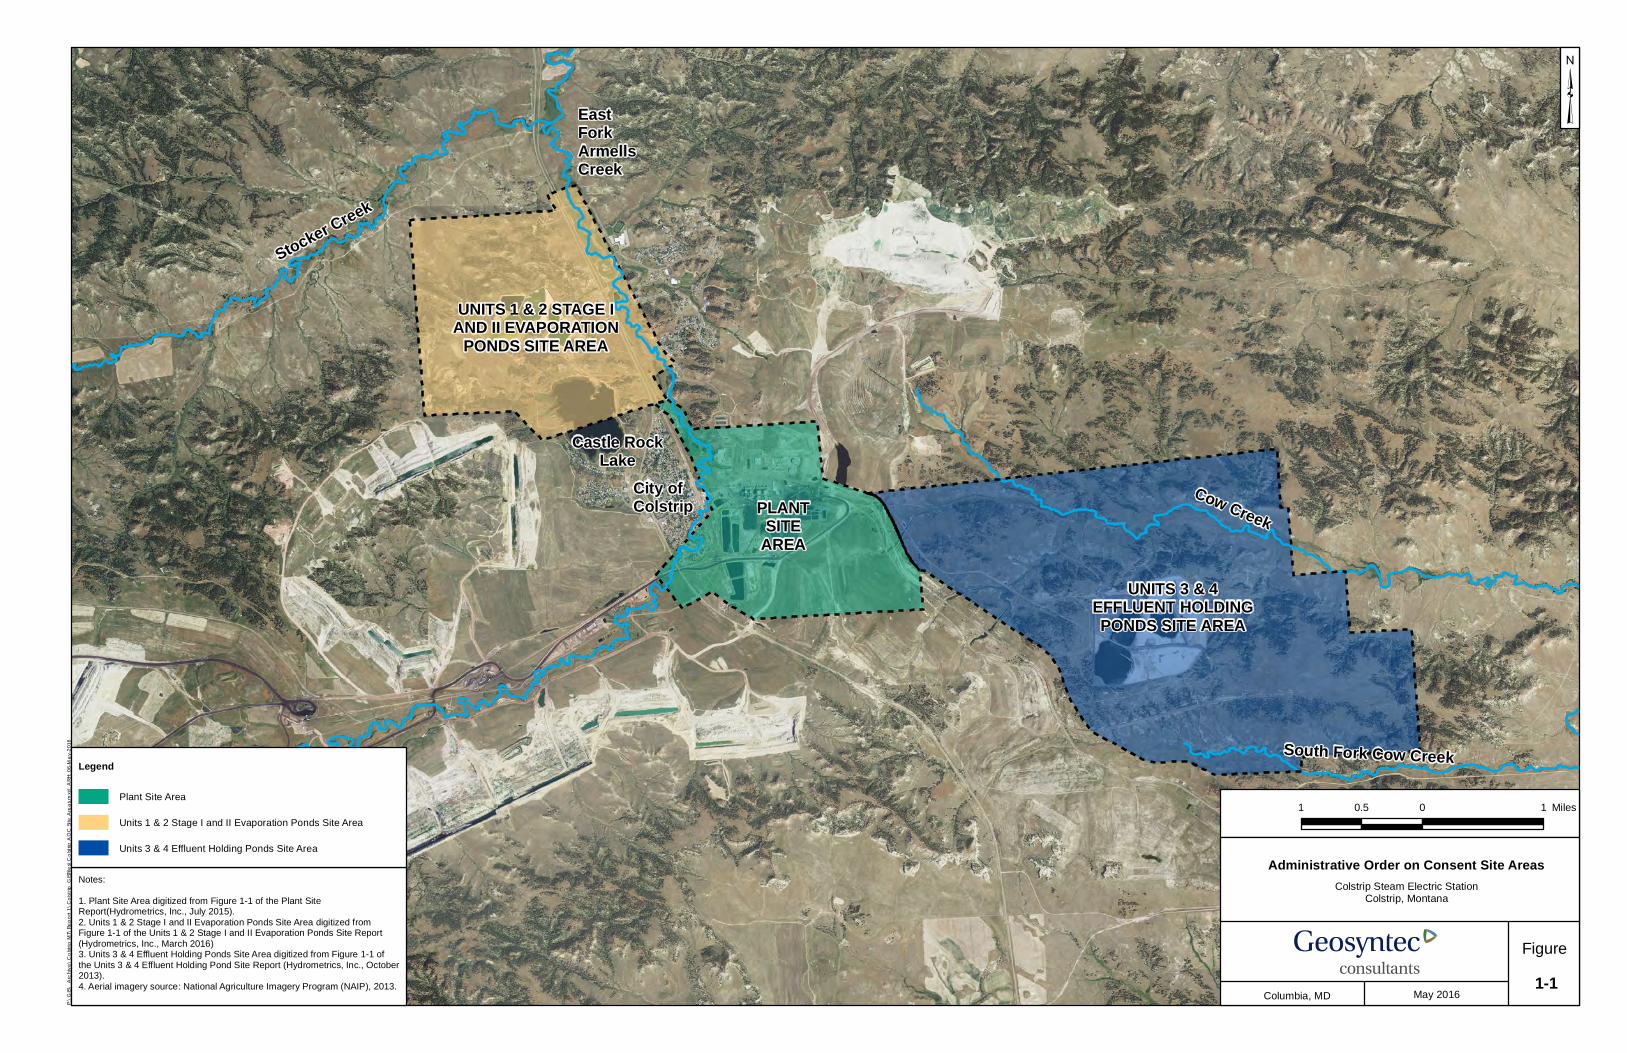
UNITS 1 & 2 STAGE IAND II EVAPORATION
PONDS SITE AREA
PLANTSITE
AREA
UNITS 3 & 4EFFLUENT HOLDINGPONDS SITE AREA
South Fork Cow Creek
Stocker Creek
Cow Creek
Administrative Order on Consent Site AreasColstrip Steam Electric Station
Colstrip, Montana
Figure
1-1
P:\GI
S\_A
rchiv
e\Co
lstrip
MT\R
epor
t 1\C
olstrip
_GISF
iles\
Colstr
ip AO
C Sit
e Ar
eas.m
xd; A
RH; 0
6-May
-2016
Columbia, MD May 2016
1 0 10.5 Miles
³
Notes:
1. Plant Site Area digitized from Figure 1-1 of the Plant SiteReport(Hydrometrics, Inc., July 2015).2. Units 1 & 2 Stage I and II Evaporation Ponds Site Area digitized fromFigure 1-1 of the Units 1 & 2 Stage I and II Evaporation Ponds Site Report(Hydrometrics, Inc., March 2016)3. Units 3 & 4 Effluent Holding Ponds Site Area digitized from Figure 1-1 ofthe Units 3 & 4 Effluent Holding Pond Site Report (Hydrometrics, Inc., October2013).4. Aerial imagery source: National Agriculture Imagery Program (NAIP), 2013.
Legend
Plant Site Area
Units 1 & 2 Stage I and II Evaporation Ponds Site Area
Units 3 & 4 Effluent Holding Ponds Site Area
EastFork ArmellsCreek
City ofColstrip
Castle RockLake
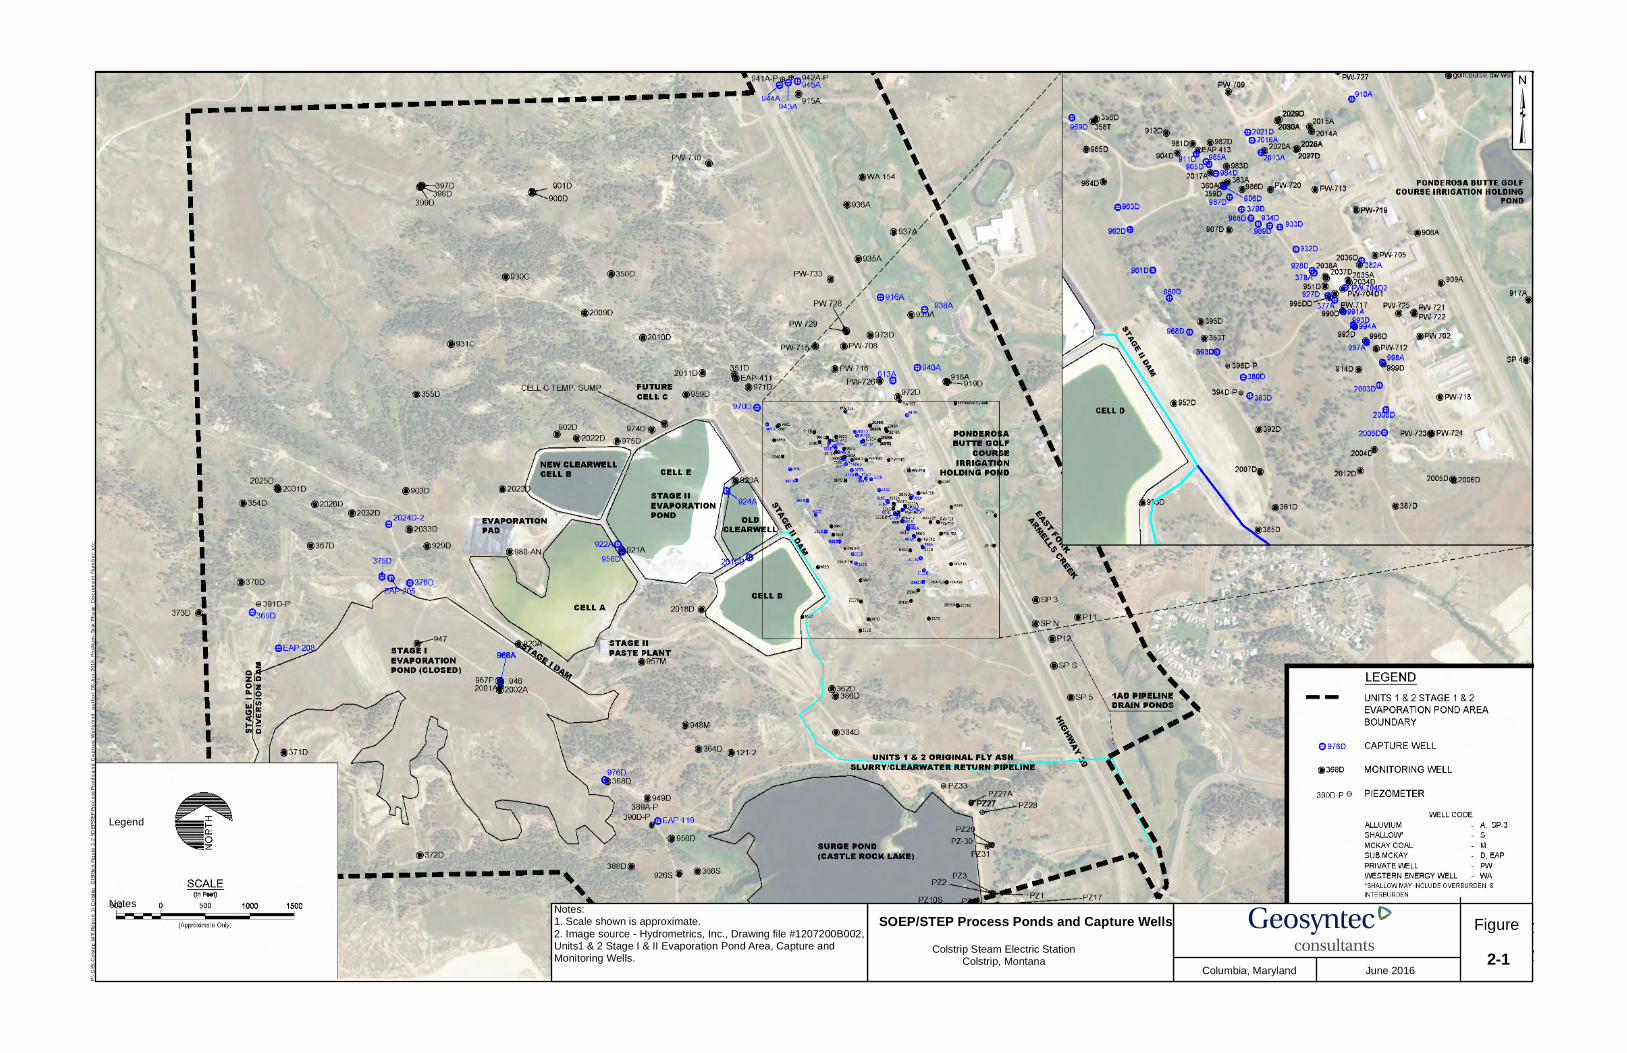
Figure
2-1
P:\GI
S\Co
lstrip
MT\R
epor
t 1\C
olstrip
_GISF
iles\
Figure
2-2 S
OEPS
TEP P
roce
ss Po
nds a
nd C
aptu
re W
ells.m
xd; a
utho
r; 09-J
un-20
16; P
rojNu
m-Ta
sk-Ph
ase;
Doc
umen
t Num
ber; e
tc.
Notes
Legend
Columbia, Maryland June 2016
³
SOEP/STEP Process Ponds and Capture WellsColstrip Steam Electric Station
Colstrip, Montana
Notes:1. Scale shown is approximate.
2. Image source - Hydrometrics, Inc., Drawing file #1207200B002,Units1 & 2 Stage I & II Evaporation Pond Area, Capture andMonitoring Wells.
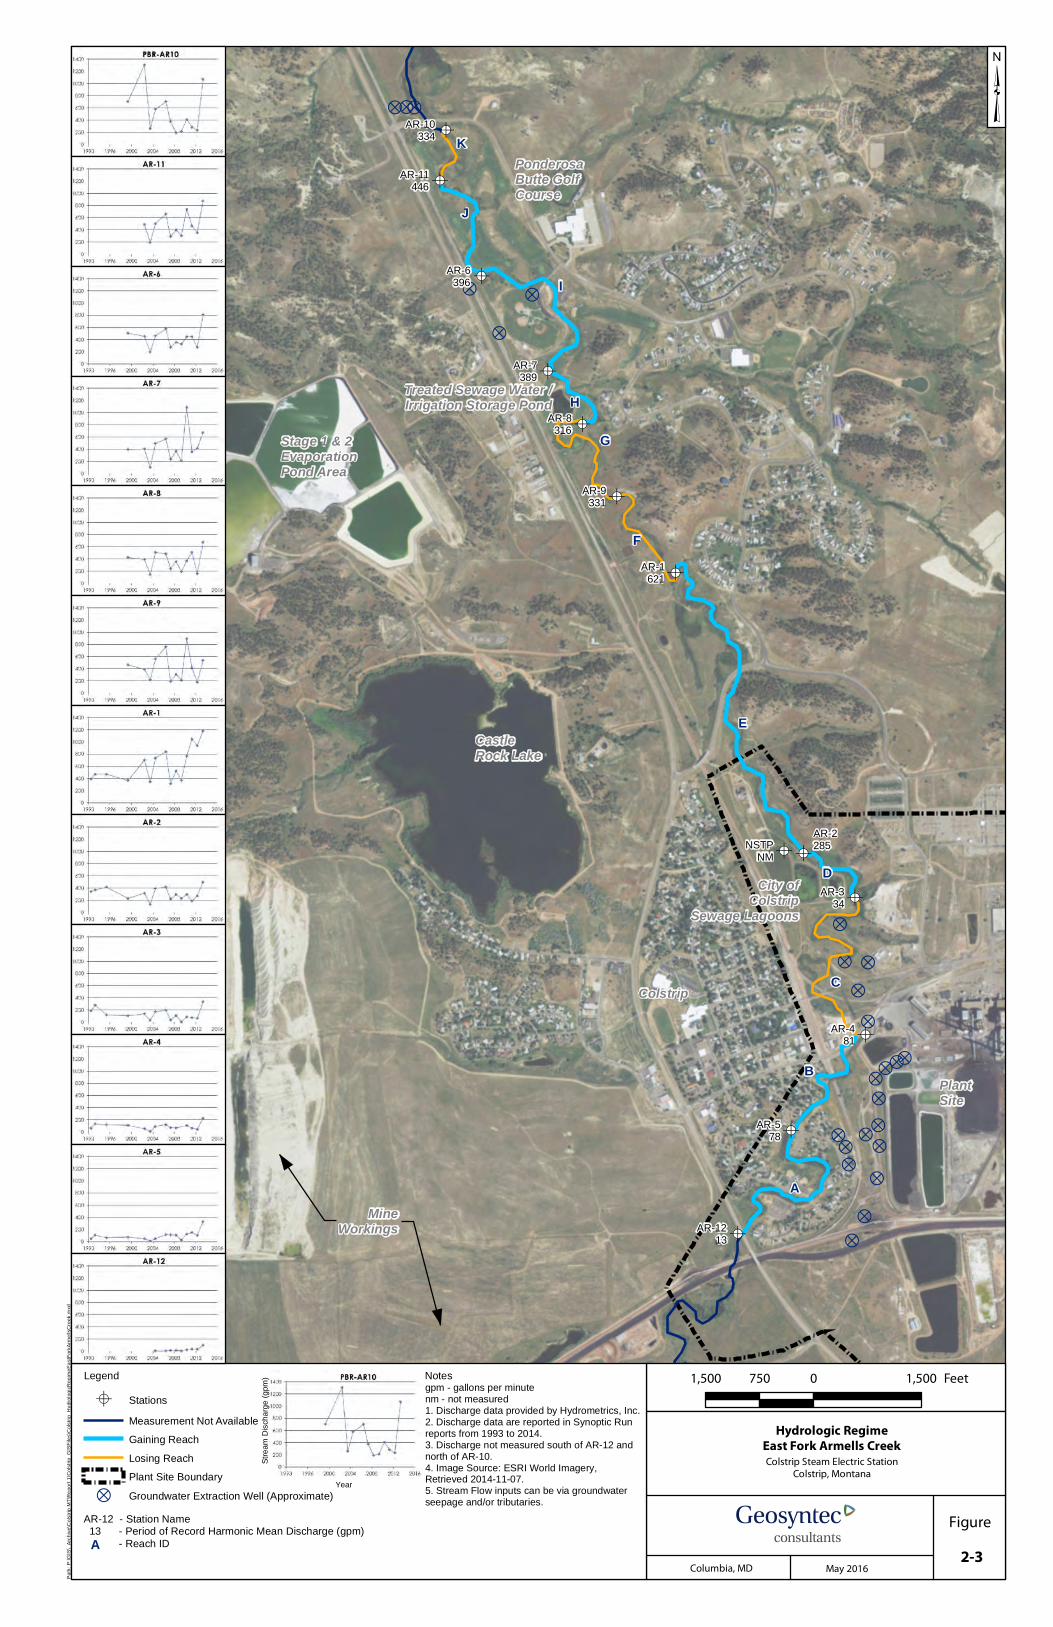
?
?
????
???
?????
?
?
??
?
?
? ?
???
!A
!A
!A
!A
!A
!A
!A
!A
!A
!A
!A
!A
!A
MineWorkings
AR-2285NSTP
NM
AR-10334
AR-11446
AR-6396
AR-7389
AR-8316
AR-9331
AR-1621
AR-334
AR-481
AR-578
AR-1213
A
B
C
D
E
F
G
H
I
J
K
Stage 1 & 2EvaporationPond Area
CastleRock Lake
City ofColstrip
Sewage Lagoons
Colstrip
PlantSite
Treated Sewage Water /Irrigation Storage Pond
PonderosaButte GolfCourse
Hydrologic RegimeEast Fork Armells CreekColstrip Steam Electric Station
Colstrip, Montana
Figure
2-3
NotesLegend
Columbia, MD
1,500 0 1,500750 Feet
³
Pa
th:
P:\
GIS
\_A
rch
ive
\Co
lstr
ip M
T\R
ep
ort
1\C
ols
trip
_G
ISF
ile
s\C
ols
trip
_H
yd
rolo
gic
Re
gim
eE
astF
ork
Arm
ells
Cre
ek
.mxd
May 2016
gpm - gallons per minutenm - not measured1. Discharge data provided by Hydrometrics, Inc. 2. Discharge data are reported in Synoptic Run reports from 1993 to 2014. 3. Discharge not measured south of AR-12 and north of AR-10.4. Image Source: ESRI World Imagery, Retrieved 2014-11-07.5. Stream Flow inputs can be via groundwaterseepage and/or tributaries.
AR-12 - Station Name 13 - Period of Record Harmonic Mean Discharge (gpm)
- Reach IDA
Str
ea
m D
isch
arg
e (
gp
m)
Year
!A Stations
Measurement Not Available
Gaining Reach
Losing Reach
Plant Site Boundary
? Groundwater Extraction Well (Approximate)
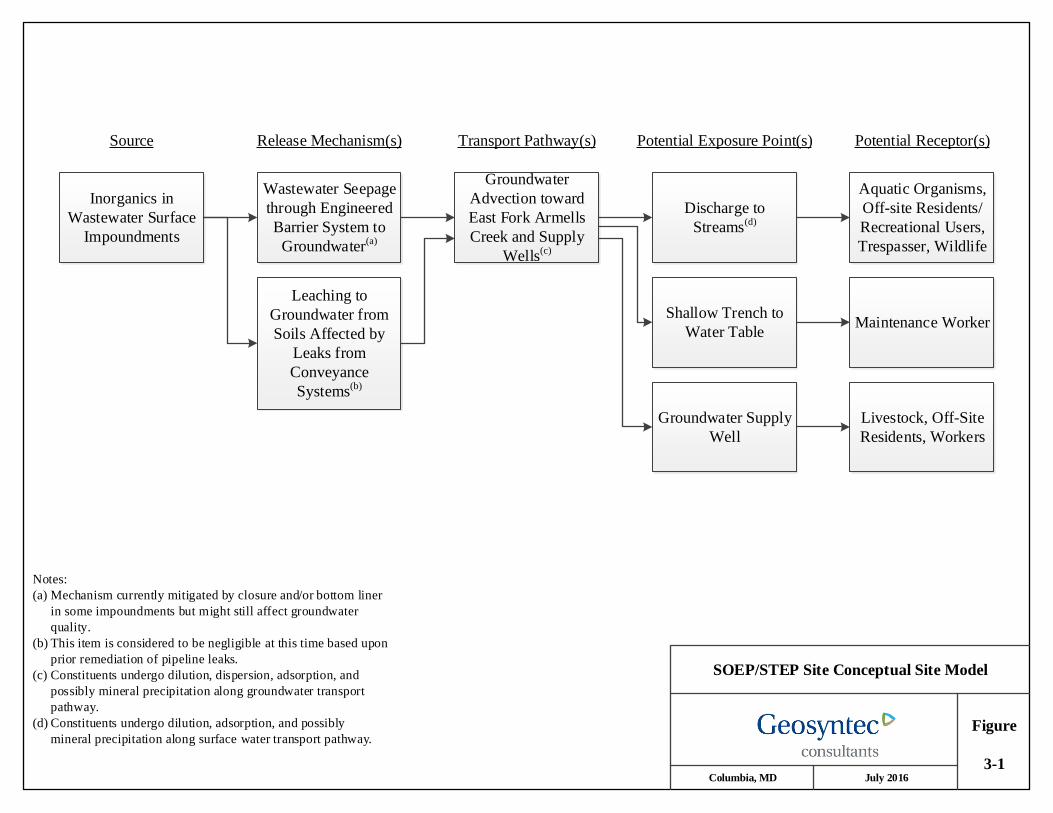
SOEP/STEP Site Conceptual Site Model
Figure
3-1Columbia, MD July 2016
Notes:
(a) Mechanism currently mitigated by closure and/or bottom liner
in some impoundments but might still affect groundwater
quality.
(b) This item is considered to be negligible at this time based upon
prior remediation of pipeline leaks.
(c) Constituents undergo dilution, dispersion, adsorption, and
possibly mineral precipitation along groundwater transport
pathway.
(d) Constituents undergo dilution, adsorption, and possibly
mineral precipitation along surface water transport pathway.
Inorganics in
Wastewater Surface
Impoundments
Wastewater Seepage
through Engineered
Barrier System to
Groundwater(a)
Groundwater
Advection toward
East Fork Armells
Creek and Supply
Wells(c)
Leaching to
Groundwater from
Soils Affected by
Leaks from
Conveyance
Systems(b)
Discharge to
Streams(d)
Aquatic Organisms,
Off-site Residents/
Recreational Users,
Trespasser, Wildlife
Groundwater Supply
Well
Livestock, Off-Site
Residents, Workers
Source Release Mechanism(s) Transport Pathway(s) Potential Exposure Point(s) Potential Receptor(s)
Maintenance WorkerShallow Trench to
Water Table
37 7/29/2016 MR1149D\Remedy Evaluation Work Plan - SOEP STEP
APPENDIX A
SOEP/STEP Site
Geologic Cross Sections
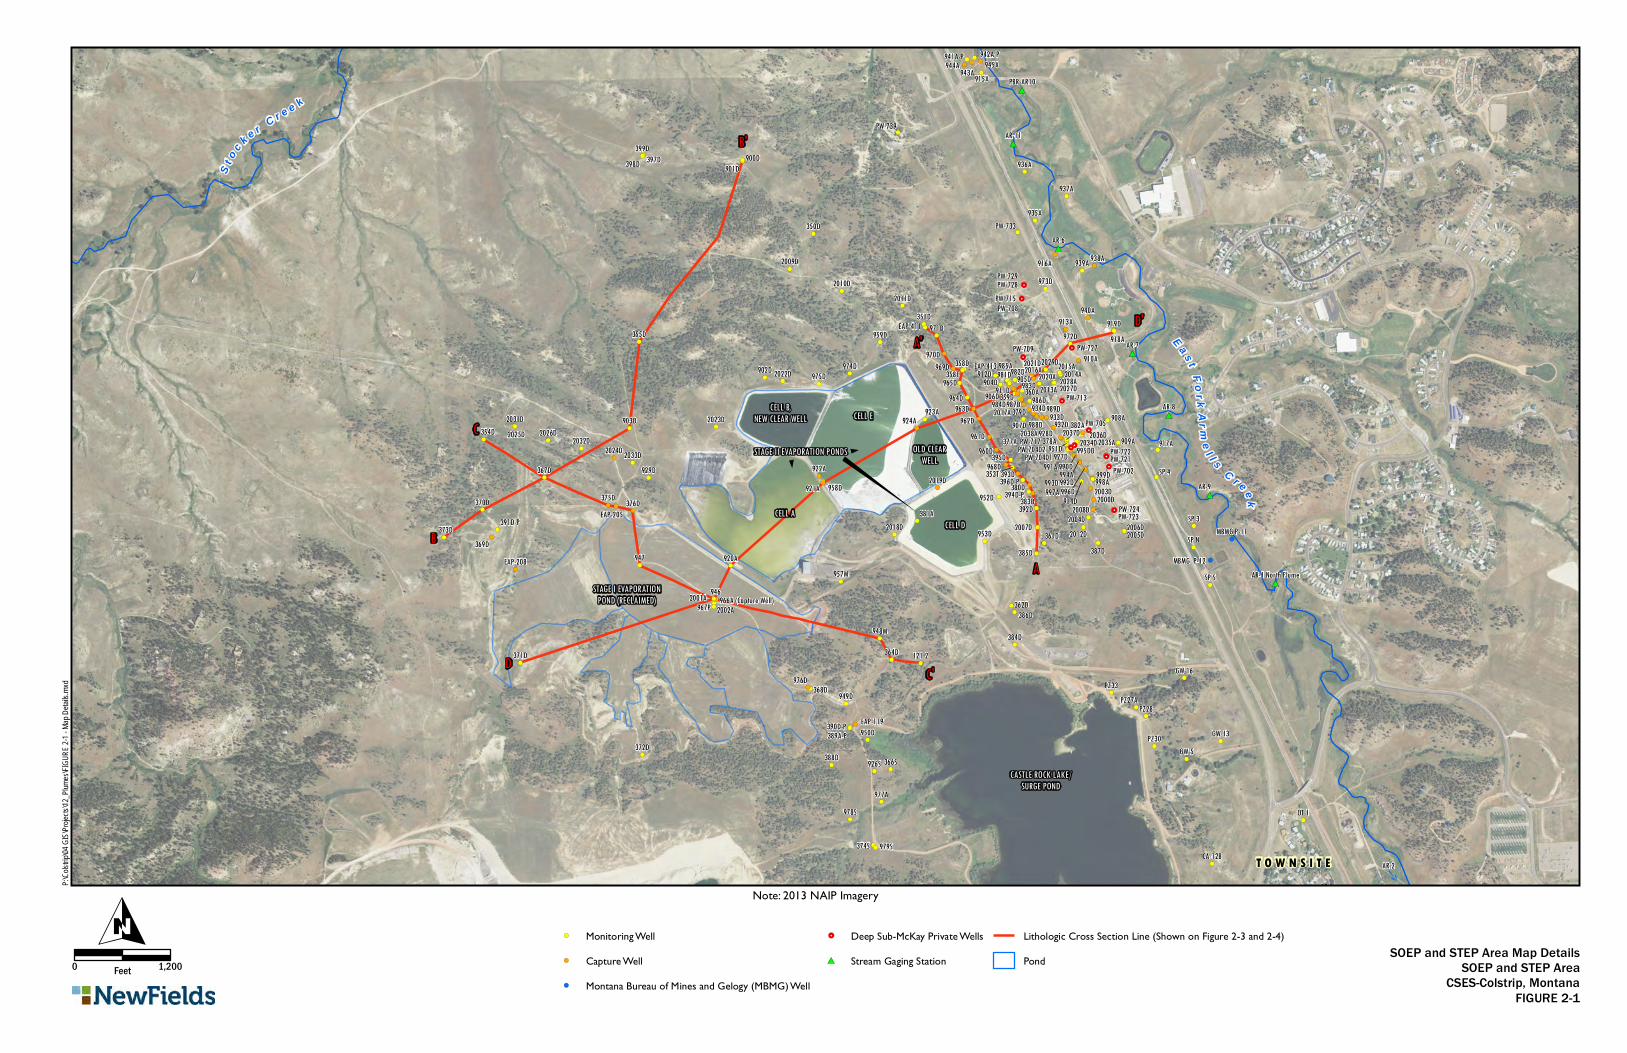
!(
!(
!(!(
!(
!(
!(!(!(
!(
!(
!(
!(
!(
!(
!(!(!(
!(
!(
!(
!(
!(!(
!(
!(
!(
!(
!(!(
!(
!(
!(
!(
!(!(
!(!(!(
!(
!(
!(
!(
!(
!(!(
!(!(
!(
!(
!(
!(
!(
!(
!(
!(
!(
!(
!(
!(
!(!(
!(
!(
!(
!(
!(
!(
!(
!(
!(
!(
!(
!(
!(!(
!(
!(
!(
!(
#*
#*
#*
!(
!(
!(!(!(!(!(
!(
!(
!(!(
!(
!( !(
!(
!(
!(
!(
!(
!(
!(
!(
!(
!(!(
!(
!(!(
!(
!(
!(
!(
!(
!(
!(
!(!(
!(
!(
!(
!(!(
!(
!( !(!(!(
!(
!(
!(
!(
!(
!(
!(
!(
!(
!(
!(
!(
!(
!(
!(
!(
!(
!(
!(!(
!(
!(
!(
!(
!(
!(
!(
!(
!(
!(
!(
!(
!( !(
!(!(
!(
!(!(
!(!(
!(!(!(!(!(
!(
!(!(
!(!(
#*
#*
#*
#*
!(
!(
!(
!(
!(
!(
!(
!(
!(
!(
!(
!(
!(
!.
!.
!.
!.
!.
!.
!.!.!.
!.!.
!.
!.!.
!(
!(
!(
!(
!(
!(
!(
!(
!(
!(
!(
E a s tFo r k
Ar m
el l s
C r e e k
CELL A
CASTLE ROCK LAKE/SURGE POND
CELL B,NEW CLEAR WELL CELL E
CELL D
STAGE I EVAPORATIONPOND (RECLAIMED)
STAGE II EVAPORATION PONDS
S to c k e r C r e e k
B
B'
C
C'D
D'A'
A
OLD CLEARWELL
PW-733
PW-739
T O W N S I T E
947
946
PZ30
SP S
SP N
SP 4
SP 3
PZ33
PZ28
OT-2
OT-1
GW-5
AR-7
AR-6
999D998A997A 996D
991A
989D988D
986D
985A
984D
981D
979S
978S977A
976D
975D974D
973D
972D971D
970D969D
968D
967P 966A (Capture Well)
965D964D
963D962D
961D960D
959D
958D
957M
953D
952D
951D
950D
949D
948M
945A944A943A
940A
939A 938A
937A
936A
935A
934D933D932D
929D927D
926S
924A923A
921A
920A
919D918A
917A
916A
915A
913A
912D910A
909A
908A903D
902D
901D900D
399D398D 397D
AR-9
AR-8
393D
392D
388D
387D
386D
385D
384D
383D
382A
381A376D375D
374S
373D
372D
371D
370D
369D
368D
367D
366S
364D
361D
358T
355D
354D
353T
351D
350D
PZ27A
GW-16
GW-13
AR-11
2036D
2033D2032D
2031D
2029D2028A2027D
2026D2025D2024D
2023D
2022D2021D
2019D
2018D 2012D
2011D2010D
2009D
2008D2007D 2006D2005D
2003D
2002A
121-2
PW-729PW-728
PW-727
PW-724
PW-722PW-721
PW-715
PW-713
PW-709
PW-708
PW-702
CA-12B
394D-P
391D-P
390D-P389A-P
EAP-208
EAP-205
PBR-AR10
MBMG P-11
MBMG P-12
AR-2
AR-1 North Flume
994A993D 992D
990D
987D983D
982D
928D
922A
914D
911D
907D
906D905D904D
395D
380D
379D
378A377A
362D
360A359D
358D
995DD2038A 2037D
2035A2034D
2020A
2017A
2016A 2015A2014A2013A
2004D
2001A
2000DPW-723
PW-717PW-705
942A-P941A-P
396D-P
EAP-413
EAP-411
EAP-119
PW-704D2PW-704D1
SOEP and STEP Area Map DetailsSOEP and STEP Area
CSES-Colstrip, MontanaFIGURE 2-1
0 1,200Feet
O
P:\Co
lstrip\0
4 GIS\
Projec
ts\12_P
lumes\
FIGUR
E 2-1 -
Map D
etails.
mxd
Note: 2013 NAIP Imagery
!( Monitoring Well!( Capture Well!( Montana Bureau of Mines and Gelogy (MBMG) Well
!. Deep Sub-McKay Private Wells#* Stream Gaging Station
Lithologic Cross Section Line (Shown on Figure 2-3 and 2-4)
Pond
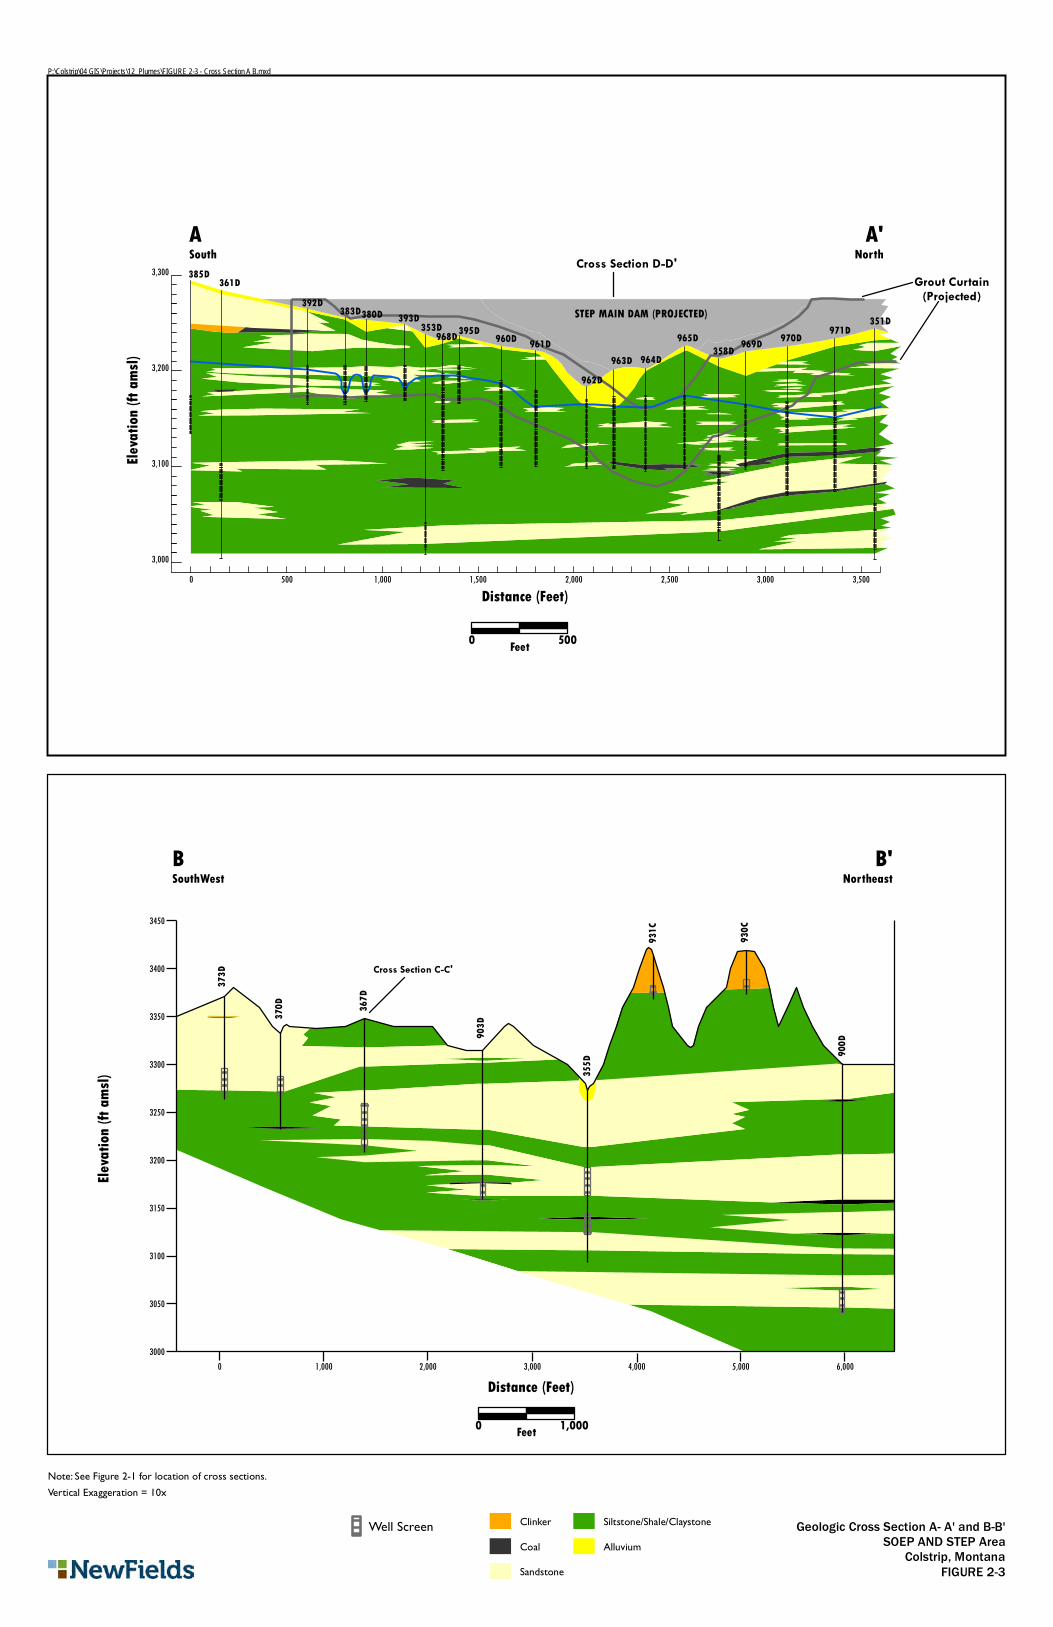
Geologic Cross Section A- A' and B-B'SOEP AND STEP Area
Colstrip, MontanaFIGURE 2-3
Vertical Exaggeration = 10xNote: See Figure 2-1 for location of cross sections.
Elevat
ion (ft
amsl)
930C
931C
370D
373D
367D
903D
355D
900D
BSouthWest
B'Northeast
Distance (Feet)0 1,000 2,000 3,000 4,000 5,000 6,000
Cross Section C-C'
3450
3400
3350
3300
3250
3200
3150
3100
3050
3000
P:\Colstrip\04 GIS\Projects\12_Plumes\FIGURE 2-3 - Cross Section A B.mxd
STEP MAIN DAM (PROJECTED)
03,000
3,100
3,200
3,300
500 1,000 1,500 2,000 2,500 3,000 3,500
385D 361D
383D380D 393D 353D968D395D 960D 961D
962D963D 964D
965D358D 969D 970D 971D 351D
ASouth
A'North
Elevat
ion (ft
amsl)
392D
Distance (Feet)
Grout Curtain(Projected)
Cross Section D-D'
0 1,000Feet
Clinker
Coal
Sandstone
Siltstone/Shale/Claystone
AlluviumWell Screen
Feet0 500
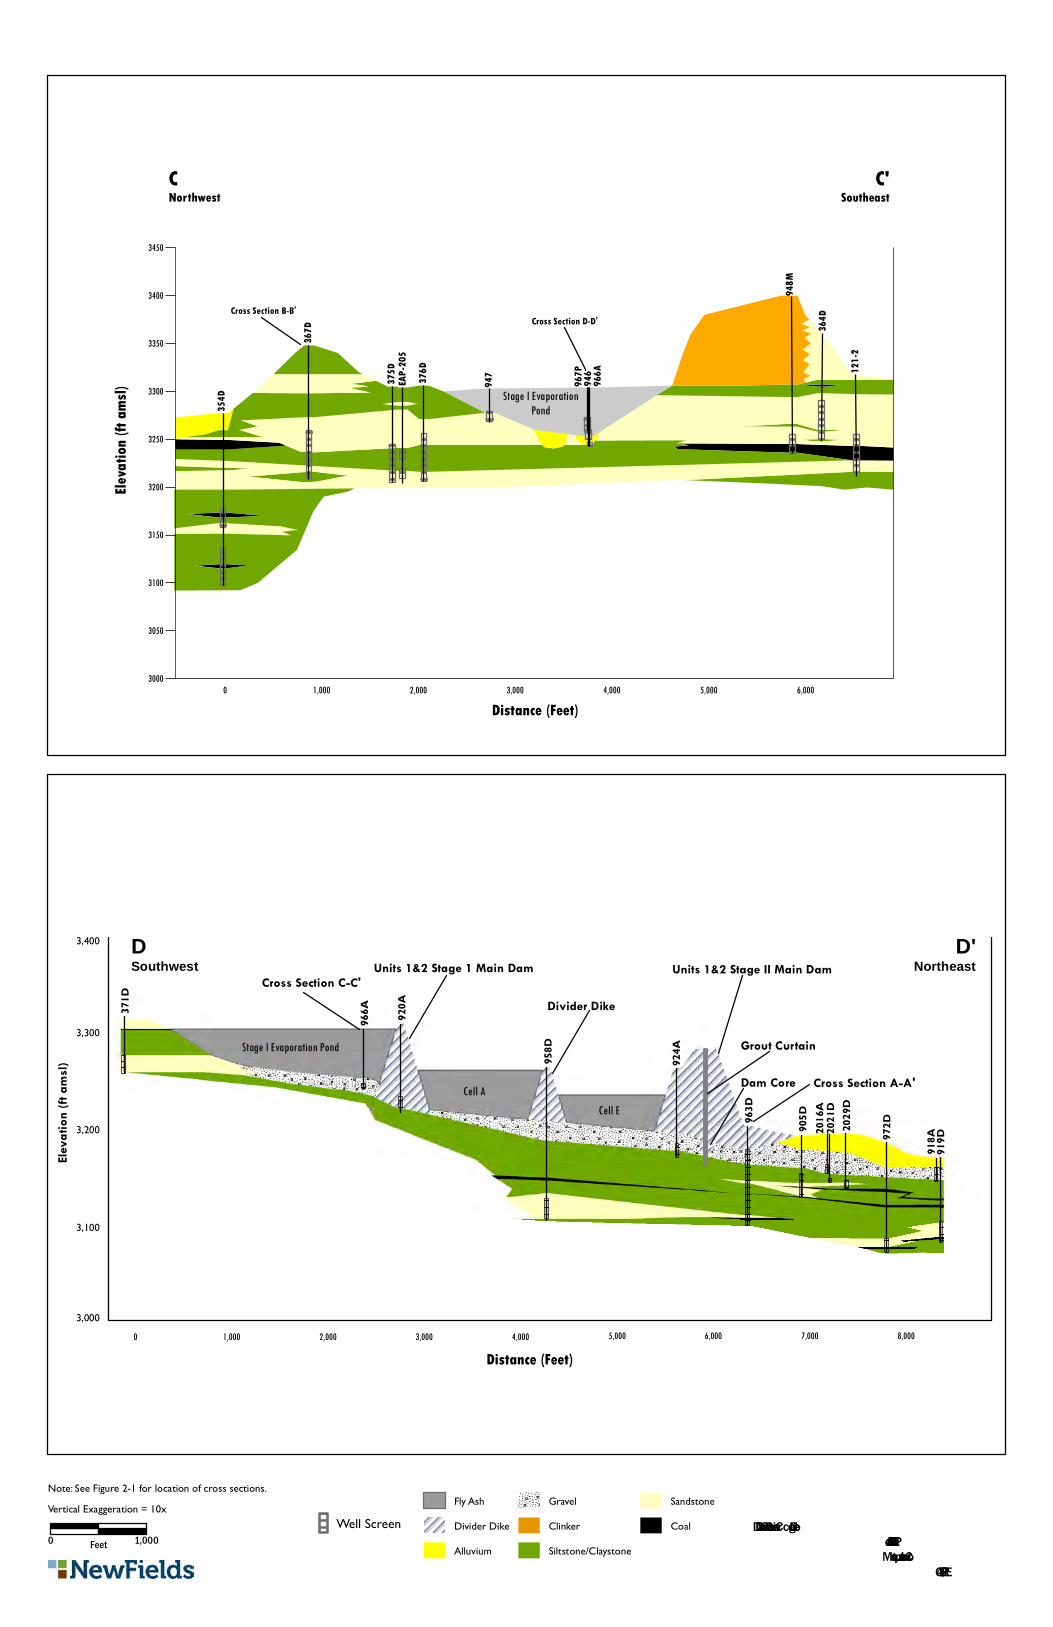
Geologic Cross Sections C-C’ and D-D’ SOEP and STEP AreaColstrip, Montana
FIGURE 2-4
0 1,000Feet
Note: See Figure 2-1 for location of cross sections.
Elevat
ion (ft
amsl)
CNorthwest
C'Southeast
Distance (Feet)0 1,000 2,000 3,000 4,000 5,000 6,000
Stage l EvaporationPond
Cross Section B-B'Cross Section D-D'
367D 36
4D
121-2
375D 376D
946
947
354D
948M
966A
EAP-2
05
967P
3450
3400
3350
3300
3250
3200
3150
3100
3050
3000
958D
963D
2029
D
371D
924A
905D
920A
919D97
2D
966A
Eleva
tion (
ft ams
l)
DSouthwest
D'Northeast
3,100
3,300
3,000
3,400
3,200
Units 1&2 Stage 1 Main Dam
Divider Dike
Units 1&2 Stage II Main Dam
Grout Curtain
Distance (Feet)0 1,000 2,000 3,000 4,000 5,000 6,000 7,000 8,000
918A20
21D
2016
A
Dam Core
Stage l Evaporation Pond
Cell ACell E
Cross Section A-A'
Cross Section C-C'
Fly Ash
Divider Dike
Alluvium
Gravel
Clinker
Siltstone/Claystone
Sandstone
CoalWell ScreenVertical Exaggeration = 10x
38 7/29/2016 MR1149D\Remedy Evaluation Work Plan - SOEP STEP
APPENDIX B
SOEP/STEP Figures Showing
Interpreted Extent of Indicator Parameters
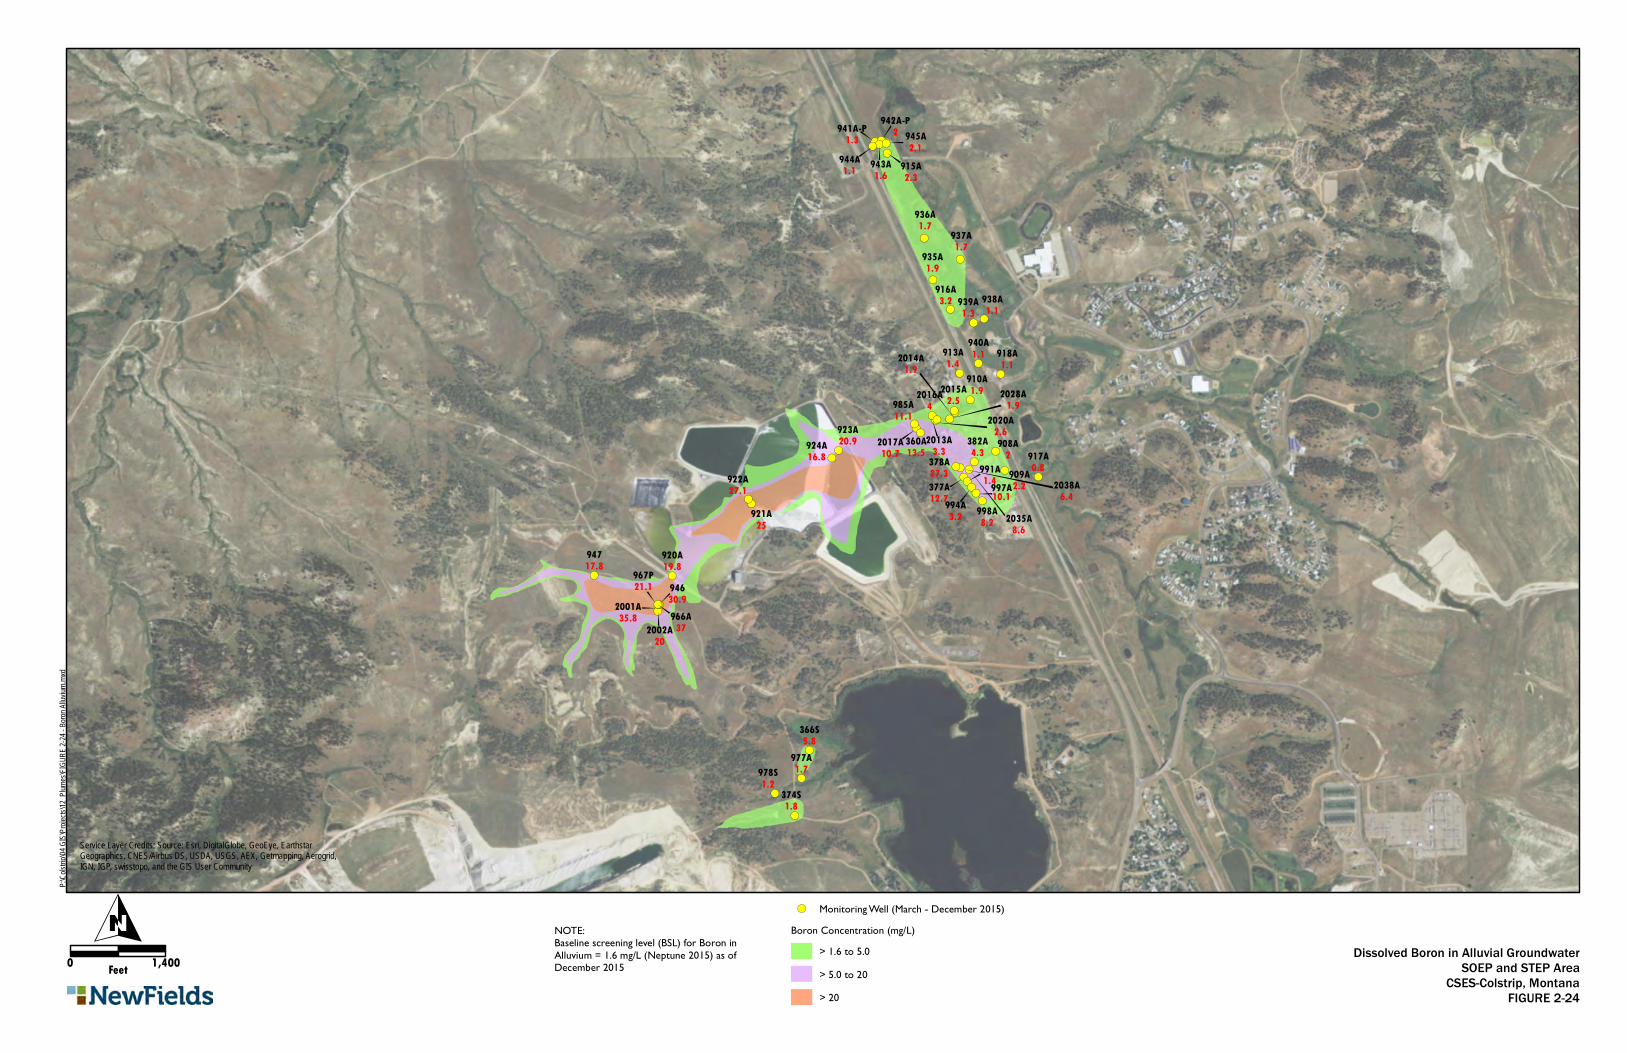
!(!(
!(!(!(!(
!(!( !(
!(!(
!(
!(
!(
!(!(
!(!(
!(
!(
!(
!(
!(
!(
!(
!(
!(!(
!(!(
!(!(
!(
!(!(!(!( !(
!(
!(
!(!(
!(
!(
!(
!(!(!(!(
!(
!(
!(
937A1.7
935A1.9
936A1.7
2001A35.8
2002A20
2013A3.3
2014A1.9
2015A2.52016A
4
2017A10.7
2020A2.6
2028A1.9
2035A8.6
2038A6.4
360A13.5
366S5.8
374S1.8
377A12.7
378A27.3
382A4.3 908A
2909A2.2
910A1.9
913A1.4
915A2.3
916A3.2
917A0.8
918A1.1
920A19.8
921A25
922A27.1
923A20.9924A
16.8
938A1.1939A
1.3
940A1.1
941A-P1.3
942A-P2
943A1.6
944A1.1
945A2.1
94630.9
94717.8
966A37
967P21.1
977A1.7978S
1.2
985A11.1
991A1.4
994A3.2
997A10.1998A8.2
Dissolved Boron in Alluvial GroundwaterSOEP and STEP Area
CSES-Colstrip, MontanaFIGURE 2-24
!( Monitoring Well (March - December 2015)Boron Concentration (mg/L)
> 1.6 to 5.0> 5.0 to 20> 20
Service Layer Credits: Source: Esri, DigitalGlobe, GeoEye, EarthstarGeographics, CNES/Airbus DS, USDA, USGS, AEX, Getmapping, Aerogrid,IGN, IGP, swisstopo, and the GIS User Community
P:\Co
lstrip\0
4 GIS\
Projec
ts\12_P
lumes\
FIGUR
E 2-24
- Boro
n Alluv
ium.mx
d
O0 1,400Feet
NOTE:Baseline screening level (BSL) for Boron inAlluvium = 1.6 mg/L (Neptune 2015) as ofDecember 2015
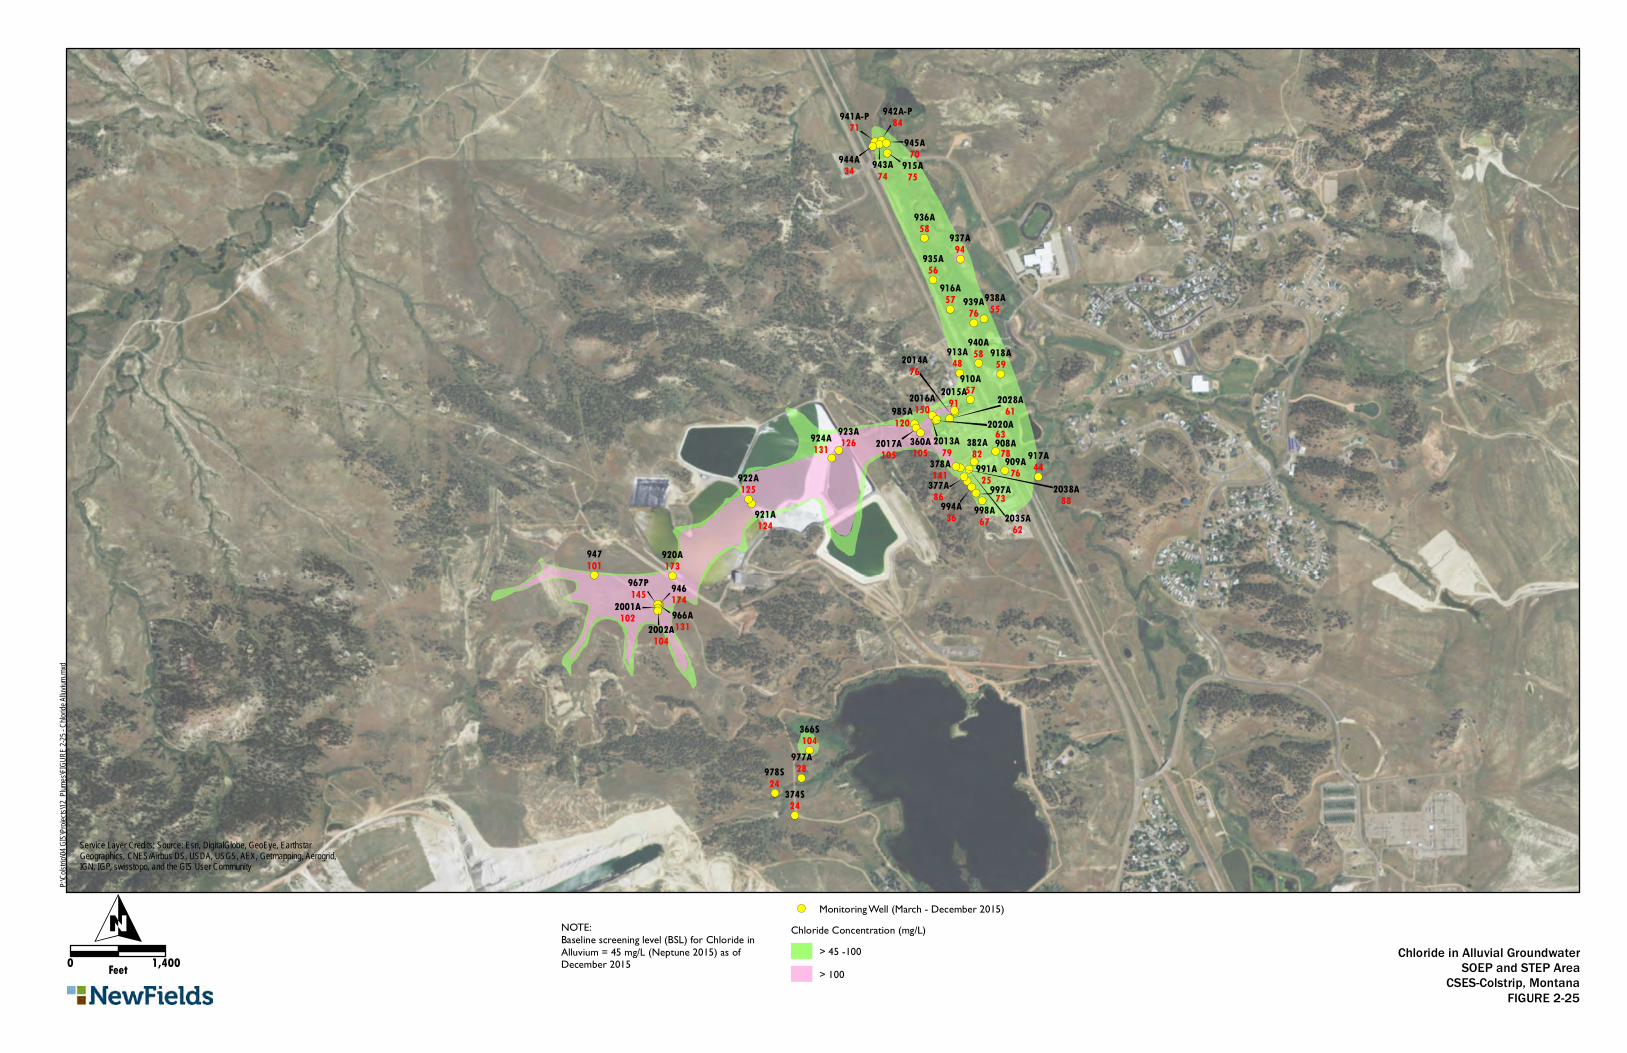
!(
!(
!(
!(
!(
!(
!(
!(
!(
!(!(
!(!(
!(
!(
!(
!(!(
!(
!(!(!(!( !(
!(
!(
!(!(
!(
!(
!(
!(!(!(!(
!(!(
!(!(!(!(
!(!( !(
!(!(
!(
!(
!(
!(!(
!(
382A82
374S24
998A67
978S24
977A28
947101
946174
940A58
939A76
938A55
937A94
936A58
935A56
918A59
917A44
916A57
913A48
910A57
909A76378A
141
366S104
360A105
924A131
923A126
922A125
921A124
920A173
2002A104
377A86 997A73994A
36
991A25
945A70944A
34 943A74
915A75
908A78
2038A88
2035A62
2028A61
2020A63
2015A91
2014A76
2013A79
985A120
967P145
966A131
2017A105
2016A150
2001A102
942A-P84941A-P
71
!( Monitoring Well (March - December 2015)Chloride Concentration (mg/L)
> 45 -100> 100
Service Layer Credits: Source: Esri, DigitalGlobe, GeoEye, EarthstarGeographics, CNES/Airbus DS, USDA, USGS, AEX, Getmapping, Aerogrid,IGN, IGP, swisstopo, and the GIS User Community
P:\Co
lstrip\0
4 GIS\
Projec
ts\12_P
lumes\
FIGUR
E 2-25
- Chlo
ride All
uvium
.mxd
O0 1,400Feet
Chloride in Alluvial GroundwaterSOEP and STEP Area
CSES-Colstrip, MontanaFIGURE 2-25
NOTE:Baseline screening level (BSL) for Chloride inAlluvium = 45 mg/L (Neptune 2015) as ofDecember 2015
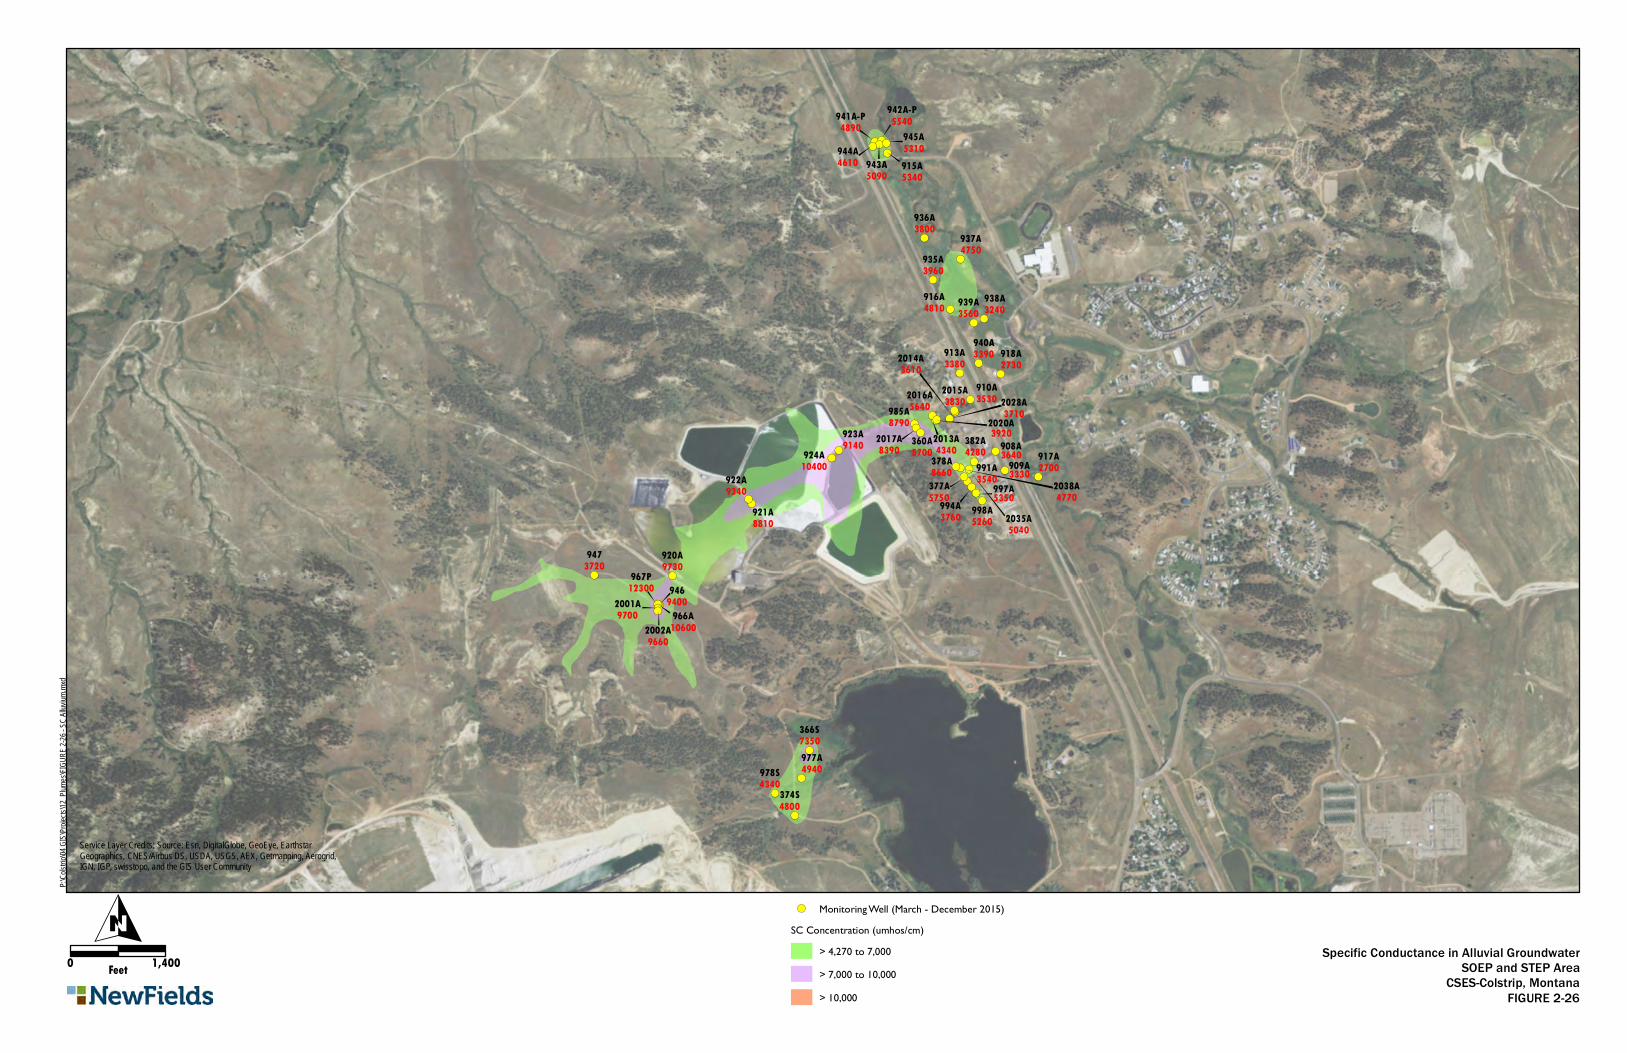
!(
!(!(!(!( !(
!(
!(
!(!(
!(
!(
!(
!(!(!(!(
!(!(
!(!(!(!(
!(!( !(
!(!(
!(
!(
!(
!(!(
!(!(
!(
!(
!(
!(
!(
!(
!(
!(
!(!(
!(!(
!(
!(
!(
!(!(
944A4610
966A10600
940A3390
941A-P4890
942A-P5540
943A5090
945A5310
9469400
9473720
967P12300
977A4940978S
4340
985A8790
991A3540
994A3760
997A5350998A5260
2001A9700
2002A9660
2013A4340
2014A3610
2015A38302016A
5640
2017A8390
2020A3920
2028A3710
2035A5040
2038A4770
360A8700
366S7350
374S4800
377A5750
378A8660
382A4280 908A3640
909A3330
910A3530
913A3380
915A5340
916A4810
917A2700
918A2730
920A9730
921A8810
922A9340
923A9140
924A10400
935A3960
936A3800
937A4750
938A3240939A
3560
!( Monitoring Well (March - December 2015)SC Concentration (umhos/cm)
> 4,270 to 7,000> 7,000 to 10,000> 10,000
Service Layer Credits: Source: Esri, DigitalGlobe, GeoEye, EarthstarGeographics, CNES/Airbus DS, USDA, USGS, AEX, Getmapping, Aerogrid,IGN, IGP, swisstopo, and the GIS User Community
P:\Co
lstrip\0
4 GIS\
Projec
ts\12_P
lumes\
FIGUR
E 2-26
- SC A
lluvium
.mxd
O0 1,400Feet
Specific Conductance in Alluvial GroundwaterSOEP and STEP Area
CSES-Colstrip, MontanaFIGURE 2-26
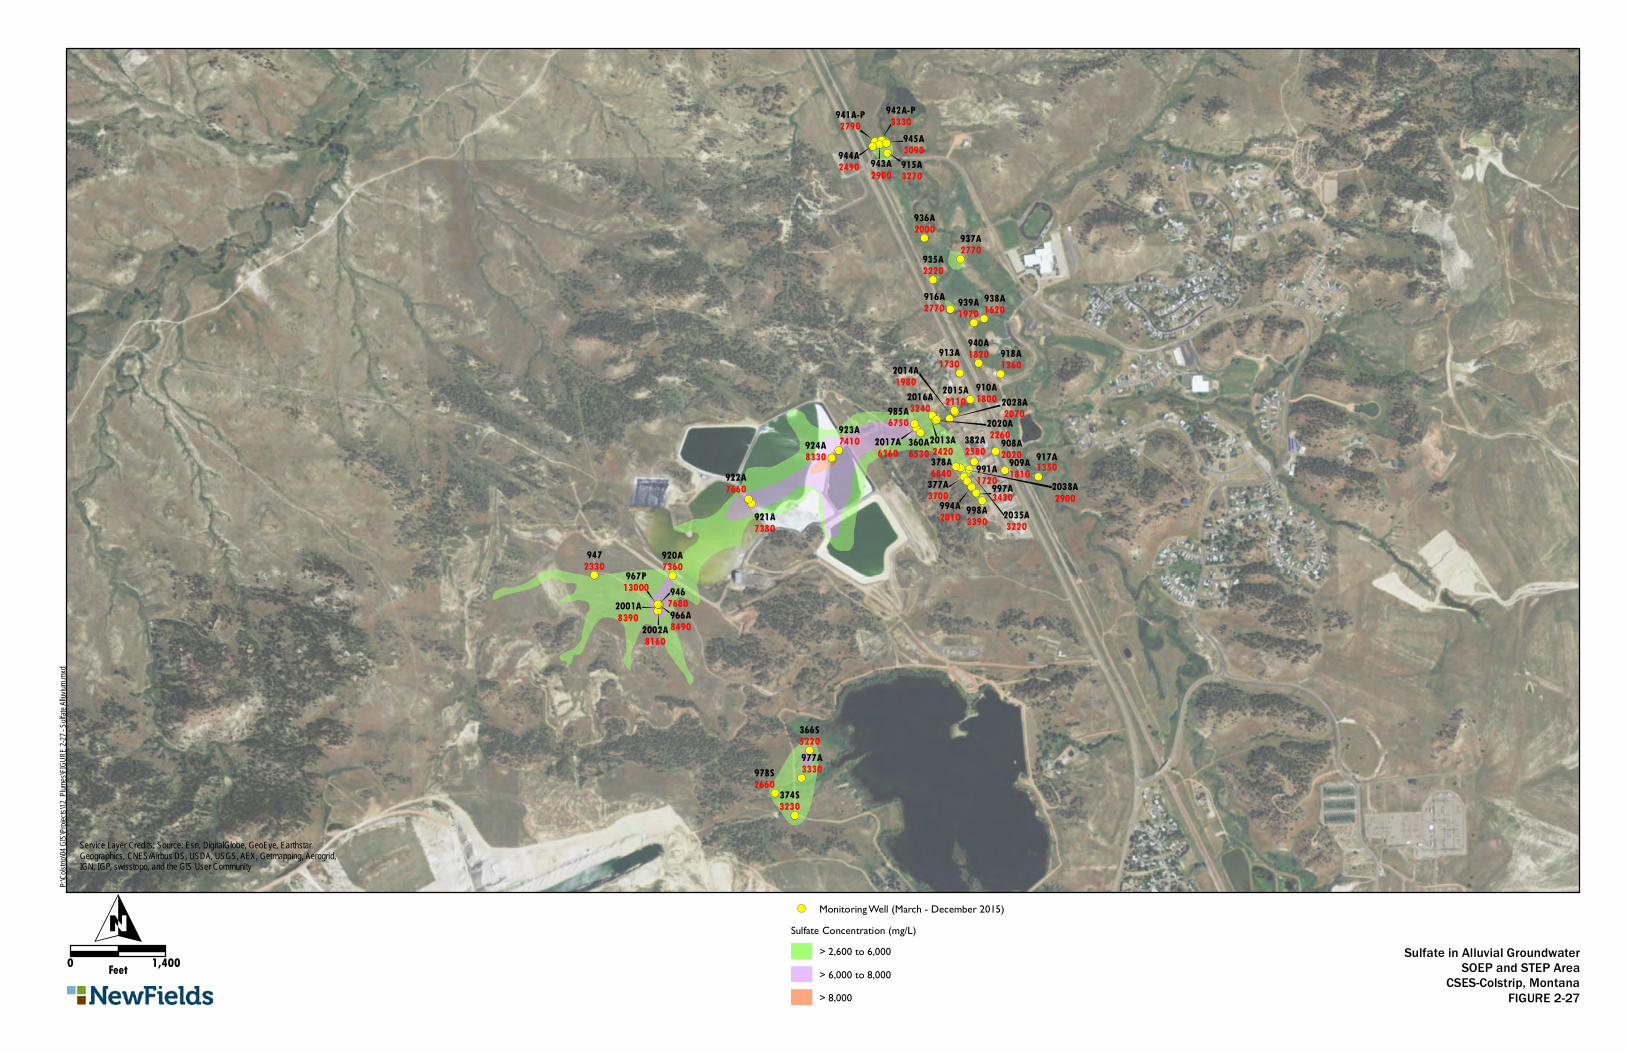
!(!(
!(!(!(!(
!(!( !(
!(!(
!(
!(
!(
!(!(
!(!(
!(
!(
!(
!(
!(
!(
!(
!(
!(!(
!(!(
!(!(
!(
!(!(!(!( !(
!(
!(
!(!(
!(
!(
!(
!(!(!(!(
!(
!(
!(
966A8490
2001A8390
2002A8160
2013A2420
2014A1980 2015A
21102016A3240
2017A6360
2020A2260
2028A2070
2035A3220
2038A2900
360A6530
366S5220
374S3230
377A3700
378A6840
382A2580 908A
2020909A1810
910A1800
913A1730
915A3270
916A2770
917A1350
918A1360
920A7360
921A7380
922A7660
923A7410924A
8330
938A1620939A
1970
940A1820
941A-P2790
942A-P3330
943A2900
944A2490
945A3090
9467680
9472330
967P13000
977A3330978S
2660
985A6750
991A1720
994A2010
997A3430998A3390
935A2220
936A2000 937A
2770
!( Monitoring Well (March - December 2015)Sulfate Concentration (mg/L)
> 2,600 to 6,000> 6,000 to 8,000> 8,000
Service Layer Credits: Source: Esri, DigitalGlobe, GeoEye, EarthstarGeographics, CNES/Airbus DS, USDA, USGS, AEX, Getmapping, Aerogrid,IGN, IGP, swisstopo, and the GIS User Community
P:\Co
lstrip\0
4 GIS\
Projec
ts\12_P
lumes\
FIGUR
E 2-27
- Sulfa
te Alluv
ium.mx
d
O0 1,400Feet
Sulfate in Alluvial GroundwaterSOEP and STEP Area
CSES-Colstrip, MontanaFIGURE 2-27
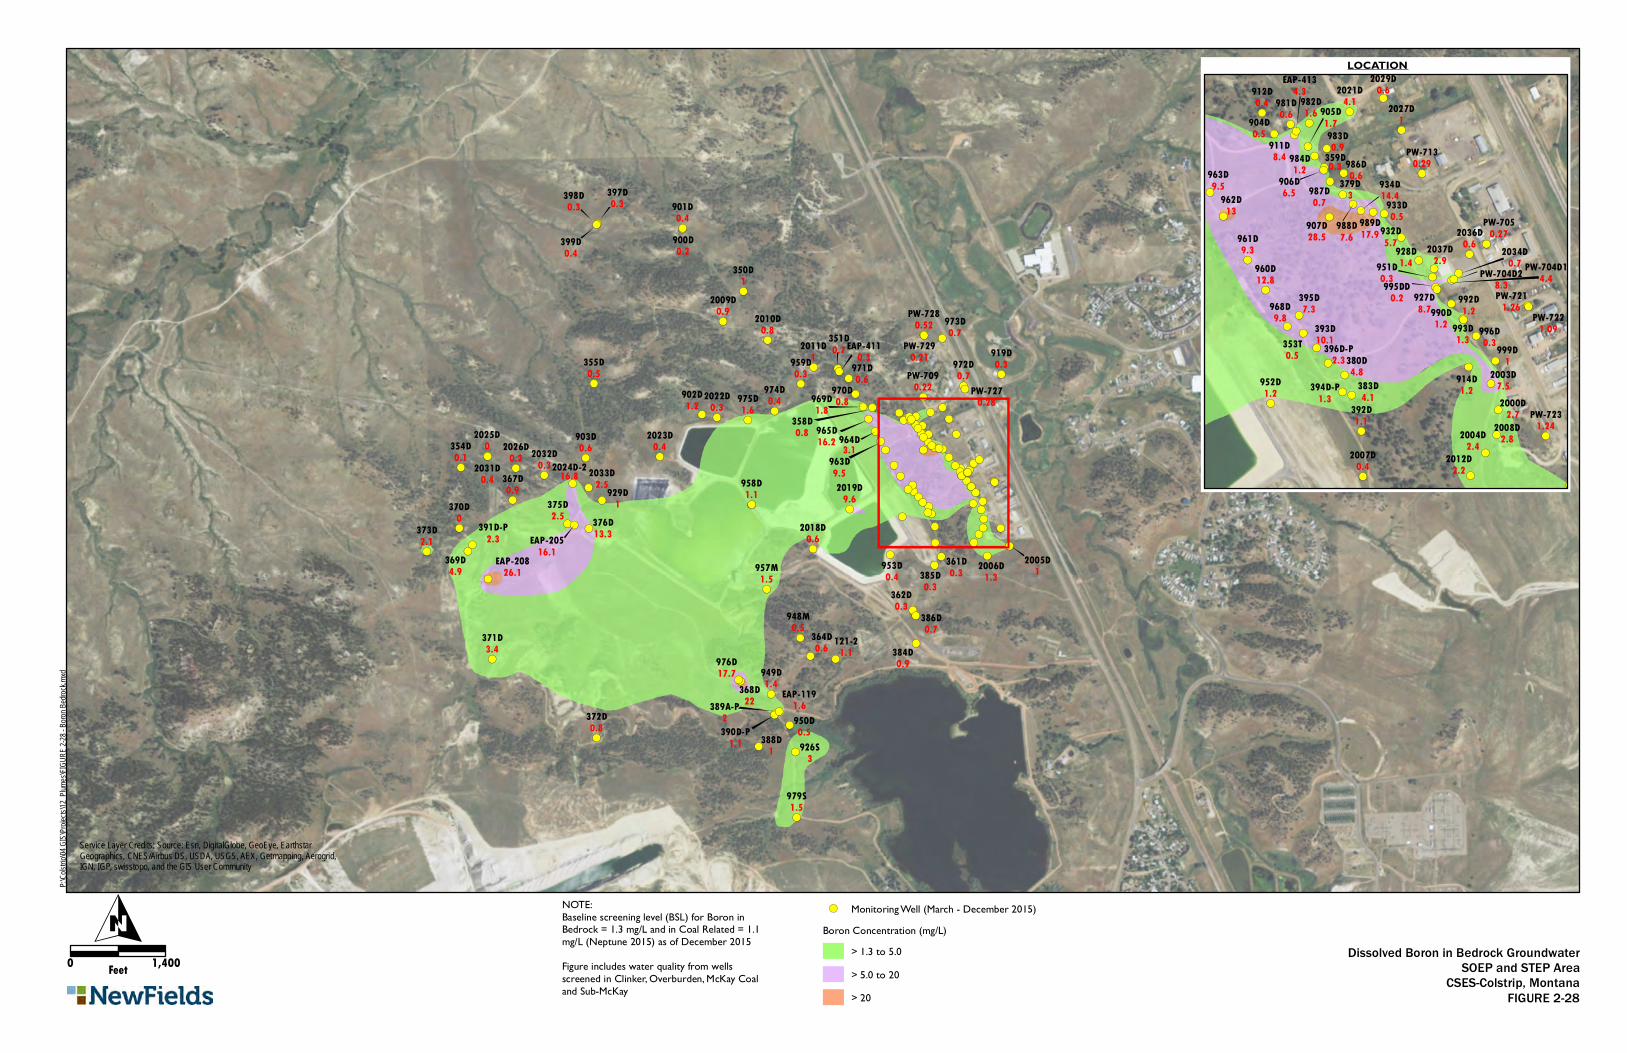
!(
!(!(
!(!(!(!(
!(
!(
!(
!(
!(!(
!(
!(!(
!(!(!(
!(!(
!(
!(!(
!(!(!(
!(
!(
!(
!(
!(
!(
!(
!(
!(
!(
!(
!(
!(
!(
!(
!(
!(
!( !(
!(
!(!(
!(
!(
!(
!(
!(
!(!(
!(
!(
!(
!(
!(
!(
!(!(!(
!(
!(!(
!(
!(
!( !(!(
!(
!(!(
!(
!(
!(
!(!(
!(
!(!(!(
!(
!(
!(
!(
!(
!(
!(
!(
!(
!(!(
!(!(!(
!(
!(
!(
!(
!(!(
!(
!(!(
!(
!(
!(!(!(!(!(!(!(!(
!(!(!(
!(
!(!(
!(
!(
!(
!(
!(
!(!(
!(
!(
!(
!(!(
!(
!(
!(!(
929D1
926S3
370D0
350D1
368D22
2025D0
2011D1
2005D1
979S1.5
975D1.6
974D0.4
973D0.7
972D0.7
969D1.8
958D1.1
957M1.5
953D0.4
950D0.5
949D1.4
948M0.5
919D0.3
903D0.6
902D1.2
901D0.4
386D0.7
385D0.3
384D0.9
375D2.5
373D2.1
372D0.8
371D3.4
369D4.9
367D0.9
355D0.5
354D0.1
376D13.3
2032D0.3
2026D0.2
2023D0.4
2019D9.6
2018D0.6
2010D0.8
2009D0.9
121-21.1
EAP-20826.1
388D1
971D0.6
970D0.8
964D3.1
963D9.5
959D0.3
900D0.2
399D0.4
398D0.3
397D0.3
389A-P2
364D0.6
362D0.3
361D0.3
358D0.8
351D0.7
976D17.7
965D16.2
2033D2.5
2031D0.4
2022D0.3
2006D1.3
391D-P2.3
390D-P1.1
PW-7290.21
PW-7280.52
PW-7270.28
PW-7090.22
EAP-4110.3
EAP-1191.6
EAP-20516.1
2024D-216.8
!( Monitoring Well (March - December 2015)Boron Concentration (mg/L)
> 1.3 to 5.0> 5.0 to 20> 20
Service Layer Credits: Source: Esri, DigitalGlobe, GeoEye, EarthstarGeographics, CNES/Airbus DS, USDA, USGS, AEX, Getmapping, Aerogrid,IGN, IGP, swisstopo, and the GIS User Community
P:\Co
lstrip\0
4 GIS\
Projec
ts\12_P
lumes\
FIGUR
E 2-28
- Boro
n Bedr
ock.mx
d
O0 1,400Feet
!(
!(
!(
!(!(!(
!(
!(
!(
!(
!(
!(
!(
!(
!(
!(
!(
!(
!(
!(
!(
!(
!(
!(
!(!(
!(
!(
!(
!(
!(
!(
!(
!(
!(!(
!(
!(
!(
!(
!(
!(
!(
!( !(
!(!(
!(!(
!(!(
!(
!(!(
!(
!(
!(
!(
!(!(
!(
!(
!(
!(!(
!(
999D1
379D3962D
13
2027D1
996D0.3
993D1.3
992D1.2
987D0.7
984D1.2
982D1.6
981D0.6
968D9.8
964D3.1
963D9.5
961D9.3
952D1.2
951D0.3
933D0.5
932D5.7928D
1.4
927D8.7
914D1.2
912D0.4
911D8.4
905D1.7904D
0.5
395D7.3
392D1.1
383D4.1
380D4.8
361D0.3
353T0.5
989D17.9
960D12.8
907D28.5
393D10.1
2036D0.6
2029D0.62021D
4.1
2012D2.2
2008D2.8
2007D0.4
2004D2.4
2003D7.52000D
2.7
394D-P1.3
PW-7231.24
PW-7221.09
PW-7211.26
PW-7130.29
PW-7050.27
990D1.2
988D7.6
986D0.6
983D0.9
906D6.5
359D0.3
995DD0.2
934D14.4
2037D2.9 2034D
0.7
396D-P2.3
EAP-4134.3
PW-704D28.3
PW-704D14.4
Dissolved Boron in Bedrock GroundwaterSOEP and STEP Area
CSES-Colstrip, MontanaFIGURE 2-28
NOTE:Baseline screening level (BSL) for Boron inBedrock = 1.3 mg/L and in Coal Related = 1.1mg/L (Neptune 2015) as of December 2015Figure includes water quality from wellsscreened in Clinker, Overburden, McKay Coaland Sub-McKay
LOCATION
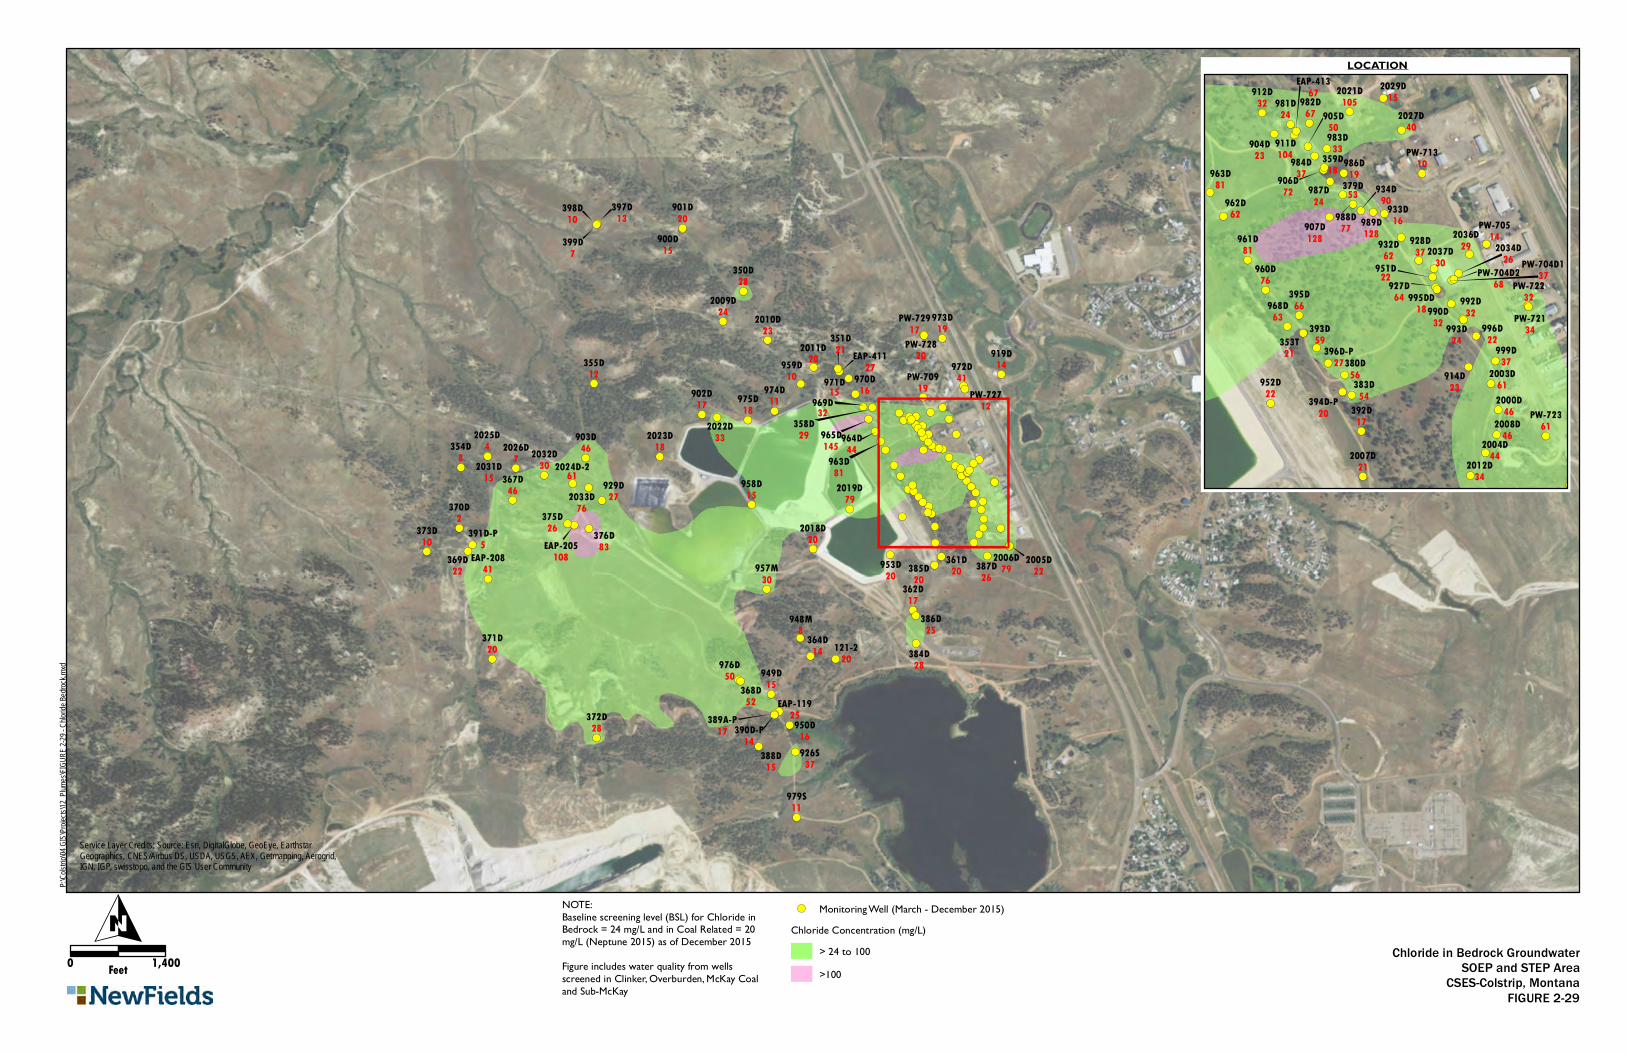
!(!(
!(
!(
!( !(!(
!(
!(!(
!(
!(
!(
!(!(
!(
!(!(!(
!(
!(
!(
!(
!(
!(
!(
!(
!(
!(!(
!(!(!(
!(
!(
!(
!(
!(!(
!(
!(!(
!(
!(
!(!(!(!(!(!(!(!(
!(!(!(
!(
!(!(
!(
!(
!(
!(
!(
!(!(
!(
!(
!(
!(!(
!(
!(
!(!(
!(
!(!(
!(!(!(!(
!(
!(
!(
!(
!(!(
!(
!(!(
!(!(!(
!(!(
!(
!(!(
!(!(!(
!(
!(
!(
!(
!(
!(
!(
!(
!(
!(
!(
!(
!(
!(
!(
!(
!(
!( !(
!(
!(!(
!(
!(
!(
!(
!(
!(
!(
!(
!(
!(
!(
!(
!(
!(
!(!(!(
399D7
370D2
354D8
948M8
398D10
397D13
388D15
387D26
386D25
385D20
384D28
376D83
375D26373D
10
372D28
371D20
369D22
368D52
367D46
364D14
358D29
355D12
351D21
350D28
2026D7
2025D4
979S11
976D50
975D18
974D11
973D19
972D41971D
15
964D44
959D10
958D15
957M30
953D20
950D16
949D15
929D27
926S37
919D14
903D46
902D17
901D20
900D15
391D-P5
2033D76
2032D302031D
15
2023D18
2022D33
2019D79
2018D20
2010D23
2009D24
2006D79
121-220
390D-P14
PW-72917
PW-72820
EAP-20841
EAP-205108
362D17
361D20
970D16
969D32
963D81
2011D20
2005D22
965D145
389A-P17
PW-72712
PW-70919
2024D-261
EAP-41127
EAP-11925
!( Monitoring Well (March - December 2015)Chloride Concentration (mg/L)
> 24 to 100>100
Service Layer Credits: Source: Esri, DigitalGlobe, GeoEye, EarthstarGeographics, CNES/Airbus DS, USDA, USGS, AEX, Getmapping, Aerogrid,IGN, IGP, swisstopo, and the GIS User Community
P:\Co
lstrip\0
4 GIS\
Projec
ts\12_P
lumes\
FIGUR
E 2-29
- Chlo
ride Be
drock.
mxd
O0 1,400Feet
!(!(
!(
!(
!(
!(
!(
!(
!(
!(
!(!(
!(
!(
!(
!(
!(
!(
!(
!( !(
!(!(
!(!(
!(!(
!(
!(!(
!(
!(
!(
!(
!(!(
!(
!(
!(
!(!(
!(
!(
!(
!(
!(!(!(
!(
!(
!(
!(
!(
!(
!(
!(
!(
!(
!(
!(
!(
!(
!(
!(
!(
!(
EAP-41367
395D66
393D59
392D17
387D26
383D54
380D56
379D53
359D18
353T21 999D
37
996D22
993D24
992D32
987D24
984D37
982D67
981D24
968D63
963D81
962D62
961D81
960D76
952D22
951D22
934D90933D
16
932D62
928D37
927D64
914D23
912D32
904D23
2036D29
2029D15
2027D40
2012D34
2008D46
2007D21
2004D44
2003D612000D
46
989D128907D
128
394D-P20
2021D105
PW-72361
PW-72232
PW-72134
PW-71310
PW-70514
990D32
988D77
986D19
983D33
906D72
905D50
2037D30
2034D26
995DD18
911D104
396D-P27
PW-704D268
PW-704D137
Chloride in Bedrock GroundwaterSOEP and STEP Area
CSES-Colstrip, MontanaFIGURE 2-29
NOTE:Baseline screening level (BSL) for Chloride inBedrock = 24 mg/L and in Coal Related = 20mg/L (Neptune 2015) as of December 2015Figure includes water quality from wellsscreened in Clinker, Overburden, McKay Coaland Sub-McKay
LOCATION
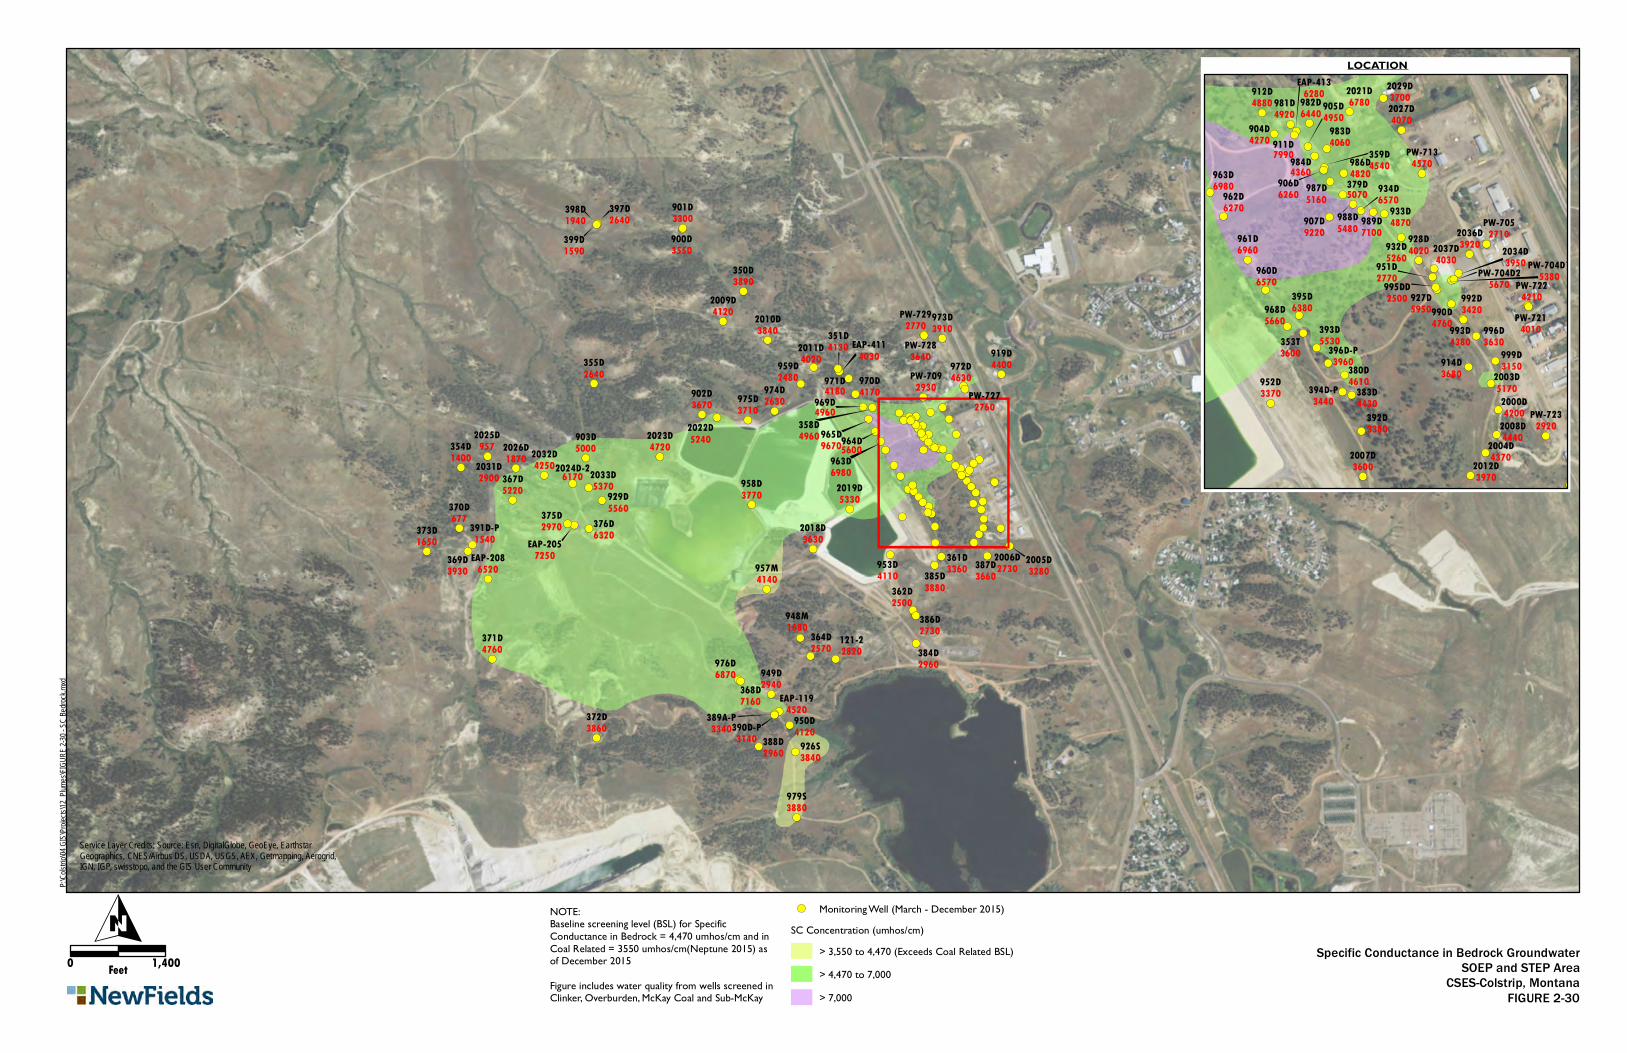
!(
!(
!(
!(
!(
!(
!(
!(
!(
!(!(
!(!(!(
!(
!(
!(
!(
!(!(
!(
!(!(
!(
!(
!(!(!(!(!(!(!(!(
!(!(!(
!(
!(!(
!(
!(
!(
!(
!(
!(!(
!(
!(
!(
!(!(
!(
!(
!(!(
!(
!(!(
!(!(!(!(
!(
!(
!(
!(
!(!(
!(
!(!(
!(!(!(
!(!(
!(
!(!(
!(!(!(
!(
!(
!(
!(
!(
!(
!(
!(
!(
!(
!(
!(
!(
!(
!(
!(
!(
!(
!( !(
!(
!(!(
!(
!(
!(
!(
!(
!(!(
!(
!(
!(
!(
!(
!(
!(!(!( !(!(
!(
!(
!( !(!(
!(
!(!(
!(
!(
!(
!(!(
!(
!(!(!(
370D677
929D5560
926S3840
919D4400
903D5000
902D3670
901D3300900D3550
399D1590
398D1940
397D2640
388D2960
387D3660
386D2730
385D3880
384D2960
376D6320
375D2970373D
1650
372D3860
371D4760
369D3930
368D7160
367D5220
364D2570
358D4960
355D2640
354D1400
351D4130
350D3890
2025D957
979S3880
976D6870
975D3710
974D2630
973D3910
972D4630971D
4180
963D6980
959D2480
958D3770
957M4140
953D4110
950D4120
949D2940
948M1680
2033D5370
2032D42502031D
2900
2026D1870
2023D4720
2022D5240
2019D5330
2018D3630
2010D3840
2009D4120
2006D2730
121-22820
391D-P1540
390D-P3140
PW-7292770PW-728
3640PW-709
2930
EAP-2086520
EAP-2057250
362D2500
361D3360
970D4170
969D4960
965D9670964D5600
2011D4020
2005D3280
389A-P3340
PW-7272760
2024D-26170
EAP-4114030
EAP-1194520
!( Monitoring Well (March - December 2015)SC Concentration (umhos/cm)
> 3,550 to 4,470 (Exceeds Coal Related BSL)> 4,470 to 7,000> 7,000
Service Layer Credits: Source: Esri, DigitalGlobe, GeoEye, EarthstarGeographics, CNES/Airbus DS, USDA, USGS, AEX, Getmapping, Aerogrid,IGN, IGP, swisstopo, and the GIS User Community
P:\Co
lstrip\0
4 GIS\
Projec
ts\12_P
lumes\
FIGUR
E 2-30
- SC B
edrock
.mxd
O0 1,400Feet
!(
!(
!(
!(
!(
!(
!(
!( !(
!(!(
!(!(
!(!(
!(
!(!(
!(
!(
!(
!(
!(!(
!(
!(
!(
!(!(
!(
!(
!(
!(
!(!(!(
!(
!(
!(
!(
!(
!(
!(
!(
!(
!(
!(
!(
!(
!(
!(
!(
!(
!(
!(!(
!(
!(
!(
!(
!(
!(
!(
!(
!(!(
361D3440
934D6570
933D4870
932D5260
928D4020
927D5950
914D3680
912D4880
911D7990
907D9220
906D6260
905D4950
904D4270
395D6380
393D5530
392D3380
387D3660
383D4430
380D4610
353T3600 999D
3150
996D3630
993D4380
992D3420
989D7100
988D5480
984D4360
982D6440
968D5660
964D5600
963D6980
962D6270
961D6960
960D6570
952D3370
951D2770
2036D3920
2029D37002027D4070
2021D6780
2012D3970
2008D4440
2007D3600
2004D4370
2003D51702000D4200
394D-P3440
PW-7232920
PW-7224210
PW-7214010
PW-7134570
PW-7052710
379D5070
359D4540
990D4760
987D5160
986D4820
983D4060
981D4920
2037D4030 2034D
3950
995DD2500
396D-P3960
EAP-4136280
PW-704D25670
PW-704D15380
Specific Conductance in Bedrock GroundwaterSOEP and STEP Area
CSES-Colstrip, MontanaFIGURE 2-30
NOTE:Baseline screening level (BSL) for SpecificConductance in Bedrock = 4,470 umhos/cm and inCoal Related = 3550 umhos/cm(Neptune 2015) asof December 2015
Figure includes water quality from wells screened inClinker, Overburden, McKay Coal and Sub-McKay
LOCATION
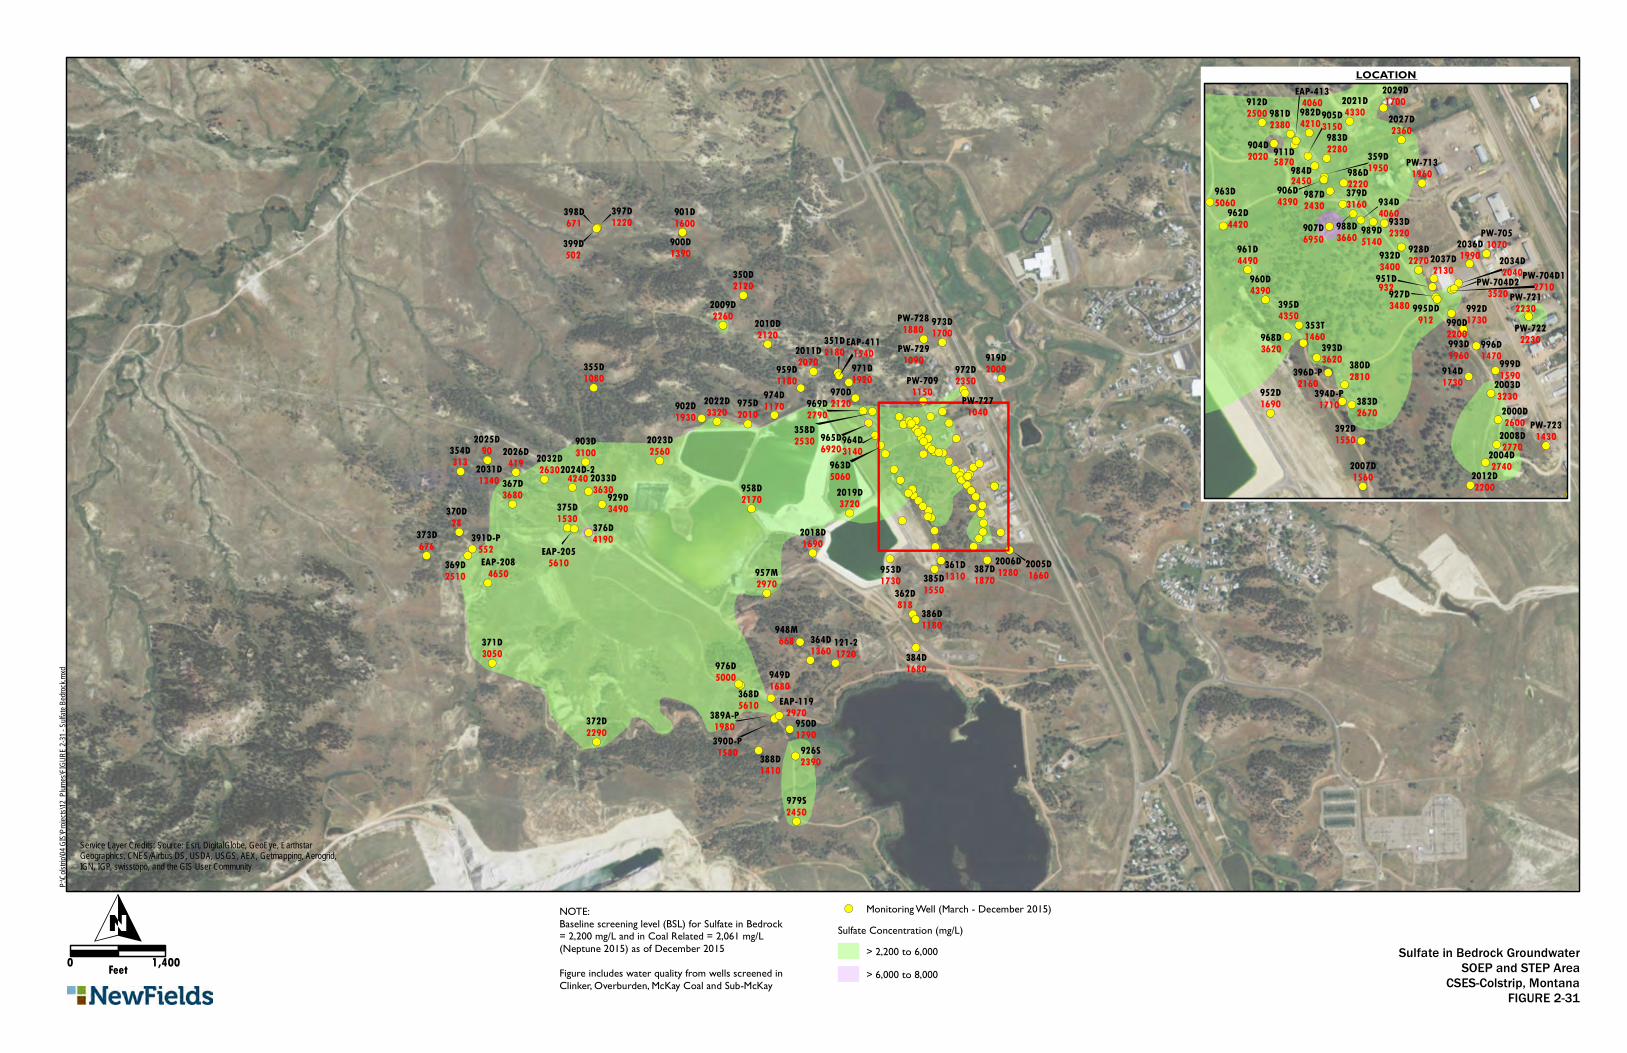
!(
!(!(
!(!(!(!(
!(
!(
!(
!(
!(!(
!(
!(!(
!(!(!(
!(!(
!(
!(!(
!(!(
!(
!(
!(
!(
!(
!(
!(
!(
!(
!(
!(
!(
!(
!(
!(
!(
!(
!(
!( !(
!(
!(!(
!(
!(
!(
!(
!(
!(!(
!(
!(
!(
!(
!(
!(
!(
!(!(!( !(!(
!(
!(
!( !(!(
!(
!(!(
!(
!(
!(
!(!(
!(
!(!(!(
!(
!(
!(
!(
!(
!(
!(
!(
!(
!(!(
!(!(!(
!(
!(
!(
!(
!(!(
!(
!(!(
!(
!(
!(!(!(!(!(!(!(!(
!(!(!(
!(
!(!(
!(
!(
!(
!(
!(
!(!(
!(
!(
!(
!(!(
!(
!(
!(!(
387D1870
121-21720
2005D1660
2006D1280
2009D2260 2010D
21202011D2070
2018D1690
2019D3720
2022D3320
2023D2560
2025D90 2026D
4192031D1340
2032D2630 2033D
3630
350D2120
351D2180
354D313
355D1080
358D2530
361D1310
362D818
364D1360
367D3680
368D5610
369D2510
370D28
371D3050
372D2290
373D676
375D1530 376D
4190
384D1680
385D1550
386D1180
388D1410
389A-P1980390D-P1580
391D-P552
2024D-24240
397D1220
398D671
399D502
900D1390
901D1600
902D1930
903D3100
919D2000
926S2390
929D3490
948M668
949D1680
950D1790
953D1730957M
2970
958D2170
959D1180
963D5060
964D3140
965D6920
969D2790
970D2120
971D1920
972D2350
973D1700
974D1170975D
2010
976D5000
979S2450
EAP-1192970
EAP-2055610EAP-208
4650
EAP-4111540
PW-7091150 PW-727
1040
PW-7281880
PW-7291090
!( Monitoring Well (March - December 2015)Sulfate Concentration (mg/L)
> 2,200 to 6,000> 6,000 to 8,000
Service Layer Credits: Source: Esri, DigitalGlobe, GeoEye, EarthstarGeographics, CNES/Airbus DS, USDA, USGS, AEX, Getmapping, Aerogrid,IGN, IGP, swisstopo, and the GIS User Community
P:\Co
lstrip\0
4 GIS\
Projec
ts\12_P
lumes\
FIGUR
E 2-31
- Sulfa
te Bedr
ock.mx
d
O0 1,400Feet
!(
!(
!(
!(!(!(
!(
!(
!(
!(
!(
!(
!(
!(
!(
!(
!(
!(
!(
!(
!(
!(
!(
!(
!(!(
!(
!(
!(
!(
!(
!(
!(
!(
!(!(
!(
!(
!(
!(
!(
!(
!(
!( !(
!(!(
!(!(
!(!(
!(
!(!(
!(
!(
!(
!(
!(!(
!(
!(
!(
!(!(
!(
387D1790
361D1310
2005D1610
2000D2600
2003D3230
2004D27402007D
1560
2008D2770
2012D2200
2021D4330 2027D
2360
2029D1700
2034D2040
2036D19902037D
2130
353T1460
359D1950
379D3160
380D2810
383D2670
392D1550
393D3620
394D-P1710
395D4350
396D-P2160
904D2020
905D3150
906D4390
907D6950
911D5870
912D2500
914D1730
927D3480
928D2270932D
3400
933D2320
934D4060
951D932
952D1690
960D4390
961D4490
962D4420
963D5060
968D3620
981D2380
982D4210
983D2280
984D2450 986D
2220987D2430
988D3660 989D
5140
990D2200
992D1730
993D1960
995DD912
996D1470999D
1590
EAP-4134060
PW-704D12710PW-704D2
3520
PW-7051070
PW-7131960
PW-7212230PW-722
2230
PW-7231430
Sulfate in Bedrock GroundwaterSOEP and STEP Area
CSES-Colstrip, MontanaFIGURE 2-31
NOTE:Baseline screening level (BSL) for Sulfate in Bedrock= 2,200 mg/L and in Coal Related = 2,061 mg/L(Neptune 2015) as of December 2015Figure includes water quality from wells screened inClinker, Overburden, McKay Coal and Sub-McKay
LOCATION
39 7/29/2016 MR1149D\Remedy Evaluation Work Plan - SOEP STEP
APPENDIX C
SOEP/STEP Figures Showing
Uncaptured Areas
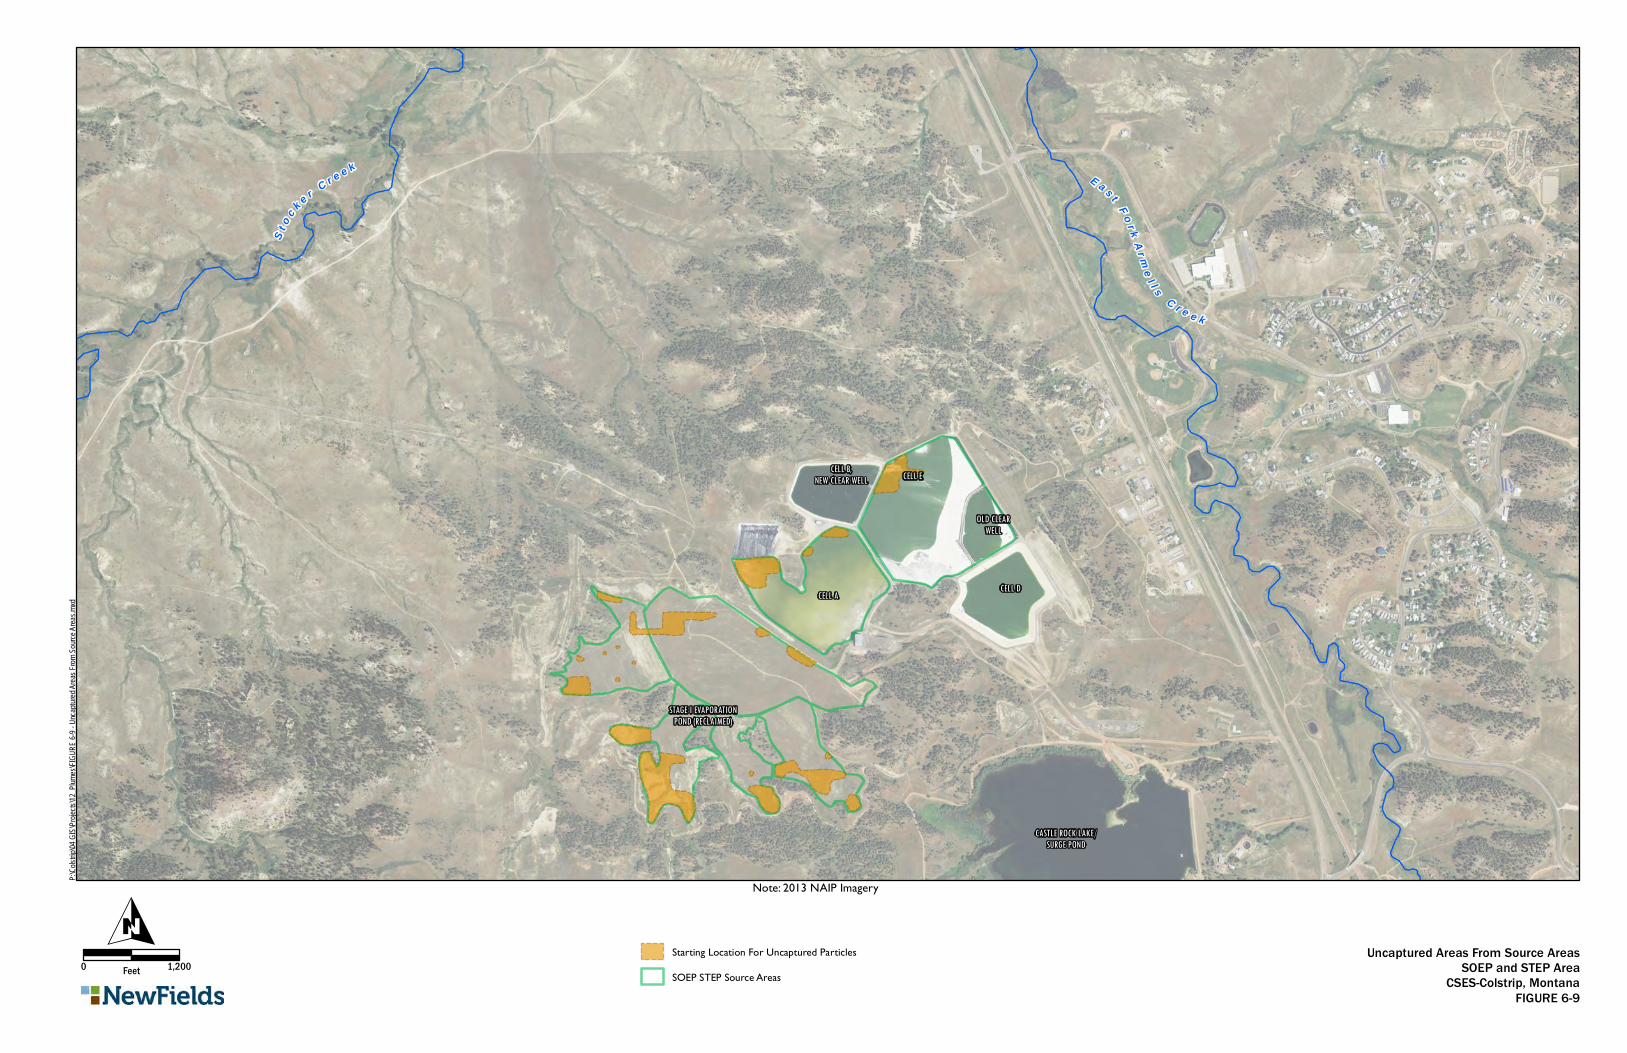
E a s t F o r kA r m
e l l s
C r e e k
CELL A
CASTLE ROCK LAKE/SURGE POND
CELL B,NEW CLEAR WELL CELL E
CELL D
STAGE I EVAPORATIONPOND (RECLAIMED)
S to c k e r C r e e k
OLD CLEARWELL
Uncaptured Areas From Source AreasSOEP and STEP Area
CSES-Colstrip, MontanaFIGURE 6-9
0 1,200Feet
O
P:\Co
lstrip\0
4 GIS\
Projec
ts\12_P
lumes\
FIGUR
E 6-9 -
Uncap
tured A
reas F
rom So
urce A
reas.m
xd
Note: 2013 NAIP Imagery
Starting Location For Uncaptured Particles
SOEP STEP Source Areas
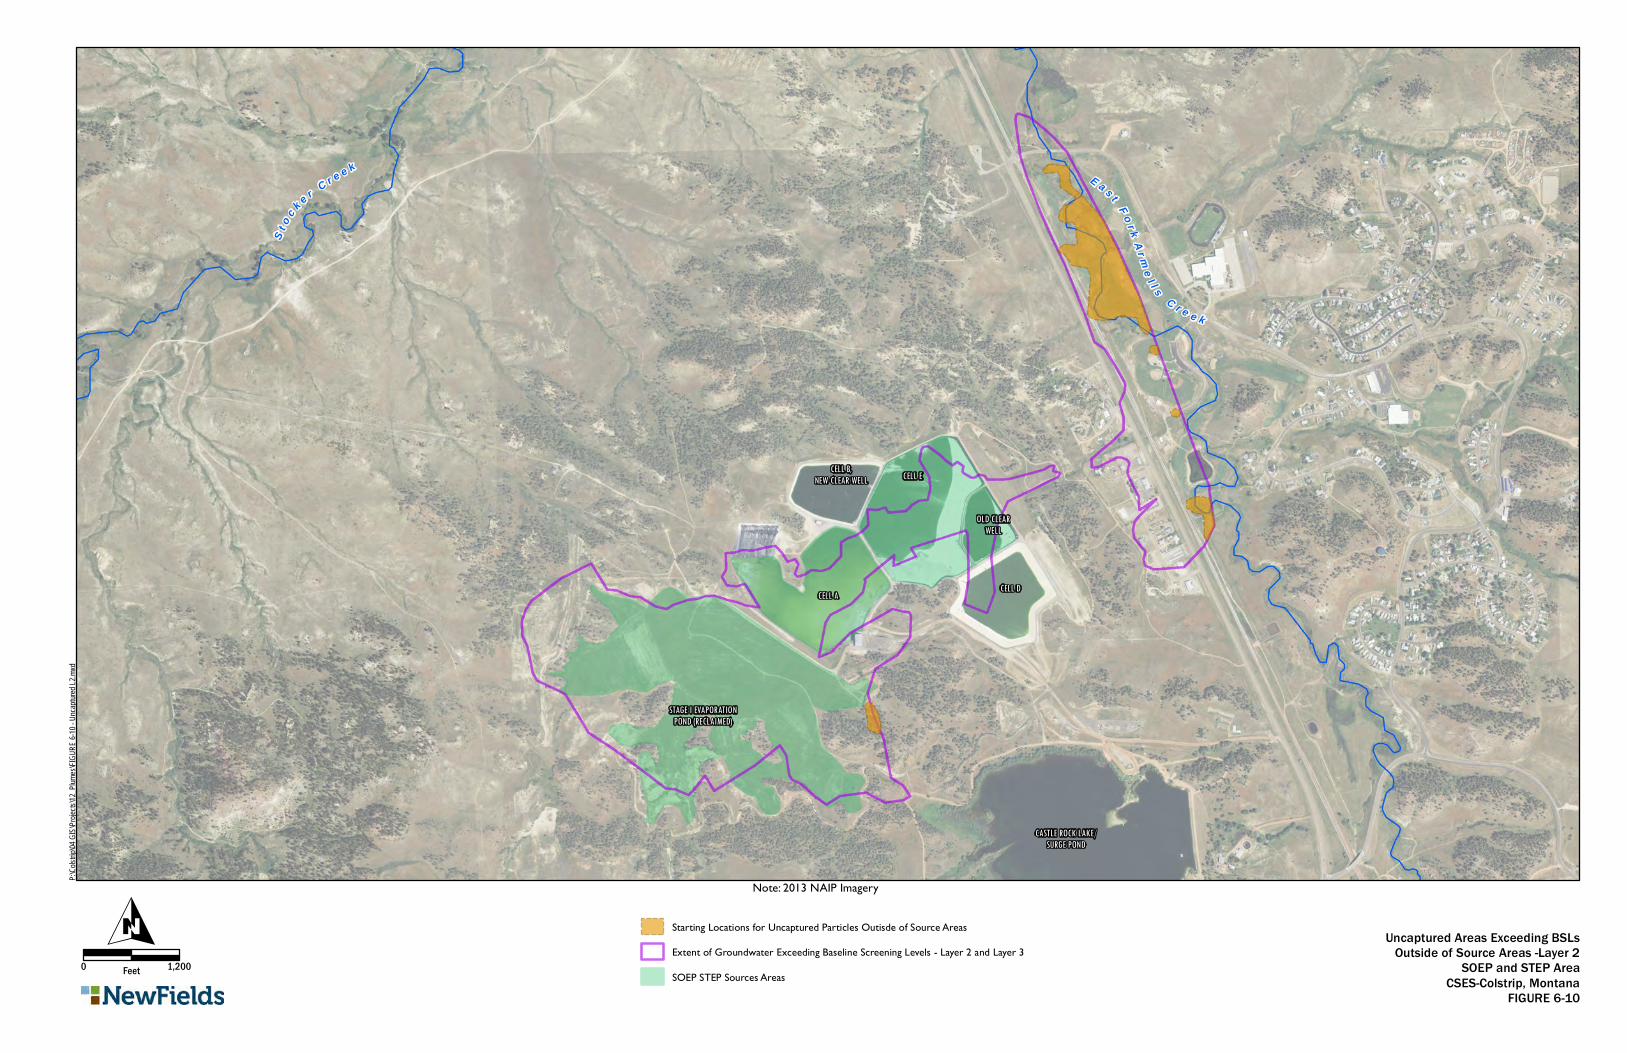
E a s t F o r kA r m
e l l s
C r e e k
CELL A
CASTLE ROCK LAKE/SURGE POND
CELL B,NEW CLEAR WELL CELL E
CELL D
STAGE I EVAPORATIONPOND (RECLAIMED)
S to c k e r C r e e k
OLD CLEARWELL
Uncaptured Areas Exceeding BSLsOutside of Source Areas -Layer 2
SOEP and STEP AreaCSES-Colstrip, Montana
FIGURE 6-10
0 1,200Feet
O
P:\Co
lstrip\0
4 GIS\
Projec
ts\12_P
lumes\
FIGUR
E 6-10
- Unca
ptured
L2.mx
d
Note: 2013 NAIP Imagery
Starting Locations for Uncaptured Particles Outisde of Source Areas
Extent of Groundwater Exceeding Baseline Screening Levels - Layer 2 and Layer 3
SOEP STEP Sources Areas
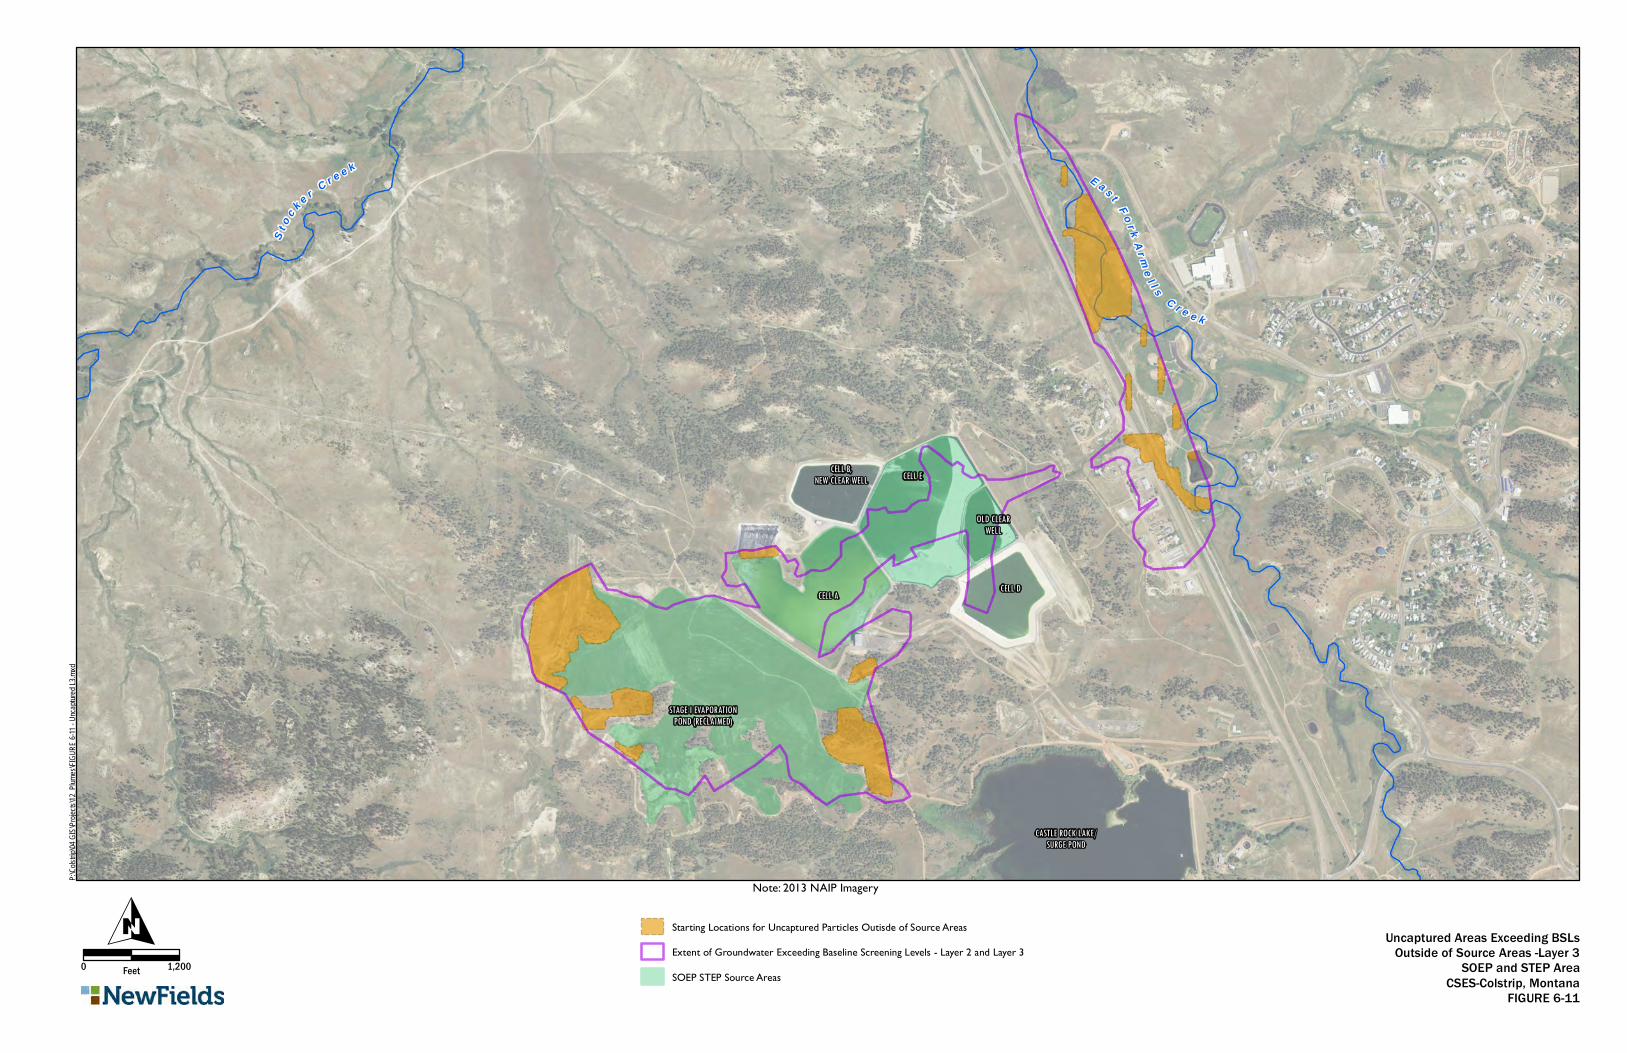
E a s t F o r kA r m
e l l s
C r e e k
CELL A
CASTLE ROCK LAKE/SURGE POND
CELL B,NEW CLEAR WELL CELL E
CELL D
STAGE I EVAPORATIONPOND (RECLAIMED)
S to c k e r C r e e k
OLD CLEARWELL
Uncaptured Areas Exceeding BSLsOutside of Source Areas -Layer 3
SOEP and STEP AreaCSES-Colstrip, Montana
FIGURE 6-11
0 1,200Feet
O
P:\Co
lstrip\0
4 GIS\
Projec
ts\12_P
lumes\
FIGUR
E 6-11
- Unca
ptured
L3.mx
d
Note: 2013 NAIP Imagery
Starting Locations for Uncaptured Particles Outisde of Source Areas
Extent of Groundwater Exceeding Baseline Screening Levels - Layer 2 and Layer 3
SOEP STEP Source Areas
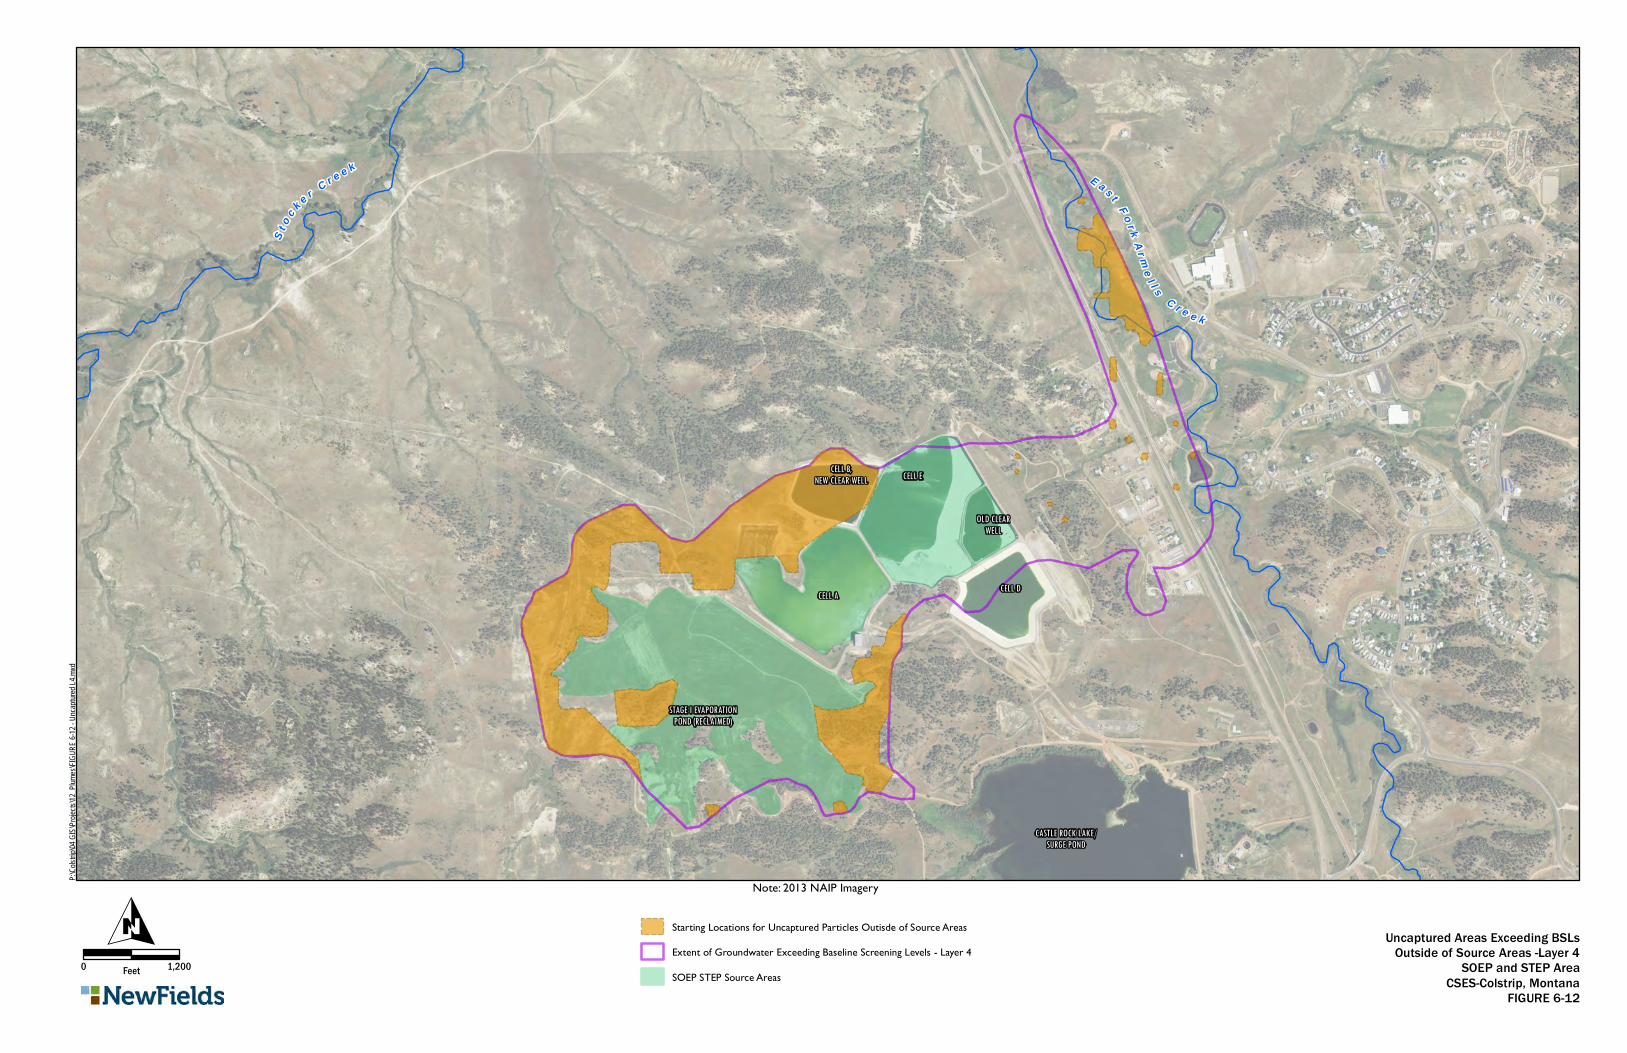
E a s t F o r kA r m
e l l s
C r e e k
CELL A
CASTLE ROCK LAKE/SURGE POND
CELL B,NEW CLEAR WELL CELL E
CELL D
STAGE I EVAPORATIONPOND (RECLAIMED)
S to c k e r C r e e k
OLD CLEARWELL
Uncaptured Areas Exceeding BSLsOutside of Source Areas -Layer 4
SOEP and STEP AreaCSES-Colstrip, Montana
FIGURE 6-12
0 1,200Feet
O
P:\Co
lstrip\0
4 GIS\
Projec
ts\12_P
lumes\
FIGUR
E 6-12
- Unca
ptured
L4.mx
d
Note: 2013 NAIP Imagery
Starting Locations for Uncaptured Particles Outisde of Source Areas
Extent of Groundwater Exceeding Baseline Screening Levels - Layer 4
SOEP STEP Source Areas
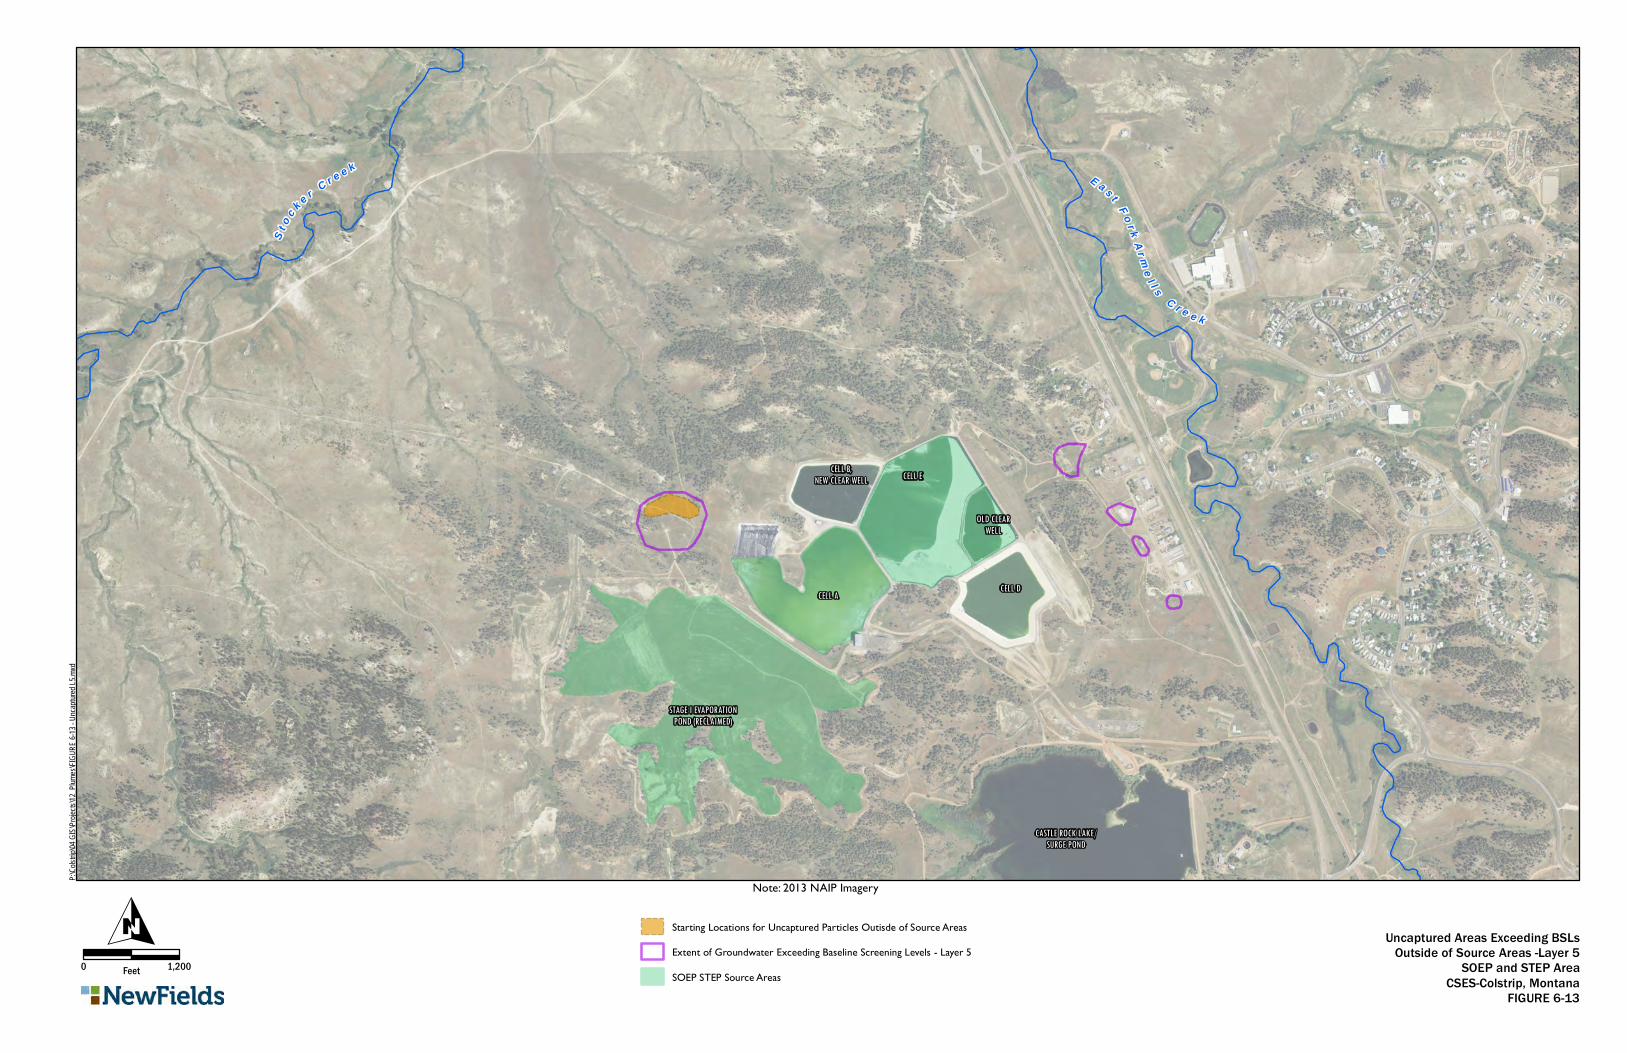
E a s t F o r kA r m
e l l s
C r e e k
CELL A
CASTLE ROCK LAKE/SURGE POND
CELL B,NEW CLEAR WELL CELL E
CELL D
STAGE I EVAPORATIONPOND (RECLAIMED)
S to c k e r C r e e k
OLD CLEARWELL
Uncaptured Areas Exceeding BSLsOutside of Source Areas -Layer 5
SOEP and STEP AreaCSES-Colstrip, Montana
FIGURE 6-13
0 1,200Feet
O
P:\Co
lstrip\0
4 GIS\
Projec
ts\12_P
lumes\
FIGUR
E 6-13
- Unca
ptured
L5.mx
d
Note: 2013 NAIP Imagery
Starting Locations for Uncaptured Particles Outisde of Source Areas
Extent of Groundwater Exceeding Baseline Screening Levels - Layer 5
SOEP STEP Source Areas