remington outdoor company, inc. · restrictive regulations, ... construction and renovation of ......
TRANSCRIPT

ANNUAL REPORT
For the fiscal year-ended:
December 31, 2015
REMINGTON OUTDOOR COMPANY, INC. (Exact name of company as specified in its charter)
Delaware (State or other jurisdiction of incorporation or organization)
870 Remington Drive
P.O. Box 1776
Madison, North Carolina 27025-1776 (Address of principal executive offices) (Zip Code)
(336) 548-8700 (Company’s telephone number, including area code)
REMINGTON OUTDOOR COMPANY, INC.
December 31, 2015
INDEX
1. BUSINESS ......................................................................................................................... 1
1A. RISK FACTORS ........................................................................................................... 17
2. PROPERTIES .................................................................................................................. 30
3. LEGAL PROCEEDINGS ................................................................................................ 31
6. SELECTED FINANCIAL DATA ................................................................................... 34
7. MANAGEMENT’S DISCUSSION AND ANALYSIS OF FINANCIAL
CONDITION AND RESULTS OF OPERATIONS ........................................................ 35
7A. QUANTITATIVE AND QUALITATIVE DISCLOSURES ABOUT
MARKET RISK ............................................................................................................... 56
8. FINANCIAL STATEMENTS AND SUPPLEMENTARY DATA ................................. 57
9. CHANGES IN AND DISAGREEMENTS WITH ACCOUNTANTS ON
ACCOUNTING AND FINANCIAL DISCLOSURE ...................................................... 106
10. DIRECTORS, EXECUTIVE OFFICERS AND CORPORATE GOVERNANCE…... 107
12. SECURITY OWNERSHIP OF CERTAIN BENEFICIAL OWNERS AND
MANAGEMENT AND RELATED STOCKHOLDER MATTERS ............................. 109
13. CERTAIN RELATIONSHIPS AND RELATED TRANSACTIONS,
AND DIRECTOR INDEPENDENCE ........................................................................... 111
14. PRINCIPAL ACCOUNTING FEES AND SERVICES ................................................ 112
Information Concerning Forward-Looking Statements
This annual report contains statements that constitute forward-looking statements, including statements
relating to trends in the operations, financial results, businesses and the products of Remington Outdoor Company,
Inc. as well as other statements including words such as “anticipate,” “believe,” “plan,” “estimate,” “expect,”
“intend” and other similar expressions.
Forward-looking statements are made based upon management’s current expectations and beliefs
concerning future developments and their potential effects on us. Such forward-looking statements are not
guarantees of future performance. The following important factors, and those important factors described elsewhere
in this annual report, including the matters set forth under the section entitled “Risk Factors,” could affect (and in
some cases have affected) our actual results and could cause such results to differ materially from estimates or
expectations reflected in such forward-looking statements.
• We are subject to the effects of general global economic and market conditions. Increases or decreases
in commodity prices, fluctuations in exchange rates, higher levels of unemployment, higher consumer
debt levels, declines in consumer confidence, uncertainty about economic stability and other economic
factors that may affect consumer spending or buying habits, including shifts by consumers to value
priced products, could adversely affect the demand and mix of products we sell. Persistent economic
uncertainty or a deterioration of economic conditions could have a material adverse effect on our
business, results of operations and financial condition, including potential impairments of long-term
assets.
• Our ability to make scheduled payments of principal and interest on, or to refinance our obligations
with respect to, our indebtedness, as well as our ability to comply with the covenants and restrictions
contained in the instruments governing such indebtedness, will depend on our future operating
performance and cash flow, which are subject to prevailing economic conditions, prevailing interest
rate levels, and financial, competitive, business and other factors beyond our control, including the
responses of competitors, changes in customer inventory management practices, changes in customer
and consumer buying patterns, regulatory developments and increased operating costs and capital
expenditures, all of which could materially adversely affect our business.
• The degree to which we are leveraged could have important consequences, all of which could
materially adversely affect our business, including the following: (i) our ability to obtain additional
financing for working capital or other purposes in the future may be limited; (ii) a substantial portion
of our cash flow from operations is dedicated to the payment of principal and interest on our
indebtedness, thereby reducing funds available for operations and growth; (iii) certain of our
borrowings are at variable rates of interest, which could cause us to be vulnerable to increases in
interest rates; and (iv) we may be more vulnerable to economic downturns and be limited in our ability
to withstand competitive pressures.
• The development of rural property in many locations has curtailed or eliminated access to private and
public lands previously available for hunting, and the continuation of the development of rural
property could materially adversely affect our industry as well as our business and results of
operations.
• A portion of our sales are seasonal. As a result of the seasonal nature of our sales, our historical
working capital financing needs generally have exceeded cash provided by operations during certain
parts of the year. Our ability to meet our debt service and other obligations depends in significant part
on customers purchasing our products during the fall hunting season. Therefore, a decrease in demand
during the fall hunting season for our higher priced, higher margin products would require us to further
reduce costs or increase our reliance on borrowings under our credit facility to fund operations. If we
are unable to reduce costs or increase our borrowings sufficiently to adjust to such a reduction in
demand, our financial condition and results of operations could be adversely affected.
• Government orders, protocol and negotiations increase volatility and uncertainty in our results. Orders
placed by the U.S. or foreign governments tend to be disproportionately large in value, which will
affect net sales, the length of time that we carry inventory and other performance metrics from period-
to-period. Procedures that we are required to follow relating to acquisition and negotiations can
increase uncertainty in the contracting process, making it difficult for us to predict our supply and
inventory needs.
• Commodity prices, including those for lead, copper, steel, brass, zinc, oil and natural gas have
historically experienced significant volatility primarily due to the global supply of and demand for the
commodity as well as other factors such as the global economic environment. We currently purchase
various hedging instruments to hedge against price fluctuations of anticipated commodity purchases.
However, we cannot assure you that our hedging activity will be effective risk management against
significant volatility in the price of lead or zinc or other commodities, which could have a material
adverse impact on our consolidated financial position, results of operations, or cash flows.
• We utilize numerous raw materials, including steel, zinc, lead, copper, brass, plastics, gunpowder, and
wood, as well as manufactured parts, which are purchased from one or a few suppliers. Any disruption
in our relationship with suppliers of these materials could increase our cost of operations. Such a
disruption may result from or be amplified by the volatility of and uncertainty in the U.S. and global
financial markets.
• We face significant domestic and international competition and our competitors vary according to
product line. Certain of these competitors are subsidiaries of large corporations with substantially
greater financial resources and less leverage than we have. There can be no assurance that we will
continue to compete effectively with all of our present competition, and our ability to so compete could
be adversely affected by the degree to which we are leveraged.
• We are subject to business risks unique to companies engaged in supplying defense-related equipment
and services to the U.S. government and other governments, including the use of indefinite delivery,
indefinite quantity (“IDIQ”) contracts that are funded by government appropriations under which the
customer places orders at its discretion. Our failure to realize anticipated revenues from IDIQ
contracts, or the loss of, or a significant reduction in, government funding, for any program in which
we participate, could have a material adverse effect on our sales and earnings and thus negatively
affect our business, financial condition, results of operations or cash flows.
• Sales made to Wal-Mart accounted for approximately 13%, 9% and 11% of our total sales for the years
ended December 31, 2015, 2014, and 2013, respectively. Our sales to Wal-Mart are generally not
governed by a written long-term contract between the parties. In the event that Wal-Mart were to
significantly reduce or terminate its purchases of firearms, ammunition and/or other products from us,
our financial condition or results of operations could be adversely affected.
• The manufacture, sale and purchase of firearms, certain firearms parts/accessories and ammunition are
subject to extensive governmental regulation on the federal, state and local levels. Changes in
regulation could materially adversely affect our business by restricting the types of products we
manufacture or sell or by imposing additional costs on us or our customers in connection with the
manufacture or sale of our products. Regulatory proposals, even if never enacted, may affect firearms,
certain firearms parts/accessories or ammunition sales as a result of consumer perceptions. While we
do not believe that existing federal and state legislation relating to the regulation of firearms and
ammunition will have a material adverse effect on our sales, no assurance can be given that more
restrictive regulations, if proposed or enacted, will not have a material adverse effect on us in the
future.
• Our operations expose us to potential liability under regulations relating to anti-corruption, trade
controls, economic sanctions and similar laws. Our ability to comply with these laws is dependent
upon sufficient internal procedures and monitoring of the activity at both the corporate level and on the
level of individual employees or other agents. While we believe we are in compliance with applicable
regulations, a reach or investigation of violations could result in civil or criminal liability or a loss of
key contracts.
• Product recalls, class action and product liability litigation, as well as unfavorable publicity or public
perception of the firearms industry generally, could adversely impact our operating results and
reputation and may result in the delayed release of new products and offerings. Failure to maintain the
strength of our brands may affect our market position and thus our financial condition.
• The Company has received various incentives for the development, construction and renovation of
buildings and equipment in Huntsville, Alabama and Lonoke, Arkansas. These incentives are subject
to claw back provisions. These provisions include commitments to achieve incentive targets associated

with employment, capital and payroll. The inability to achieve these targets may require repayment of
certain funds already received and thus impact our financial condition.
Any forward-looking statement speaks only as of the date on which it is made, and, except as required by
law, we undertake no obligation to update any forward-looking statement to reflect events or circumstances after the
date on which the statement is made or to reflect the occurrence of unanticipated events.
1
1. BUSINESS
References in this report to (1) the terms “we,” “us,” “our,” the “Company,” “Remington Outdoor Company” and
“Remington Outdoor” refer to Remington Outdoor Company, Inc. and its subsidiaries on a consolidated basis, (2)
the term “FGI Holding” refers to FGI Holding Company, LLC, (3) the term “FGI Opco” refers to FGI Operating
Company, LLC, (4) the term “FGI Finance” refers to FGI Finance, Inc., (5) the term “Remington” refers to
Remington Arms Company, LLC and its direct and indirect subsidiaries, (6) the term “Mountain Khakis” refers to
Mountain Khakis, LLC, (7) the term “AAC” refers to Advanced Armament Corp., LLC, (8) the term “Barnes” refers
to Barnes Bullets, LLC, (9) the term “Para” refers to Para USA, LLC, (10) the term “TAPCO” refers to The
American Parts Company, Inc., (11) the term “LAR” refers to LAR Manufacturing, Inc., (12) the term “Dublin
Dog” refers to Dublin Dog Company, (13) the term “TMRI” refers to TMRI, Inc., (14) the term “Remington UK”
refers to Remington Outdoor (UK) Ltd., (15) the term “SMK” refers to Tech Group (UK) Ltd., (16) the term “Storm
Lake” refers to Storm Lake, Inc. and (17) “2020 Notes,” “Term Loan B,” “ABL,” and “ABL Revolver” have the
respective meanings given to them in the “Notes to Consolidated Financial Statements –note 8 – Debt.”
Company Overview
Our Company
We are a leading global manufacturer of firearms, ammunition and related products for commercial,
military and law enforcement markets with a diverse portfolio of category-defining brands, including Remington,
Marlin, Bushmaster, Barnes Bullets, Advanced Armament Corp., and DPMS, among others. We were formed
through a series of focused acquisitions over the past eight years and have assembled a premier brand portfolio that
offers a wide suite of outdoor products, ranging from value to premium price points. Our strategic goals are to
leverage our brand equity to create scale in our distribution channels, develop and introduce new products that
achieve market leading positions in their categories, and optimize our manufacturing operations and supply chain to
continuously improve profitability. We have held the #1 or #2 market positions in the United States for all long gun
categories and modern sporting rifles (“MSRs”) and the #3 market position for ammunition since 2008.
We are America’s oldest and among its largest firearms and ammunition manufacturers, with our flagship
Remington brand founded in 1816 and celebrating its 200th
anniversary in 2016. Remington represents an iconic
brand born from a passion for precision and a pride in craftsmanship dating back to Eliphalet Remington. From the
beginning, Remington built its reputation on these two core principles. We are actively preparing for our 200th
anniversary in 2016 and intend to use this milestone to ensure that pride and precision are engrained in everything
we do and that our culture embodies these principles for years to come. Additionally, this effort involves leveraging
a combination of consumer touch points to activate new and existing Remington loyalists and introducing limited-
edition anniversary products. Since production started in 1962 and 1950, respectively, we have manufactured more
than 6.1 million Model 700 Bolt Action rifles and more than 11.8 million Model 870 Pump Action shotguns,
demonstrating the multi-generational appeal of our products. In 2014, Remington ranked as top shotgun brand
(19.0% of all purchases) and among the top rifle ammunition brands (19.7% of all purchases) in the United States,
based on Hunting, Shooting and Self-Defense Market survey data from Southwick Associates. We believe that our
rich heritage and reputation for quality have resulted in strong brand recognition and customer loyalty for all of our
products and that our Remington brand represents an enduring symbol of American values that is trusted and
respected by generations of sportsmen.
We believe that the strength and scale of our brand portfolio, led by Remington, has enabled us to develop a
strong and differentiated distribution channel. By leveraging our portfolio of 16 brands within our distribution
channel, we have significantly expanded the sales opportunities for the brands that we have acquired. Our sales
organization is designed to move us closer to our customers, better serve independent dealers through wholesalers,
improve retail planning and merchandising at dealers and retailers, better support customers with data and programs,
and provide enhanced training to our retail counter staff. We believe our sales organization, together with our strong
brands, broad and diversified product assortment, leading market share and ability to offer both firearms and
ammunition allows us to leverage resources and focus on prudently growing our business, while providing the our
customers superior access to our products.
The aggregate firearms, ammunition and accessories retail consumer market in the United States was
approximately $17.7 billion in 2014. As a result of favorable industry-wide trends, including broader participation
in hunting and shooting sports, an increasing number of female shooters, an increased focus on home and self-

2
defense and recent rises in demand brought about by regulatory and legislative concerns, these markets have grown
over the past five years.
We believe our scale and product breadth are unmatched within our industry. We are one of only two
major U.S. companies that manufacture both firearms and ammunition, which we believe provides a competitive
advantage, supports our market leadership position and adds a recurring revenue component to our sales. We also
believe that our portfolio of products is more diverse and expansive than those of other manufacturers of both
firearms and ammunition based on the number of product categories in which we participate.
Our Defense Division is an active participant in the Law Enforcement, International Military, and U.S.
Federal and Military markets for ammunition, shotgun, carbine, sniper rifle, and suppressor categories. We are one
of the market leaders in the military sniper rifle and law enforcement shotgun markets and a major provider of
service and training/duty use ammunition. Additionally, our work in shaping international requirements over the
last 5 years resulted in contracts with the Republic of the Philippines for M4-type carbines that will support its
domestic and regional security operations. We believe that our commitment to researching and developing creative
new products with end user input, along with our commitment to providing the highest quality firearm solutions
available for law enforcement and military customers provides an opportunity for attractive revenue diversification
while reinforcing the strength of our brands with consumers.
By improving machinery and equipment in our manufacturing process and by leveraging new technologies,
we believe that we can improve our quality and cost position. To that end, in 2015 we invested $44.9 million in
capital equipment for new product innovation and maintenance projects.
We currently manufacture our products in eight primary facilities with an aggregate 2.6 million square feet
of manufacturing space, enabling us to deliver our products in the U.S. and globally to approximately 55 countries.
The majority of our revenue is derived from three key firearms facilities in Ilion, New York, Huntsville, Alabama
and Mayfield, Kentucky and our primary ammunition plant in Lonoke, Arkansas. We are continuously evaluating
options to improve our competitive position in manufacturing through investments in equipment, facilities and best
practices which also contribute to improvements in gross margin. In 2014, we undertook an expansion at our
Lonoke ammunition factory. This production facility, which came on-line in the second half of 2014 and is fully
operational, has significantly expanded our centerfire pistol and revolver (“P&R”) ammunition capacity, enabling us
to meet the industry-wide demand for these rounds. Our Huntsville facility became fully operational in 2015. In
addition to capacity expansions to meet demand, our capital investment program is also key to our margin
improvement initiative, as new and more efficient machines enable us to realize lower manufacturing costs.
Our History and Corporate Structure
Remington Outdoor Company is a holding company currently controlled by Cerberus Capital Management
(“CCM”). Our predecessor company, Bushmaster Firearms International, LLC, was created in 2006 by CCM for
the purpose of acquiring the business of Bushmaster Firearms, Inc., which subsequently merged with Remington
Arms Company, Inc. on December 12, 2007, creating Freedom Group, Inc., which was subsequently renamed
Remington Outdoor Company.
Our Market Opportunity
We compete in multiple marketplaces for firearms, ammunition and related accessories. End-user markets
include U.S. and international consumers, such as sportsmen, hunters, recreational shooters, and individuals desiring
personal protection, police departments, the U.S. Military and allied foreign governments. The total size of the
domestic commercial market for firearms was approximately $3.8 billion in 2014 according to Federal Excise Tax
data. Through our broad portfolio of brands, we are active in many growth segments of the firearms industry, which
helped us achieve the #1 market position in 2014 in many of the categories in which we compete. We are also a
leading provider of ammunition, which had a total domestic commercial market of approximately $2.7 billion in
2014, holding the #3 position overall in 2014. According to the National Shooting Sports Foundation (“NSSF”),
domestic consumer long gun sales (based on Federal Excise Tax data) have grown at a 14.5% CAGR from 2010
through 2014 while handgun sales have grown at a 14.0% CAGR from 2010 through 2014. We believe we are the
largest producer of commercial MSRs, a market that has grown at a 28% CAGR from 2010 through 2014. Further,
the NSSF estimates that domestic consumer ammunition sales grew at a 15.9% CAGR from 2010 to 2014.
3
We are a leading competitor in the following:
Long Guns: Since 2008, we have been the #1 provider of firearms in the long gun market, which was
estimated to be $1.9 billion in 2014 based on Federal Excise Tax data. According to Southwick
Associates, our brands represented 15.8% of the domestic rifle market and 19.0% of the domestic
shotgun market in 2014.
Handguns: We re-entered the handgun market in 2010 with our R1 1911 pistol and the RM380 Micro
Pistol in late 2015. The handgun market constitutes a $1.9 billion market and is growing rapidly
according to the National Instant Criminal Background Check System (“NICS”) checks, and thus
provides a significant opportunity to gain market share. We have a detailed product roadmap to
continue to introduce additional handgun product platforms in the future, which will enable us to
actively grow within the handgun market.
MSRs: Through our Remington, Bushmaster and DPMS brands, we were the #1 provider of MSRs in
the domestic market in 2014 with recent new products that address the increased demand for
sportsmen and hunters.
Ammunition: We estimate, based on Federal Excise Tax data, that the domestic commercial
ammunition market was $2.7 billion in 2014. Overall, our brands held the #3 position in the total
ammunition market in 2014, placing even higher among rifle ammunition manufacturers (#2 position,
as a combination of Remington and Barnes).
Consumer: Through our AAC, TAPCO, Remington, Bushmaster, DPMS, Marlin and Storm Lake
brands, we offer on- and off-gun accessories and firearm cleaning supplies.
Our consumers include people of all ages, genders, educational backgrounds and income levels that use our
products for hunting, target shooting, competition and self-defense. According to an ongoing National Sporting
Goods Association (“NSGA”) study, there were approximately 32.2 million active shooters in the United States in
2014, representing a 1.0% CAGR since 2010. These 32.2 million shooters include approximately 13.7 million
handgun shooters, 11.8 million rifle target shooters and 10.1 million shotgun target shooters, representing a
significant installed customer base that generates a recurring revenue stream for ammunition, parts and accessory
sales. In addition, a number of developments in the industry are broadening and expanding consumer interest in
hunting and shooting sports and self-defense, including a renewed interest in the outdoors and product offerings
designed to introduce new shooters to hunting and shooting activities. The 2015 Shooting Sports Participation
report provided by the NSGA and NSSF revealed that overall shooting participation over the nine year period
between 2006 and 2014 increased by 13%, while female participation rose 52%, demonstrating the industry’s
favorable and sustainable demographic growth trends. We believe that as new participants are introduced to the
market, it will lead to consumers purchasing multiple firearm and ammunition products as their participation in
shooting sports broadens.
The number of firearm background checks initiated through the NICS has increased strongly, with more
than 23.1 million checks in 2015, compared to roughly 21.0 million in each of 2014 and 2013. We believe the
industry is continuing to experience sustainable industry-wide growth trends, including favorable demographics
among new shooters, an increasing number of female shooters and a greater focus on home and self-defense. We
view the increase in demand as having significant long-term benefits, including expanding the popularity of
shooting sport categories and providing an opportunity to cultivate new, and renew existing, long-term customer
relationships across our portfolio of products and brands.
As the popularity of hunting, shooting and outdoor sports increases, retailers serving this market continue
to expand their locations and product offerings to capitalize on these trends. These retailers stock our products in a
manner that encourages new shooting sports consumers to engage with our products at the counter and in store
ranges. We maintain direct sales relationships with these retailers, with each stocking a variety of our firearm,
ammunition and accessory brands.
4
Our Competitive Strengths
Our competitive strengths include:
Category Defining Brands
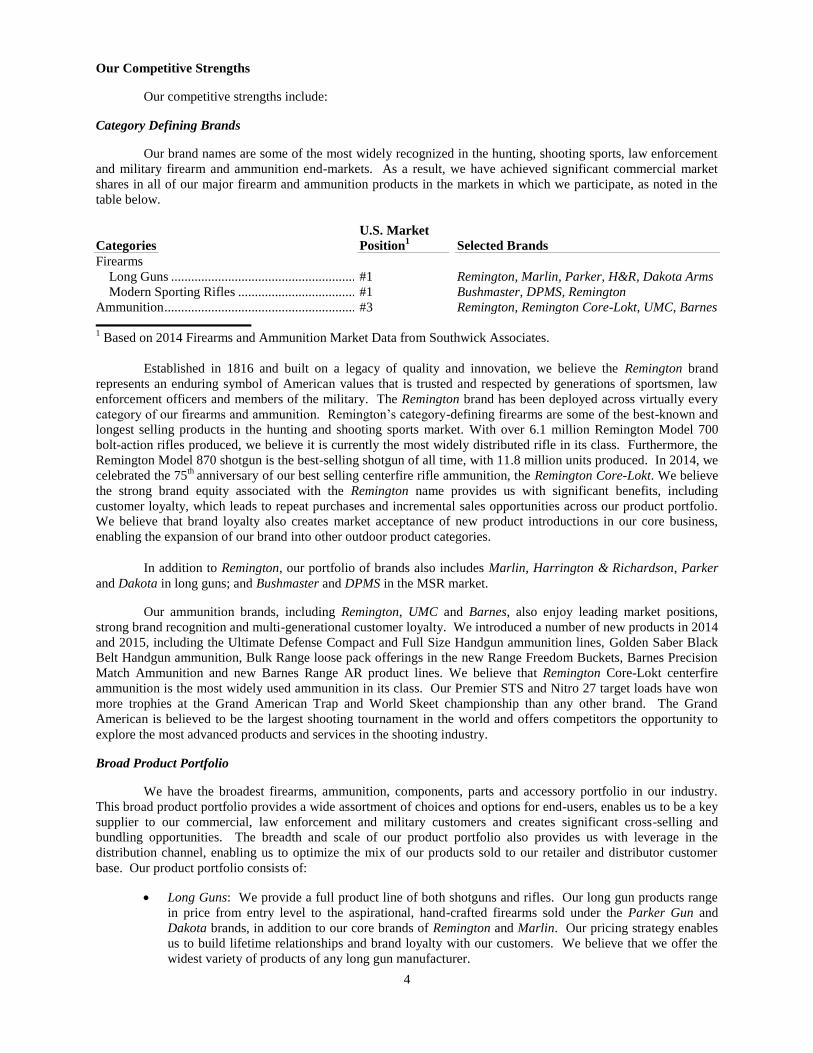
Our brand names are some of the most widely recognized in the hunting, shooting sports, law enforcement
and military firearm and ammunition end-markets. As a result, we have achieved significant commercial market
shares in all of our major firearm and ammunition products in the markets in which we participate, as noted in the
table below.
Categories
U.S. Market
Position1
Selected Brands
Firearms
Long Guns ........................................................ #1 Remington, Marlin, Parker, H&R, Dakota Arms
Modern Sporting Rifles .................................... #1 Bushmaster, DPMS, Remington
Ammunition .......................................................... #3 Remington, Remington Core-Lokt, UMC, Barnes
1 Based on 2014 Firearms and Ammunition Market Data from Southwick Associates.
Established in 1816 and built on a legacy of quality and innovation, we believe the Remington brand
represents an enduring symbol of American values that is trusted and respected by generations of sportsmen, law
enforcement officers and members of the military. The Remington brand has been deployed across virtually every
category of our firearms and ammunition. Remington’s category-defining firearms are some of the best-known and
longest selling products in the hunting and shooting sports market. With over 6.1 million Remington Model 700
bolt-action rifles produced, we believe it is currently the most widely distributed rifle in its class. Furthermore, the
Remington Model 870 shotgun is the best-selling shotgun of all time, with 11.8 million units produced. In 2014, we
celebrated the 75th
anniversary of our best selling centerfire rifle ammunition, the Remington Core-Lokt. We believe
the strong brand equity associated with the Remington name provides us with significant benefits, including
customer loyalty, which leads to repeat purchases and incremental sales opportunities across our product portfolio.
We believe that brand loyalty also creates market acceptance of new product introductions in our core business,
enabling the expansion of our brand into other outdoor product categories.
In addition to Remington, our portfolio of brands also includes Marlin, Harrington & Richardson, Parker
and Dakota in long guns; and Bushmaster and DPMS in the MSR market.
Our ammunition brands, including Remington, UMC and Barnes, also enjoy leading market positions,
strong brand recognition and multi-generational customer loyalty. We introduced a number of new products in 2014
and 2015, including the Ultimate Defense Compact and Full Size Handgun ammunition lines, Golden Saber Black
Belt Handgun ammunition, Bulk Range loose pack offerings in the new Range Freedom Buckets, Barnes Precision
Match Ammunition and new Barnes Range AR product lines. We believe that Remington Core-Lokt centerfire
ammunition is the most widely used ammunition in its class. Our Premier STS and Nitro 27 target loads have won
more trophies at the Grand American Trap and World Skeet championship than any other brand. The Grand
American is believed to be the largest shooting tournament in the world and offers competitors the opportunity to
explore the most advanced products and services in the shooting industry.
Broad Product Portfolio
We have the broadest firearms, ammunition, components, parts and accessory portfolio in our industry.
This broad product portfolio provides a wide assortment of choices and options for end-users, enables us to be a key
supplier to our commercial, law enforcement and military customers and creates significant cross-selling and
bundling opportunities. The breadth and scale of our product portfolio also provides us with leverage in the
distribution channel, enabling us to optimize the mix of our products sold to our retailer and distributor customer
base. Our product portfolio consists of:
Long Guns: We provide a full product line of both shotguns and rifles. Our long gun products range
in price from entry level to the aspirational, hand-crafted firearms sold under the Parker Gun and
Dakota brands, in addition to our core brands of Remington and Marlin. Our pricing strategy enables
us to build lifetime relationships and brand loyalty with our customers. We believe that we offer the
widest variety of products of any long gun manufacturer.
5
Handguns: Since re-entering this market in 2010 with the introduction of the Model 1911 R1 pistol,
we have continued to expand on the popularity of the 1911 R1 with products including the 1911 R1
Stainless, the 1911 R1 Threaded Barrel, the 1911 R1 Carry, and the 1911 R1 Carry Commander. Most
recently, we introduced the RM380 Micro Pistol in late 2015 for the concealed carry market.
MSRs: Through our Bushmaster and DPMS brands, we held the #1 market share position in the core
MSR category in 2014. Within the MSR market, we have also made acquisitions that enable us to
provide components and parts to customize MSRs, allowing us to generate additional sales to existing
customers, with component systems and parts often yielding higher margins than complete rifles.
Ammunition: We believe our prominence in the ammunition market and ability to leverage brand
loyalty creates a recurring and growing revenue stream in ammunition to complement our firearms
business. We currently produce over 1,200 SKUs of ammunition (loaded rounds and components) in
approximately 60 calibers and gauges for use across the entire spectrum of firearms, including
centerfire rifles, rimfire rifles, shotguns, and handguns, at a variety of price points and for a broad
range of applications.
Consumer: We sell a wide variety of accessories that leverage our core brands, including gun care,
cleaning products, traditional parts and accessories, tactical accessories, silencers and muzzle devices.
We also license our trademarks to a carefully selected number of third parties that manufacture
sporting and outdoor products in order to expand our brand recognition, enhance our ability to market
our core products and generate attractive margins.
Multiple Distribution Channels, Reaching Diverse End-Markets
We believe the combination of our strong brands, broad product assortment, leading market share and
ability to offer firearms, firearm parts and accessories and ammunition products has made us a key partner with
commercial retailers and wholesalers. Unlike many of our competitors that sell their products exclusively to
distributors, a significant portion of our commercial sales are directly to major retail and sporting goods chains. Our
relationships with these retailers enable us to develop favorable product mix and stocking strategies, ensuring that
our full suite of products is widely available to consumers while also serving to optimize our profitability. In
addition, we maintain strong commercial sales relationships with several major sporting goods wholesalers. We also
have strong relationships with dealers and shooting ranges, and actively work to grow net sales within these
channels.
In addition to our significant commercial business, we sell products to law enforcement, government and
military end-markets in the U.S. and internationally. These markets represented approximately 16% of net sales in
2015. Our current customers include, among others, the Texas Department of Public Safety, Los Angeles County
Sheriff’s Department, Los Angeles Police Department, the California Highway Patrol, the Federal Law Enforcement
Training Center (“FLETC”), SOCOM, the U.S. Secret Service, the Department of Homeland Security, the Bureau of
Alcohol, Tobacco and Firearms, and important U.S. foreign allies. Although these end-markets comprise a smaller
portion of our total net sales than our commercial business, we believe that the research and development
investments in our military and law enforcement business drives innovation with a goal of generating significant
benefits to our overall product portfolio and creates an aspirational aspect to similar products that we sell to
consumers.
Differentiated, Customer-Focused Management, Sales and Marketing Approach
We have shifted our business from a manufacturing-based “push system,” in which product volumes and
mix are determined based on available capacity, to a customer-focused “pull system,” in which customer preference
and consumer demand determine manufacturing decisions. We are able to determine what products customers
demand by mining our extensive and proprietary database of consumer data and we believe we are an industry
leader in capturing and analyzing point-of-sale statistics from key customers and distributors.
We have undergone recent organizational changes, which include partnering with select customers, who
share key data with us to ensure better service; focusing on select wholesalers who are committed to the independent
dealer network, to ensure the best independent dealer and small chain coverage, service and support; creating a retail
associates program to ensure proper merchandising, customer service, inventory levels, training and counter
programs for retail outlets and dealers; creating an inside sales force to canvas the dealer network to ensure access to
merchandising and inventory; and continued investment in data management. A key premise of this realignment is
6
data management and sharing. Our industry and its distribution channels, in particular, are rapidly becoming more
sophisticated with increasing amounts of data needed to drive and manage our business.
We believe this sales structure denotes clearer lines of responsibility, promotes organizational efficiency
and drives accountability. In addition, it provides the ability to leverage our flexible manufacturing capacity to
quickly respond to changes in consumer preferences and demands. Through this reorganization, we have eliminated
the need for third-party, non-exclusive domestic sales representatives.
Continuous Capital Investment to Increase Earnings
In order to enhance our mix management through flexible manufacturing and to meet the demand for our
products, we embarked on a capital investment program that added capacity to our manufacturing operations.
During 2015, 2014 and 2013, we invested approximately $44.9 million, $74.3 million and $59.2 million in capital
expenditures, respectively. The majority of this investment, compared to our annual historical capital expenditure
rate of $20 to $25 million per year, was focused on product categories that are experiencing historically high
demand such as ammunition and our new handgun product lines. In 2014, we undertook an expansion at our
Lonoke ammunition factory. This production facility, which came on-line in the second half of 2014 and is fully
operational, has significantly expanded our centerfire P&R ammunition capacity, enabling us to meet the industry-
wide demand for these rounds. We also completed the acquisition of a facility in Huntsville, Alabama in 2014. This
facility has allowed us to start consolidating our firearm manufacturing and research and development capabilities.
Experienced Management Team and Board of Directors
In 2015, we announced a series of changes to senior management and the Board: Jim “Marco” Marcotuli
was appointed to serve as President, Chief Executive Officer and Interim Chairman of the Board and Stephen P.
Jackson, Jr. returned to the Company to serve as Chief Financial Officer. The Board also appointed James E. Geisler
to serve as a member of the Board. In addition, certain members of senior management and the Board stepped down
or retired.
Our Growth Strategy
We intend to grow our revenue and earnings pursuant to the following strategies:
Strategically Invest Capital to Increase Capacity and Efficiency
We have undertaken a capital investment program under which we cumulatively spent approximately $180
million in the past three years in equipment and new product innovation to increase capacity and improve overall
production efficiency through enhanced mix management and flexible manufacturing. Our capital investment
strategy targets increasing production capacity in product lines and categories with attractive margins and persistent
unsatisfied market demand. This strategy is demonstrated by the initiatives we are undertaking at our Huntsville
firearms factory and Lonoke ammunition factory.
Continued Focus on Innovation and New Product Development
We believe that continuously developing innovative new products and improving existing offerings is
paramount to the success of businesses in our industry. We introduced several new products in 2014 and 2015, and
we plan to introduce more new products in 2016, including the following:
Long Guns: New Remington Long Gun projects for 2015 included the repositioning of the Model 783
bolt rifle to provide a scoped combo with superior performance and value in the opening price point
market category. In 2016 we plan to expand the Model 783 bolt rifle platform with camouflage stock
offerings in popular hunting calibers. We plan to introduce our new V3 shotgun platform that will
leverage the success of the patented Versa-Port gas system to the largest consumer market in semi-
automatic shotguns. Within the Marlin category, the Model 1894 will be expanded with the
reintroduction of new pistol caliber cartridges. Additionally, in 2016 we will celebrate Remington’s
200th
anniversary. We will be offering machine engraved Limited Edition models of our 700 bolt rifle,
7600 pump rifle, 870 pump and 1100 auto-loading shotguns. The engraving on the Limited Edition
models will include “1 of 2016” on each of the firearms, appealing to collectors and Remington
loyalists. In addition, we will introduce Commemorative Editions of the 700 bolt rifle and the 870
pump shotgun.
7
Handguns: In 2015, Remington entered the mainstream semi-automatic pistol market with our
introduction of the RM380 Micro Pistol for the concealed carry market. In 2016, we plan to introduce
multiple new semi-automatic platforms to facilitate growth in handguns over the next decade. Since
re-entering the handgun market in 2010, we have continued to expand the popularity of the 1911 R1
product line to the point of becoming one of the market share leaders in the 1911 product segment. In
2016, we will integrate consumer desired features into the R1 line with additional calibers including
9mm and 10mm. In addition, we will launch R1 1911 models with higher magazine capacity for
competition, self-defense and concealed carry. In connection with Remington’s 200th
anniversary, we
will offer a R1 1911 machine engraved Limited Edition. The engraving on the Limited Edition model
will include “1 of 2016” on each of the pistols. In addition, we will introduce a Commemorative
Edition R1 1911 pistol.
MSRs: In 2015, we repositioned our DPMS Oracle and Sportical modern sporting rifles to more
effectively compete in the market category. In addition, we began initial shipments of the Bushmaster
Quick Response Carbine (“QRC”). The Bushmaster QRC includes flat-top models and models with
red-dot optics. In 2014, we achieved a significant milestone in the MSR category with the launch of
the DPMS GII 308 rifle platform. We believe the GII rifle represents the most revolutionary
technological improvements to the AR platform in decades, providing the sportsmen, hunter and
recreational shooter additional options when going afield. In 2016, the technology of the GII platform
will be expanded to the Remington brand with the R25 GII, setting a new standard for semi-automatic
hunting rifles in terms of accuracy, reliability, and versatility, in a package weighing about the same as
many bolt action rifles, and significantly lighter than competitive AR-10 rifles.
Ammunition: In 2015, we expanded our Premium Pistol and Revolver Ammunition offering with the
Ultimate Defense Compact Handgun, which is specially designed for concealed carry handgun
customers. In 2016, we will release new Ultimate Defense Full Size Handgun line extensions,
completing our Ultimate Defense Product Line and we added the Golden Saber Black Belt for
commercial sales. There are now three new loose bulk pack offerings developed for the commercial
range markets in 9mm, .223 Remington, and Rimfire Range Freedom buckets. To complement our
Ultimate Muzzleloader rifle, in 2015 we produced the Premier AccuTip slug and expanded the VOR-
TX line to include a 300 AAC BLK 120gr TAC-TX for MSR shooters and a 280gr LRX 338 Lapua for
long range hunting applications. We also released a brand new line of rifle low cost lead-free
ammunition in 5.56mm and 300 AAC with the new Barnes RangeAR product line. In addition, a new
Barnes Precision Match line was released in 2015 in 5.56mm, .308 Win, .300 Win Mag, and .338
Lapua Mag offering shooters one of the most accurate factory loaded ammunition available. Finally,
we are releasing New American Clay and Field Reloadable Target Loads in 2016.
Consumer: In 2015, our AAC brand launched our new Illusion 9 Eccentric Suppressor. This
innovative suppressor, when installed, does not obstruct the sight picture on 9mm pistols. The
consumer does not have to purchase taller sights to effectively use our eccentric suppressor. We have
numerous new accessory products and existing product extensions in development, with planned
introductions in 2016 and beyond. These initiatives support our strategy to leverage the strength of the
Remington, DPMS, Bushmaster, AAC and Marlin brands by selling a variety of outdoor products in
order to provide an increasing share of the equipment and accessories upon which the outdoorsman
relies. We continue to strategically expand our licensing portfolio. We have over 20 licensing partners,
who provide brand relevant products and services to the outdoorsman. Examples include truck
accessories, logo wear, sporting dog products and guided hunting trips.
Continue to Optimize Manufacturing Operations
In addition to increasing capacity to meet demand, our management team is focused on optimizing
operations through the adoption of lean manufacturing, six sigma, and other continuous improvement projects
focused on inventory and supply chain management, cost reductions and productivity. Our manufacturing
optimization plan also includes the potential to expand our production capacity while focusing on SKU level
adherence to build plans. Our continuous cost and production volume improvements continue to be our
organization’s focus as we build and optimize our world class manufacturing platform. In 2014, we acquired a
facility in Huntsville, Alabama, in order to consolidate our footprint and improve our new product development
offerings, margin and speed to market.
8
Increase Commercial Market Share
Our industry is currently experiencing what we believe to be changing dynamics and demographics of the
hunting/shooting consumer and increased popularity of outdoor sports, lifestyle and personal defense. We intend to
grow our commercial market share by leveraging our strong brand and product portfolio with our dedicated sales
force to increase shelf space. Support for all business channels will come from our increased focus on social media
by leveraging our brand ambassadors and engaging consumers to shape purchase decisions.
Further Penetrate the Domestic and International Defense and Law Enforcement Channels
We focus our research efforts on developing products in advance of key emerging firearms solicitation
windows for the U.S. government and allied foreign militaries. We have supplied products to the military and law
enforcement channels for over 195 years, leading the military sniper rifle market since the Vietnam era. In 2015, we
were awarded a contract to provide our new Remington R10TM
.308 Semi-Auto Precision Patrol Rifle to premier
U.S. Federal Agencies. We use key relationships to identify defense and law enforcement needs in anticipation of
formal bids, so that research and development investments are focused on providing products that meet those needs.
We are developing several products specific to the anticipated requirements of U.S. foreign allies, including a
7.62mm semi-automatic sniper system and several personal defense weapons that we believe will help us improve
our international sales efforts. We believe we are a well-positioned player in this growing global market, as we are
able to offer full firearms and ammunition solutions to existing and new foreign military customers and have been
awarded several contracts from allied militaries. We believe that the research and development investments in our
military business have a positive impact on our commercial markets as consumers ascribe significant brand
recognition to, and aspire to own, products used by some of the most discerning end-users in the world.
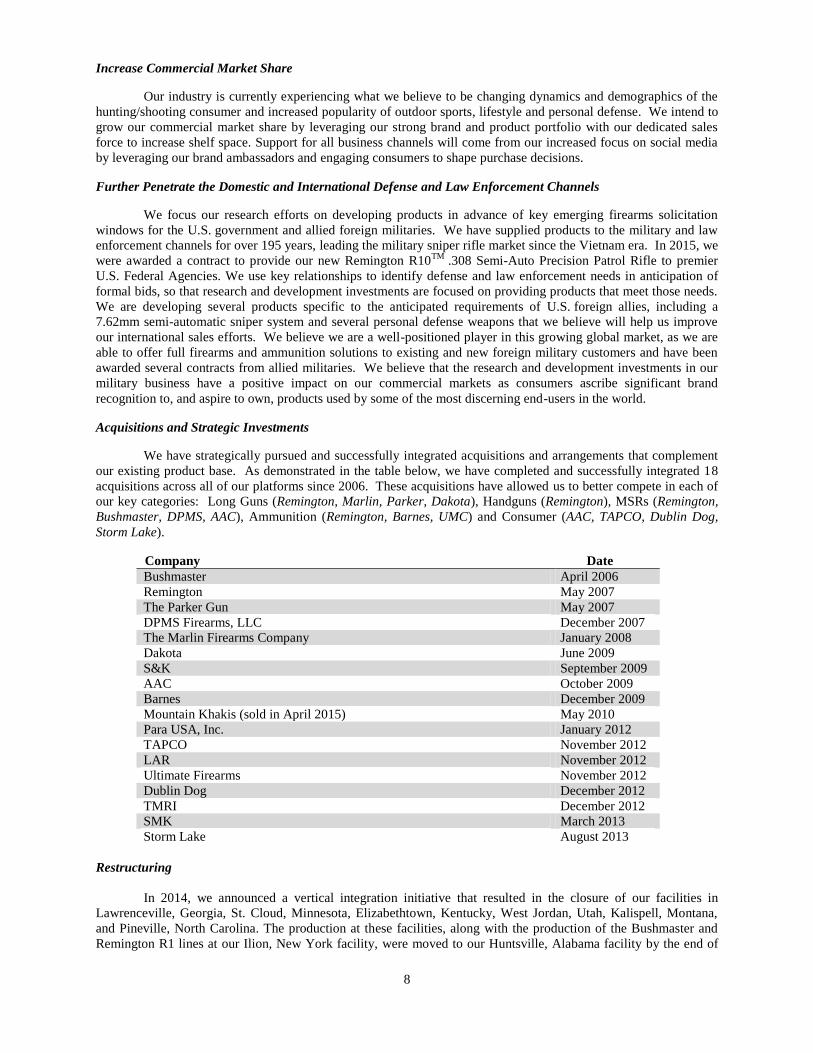
Acquisitions and Strategic Investments
We have strategically pursued and successfully integrated acquisitions and arrangements that complement
our existing product base. As demonstrated in the table below, we have completed and successfully integrated 18
acquisitions across all of our platforms since 2006. These acquisitions have allowed us to better compete in each of
our key categories: Long Guns (Remington, Marlin, Parker, Dakota), Handguns (Remington), MSRs (Remington,
Bushmaster, DPMS, AAC), Ammunition (Remington, Barnes, UMC) and Consumer (AAC, TAPCO, Dublin Dog,
Storm Lake).
Company Date
Bushmaster April 2006
Remington May 2007
The Parker Gun May 2007
DPMS Firearms, LLC December 2007
The Marlin Firearms Company January 2008
Dakota June 2009
S&K September 2009
AAC October 2009
Barnes December 2009
Mountain Khakis (sold in April 2015)
May 2010
Para USA, Inc. January 2012
TAPCO November 2012
LAR November 2012
Ultimate Firearms November 2012
Dublin Dog December 2012
TMRI December 2012
SMK March 2013
Storm Lake August 2013
Restructuring
In 2014, we announced a vertical integration initiative that resulted in the closure of our facilities in
Lawrenceville, Georgia, St. Cloud, Minnesota, Elizabethtown, Kentucky, West Jordan, Utah, Kalispell, Montana,
and Pineville, North Carolina. The production at these facilities, along with the production of the Bushmaster and
Remington R1 lines at our Ilion, New York facility, were moved to our Huntsville, Alabama facility by the end of
9
December 2015. In 2013, we announced an expansion at our Lonoke ammunition factory. The new ammunition
production facility came on-line in late 2014.
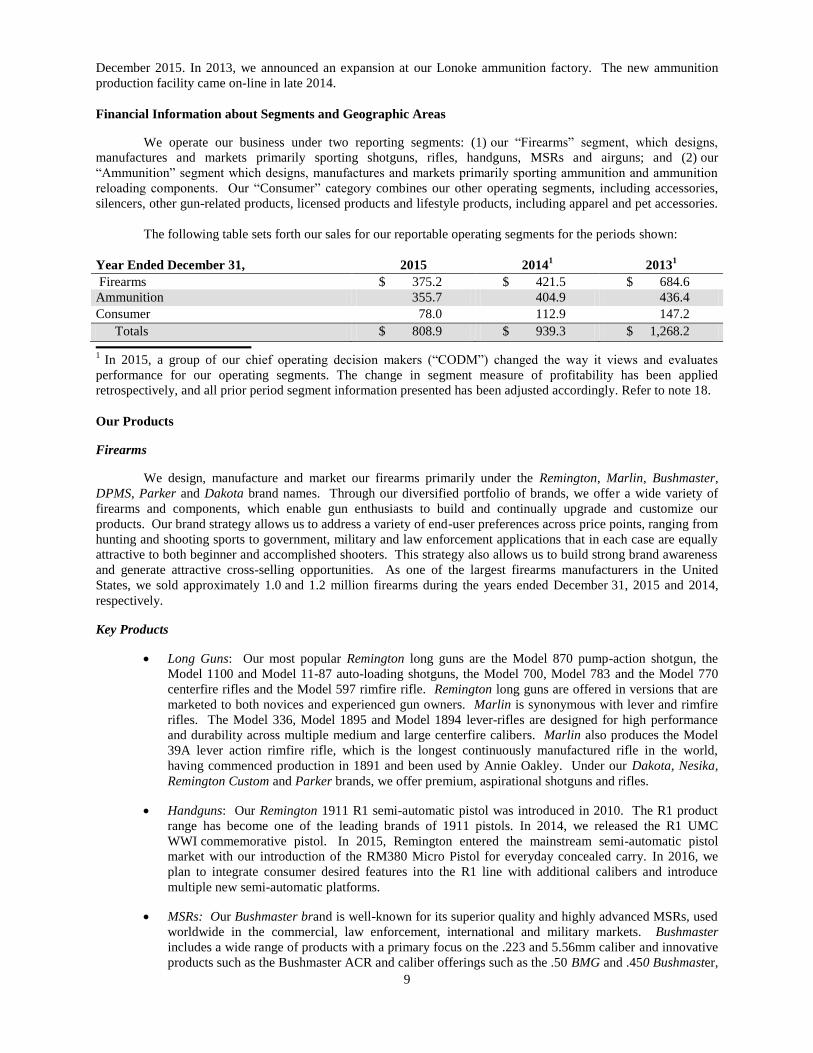
Financial Information about Segments and Geographic Areas
We operate our business under two reporting segments: (1) our “Firearms” segment, which designs,
manufactures and markets primarily sporting shotguns, rifles, handguns, MSRs and airguns; and (2) our
“Ammunition” segment which designs, manufactures and markets primarily sporting ammunition and ammunition
reloading components. Our “Consumer” category combines our other operating segments, including accessories,
silencers, other gun-related products, licensed products and lifestyle products, including apparel and pet accessories.
The following table sets forth our sales for our reportable operating segments for the periods shown:
Year Ended December 31, 2015 20141
20131
Firearms $ 375.2 $ 421.5 $ 684.6
Ammunition 355.7 404.9 436.4
Consumer 78.0 112.9 147.2
Totals $ 808.9 $ 939.3 $ 1,268.2
1 In 2015, a group of our chief operating decision makers (“CODM”) changed the way it views and evaluates
performance for our operating segments. The change in segment measure of profitability has been applied
retrospectively, and all prior period segment information presented has been adjusted accordingly. Refer to note 18.
Our Products
Firearms
We design, manufacture and market our firearms primarily under the Remington, Marlin, Bushmaster,
DPMS, Parker and Dakota brand names. Through our diversified portfolio of brands, we offer a wide variety of
firearms and components, which enable gun enthusiasts to build and continually upgrade and customize our
products. Our brand strategy allows us to address a variety of end-user preferences across price points, ranging from
hunting and shooting sports to government, military and law enforcement applications that in each case are equally
attractive to both beginner and accomplished shooters. This strategy also allows us to build strong brand awareness
and generate attractive cross-selling opportunities. As one of the largest firearms manufacturers in the United
States, we sold approximately 1.0 and 1.2 million firearms during the years ended December 31, 2015 and 2014,
respectively.
Key Products
Long Guns: Our most popular Remington long guns are the Model 870 pump-action shotgun, the
Model 1100 and Model 11-87 auto-loading shotguns, the Model 700, Model 783 and the Model 770
centerfire rifles and the Model 597 rimfire rifle. Remington long guns are offered in versions that are
marketed to both novices and experienced gun owners. Marlin is synonymous with lever and rimfire
rifles. The Model 336, Model 1895 and Model 1894 lever-rifles are designed for high performance
and durability across multiple medium and large centerfire calibers. Marlin also produces the Model
39A lever action rimfire rifle, which is the longest continuously manufactured rifle in the world,
having commenced production in 1891 and been used by Annie Oakley. Under our Dakota, Nesika,
Remington Custom and Parker brands, we offer premium, aspirational shotguns and rifles.
Handguns: Our Remington 1911 R1 semi-automatic pistol was introduced in 2010. The R1 product
range has become one of the leading brands of 1911 pistols. In 2014, we released the R1 UMC
WWI commemorative pistol. In 2015, Remington entered the mainstream semi-automatic pistol
market with our introduction of the RM380 Micro Pistol for everyday concealed carry. In 2016, we
plan to integrate consumer desired features into the R1 line with additional calibers and introduce
multiple new semi-automatic platforms.
MSRs: Our Bushmaster brand is well-known for its superior quality and highly advanced MSRs, used
worldwide in the commercial, law enforcement, international and military markets. Bushmaster
includes a wide range of products with a primary focus on the .223 and 5.56mm caliber and innovative
products such as the Bushmaster ACR and caliber offerings such as the .50 BMG and .450 Bushmaster,
10
with several new platforms currently under development. In 2014, we began initial production of the
Bushmaster C22 Carbine. Our DPMS brand is an innovator of MSRs with a broad range of caliber
offerings such as .308, .338, .243 and the new GII 308 platform. In addition, DPMS produces a range
of upper and lower assemblies, stocks and other gun components to a diverse customer base including
dealers and end-users. We also offer the R-15 and R-25 MRSs for hunting use through our Remington
brand.
Firearm Product Introductions
We consistently introduce new and innovative products. In 2016, we plan to introduce new handgun
platforms, which will significantly expand our handgun offering beyond our current 1911 and RM 380 offerings and
broaden our participation in the growing handgun market.
New Remington long gun projects for 2015 included the launch of our Model 783 bolt rifle within the
opening price point category as a scoped combo, providing superior performance and value. In 2016, we will
continue our expansion of Model 783 offerings with camouflage stocks in key hunting calibers. We also plan to
introduce our new V3 shotgun platform that will leverage the success of the patented Versa-Port gas system to the
largest consumer segment in semi-automatic shotguns.
Marlin has introduced several Limited Edition models, which include the 336C Limited Edition and the
1895 Limited Edition.
In 2014, we achieved a significant milestone in the MSR category with the launch of the DPMS GII 308
Platform. In 2015, we repositioned our DPMS Oracle and Sportical models to more effectively compete in the
market segment and launch our new Bushmaster Quick Response Carbine (“QRC”).
Ammunition
We sold approximately 2.7 billion and 2.8 billion rounds of ammunition during the years ended
December 31, 2015 and 2014, respectively, making us one of the largest manufacturers of commercial ammunition
in the United States. As one of only two major manufacturers of both firearms and ammunition in the United States,
we believe our ability to manufacture and sell ammunition creates a unique competitive advantage within the
industry, allowing us to solidify and extend our existing long-term relationship with our loyal customer base.
Key Products
Our most popular ammunition products include Remington Core-Lokt centerfire rifle ammunition and
UMC Centerfire ammunition, Premier STS and Nitro 27 shotgun target loads, which have won more trophies at the
Grand American Trap and World Skeet championship than any other brand. In addition to copper lead-free bullets,
Barnes is a supplier of loaded ammunition with their Barnes Vor-TX, new Precision Match and Range AR lines of
products.
Ammunition Product Introductions
In 2014, we celebrated 75 plus years of Remington Core-Lokt, our best selling centerfire hunting
ammunition with recently improved packaging. We expanded our Premium Pistol and Revolver Ammunition
offering with the Ultimate Defense Compact and full size handgun ammunition with a full line up of pistol offerings
specially designed for self-defense handgun customers. We added the Golden Saber Black Belt line for commercial
use as one of the best performing terminal performance products in the market. To complement our Ultimate
Muzzleloader rifle, we produced the Premier AccuTip slug, expanded the VOR-TX line to include a 120gr TAC-
TX, 300 AAC BLK offering for MSR shooters and a 280gr LRX 338 Lapua offering for long range hunting
applications. We released a brand new line of rifle low cost lead-free ammunition in 5.56mm and 300 AAC with the
new Barnes RangeAR product line. In addition, a new Barnes Precision Match line was released in 2015 in
5.56mm, .308 Win, .300 Win Mag, and .338 Lapua Mag, offering shooters one of the most accurate factory loaded
ammunition available. Finally, New American Clay and Field Reloadable Target Loads are releasing in 2016.
Consumer
We sell a wide variety of branded accessories, including gun care, cleaning products, silencers, muzzle
devices as well as aftermarket and replacement traditional and tactical gun parts. We believe we are one of the top
11
brands in complete firearm care, including cleaning chemicals, tools and kits. In order to better serve our
consumers, we also offer them access to these products through our online store.
In addition to offering a wide range of Remington branded accessories to the commercial market, we
provide accessory products to military, law enforcement and commercial markets through our AAC brand. We are
committed to growing our accessories line through innovation with a pipeline of products ranging from everyday
apparel to accessories created to satisfy outdoor lifestyles. That commitment is exemplified by our acquisitions of
TAPCO, a designer and marketer of American-made aftermarket accessories for firearms, and SMK, a leading
participant in the UK airgun market.
We also license our trademarks to carefully selected third parties that manufacture and market sporting and
outdoor products that complement our product lines. Currently, our trademarks are licensed for use on, among other
things, air guns, cutlery, apparel, caps, gun cases, sporting dog equipment, gun safes, and various other novelty
goods. We strive to ensure that the quality, image and appeal of these licensed products are consistent with our
brands’ images and the high-quality nature of our products. We believe that these licenses increase market
recognition of our brands, enhance our ability to market our core products and generate attractive, high margin
income. Additionally, we believe there are significant additional opportunities for our licensed products as
consumer preference is continuing to move toward an outdoor lifestyle.
Competition
Product image, performance, quality and innovation are the primary competitive factors in the firearms
industry, with price and customer service also being important. Our shotgun products compete with products
offered by O.F. Mossberg & Sons, Inc., Benelli, Winchester, Browning Arms Company, and Fabbrica d’Armi Pietro
Beretta S.p.A. Our centerfire and rimfire rifles compete with products offered by Sturm, Ruger & Co., Inc., Savage
Arms, Inc., Henry and Browning Arms Company. Our MSR products compete with Colt Defense, Smith & Wesson,
Rock River Arms, Stag Arms, Daniel Defense and Armalite.
In the ammunition market, we compete with the Winchester division of Olin Corporation, Vista Outdoors
and Hornady. Additionally, some imported ammunition brands compete in the domestic market and have gained
share in the shotshell category.
Manufacturing
We are one of the largest manufacturers of firearms in the United States. The majority of our revenue is
derived from our three key firearms facilities in Huntsville, Alabama, Ilion, New York and Mayfield, Kentucky and
our primary ammunition plant in Lonoke, Arkansas. In addition, we manufacture ammunition in Mona, Utah, and
firearms and ammunition in Sturgis, South Dakota. Certain of these facilities also provide factory repair services.
We also have firearm component manufacturing facilities in Lexington, Missouri and Lenoir City, Tennessee.
Seasonality
Although the sales of many of our products fall outside the September through December hunting season, a
portion of our sales are seasonal and concentrated toward the fall hunting season. As a result of the seasonal nature
of our sales and the payment terms under our billing practices, our historical working capital financing needs
generally have exceeded cash provided by operations during certain parts of the year. As a result, our working
capital financing needs tend to be greatest during the spring and summer months, decreasing during the fall and
reaching their lowest points during the winter.
Supply of Raw Materials
We have augmented and integrated our facilities and supply chain and have focused on improving our
operating efficiency. To manufacture our various firearms, ammunition and related products, we utilize numerous
raw materials, including steel, wood, lead, brass, powder and plastics, as well as parts purchased from independent
manufacturers. We have completed numerous lean manufacturing projects and six sigma efforts focused on supply
chain optimization.
For a number of our raw materials, we rely on a limited number of suppliers. For example, our brass strip,
lead and smokeless powder requirements in the United States and Canada are supplied by a few key vendors.
Where machining processes on certain of our firearms components are performed by a limited number of vendors,
we are actively pursuing in-house capabilities to mitigate supply chain dependency associated with our products.
12
See “1A.—Risk Factors—Risks Related to Our Business—We are dependent on a number of key suppliers. Loss of
or damage to our relationships with these suppliers could have a material adverse effect on our business, financial
condition, results of operations or cash flows.”
We have long-term relationships with most of our vendors and believe that all such relationships are good,
and do not currently anticipate any material shortages or disruptions in supply from these vendors.
The price and availability of production materials are affected by a wide variety of interrelated economic
and other factors, including alternative uses of materials and their components, changes in production capacity,
energy prices, commodity prices and governmental regulations. Specifically, some of our manufacturing sites have
experienced volatility in acquisition costs related to purchases of metals and other materials related to our business,
increased processing charges and increased energy costs. See “7.—Management’s Discussion and Analysis of
Financial Condition and Results of Operations—Liquidity and Capital Resources” and “7A.—Management’s
Discussion and Analysis of Financial Condition and Results of Operations—Quantitative and Qualitative Analysis
of Market Risk.”
Service and Warranty
We have support, service and repair facilities for our firearms products in order to meet the service needs of
our distributors, customers and consumers nationwide. We provide a variety of warranty programs for our new
firearms products manufactured in the United States to the original purchaser for defects in material and
workmanship for various periods, which commence on the registered date of purchase by the end consumer. Our
imported firearms products are warranted by our vendors for a period of one year commencing with the registered
date of purchase by the end consumer. We also provide limited warranties for our ammunition products. Warranty
costs associated with these programs were $5.8 million for the year ended December 31, 2015 and $6.2 million for
the year ended December 31, 2014.
Marketing and Distribution
We are a leading global manufacturer of firearms, ammunition and related products with a diverse portfolio
of category-defining brands including Remington, Marlin, Bushmaster, Barnes Bullets, AAC and DPMS. We sell
products to the commercial, law enforcement, international, government and military end-user markets.
We have shifted our business from a manufacturing-based “push system,” in which product volumes and
mix are determined based on available capacity, to a customer-focused “pull system,” in which customer preference
and consumer demand determine manufacturing decisions. We forecast what products customers demand by mining
our extensive and proprietary database of consumer data and we believe we are an industry leader in capturing and
analyzing point-of-sale statistics from key customers and distributors. Additionally, key account managers have
access to the full suite of our products, further leveraging our retail partners to assist in long range sales planning.
In addition to our significant commercial business, we also sell products to law enforcement, government
and military end-markets in the U.S. and internationally. These markets represented approximately 16% of net sales
for the year ended December 31, 2015. Our current end users and customers include various state and local police
departments, federal and military agencies such as the U.S. Army, FLETC, SOCOM, the U.S. Secret Service, the
Department of Homeland Security, the Bureau of Alcohol, Tobacco and Firearms, and important U.S. foreign allies.
We are increasing our presence in social media as consumers become more comfortable with technology
and the ease of access improves across all demographics. While broadcast and digital marketing are important, print
publications, press relations and print advertisements are a critical component of our marketing strategy.
Geographic Areas
Net sales from customers outside of the United States were $82.3 million, $81.5 million and $82.2 million
for each of the years ended December 31, 2015, 2014 and 2013, respectively. Net sales from customers in Canada
were $26.9 million, $38.9 million and $31.0 million for each of the years ended December 31, 2015, 2014 and 2013,
respectively. The carrying amounts of long-lived, tangible assets maintained outside of the United States were $0.4
million, $0.4 million and $0.6 million at December 31, 2015, 2014 and 2013, respectively.
Sales outside of the United States accounted for approximately 10%, 9% and 6% of our total net sales for
the years ended December 31, 2015, 2014 and 2013, respectively. Our sales personnel and manufacturers’ sales
representatives market to foreign distributors generally on a nonexclusive basis and for a one-year term.
13
Customer Concentration
Approximately 13%, 9% and 11% of our total net sales from all reportable business segments for the years
ended December 31, 2015, 2014 and 2013, respectively, consisted of sales made to one customer, Wal-Mart. The
loss of this customer or a substantial reduction in sales to this customer could adversely affect our financial
condition, results of operations or cash flows. No other single customer comprised more than 10% of total sales in
2015. No material portion of our business is subject to renegotiation of profits or termination of contracts at the
election of a government or any other type of purchaser. See “1A.—Risk Factors—Risks Relating to Our
Business—A substantial amount of our business comes from one “national account” customer. Loss of business
from this customer could adversely affect our financial condition, results of operations or cash flows.”
Research and Development
Our research and development team is focused on new product development and improving existing
products based on consumer needs and demands and in response to competition in the market. Research and
development expenditures were approximately $17.0 million, $20.6 million and $16.6 million in the years ended
December 31, 2015, 2014 and 2013, respectively.
Patents, Trademarks and Copyrights
Our operations are dependent upon the Remington and Bushmaster trademarks and the Remington,
Bushmaster and DPMS logos. In addition, we also own, among others, the Marlin, AAC and Dakota trade names
and trademarks. Some of the other trademarks that we use, however, are nonetheless identified with and important
to the sale of our products. Our business is not dependent to a material degree on patents, copyrights or trade
secrets. We do not believe that the expiration of any of our patents will have a material adverse effect on our
financial condition or our results of operations. We likewise do not believe that any of our licenses of intellectual
property to third parties are material to our business, taken as a whole.
In June 2000, Remington formed RA Brands L.L.C. (“RA Brands”), a Delaware limited liability company
and wholly-owned subsidiary of Remington, to which Remington transferred ownership of all of its patents,
trademarks and copyrights. RA Brands licenses such trademarks to Remington at an arm’s length royalty rate. In
July 2011, Remington contributed its interest in RA Brands to FGI Opco. In 2012, we acquired intellectual property
related to muzzle loading adapters for approximately $0.8 million. We believe that we have adequate policies and
procedures in place to protect our intellectual property.
Regulation
The manufacture, sale, purchase, possession, import, export, and use of firearms are subject to extensive
federal, state and local governmental regulations. The primary federal laws are the National Firearms Act of 1934
(“NFA”), the Gun Control Act of 1968 (“GCA”), the Arms Export Control Act of 1976 (“AECA”) and the Internal
Revenue Code provisions applicable to the Firearms and Ammunition Excise Tax (“FAET”), which have been
amended from time to time. These regulations are administered and enforced by government agencies including the
Bureau of Alcohol, Tobacco, Firearms and Explosives, the Department of Justice, the Directorate of Defense Trade
Controls, the Department of State, the Bureau of Industry and Security, the Department of Commerce, the Alcohol
and Tobacco Tax and Trade Bureau, and the Department of Treasury.
We maintain valid federal licenses and registrations at our locations as required by these agencies for us to
import, export, manufacture and sell firearms and ammunition. The NFA places various additional restrictions on
certain firearms defined in that law and its regulations including fully automatic firearms, short barreled rifles, short
barreled shotguns, silencers and destructive devices. We manufacture or import a limited number of products that
are regulated under the NFA primarily for official government and law enforcement end users. The GCA places
certain restrictions on the interstate sale of firearms, among other things. The AECA requires approved licenses or
other authorizations to be in place prior to the import or export of certain defense articles or services. The FAET
imposes a federal excise tax on the sale of or use by the manufacturer, producer or importer of firearms and
ammunition. There is no assurance that the administrative branches responsible for approving import and export
licenses, as well as authorizations or transfers of NFA firearms or other firearms to our customers will do so in all
cases, and failure to obtain such approvals could adversely affect our business. In addition, changes in the tax laws
or rates could adversely affect our business.

14
In 2004, the United States Congress declined to renew the Assault Weapons Ban (“AWB”) which generally
prohibited the manufacture of certain firearms defined under that statute as “assault weapons” as well as the sale or
possession of “assault weapons” except for those that were manufactured prior to the law’s enactment. Various
states and local jurisdictions have adopted their own version of the AWB and some of those apply to Bushmaster,
DPMS and certain Remington sporting firearms products. We cannot guarantee that an “assault weapons” ban
similar to the AWB, or another version thereof, will not be re-enacted. Legislation of this type, if enacted, could
have a material adverse effect on our business.
In January 2016, in light of recurring high-profile crimes by individuals involving firearms, President
Obama announced executive actions that serve to, among other things, enhance background checks and broaden the
definition of a “dealer” under current gun laws. Other objectives of the executive actions are to reduce sales of guns
that are not required to be tracked and for which the seller is not required to conduct a background check, to increase
reporting by dealers of unauthorized attempts to acquire guns, to provide greater access to information for sellers
about prospective buyers of guns, to include mental health treatment and reporting as part to the firearm background
check system, and to fund research in gun safety technology. The 2016 executive actions follow a previous attempt
by President Obama to act through executive action in 2013, when he announced 23 executive actions intended to
reduce violent acts by individuals, which were overridden by Congress. No assurance can be given as to whether
some or all of these actions will be adopted, and if they are adopted, the effect they may have on our business,
results of operations and financial condition.
At the federal level, bills have, in the past, been introduced in Congress to establish, and to consider the
feasibility of establishing, a nationwide database recording so-called “ballistic images” of ammunition fired from
new firearms. Should such a mandatory database be established, the cost to the Company and its customers could be
significant, depending on the type of firearms and ballistic information included in the database. Other bills have
been introduced in Congress in the past that would restrict or prohibit the manufacture, transfer, importation or sale
of certain calibers of handgun ammunition, impose a tax and import controls on bullets designed to penetrate
bullet-proof vests, impose a special occupational tax and registration requirements on manufacturers of handgun
ammunition, and increase the tax on handgun ammunition in certain calibers.
In addition to federal requirements, state and local laws and regulations may place additional restrictions on
firearms and ammunition manufacture, sale, purchase, possession and use. Since the beginning of 2013, more than a
dozen states and Washington, D.C. have enacted new laws aimed at strengthening restrictions against guns. For
example, in the past, a small number of states sought to implement “ballistic imaging” registries of ammunition fired
from new handguns. At least four states have previously introduced, or currently have, bills proposing requirements
for “bullet serialization” for ammunition or “microstamping” capabilities for certain firearms. Some of these bills
would apply to ammunition and firearms of the kind we produce. California passed semi-automatic pistol
microstamping legislation that went into effect in May 2013, and has resulted in the cessation of semi-automatic
pistol sales in California by some large manufacturers. Several other states require firearms to be sold with internal
or external locking mechanisms.
Federal and some state regulations ban the use of lead based ammunition for certain types of hunting.
Federally, it is unlawful to use lead-shot for waterfowl hunting. At the state level, California currently bans the use
of lead ammunition for any hunting in certain regions, and states such as Arizona and Utah have a voluntary lead-
based ammunition reduction program. Multiple lawsuits and proposed pieces of legislation have been introduced in
recent years in an attempt by environmental groups to increase the restrictions on lead-based ammunition.
Restrictions on lead-based ammunition could have an adverse effect on our traditional ammunition products but may
benefit the sales of our copper, and other non-lead ammunition. No assurance can be given as to the effect such
legislation may have on our business, results of operations and financial condition.
Although numerous jurisdictions presently have mandatory waiting periods for the sale of handguns (and
some for the sale of long guns as well), there are currently few restrictive state or municipal regulations applicable to
handgun ammunition. Our firearms are covered under several state regulations requiring guns to be sold with
internal or external locking mechanisms. Some states are considering mandating certain design features on safety
grounds, most of which would be applicable only to handguns. There can be no assurance that the regulation of
firearms and ammunition will not become more restrictive in the future, and more restrictive legislation in this area
could have a material adverse effect on our business.
We are no longer a defendant in any lawsuits brought by municipalities against participants in the firearms
industry. In addition, legislation has been enacted in approximately 34 states precluding such actions. Similar
federal legislation, entitled “The Protection of Lawful Commerce in Arms Act” (“PLCAA”) was signed into law
15
in 2005. However, the applicability of the law to various types of governmental and private lawsuits has been
challenged. Any court decision restricting the applicability of the law could adversely impact the business of the
Company.
We believe that existing federal and state regulation regarding firearms and ammunition has not had a
material adverse effect on our sales of these products to date. However, there can be no assurance that federal, state,
local or foreign regulation of firearms and/or ammunition will not become more restrictive in the future and that any
such development would not have a material adverse effect on our business either directly or by placing additional
burdens on those who distribute and sell our products or those consumers who purchase our products. In addition,
future incidents of violence by individuals involving firearms could increase pressure to adopt some or all of the
proposed regulations described above or spur additional regulatory proposals at the state and federal levels and call
for the adoption of such proposals. Any such development might have a material adverse effect on our business,
financial condition, results of operations or cash flows. See “—1A. Risk Factors—Risks Relating to Our Business—
Our business is subject to legislation and regulation by the U.S. federal government and other foreign governments
that may restrict our operations, increase our costs of operations, or adversely affect the demand for our products by
limiting the availability and/or increasing the cost of our products”, “—1A. Risk Factors—Risks Relating to Our
Business—Future governmental legislation and regulation may restrict our operations, increase our costs of
operations, or adversely affect the demand for our products by limiting the availability and/or increasing the cost of
our products’ and “—1A. Risk Factors—Risks Relating to Our Business—Our business is subject to legislation and
regulation at the state and local level that may restrict our operations and increase our costs of operations, in ways
that vary across jurisdictions.”
Environmental Matters
Our operations are subject to a variety of federal, state and local environmental laws and regulations that
govern, among other things, the discharge of hazardous materials into the air and water, handling, treatment, storage
and disposal of such materials and remediation of contaminated soil and groundwater. We have programs in place
that monitor compliance with these requirements and we believe our operations are in material compliance with
them. In the normal course of our manufacturing operations, we are subject to occasional governmental proceedings
and orders pertaining to waste disposal, air emissions and water discharges into the environment. We believe that
we are in compliance with applicable environmental regulations in all material respects, and that the outcome of any
such proceedings and orders will not have a material adverse effect on our business.
Under the terms of a legacy asset purchase agreement from 1993 (“Purchase Agreement”) with E.I. DuPont
Nemours & Company (“DuPont”) relating to the Remington business (“Asset Purchase”), DuPont agreed to retain
responsibility for certain pre-closing environmental liabilities. Remington also entered into an agreement with
DuPont with respect to cooperation and responsibility for specified environmental matters. See “3.—Legal
Proceedings and Related Matters” and “3. —Legal Proceedings and Related Matters—Certain Indemnities.” To
date, DuPont has honored its responsibilities under the Purchase Agreement, but no assurance can be given that it
will continue to do so in the future.
There are various pending proceedings associated with environmental liability for which DuPont and its
affiliates have accepted liability. Our obligations in these cases are not expected to be material.
The Company has also conducted remediation activities at its former facilities. Costs for remediation are
not expected to be material.
Based on information known to us, we do not expect current environmental regulations or environmental
proceedings and claims to have a material adverse effect on our results of operations, financial condition or cash
flows. However, it is not possible to predict the impact of future environmental compliance requirements or the cost
of resolution of any future environmental proceedings and claims, in part because the scope of the remedies that may
be required is not certain, liability under some federal environmental laws is in some cases joint and several in
nature, and environmental laws and regulations are subject to modification and changes in interpretation. There can
be no assurance that environmental regulation will not become more burdensome in the future or that unknown
conditions will not be discovered and that any such development would not have a material adverse effect on our
business.

16
Employees
As of December 31, 2015, we employed approximately 3,400 full-time employees. An additional work
force of temporary employees is engaged during peak production schedules at certain of our manufacturing
facilities.
As of December 31, 2015, approximately 1,100 employees were members of the United Mine Workers of
America (“UMWA”) at our Ilion, New York manufacturing facility. The collective bargaining agreement with the
UMWA was renegotiated effective October 2012 and expires in October 2017. Employees at our other
manufacturing facilities are not represented by unions. There have been no significant interruptions or curtailments
of operations due to labor disputes since prior to 1968 and we believe that our relations with our employees are
satisfactory.
17
1A. RISK FACTORS
Risks Relating to Our Business
Our business is subject to legislation and regulation by the U.S. federal government and other foreign
governments that may restrict our operations, increase our costs of operations, or adversely affect the demand for
our products by limiting the availability and/or increasing the cost of our products.
The manufacture, sale, purchase, possession, import, export and use of firearms, ammunition and certain of
our consumer businesses are subject to extensive federal governmental regulation. Current federal regulations
include:
• licensing requirements for the manufacture and/or sale of firearms and ammunition;
• a national system of instant background checks for all purchases of firearms from federal license
holders, including purchases of our firearms products and purchases from license holders at gun
shows; and
• Department of State and Commerce Department licensing that governs the international sale, export
and international distribution of firearms and ammunition.
We are issued a Federal Firearms License by, and pay Special Occupational Taxes to, the Bureau of
Alcohol, Tobacco, Firearms and Explosives of the U.S. Department of Justice to be able to manufacture firearms
and destructive devices in the U.S. These federal agencies also require the serialization of receivers or frames of our
firearm products and recordkeeping of our production and sales. Our places of business are subject to compliance
inspections by these agencies. Compliance failures, which constitute violations of law and regulation, could result in
the assessment of fines and penalties by these agencies, including license revocation, or other disruption of our
business. Any curtailment of our privileges to manufacture, sell, or distribute our products could have a material
adverse effect on our business.
We are also required to submit forms to the Bureau of Alcohol, Tobacco, Firearms and Explosives and to
obtain advance approval of certain transfers of firearms, including exports from the United States. Failure to obtain
required approvals when required results in a delay in shipping products to customers. Delays in shipping products
can cause us to incur late delivery penalties and delay the recognition of sales for financial reporting purposes.
In addition, we are required to comply with legislation in the foreign jurisdictions with which we do
business. We believe that existing federal and foreign government legislation relating to the regulation of firearms
and ammunition has not had a material adverse effect on our sales of our products, but any failure to comply with
such legislation could result in penalties or a reduction in our ability to continue certain of our operations without
delay or at all, which could have a material adverse effect on our business.
Future governmental legislation and regulation may restrict our operations, increase our costs of operations, or
adversely affect the demand for our products by limiting the availability and/or increasing the cost of our
products.
Future regulations may adversely affect our operations by limiting the types of products that we can
manufacture and/or sell, or imposing additional costs on us or on our customers in connection with the manufacture
and/or sale of our products. Such regulations may also adversely affect demand for our products by imposing
limitations that increase the costs of our products, making it more difficult or cumbersome for our distributors or end
users to transfer and own our products, or creating negative consumer perceptions with respect to our products. Bills
have, in the past, been introduced in Congress to establish, and to consider the feasibility of establishing, a
nationwide database recording so-called “ballistic images” of ammunition fired from new guns. Should such a
mandatory database be established, the cost to us, our distributors and our customers could be significant, depending
on the type of firearms and ballistic information included in the database. Bills have also been introduced in
Congress in the past that would affect the manufacture and sale of ammunition, including bills to regulate the
manufacture, importation and sale of armor-piercing bullets, to prohibit the manufacture, transfer or importation of
.25 caliber, .32 caliber and 9 mm handgun ammunition, and to increase or impose new taxes on the sales of certain
types of ammunition, as well as bills addressing the use of lead in ammunition. Though no new firearms legislation
18
has been passed by Congress in recent years, future bills that apply to the ammunition we produce, if enacted, could
have a material adverse effect on our business.
In September 2004, the U.S. Congress declined to renew the Federal Assault Weapons Ban of 1994
(“AWB”), which generally prohibited the manufacture of certain firearms defined under that statute as “assault
weapons” and the sale or possession of “assault weapons.” Various states and local jurisdictions have adopted their
own version of the AWB, some of which apply to Bushmaster, DPMS and certain Remington sporting firearms
products. If a statute similar to AWB were to be re-enacted at the federal level, it could have a material adverse
effect on our business.
In January 2016, in light of recurring high-profile crimes by individuals involving firearms, President
Obama announced executive actions that serve to, among other things, enhance background checks and broaden the
definition of a “dealer” under current gun laws. Other objectives of the executive actions are to reduce sales of guns
that are not required to be tracked and for which the seller is not required to conduct a background check, to increase
reporting by dealers of unauthorized attempts to acquire guns, to provide greater access to information for sellers
about prospective buyers of guns, to include mental health treatment and reporting as part to the firearm background
check system, and to fund research in gun safety technology. The 2016 executive actions follow a previous attempt
by President Obama to act through executive action in 2013, when he announced 23 executive actions intended to
reduce violent acts by individuals, which were overridden by Congress. No assurance can be given as to whether the
most recent actions will again be overridden by legislative action or will ultimately be adopted, or if they are
adopted, what kind of effect they may have on our business, results of operations and financial condition.
We believe that existing state and federal legislation relating to the regulation of firearms and ammunition
has not had a material adverse effect on our sales of these products. However, the regulation of firearms and
ammunition may become more restrictive at any time in the future and any such development might have a material
adverse effect on our business, financial condition, results of operations or cash flows. In addition, future incidents
of violence by individuals involving guns could increase pressure to adopt some or all of the proposed regulations
described above or spur additional regulatory proposals at the state or federal levels and call for the adoption of such
proposals. Any such development might have a material adverse effect on our business, financial condition, results
of operations or cash flows. Finally, we may become subject to existing regulation as we enter into new markets and
develop and sell new products. Regulatory proposals, even if never enacted, may affect firearms or ammunition
sales as a result of consumer perceptions. See “1.—Business—Regulation.”
Although we are primarily a manufacturer of long guns and ammunition, the trends regarding firearms
regulation, as well as pending industry litigation, and the consumer perception of such developments, may adversely
affect sales of firearms, ammunition and other shooting-related products not applicable to long guns by increasing
costs of production and/or reducing the number of distribution outlets for our products.
Our business is subject to legislation and regulation at the state and local level that may restrict our operations
and increase our costs of operations, in ways that vary across jurisdictions.
In addition to federal legislation, state and local laws and regulations may place additional restrictions on
the ownership and transfer of firearms and ammunition as described below.
• There has been an increase in activity at the state level relating to more restrictive legislation intended
to reduce violent acts by individuals. Following the shooting at Sandy Hook, the Connecticut state
legislature passed a comprehensive gun control package, including a ban on assault weapons and large-
capacity ammunition magazines. Similarly, the state of New York enacted a gun control act, the NY
SAFE ACT, in January 2013 that expands the state's ban on assault weapons, requires current owners
of assault weapons to register them with the police, requires background checks to buy ammunition,
and adds measures to keep guns away from the mentally ill. There are currently 13 states, including
Colorado, California and New Jersey that have full point-of-contact background check legislation and
seven states, including Maryland, New Hampshire and North Carolina, which have partial point-of-
contact background check legislation.
• Some other states have enacted, and others are considering enacting, legislation that restricts or
prohibits the ownership, use or sale of specified categories of firearms and ammunition. Many states
currently have mandatory waiting period laws in effect for the purchase of firearms, including rifles
19
and shotguns. Although there are few restrictive state or local regulations applicable to ammunition,
several jurisdictions are considering such restrictions for a variety of reasons.
• Some states have enacted regulations prohibiting the sale of firearms unless accompanied by an
internal and/or external locking device. In several states, this requirement is imposed on both handguns
and long guns. Some states are also considering mandating the inclusion of various design features on
safety grounds. Most of these regulations as currently contemplated would be applicable only to
handguns.
• In the past, a small number of states operated registries of so-called “ballistic images” of ammunition
fired from new guns. Although Maryland became the last state to repeal these measures in May 2015,
these or other states may re-enact such measures in the future.
We continue to monitor changes in legislation across the states in which we operate, but no assurance can
be given that differences across these jurisdictions will not prove costly or have a material effect on our results of
operations.
Unfavorable publicity or public perception of the firearms industry could adversely impact our operating results
and reputation.
As a manufacturer of firearms, our business is subject to risks associated with negative public opinion.
Recent incidents involving the firearms industry, including events of violence by individuals using firearms, and the
media coverage thereof, may adversely impact our reputation and, in the long run, the demand for our firearms
products. We have received media attention associated with gun-related incidents. In addition, increases in gun-
related incidents are likely to negatively influence public opinion of the firearms industry or firearms companies.
Any negative publicity, whether or not tied to specific events, or an adverse outcome in litigation, could adversely
affect our business, financial condition, results of operations or cash flows and may expose us to increased
regulatory action.
Because of the nature of potential injuries relating to the manufacture and/or sale of firearms and ammunition,
certain negative public perceptions of our products, recent efforts to expand liability of manufacturers of
firearms and ammunition, product liability cases and claims, and insurance costs associated with such cases and
claims, as well as related class action claims alleging economic harm, may cause us to incur significant costs.
We are currently defending product liability litigation involving Remington brand firearms (including
firearms manufactured under the Marlin, Bushmaster and H&R names) and our ammunition products (including
ammunition manufactured under the UMC and Peters names). As of December 31, 2015, we had a number of
individual bodily injury cases and pre-litigation claims in various stages pending, primarily alleging defective
product design, defective manufacture and/or failure to provide adequate warnings. Some of these cases seek
punitive as well as compensatory damages. We also have two class action cases pending relating to breach of
warranty claims concerning certain of our firearms products where economic damages are sought. In December
2014, pending court approval, we reached a settlement with respect to one such class action suit, which requires us
to offer to replace the triggers on certain of our model rifles. The replacement of the triggers is not a result of a recall
or an admission of liability regarding the functioning of the current models, but such measures may cause us to incur
significant costs. In addition, to the extent our products are the subject of negative publicity related to alleged
defects, including by way of news stories, news articles or other forms of public or social media, related product
liability claims could increase.
In December 2014, we were named as a defendant in a wrongful death litigation case related to the use of
one of our Bushmaster firearms in the 2012 shootings in Newtown, Connecticut. In addition, we are currently
defending claims including, among other things, product liability claims and certain class actions pleading economic
damages resulting from the use of our products. We are also currently defending numerous lawsuits, claims,
investigations and proceedings, including commercial, environmental, trade mark, trade dress and employment
matters that arise in the ordinary course of business. We are vigorously defending ourselves in the lawsuits to which
we are subject. There can be no assurance, however, that we will not have to pay significant damages or amounts in
settlement above our insurance coverage. Litigation of this nature is expensive and time consuming and may divert
the time and attention of our management. Any unfavorable outcome or prolonged litigation could have a material
adverse effect on our business, financial condition, results of operations and cash flows.
20
The nature and extent of liability based on the manufacture and/or sale of firearms and ammunition is
uncertain, particularly as to firearms and ammunition, and if we were to incur significant liability as a result of any
related claims, our resources may not be adequate to cover such claim and/or other pending and/or future product
liability and product related occurrences, cases or claims, in the aggregate, and such cases and claims could result in
a material adverse effect upon our business, financial condition or results of operations. In addition, insurance
coverage for these risks is expensive and relatively difficult to obtain. Our insurance costs were approximately
$2.4 million and $3.8 million for the years ended December 31, 2015 and 2014, respectively. Any inability to obtain
insurance, any significant increases in the cost of insurance we obtain, or any losses in excess of our insurance
coverage could have a material adverse effect on our business, financial condition or results of operations. See “3.—
Legal Proceedings.”
Significant risks are inherent in the day-to-day operations in our business.
Furthermore, the day-to-day activities of our business involve the operation of machinery and other
operating hazards, including worker exposure to lead and other hazardous substances. As a result, our operations can
cause personal injury or loss of life, severe damage to and destruction of property and equipment, and interruption of
our business. Many of our products are of the type that can cause accidental damage, injury or death or can
potentially be used in incidents of workplace violence. We could be named as a defendant in a lawsuit asserting
substantial claims upon the occurrence of any of these events. Although we maintain insurance protection in
amounts we consider to be adequate, this insurance could be insufficient in coverage and may not be effective under
all circumstances or against all hazards to which we may be subject. If we are not fully insured against a successful
claim, there could be a material adverse effect on our financial condition and results of operations.
Unfavorable market trends and regulatory concerns could adversely affect demand for our products and our
business.
We believe that a number of trends that currently exist may affect the hunting and shooting sports market,
including:
• the development of rural property in many locations has curtailed or eliminated access to private and
public lands previously available for hunting;
• environmental issues, such as concern about lead in the environment, a component in our products; and
• decreases in consumer confidence and levels of consumer discretionary spending.
These trends, or other trends that affect the market for sporting rifles, may have a material adverse effect on
our business by reducing industry sales of firearms, ammunition and other shooting-related products.
Government cuts in defense spending may have an adverse impact on our business.
On March 1, 2013, automatic spending cuts by the U.S. government included as part of the Budget Control
Act of 2011 (the “BCA”) became effective. Spending cuts under the BCA are evenly divided amongst defense
spending and domestic spending. For the year ended December 31, 2015, our net sales to law enforcement,
government and the military, both in the U.S. and internationally, represented approximately 16% of our total net
sales. We cannot at this time predict or provide any assurances as to whether or not the spending cuts will remain in
effect and, if they do, how they will affect our business. To the extent the spending cuts remain in place, our sales to
the U.S. law enforcement, government and the military communities could be adversely affected, which in turn
could have a material adverse impact on our business, financial condition, results of operations or cash flows.
Our business is subject to economic and market factors beyond our control or ability to predict.
The sale of our products depends upon a number of factors related to the level of consumer spending,
including the general state of the economy and the willingness of consumers to spend on discretionary items.
Historically, the general level of economic activity has significantly affected the demand for sporting goods products
in the hunting and shooting sports and related markets. As economic activity slows, consumer confidence and
discretionary spending by consumers declines. Lower consumer spending and other competitive pressures arising
from any significant or prolonged economic downturn could have a material adverse impact on our financial
condition and results of operations, and such impact could be intensified the amount of debt we have outstanding.
21
Significant increases in commodity and energy prices could have a material impact on our financial condition,
results of operations or cash flows.
The manufacturing of our products is dependent upon the availability of raw materials such as lead, copper,
zinc, steel and brass. Increases in the prices of any of these raw materials as well as an increase in energy prices
could have a material impact on our financial condition. We can provide no assurance as to the future trends of these
conditions or to what extent future increases could be offset through customer price increases.
Our results of operations are affected by fluctuations in business and, as a result, our customers’ inventory
management practices have an effect on our business.
Many of our firearms products are purchased in anticipation of use during the fall hunting season. As a
result of the seasonal nature of our sales, our historical working capital financing needs generally have exceeded
cash provided by operations during certain parts of the year. Our working capital financing needs tend to be higher
during the spring and summer months, decreasing during the fall and reaching their lowest points during the winter.
In addition, we believe that, in the past, deteriorations in economic conditions have caused customers,
primarily dealers and chains, to defer purchases of our products until later in the core fall hunting seasons
(September through December) and to utilize lower inventory levels than during prior periods. This overall trend to
defer purchases continues to date, and there can be no assurance that such trends will not continue.
Our results of operations are also affected by fluctuations due to the timing of the manufacture and delivery
of large domestic and international governmental orders, which tend to be disproportionately large in value. This
may extend the period of time during which we carry inventory and may result in an uneven distribution of net sales
from these contracts between periods.
As a result of these fluctuations in our sales and our customers’ inventory management practices, our
working capital financing needs may significantly exceed cash provided by operations during certain periods during
the year, and therefore we may be required to rely on borrowings under our ABL Revolver for working capital
needs.
A substantial amount of our business comes from one “national account” customer. Loss of business from this
customer could adversely affect our financial condition, results of operations or cash flows.
Our dedicated sales force and key account managers market our products directly to national accounts
(consisting primarily of mass merchandisers) and to federal, state and local government agencies. Approximately
13%, 9% and 11% of our total net sales for the years ended December 31, 2015, 2014 and 2013, respectively, were
attributable to one national account, Wal-Mart. Our sales to Wal-Mart are generally not governed by a written long-
term agreement. In the event that Wal-Mart incurs financial difficulty or significantly reduces or terminates its
purchases of firearms and/or ammunition from us, our financial condition, results of operations or cash flows could
be adversely affected.
We are dependent on a number of key suppliers. Loss of or damage to our relationships with these suppliers
could have a material adverse effect on our business, financial condition, results of operations or cash flows.
To manufacture our various products, we use many raw materials, including steel, zinc, lead, brass, copper,
plastics and wood, as well as manufactured parts purchased from independent manufacturers. An extended
interruption in the supply of these or other raw materials or in the supply of suitable substitute materials would
disrupt our operations, which could have a material adverse effect on our business, financial condition and results of
operations. Furthermore, we may incur additional costs in sourcing raw materials from alternative producers.
For a number of our raw materials, we rely on just a few suppliers and, in some instances, we have sole
supplier relationships. Alternative sources, many of which are foreign, exist for each of these materials. We do not,
however, currently have significant supply relationships with any of these alternative sources and, therefore, the
materials may be more expensive. We cannot estimate with any certainty the length of time that would be required
to establish alternative supply relationships, or whether the quantity or quality of materials that could be so obtained
would be sufficient.
22
In addition, we rely on a limited number of vendors to perform machining processes on key rifle
components. Any disruption of the operations of one of our key vendors could materially impact our ability to obtain
certain rifle components. In the event that we lose one of our principal vendors, we may not be able to find an
alternative vendor in a timely manner and, as a result, our ability to produce rifles could be materially and adversely
affected.
We may not be able to compete successfully within our highly competitive markets, which could adversely affect
our business, financial condition, results of operations or cash flows.
The markets in which we operate are highly competitive. Product image, performance, quality, price and
innovation are the primary competitive factors in the firearms industry. Product differentiation exists to a much
lesser extent in the ammunition industry, where price is the primary competitive factor. Reductions in price by our
competitors in the ammunition industry could cause us to reduce prices or otherwise alter terms of sale as a
competitive measure, which could adversely affect our business, financial condition, results of operations or cash
flows.
Our competitors vary by product line. Some of our competitors are subsidiaries of large corporations with
substantially greater financial resources than us. Although we believe that we compete effectively with all of our
present competitors, we may not continue to do so, and our ability to compete could be adversely affected by our
significant amount of debt. See “1.—Business—Competition.”
Acquisition protocol and contract negotiations with government, law enforcement and military channels could
result in increased volatility and uncertainty to the timing of our sales revenues.
Government, law enforcement and military sales channels are typically in the form of contractual
arrangements pursuant to Federal Acquisition Regulations (FAR)/Defense Federal Acquisition Regulation
Supplement (DFARS), laws of international military buyers, or law enforcement distributor agreements. We sell
certain firearms, accessories, and ammunition products to these channels. A percentage of our sales revenues could
therefore be subject to customer acquisition protocol and contract negotiations. This could cause sales revenue from
these channels to be increasingly volatile and uncertain with respect to the timing of orders and may have an impact
on delivery schedules.
For instance, we are subject to business risks specific to companies engaged in supplying defense-related
equipment and services to the U.S. government and other governments. Our contracts with the U.S. government may
be indefinite delivery, indefinite quantity (“IDIQ”) contracts under which the customer places orders at its
discretion. Although these contracts generally have a three to five year term, they are funded only when orders are
placed and, as a result, sales to the U.S. government could vary significantly from year to year. Although our
agreements with foreign governments typically include firm quantities and delivery schedules, foreign governments
generally have the ability to terminate for convenience, and they also generally have standard acquisition protocols
that impact the timing and execution of contract awards. Accordingly, our net sales from year to year with respect to
such customers are dependent on government appropriations, federal law and acquisition guidelines and are subject
to uncertainty. The U.S. government or any allied foreign government may decide to reduce government defense
spending in the programs in which we participate. Sovereign budget deficits are likely to put long term pressure on
defense budgets in countries to which we may sell our products. There can be no assurances that the amount spent
on defense by countries to which we sell our products will be maintained or that individual defense agencies will
allocate a percentage of their budget for the purchase of small arms. The loss of, or a significant reduction in,
government funding, for any program in which we participate, could have a material adverse effect on our sales and
thus negatively affect our business, financial condition, results of operations or cash flows.
Furthermore, our contracts with the U.S. government may be IDIQ contracts under which the government
may order up to a maximum quantity specified in the contract but is only obligated to order a minimum quantity. We
may incur capital or other expenses in order to be prepared to manufacture the maximum quantity that may not be
fully recouped if the U.S. government orders a smaller amount. The U.S. government may order less than the
maximum quantity for any number of reasons, including a decision to purchase the same or similar product from
others despite the existence of an IDIQ contract. Our failure to realize anticipated revenues from IDIQ contracts
could negatively affect our results of operations.
23
In addition, the U.S. government and other government counterparties may suspend or permanently prevent
us from receiving new contracts or from extending existing contracts based on violations or suspected violations of
procurement laws or regulations or terminate our existing contracts.
A significant number of U.S. government and other government contracts are obtained through competitive
bidding. We will not win all of the contracts for which we compete and, even when we do, contracts awarded to us
may not result in a profit. We are also subject to risks associated with the substantial expense, time and effort
required to prepare bids and proposals for competitively awarded contracts that may not be awarded to us. In
addition, our customers may require terms and conditions that require us to reduce our price or provide more
favorable terms if we provide a better price or terms under any other contract for the same product. Such “most
favored nation” clauses could restrict our ability to competitively bid for government and other contracts.
Some of our contracts with foreign governments are or will be subject to the fulfillment of offset commitment or
industrial cooperation agreements that could impose additional costs on us and that we might not be able to
timely satisfy, possibly resulting in the assessment of penalties or even debarment from doing further business
with that government.
Some countries with which we currently or may in the future do business with may impose offset purchase
commitments, also known as industrial cooperation commitments, in return for purchasing our products and
services. These commitments vary from country to country and generally require us to commit to make direct or
indirect purchases or investments in the local economy. The gross amount of the offset purchase commitment arising
from a sales contract is typically a function of the value of the contract. Failure to satisfy offset purchase
commitments can result in penalties or blacklisting against awards of future contracts. If we are unable to fulfill
those commitments, we may be subject to future penalties or transaction costs or even disbarment from doing
business with a government.
Our law enforcement sales are achieved by way of designated law enforcement distributors. While we
generally are not a party to agreements directly with a U.S. state or local police agency, the acquisition methods and
laws of a particular state or local agency may impact procurement from a law enforcement distributor. In turn, sales
revenue opportunities from distributors may be adversely impacted.
In order for us to sell our products overseas, we are required to obtain certain licenses or authorizations, which
we may not be able to receive or retain.
Export licenses are required for us to export our products and services from the U.S. and issuance of an
export license lies within the discretion of the issuing government. In the U.S., substantially all of our export
licenses are processed and issued by the Directorate of Defense Trade Controls (“DDTC”) within the U.S.
Department of State. In the case of large transactions, DDTC is required to notify Congress before it issues an export
license. Congress may take action to block the proposed sale. As a result, we may not be able to obtain export
licenses or to complete profitable contracts due to domestic political or other reasons that are outside our control.
We cannot be sure, therefore, of our ability to obtain the governmental authorizations required to export our
products. Furthermore, our export licenses, once obtained, may be terminated or suspended by the U.S. government
at any time. Failure to receive required licenses or authorizations or any termination or suspension of our export
privileges could have a material adverse effect on our business, financial condition, results of operations and cash
flow.
We are subject to U.S. and other anti-corruption laws, trade controls, economic sanctions and similar laws and
regulations, including those in the jurisdictions where we operate. Our failure to comply with these laws and
regulations could subject us to civil, criminal and administrative penalties and harm our reputation.
Doing business on a worldwide basis requires us to comply with the laws and regulations of various foreign
jurisdictions. These laws and regulations place restrictions on our operations, trade practices, partners and
investment decisions. In particular, our operations are subject to U.S. and foreign anti-corruption and trade control
laws and regulations, such as the U.S. Foreign Corrupt Practices Act of 1977 (the “FCPA”), export controls and
economic sanctions programs, including those administered by the U.S. Treasury Department’s Office of Foreign
Assets Control (“OFAC”). As a result of doing business in foreign countries and with foreign partners, we are
exposed to the risk of violating anti-corruption and trade control laws and sanctions regulations.
24
The FCPA prohibits us from providing anything of value to foreign officials for the purposes of obtaining
or retaining business or securing any improper business advantage. Economic sanctions programs restrict our
business dealings with certain sanctioned countries, persons and entities. In addition, because we act through dealers
and distributors, we face the risk that our dealers, distributors or consumers might further distribute our products to a
sanctioned person or entity, or an ultimate end-user in a sanctioned country, which might subject us to an
investigation concerning compliance with OFAC or other sanctions regulations.
Violations of anti-corruption and trade control laws and sanctions regulations are punishable by civil
penalties, including fines, denial of export privileges, injunctions, asset seizures, debarment from government
contracts and revocations or restrictions of licenses, as well as criminal fines and imprisonment. We cannot assure
you that all of our local, strategic or joint partners will comply with these laws and regulations, in which case we
could be held liable for actions taken inside or outside of the United States, even though our partners may not be
subject to these laws. Such a violation could materially and adversely affect our reputation, business, results of
operations and financial condition. Any continued international expansion, including in developing countries, and
any development of new partnerships and joint venture relationships worldwide, could increase the risk of FCPA or
OFAC violations in the future.
Environmental litigation and regulations may restrict or increase the cost of our operations and/or impair our
financial condition.
We are subject to a variety of federal, state and local environmental laws and regulations that govern,
among other things, the discharge of hazardous materials into the air and water, the handling, treatment, storage and
disposal of such materials, as well as remediation of contaminated soil and groundwater. We have programs in place
that monitor compliance with those requirements and we believe that our operations are in material compliance with
them. In the normal course of our manufacturing operations, we are subject to governmental proceedings and orders
pertaining to waste disposal, air emissions and water discharges into the environment.
Based on information known to us, we do not expect current environmental regulations or environmental
proceedings and claims to have a material adverse effect on our financial condition, results of operations or cash
flows. However, it is not possible to predict the impact on us of future environmental compliance requirements or of
the cost of resolution of future environmental proceedings and claims, in part because the scope of the remedies that
may be required is not certain, liability under federal environmental laws is, in some cases, joint and several in
nature, and environmental laws and regulations are subject to modifications and changes in interpretation.
Environmental regulations may become more burdensome in the future and any such development, or discovery of
unknown conditions, may require us to make material expenditures or otherwise materially adversely affect the way
we operate our business, as well as have a material adverse effect on our financial condition, results of operations or
cash flows.
We depend on others to indemnify us for certain losses related to environmental liabilities, but we have no
assurance that they will meet their obligations.
DuPont has agreed to indemnify us for certain environmental liabilities under the terms of a legacy asset
purchase agreement from 1993 with DuPont related to the Remington business, but we cannot assure you that they
will continue to honor their obligations. We may be subject to substantial liabilities if DuPont does not fulfill its
obligations, which could have a material adverse effect on our business, financial condition, results of operations or
cash flows. See “1.—Business—Legal Proceedings.”
In addition, under the agreements pursuant to which we acquired certain of our other properties, we are
entitled to indemnification from the seller for certain environmental liabilities. However, the ability to collect on any
of these indemnification claims is subject to the financial condition of the seller of the property at the time a claim
arises. The seller might also dispute its obligation to indemnify us. Failure to collect on any such indemnification
claim for any reason could have a material impact on our business, financial condition, results of operations or cash
flows. See “1.—Business—Environmental Matters.”
If we lose key management or are unable to attract and retain qualified individuals required for our business, our
operating results and growth may suffer.
Our ability to operate our business is dependent on our ability to hire and retain qualified senior
management. Our senior management is intimately familiar with our products and those offered by our competitors,
as well as the situations in which our products are utilized in combat and law enforcement activities. Our senior
25
management also brings an array of other important talents and experience, including strategy, managerial, financial,
supply chain, governmental contracts, sales, legal and compliance. We believe their backgrounds, experience and
knowledge gives us expertise that is important to our success. Losing the services of these or other members of our
management team, particularly if they leave us to join a competitor’s business, could harm our business and
expansion efforts. Our success also is dependent on our ability to hire and retain technically skilled
workers. Competition for some qualified employees, such as engineering professionals, is intense and may become
even more competitive in the future. If we are unable to attract and retain qualified employees, our operating results,
growth and ability to obtain future contracts could suffer. Worse-than-assumed economic and demographic experience for our postretirement benefit plans (e.g., discount
rates, investment returns, and health care cost trends) could negatively impact our financial condition, results of
operations or cash flows.
We sponsor plans to provide postretirement pension and health care for certain of our retired employees.
The measurement of our obligations, costs and liabilities associated with these benefits requires that we estimate the
present values of projected future payments to all participants. We use many assumptions in calculating these
estimates, including discount rates, investment returns on designated plan assets, health care cost trends, and
demographic experience (e.g., mortality and retirement rates). To the extent that actual results are less favorable than
our assumptions, it could have be a substantial adverse impact on our financial condition, results of operations or
cash flows.
Our future pension costs and required level of contributions could be unfavorably impacted by changes in
actuarial assumptions and future market performance of plan assets, which could adversely affect our financial
condition, results of operations or cash flows.
We have defined benefit pension obligations. The funding position of our pension plans is impacted by the
performance of the financial markets, particularly the equity markets, and the discount rates used to calculate our
pension obligations for funding and expense purposes. Historical fluctuations in the financial markets have
negatively impacted the value of the assets in our pension plans. In addition, lower bond yields may reduce our
discount rates resulting in increased pension contributions and expense.
Funding obligations are determined under government regulations and are measured each year based on the
value of assets and liabilities on a specific date. If the financial markets do not provide the long-term returns that are
expected under the governmental funding calculations, we could be required to make larger contributions. The
equity markets can be very volatile, and therefore our estimate of future contribution requirements can change
dramatically in relatively short periods of time. Similarly, changes in interest rates can impact our contribution
requirements. In a low interest rate environment, the likelihood of higher contributions in the future increases. Under
the Employee Retirement Income Security Act of 1974, as amended (“ERISA”), the Pension Benefit Guaranty
Corporation (“PBGC”) has the authority to petition a court to terminate an underfunded tax-qualified defined benefit
pension plan under limited circumstances. In the event our tax-qualified defined benefit pension plans were
terminated by the PBGC, we could be liable to the PBGC for the entire amount of the underfunding, as calculated by
the PBGC based on its own assumptions (which might result in a larger obligation than that based on the
assumptions we have used to fund such plans). Finally, to the extent that any of our facilities’ closures results in a
cessation of operations event under ERISA, we may be required to post collateral or security in respect of its
associated or attributable unfunded liabilities.
A disruption to certain of our production and distribution facilities and headquarters could have a material
adverse effect on our financial condition, results of operations or cash flows.
The following facilities are critical to our success: Huntsville, Alabama, Ilion, New York, Lonoke,
Arkansas, Memphis, Tennessee and Madison, North Carolina. These facilities house our principal production,
research, development, engineering, design, shipping and general and administrative functions. Any event that
causes a disruption to the operation of any of these facilities for even a relatively short period of time may have a
material adverse effect on our ability to produce and ship products and to provide service to our customers.
A significant disruption in our computer systems or a cyber-security breach could adversely affect our operations.
We rely extensively on our computer systems to manage our ordering, pricing, inventory replenishment,
and other processes. Our systems are subject to damage or interruption from various sources, including power
26
outages, computer and telecommunications failures, computer viruses, cyber security breaches, vandalism, severe
weather conditions, catastrophic events and human error, and our disaster recovery planning cannot account for all
eventualities. If our systems are damaged, fail to function properly or otherwise become unavailable, we may incur
substantial costs to repair or replace them, and we may experience loss of critical data and interruptions or delays in
our ability to perform critical functions, which could adversely affect our business and operating results. Any
compromise of our data security could also result in a violation of applicable privacy and other laws, significant
legal and financial exposure, damage to our reputation, loss or misuse of the information, and a loss of confidence in
our data security measures, which could harm our business.
Resources devoted to research and development may not yield new products that achieve commercial success.
We devote significant resources, including cash, toward research and development. The research and
development process is expensive, prolonged and entails considerable uncertainty. Development of a new firearms
product typically takes between two and three years. Because of the complexities and uncertainties associated with
research and development, products that we are currently developing may not complete the development process or
obtain the regulatory approvals required for us to market such products successfully. In addition, the development of
new products may take longer and cost more to develop and may be less successful than we currently anticipate.
We cannot ensure that any of our products currently in our development pipeline will be commercially
successful.
Our success depends on sustaining the strength of our brands.
The willingness of consumers to purchase our products depends in part upon our ability to offer attractive
brand value propositions. This in turn depends in part on consumers attributing a higher value to our products than
alternatives. If the difference in the value attributed to our products as compared to those of our competitors
narrows, or if there is a perception of such a narrowing, consumers may choose not to buy our products. If we fail to
promote and maintain the brand equity of our products, consumer perception of our products’ quality may be
diminished and our financial condition, results of operations or cash flows could be materially adversely affected.
We may also, from time to time, be the subject of new articles or stories that portray our brands in a negative light or
we may face other types of negative publicity related to our brands and products. Any type of adverse publicity
related to our brands may negatively affect our brand equity, regardless of whether the characterizations are
accurate.
Our inability to protect our intellectual property or obtain the right to use intellectual property from third parties
could impair our competitive advantage, reduce our revenue, and increase our costs.
Our success and ability to compete depend in part on our ability to protect our intellectual property. We
rely on a combination of patents, copyrights, trade secrets, trademarks, confidentiality agreements and other
contractual provisions to protect our intellectual property, but these measures may provide only limited protection.
Our failure to enforce and protect our intellectual property rights or obtain the right to use necessary intellectual
property from third parties could reduce our sales and/or increase our costs. In addition, the laws of some foreign
countries do not protect proprietary rights as strictly as do the laws of the U.S.
Even if we attempt to protect our intellectual property, patents may not be issued for the patent applications
that we have filed or may file in the future. Our issued patents may be challenged, invalidated, or circumvented, and
claims of our patents may not be of sufficient scope or strength, or issued in the proper geographic regions, to
provide meaningful protection. We have registered certain of our trademarks in the U.S. and other countries. We
may be unable to enforce existing trademarks or obtain new registrations of principle or other trademarks in key
markets. Failure to obtain or enforce such registrations could compromise our ability to protect fully our trademarks
and brands and could increase the risk of challenge from third parties to our use of our trademarks and brands.
Labor disputes may cause work stoppages, strikes and disruptions.
The workforce at our Ilion, New York manufacturing facility is unionized and covered by a collective
bargaining agreement, which expires in October 2017. Any labor disputes at this facility, including work stoppages,
strikes and disruptions could have a material adverse impact on our business. In addition, from time to time, we face
union organizing activities at our other facilities. Although none of these activities have resulted in employees at
27
these facilities being represented by or joining unions, to the extent that were to occur, our labor costs could increase
significantly.
We have a substantial amount of indebtedness, which could have a material adverse effect on our financial
health and on our ability to obtain financing in the future and to react to changes in our business.
We have substantial indebtedness. As of December 31, 2015, we had $839.1 million of total indebtedness.
In addition, subject to restrictions in our debt instruments, we may incur additional indebtedness in the future. If new
debt is added to our current debt levels, the related risks that we now face could increase. Further, borrowings under
our Term Loan B and ABL Revolver bear interest at variable rates. Both debt instruments use LIBOR as their base
rate with minimum floors. If LIBOR rates increase above our debt instruments’ floor, our interest expense would
increase and we would have to devote more cash from our operations toward satisfying the additional interest.
Our significant amount of debt could limit our ability to satisfy our obligations, limit our ability to operate
our business and impair our competitive position. For example, it could:
• make it more difficult for us to satisfy our obligations under the 2020 Notes, Term Loan B, or the ABL
Revolver;
• increase our vulnerability to adverse economic and general industry conditions, including interest rate
fluctuations, because a portion of our borrowings are and will continue to be at variable rates of
interest;
• require us to dedicate a substantial portion of our cash flow from operations to payments on our debt,
which would reduce the availability of our cash flow from operations to fund working capital, capital
expenditures or for other general corporate purposes;
• limit our flexibility in planning for, or reacting to, changes in our business and industry;
• place us at a disadvantage compared to competitors that may have proportionately less debt;
• limit our ability to obtain additional debt or equity financing due to applicable financial and restrictive
covenants in our debt agreements; and
• increase our cost of borrowing.
In addition, we cannot assure you that we will be able to refinance any of our debt or that we will be able to
refinance our debt on commercially reasonable terms. If we were unable to make payments or refinance our debt or
obtain new financing under these circumstances, we would have to consider other options, such as:
• sales of assets;
• sales of equity; or
• negotiations with our lenders to restructure the applicable debt.
Our debt instruments may restrict, or market or business conditions may limit, our ability to effectuate
some of our options.
Our debt instruments may restrict our current and future operations.
The indenture governing the 2020 Notes and the credit agreements governing the ABL Revolver and the
Term Loan B impose significant operating and financial restrictions on us and our subsidiaries. These restrictions
limit our ability and the ability of our subsidiaries to, among other things:
• incur or guarantee additional debt, incur liens, or issue disqualified or preferred stock;
• declare or make distributions to our stockholders, repurchase equity or prepay subordinated debt;
28
• make loans and certain investments;
• enter into transactions with affiliates;
• enter into mergers, acquisitions and other business combinations;
• consolidate or sell all or substantially all of our assets;
• amend or modify our governing documents;
• create liens;
• engage in businesses other than our business as currently conducted; and
• allow certain restrictions on the ability of our restricted subsidiaries to pay dividends or make other
payments to us.
In addition to the covenants listed above, the ABL Revolver requires us, under certain circumstances, to
meet a specified financial ratio. Any of these restrictions could limit our ability to plan for or react to market
conditions or meet extraordinary capital needs and could otherwise restrict corporate activities. Our ability to
comply with these covenants may be affected by events beyond our control, and an adverse development affecting
our business could require us to seek waivers or amendments of covenants, alternative or additional sources of
financing or reductions in expenditures. We cannot assure you that these waivers, amendments or alternative or
additional financings could be obtained, or if obtained, would be on terms acceptable to us.
Further, upon the occurrence of specific kinds of change of control events, the indenture governing the
2020 Notes requires us to make an offer to repurchase the 2020 Notes at a purchase price of 101% of par plus
accrued and unpaid interest. Our Term Loan B and ABL Revolver provide that a change of control event is an event
of default under such facilities, which entitles the lenders to accelerate the maturity of such facilities. These
covenants may affect our ability to enter into certain strategic transactions.
A breach of any of the covenants or restrictions contained in any of our existing or future financing
agreements, including our inability to comply with the financial covenant in the ABL Revolver, could result in an
event of default under those agreements. A default may allow the lenders under our financing agreements, if the
agreements so provide, to discontinue lending, to accelerate the related debt as well as any other debt to which a
cross acceleration or cross default provision applies, and to declare all borrowings outstanding under our financing
arrangements to be due and payable. In addition, the lenders could terminate any commitments they had made to
supply us with further funds. If the lenders require immediate repayments, we may not be able to repay them in full.
Failure to maintain our credit ratings could adversely affect our liquidity, capital position, borrowing costs and
access to capital markets.
Our credit risk is evaluated by major independent rating agencies. During 2015, Moody’s Investor Services,
Inc. and Standard & Poor’s Ratings Services downgraded our corporate credit rating to Caa1 from B2, and to B-
from B, respectively, due in part to our high leverage. Both agencies also downgraded the ratings of each of our
Term Loan B and 2020 Notes. We cannot assure you that we will be able to maintain our current corporate or issue-
level credit ratings, and any additional actual or anticipated changes or downgrades in these credit ratings, including
any announcement that our ratings are under further review for a downgrade, may further impact our borrowing
capabilities and may have a negative impact on our liquidity, capital position and access to capital markets.
Substantially all of our assets are pledged as collateral under the 2020 Notes, the Term Loan B and the ABL
Revolver.
As of December 31, 2015, there was $250.0 million, $559.6 million and $15.4 million of senior secured
indebtedness outstanding under the 2020 Notes, the Term Loan B and the ABL Revolver, respectively. As of
December 31, 2015, the ABL Revolver permitted additional borrowings of up to a maximum of $129.8 million
(including the minimum excess availability condition) under the borrowing base as of that date. Furthermore, all of
our wholly-owned domestic subsidiaries (other than Outdoor Services, LLC), with the exception of FGI Opco and
FGI Finance, the co-issuers of the 2020 Notes, are guarantors of our obligations under the 2020 Notes and Term
29
Loan B and are either borrowers or guarantors under the ABL Revolver. Substantially all of our assets are pledged
as collateral for these borrowings. If we are unable to repay all secured borrowings when due, whether at maturity or
if declared due and payable following an event of default, the trustee or the lenders, as applicable, would have the
right to proceed against the collateral pledged to the indebtedness and may sell the assets pledged as collateral in
order to repay those borrowings, which could have a material adverse effect on our business, financial condition,
results of operations or cash flows.
We may have to repay certain incentive funds already received if we do not achieve certain targets.
The Company has received various incentives for the development, construction and renovation of
buildings and equipment in Huntsville, Alabama and Lonoke, Arkansas. These incentives are subject to claw back
provisions. These provisions include commitments to achieve incentive targets associated with employment, capital
and payroll. The inability to achieve these targets may require the repayment of certain funds already received.
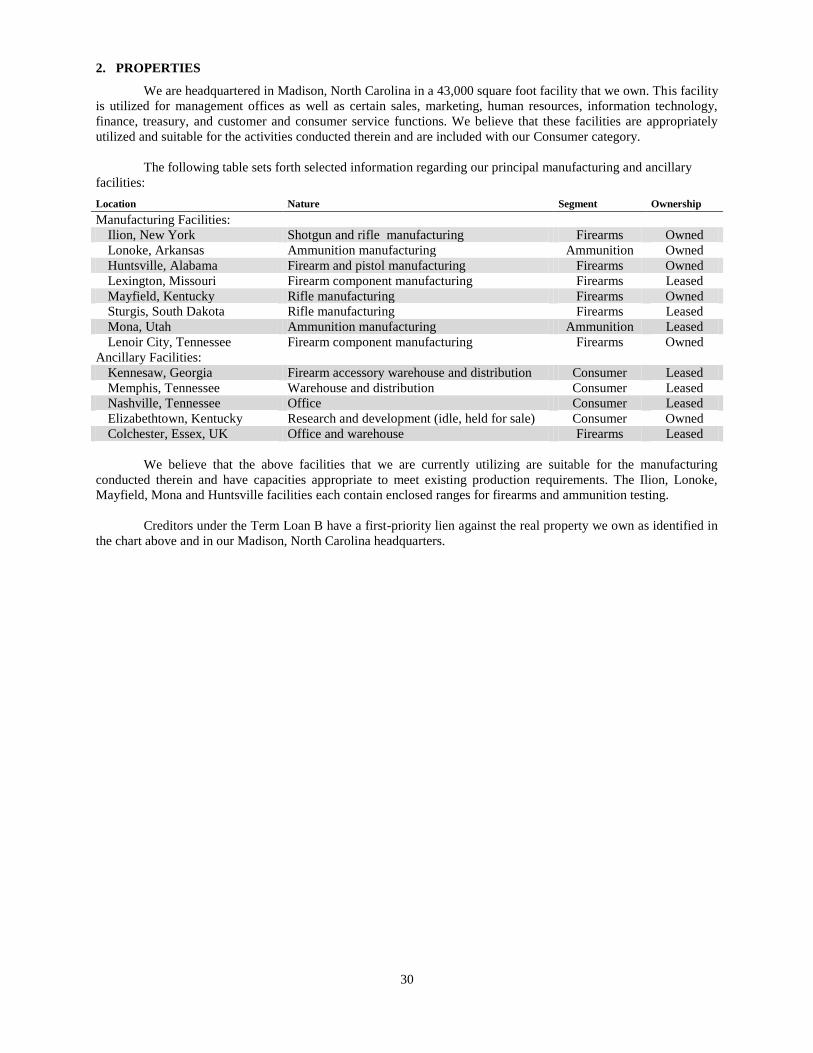
30
2. PROPERTIES
We are headquartered in Madison, North Carolina in a 43,000 square foot facility that we own. This facility
is utilized for management offices as well as certain sales, marketing, human resources, information technology,
finance, treasury, and customer and consumer service functions. We believe that these facilities are appropriately
utilized and suitable for the activities conducted therein and are included with our Consumer category.
The following table sets forth selected information regarding our principal manufacturing and ancillary
facilities:
Location Nature Segment Ownership
Manufacturing Facilities:
Ilion, New York Shotgun and rifle manufacturing Firearms Owned
Lonoke, Arkansas Ammunition manufacturing Ammunition Owned
Huntsville, Alabama Firearm and pistol manufacturing Firearms Owned
Lexington, Missouri Firearm component manufacturing Firearms Leased
Mayfield, Kentucky Rifle manufacturing Firearms Owned
Sturgis, South Dakota Rifle manufacturing Firearms Leased
Mona, Utah Ammunition manufacturing Ammunition Leased
Lenoir City, Tennessee Firearm component manufacturing Firearms Owned
Ancillary Facilities:
Kennesaw, Georgia Firearm accessory warehouse and distribution Consumer Leased
Memphis, Tennessee Warehouse and distribution Consumer Leased
Nashville, Tennessee Office Consumer Leased
Elizabethtown, Kentucky Research and development (idle, held for sale) Consumer Owned
Colchester, Essex, UK Office and warehouse Firearms Leased
We believe that the above facilities that we are currently utilizing are suitable for the manufacturing
conducted therein and have capacities appropriate to meet existing production requirements. The Ilion, Lonoke,
Mayfield, Mona and Huntsville facilities each contain enclosed ranges for firearms and ammunition testing.
Creditors under the Term Loan B have a first-priority lien against the real property we own as identified in
the chart above and in our Madison, North Carolina headquarters.
31
3. LEGAL PROCEEDINGS
Certain Indemnities
As of the closing of the Asset Purchase in December 1993 under the Purchase Agreement, Remington
assumed:
• a number of specified liabilities, including certain trade payables and contractual obligations of DuPont
and its affiliates;
• limited financial responsibility for specified product liability claims relating to disclosed occurrences
arising prior to the Asset Purchase;
• limited financial responsibility for environmental claims relating to the operation of the Remington
business prior to the Asset Purchase; and
• liabilities for product liability claims relating to occurrences after the Asset Purchase, except for claims
involving products discontinued at the time of closing.
All other liabilities relating to or arising out of the operation of the Remington business prior to the Asset
Purchase from DuPont are excluded liabilities (“Excluded Liabilities”), which DuPont and its affiliates retained.
DuPont and its affiliates are required to indemnify us in respect of the Excluded Liabilities, which include, among
other liabilities:
• liability in excess of our limited financial responsibility for environmental claims and disclosed
product liability claims relating to pre-closing occurrences;
• liability for product liability litigation related to discontinued products; and
• certain tax liabilities, employee and retiree compensation and benefit liabilities and intercompany
accounts payable that do not represent trade accounts payable.
DuPont and its affiliates’ overall liability in respect of their representations, covenants and the Excluded
Liabilities under the Purchase Agreement, excluding environmental liabilities and product liability matters relating
to events occurring prior to the purchase but not disclosed, or relating to discontinued products, is limited to
$324.8 million. With a few exceptions, DuPont and its affiliates’ representations under the Purchase Agreement
have expired. We made claims for indemnification involving product liability issues prior to such expiration. See
“—Product Related Litigation.”
In addition, DuPont and its affiliates agreed in 1996 to indemnify Remington against a portion of certain
product liability costs involving various shotguns manufactured prior to 1995 and arising from occurrences on or
prior to November 30, 1999. These indemnification obligations of DuPont and its affiliates relating to product
liability and environmental matters (subject to a limited exception) are not subject to any survival period limitation,
deductible or other dollar threshold or cap. We and DuPont and its affiliates are also party to separate agreements
setting forth agreed procedures for the management and disposition of environmental and product liability claims
and proceedings relating to the operation or ownership of the Remington business prior to the Asset Purchase, and
are currently engaged in the joint defense of certain product liability claims and proceedings. See “—Product
Related Litigation.”
Additionally, as part of our recent acquisitions, the Company has received customary product liability,
environmental, and legal indemnifications.
Product Related Litigation
We maintain insurance coverage for product liability claims subject to certain self-insured retentions on a
per-occurrence basis for personal injury or property damage with respect to Remington (relating to occurrences
arising after the Asset Purchase), Marlin, Bushmaster, DPMS and our other brands and products. We believe that
our current product liability insurance coverage for personal injury and property damage is adequate for our needs.
32
Based in part on the nature of our products, there can be no assurance that we will be able to obtain adequate product
liability insurance coverage upon the expiration of the current policy. Our current product liability insurance policy
expires December 1, 2016.
As a result of contractual arrangements, we manage the joint defense of product liability litigation
involving Remington brand firearms and our ammunition products for both Remington and DuPont and its affiliates.
As of December 31, 2015, we had a number of individual bodily injury cases and pre-litigation claims in various
stages pending relating to firearms and our ammunitions products, primarily alleging defective product design,
defective manufacture and/or failure to provide adequate warnings; some of these cases seek punitive as well as
compensatory damages. We have previously disposed of a number of other cases involving post-Asset Purchase
occurrences involving Remington brand firearms and our ammunition products by settlement. The pending
individual cases and claims involve pre- and post-Asset Purchase occurrences for which we or DuPont bear
responsibility under the Purchase Agreement.
The relief sought in individual product liability cases includes compensatory and, in some cases, punitive
damages. Certain of the claims and cases seek unspecified compensatory and/or punitive damages. In others,
compensatory damages sought may range from less than $50,000 to in excess of $1 million and punitive damages
sought may exceed $1 million.
Of the individual post-Asset Purchase bodily injury cases and claims pending as of December 31, 2015,
plaintiffs and claimants seek either compensatory and/or punitive damages in unspecified amounts or in amounts
within these general ranges. In our experience, initial demands do not generally bear a reasonable relationship to the
facts and circumstances of a particular matter, and in any event, are typically reduced significantly as a case
proceeds. We believe that our accruals for product liability cases and claims, as described below, are a better
quantitative measure of the cost of product liability cases and claims.
The Company is involved in lawsuits, claims, investigations and proceedings, including commercial,
environmental and employment matters, which arise in the ordinary course of business. From late 2012 through
2013, five class actions alleging economic harm were filed in four states (Florida, Missouri (two filings),
Washington and Montana), all of which alleged claims of economic harm to gun owners due to an alleged defect.
The Company believes all of these cases were without merit and has vigorously defended them. However, in order
to avoid the uncertainties and expense of protracted litigation, following mediation, Remington and the plaintiffs
entered into settlement discussions. In late 2014, the parties requested settlement approval from the Court and are
now awaiting a decision, which should be reached in early 2016. Three of the cases have been voluntarily dismissed
without prejudice pending the outcome of the potential settlement and the remaining two class actions are still
pending.
At December 31, 2015, our accrual for product liability cases and claims was approximately $26.2 million.
The amount of our accrual for these liability cases and claims is based upon estimates. We establish reserves for
anticipated defense and disposition costs for those pending cases and claims for which we are financially
responsible. Based on those estimates and an actuarial analysis of actual defense and disposition costs incurred by us
with respect to product liability cases and claims in recent years, we determine the estimated defense and disposition
costs for unasserted product liability cases and claims. We combine the estimated defense and disposition costs for
both pending cases and threatened but unasserted claims to determine the amount of our accrual for product liability
and product related cases and claims. It is reasonably possible additional experience could result in further increases
or decreases in the period in which such information is made available. We believe that our accruals for losses
relating to such cases and claims are adequate. Our accruals for losses relating to product liability and product
related cases and claims include accruals for all probable losses the amount of which can be reasonably estimated.
Based on the relevant circumstances (including, with respect to Remington-based claims, the current availability of
insurance for personal injury and property damage with respect to cases and claims involving occurrences arising
after the Asset Purchase, our accruals for the uninsured costs of such cases and claims and DuPont’s agreement to be
responsible for a portion of certain post-Asset Purchase product liability costs, as well as the type of firearms
products that we make), we do not believe with respect to product liability and product related cases and claims that
any probable loss exceeding amounts already recognized through our accruals has been incurred.
Because our assumption of financial responsibility for certain Remington product liability cases and claims
involving pre-Asset Purchase occurrences was limited to an amount that has now been fully paid, with DuPont and
its affiliates retaining liability in excess of that amount and indemnifying us in respect of such liabilities, and
because of our accruals with respect to such cases and claims, we believe that Remington product liability cases and
33
claims involving occurrences arising prior to the Asset Purchase are not likely to have a material adverse effect upon
our financial condition, results of operations or cash flows, nor do we believe at this time that there is an estimated
range of reasonably possible additional losses. Moreover, although it is difficult to forecast the outcome of litigation,
we do not believe, in light of relevant circumstances (including with respect to Remington-based claims, the current
availability of insurance for personal injury and property damage with respect to cases and claims involving
occurrences arising after the Asset Purchase, our accruals for the uninsured costs of such cases and claims and the
agreement of DuPont and its affiliates to be responsible for a portion of certain post-Asset Purchase product liability
costs, as well as the type of firearms products that we make), that the outcome of all pending product liability cases
and class action cases and claims will be likely to have a material adverse effect upon our financial condition, results
of operations or cash flows. Nonetheless, in part because the nature and extent of liability based on the manufacture
and/or sale of allegedly defective products (particularly as to firearms and ammunition) is uncertain, there can be no
assurance that our resources will be adequate to cover pending and future product liability or class action cases or
claims, in the aggregate, or that a material adverse effect upon our financial condition, results of operations or cash
flows will not result there from. Because of the nature of our products, we anticipate that we will continue to be
involved in product liability and product related litigation in the future. Because of the potential nature of injuries
relating to firearms and ammunition, certain public perceptions of our products, and recent efforts to expand liability
of manufacturers of firearms and ammunition, product liability cases and claims, as well as class action cases and
claims, and insurance costs associated with such cases and claims, may cause us to incur material costs.
Other Litigation
Two former employees filed suit against Remington in the federal court for the Southern District of New
York in 2012 alleging breach of their employment agreements and failure to pay earn-outs. In January 2014, the
district court entered its decision finding in favor of these employees. The case was appealed to the United States
Court of Appeals for the Second Circuit and the appellate court affirmed the trial court’s decision in an opinion in
June 2015. In the third quarter of 2015, Remington paid the $10.5 million settlement as affirmed by the United
States Court of Appeals for the Second Circuit.
We are involved in lawsuits, claims, investigations and proceedings, including commercial, environmental,
trade mark, trade dress and employment matters, which arise in the ordinary course of business. In December 2014,
we were named as a defendant in a wrongful death litigation case related to the use of one of our Bushmaster
firearms in the 2012 shooting in Newtown, Connecticut. Because our products are currently protected under the
PLCAA, which prohibits “causes of action against manufacturers, distributors, dealers, and importers of firearms or
ammunition products, and their trade associations, for the harm solely caused by the criminal or unlawful misuse of
firearm products or ammunition products by others when the product functioned as designed and intended,” We
have filed a motion to dismiss the suit. We do not expect that the ultimate costs to resolve this or any other matters
will have a material adverse effect on our financial position, results of operations or cash flows.
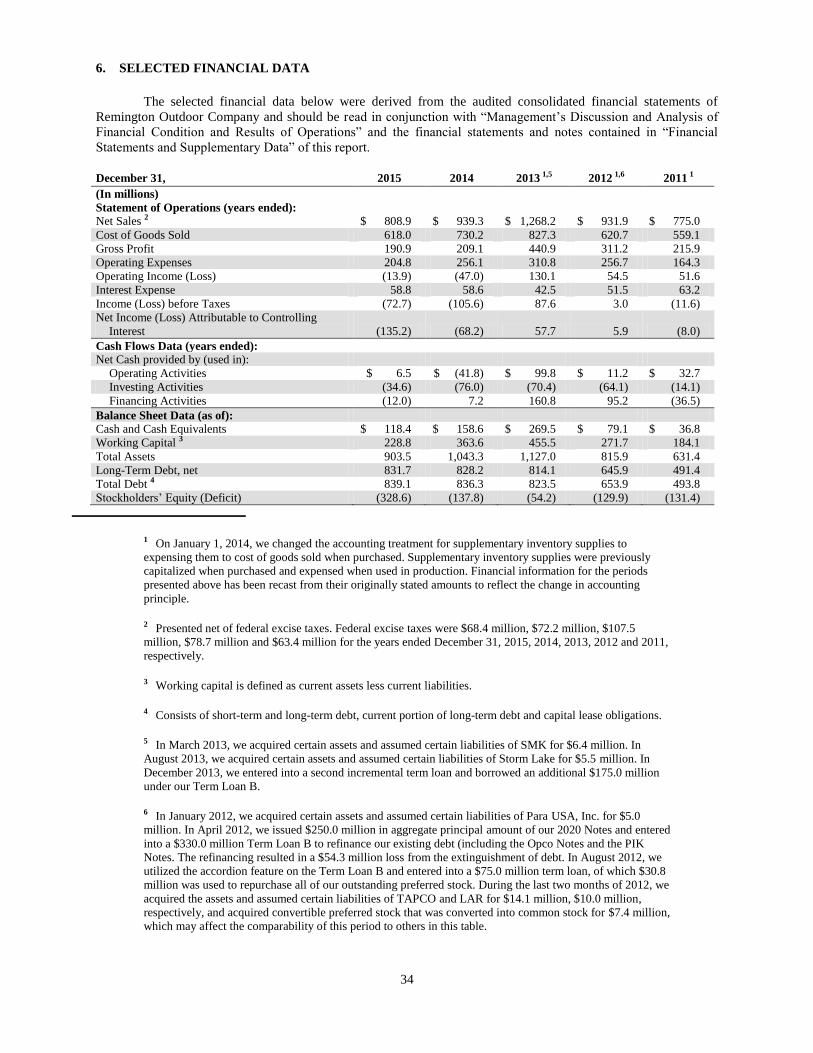
34
6. SELECTED FINANCIAL DATA
The selected financial data below were derived from the audited consolidated financial statements of
Remington Outdoor Company and should be read in conjunction with “Management’s Discussion and Analysis of
Financial Condition and Results of Operations” and the financial statements and notes contained in “Financial
Statements and Supplementary Data” of this report.
December 31, 2015 2014 2013 1,5 2012 1,6 2011 1
(In millions)
Statement of Operations (years ended):
Net Sales 2 $ 808.9 $ 939.3 $ 1,268.2 $ 931.9 $ 775.0
Cost of Goods Sold 618.0 730.2 827.3 620.7 559.1
Gross Profit 190.9 209.1 440.9 311.2 215.9
Operating Expenses 204.8 256.1 310.8 256.7 164.3
Operating Income (Loss) (13.9) (47.0) 130.1 54.5 51.6
Interest Expense 58.8 58.6 42.5 51.5 63.2
Income (Loss) before Taxes (72.7) (105.6) 87.6 3.0 (11.6)
Net Income (Loss) Attributable to Controlling
Interest (135.2) (68.2) 57.7 5.9 (8.0)
Cash Flows Data (years ended):
Net Cash provided by (used in):
Operating Activities $ 6.5 $ (41.8) $ 99.8 $ 11.2 $ 32.7
Investing Activities (34.6) (76.0) (70.4) (64.1) (14.1)
Financing Activities (12.0) 7.2 160.8 95.2 (36.5)
Balance Sheet Data (as of):
Cash and Cash Equivalents $ 118.4 $ 158.6 $ 269.5 $ 79.1 $ 36.8
Working Capital 3 228.8 363.6 455.5 271.7 184.1
Total Assets 903.5 1,043.3 1,127.0 815.9 631.4
Long-Term Debt, net 831.7 828.2 814.1 645.9 491.4
Total Debt 4 839.1 836.3 823.5 653.9 493.8
Stockholders’ Equity (Deficit) (328.6) (137.8) (54.2) (129.9) (131.4)
1 On January 1, 2014, we changed the accounting treatment for supplementary inventory supplies to
expensing them to cost of goods sold when purchased. Supplementary inventory supplies were previously
capitalized when purchased and expensed when used in production. Financial information for the periods
presented above has been recast from their originally stated amounts to reflect the change in accounting
principle.
2 Presented net of federal excise taxes. Federal excise taxes were $68.4 million, $72.2 million, $107.5
million, $78.7 million and $63.4 million for the years ended December 31, 2015, 2014, 2013, 2012 and 2011,
respectively.
3 Working capital is defined as current assets less current liabilities.
4 Consists of short-term and long-term debt, current portion of long-term debt and capital lease obligations.
5 In March 2013, we acquired certain assets and assumed certain liabilities of SMK for $6.4 million. In
August 2013, we acquired certain assets and assumed certain liabilities of Storm Lake for $5.5 million. In
December 2013, we entered into a second incremental term loan and borrowed an additional $175.0 million
under our Term Loan B.
6 In January 2012, we acquired certain assets and assumed certain liabilities of Para USA, Inc. for $5.0
million. In April 2012, we issued $250.0 million in aggregate principal amount of our 2020 Notes and entered
into a $330.0 million Term Loan B to refinance our existing debt (including the Opco Notes and the PIK
Notes. The refinancing resulted in a $54.3 million loss from the extinguishment of debt. In August 2012, we
utilized the accordion feature on the Term Loan B and entered into a $75.0 million term loan, of which $30.8
million was used to repurchase all of our outstanding preferred stock. During the last two months of 2012, we
acquired the assets and assumed certain liabilities of TAPCO and LAR for $14.1 million, $10.0 million,
respectively, and acquired convertible preferred stock that was converted into common stock for $7.4 million,
which may affect the comparability of this period to others in this table.

35
7. MANAGEMENT’S DISCUSSION AND ANALYSIS OF FINANCIAL CONDITION AND RESULTS OF
OPERATIONS
You should read the following discussion of our results of operations and financial condition together with
the “Selected Financial Data” and the audited and historical consolidated financial statements and related notes
included elsewhere in this annual report. This discussion contains forward-looking statements and involves
numerous risks and uncertainties, including, but not limited to, those described in the “Risk Factors” section of this
annual report. Actual results may differ materially from those contained in any forward-looking statements. Certain
monetary amounts, percentages and other figures included in this annual report have been subject to rounding
adjustments. Accordingly, figures shown as totals in certain tables may not be the arithmetic aggregation of the
figures that precede them, and figures expressed as percentages in the text may not total 100% or, as applicable,
when aggregated may not be the arithmetic aggregation of the percentages that precede them.
Management’s Discussion and Analysis of Financial Condition and Results of Operations is separated into the
following sections:
Company Overview
Current Sales Demand
Recent Company Developments
EBITDA Measurements
Results of Operations
Liquidity and Capital Resources
Critical Accounting Policies and Estimates
Recent Accounting Pronouncements
Company Overview
We are one of the leading firearms, ammunition and related products companies in the world. We are
America’s oldest manufacturer of firearms and ammunition with our Remington brand dating back to 1816. We are
one of the largest major U.S. manufacturers of both firearms and ammunition, which provides a significant
competitive advantage and supports our market leadership position. Our approximately 3,400 employees represent
the largest domestic manufacturing presence in the firearms and related industries. This scale enables us to deliver
our products throughout the United States and internationally to approximately 55 countries.
During 2015, we announced changes to our senior management team and our Board initiated a headcount
reduction. These changes were intended to accelerate an ongoing transformation as we seek to optimize operations
and improve the foundational processes to deliver consistently superior quality across all of our products and
services. We believe that by focusing on core operational processes, such as customers, quality, safety, and
compliance, we are building a solid strategic foundation, which will allow us to become more competitive. In
addition, we are committed to enhancing our core businesses and positioning ourselves to take advantage of growth
opportunities that expand and enhance our portfolio of brands, products and intellectual property.
Remington represents an iconic brand born from a passion for precision and a pride in craftsmanship dating
back to Eliphalet Remington. From the beginning, Remington built its reputation on these two core principles. We
are actively preparing for our 200th
anniversary in 2016 and intend to use this milestone to ensure that pride and
precision are engrained in everything we do and that our culture embodies these principles for years to come.
To commemorate our 200-Year history, we plan to introduce a Commemorative Edition R1 1911 pistol,
700 bolt rifle, 870 shotgun and Limited Edition models of our 700 bolt rifle, 7600 pump rifle, 870 pump, 1100 auto-
loading shotguns, and R1 1911 pistol in 2016. We also plan to expand the Model 783 bolt rifle platform and
introduce our new V3 shotgun platform. In addition, we plan to launch new handgun platforms to meet our
consumers’ needs for recreational and defensive products.
In 2014, we celebrated the 75th
anniversary of Remington Core-Lokt, our best selling centerfire hunting
ammunition. In 2016, we plan to release six new Ultimate Defense Full Size Handgun line extensions completing
our Ultimate Defense Product Line. We will also begin releasing the Golden Saber Black Belt product for
commercial sales in 2016. There are now three new loose bulk pack offerings developed for the commercial range
markets in 9mm, .223 Remington, and Rimfire Range Freedom buckets. To complement our Ultimate Muzzleloader
rifle, we produced the Premier AccuTip slug, expanded the VOR-TX line to include a 300 AAC BLK 120gr TAC-
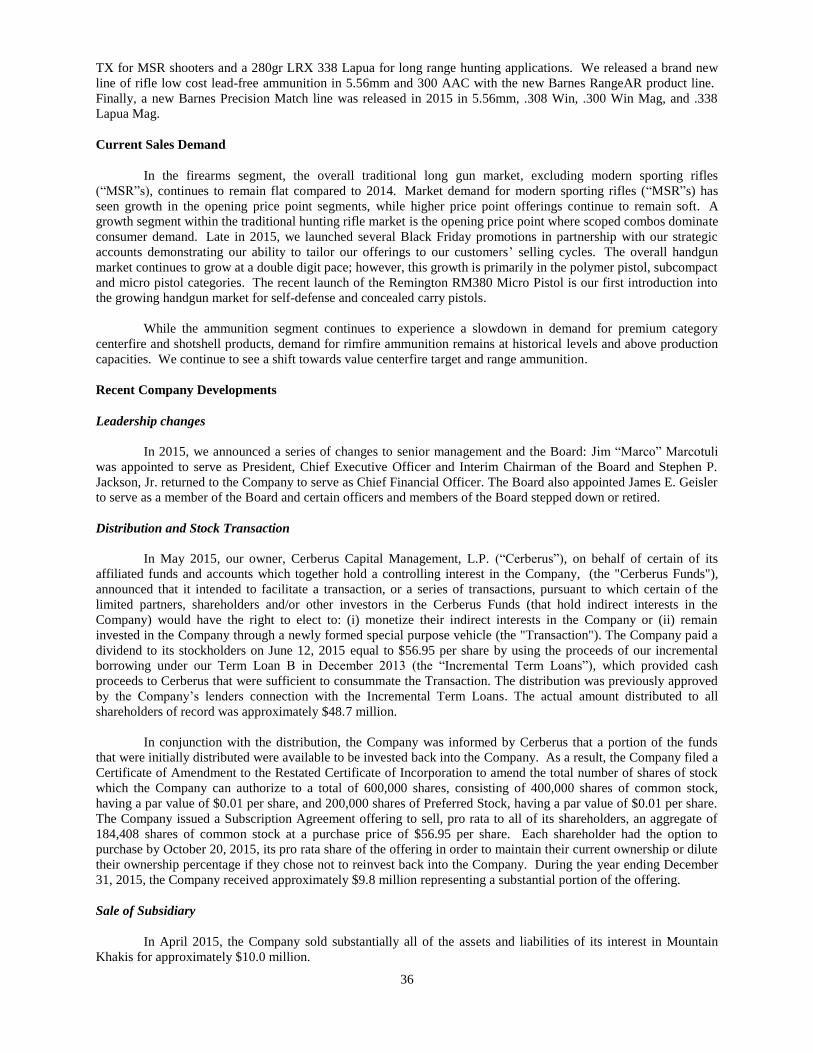
36
TX for MSR shooters and a 280gr LRX 338 Lapua for long range hunting applications. We released a brand new
line of rifle low cost lead-free ammunition in 5.56mm and 300 AAC with the new Barnes RangeAR product line.
Finally, a new Barnes Precision Match line was released in 2015 in 5.56mm, .308 Win, .300 Win Mag, and .338
Lapua Mag.
Current Sales Demand
In the firearms segment, the overall traditional long gun market, excluding modern sporting rifles
(“MSR”s), continues to remain flat compared to 2014. Market demand for modern sporting rifles (“MSR”s) has
seen growth in the opening price point segments, while higher price point offerings continue to remain soft. A
growth segment within the traditional hunting rifle market is the opening price point where scoped combos dominate
consumer demand. Late in 2015, we launched several Black Friday promotions in partnership with our strategic
accounts demonstrating our ability to tailor our offerings to our customers’ selling cycles. The overall handgun
market continues to grow at a double digit pace; however, this growth is primarily in the polymer pistol, subcompact
and micro pistol categories. The recent launch of the Remington RM380 Micro Pistol is our first introduction into
the growing handgun market for self-defense and concealed carry pistols.
While the ammunition segment continues to experience a slowdown in demand for premium category
centerfire and shotshell products, demand for rimfire ammunition remains at historical levels and above production
capacities. We continue to see a shift towards value centerfire target and range ammunition.
Recent Company Developments
Leadership changes
In 2015, we announced a series of changes to senior management and the Board: Jim “Marco” Marcotuli
was appointed to serve as President, Chief Executive Officer and Interim Chairman of the Board and Stephen P.
Jackson, Jr. returned to the Company to serve as Chief Financial Officer. The Board also appointed James E. Geisler
to serve as a member of the Board and certain officers and members of the Board stepped down or retired.
Distribution and Stock Transaction
In May 2015, our owner, Cerberus Capital Management, L.P. (“Cerberus”), on behalf of certain of its
affiliated funds and accounts which together hold a controlling interest in the Company, (the "Cerberus Funds"),
announced that it intended to facilitate a transaction, or a series of transactions, pursuant to which certain of the
limited partners, shareholders and/or other investors in the Cerberus Funds (that hold indirect interests in the
Company) would have the right to elect to: (i) monetize their indirect interests in the Company or (ii) remain
invested in the Company through a newly formed special purpose vehicle (the "Transaction"). The Company paid a
dividend to its stockholders on June 12, 2015 equal to $56.95 per share by using the proceeds of our incremental
borrowing under our Term Loan B in December 2013 (the “Incremental Term Loans”), which provided cash
proceeds to Cerberus that were sufficient to consummate the Transaction. The distribution was previously approved
by the Company’s lenders connection with the Incremental Term Loans. The actual amount distributed to all
shareholders of record was approximately $48.7 million.
In conjunction with the distribution, the Company was informed by Cerberus that a portion of the funds
that were initially distributed were available to be invested back into the Company. As a result, the Company filed a
Certificate of Amendment to the Restated Certificate of Incorporation to amend the total number of shares of stock
which the Company can authorize to a total of 600,000 shares, consisting of 400,000 shares of common stock,
having a par value of $0.01 per share, and 200,000 shares of Preferred Stock, having a par value of $0.01 per share.
The Company issued a Subscription Agreement offering to sell, pro rata to all of its shareholders, an aggregate of
184,408 shares of common stock at a purchase price of $56.95 per share. Each shareholder had the option to
purchase by October 20, 2015, its pro rata share of the offering in order to maintain their current ownership or dilute
their ownership percentage if they chose not to reinvest back into the Company. During the year ending December
31, 2015, the Company received approximately $9.8 million representing a substantial portion of the offering.
Sale of Subsidiary
In April 2015, the Company sold substantially all of the assets and liabilities of its interest in Mountain
Khakis for approximately $10.0 million.

37
Restructuring and Start-Up Costs
During 2014, we completed the acquisition of a facility in Huntsville, Alabama; announced a vertical
integration initiative that resulted in the closure of several of our facilities; and completed an expansion at our
Lonoke, Arkansas ammunition factory. As a result of these activities, we have incurred restructuring and start-up
costs over the last two years. As of December 31, 2015, the restructuring and start-up related activities were
completed. We do not anticipate any further material expenses related to the vertical integration and expansion.
We consider restructuring costs as those one-time costs related to severance, retention, and relocation;
equipment transfer, site prep and carrying costs; contract terminations; and other non-cash costs such as the write-off
of inventory and inefficiency variances related to the consolidation of facilities. For the year ended December 31,
2015, the Company recognized $7.8 million in restructuring charges. Through December 31, 2015, the Company
has recognized $28.9 million in cumulative restructuring charges.
We consider start-up costs as those one-time costs related to opening a new facility, introducing a new
product or service, conducting business in a new territory or conducting business with a new class of customers.
These costs include core and support team expenses, consulting, legal expense and the write-off of inefficiency
variances directly related to a new facility prior to it becoming fully operational. For the year ended December 31,
2015, the Company incurred start-up costs of $9.9 million. Through December 31, 2015 the Company has
recognized $23.7 million in cumulative start-up charges.
EBITDA Measurements
We use the term Adjusted EBITDA throughout this section. Adjusted EBITDA is not a measure of
performance defined in accordance with Generally Accepted Accounting Principles (“GAAP”). We use Adjusted
EBITDA as a supplement to our GAAP results in evaluating certain aspects of our business. We believe that
Adjusted EBITDA is useful to investors in evaluating our performance because such measures are commonly used
financial metrics for measuring and comparing the operating performance of companies in our industry. We believe
that the disclosure of Adjusted EBITDA offers an additional financial metric that, when coupled with the GAAP
results and the reconciliation to GAAP results, provide a more complete understanding of our results of operations
and the factors and trends affecting our business.
Adjusted EBITDA should not be considered as an alternative to net income (loss), as an indicator of our
performance, as an alternative to net cash provided by operating activities, as a measure of liquidity, or as an
alternative to any other measure prescribed by GAAP. We believe that Adjusted EBITDA may make an evaluation
of our operating performance more consistent because such measures primarily remove items that do not reflect our
core operations. There are, however, limitations to using non-GAAP measures such as:
(i) other companies in our industry may define Adjusted EBITDA differently than we do and, as a
result, such measures may not be comparable to similarly titled measures used by other companies
in our industry; and
(ii) such measures exclude financial information that some may consider important in evaluating our
performance.
We compensate for these limitations by providing disclosure of the differences between our Adjusted
EBITDA calculations and GAAP results, including providing a reconciliation of GAAP results to Adjusted
EBITDA, to enable investors to perform their own analysis of our operating results. See “–Results of Operations–
Adjusted EBITDA” for a reconciliation of Net Income to Adjusted EBITDA.
Because of these limitations, Adjusted EBITDA should not be considered as a measure of the income
generated by our business or discretionary cash available to us to invest in the growth of our business. Our
management compensates for these limitations by relying primarily on our GAAP results and using Adjusted
EBITDA as a supplemental financial metric for evaluation of our operating performance. See our consolidated
statements of operations and consolidated statements of cash flows in our consolidated financial statements included
elsewhere in this annual report.
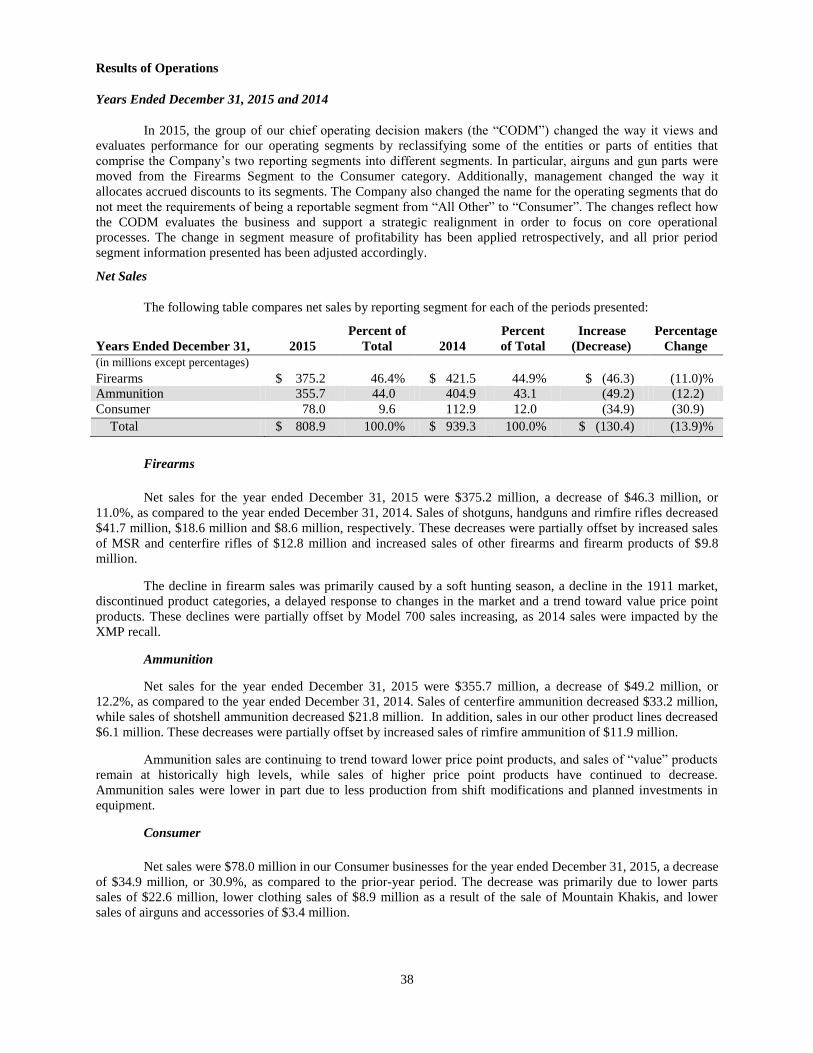
38
Results of Operations
Years Ended December 31, 2015 and 2014
In 2015, the group of our chief operating decision makers (the “CODM”) changed the way it views and
evaluates performance for our operating segments by reclassifying some of the entities or parts of entities that
comprise the Company’s two reporting segments into different segments. In particular, airguns and gun parts were
moved from the Firearms Segment to the Consumer category. Additionally, management changed the way it
allocates accrued discounts to its segments. The Company also changed the name for the operating segments that do
not meet the requirements of being a reportable segment from “All Other” to “Consumer”. The changes reflect how
the CODM evaluates the business and support a strategic realignment in order to focus on core operational
processes. The change in segment measure of profitability has been applied retrospectively, and all prior period
segment information presented has been adjusted accordingly.
Net Sales
The following table compares net sales by reporting segment for each of the periods presented:
Years Ended December 31, 2015
Percent of
Total 2014
Percent
of Total
Increase
(Decrease)
Percentage
Change
(in millions except percentages)
Firearms $ 375.2 46.4% $ 421.5 44.9% $ (46.3) (11.0)%
Ammunition 355.7 44.0 404.9 43.1 (49.2) (12.2)
Consumer 78.0 9.6 112.9 12.0 (34.9) (30.9)
Total $ 808.9 100.0% $ 939.3 100.0% $ (130.4) (13.9)%
Firearms
Net sales for the year ended December 31, 2015 were $375.2 million, a decrease of $46.3 million, or
11.0%, as compared to the year ended December 31, 2014. Sales of shotguns, handguns and rimfire rifles decreased
$41.7 million, $18.6 million and $8.6 million, respectively. These decreases were partially offset by increased sales
of MSR and centerfire rifles of $12.8 million and increased sales of other firearms and firearm products of $9.8
million.
The decline in firearm sales was primarily caused by a soft hunting season, a decline in the 1911 market,
discontinued product categories, a delayed response to changes in the market and a trend toward value price point
products. These declines were partially offset by Model 700 sales increasing, as 2014 sales were impacted by the
XMP recall.
Ammunition
Net sales for the year ended December 31, 2015 were $355.7 million, a decrease of $49.2 million, or
12.2%, as compared to the year ended December 31, 2014. Sales of centerfire ammunition decreased $33.2 million,
while sales of shotshell ammunition decreased $21.8 million. In addition, sales in our other product lines decreased
$6.1 million. These decreases were partially offset by increased sales of rimfire ammunition of $11.9 million.
Ammunition sales are continuing to trend toward lower price point products, and sales of “value” products
remain at historically high levels, while sales of higher price point products have continued to decrease.
Ammunition sales were lower in part due to less production from shift modifications and planned investments in
equipment.
Consumer
Net sales were $78.0 million in our Consumer businesses for the year ended December 31, 2015, a decrease
of $34.9 million, or 30.9%, as compared to the prior-year period. The decrease was primarily due to lower parts
sales of $22.6 million, lower clothing sales of $8.9 million as a result of the sale of Mountain Khakis, and lower
sales of airguns and accessories of $3.4 million.
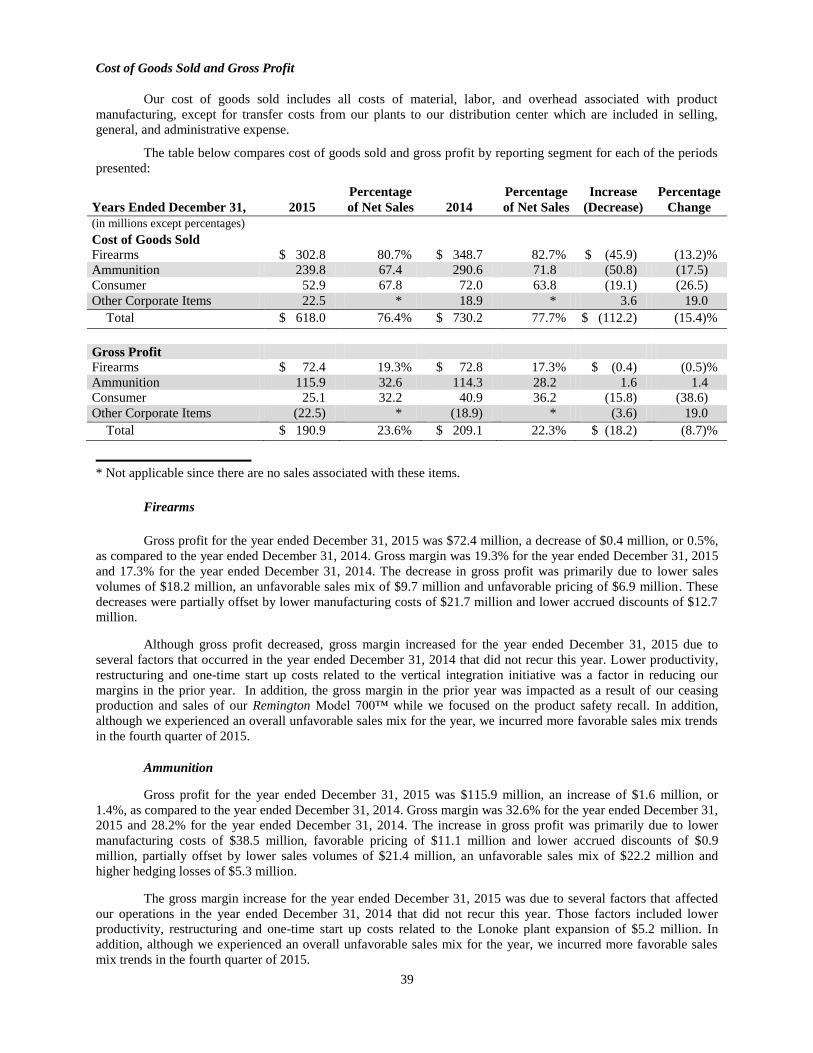
39
Cost of Goods Sold and Gross Profit
Our cost of goods sold includes all costs of material, labor, and overhead associated with product
manufacturing, except for transfer costs from our plants to our distribution center which are included in selling,
general, and administrative expense.
The table below compares cost of goods sold and gross profit by reporting segment for each of the periods
presented:
Years Ended December 31, 2015
Percentage
of Net Sales 2014
Percentage
of Net Sales
Increase
(Decrease)
Percentage
Change
(in millions except percentages)
Cost of Goods Sold
Firearms $ 302.8 80.7% $ 348.7 82.7% $ (45.9) (13.2)%
Ammunition 239.8 67.4 290.6 71.8 (50.8) (17.5)
Consumer 52.9 67.8 72.0 63.8 (19.1) (26.5)
Other Corporate Items 22.5 * 18.9 * 3.6 19.0
Total $ 618.0 76.4% $ 730.2 77.7% $ (112.2) (15.4)%
Gross Profit
Firearms $ 72.4 19.3% $ 72.8 17.3% $ (0.4) (0.5)%
Ammunition 115.9 32.6 114.3 28.2 1.6 1.4
Consumer 25.1 32.2 40.9 36.2 (15.8) (38.6)
Other Corporate Items (22.5) * (18.9) * (3.6) 19.0
Total $ 190.9 23.6% $ 209.1 22.3% $ (18.2) (8.7)%
* Not applicable since there are no sales associated with these items.
Firearms
Gross profit for the year ended December 31, 2015 was $72.4 million, a decrease of $0.4 million, or 0.5%,
as compared to the year ended December 31, 2014. Gross margin was 19.3% for the year ended December 31, 2015
and 17.3% for the year ended December 31, 2014. The decrease in gross profit was primarily due to lower sales
volumes of $18.2 million, an unfavorable sales mix of $9.7 million and unfavorable pricing of $6.9 million. These
decreases were partially offset by lower manufacturing costs of $21.7 million and lower accrued discounts of $12.7
million.
Although gross profit decreased, gross margin increased for the year ended December 31, 2015 due to
several factors that occurred in the year ended December 31, 2014 that did not recur this year. Lower productivity,
restructuring and one-time start up costs related to the vertical integration initiative was a factor in reducing our
margins in the prior year. In addition, the gross margin in the prior year was impacted as a result of our ceasing
production and sales of our Remington Model 700™ while we focused on the product safety recall. In addition,
although we experienced an overall unfavorable sales mix for the year, we incurred more favorable sales mix trends
in the fourth quarter of 2015.
Ammunition
Gross profit for the year ended December 31, 2015 was $115.9 million, an increase of $1.6 million, or
1.4%, as compared to the year ended December 31, 2014. Gross margin was 32.6% for the year ended December 31,
2015 and 28.2% for the year ended December 31, 2014. The increase in gross profit was primarily due to lower
manufacturing costs of $38.5 million, favorable pricing of $11.1 million and lower accrued discounts of $0.9
million, partially offset by lower sales volumes of $21.4 million, an unfavorable sales mix of $22.2 million and
higher hedging losses of $5.3 million.
The gross margin increase for the year ended December 31, 2015 was due to several factors that affected
our operations in the year ended December 31, 2014 that did not recur this year. Those factors included lower
productivity, restructuring and one-time start up costs related to the Lonoke plant expansion of $5.2 million. In
addition, although we experienced an overall unfavorable sales mix for the year, we incurred more favorable sales
mix trends in the fourth quarter of 2015.
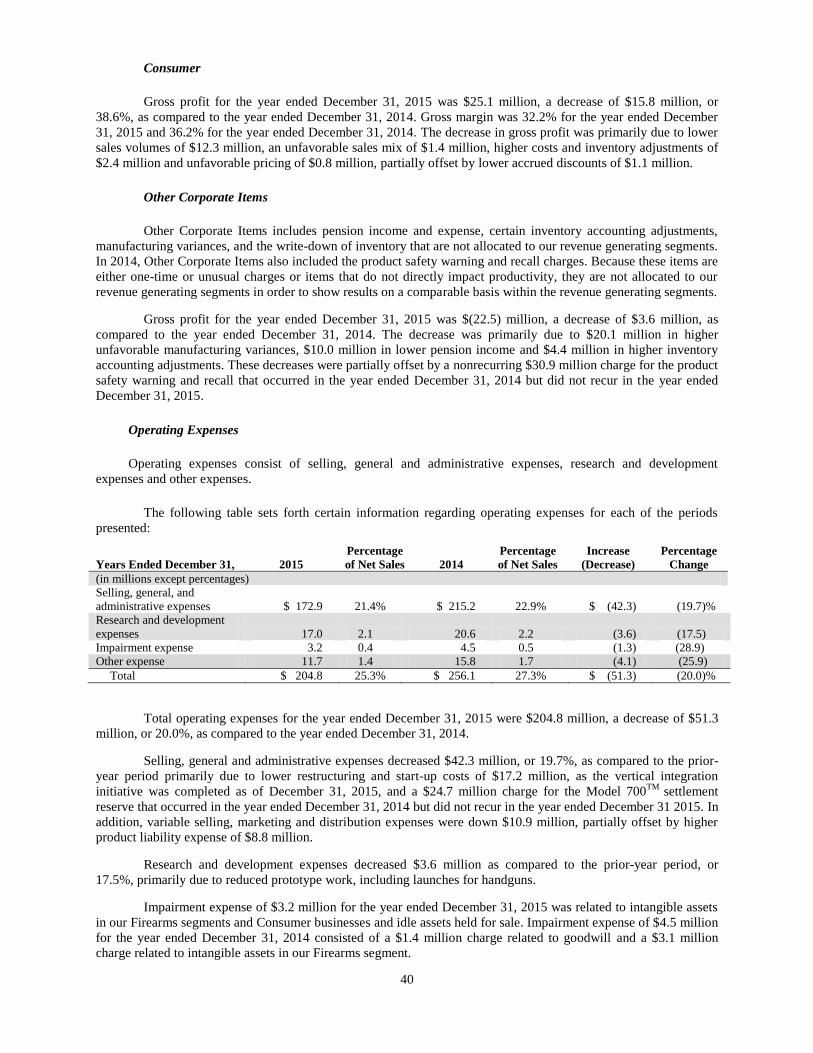
40
Consumer
Gross profit for the year ended December 31, 2015 was $25.1 million, a decrease of $15.8 million, or
38.6%, as compared to the year ended December 31, 2014. Gross margin was 32.2% for the year ended December
31, 2015 and 36.2% for the year ended December 31, 2014. The decrease in gross profit was primarily due to lower
sales volumes of $12.3 million, an unfavorable sales mix of $1.4 million, higher costs and inventory adjustments of
$2.4 million and unfavorable pricing of $0.8 million, partially offset by lower accrued discounts of $1.1 million.
Other Corporate Items
Other Corporate Items includes pension income and expense, certain inventory accounting adjustments,
manufacturing variances, and the write-down of inventory that are not allocated to our revenue generating segments.
In 2014, Other Corporate Items also included the product safety warning and recall charges. Because these items are
either one-time or unusual charges or items that do not directly impact productivity, they are not allocated to our
revenue generating segments in order to show results on a comparable basis within the revenue generating segments.
Gross profit for the year ended December 31, 2015 was $(22.5) million, a decrease of $3.6 million, as
compared to the year ended December 31, 2014. The decrease was primarily due to $20.1 million in higher
unfavorable manufacturing variances, $10.0 million in lower pension income and $4.4 million in higher inventory
accounting adjustments. These decreases were partially offset by a nonrecurring $30.9 million charge for the product
safety warning and recall that occurred in the year ended December 31, 2014 but did not recur in the year ended
December 31, 2015.
Operating Expenses
Operating expenses consist of selling, general and administrative expenses, research and development
expenses and other expenses.
The following table sets forth certain information regarding operating expenses for each of the periods
presented:
Years Ended December 31, 2015
Percentage
of Net Sales 2014
Percentage
of Net Sales
Increase
(Decrease)
Percentage
Change
(in millions except percentages)
Selling, general, and
administrative expenses $ 172.9 21.4% $ 215.2 22.9% $ (42.3) (19.7)%
Research and development
expenses 17.0 2.1 20.6 2.2 (3.6) (17.5)
Impairment expense 3.2 0.4 4.5 0.5 (1.3) (28.9)
Other expense 11.7 1.4 15.8 1.7 (4.1) (25.9)
Total $ 204.8 25.3% $ 256.1 27.3% $ (51.3) (20.0)%
Total operating expenses for the year ended December 31, 2015 were $204.8 million, a decrease of $51.3
million, or 20.0%, as compared to the year ended December 31, 2014.
Selling, general and administrative expenses decreased $42.3 million, or 19.7%, as compared to the prior-
year period primarily due to lower restructuring and start-up costs of $17.2 million, as the vertical integration
initiative was completed as of December 31, 2015, and a $24.7 million charge for the Model 700TM
settlement
reserve that occurred in the year ended December 31, 2014 but did not recur in the year ended December 31 2015. In
addition, variable selling, marketing and distribution expenses were down $10.9 million, partially offset by higher
product liability expense of $8.8 million.
Research and development expenses decreased $3.6 million as compared to the prior-year period, or
17.5%, primarily due to reduced prototype work, including launches for handguns.
Impairment expense of $3.2 million for the year ended December 31, 2015 was related to intangible assets
in our Firearms segments and Consumer businesses and idle assets held for sale. Impairment expense of $4.5 million
for the year ended December 31, 2014 consisted of a $1.4 million charge related to goodwill and a $3.1 million
charge related to intangible assets in our Firearms segment.
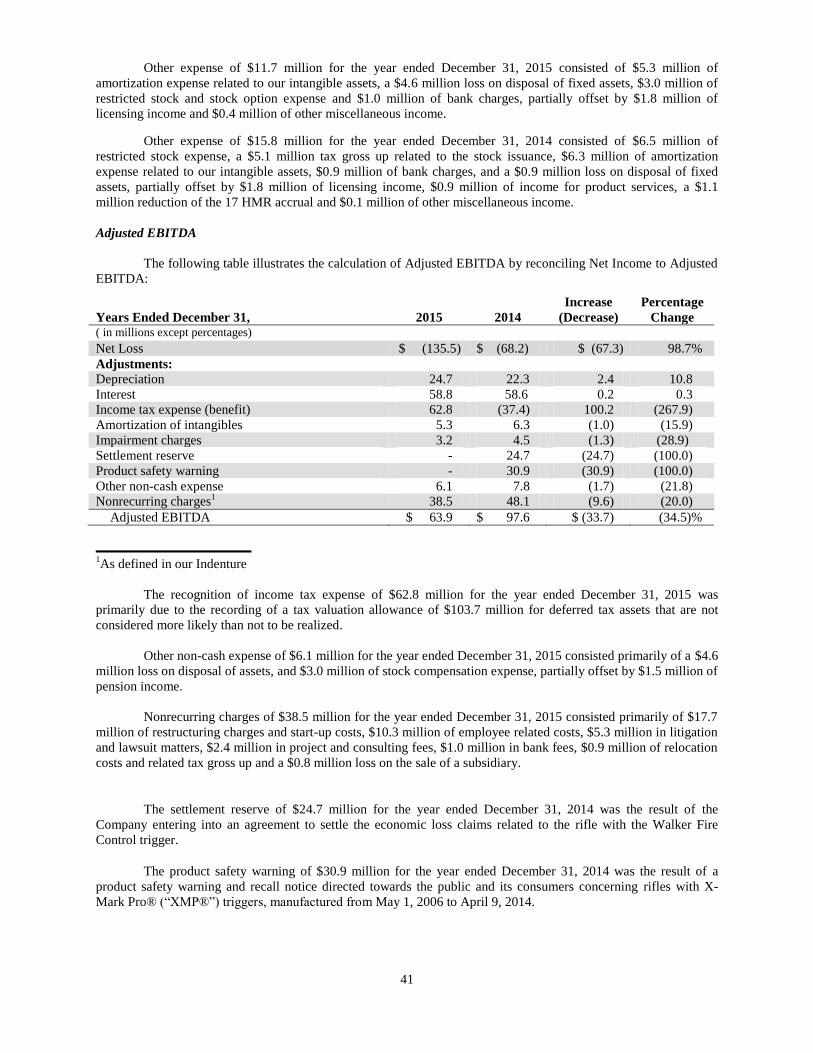
41
Other expense of $11.7 million for the year ended December 31, 2015 consisted of $5.3 million of
amortization expense related to our intangible assets, a $4.6 million loss on disposal of fixed assets, $3.0 million of
restricted stock and stock option expense and $1.0 million of bank charges, partially offset by $1.8 million of
licensing income and $0.4 million of other miscellaneous income.
Other expense of $15.8 million for the year ended December 31, 2014 consisted of $6.5 million of
restricted stock expense, a $5.1 million tax gross up related to the stock issuance, $6.3 million of amortization
expense related to our intangible assets, $0.9 million of bank charges, and a $0.9 million loss on disposal of fixed
assets, partially offset by $1.8 million of licensing income, $0.9 million of income for product services, a $1.1
million reduction of the 17 HMR accrual and $0.1 million of other miscellaneous income.
Adjusted EBITDA
The following table illustrates the calculation of Adjusted EBITDA by reconciling Net Income to Adjusted
EBITDA:
Years Ended December 31, 2015 2014
Increase
(Decrease)
Percentage
Change ( in millions except percentages)
Net Loss $ (135.5) $ (68.2) $ (67.3) 98.7%
Adjustments:
Depreciation 24.7 22.3 2.4 10.8
Interest 58.8 58.6 0.2 0.3
Income tax expense (benefit) 62.8 (37.4) 100.2 (267.9)
Amortization of intangibles 5.3 6.3 (1.0) (15.9)
Impairment charges 3.2 4.5 (1.3) (28.9)
Settlement reserve - 24.7 (24.7) (100.0)
Product safety warning - 30.9 (30.9) (100.0)
Other non-cash expense 6.1 7.8 (1.7) (21.8)
Nonrecurring charges1
38.5 48.1 (9.6) (20.0)
Adjusted EBITDA
$ 63.9 $ 97.6 $ (33.7) (34.5)%
1As defined in our Indenture
The recognition of income tax expense of $62.8 million for the year ended December 31, 2015 was
primarily due to the recording of a tax valuation allowance of $103.7 million for deferred tax assets that are not
considered more likely than not to be realized.
Other non-cash expense of $6.1 million for the year ended December 31, 2015 consisted primarily of a $4.6
million loss on disposal of assets, and $3.0 million of stock compensation expense, partially offset by $1.5 million of
pension income.
Nonrecurring charges of $38.5 million for the year ended December 31, 2015 consisted primarily of $17.7
million of restructuring charges and start-up costs, $10.3 million of employee related costs, $5.3 million in litigation
and lawsuit matters, $2.4 million in project and consulting fees, $1.0 million in bank fees, $0.9 million of relocation
costs and related tax gross up and a $0.8 million loss on the sale of a subsidiary.
The settlement reserve of $24.7 million for the year ended December 31, 2014 was the result of the
Company entering into an agreement to settle the economic loss claims related to the rifle with the Walker Fire
Control trigger.
The product safety warning of $30.9 million for the year ended December 31, 2014 was the result of a
product safety warning and recall notice directed towards the public and its consumers concerning rifles with X-
Mark Pro® (“XMP®”) triggers, manufactured from May 1, 2006 to April 9, 2014.
42
Other non-cash expense of $7.8 million for the year ended December 31, 2014 consisted primarily of $6.5
million of stock compensation expense, a $0.9 million loss on disposal of assets, $0.2 million of pension expense
and $0.2 million of post-employment benefit accruals.
Nonrecurring charges of $48.1 million for the year ended December 31, 2014 consisted primarily of $34.9
million of restructuring charges and start-up costs, a $5.1 million tax gross up on a restricted stock issuance, $4.8
million of employee related costs, $2.3 million of expense for due diligence, project fees and consulting, $1.0
million of relocation costs, $0.9 million of bank fees and $0.2 million of purchase price accounting adjustment,
partially offset by a ($1.1) million reversal for the 17 HMR safety warning campaign.
Interest Expense
Interest expense was $58.8 million for the year ended December 31, 2015, compared to $58.6 million for
the year ended December 31, 2014. The $0.2 million increase in interest expense over the year ended December 31,
2014 was primarily due to $0.7 million in higher accretion adjustments, partially offset by $0.5 million of lower
interest expense related to our interest rate swap.
Income Tax Provision
Our effective tax rate on continuing operations for the years ended December 31, 2015 and 2014 was
(86.4)% and 35.4%, respectively. The difference between the actual effective tax rate and the federal statutory rate
of 35% is principally due to a valuation allowance recorded at December 31, 2015.
In assessing the need for a non-cash valuation allowance, we consider both positive and negative evidence
related to the likelihood of realization of the deferred tax assets. If, based on the weight of available evidence, it is
more likely than not that the deferred tax assets will not be realized, we record a valuation allowance. The weight
given to the positive and negative evidence is commensurate with the extent to which the evidence may be
objectively verified. As such, it is generally difficult for positive evidence regarding projected future taxable income
exclusive of reversing taxable temporary differences to outweigh objective negative evidence of recent financial
reporting losses. Based upon our consideration of the evidence we concluded that the net deferred tax assets required
a full valuation allowance at December 31, 2015.
We are subject to ongoing audits by federal and state tax authorities. Depending on the outcome of these
audits, we may be required to pay additional taxes. However, we do not believe that any additional taxes and related
interest or penalties would have a material impact on our financial position, results of operations, or cash flows.
Our continuing practice is to recognize interest and/or penalties related to income tax matters within
income tax expense.
Years Ended December 31, 2014 and 2013
In 2015, the CODM changed the way it views and evaluates performance for our operating segments by
reclassifying some of the entities or parts of entities that comprise the Company’s two reporting segments into
different segments. In particular, airguns and gun parts were moved from the Firearms Segment to the Consumer
category. Additionally, management changed the way it allocates accrued discounts to its segments. The Company
also changed the name for the operating segments that do not meet the requirements of being a reportable segment
from “All Other” to “Consumer”. The changes reflect how the CODM evaluates the business and support a strategic
realignment in order to focus on core operational processes. The change in segment measure of profitability has
been applied retrospectively, and all prior period segment information presented has been adjusted accordingly.
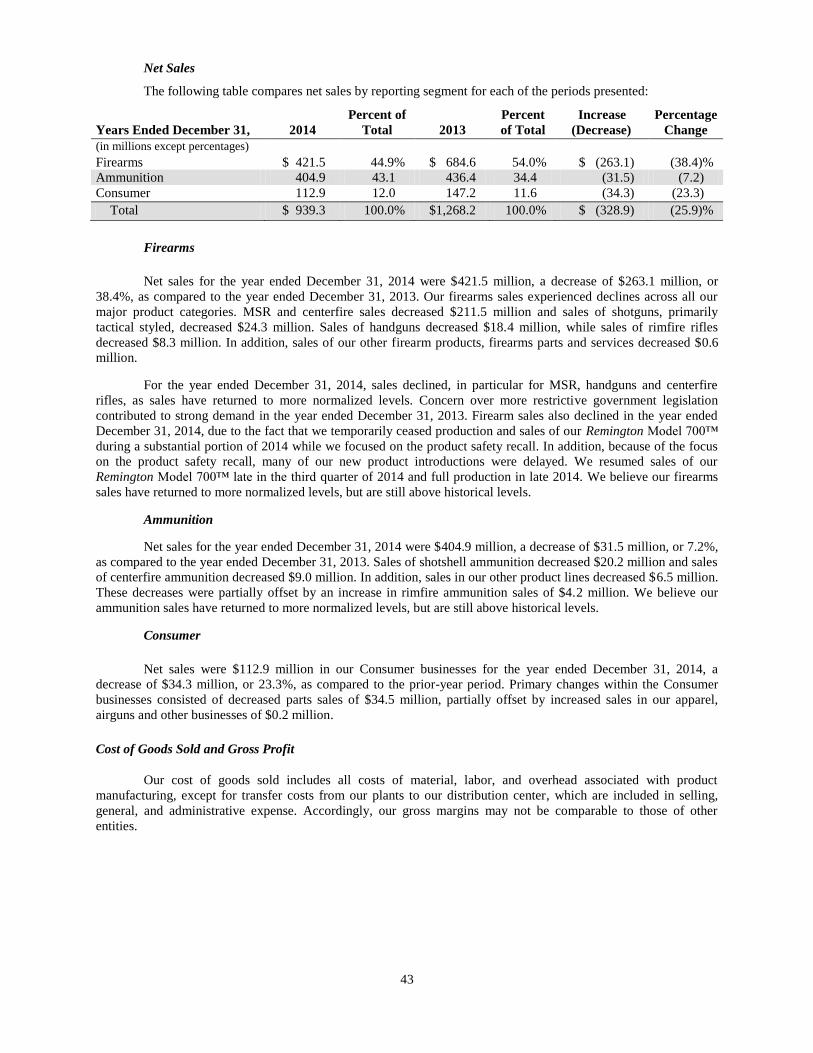
43
Net Sales
The following table compares net sales by reporting segment for each of the periods presented:
Years Ended December 31, 2014
Percent of
Total 2013
Percent
of Total
Increase
(Decrease)
Percentage
Change
(in millions except percentages)
Firearms $ 421.5 44.9% $ 684.6 54.0% $ (263.1) (38.4)%
Ammunition 404.9 43.1 436.4 34.4 (31.5) (7.2)
Consumer 112.9 12.0 147.2 11.6 (34.3) (23.3)
Total $ 939.3 100.0% $1,268.2 100.0% $ (328.9) (25.9)%
Firearms
Net sales for the year ended December 31, 2014 were $421.5 million, a decrease of $263.1 million, or
38.4%, as compared to the year ended December 31, 2013. Our firearms sales experienced declines across all our
major product categories. MSR and centerfire sales decreased $211.5 million and sales of shotguns, primarily
tactical styled, decreased $24.3 million. Sales of handguns decreased $18.4 million, while sales of rimfire rifles
decreased $8.3 million. In addition, sales of our other firearm products, firearms parts and services decreased $0.6
million.
For the year ended December 31, 2014, sales declined, in particular for MSR, handguns and centerfire
rifles, as sales have returned to more normalized levels. Concern over more restrictive government legislation
contributed to strong demand in the year ended December 31, 2013. Firearm sales also declined in the year ended
December 31, 2014, due to the fact that we temporarily ceased production and sales of our Remington Model 700™
during a substantial portion of 2014 while we focused on the product safety recall. In addition, because of the focus
on the product safety recall, many of our new product introductions were delayed. We resumed sales of our
Remington Model 700™ late in the third quarter of 2014 and full production in late 2014. We believe our firearms
sales have returned to more normalized levels, but are still above historical levels.
Ammunition
Net sales for the year ended December 31, 2014 were $404.9 million, a decrease of $31.5 million, or 7.2%,
as compared to the year ended December 31, 2013. Sales of shotshell ammunition decreased $20.2 million and sales
of centerfire ammunition decreased $9.0 million. In addition, sales in our other product lines decreased $6.5 million.
These decreases were partially offset by an increase in rimfire ammunition sales of $4.2 million. We believe our
ammunition sales have returned to more normalized levels, but are still above historical levels.
Consumer
Net sales were $112.9 million in our Consumer businesses for the year ended December 31, 2014, a
decrease of $34.3 million, or 23.3%, as compared to the prior-year period. Primary changes within the Consumer
businesses consisted of decreased parts sales of $34.5 million, partially offset by increased sales in our apparel,
airguns and other businesses of $0.2 million.
Cost of Goods Sold and Gross Profit
Our cost of goods sold includes all costs of material, labor, and overhead associated with product
manufacturing, except for transfer costs from our plants to our distribution center, which are included in selling,
general, and administrative expense. Accordingly, our gross margins may not be comparable to those of other
entities.
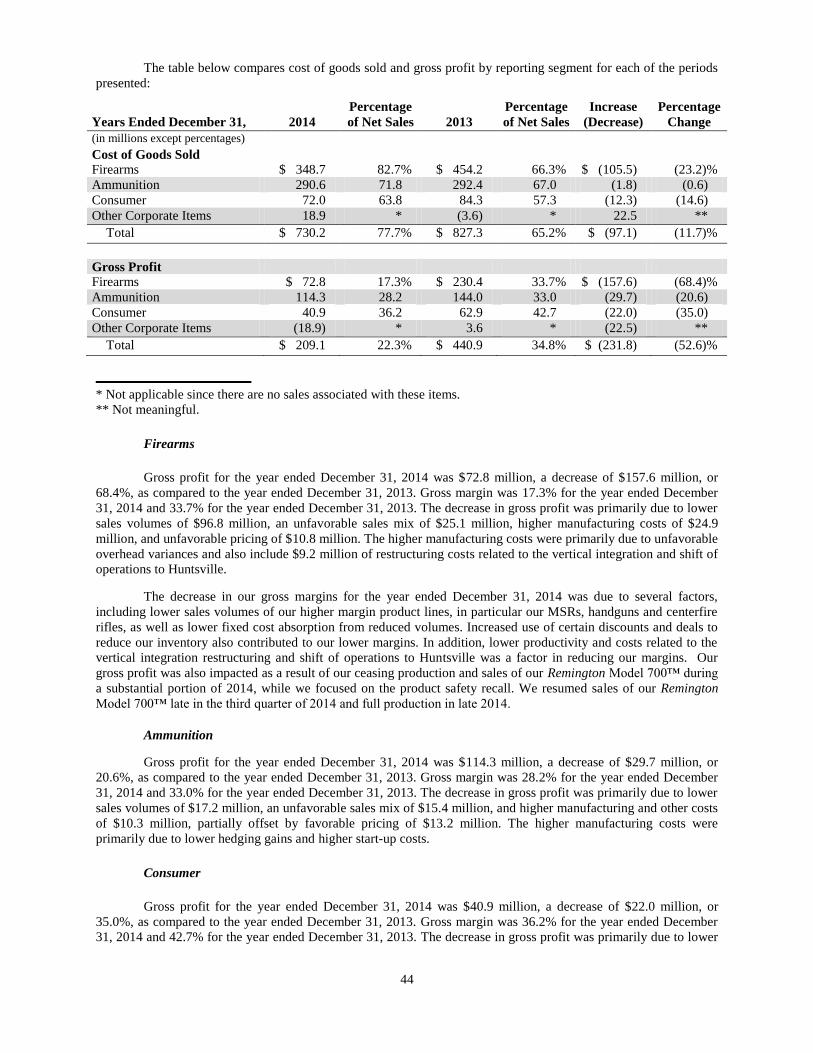
44
The table below compares cost of goods sold and gross profit by reporting segment for each of the periods
presented:
Years Ended December 31, 2014
Percentage
of Net Sales 2013
Percentage
of Net Sales
Increase
(Decrease)
Percentage
Change
(in millions except percentages)
Cost of Goods Sold
Firearms $ 348.7 82.7% $ 454.2 66.3% $ (105.5) (23.2)%
Ammunition 290.6 71.8 292.4 67.0 (1.8) (0.6)
Consumer 72.0 63.8 84.3 57.3 (12.3) (14.6)
Other Corporate Items 18.9 * (3.6) * 22.5 **
Total $ 730.2 77.7% $ 827.3 65.2% $ (97.1) (11.7)%
Gross Profit
Firearms $ 72.8 17.3% $ 230.4 33.7% $ (157.6) (68.4)%
Ammunition 114.3 28.2 144.0 33.0 (29.7) (20.6)
Consumer 40.9 36.2 62.9 42.7 (22.0) (35.0)
Other Corporate Items (18.9) * 3.6 * (22.5) **
Total $ 209.1 22.3% $ 440.9 34.8% $ (231.8) (52.6)%
* Not applicable since there are no sales associated with these items.
** Not meaningful.
Firearms
Gross profit for the year ended December 31, 2014 was $72.8 million, a decrease of $157.6 million, or
68.4%, as compared to the year ended December 31, 2013. Gross margin was 17.3% for the year ended December
31, 2014 and 33.7% for the year ended December 31, 2013. The decrease in gross profit was primarily due to lower
sales volumes of $96.8 million, an unfavorable sales mix of $25.1 million, higher manufacturing costs of $24.9
million, and unfavorable pricing of $10.8 million. The higher manufacturing costs were primarily due to unfavorable
overhead variances and also include $9.2 million of restructuring costs related to the vertical integration and shift of
operations to Huntsville.
The decrease in our gross margins for the year ended December 31, 2014 was due to several factors,
including lower sales volumes of our higher margin product lines, in particular our MSRs, handguns and centerfire
rifles, as well as lower fixed cost absorption from reduced volumes. Increased use of certain discounts and deals to
reduce our inventory also contributed to our lower margins. In addition, lower productivity and costs related to the
vertical integration restructuring and shift of operations to Huntsville was a factor in reducing our margins. Our
gross profit was also impacted as a result of our ceasing production and sales of our Remington Model 700™ during
a substantial portion of 2014, while we focused on the product safety recall. We resumed sales of our Remington
Model 700™ late in the third quarter of 2014 and full production in late 2014.
Ammunition
Gross profit for the year ended December 31, 2014 was $114.3 million, a decrease of $29.7 million, or
20.6%, as compared to the year ended December 31, 2013. Gross margin was 28.2% for the year ended December
31, 2014 and 33.0% for the year ended December 31, 2013. The decrease in gross profit was primarily due to lower
sales volumes of $17.2 million, an unfavorable sales mix of $15.4 million, and higher manufacturing and other costs
of $10.3 million, partially offset by favorable pricing of $13.2 million. The higher manufacturing costs were
primarily due to lower hedging gains and higher start-up costs.
Consumer
Gross profit for the year ended December 31, 2014 was $40.9 million, a decrease of $22.0 million, or
35.0%, as compared to the year ended December 31, 2013. Gross margin was 36.2% for the year ended December
31, 2014 and 42.7% for the year ended December 31, 2013. The decrease in gross profit was primarily due to lower
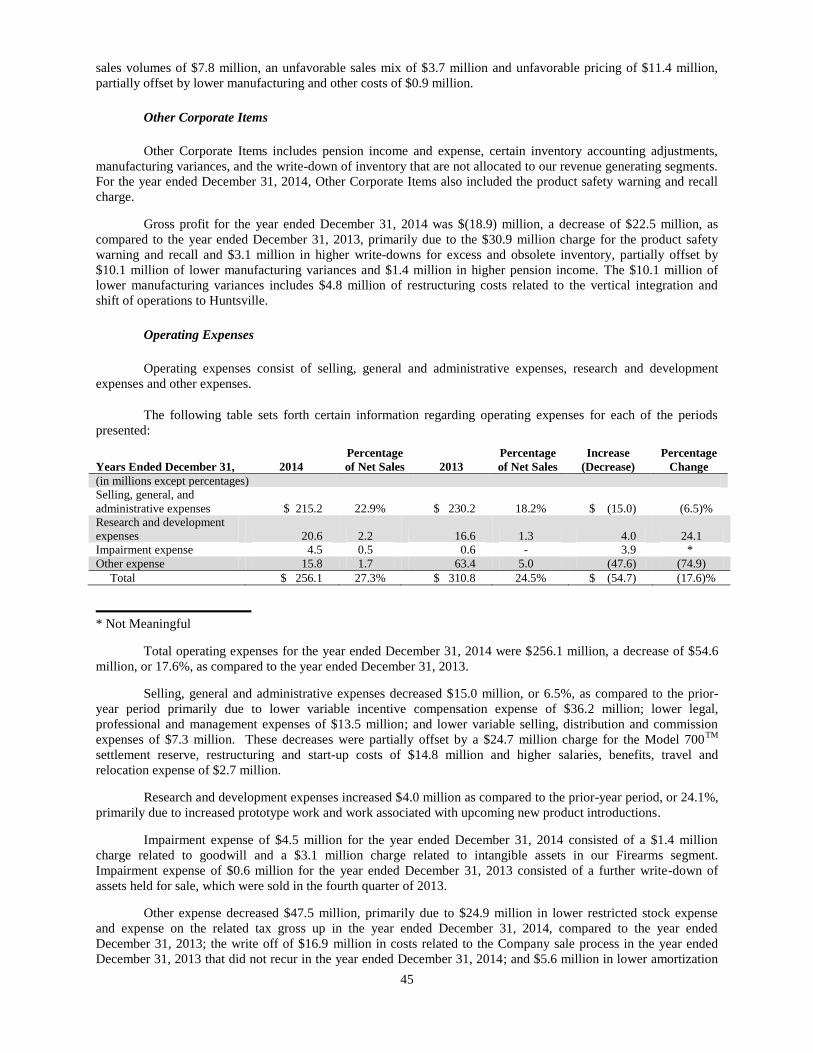
45
sales volumes of $7.8 million, an unfavorable sales mix of $3.7 million and unfavorable pricing of $11.4 million,
partially offset by lower manufacturing and other costs of $0.9 million.
Other Corporate Items
Other Corporate Items includes pension income and expense, certain inventory accounting adjustments,
manufacturing variances, and the write-down of inventory that are not allocated to our revenue generating segments.
For the year ended December 31, 2014, Other Corporate Items also included the product safety warning and recall
charge.
Gross profit for the year ended December 31, 2014 was $(18.9) million, a decrease of $22.5 million, as
compared to the year ended December 31, 2013, primarily due to the $30.9 million charge for the product safety
warning and recall and $3.1 million in higher write-downs for excess and obsolete inventory, partially offset by
$10.1 million of lower manufacturing variances and $1.4 million in higher pension income. The $10.1 million of
lower manufacturing variances includes $4.8 million of restructuring costs related to the vertical integration and
shift of operations to Huntsville.
Operating Expenses
Operating expenses consist of selling, general and administrative expenses, research and development
expenses and other expenses.
The following table sets forth certain information regarding operating expenses for each of the periods
presented:
Years Ended December 31, 2014
Percentage
of Net Sales 2013
Percentage
of Net Sales
Increase
(Decrease)
Percentage
Change
(in millions except percentages)
Selling, general, and
administrative expenses $ 215.2 22.9% $ 230.2 18.2% $ (15.0) (6.5)%
Research and development
expenses 20.6 2.2 16.6 1.3 4.0 24.1
Impairment expense 4.5 0.5 0.6 - 3.9 *
Other expense 15.8 1.7 63.4 5.0 (47.6) (74.9)
Total $ 256.1 27.3% $ 310.8 24.5% $ (54.7) (17.6)%
* Not Meaningful
Total operating expenses for the year ended December 31, 2014 were $256.1 million, a decrease of $54.6
million, or 17.6%, as compared to the year ended December 31, 2013.
Selling, general and administrative expenses decreased $15.0 million, or 6.5%, as compared to the prior-
year period primarily due to lower variable incentive compensation expense of $36.2 million; lower legal,
professional and management expenses of $13.5 million; and lower variable selling, distribution and commission
expenses of $7.3 million. These decreases were partially offset by a $24.7 million charge for the Model 700TM
settlement reserve, restructuring and start-up costs of $14.8 million and higher salaries, benefits, travel and
relocation expense of $2.7 million.
Research and development expenses increased $4.0 million as compared to the prior-year period, or 24.1%,
primarily due to increased prototype work and work associated with upcoming new product introductions.
Impairment expense of $4.5 million for the year ended December 31, 2014 consisted of a $1.4 million
charge related to goodwill and a $3.1 million charge related to intangible assets in our Firearms segment.
Impairment expense of $0.6 million for the year ended December 31, 2013 consisted of a further write-down of
assets held for sale, which were sold in the fourth quarter of 2013.
Other expense decreased $47.5 million, primarily due to $24.9 million in lower restricted stock expense
and expense on the related tax gross up in the year ended December 31, 2014, compared to the year ended
December 31, 2013; the write off of $16.9 million in costs related to the Company sale process in the year ended
December 31, 2013 that did not recur in the year ended December 31, 2014; and $5.6 million in lower amortization
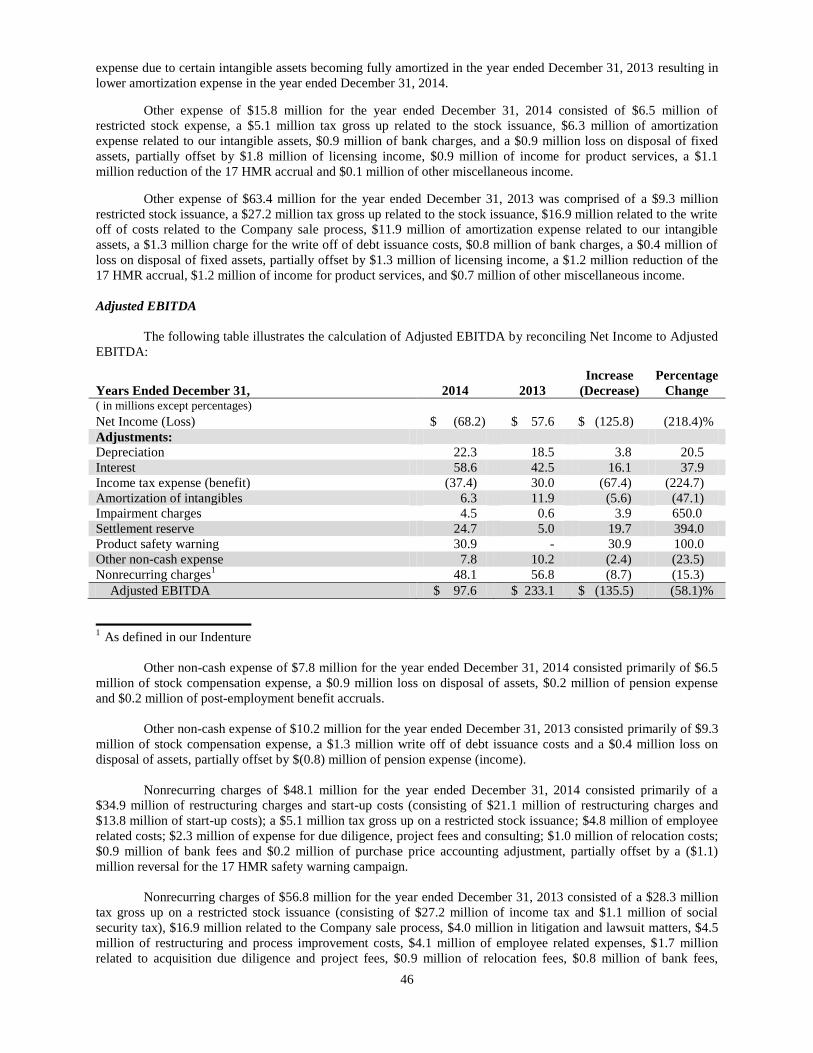
46
expense due to certain intangible assets becoming fully amortized in the year ended December 31, 2013 resulting in
lower amortization expense in the year ended December 31, 2014.
Other expense of $15.8 million for the year ended December 31, 2014 consisted of $6.5 million of
restricted stock expense, a $5.1 million tax gross up related to the stock issuance, $6.3 million of amortization
expense related to our intangible assets, $0.9 million of bank charges, and a $0.9 million loss on disposal of fixed
assets, partially offset by $1.8 million of licensing income, $0.9 million of income for product services, a $1.1
million reduction of the 17 HMR accrual and $0.1 million of other miscellaneous income.
Other expense of $63.4 million for the year ended December 31, 2013 was comprised of a $9.3 million
restricted stock issuance, a $27.2 million tax gross up related to the stock issuance, $16.9 million related to the write
off of costs related to the Company sale process, $11.9 million of amortization expense related to our intangible
assets, a $1.3 million charge for the write off of debt issuance costs, $0.8 million of bank charges, a $0.4 million of
loss on disposal of fixed assets, partially offset by $1.3 million of licensing income, a $1.2 million reduction of the
17 HMR accrual, $1.2 million of income for product services, and $0.7 million of other miscellaneous income.
Adjusted EBITDA
The following table illustrates the calculation of Adjusted EBITDA by reconciling Net Income to Adjusted
EBITDA:
Years Ended December 31, 2014 2013
Increase
(Decrease)
Percentage
Change ( in millions except percentages)
Net Income (Loss) $ (68.2) $ 57.6 $ (125.8) (218.4)%
Adjustments:
Depreciation 22.3 18.5 3.8 20.5
Interest 58.6 42.5 16.1 37.9
Income tax expense (benefit) (37.4) 30.0 (67.4) (224.7)
Amortization of intangibles 6.3 11.9 (5.6) (47.1)
Impairment charges 4.5 0.6 3.9 650.0
Settlement reserve 24.7 5.0 19.7 394.0
Product safety warning 30.9 - 30.9 100.0
Other non-cash expense 7.8 10.2 (2.4) (23.5)
Nonrecurring charges1 48.1 56.8 (8.7) (15.3)
Adjusted EBITDA
$ 97.6 $ 233.1 $ (135.5) (58.1)%
1
As defined in our Indenture
Other non-cash expense of $7.8 million for the year ended December 31, 2014 consisted primarily of $6.5
million of stock compensation expense, a $0.9 million loss on disposal of assets, $0.2 million of pension expense
and $0.2 million of post-employment benefit accruals.
Other non-cash expense of $10.2 million for the year ended December 31, 2013 consisted primarily of $9.3
million of stock compensation expense, a $1.3 million write off of debt issuance costs and a $0.4 million loss on
disposal of assets, partially offset by $(0.8) million of pension expense (income).
Nonrecurring charges of $48.1 million for the year ended December 31, 2014 consisted primarily of a
$34.9 million of restructuring charges and start-up costs (consisting of $21.1 million of restructuring charges and
$13.8 million of start-up costs); a $5.1 million tax gross up on a restricted stock issuance; $4.8 million of employee
related costs; $2.3 million of expense for due diligence, project fees and consulting; $1.0 million of relocation costs;
$0.9 million of bank fees and $0.2 million of purchase price accounting adjustment, partially offset by a ($1.1)
million reversal for the 17 HMR safety warning campaign.
Nonrecurring charges of $56.8 million for the year ended December 31, 2013 consisted of a $28.3 million
tax gross up on a restricted stock issuance (consisting of $27.2 million of income tax and $1.1 million of social
security tax), $16.9 million related to the Company sale process, $4.0 million in litigation and lawsuit matters, $4.5
million of restructuring and process improvement costs, $4.1 million of employee related expenses, $1.7 million
related to acquisition due diligence and project fees, $0.9 million of relocation fees, $0.8 million of bank fees,
47
partially offset by ($3.2) million in purchase accounting adjustments and a ($1.2) million reversal for the 17 HMR
safety warning campaign.
Interest Expense
Interest expense was $58.6 million for the year ended December 31, 2014, compared to $42.5 million for
the year ended December 31, 2013. The $16.1 million increase in interest expense over the year ended December
31, 2013 was due to $9.1 million of additional interest expense related to the borrowing of the Incremental Term
Loans, $5.2 million of additional interest expense on our interest rate swap, $1.0 million of interest expense related
to our ABL Revolver, $1.1 million of higher amortization expense related to debt acquisition costs and amortization
of bond discount, and $0.5 million of interest expense related to our newly acquired Huntsville facility, partially
offset by a $0.6 million in accretion adjustments and $0.2 million of miscellaneous interest income.
Income Tax Provision
Our effective tax rate on continuing operations for the years ended December 31, 2014 and 2013 was
35.4% and 34.2% respectively. The difference between the actual effective tax rate and the federal statutory rate of
35% is principally due to state income taxes, permanent differences, and the utilization of available tax credits. The
effective tax rate for the year ended December 31, 2014 was additionally impacted by the recording of a valuation
allowance of $3.7 million for certain state tax credits. The valuation allowance was recorded as a result of changes
in the corporate income tax regime for New York State due to legislation enacted effective March 31, 2014. We
believe that the deferred tax asset related to the New York State tax credits carried forward is no longer more likely
than not to be realized as a result of the enacted legislation.
We are subject to ongoing audits by federal and state tax authorities. Depending on the outcome of these
audits, we may be required to pay additional taxes. However, we do not believe that any additional taxes and related
interest or penalties would have a material impact on our financial position, results of operations, or cash flows.
Our continuing practice is to recognize interest and/or penalties related to income tax matters within
income tax expense.
Liquidity and Capital Resources
We generally expect to fund expenditures for operations, administrative expenses, capital expenditures,
debt service obligations and our working capital needs with internally generated funds from operations and
borrowings under our ABL Revolver. We believe that we will be able to meet our debt service obligations and fund
our short-term and long-term operating requirements. In the near term, we expect to use borrowings under the ABL
Revolver, existing cash and cash flow from operations, although no assurance can be given in this regard.
We continue to focus on managing our working capital by monitoring inventory, accounts receivable and
accounts payable key performance indicators while recognizing that changes to our sales volumes and timing can
impact our working capital strategies. As part of our 2016 planning process, we are assessing inventory positions for
certain product categories.
In June 2014, we amended our credit facility agreement which increased the borrowing capacity under our
ABL Revolver by $75.0 million to $225.0 million and extended its maturity to June 2019. We were in compliance
with our debt covenants at December 31, 2015 and had the ability to borrow an additional approximately $129.8
million under our ABL Revolver (the “Excess Availability”). Under our ABL Revolver, if the Excess Availability
falls below $33.75 million, we will be required to comply with certain restrictive covenants including covenants
related to permitted investments, repurchase of capital stock, incurrence of indebtedness, sales of assets and
dividend distributions. In addition, if Excess Availability falls below $22.5 million, lenders have the right to enforce
collections and amounts owed to FGI Opco on certain accounts and collateral.
We believe the cash we generate internally from our operating activities, in addition to access to additional
borrowings under our ABL Revolver and letters of credit, provides us with an adequate financial pool that allows us
to meet our short-term and strategic goals. Based on these factors, we believe our liquidity position is adequate to
meet our financial commitments and manage our business.
48
We have approximately $10.0 million of cash in a restricted account in order to collateralize certain vendor
financing arrangements.
2015 Cash Flows and Working Capital
Cash Flows from Operating Activities
Net cash provided by operating activities was $6.5 million for the year ended December 31, 2015 compared
to net cash used in operating activities of $41.8 million for the year ended December 31, 2014. The significant
changes comprising the $48.3 million increase in net provided by operating activities for the year ended December
31, 2015 compared to the prior-year period resulted primarily from:
• deferred income taxes decreasing by $63.2 million during the year ended December 31, 2015 compared to
an increase of $17.0 million during the year ended December 31, 2014, a net increase in cash provided by
operating activities of $80.2 million, primarily due to the recording of a non-cash valuation allowance of
$103.7 million for deferred tax assets that are not considered more likely than not to be realized;
• accounts payable increasing by $14.6 million during the year ended December 31, 2015 compared to a
decrease of $34.6 million during the year ended December 31, 2014, a net increase in cash provided by
operating activities of $49.2 million, primarily due to an increased focus on vendor payment terms and
increased losses in our commodity hedges;
• prepaid expenses and other current and long-term assets decreasing $22.8 million during the year ended
December 31, 2015 compared to an increase of $6.0 million during the year ended December 31, 2014, a
net increase in cash provided by operating activities of $28.8 million, primarily due to the receipt of income
tax refunds in 2015.
• trade receivables decreasing $11.2 million during the year ended December 31, 2015 compared to an
increase of $8.9 million during the year ended December 31, 2014, a net increase in cash provided by
operating activities of $20.1 million, primarily due to increased collections at the end of 2015, combined
with lower fourth quarter 2015 sales compared to fourth quarter 2014; partially offset by
• a net loss of $135.5 million during the year ended December 31, 2015 compared to a net loss of $68.2
million during the year ended December 31, 2014, a net decrease in cash provided by operating activities of
$67.3 million;
• inventory increasing by $5.4 million during the year ended December 31, 2015 compared to a decrease of
$47.7 million during the year ended December 31, 2014, a net decrease in cash provided by operating
activities of $53.1 million. During 2014 and into 2015, we focused on inventory management and reducing
channel inventory.
• other liabilities decreasing by $7.6 million during the year ended December 31, 2015 compared to a
decrease of $0.8 million during the year ended December 31, 2014, a net decrease in cash provided by
operating activities of $6.8 million. This was primarily due to decreases in certain accruals, such as
marketing, legal and employee compensation when compared to the prior year period.
Cash Flows from Investing Activities
Net cash used in investing activities of $34.6 million for the year ended December 31, 2015 was primarily
related to the purchase of property, plant and equipment of $44.9 million, partially offset by $9.2 million received
for the sale of a subsidiary and $1.1 million of proceeds related to the sale of property, plant and equipment.
Cash Flows from Financing Activities
Net cash used by financing activities was $12.0 million for the year ended December 31, 2015 and
consisted primarily of a $48.7 million distribution of indirect interests, $8.3 million of principal payments on our
debt and $0.6 million of disbursements for debt issuance costs. These payments were partially offset by $17.5
million of various state and local incentives, which are restricted for use in connection with the acquisition,
construction or improvement of property, plant and equipment. We also received $9.8 million from the issuance of
stock, $8.9 million in net borrowings on our ABL Revolver, had a $6.7 million book overdraft, realized $2.3 million
of tax benefits from restricted stock modifications and received $0.4 million from exercised stock options.
49
2014 Cash Flows and Working Capital
Cash Flows from Operating Activities
Net cash used in operating activities was $41.8 million for the year ended December 31, 2014 compared to
net cash provided by operating activities of $99.8 million for the year ended December 31, 2013. The significant
changes comprising the $141.6 million increase in net cash used in operating activities for the year ended December
31, 2014 compared to the prior-year period resulted primarily from:
• other liabilities decreasing by $0.8 million during the year ended December 31, 2014 compared to an
increase of $46.1 million during the year ended December 31, 2013, or a net increase in net cash used of
$46.9 million. This was primarily due to decreases in certain accruals such as marketing, excise taxes and
employee compensation when compared to the prior year period;
• accounts payable decreasing by $34.6 million during the year ended December 31, 2014 compared to an
increase of $13.8 million during the year ended December 31, 2013, or a net increase in net cash used of
$48.4 million. The decline was due to reduced inventory purchases and improved cash management
processes; and
• receivables increasing by $8.9 million during the year ended December 31, 2014 compared to a decrease of
$27.2 million during the year ended December 31, 2013, or a net increase in net cash used of $36.1
million. Receivables have increased due to sales returning to more normalized levels.
Cash Flows from Investing Activities
Net cash used in investing activities of $76.0 million during the year ended December 31, 2014 was
primarily related to payments made during our acquisitions, net of cash acquired, totaling $1.9 million, and the
purchase of property, plant and equipment of $74.3 million.
Cash Flows from Financing Activities
Net cash provided by financing activities was $7.2 million during the year ended December 31, 2014. Net
borrowings from our ABL Revolver were $6.5 million during the year ended December 31, 2014, while the
amendment of the ABL Revolver agreement resulted in $2.8 million of issuance costs. We also received $1.9
million of proceeds from a $12.5 million promissory note with the city of Huntsville, Alabama. The remaining
proceeds of the promissory note were used to finance the facility in Huntsville, Alabama. We received $16.6 million
of various state and local incentives which are restricted for use in connection with the acquisition, construction or
improvement of property, plant and equipment. In addition, we received approximately $1.0 million from exercised
stock options which was offset by $6.2 million of disbursements to repurchase 1,994 shares of our outstanding
common stock. We also disbursed $5.8 million for the outstanding principal on our Term Loan B and $4.0 million
for other short-term financing arrangements.
Debt
As of December 31, 2015, we had outstanding indebtedness of approximately $839.1 million, which
consisted of the following:
• $250.0 million of outstanding 2020 Notes;
• $559.6 million outstanding under our Term Loan B;
• $15.4 million outstanding under the ABL Revolver;
• $12.5 million outstanding under the Promissory Note; and
• $1.6 million of capital lease obligations and other debt.
50
Refer to note 8 under “8. — Financial Statements and Supplementary Data” for a complete discussion of
our indebtedness at December 31, 2015.
Capital and Operating Leases and Other Long-Term Obligations
We maintain capital leases mainly for computer equipment. We have several operating leases, including a
lease for our Memphis warehouse that expires in June 2016, our Madison annex office that expires in September
2016, and leases for several of our manufacturing facilities that expire on various dates through 2023. We also
maintain contracts including, among other things, a services contract with our third party warehouse provider. We
also have various pension plan obligations.
Capital Expenditures
Gross capital expenditures for the years ended December 31, 2015 and 2014 were $44.9 million and
$74.3 million, respectively, consisting primarily of capital expenditures both for new equipment related to the
manufacture of firearms and ammunition, as well as capital maintenance of existing facilities. We expect total
capital expenditures for 2016 to be in the range of $35.0 million to $50.0 million, of which approximately
$15.0 million is expected to be related to capital maintenance projects and the remainder related to capital
expenditures for new assets in order to improve production and produce new products.
Off-Balance Sheet Arrangements
As of December 31, 2015, off balance sheet arrangements consisted of our obligations in respect of standby
letters of credit of $14.2 million.
Contractual Obligations and Commercial Commitments
We have various purchase commitments for services incidental to the ordinary conduct of business,
including, among other things, a services contract with our third-party warehouse provider. We do not believe such
commitments are at prices in excess of current market prices. Included in those purchase commitments are purchase
contracts with certain raw materials suppliers, for periods ranging from one to five years, some of which contain
firm commitments to purchase minimum specified quantities. However, such contracts had no material impact on
our financial condition, results of operations, or cash flows during the reporting periods presented herein.
We support service and repair facilities for all of our firearm products in order to meet the service needs of
our distributors, customers and consumers nationwide. We provide consumer warranties against manufacturing
defects in all firearm products we manufacture in the United States. Estimated future warranty costs are accrued at
the time of sale and are primarily based upon historical experience. Product modifications or corrections are
voluntary steps taken by us to assure proper usage or performance of a product by consumers. The cost associated
with product modifications and/or corrections are recognized in accordance with FASB ASC 450 “Contingencies”,
and charged to operations. The cost of these programs is not expected to have a material adverse impact on our
operations, liquidity or cash flows.
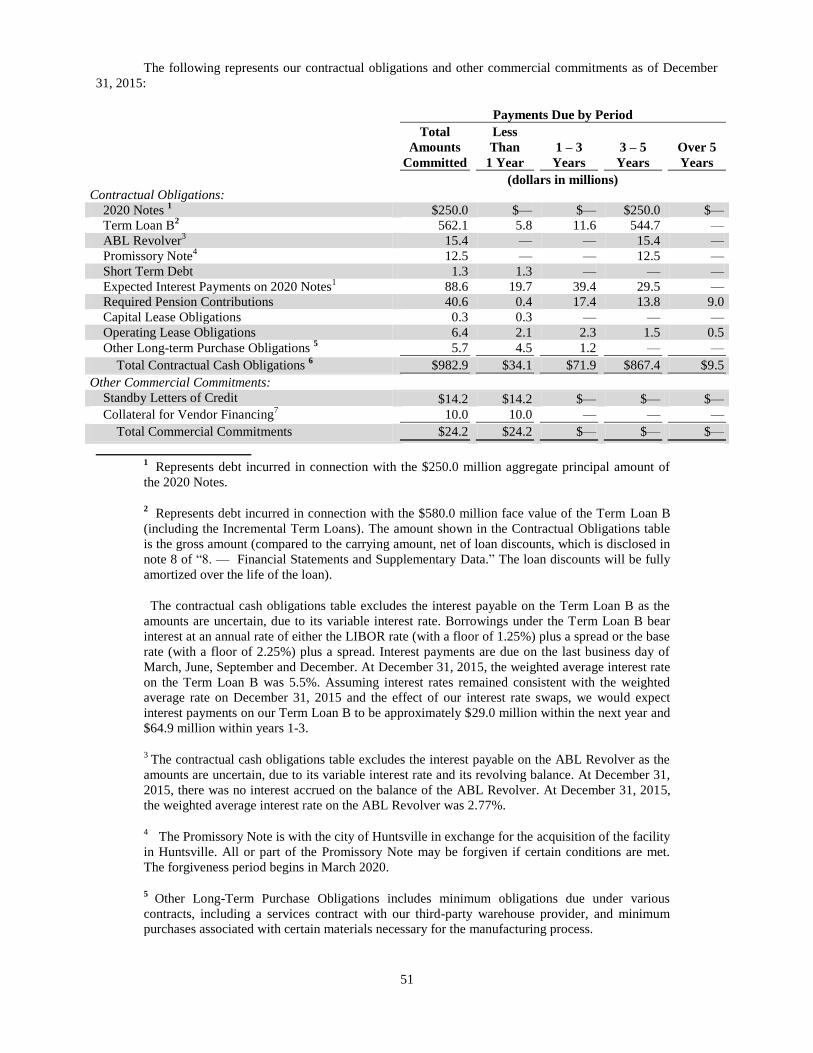
51
The following represents our contractual obligations and other commercial commitments as of December
31, 2015:
Payments Due by Period
Total
Amounts
Committed
Less
Than
1 Year
1 – 3
Years
3 – 5
Years
Over 5
Years
(dollars in millions)
Contractual Obligations:
2020 Notes 1 $250.0 $— $— $250.0 $—
Term Loan B2 562.1 5.8 11.6 544.7 —
ABL Revolver3
15.4 — — 15.4 —
Promissory Note4
12.5 — — 12.5 —
Short Term Debt 1.3 1.3 — — —
Expected Interest Payments on 2020 Notes1
88.6 19.7 39.4 29.5 —
Required Pension Contributions 40.6 0.4 17.4 13.8 9.0
Capital Lease Obligations 0.3 0.3 — — —
Operating Lease Obligations 6.4 2.1 2.3 1.5 0.5
Other Long-term Purchase Obligations 5 5.7 4.5 1.2 — —
Total Contractual Cash Obligations 6 $982.9 $34.1 $71.9 $867.4 $9.5
Other Commercial Commitments:
Standby Letters of Credit $14.2 $14.2 $— $— $—
Collateral for Vendor Financing7
10.0 10.0 — — —
Total Commercial Commitments $24.2 $24.2 $— $— $—
1
Represents debt incurred in connection with the $250.0 million aggregate principal amount of
the 2020 Notes.
2 Represents debt incurred in connection with the $580.0 million face value of the Term Loan B
(including the Incremental Term Loans). The amount shown in the Contractual Obligations table
is the gross amount (compared to the carrying amount, net of loan discounts, which is disclosed in
note 8 of “8. — Financial Statements and Supplementary Data.” The loan discounts will be fully
amortized over the life of the loan).
The contractual cash obligations table excludes the interest payable on the Term Loan B as the
amounts are uncertain, due to its variable interest rate. Borrowings under the Term Loan B bear
interest at an annual rate of either the LIBOR rate (with a floor of 1.25%) plus a spread or the base
rate (with a floor of 2.25%) plus a spread. Interest payments are due on the last business day of
March, June, September and December. At December 31, 2015, the weighted average interest rate
on the Term Loan B was 5.5%. Assuming interest rates remained consistent with the weighted
average rate on December 31, 2015 and the effect of our interest rate swaps, we would expect
interest payments on our Term Loan B to be approximately $29.0 million within the next year and
$64.9 million within years 1-3.
3 The contractual cash obligations table excludes the interest payable on the ABL Revolver as the
amounts are uncertain, due to its variable interest rate and its revolving balance. At December 31,
2015, there was no interest accrued on the balance of the ABL Revolver. At December 31, 2015,
the weighted average interest rate on the ABL Revolver was 2.77%.
4 The Promissory Note is with the city of Huntsville in exchange for the acquisition of the facility
in Huntsville. All or part of the Promissory Note may be forgiven if certain conditions are met.
The forgiveness period begins in March 2020.
5 Other Long-Term Purchase Obligations includes minimum obligations due under various
contracts, including a services contract with our third-party warehouse provider, and minimum
purchases associated with certain materials necessary for the manufacturing process.
52
6 The contractual cash obligations above exclude: (i) income taxes that may be paid in future
years; (ii) any impact for likely future reversal of net deferred income tax liabilities when reversal
occurs; (iii) income tax liabilities of approximately $1.7 million as of December 31, 2015 for
unrecognized tax benefits due to uncertainty on the timing of related payments, if any; and
(iv) capital expenditures that may be made although not under contract as of December 31, 2015
(cash paid for capital expenditures was approximately $44.9 million in the year ended December
31, 2015).
7 The Company has approximately $10.0 of cash in a restricted account in order to collateralize certain
vendor financing arrangements.
Critical Accounting Policies and Estimates
Our discussion and analysis of our financial condition, results of operations, and cash flows are based upon
our consolidated financial statements, which have been prepared in accordance with GAAP. The preparation of
these financial statements requires us to make estimates and judgments that affect the reported amounts of assets,
liabilities, revenues and expenses, and related disclosure of contingent assets and liabilities. On an ongoing basis, we
evaluate our estimates, including those related to inventories, supplies, accounts receivable, warranties, long-lived
assets, product liability, revenue recognition (inclusive of cash discounts, rebates, and sales returns), advertising and
promotional costs, self-insurance, pension and post-retirement benefits, deferred tax assets, and goodwill. We base
our estimates on historical experience and on various other assumptions that are believed to be reasonable under the
circumstances, the results of which form the basis for making judgments about the carrying values of assets and
liabilities that are not readily apparent from other sources. As noted below, in some cases, our estimates are also
based in part on the assistance of independent advisors. Actual results may differ from these estimates under
different assumptions or conditions.
Management has addressed and reviewed our critical accounting policies and considers them appropriate.
We believe the following critical policies utilize significant judgments and estimates used in the preparation of our
consolidated financial statements:
Revenue Recognition
Sales, net of an estimate for discounts, returns and allowances, and related cost of sales are recorded at
which time risk of loss and title transfer to the customer. We continually evaluate our sales terms against criteria
outlined in SEC Staff Accounting Bulletin 104, Revenue Recognition. We follow the industry practice of selling a
limited amount of select firearms pursuant to a “dating” plan, allowing the customer to purchase these products
commencing in December (the start of our dating plan year) and to pay for them on extended terms. We use certain
dating plans and those plans have the effect of shifting some firearms sales from the second and third quarters to the
first and fourth quarters. As a competitive measure, we offer extended terms on select ammunition purchases.
However, use of the dating plans also results in deferral of collection of accounts receivable until the latter part of
the year. Customers do not have the right to return unsold product. Management uses historical trend information as
well as other economic data to estimate future discounts, returns, rebates and allowances.
Allowance for Doubtful Accounts
We maintain an allowance for doubtful receivables for estimated losses resulting from the inability of our
trade customers to make required payments. We provide an allowance for specific customer accounts where
collection is doubtful and also provide an allowance for customer deductions based on historical collection and
write-off experience. Additional allowances would be required if the financial conditions of our customers
deteriorated.
Inventories
Our inventories are valued at the lower of cost or market. We evaluate the quantities of inventory held
against past and future demand and market conditions to determine excess or slow moving inventory. For those
product classes of inventory identified, we estimate their market value based on current and projected selling prices.
We periodically write inventory amounts down to market for any excess and obsolete inventory when costs exceed
market value. This methodology recognizes projected inventory losses at the time such losses are evident rather than
at the time goods are actually sold.
53
Property, Plant and Equipment
Property, plant and equipment are stated at cost less accumulated depreciation. Depreciation is determined
on a straight-line basis over the estimated useful life of the individual asset by major asset class as follows:
Buildings 20 to 43 years
Building and leasehold improvements 1 to 15 years
Machinery and equipment 7 to 15 years
Furniture and fixtures 7 to 10 years
Trailers and automotive equipment 3 to 5 years
Computer equipment 1 to 3 years
In accordance with FASB ASC 360 “Property, Plant, and Equipment”, management assesses property,
plant and equipment for impairment whenever facts and circumstances indicate that the carrying amount may not be
fully recoverable. Maintenance and repairs are charged to operations; replacements and betterments are capitalized.
Computer hardware and software, lighting and postage equipment under capital leases are amortized over the term
of the lease. The cost and related accumulated depreciation applicable to assets sold or retired are removed from the
accounts and the gain or loss on disposition is recognized in operations, included in the other income and expenses.
We recognized $2.1 million of impairment charges during 2015 as a result of idle facilities available for
sale. Refer to notes 5 and 14 of “8. — Financial Statements and Supplementary Data” for additional discussion of
assets that were held for sale and determination of their fair value prior to their sale.
Goodwill, Goodwill Impairment, and Intangible Assets
We adopted the provisions of FASB ASC 350 “Intangibles-Goodwill and Other” for goodwill and
intangible assets. We test goodwill and other indefinite-lived intangible assets for impairment annually and at any
time events or circumstances indicate that intangible assets might be impaired prior to our annual impairment test.
At October 1 each year, we test our goodwill and other indefinite-lived intangible assets for potential impairments.
Goodwill impairment testing is performed at the reporting unit, which is at a level below our operating segments,
and consists of a two-step process. In the first step, the fair value of a reporting unit is compared to its carrying
amount, including goodwill. If the fair value of the reporting unit is less than its carrying amount, then the second
step of the test process is performed in order to determine the amount of impairment loss. The second step compares
the implied fair value of the reporting unit’s goodwill to the carrying amount of that goodwill. If the carrying
amount of goodwill exceeds its implied value, an impairment loss is recognized for the amount of that excess.
Impairment testing on indefinite-lived intangible assets compares the asset’s fair value against its carrying amount.
If the carrying amount exceeds its fair value, an impairment loss is recognized for the amount of that excess.
During our 2015 annual impairment test, we compared the fair value of the assets with their carrying value
within certain of our other Firearms reporting units and certain of our Consumer reporting units and concluded that
$1.1 million of trademarks were deemed impaired. During 2015, there were no events or circumstances indicating
the carrying amounts of our goodwill, and definite-lived intangible assets were impaired or nonrecoverable.
During our 2014 annual impairment test, we revised our outlook for the firearms markets on the basis that
current conditions could indicate a potential impairment of our goodwill and indefinite-lived intangible assets. We
compared the fair value of the assets within the handgun reporting unit to their carrying value and concluded that
$1.4 million of goodwill and $1.9 million of related trademarks were deemed impaired. We also recognized $1.2
million of impairment charges for trademarks of our other firearms’ brands.
During 2013, there were no events or circumstances indicating the carrying amounts of our goodwill,
indefinite-lived, and definite-lived intangible assets were impaired or nonrecoverable. We did not recognize any
impairment charges in 2013 as a result of our annual testing for goodwill and indefinite-lived intangible asset
impairments.
The impairment testing of goodwill estimates the fair values of our reporting units from an equally-
weighted combination of two valuation approaches: the income approach and market approach. The income
approach estimates fair value based on income streams a reporting unit can expect to generate over its useful life.
Those income streams are discounted at a rate appropriate to the risk profile of the reporting unit from the
54
perspective of a market participant, referred to as the discount cash flow method. Under the market approach, the
fair value of a reporting unit reflects the purchase price of comparable companies. The guideline public company
method compares the reporting unit to public companies that are in the same industry whose stock is actively traded
on organized exchanges.
The discounted cash flow method relies primarily on internally provided assumptions such as projected
revenues, operating margins, growth rates, and discount rates. These internally generated assumptions were based on
actual, historical results, forecasted trends applicable to those reporting units, and discount rates which are used to
provide the present value of a reporting unit’s cash flows. The guideline public company method used inputs from
comparable publicly-traded companies that were more observable, such as market capitalization, weighted average
costs of capital, revenue multiples, as well as general observable inputs such as the 30-year Treasury Bond yield
used to determine the risk-free rate. After the fair values under both methods were determined for each reporting
unit, equal weight was applied from both methods to estimate the reporting units’ fair value. After completion of the
first step of the goodwill impairment test, it was concluded that each reporting units’ fair value exceeded their
carrying amount thereby indicating no additional impairment of goodwill.
The fair value of our trademarks was determined using the discounted cash flow method and relied on
assumptions such as revenue growth rates and discount rates to estimate their fair values. During 2015, the fair value
of our remaining trademarks was less than their respective carrying values and impairment charges of $1.1 million
were recognized as of December 31, 2015.
Refer to notes 6 and 14 of “8. — Financial Statements and Supplementary Data” for additional discussion
of goodwill and intangible asset impairment charges.
Reserves for Product Liability
We provide for estimated defense and settlement costs related to product liabilities when it becomes
probable that a liability has been incurred and reasonable estimates of such costs are available. Estimates for
accruals for product liability matters are based on historical patterns of the number of occurrences, costs incurred
and a range of potential outcomes. We also utilize the assistance of independent advisors to assist in analyzing the
adequacy of such reserves. Due to the inherently unpredictable nature of litigation, actual results will likely differ
from estimates and those differences could be material.
Employee Benefit Plans
We have defined benefit plans and post-retirement benefit plans that cover certain of our salaried and
hourly paid employees. As a result of amendments to our defined benefit plans, future accrued benefits for all
employees were frozen as of January 1, 2008. As of January 1, 2011, future accrued benefits for eligible participants
in our other non-union postemployment benefit (“OPEB”) plans were also frozen.
We derive pension benefit expense from an actuarial calculation based on the defined benefit plans’
provisions and management’s assumptions regarding discount rate and expected long-term rate of return on assets.
Management determines the expected long-term rate of return on plan assets based upon historical actual asset
returns and the expectations of asset returns over the expected period to fund participant benefits based on the
current investment mix of our plans. The discount rate is based on the yield of high quality fixed income
investments expected to be available in the future when cash flows are paid. In addition, management also consults
with independent actuaries in determining these assumptions. Our OPEB plans are unfunded but their discount rates
are computed in a similar manner as those for our pension plans.
Effective January 1, 2012, we changed our policy to amortize actuarial gains and losses over the
participants’ average remaining life expectancy and employ the corridor approach for all of our retirement plans. We
believe that implementing the corridor approach and amortizing actuarial gains and losses over the participants’
average remaining life expectancy is preferable because recognition of gains and losses will occur over the same
period that the average benefit obligations are satisfied, gains and losses will be treated similarly as other
components of pension costs and our assumptions will be uniform as all of our retirement plans have similar
participant populations and attributes. The change in assumptions resulted in a change in estimate affected by a
change in accounting principle and was made on a prospective basis as of January 1, 2012.
55
Reserves for Workers’ Compensation Liability
We provide for estimated medical and indemnity compensation costs related to workers’ compensation
liabilities when it becomes probable that a liability has been incurred and reasonable estimates of such costs are
available. Estimates for accruals for workers compensation liability matters are based on historical patterns of the
number of occurrences, costs incurred and a range of potential outcomes. We also utilize the assistance of
independent advisors to assist in analyzing the adequacy of such reserves.
Income Taxes
Income tax expense is based on pretax financial accounting income. We recognize deferred tax assets and
liabilities for the future tax consequences attributable to differences between financial statement carrying amounts of
existing assets and liabilities and their respective tax bases. Deferred tax assets and liabilities are measured using
enacted tax rates expected to be applied to taxable income in the years in which those temporary differences are
expected to be recovered or settled.
U.S. GAAP standards of accounting for income taxes require a reduction in the carrying amount of
deferred tax assets by recording a valuation allowance if, based on the available evidence, it is more likely than not
such assets will not be realized. The valuation of deferred tax assets requires judgment in assessing the likely future
tax consequences of events that have been recognized in our financial statements or tax returns and future
profitability. Our accounting for deferred tax consequences represents our best estimate of those future events.
During 2015, the Company recorded a valuation allowance of $103.7 million.
Refer to notes 12 of “8. — Financial Statements and Supplementary Data” for additional discussion of
income taxes and the valuation allowance.
Fair Value Measurements
Under current accounting guidance, fair value is defined as the price that would be received to sell an asset
or paid to transfer a liability in the principal or most advantageous market for the asset or liability in an orderly
transaction between market participants at the measurement date (that is, an exit price). The exit price is based on
the amount that the holder of the asset or liability would receive or need to pay in an actual transaction (or in a
hypothetical transaction if an actual transaction does not exist) at the measurement date. In some circumstances, the
entry and exit price may be the same; however, they are conceptually different. Fair value is generally determined
based on quoted market prices in active markets for identical assets or liabilities. If quoted market prices are not
available, we use valuation techniques that place greater reliance on observable inputs and less reliance on
unobservable inputs. In measuring fair value, we may make adjustments for risks and uncertainties, if a market
participant would include such an adjustment in its pricing.
Refer to note 14 of “8. — Financial Statements and Supplementary Data” for additional discussion of fair
value measurements.
Recent Accounting Pronouncements
See note 2 of “8.— Financial Statements and Supplementary Data” for disclosure of recent accounting
pronouncements.
Related Party Transactions
See “13.— Certain Relationships and Related Transactions, and Director Independence”, appearing
elsewhere in this annual report.
56
7A. QUANTITATIVE AND QUALITATIVE DISCLOSURES ABOUT MARKET RISK
The primary market risks our financial instruments are exposed to are fluctuations in commodity prices and
interest rates. These risks are monitored as part of our risk management control system, and we have established
policies and procedures governing our management of market risks. Negotiating favorable prices of raw materials,
matching raw material purchases with our short and long-term forecasts, and engaging in hedge activities with
derivative instruments are some strategies we use to manage these market risks. Our activity with derivative
instruments is used exclusively as a risk management tool.
Commodity Price Risk
We negotiate with our suppliers to obtain the most favorable prices for our raw materials. We also enter
into derivative financial instruments for those commodities that experience greater price volatility. We typically
enter into commodity option and swap contracts for our anticipated purchases of copper and lead. At December 31,
2015, our commodity derivative instruments had a notional amount of 39.2 million pounds and will settle over the
next 16 months. The fair values of these open commodity contracts resulted in an $11.6 million liability. Assuming a
hypothetical 10% increase in copper and lead commodity prices which are currently hedged at December 31, 2015,
our cost for those related purchases would result in a $4.6 million loss. Due to the increase in the related hedging
instruments’ fair values, the hypothetical cost would be mitigated by $2.9 million.
Interest Rate Risk
Our Term Loan B and ABL Revolver bear interest at variable rates using LIBOR and Alternate Base Rate
interest rates and are susceptible to interest rate fluctuations. We occasionally enter into interest rate swap
agreements to manage this risk. Approximately $575.0 million of our total outstanding debt at December 31, 2015
bears interest at variable rates. Assuming no changes in the monthly average variable-rate debt levels of
$598.5 million for the year ended December 31, 2015, we estimate that a hypothetical increase of 100 basis points in
the LIBOR and Alternate Base Rate interest rates would have increased interest expense by $0.3 million for the year
ended December 31, 2015.
57
8. FINANCIAL STATEMENTS AND SUPPLEMENTARY DATA
REPORT OF INDEPENDENT REGISTERED PUBLIC ACCOUNTING FIRM
Board of Directors
Remington Outdoor Company, Inc.
We have audited the accompanying consolidated balance sheets of Remington Outdoor Company, Inc. (a Delaware
corporation) and subsidiaries (collectively, the “Company”) as of December 31, 2015 and 2014, and the related
consolidated statements of operations, comprehensive income (loss), shareholders’ equity (deficit) and accumulated
other comprehensive income (loss) and cash flows for each of the three years in the period ended December 31,
2015. Our audits of the basic consolidated financial statements included the financial statement schedule listed in the
index appearing under Item 8. These financial statements and financial statement schedule are the responsibility of
the Company’s management. Our responsibility is to express an opinion on these financial statements and financial
statement schedule based on our audits.
We conducted our audits in accordance with the auditing standards of the Public Company Accounting Oversight
Board (United States) and in accordance with auditing standards generally accepted in the United States of America.
Those standards require that we plan and perform the audit to obtain reasonable assurance about whether the
financial statements are free of material misstatement. We were not engaged to perform an audit of the Company’s
internal control over financial reporting. Our audits included consideration of internal control over financial
reporting as a basis for designing audit procedures that are appropriate in the circumstances, but not for the purpose
of expressing an opinion on the effectiveness of the Company’s internal control over financial reporting.
Accordingly, we express no such opinion. An audit also includes examining, on a test basis, evidence supporting the
amounts and disclosures in the financial statements, assessing the accounting principles used and significant
estimates made by management, as well as evaluating the overall financial statement presentation. We believe that
our audits provide a reasonable basis for our opinion.
In our opinion, the consolidated financial statements referred to above present fairly, in all material respects, the
financial position of Remington Outdoor Company Inc. and subsidiaries as of December 31, 2015 and 2014, and the
results of their operations and their cash flows for each of the three years in the period ended December 31, 2015 in
conformity with accounting principles generally accepted in the United States of America. Also, in our opinion, the
related financial statement schedule, which considered in relation to the basic consolidated financial statements
taken as a whole, presents fairly, in all material respects, the information set forth therein.
/s/ GRANT THORNTON LLP
Charlotte, NC
March 30, 2016
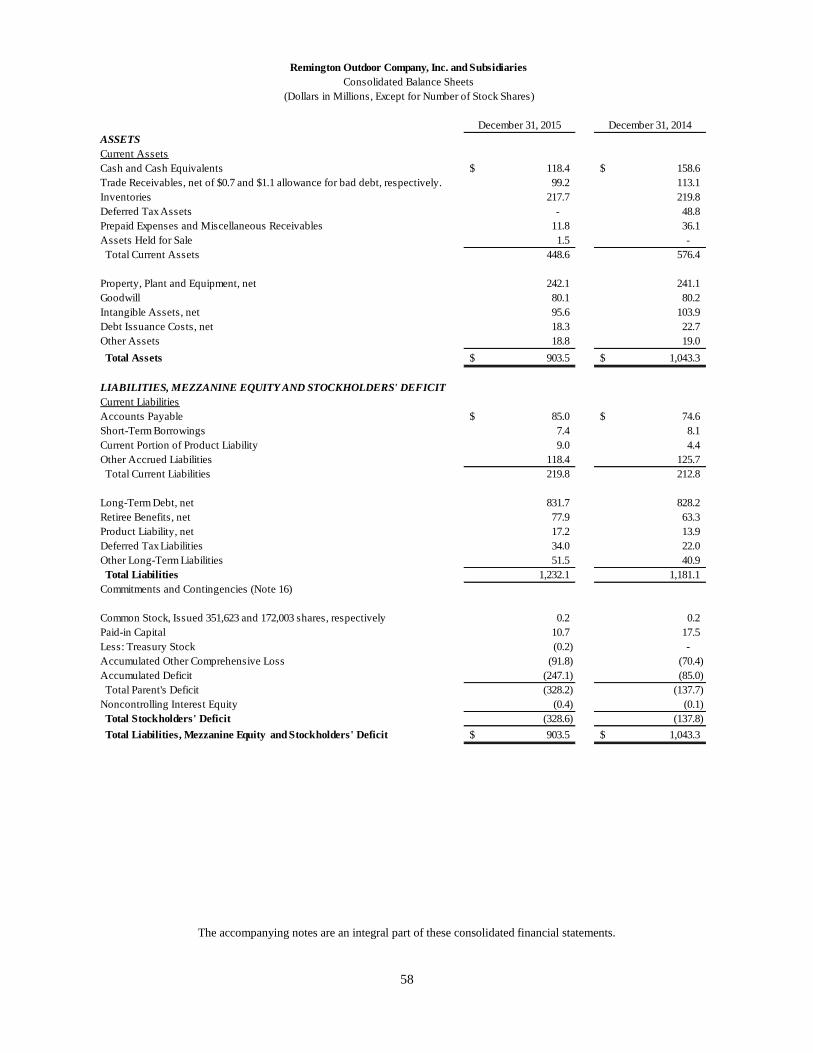
58
The accompanying notes are an integral part of these consolidated financial statements.
December 31, 2015 December 31, 2014
ASSETS
Current Assets
Cash and Cash Equivalents 118.4$ 158.6$
Trade Receivables, net of $0.7 and $1.1 allowance for bad debt, respectively. 99.2 113.1
Inventories 217.7 219.8
Deferred Tax Assets - 48.8
Prepaid Expenses and Miscellaneous Receivables 11.8 36.1
Assets Held for Sale 1.5 -
Total Current Assets 448.6 576.4
Property, Plant and Equipment, net 242.1 241.1
Goodwill 80.1 80.2
Intangible Assets, net 95.6 103.9
Debt Issuance Costs, net 18.3 22.7
Other Assets 18.8 19.0
Total Assets 903.5$ 1,043.3$
LIABILITIES, MEZZANINE EQUITY AND STOCKHOLDERS' DEFICIT
Current Liabilities
Accounts Payable 85.0$ 74.6$
Short-Term Borrowings 7.4 8.1
Current Portion of Product Liability 9.0 4.4
Other Accrued Liabilities 118.4 125.7
Total Current Liabilities 219.8 212.8
Long-Term Debt, net 831.7 828.2
Retiree Benefits, net 77.9 63.3
Product Liability, net 17.2 13.9
Deferred Tax Liabilities 34.0 22.0
Other Long-Term Liabilities 51.5 40.9
Total Liabilities 1,232.1 1,181.1
Commitments and Contingencies (Note 16)
0.2 0.2
10.7 17.5
(0.2) -
Accumulated Other Comprehensive Loss (91.8) (70.4)
Accumulated Deficit (247.1) (85.0)
Total Parent's Deficit (328.2) (137.7)
Noncontrolling Interest Equity (0.4) (0.1)
Total Stockholders' Deficit (328.6) (137.8)
Total Liabilities, Mezzanine Equity and Stockholders' Deficit 903.5$ 1,043.3$
Common Stock, Issued 351,623 and 172,003 shares, respectively
Less: Treasury Stock
Remington Outdoor Company, Inc. and Subsidiaries
Consolidated Balance Sheets
(Dollars in Millions, Except for Number of Stock Shares)
Paid-in Capital
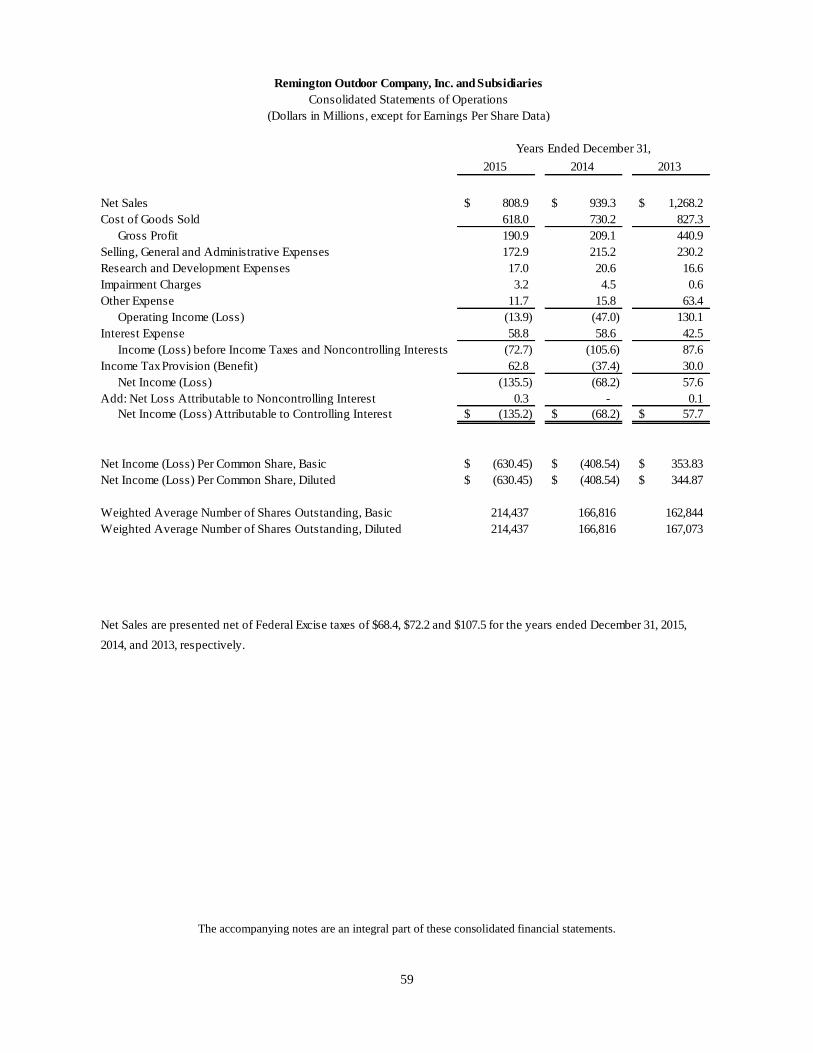
59
The accompanying notes are an integral part of these consolidated financial statements.
2015 2014 2013
Net Sales 808.9$ 939.3$ 1,268.2$
Cost of Goods Sold 618.0 730.2 827.3
Gross Profit 190.9 209.1 440.9
Selling, General and Administrative Expenses 172.9 215.2 230.2
Research and Development Expenses 17.0 20.6 16.6
Impairment Charges 3.2 4.5 0.6
Other Expense 11.7 15.8 63.4
Operating Income (Loss) (13.9) (47.0) 130.1
Interest Expense 58.8 58.6 42.5
Income (Loss) before Income Taxes and Noncontrolling Interests (72.7) (105.6) 87.6
Income Tax Provision (Benefit) 62.8 (37.4) 30.0
Net Income (Loss) (135.5) (68.2) 57.6
Add: Net Loss Attributable to Noncontrolling Interest 0.3 - 0.1
Net Income (Loss) Attributable to Controlling Interest (135.2)$ (68.2)$ 57.7$
Net Income (Loss) Per Common Share, Basic (630.45)$ (408.54)$ 353.83$
Net Income (Loss) Per Common Share, Diluted (630.45)$ (408.54)$ 344.87$
Weighted Average Number of Shares Outstanding, Basic 214,437 166,816 162,844
Weighted Average Number of Shares Outstanding, Diluted 214,437 166,816 167,073
Net Sales are presented net of Federal Excise taxes of $68.4, $72.2 and $107.5 for the years ended December 31, 2015,
2014, and 2013, respectively.
Remington Outdoor Company, Inc. and Subsidiaries
(Dollars in Millions, except for Earnings Per Share Data)
Years Ended December 31,
Consolidated Statements of Operations
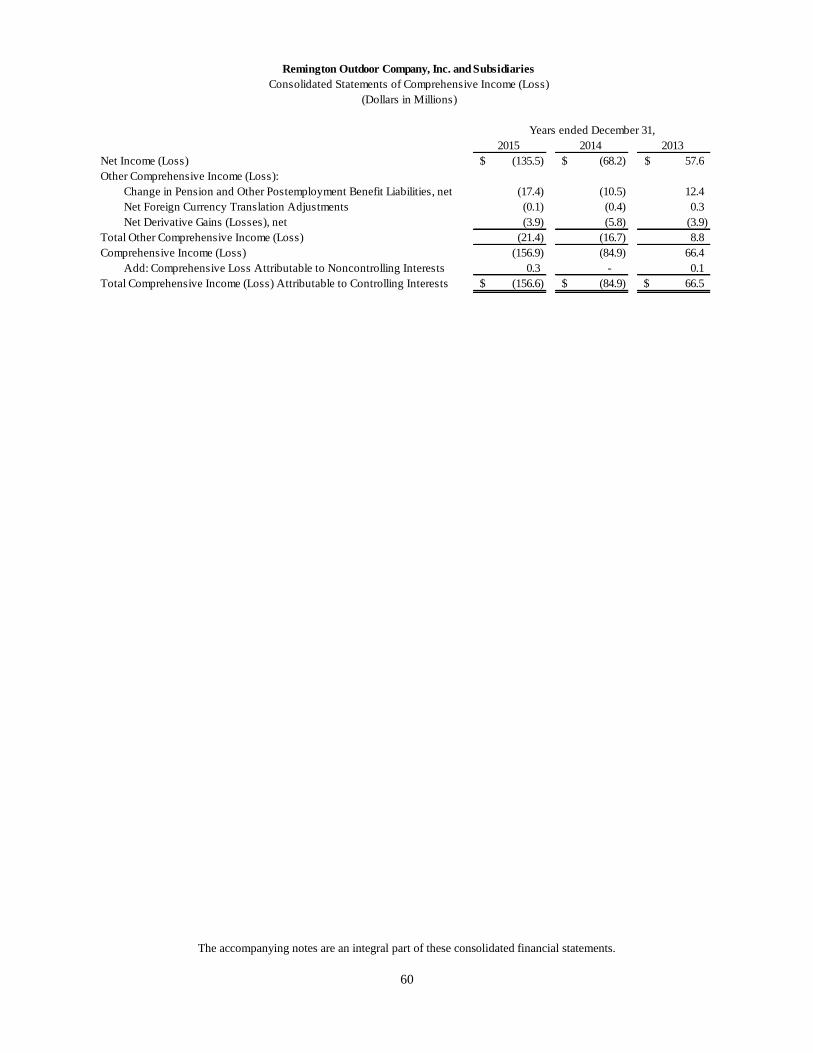
60
The accompanying notes are an integral part of these consolidated financial statements.
2015 2014 2013
Net Income (Loss) (135.5)$ (68.2)$ 57.6$
Other Comprehensive Income (Loss):
Change in Pension and Other Postemployment Benefit Liabilities, net (17.4) (10.5) 12.4
Net Foreign Currency Translation Adjustments (0.1) (0.4) 0.3
Net Derivative Gains (Losses), net (3.9) (5.8) (3.9)
Total Other Comprehensive Income (Loss) (21.4) (16.7) 8.8
Comprehensive Income (Loss) (156.9) (84.9) 66.4
Add: Comprehensive Loss Attributable to Noncontrolling Interests 0.3 - 0.1
Total Comprehensive Income (Loss) Attributable to Controlling Interests (156.6)$ (84.9)$ 66.5$
Years ended December 31,
Remington Outdoor Company, Inc. and Subsidiaries
Consolidated Statements of Comprehensive Income (Loss)
(Dollars in Millions)
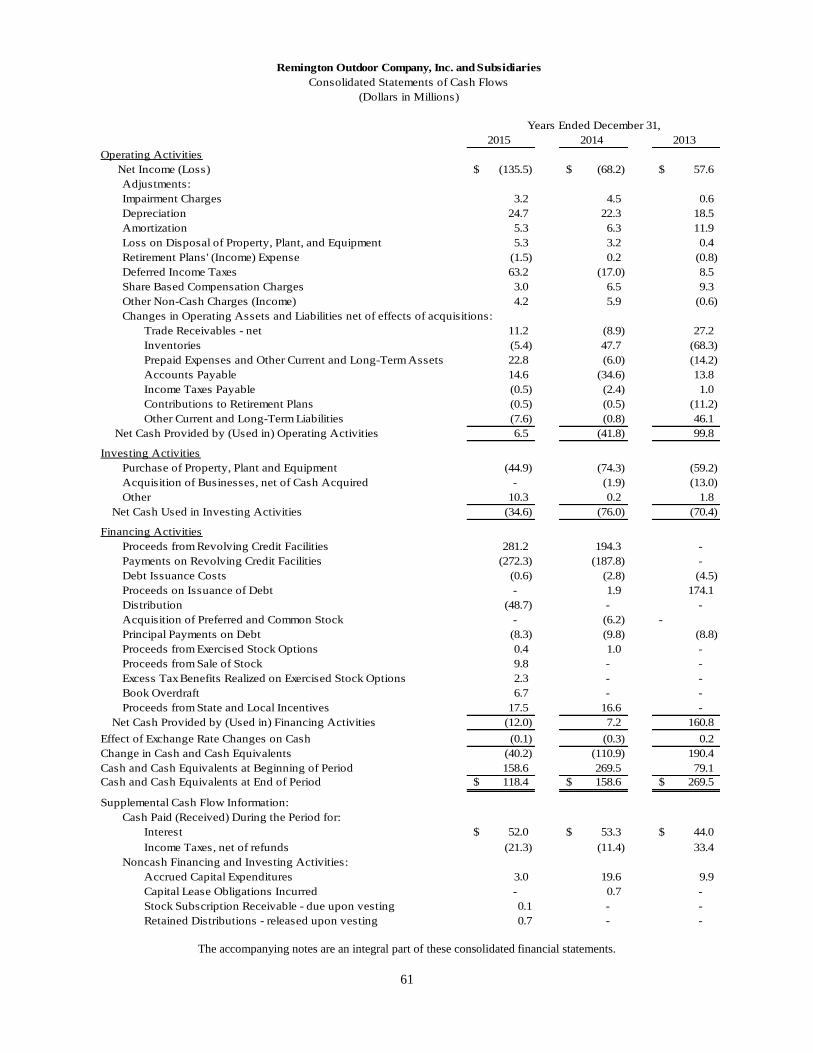
61
The accompanying notes are an integral part of these consolidated financial statements.
2015 2014 2013
Operating Activities
Net Income (Loss) (135.5)$ (68.2)$ 57.6$
Adjustments:
Impairment Charges 3.2 4.5 0.6
Depreciation 24.7 22.3 18.5
Amortization 5.3 6.3 11.9
Loss on Disposal of Property, Plant, and Equipment 5.3 3.2 0.4
Retirement Plans' (Income) Expense (1.5) 0.2 (0.8)
Deferred Income Taxes 63.2 (17.0) 8.5
Share Based Compensation Charges 3.0 6.5 9.3
Other Non-Cash Charges (Income) 4.2 5.9 (0.6)
Changes in Operating Assets and Liabilities net of effects of acquisitions:
Trade Receivables - net 11.2 (8.9) 27.2
Inventories (5.4) 47.7 (68.3)
Prepaid Expenses and Other Current and Long-Term Assets 22.8 (6.0) (14.2)
Accounts Payable 14.6 (34.6) 13.8
Income Taxes Payable (0.5) (2.4) 1.0
Contributions to Retirement Plans (0.5) (0.5) (11.2)
Other Current and Long-Term Liabilities (7.6) (0.8) 46.1
Net Cash Provided by (Used in) Operating Activities 6.5 (41.8) 99.8
Investing Activities
Purchase of Property, Plant and Equipment (44.9) (74.3) (59.2)
Acquisition of Businesses, net of Cash Acquired - (1.9) (13.0)
Other 10.3 0.2 1.8
Net Cash Used in Investing Activities (34.6) (76.0) (70.4)
Financing Activities
Proceeds from Revolving Credit Facilities 281.2 194.3 -
Payments on Revolving Credit Facilities (272.3) (187.8) -
Debt Issuance Costs (0.6) (2.8) (4.5)
Proceeds on Issuance of Debt - 1.9 174.1
Distribution (48.7) - -
Acquisition of Preferred and Common Stock - (6.2) -
Principal Payments on Debt (8.3) (9.8) (8.8)
Proceeds from Exercised Stock Options 0.4 1.0 -
Proceeds from Sale of Stock 9.8 - -
Excess Tax Benefits Realized on Exercised Stock Options 2.3 - -
Book Overdraft 6.7 - -
Proceeds from State and Local Incentives 17.5 16.6 -
Net Cash Provided by (Used in) Financing Activities (12.0) 7.2 160.8
Effect of Exchange Rate Changes on Cash (0.1) (0.3) 0.2
Change in Cash and Cash Equivalents (40.2) (110.9) 190.4
Cash and Cash Equivalents at Beginning of Period 158.6 269.5 79.1
Cash and Cash Equivalents at End of Period 118.4$ 158.6$ 269.5$
Supplemental Cash Flow Information:
Cash Paid (Received) During the Period for:
Interest 52.0$ 53.3$ 44.0$
Income Taxes, net of refunds (21.3) (11.4) 33.4
Noncash Financing and Investing Activities:
Accrued Capital Expenditures 3.0 19.6 9.9
Capital Lease Obligations Incurred - 0.7 -
Stock Subscription Receivable - due upon vesting 0.1 - -
Retained Distributions - released upon vesting 0.7 - -
Years Ended December 31,
Remington Outdoor Company, Inc. and Subsidiaries
Consolidated Statements of Cash Flows
(Dollars in Millions)
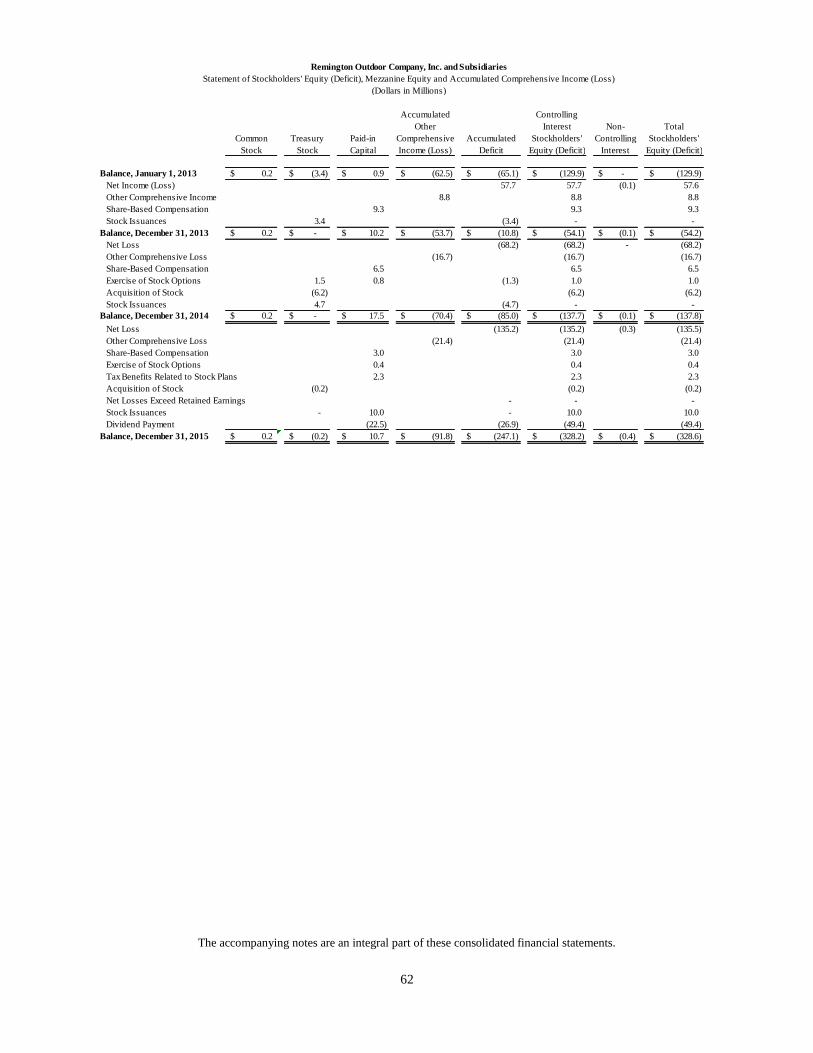
62
The accompanying notes are an integral part of these consolidated financial statements.
Accumulated Controlling
Other Interest Non- Total
Common Treasury Paid-in Comprehensive Accumulated Stockholders' Controlling Stockholders'
Stock Stock Capital Income (Loss) Deficit Equity (Deficit) Interest Equity (Deficit)
Balance, January 1, 2013 0.2$ (3.4)$ 0.9$ (62.5)$ (65.1)$ (129.9)$ -$ (129.9)$
Net Income (Loss) 57.7 57.7 (0.1) 57.6
Other Comprehensive Income 8.8 8.8 8.8
Share-Based Compensation 9.3 9.3 9.3
Stock Issuances 3.4 (3.4) - -
Balance, December 31, 2013 0.2$ -$ 10.2$ (53.7)$ (10.8)$ (54.1)$ (0.1)$ (54.2)$
Net Loss (68.2) (68.2) - (68.2)
Other Comprehensive Loss (16.7) (16.7) (16.7)
Share-Based Compensation 6.5 6.5 6.5
Exercise of Stock Options 1.5 0.8 (1.3) 1.0 1.0
Acquisition of Stock (6.2) (6.2) (6.2)
Stock Issuances 4.7 (4.7) - -
Balance, December 31, 2014 0.2$ -$ 17.5$ (70.4)$ (85.0)$ (137.7)$ (0.1)$ (137.8)$
Net Loss (135.2) (135.2) (0.3) (135.5)
Other Comprehensive Loss (21.4) (21.4) (21.4)
Share-Based Compensation 3.0 3.0 3.0
Exercise of Stock Options 0.4 0.4 0.4
Tax Benefits Related to Stock Plans 2.3 2.3 2.3
Acquisition of Stock (0.2) (0.2) (0.2)
Net Losses Exceed Retained Earnings - - -
Stock Issuances - 10.0 - 10.0 10.0
Dividend Payment (22.5) (26.9) (49.4) (49.4)
Balance, December 31, 2015 0.2$ (0.2)$ 10.7$ (91.8)$ (247.1)$ (328.2)$ (0.4)$ (328.6)$
Remington Outdoor Company, Inc. and Subsidiaries
Statement of Stockholders' Equity (Deficit), Mezzanine Equity and Accumulated Comprehensive Income (Loss)
(Dollars in Millions)
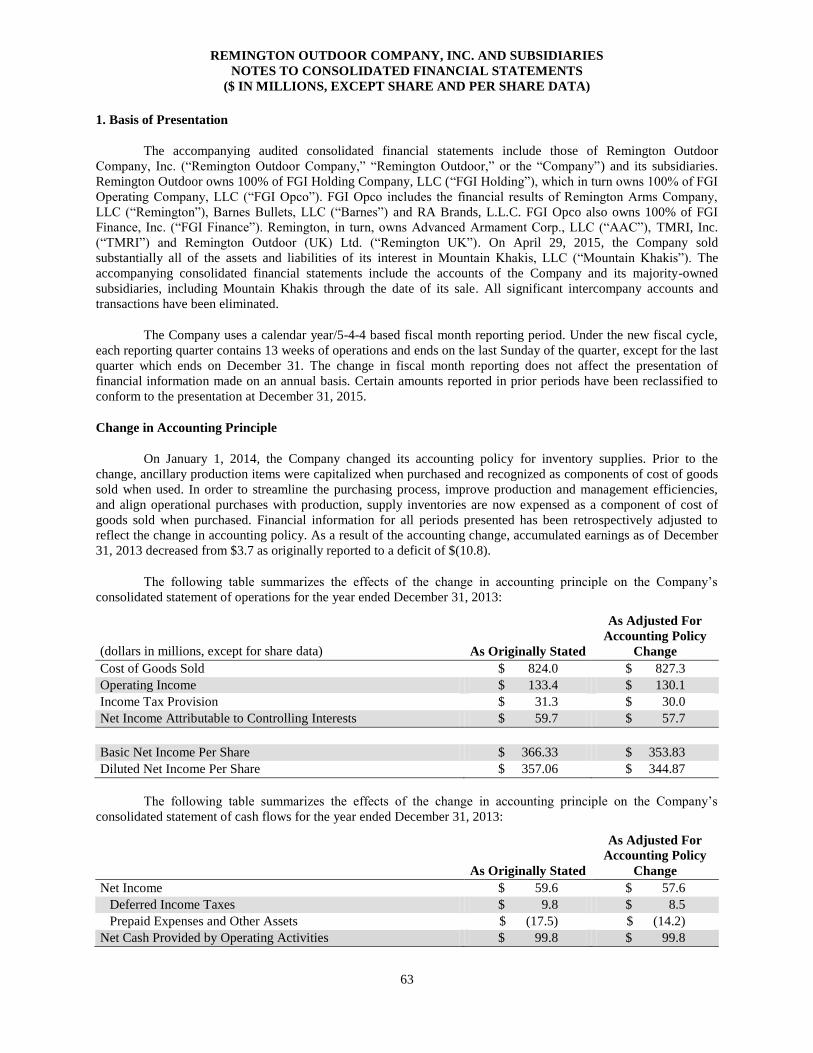
REMINGTON OUTDOOR COMPANY, INC. AND SUBSIDIARIES NOTES TO CONSOLIDATED FINANCIAL STATEMENTS
($ IN MILLIONS, EXCEPT SHARE AND PER SHARE DATA)
63
1. Basis of Presentation
The accompanying audited consolidated financial statements include those of Remington Outdoor
Company, Inc. (“Remington Outdoor Company,” “Remington Outdoor,” or the “Company”) and its subsidiaries.
Remington Outdoor owns 100% of FGI Holding Company, LLC (“FGI Holding”), which in turn owns 100% of FGI
Operating Company, LLC (“FGI Opco”). FGI Opco includes the financial results of Remington Arms Company,
LLC (“Remington”), Barnes Bullets, LLC (“Barnes”) and RA Brands, L.L.C. FGI Opco also owns 100% of FGI
Finance, Inc. (“FGI Finance”). Remington, in turn, owns Advanced Armament Corp., LLC (“AAC”), TMRI, Inc.
(“TMRI”) and Remington Outdoor (UK) Ltd. (“Remington UK”). On April 29, 2015, the Company sold
substantially all of the assets and liabilities of its interest in Mountain Khakis, LLC (“Mountain Khakis”). The
accompanying consolidated financial statements include the accounts of the Company and its majority-owned
subsidiaries, including Mountain Khakis through the date of its sale. All significant intercompany accounts and
transactions have been eliminated.
The Company uses a calendar year/5-4-4 based fiscal month reporting period. Under the new fiscal cycle,
each reporting quarter contains 13 weeks of operations and ends on the last Sunday of the quarter, except for the last
quarter which ends on December 31. The change in fiscal month reporting does not affect the presentation of
financial information made on an annual basis. Certain amounts reported in prior periods have been reclassified to
conform to the presentation at December 31, 2015.
Change in Accounting Principle
On January 1, 2014, the Company changed its accounting policy for inventory supplies. Prior to the
change, ancillary production items were capitalized when purchased and recognized as components of cost of goods
sold when used. In order to streamline the purchasing process, improve production and management efficiencies,
and align operational purchases with production, supply inventories are now expensed as a component of cost of
goods sold when purchased. Financial information for all periods presented has been retrospectively adjusted to
reflect the change in accounting policy. As a result of the accounting change, accumulated earnings as of December
31, 2013 decreased from $3.7 as originally reported to a deficit of $(10.8).
The following table summarizes the effects of the change in accounting principle on the Company’s
consolidated statement of operations for the year ended December 31, 2013:
(dollars in millions, except for share data) As Originally Stated
As Adjusted For
Accounting Policy
Change
Cost of Goods Sold $ 824.0 $ 827.3
Operating Income $ 133.4 $ 130.1
Income Tax Provision $ 31.3 $ 30.0
Net Income Attributable to Controlling Interests $ 59.7 $ 57.7
Basic Net Income Per Share $ 366.33 $ 353.83
Diluted Net Income Per Share $ 357.06 $ 344.87
The following table summarizes the effects of the change in accounting principle on the Company’s
consolidated statement of cash flows for the year ended December 31, 2013:
As Originally Stated
As Adjusted For
Accounting Policy
Change
Net Income $ 59.6 $ 57.6
Deferred Income Taxes $ 9.8 $ 8.5
Prepaid Expenses and Other Assets $ (17.5) $ (14.2)
Net Cash Provided by Operating Activities $ 99.8 $ 99.8

REMINGTON OUTDOOR COMPANY, INC. AND SUBSIDIARIES NOTES TO CONSOLIDATED FINANCIAL STATEMENTS
($ IN MILLIONS, EXCEPT SHARE AND PER SHARE DATA)
64
2. Significant Accounting Policies
Cash and Cash Equivalents
Cash and cash equivalents include demand deposits with banks and highly liquid investments with
remaining maturities, when purchased, of three months or less and treasury reserve funds.
Accounts Receivable
Accounts receivable are recognized at their net realized value. The Company reviews the credit history and
financial condition of its customer, prior to the extension of credit. An allowance for doubtful accounts is
established based upon factors surrounding the credit risk of specific customers, historical trends and other
information. Allowances for doubtful accounts were $0.6 and $1.1 at December 31, 2015 and 2014, respectively.
Inventories
The Company’s inventories are stated at the lower of cost or market and are determined by the first-in,
first-out (“FIFO”) method. Inventory costs associated with Semi-Finished Products and Finished Products include
material, labor, and overhead, while costs associated with Raw Materials include material and inbound freight costs.
The Company periodically writes inventory amounts down to market for any excess and obsolete inventories and
periodically writes inventory amounts down to market when costs exceed market value.
Service and Warranty
The Company supports service and repairs for all of its firearm products, with the exception of its
internationally sourced product lines that are serviced and repaired by the Company’s third party vendor, in order to
meet the service needs of its distributors, customers and consumers worldwide.
The Company provides consumer warranties against manufacturing defects in all firearm products
manufactured in the United States. Estimated future warranty costs are accrued at the time of sale, using the
percentage of actual historical repairs to shipments for the same period, and are included in other accrued liabilities.
Product modifications or corrections are voluntary steps taken by the Company to assure proper usage or
performance of a product by consumers. The cost associated with product modifications and/or corrections is
recognized in accordance with the Financial Accounting Standards Board (“FASB”) Accounting Standards
Codification (“ASC”) 450 “Contingencies” and charged to operations. Refer to note 7.
Property, Plant and Equipment
Property, plant and equipment are stated at cost less accumulated depreciation, with the exception of
acquisitions in which the acquired property, plant and equipment is stated at fair value as of the acquisition date less
accumulated depreciation. Depreciation is determined on a straight-line basis over the estimated lives of the assets.
The estimated useful lives range from 1 to 43 years for buildings and improvements, and range from 1 to 15 years
for machinery and equipment. Depreciation expense is included in the Company’s Cost of Goods Sold, Research
and Development expense, and Selling, General, and Administrative expense. Amortization of assets under capital
leases are combined with depreciation expense and classification of depreciation expense is based on the nature and
activity of the assets.
Maintenance and repairs are charged to operations, and replacements and betterments are capitalized.
Computer hardware and software costs under capital leases are amortized over the shorter of the useful lives or the
term of the lease. The cost and related accumulated depreciation applicable to assets sold or retired are removed
from the accounts and the gain or loss on disposition is recognized in operations, included in the other income, net
line item on the consolidated statement of operations. Refer to note 5 for property, plant, and equipment.
In accordance with FASB ASC 360 “Property, Plant, and Equipment”, the Company periodically reviews
long-lived assets for impairment whenever events or changes in business circumstances indicate that the carrying
REMINGTON OUTDOOR COMPANY, INC. AND SUBSIDIARIES NOTES TO CONSOLIDATED FINANCIAL STATEMENTS
($ IN MILLIONS, EXCEPT SHARE AND PER SHARE DATA)
65
amount of the assets may not be fully recoverable or that the useful lives of those assets are no longer appropriate.
Significant judgments and estimates are involved in determining the useful lives of long-lived assets, determining
what reporting units exist, and assessing when events or circumstances would require an interim impairment
analysis of tangible, long-lived assets to be performed. Changes in the organization or management reporting
structure, as well as other events and circumstances, including technological advances, increased competition, and
changing economic or market conditions, could result in (a) shorter estimated useful lives, (b) additional reporting
units, which may require alternative methods of estimating fair values or greater disaggregation or aggregation in
our analysis by reporting unit, and/or (c) other changes in previous assumptions or estimates. In turn, this could have
an additional impact on the Company’s consolidated financial statements through accelerated depreciation and/or
impairment charges. Each impairment test is based on a comparison of the undiscounted cash flows to the recorded
carrying value for the asset. If impairment is indicated, the asset is written down to its estimated fair value based on
a discounted cash flow analysis.
During the year ended December 31, 2015, the Company incurred $2.1 of impairment charges for idle
assets that were held for sale. No impairment charges were incurred in the year ended December 31, 2014, related to
property, plant and equipment. During the year ended December 31, 2013, the Company incurred $0.6 of
impairment charges for idle assets that were held for sale. Refer to note 14 regarding assets held for sale and long-
lived asset impairments.
Goodwill, Goodwill Impairment and Intangible Assets
The values of goodwill and intangible assets resulting from acquisitions were initially determined by and
were the responsibility of management who considered in part the work performed by an independent third party
valuation firm. Management assesses goodwill and definite lived identifiable intangible assets for impairment
whenever facts and circumstances indicate that the carrying amount may not be fully recoverable. Factors the
Company considers important, which could trigger an impairment of such assets, include the following:
• significant underperformance relative to historical or projected future operating results;
• significant changes in the manner of or use of the acquired assets or the strategy for our overall
business; and
• significant negative industry or economic trends.
Future adverse changes in these or other unforeseeable factors could result in an impairment charge that
would materially impact future results of operations and financial position in the reporting period identified.
Each year, the Company tests for impairment of goodwill. The Company adopted the provisions of new
accounting guidance which allows it to qualitatively analyze any of its reporting units to determine whether further
goodwill impairment testing is necessary. For goodwill reporting units that indicate the need for quantitative testing,
the Company uses a two step approach. In the first step, the Company estimates the fair values of its reporting units
using a combination of the present value of future cash flows approach and the market approach, subject to a
comparison for reasonableness to its market capitalization at the date of valuation. If the carrying amount exceeds
the fair value, the second step of the goodwill impairment test is performed to measure the amount of the
impairment loss, if any. In the second step the implied fair value of the goodwill is estimated as the fair value of the
reporting unit used in the first step less the fair values of all other net tangible and intangible assets of the reporting
unit. If the carrying amount of the goodwill exceeds its implied fair market value, an impairment loss is recognized
in an amount equal to that excess, not to exceed the carrying amount of the goodwill.
In addition, goodwill of a reporting unit is tested for impairment between annual tests if an event occurs or
circumstances change that would more likely than not reduce the fair value of a reporting unit below its carrying
value. For other intangible assets, the impairment test consists of a comparison of the fair value of the intangible
assets to their respective carrying amount. The Company uses a discount rate equal to its average cost of funds to
discount the expected future cash flows.
REMINGTON OUTDOOR COMPANY, INC. AND SUBSIDIARIES NOTES TO CONSOLIDATED FINANCIAL STATEMENTS
($ IN MILLIONS, EXCEPT SHARE AND PER SHARE DATA)
66
During the year ended December 31, 2015, the Company recognized $1.1 of impairment charges related to
other intangible assets. During the year ended December 31, 2014, the Company recognized $4.5 of impairment
charges related to goodwill and other intangible assets. No impairment charges related to goodwill and other
intangible assets were recognized in 2013.
Derivative Instruments
The Company frequently uses derivative instruments to mitigate potentially adverse effects from market
risks associated with commodity prices and interest rates. All derivative instruments are carried on the Company’s
consolidated balance sheet at their fair values. Typically, changes in the fair values of derivatives designated as cash
flow hedges are recorded in accumulated other comprehensive income until the hedged item affects earnings at
which time those changes in fair value will be reclassified into earnings. Changes in the fair value of derivative
instruments not designated or qualifying as hedging instruments are reflected in the Company’s consolidated
statement of operations. Refer to note 17.
Product Liability
The Company provides for estimated defense and settlement costs related to product liabilities when it
becomes probable that a liability has been incurred and reasonable estimates of such costs are available in
accordance with FASB ASC 450 “Contingencies.” The Company maintains insurance coverage for product liability
claims, subject to certain policy limits and to certain self-insured retentions for personal injury or property damage.
The current product liability insurance policy expires on December 1, 2016. Product liabilities are recorded at the
Company’s best estimate of the most probable exposure in accordance with FASB ASC 450, including
consideration of historical payment experience and the self-insured retention limits. The Company did not receive
any recoveries from its product liability insurance for the years ended December 31, 2015 and 2014. The Company’s
estimate of its discounted liability for product liability cases and claims outstanding at December 31, 2015 and 2014
was $26.2 and $18.3, respectively. Associated with product liability cases, the Company has also recorded a
receivable in Other Assets of $1.9 and $1.5, respectively, at December 31, 2015 and 2014 for the estimated
liabilities expected to be recovered through insurance coverage. The Company disbursed $2.3, $1.4, and $3.7 during
the years ended December 31, 2015, 2014, and 2013, respectively, for defense and settlement costs.
At December 31, 2015, the accrued product liability was determined by discounting the present value of
estimated future payments using a 4.75% discount rate. The aggregate undiscounted product liability, net of
estimated recoveries from insurance, at December 31, 2015 was $29.7.
Expected payments for each of the five succeeding years and the aggregate amount thereafter are:
Year Amount
2016 $ 8.9
2017 8.2
2018 6.0
2019 3.2
2020 1.6
Thereafter 1.8
Total $ 29.7
Workers’ Compensation
The Company’s estimate of its discounted liability for workers’ compensation claims outstanding at
December 31, 2015 and 2014 was $18.6 and $17.9, respectively. Associated with workers compensation claims, the
Company has also recorded a receivable in Other Assets of $10.5 and $9.1, respectively, at December 31, 2015 and
2014 for the estimated liabilities expected to be recovered through insurance coverage.
As of December 31, 2014, the accrued workers’ compensation liability was determined by discounting the
present value of estimated future payments using a 4.75% discount rate. The aggregate undiscounted workers’
compensation liability, net of estimated recoveries from insurance, at December 31, 2015 was $9.8.
REMINGTON OUTDOOR COMPANY, INC. AND SUBSIDIARIES NOTES TO CONSOLIDATED FINANCIAL STATEMENTS
($ IN MILLIONS, EXCEPT SHARE AND PER SHARE DATA)
67
Expected payments for each of the five succeeding years and the aggregate amount thereafter are:
Year Amount
2016 $ 1.8
2017 1.6
2018 1.3
2019 1.0
2020 0.9
Thereafter 3.2
Total $ 9.8
Revenue Recognition
The Company recognizes revenue from product sales when the sale has been both realized and earned. The
Company believes that a sale is realized and earned when it meets the following criteria: persuasive evidence that
the terms and nature of a transaction are agreed-upon with the Company’s customers, the time at which title and the
risks and rewards of product ownership are transferred to the customer, prices and terms are fixed or readily
determinable, and when collectability is reasonably assured. Most of the Company’s revenues are recognized once
shipment is made to the customer. However, some revenues on certain contracts are not recognized until the
customer receives the shipment and related conditions, if any, are satisfied. Occasionally, the Company will offer
discounts or rebates that can be reasonably estimated at the time of the program based on historical information and
information included within the programs. Reductions in revenues are recognized during the period in which the
revenues related to the discount and rebate programs are recognized.
The Company’s transaction terms allow its customers the right of return. Gross margins on the Company’s
consolidated statement of operations are reduced by an estimate of future sales returns. The estimate provision for
future sales returns is derived by analyzing historical returned products and the timing of returns based on their
original sale.
Sales on the Company’s consolidated statement of operations are presented net of Federal Excise Taxes,
which were $68.4, $72.2 and $107.5 for the years ended December 31, 2015, 2014, and 2013, respectively.
Cost of Goods Sold
Cost of Goods Sold includes material, labor, and overhead costs associated with product manufacturing,
including depreciation, purchasing and receiving, inspection, warehousing, and internal transfer costs, except for
transfer costs from our plants to our distribution center which are included in Selling, General and Administrative
Expense.
Selling, General, and Administrative Expense
Selling, General and Administrative expense includes, among other items, administrative salaries and
benefits, commissions, outbound shipping, advertising, product liability, insurance, and professional fees.
Shipping and Handling Costs
Outbound shipping costs to customers are expensed as incurred and included in Selling, General, and
Administrative expense. Outbound shipping costs include costs of shipping products from our plants to our
distribution center and costs of shipping products from our distribution center or from our manufacturing facilities to
customers. Also included in outbound shipping expense are costs of the warehouse such as contract laborers in the
warehouse, rent, and equipment charges for the warehouse. Outbound shipping costs totaled $16.5, $21.2, and $23.3
for the years ended December 31, 2015, 2014, and 2013, respectively.
REMINGTON OUTDOOR COMPANY, INC. AND SUBSIDIARIES NOTES TO CONSOLIDATED FINANCIAL STATEMENTS
($ IN MILLIONS, EXCEPT SHARE AND PER SHARE DATA)
68
Advertising and Promotions
Advertising and promotional costs including print ads, commercials, catalogs, brochures and cooperative
advertising are expensed the first time the advertising occurs. The Company’s co-op program is structured so that
certain dealers and chain accounts are eligible for reimbursement of certain types of advertisements on qualifying
product purchases. The Company does not pay slotting fees, offer buydown programs, or make other payments to
resellers. Advertising and promotional costs totaled $22.4, $27.6 and $27.1 for the years ended December 31, 2015,
2014, and 2013, respectively, and is included within Selling, General and Administrative Expense
Self-Insurance
The majority of Remington Outdoor is self-insured for elements of its employee benefit plans including;
among others, medical, workers’ compensation and elements of its property and liability insurance programs, but
limits its liability through stop-loss insurance and annual plan maximum coverage limits. Self-insurance liabilities
are based on filed claims and estimated claims incurred but not yet reported.
Stock-Based Compensation Options and Restricted Stock/Restricted Units
Stock-based compensation awards, which are associated with the Company’s common stock, have been
considered equity awards under FASB ASC 718 “Stock Compensation.” FASB ASC 718 requires the Company to
measure the cost of all employee stock-based compensation awards that are expected to be exercised based on the
grant-date fair value of those awards and to record that cost as compensation expense over the period during which
the employee is required to perform service in exchange for the award (generally over the vesting period of the
award). Exercised stock-based compensation awards are exchanged for shares held in the Company’s treasury if
available prior to issuing new shares.
The Company accounts for restricted common unit/share awards in accordance FASB ASC 718. The fair
value of the restricted common unit/share awards at their grant date, which was determined using a total enterprise
valuation, is recognized as compensation expense over the vesting period for the awards.
Translation and Foreign Currency Transactions
The Company operates using the U.S. dollar as its functional currency. Assets and liabilities of foreign
subsidiaries that use the local currency as their functional currency are translated into U.S. Dollars prior to their
consolidation using the foreign currency exchange rate at the balance sheet date. Changes in the carrying values of
these assets and liabilities attributable to fluctuations in the corresponding foreign currency exchange rates are
recognized in the foreign currency translation component of accumulated other comprehensive income. Refer to
note 20.
The Company conducts the majority of its business transactions in U.S. dollars, but occasionally enters into
transactions that are denominated in foreign currencies. Transactions that are denominated in a currency other than
the U.S. Dollar are subject to changes in exchange rates with the resulting gains and losses recorded within net
income. There were no significant gains or losses recognized from transactions denominated in foreign currencies
during the years ended December 31, 2015, 2014, and 2013.
Research and Development Costs
Internal research and development costs including salaries and benefits, administrative expenses, building
operating costs and depreciation of our research and development facilities and equipment, and related project
expenses are expensed as incurred. Research and development costs totaled $17.0, $20.6 and $16.6 for the years
ended December 31, 2015, 2014, and 2013, respectively.
REMINGTON OUTDOOR COMPANY, INC. AND SUBSIDIARIES NOTES TO CONSOLIDATED FINANCIAL STATEMENTS
($ IN MILLIONS, EXCEPT SHARE AND PER SHARE DATA)
69
Licensing Income
The Company licenses certain of its brands and trademarks. The income from such licensing was $1.8,
$1.8, and $1.3 for the years ended December 31, 2015, 2014, and 2013, respectively, which is reflected in Other
Expense.
Interest Expense
The Company includes the amortization of debt issuance costs and debt discounts and premiums as interest
expense on its consolidated statement of operations.
Estimated amortization of debt issuance costs and debt discounts that will be included interest expense over
the five calendar years and beyond are as follows:
Year Amount
2016 $ 5.4
2017 5.7
2018 6.0
2019 3.2
2020 0.5
Thereafter -
Total $ 20.8
Debt Issuance Costs
Debt issuance costs are reported as noncurrent deferred charges on the consolidated balance sheet and
amortized over the life of the related debt agreements or amendments. Debt issuance costs related to the 2020 Notes
and Term Loan B are amortized using the effective interest method while costs related to the ABL Revolver are
amortized on a straight-line basis. Amortization of deferred financing costs was $4.4, $4.1 and $3.1 during the years
ending December 31, 2015, 2014, and 2013, respectively.
During the year ended December 31, 2014, the Company increased the borrowing capacity and extended
the term of its ABL Revolver through June 2019. Fees to third parties that were directly related to the ABL
Revolver’s modification were capitalized totaling $1.8. The remaining amount of previously capitalized debt
issuance costs related to the ABL Revolver along with the recently capitalized fees will be amortized on a straight-
line basis over the next five years.
Debt Discounts and Premiums
Debt discounts and premiums are reported as a direct reduction from, or addition to, the face amount of the
debt instrument on the Company’s consolidated balance sheet and are amortized over the life of the related debt
agreement using the effective interest method. Amortization of debt discounts and premiums was $0.7, $0.6 and
$0.5 during the years ending December 31, 2015, 2014, and 2013, respectively.
Start-Up Costs
The Company considers start-up costs as those one-time costs related to opening a new facility, introducing
a new product of service, conducting business in a new territory or conducting business with a new class of
customers. These costs include core and support team expenses, consulting, legal expense and the write-off of
inefficiency variances directly related to a new facility prior to it becoming fully operational. Refer to note 19.
Restructuring Costs
The Company considers restructuring costs as those one-time costs related to severance, retention, and
relocation; equipment transfer, site preparation and carrying costs; contract terminations; and other non-cash costs
REMINGTON OUTDOOR COMPANY, INC. AND SUBSIDIARIES NOTES TO CONSOLIDATED FINANCIAL STATEMENTS
($ IN MILLIONS, EXCEPT SHARE AND PER SHARE DATA)
70
such as the write-off of inventory and inefficiency variances related to the consolidation of facilities. Refer to note
19.
Income Taxes
The Company files its income taxes in a consolidated tax return, which includes all domestic corporations
eligible for consolidation, as well as separate and combined income tax returns in numerous states. Current and
deferred tax expense is allocated to the members based on an adjusted separate return methodology.
The Company recorded a valuation allowance in the fourth quarter of 2015. In assessing the need for a
valuation allowance, the Company considers both positive and negative evidence related to the likelihood of
realization of the deferred tax assets. If, based on the weight of available evidence, it is more likely than not that the
deferred tax assets will not be realized, the Company records a valuation allowance. The weight given to the positive
and negative evidence is commensurate with the extent to which the evidence may be objectively verified. As such,
it is generally difficult for positive evidence regarding projected future taxable income exclusive of reversing taxable
temporary differences to outweigh objective negative evidence of recent financial reporting losses.
Refer to notes 12 of “8. — Financial Statements and Supplementary Data” for additional discussion of
income taxes and the valuation allowance.
Use of Estimates
The preparation of financial statements in conformity with Generally Accepted Accounting Principles
(“GAAP”) requires management to make estimates and assumptions that affect the reported amounts of assets and
liabilities and disclosure of contingent assets and liabilities at the date of the financial statements and the reported
amounts of income and expenses during the reported period. The Company is subject to management’s estimates
and assumptions, the most significant of which include reserves for product liability claims, medical claims,
workers’ compensation claims, warranty claims, employee benefit plans, inventory obsolescence, allowance for
doubtful accounts, impairment of long-lived assets, product safety warnings, retrofits and valuation allowances.
Actual amounts may differ from those estimates and such differences could be material.
New and Recently Adopted Accounting Pronouncements
In November 2015, the Financial Accounting Standards Board (“FASB”) issued Accounting Standards
Update (“ASU”) No. 2015-17, “Balance Sheet Classification of Deferred Taxes,” as part of its simplification
initiative. Under the ASU, organizations that present a classified balance sheet are required to classify all deferred
taxes as noncurrent assets or noncurrent liabilities. For public companies, the ASU is effective for annual periods
beginning after December 15, 2016, and interim periods within those annual periods. For all other entities, the ASU
is effective for annual periods beginning after December 15, 2017, and interim periods within annual periods
beginning after December 15, 2018.
The Company adopted the provisions of this ASU early, effective December 31, 2015, on a prospective
basis and early adoption did not impact the Company’s results of operations.
In September 2015, the FASB issued ASU 2015-16 “Business Combinations (Topic 805): Simplifying the
Accounting for Measurement-Period Adjustments.” Under the new standard, an acquirer must recognize
adjustments to provisional amounts that are identified during the measurement period in the reporting period in
which the adjustment amounts are determined. The effect on earnings of changes in depreciation or amortization, or
other income effects (if any) as a result of the change to the provisional amounts, calculated as if the accounting had
been completed as of the acquisition date, must be recorded in the reporting period in which the adjustment amounts
are determined rather than retrospectively. The ASU is effective for fiscal years beginning after December 15, 2016
and early adoption is permitted. The Company does not believe the adoption of the new guidance will affect the
Company’s results of operations. In August 2015, FASB issued ASU 2015-15 “Imputation of Interest (Subtopic
835-30): Presentation and Subsequent Measurement of Debt Issuance Cost Associated with Line-of-Credit
Arrangements.” Under the new guidance, the Board clarified the exclusion of line-of-credit arrangements from the
REMINGTON OUTDOOR COMPANY, INC. AND SUBSIDIARIES NOTES TO CONSOLIDATED FINANCIAL STATEMENTS
($ IN MILLIONS, EXCEPT SHARE AND PER SHARE DATA)
71
scope of ASU 2015-03 “Imputation of Interest”. Therefore, debt issuance costs related to line-of-credit
arrangements can be deferred and presented as assets and the costs can be subsequently amortized ratably over the
term of the arrangement regardless of whether there are any outstanding borrowings on the line-of-credit
arrangement. The new guidance will become effective for financial statements issued for fiscal years beginning
after December 15, 2015, and interim periods within those fiscal years. The Company does not believe adoption of
the new guidance will affect the Company’s results of operations.
In August 2015, the FASB issued ASU 2015-14 “Revenue from Contracts with Customers (Topic 606):
Deferral of the Effective Date.” The new guidance defers the effective date of ASU 2014-09: “Revenues from
Contracts with Customers” to annual reporting periods beginning after December 15, 2017. ASU 2014-09 amends
existing guidance on revenue recognition. The new guidance is based on the principle that an entity will recognize
revenue to depict the transfer of goods and services to customers at an amount the entity expects to be entitled to in
exchange for those goods and services. The guidance requires additional disclosures regarding the nature, amount,
timing, and uncertainty of cash flows and both qualitative and quantitative information about contracts with
customers and applied significant judgments. The Company has not determined which method it will adopt and is
evaluating the effects the new guidance will have on its consolidated financial statements.
In July 2015, the FASB issued ASU 2015-11 “Simplifying the Measurement of Inventory” as part of its
simplification initiative. Under the ASU, inventory is measured at the “lower of cost and net realizable value”
which would eliminate the other two options that currently exist for “market”: (1) replacement cost and (2) net
realizable value less an approximately normal profit margin. Net realizable value is the estimated selling price in the
ordinary cost of business less reasonably predictable costs to completion, transportation, or disposal. The new
guidance will become effective for financial statements issued for fiscal years beginning after December 15, 2016,
and interim periods within those fiscal years. The Company is evaluating the effects the new guidance will have on
its consolidated financial statements.
In July 2015, the FASB issued ASU 2015-12 “Plan Accounting: Defined Benefit Pension Plans (Topic
960), Defined Contribution Pension Plans (Topic 962), and Health and Welfare Benefit Plans (Topic 965): Part (I)
Fully Benefit-Responsive Investment Contracts, Part (II) Plan Investment Disclosures and Part (III) Measurement
Date Practical Expedient.” This three-part standard simplifies employee benefit plan reporting with respect to fully
benefit-responsive investment contracts and plan investment disclosures, and provides for a measurement-date
practical expedient. Each of the Parts is effective for fiscal years beginning after December 15, 2015, and should be
applied retrospectively, with early application permitted, with the exception of Part III, which should be applied
prospectively. Management has elected to adopt Part II early. Accordingly, the amendments were retrospectively
applied resulting in updated disclosures to the Plan financial statements. Parts I and III are not applicable to the Plan.
The Company’s results of operations are not affected by the adoption of Part II of this new guidance.
In April 2015, the FASB issued ASU 2015-03 “Imputation of Interest (Subtopic 835-30): Simplifying the
Presentation of Debt Issuance Costs.” ASU 2015-03 simplifies the presentation of debt issuance costs. Under the
new guidance, debt issuance costs would be presented in the balance sheet as a direct deduction from the carrying
amount of the debt liability, consistent with debt discounts or premiums. The recognition and measurement guidance
for debt issuance costs would not be affected. The new guidance will become effective for financial statements
issued for fiscal years beginning after December 15, 2015, and interim periods within those fiscal years. The
Company does not believe adoption of the new guidance will affect the Company’s results of operations.
In January 2015, the FASB issued ASU 2015-01 “Income Statement – Extraordinary and Unusual Items
(Subtopic 225-20).” ASU 2015-01 eliminates the concept of extraordinary items and the current presentation and
disclosure requirements surrounding them. Extraordinary items are events and transactions that were deemed both
unusual in nature and infrequent in occurrence. The new guidance will become effective for fiscal periods beginning
after December 15, 2015 and early adoption occurs at the beginning of the fiscal year. The Company adopted the
provisions in the accounting update on January 1, 2015 and it did not affect the Company’s results of operations.
In November 2014, the FASB issued new guidance for pushdown accounting. Pushdown accounting refers
to shifting the acquirer’s accounting and reporting basis, which are recognized in conjunction with its accounting for
a business combination, down to the acquiree’s standalone financial statements. Under the new guidance, which

REMINGTON OUTDOOR COMPANY, INC. AND SUBSIDIARIES NOTES TO CONSOLIDATED FINANCIAL STATEMENTS
($ IN MILLIONS, EXCEPT SHARE AND PER SHARE DATA)
72
becomes effective immediately, pushdown accounting is optional for an acquiree when a change in control event
occurs. The new guidance did not affect the Company’s consolidated financial statements.
In May 2014, the FASB issued accounting guidance that amends existing guidance on revenue recognition.
The new guidance is based on principles that an entity will recognize revenue to depict the transfer of goods and
services to customers at an amount the entity expects to be entitled to in exchange for those goods and services. The
guidance requires additional disclosures regarding the nature, amount, timing, and uncertainty of cash flows and
both qualitative and quantitative information about contracts with customers and applied significant judgments. The
new authoritative guidance will become effective in the first quarter of 2018, using one of two retrospective methods
of adoption. The Company has not determined which method it will adopt and is evaluating the effects the new
guidance will have on its consolidated financial statements.
In April 2014, the FASB issued ASU 2014-08 “Presentation of Financial Statements (Topic 205) and
Property, Plant and Equipment (Topic 360): Reporting Discontinued Operations and Disclosures of Disposals of
Components of an Entity.” ASU 2014-08 amended existing criteria used to identify a discontinued operation. Under
the new guidance, the disposal of a component or group of components is required to be reported as a discontinued
operation if the disposal represents a strategic shift that will have a major effect on the Company’s operations. On
January 1, 2015, the Company adopted the provisions of the new guidance and does not believe it will have a
material effect on its consolidated financial statements.
In February 2013, the FASB issued ASU 2013-02 “Reporting of Amounts Reclassified Out of
Accumulated Other Comprehensive Income,” which clarified the reclassification requirements of ASU 2012-12.
Under FASB ASU 2013-02, significant items reclassified out of Accumulated Other Comprehensive Income
(“AOCI”) may be presented on the face of the financial statements, or in the accompanying footnotes. Significant
reclassified items will be presented by the respective line items of net income only if those reclassified items are
required to be reclassified to net income in their entirety in the same reporting period. Those significant items that
are not required to be reclassified to net income in their entirety in the same period, such as pension and other post-
retirement benefit period costs, can be cross-referenced to other disclosures in the accompanying footnotes. Since
the new accounting guidance affects the presentation and disclosure requirements of AOCI, adoption of this
standard did not impact the Company’s results of operations, financial condition or equity. Refer to note 20 for
additional information on the Company’s AOCI.
The FASB issued ASU 2013-01 “Clarifying the Scope of Disclosures about Offsetting Assets and
Liabilities,” which augments the requirements of ASU 2011-11, “Disclosures About Offsetting Assets and
Liabilities.” Under both Updates, entities are required to disclose additional information about their derivatives
instruments, repurchase agreements, and securities borrowing and lending transactions that are either offset in their
statements of financial position or are subject to enforceable master netting agreements. Both standards were
adopted since they became effective for interim and annual reporting periods beginning on January 1, 2013. The
new standards required additional disclosures, but their adoption did not affect the Company’s results of operations,
financial condition, or equity. Refer to note 14 for additional information on the Company’s derivative instruments
and enforceable master netting agreements.
3. Business Combinations
As discussed below, the Company has made various acquisitions. These acquisitions are being accounted
for as business combinations using the acquisition method, in accordance with Financial Accounting Standards
Board Accounting Standards Codification (“FASB ASC”), 805 “Business Combinations” whereby the final
purchase price (including assumed liabilities) is allocated and pushed down to the assets acquired based on their
estimated fair market values at the date of the acquisition.
Tech Group (UK) Ltd. (“SMK”)
On March 28, 2013, the Company, through its subsidiary, Remington UK, acquired certain assets and
assumed certain liabilities of SMK for approximately $6.4 (the “SMK Acquisition”) including cash, fees and escrow
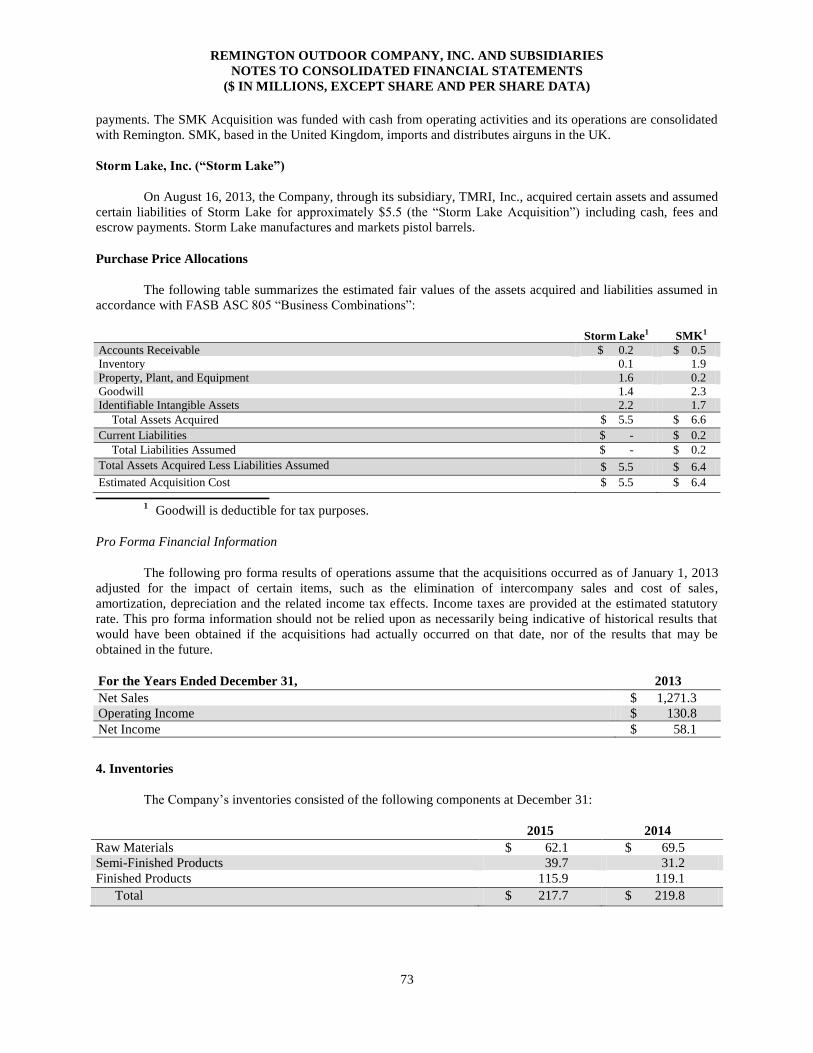
REMINGTON OUTDOOR COMPANY, INC. AND SUBSIDIARIES NOTES TO CONSOLIDATED FINANCIAL STATEMENTS
($ IN MILLIONS, EXCEPT SHARE AND PER SHARE DATA)
73
payments. The SMK Acquisition was funded with cash from operating activities and its operations are consolidated
with Remington. SMK, based in the United Kingdom, imports and distributes airguns in the UK.
Storm Lake, Inc. (“Storm Lake”)
On August 16, 2013, the Company, through its subsidiary, TMRI, Inc., acquired certain assets and assumed
certain liabilities of Storm Lake for approximately $5.5 (the “Storm Lake Acquisition”) including cash, fees and
escrow payments. Storm Lake manufactures and markets pistol barrels.
Purchase Price Allocations
The following table summarizes the estimated fair values of the assets acquired and liabilities assumed in
accordance with FASB ASC 805 “Business Combinations”:
Storm Lake1 SMK1
Accounts Receivable $ 0.2 $ 0.5
Inventory 0.1 1.9
Property, Plant, and Equipment 1.6 0.2
Goodwill 1.4 2.3
Identifiable Intangible Assets 2.2 1.7
Total Assets Acquired $ 5.5 $ 6.6
Current Liabilities $ - $ 0.2
Total Liabilities Assumed $ - $ 0.2
Total Assets Acquired Less Liabilities Assumed $ 5.5 $ 6.4
Estimated Acquisition Cost $ 5.5 $ 6.4
1 Goodwill is deductible for tax purposes.
Pro Forma Financial Information
The following pro forma results of operations assume that the acquisitions occurred as of January 1, 2013
adjusted for the impact of certain items, such as the elimination of intercompany sales and cost of sales,
amortization, depreciation and the related income tax effects. Income taxes are provided at the estimated statutory
rate. This pro forma information should not be relied upon as necessarily being indicative of historical results that
would have been obtained if the acquisitions had actually occurred on that date, nor of the results that may be
obtained in the future.
For the Years Ended December 31, 2013
Net Sales $ 1,271.3
Operating Income $ 130.8
Net Income $ 58.1
4. Inventories
The Company’s inventories consisted of the following components at December 31:
2015 2014
Raw Materials
$ 62.1 $ 69.5
Semi-Finished Products 39.7 31.2
Finished Products 115.9 119.1
Total $ 217.7 $ 219.8
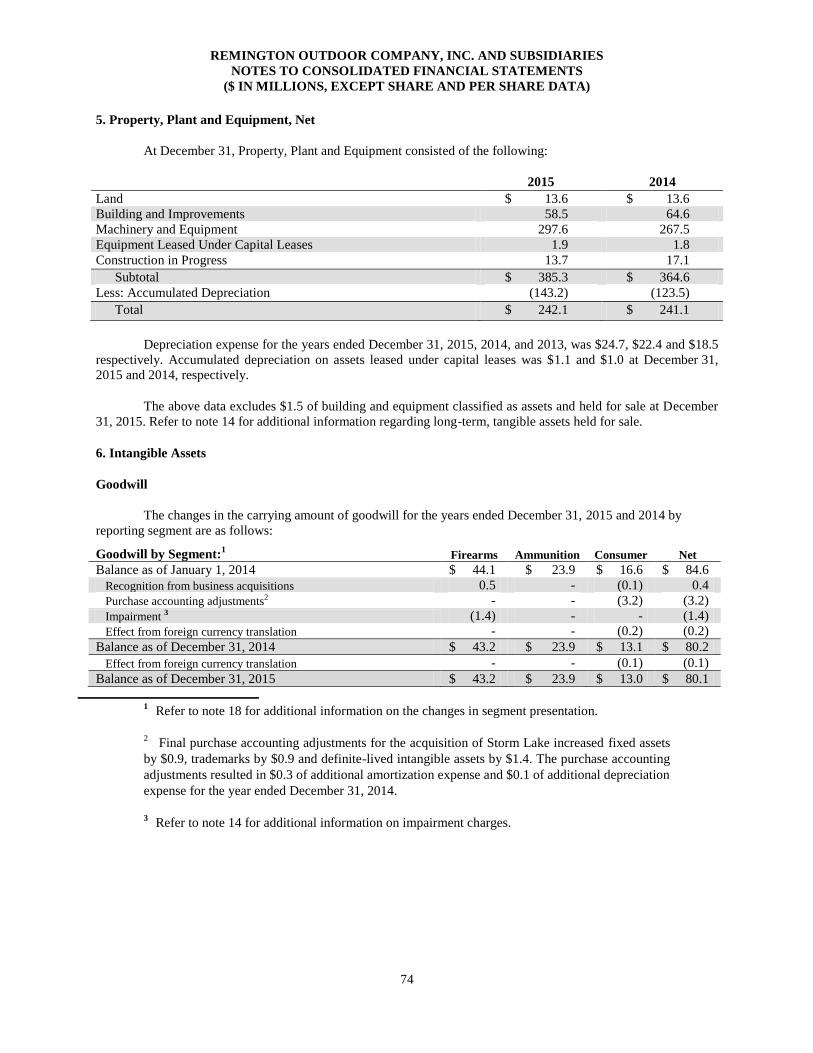
REMINGTON OUTDOOR COMPANY, INC. AND SUBSIDIARIES NOTES TO CONSOLIDATED FINANCIAL STATEMENTS
($ IN MILLIONS, EXCEPT SHARE AND PER SHARE DATA)
74
5. Property, Plant and Equipment, Net
At December 31, Property, Plant and Equipment consisted of the following:
2015 2014
Land $ 13.6 $ 13.6
Building and Improvements 58.5 64.6
Machinery and Equipment 297.6 267.5
Equipment Leased Under Capital Leases 1.9 1.8
Construction in Progress 13.7 17.1
Subtotal $ 385.3 $ 364.6
Less: Accumulated Depreciation (143.2) (123.5)
Total $ 242.1 $ 241.1
Depreciation expense for the years ended December 31, 2015, 2014, and 2013, was $24.7, $22.4 and $18.5
respectively. Accumulated depreciation on assets leased under capital leases was $1.1 and $1.0 at December 31,
2015 and 2014, respectively.
The above data excludes $1.5 of building and equipment classified as assets and held for sale at December
31, 2015. Refer to note 14 for additional information regarding long-term, tangible assets held for sale.
6. Intangible Assets
Goodwill
The changes in the carrying amount of goodwill for the years ended December 31, 2015 and 2014 by
reporting segment are as follows:
Goodwill by Segment:1
Firearms Ammunition Consumer Net
Balance as of January 1, 2014 $ 44.1 $ 23.9 $ 16.6 $ 84.6
Recognition from business acquisitions 0.5 - (0.1) 0.4
Purchase accounting adjustments2 - - (3.2) (3.2)
Impairment 3 (1.4) - - (1.4)
Effect from foreign currency translation - - (0.2) (0.2)
Balance as of December 31, 2014 $ 43.2 $ 23.9 $ 13.1 $ 80.2
Effect from foreign currency translation - - (0.1) (0.1)
Balance as of December 31, 2015 $ 43.2 $ 23.9 $ 13.0 $ 80.1
1
Refer to note 18 for additional information on the changes in segment presentation.
2 Final purchase accounting adjustments for the acquisition of Storm Lake increased fixed assets
by $0.9, trademarks by $0.9 and definite-lived intangible assets by $1.4. The purchase accounting
adjustments resulted in $0.3 of additional amortization expense and $0.1 of additional depreciation
expense for the year ended December 31, 2014.
3 Refer to note 14 for additional information on impairment charges.
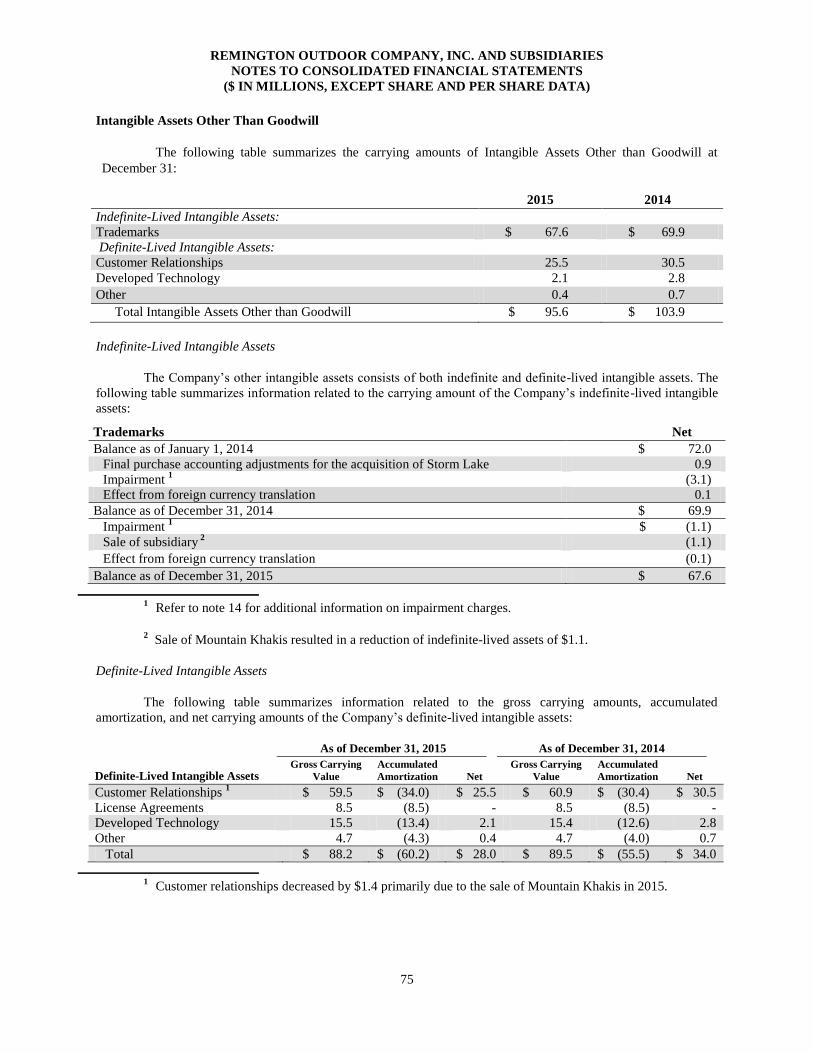
REMINGTON OUTDOOR COMPANY, INC. AND SUBSIDIARIES NOTES TO CONSOLIDATED FINANCIAL STATEMENTS
($ IN MILLIONS, EXCEPT SHARE AND PER SHARE DATA)
75
Intangible Assets Other Than Goodwill
The following table summarizes the carrying amounts of Intangible Assets Other than Goodwill at
December 31:
2015 2014
Indefinite-Lived Intangible Assets:
Trademarks
$ 67.6 $ 69.9
Definite-Lived Intangible Assets:
Customer Relationships 25.5 30.5
Developed Technology 2.1 2.8
Other 0.4 0.7
Total Intangible Assets Other than Goodwill $ 95.6 $ 103.9
Indefinite-Lived Intangible Assets
The Company’s other intangible assets consists of both indefinite and definite-lived intangible assets. The
following table summarizes information related to the carrying amount of the Company’s indefinite-lived intangible
assets:
Trademarks Net
Balance as of January 1, 2014 $ 72.0
Final purchase accounting adjustments for the acquisition of Storm Lake
0.9
Impairment 1
(3.1)
Effect from foreign currency translation 0.1
Balance as of December 31, 2014 $ 69.9
Impairment 1
$ (1.1)
Sale of subsidiary 2
(1.1)
Effect from foreign currency translation (0.1)
Balance as of December 31, 2015 $ 67.6
1
Refer to note 14 for additional information on impairment charges.
2 Sale of Mountain Khakis resulted in a reduction of indefinite-lived assets of $1.1.
Definite-Lived Intangible Assets
The following table summarizes information related to the gross carrying amounts, accumulated
amortization, and net carrying amounts of the Company’s definite-lived intangible assets:
As of December 31, 2015 As of December 31, 2014
Definite-Lived Intangible Assets Gross Carrying
Value
Accumulated
Amortization Net
Gross Carrying
Value
Accumulated
Amortization Net
Customer Relationships 1
$ 59.5 $ (34.0) $ 25.5 $ 60.9 $ (30.4) $ 30.5
License Agreements
8.5 (8.5) - 8.5 (8.5) -
Developed Technology
15.5 (13.4) 2.1 15.4 (12.6) 2.8
Other
4.7 (4.3) 0.4 4.7 (4.0) 0.7
Total $ 88.2 $ (60.2) $ 28.0 $ 89.5 $ (55.5) $ 34.0
1
Customer relationships decreased by $1.4 primarily due to the sale of Mountain Khakis in 2015.
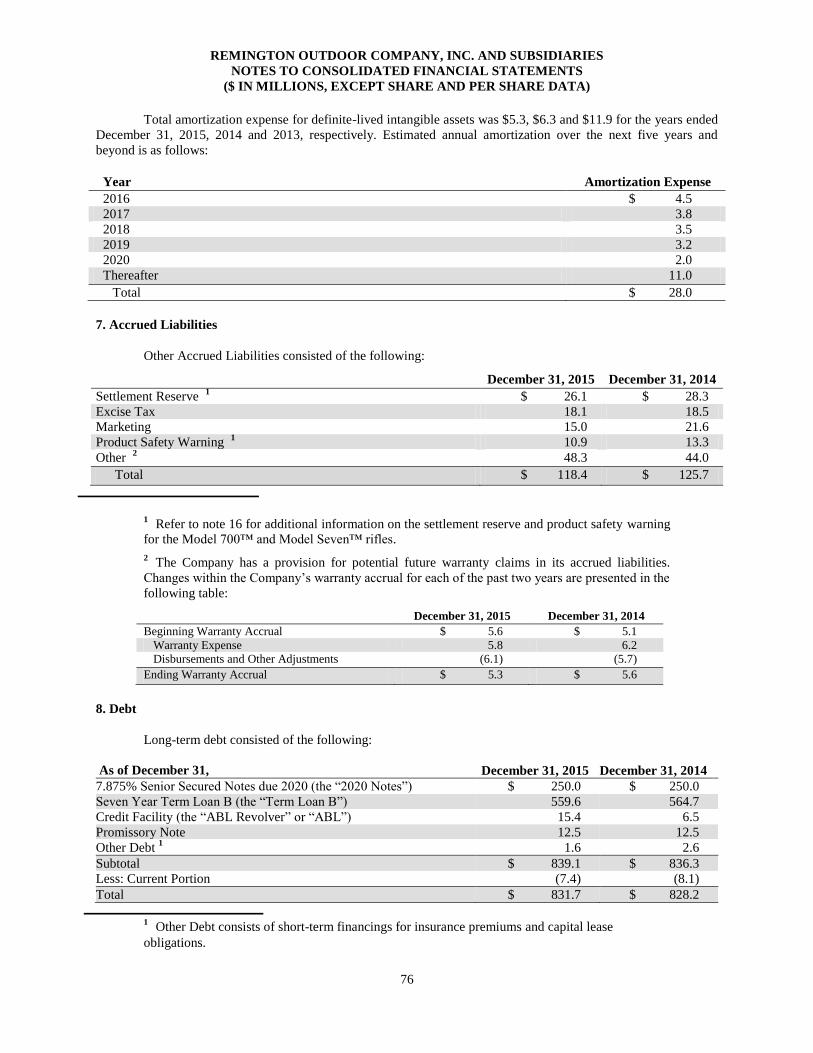
REMINGTON OUTDOOR COMPANY, INC. AND SUBSIDIARIES NOTES TO CONSOLIDATED FINANCIAL STATEMENTS
($ IN MILLIONS, EXCEPT SHARE AND PER SHARE DATA)
76
Total amortization expense for definite-lived intangible assets was $5.3, $6.3 and $11.9 for the years ended
December 31, 2015, 2014 and 2013, respectively. Estimated annual amortization over the next five years and
beyond is as follows:
Year Amortization Expense
2016 $ 4.5
2017 3.8
2018 3.5
2019 3.2
2020 2.0
Thereafter 11.0
Total $ 28.0
7. Accrued Liabilities
Other Accrued Liabilities consisted of the following:
December 31, 2015 December 31, 2014
Settlement Reserve 1
$ 26.1 $ 28.3
Excise Tax 18.1 18.5
Marketing 15.0 21.6
Product Safety Warning 1 10.9 13.3
Other 2 48.3 44.0
Total $ 118.4 $ 125.7
1 Refer to note 16 for additional information on the settlement reserve and product safety warning
for the Model 700™ and Model Seven™ rifles.
2 The Company has a provision for potential future warranty claims in its accrued liabilities.
Changes within the Company’s warranty accrual for each of the past two years are presented in the
following table:
December 31, 2015 December 31, 2014
Beginning Warranty Accrual $ 5.6 $ 5.1
Warranty Expense 5.8 6.2
Disbursements and Other Adjustments (6.1) (5.7)
Ending Warranty Accrual $ 5.3 $ 5.6
8. Debt
Long-term debt consisted of the following:
As of December 31, December 31, 2015 December 31, 2014
7.875% Senior Secured Notes due 2020 (the “2020 Notes”) $ 250.0 $ 250.0
Seven Year Term Loan B (the “Term Loan B”) 559.6 564.7
Credit Facility (the “ABL Revolver” or “ABL”) 15.4 6.5
Promissory Note 12.5 12.5
Other Debt 1 1.6 2.6
Subtotal $ 839.1 $ 836.3
Less: Current Portion (7.4) (8.1)
Total $ 831.7 $ 828.2
1
Other Debt consists of short-term financings for insurance premiums and capital lease
obligations.
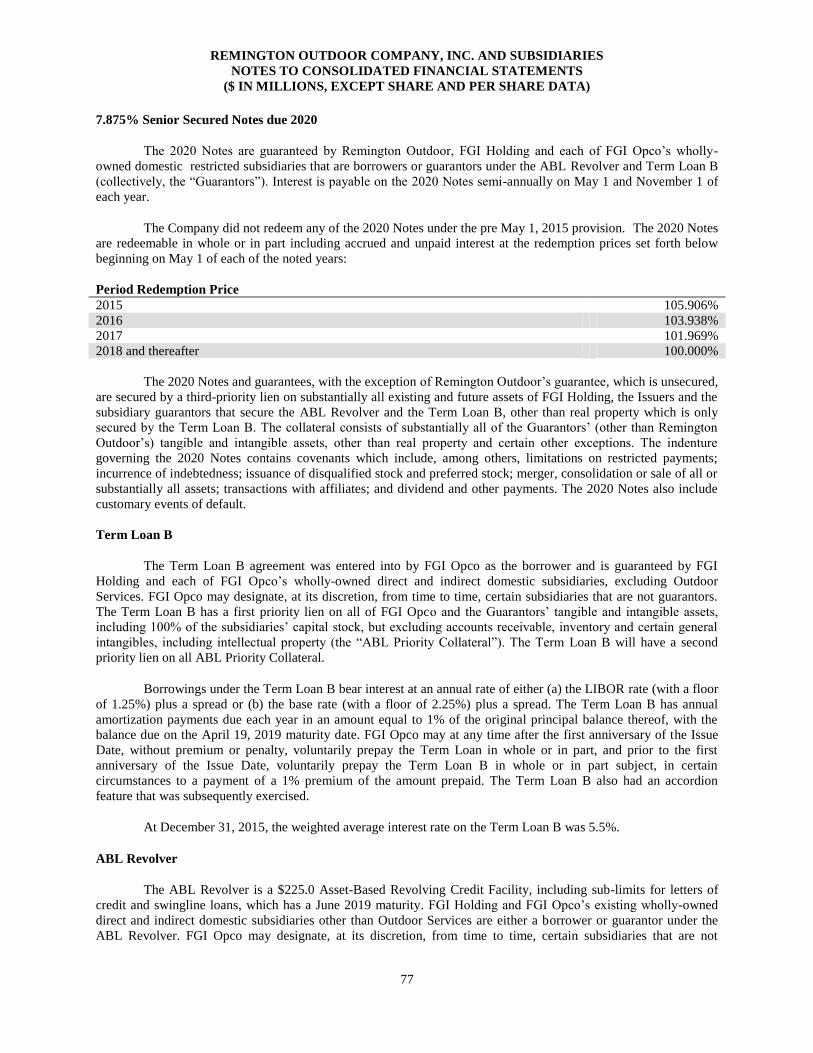
REMINGTON OUTDOOR COMPANY, INC. AND SUBSIDIARIES NOTES TO CONSOLIDATED FINANCIAL STATEMENTS
($ IN MILLIONS, EXCEPT SHARE AND PER SHARE DATA)
77
7.875% Senior Secured Notes due 2020
The 2020 Notes are guaranteed by Remington Outdoor, FGI Holding and each of FGI Opco’s wholly-
owned domestic restricted subsidiaries that are borrowers or guarantors under the ABL Revolver and Term Loan B
(collectively, the “Guarantors”). Interest is payable on the 2020 Notes semi-annually on May 1 and November 1 of
each year.
The Company did not redeem any of the 2020 Notes under the pre May 1, 2015 provision. The 2020 Notes
are redeemable in whole or in part including accrued and unpaid interest at the redemption prices set forth below
beginning on May 1 of each of the noted years:
Period Redemption Price
2015 105.906%
2016 103.938%
2017 101.969%
2018 and thereafter 100.000%
The 2020 Notes and guarantees, with the exception of Remington Outdoor’s guarantee, which is unsecured,
are secured by a third-priority lien on substantially all existing and future assets of FGI Holding, the Issuers and the
subsidiary guarantors that secure the ABL Revolver and the Term Loan B, other than real property which is only
secured by the Term Loan B. The collateral consists of substantially all of the Guarantors’ (other than Remington
Outdoor’s) tangible and intangible assets, other than real property and certain other exceptions. The indenture
governing the 2020 Notes contains covenants which include, among others, limitations on restricted payments;
incurrence of indebtedness; issuance of disqualified stock and preferred stock; merger, consolidation or sale of all or
substantially all assets; transactions with affiliates; and dividend and other payments. The 2020 Notes also include
customary events of default.
Term Loan B
The Term Loan B agreement was entered into by FGI Opco as the borrower and is guaranteed by FGI
Holding and each of FGI Opco’s wholly-owned direct and indirect domestic subsidiaries, excluding Outdoor
Services. FGI Opco may designate, at its discretion, from time to time, certain subsidiaries that are not guarantors.
The Term Loan B has a first priority lien on all of FGI Opco and the Guarantors’ tangible and intangible assets,
including 100% of the subsidiaries’ capital stock, but excluding accounts receivable, inventory and certain general
intangibles, including intellectual property (the “ABL Priority Collateral”). The Term Loan B will have a second
priority lien on all ABL Priority Collateral.
Borrowings under the Term Loan B bear interest at an annual rate of either (a) the LIBOR rate (with a floor
of 1.25%) plus a spread or (b) the base rate (with a floor of 2.25%) plus a spread. The Term Loan B has annual
amortization payments due each year in an amount equal to 1% of the original principal balance thereof, with the
balance due on the April 19, 2019 maturity date. FGI Opco may at any time after the first anniversary of the Issue
Date, without premium or penalty, voluntarily prepay the Term Loan in whole or in part, and prior to the first
anniversary of the Issue Date, voluntarily prepay the Term Loan B in whole or in part subject, in certain
circumstances to a payment of a 1% premium of the amount prepaid. The Term Loan B also had an accordion
feature that was subsequently exercised.
At December 31, 2015, the weighted average interest rate on the Term Loan B was 5.5%.
ABL Revolver
The ABL Revolver is a $225.0 Asset-Based Revolving Credit Facility, including sub-limits for letters of
credit and swingline loans, which has a June 2019 maturity. FGI Holding and FGI Opco’s existing wholly-owned
direct and indirect domestic subsidiaries other than Outdoor Services are either a borrower or guarantor under the
ABL Revolver. FGI Opco may designate, at its discretion, from time to time, certain subsidiaries that are not
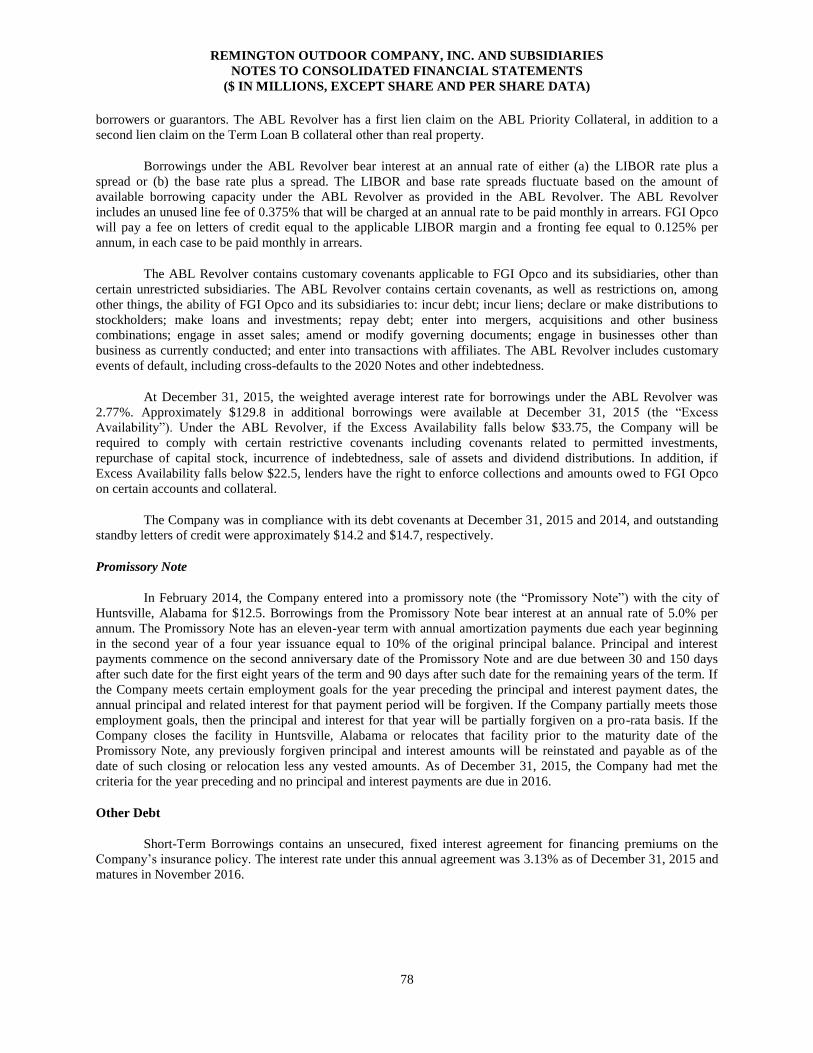
REMINGTON OUTDOOR COMPANY, INC. AND SUBSIDIARIES NOTES TO CONSOLIDATED FINANCIAL STATEMENTS
($ IN MILLIONS, EXCEPT SHARE AND PER SHARE DATA)
78
borrowers or guarantors. The ABL Revolver has a first lien claim on the ABL Priority Collateral, in addition to a
second lien claim on the Term Loan B collateral other than real property.
Borrowings under the ABL Revolver bear interest at an annual rate of either (a) the LIBOR rate plus a
spread or (b) the base rate plus a spread. The LIBOR and base rate spreads fluctuate based on the amount of
available borrowing capacity under the ABL Revolver as provided in the ABL Revolver. The ABL Revolver
includes an unused line fee of 0.375% that will be charged at an annual rate to be paid monthly in arrears. FGI Opco
will pay a fee on letters of credit equal to the applicable LIBOR margin and a fronting fee equal to 0.125% per
annum, in each case to be paid monthly in arrears.
The ABL Revolver contains customary covenants applicable to FGI Opco and its subsidiaries, other than
certain unrestricted subsidiaries. The ABL Revolver contains certain covenants, as well as restrictions on, among
other things, the ability of FGI Opco and its subsidiaries to: incur debt; incur liens; declare or make distributions to
stockholders; make loans and investments; repay debt; enter into mergers, acquisitions and other business
combinations; engage in asset sales; amend or modify governing documents; engage in businesses other than
business as currently conducted; and enter into transactions with affiliates. The ABL Revolver includes customary
events of default, including cross-defaults to the 2020 Notes and other indebtedness.
At December 31, 2015, the weighted average interest rate for borrowings under the ABL Revolver was
2.77%. Approximately $129.8 in additional borrowings were available at December 31, 2015 (the “Excess
Availability”). Under the ABL Revolver, if the Excess Availability falls below $33.75, the Company will be
required to comply with certain restrictive covenants including covenants related to permitted investments,
repurchase of capital stock, incurrence of indebtedness, sale of assets and dividend distributions. In addition, if
Excess Availability falls below $22.5, lenders have the right to enforce collections and amounts owed to FGI Opco
on certain accounts and collateral.
The Company was in compliance with its debt covenants at December 31, 2015 and 2014, and outstanding
standby letters of credit were approximately $14.2 and $14.7, respectively.
Promissory Note
In February 2014, the Company entered into a promissory note (the “Promissory Note”) with the city of
Huntsville, Alabama for $12.5. Borrowings from the Promissory Note bear interest at an annual rate of 5.0% per
annum. The Promissory Note has an eleven-year term with annual amortization payments due each year beginning
in the second year of a four year issuance equal to 10% of the original principal balance. Principal and interest
payments commence on the second anniversary date of the Promissory Note and are due between 30 and 150 days
after such date for the first eight years of the term and 90 days after such date for the remaining years of the term. If
the Company meets certain employment goals for the year preceding the principal and interest payment dates, the
annual principal and related interest for that payment period will be forgiven. If the Company partially meets those
employment goals, then the principal and interest for that year will be partially forgiven on a pro-rata basis. If the
Company closes the facility in Huntsville, Alabama or relocates that facility prior to the maturity date of the
Promissory Note, any previously forgiven principal and interest amounts will be reinstated and payable as of the
date of such closing or relocation less any vested amounts. As of December 31, 2015, the Company had met the
criteria for the year preceding and no principal and interest payments are due in 2016.
Other Debt
Short-Term Borrowings contains an unsecured, fixed interest agreement for financing premiums on the
Company’s insurance policy. The interest rate under this annual agreement was 3.13% as of December 31, 2015 and
matures in November 2016.

REMINGTON OUTDOOR COMPANY, INC. AND SUBSIDIARIES NOTES TO CONSOLIDATED FINANCIAL STATEMENTS
($ IN MILLIONS, EXCEPT SHARE AND PER SHARE DATA)
79
Maturities of debt, including those for capital leases, for each of the next five years and thereafter are as
follows:
Year Amount 1
2016 $ 6.7
2017 5.1
2018 5.0
2019 559.8
2020 262.5
Thereafter -
Total $ 839.1
1 Amounts are net of amortization for the Term Loan B discount of $0.7, $0.7, $0.8, $0.3 and zero
for 2016, 2017, 2018, 2019 and 2020, respectively.
9. Stockholders’ Equity
Preferred Stock
Preferred stock has a par value of $0.01 per share and consists of 200,000 shares authorized, with 190,000
designated as Series A preferred stock. The holders of Series A preferred stock are entitled to one vote per share to
be voted together with holders of Common Stock as a single class. Dividends may be declared and paid on the
Series A preferred stock from funds lawfully available at the discretion of the Remington Outdoor Board of
Directors (the “Board”). In the event of any liquidation, dissolution, or winding up of the Corporation, either
voluntary or involuntary, the holders of Series A preferred stock will be entitled to receive, prior and in preference to
any distributions of assets or funds to the holders of its common stock, an amount per share equal to the sum of
$10.53 for each outstanding share (the liquidation value). Also, the holders of Series A preferred stock will receive
an additional amount equal to 10% of the liquidation value, compounded annually, prorated from the later of the
original issue date of the Series A preferred stock or the most recent anniversary of the issue date. There were no
shares outstanding as of December 31, 2015, 2014, and 2013.
Common Stock
Common stock has a par value of $0.01 per share and consists of 400,000 shares authorized as of
December 31, 2015. The holders of common stock are entitled to one vote per share and shares are nonredeemable.
No dividends may be declared or paid on common stock so long as any Series A preferred stock is outstanding. If no
Series A preferred stock is outstanding, dividends may be declared and paid on common stock from funds lawfully
available; therefore as and when determined by the Board.
Forfeitures of common stock represent unvested shares issued to participants covered by the Plan (as
defined below) who failed to meet the Plan’s vesting requirements. Under the Plan, unvested shares of common
stock are remitted back to the Company and may be included in future awards. Forfeitures, as well as non-retired
shares of previously acquired stock, are reissued to satisfy exercised stock options and new stock grants prior to the
issuance of new shares.
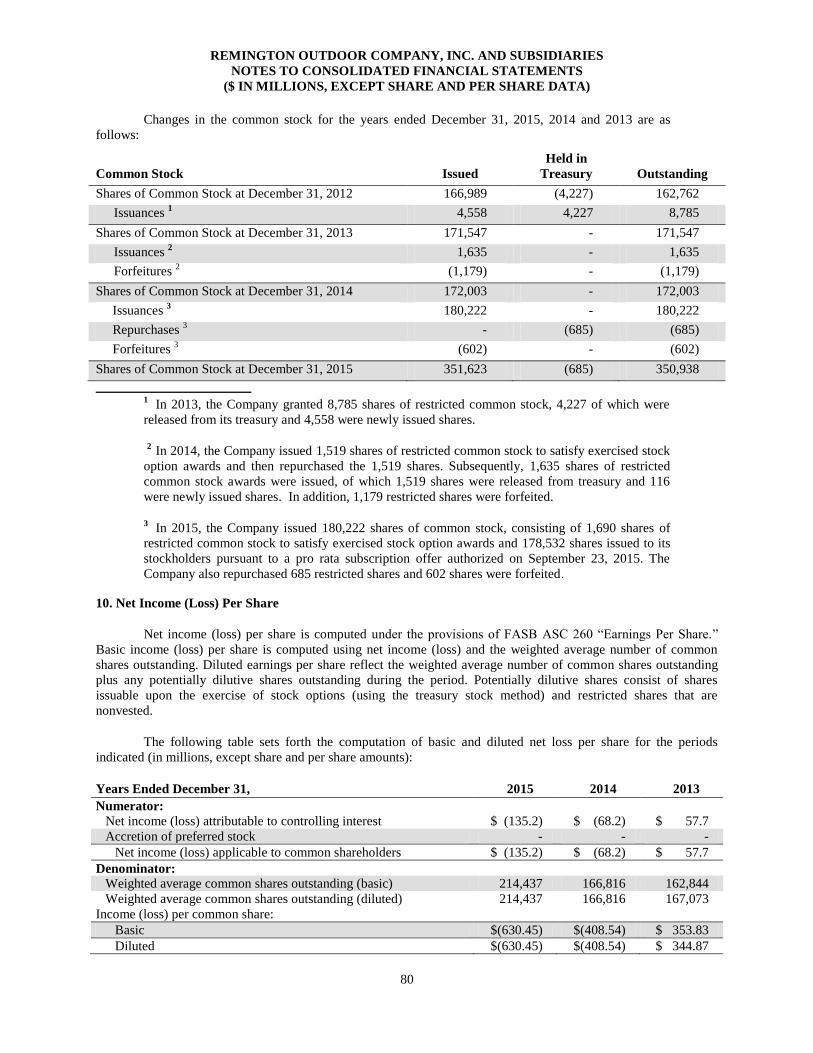
REMINGTON OUTDOOR COMPANY, INC. AND SUBSIDIARIES NOTES TO CONSOLIDATED FINANCIAL STATEMENTS
($ IN MILLIONS, EXCEPT SHARE AND PER SHARE DATA)
80
Changes in the common stock for the years ended December 31, 2015, 2014 and 2013 are as
follows:
Common Stock Issued
Held in
Treasury Outstanding
Shares of Common Stock at December 31, 2012 166,989 (4,227) 162,762
Issuances 1 4,558 4,227 8,785
Shares of Common Stock at December 31, 2013 171,547 - 171,547
Issuances 2 1,635 - 1,635
Forfeitures 2
(1,179) - (1,179)
Shares of Common Stock at December 31, 2014 172,003 - 172,003
Issuances 3 180,222 - 180,222
Repurchases 3
- (685) (685)
Forfeitures 3
(602) - (602)
Shares of Common Stock at December 31, 2015 351,623 (685) 350,938
1
In 2013, the Company granted 8,785 shares of restricted common stock, 4,227 of which were
released from its treasury and 4,558 were newly issued shares.
2
In 2014, the Company issued 1,519 shares of restricted common stock to satisfy exercised stock
option awards and then repurchased the 1,519 shares. Subsequently, 1,635 shares of restricted
common stock awards were issued, of which 1,519 shares were released from treasury and 116
were newly issued shares. In addition, 1,179 restricted shares were forfeited.
3 In 2015, the Company issued 180,222 shares of common stock, consisting of 1,690 shares of
restricted common stock to satisfy exercised stock option awards and 178,532 shares issued to its
stockholders pursuant to a pro rata subscription offer authorized on September 23, 2015. The
Company also repurchased 685 restricted shares and 602 shares were forfeited.
10. Net Income (Loss) Per Share
Net income (loss) per share is computed under the provisions of FASB ASC 260 “Earnings Per Share.”
Basic income (loss) per share is computed using net income (loss) and the weighted average number of common
shares outstanding. Diluted earnings per share reflect the weighted average number of common shares outstanding
plus any potentially dilutive shares outstanding during the period. Potentially dilutive shares consist of shares
issuable upon the exercise of stock options (using the treasury stock method) and restricted shares that are
nonvested.
The following table sets forth the computation of basic and diluted net loss per share for the periods
indicated (in millions, except share and per share amounts):
Years Ended December 31, 2015 2014 2013
Numerator:
Net income (loss) attributable to controlling interest $ (135.2) $ (68.2) $ 57.7
Accretion of preferred stock - - -
Net income (loss) applicable to common shareholders $ (135.2) $ (68.2) $ 57.7
Denominator:
Weighted average common shares outstanding (basic) 214,437 166,816 162,844
Weighted average common shares outstanding (diluted) 214,437 166,816 167,073
Income (loss) per common share:
Basic $(630.45) $(408.54) $ 353.83
Diluted $(630.45) $(408.54) $ 344.87
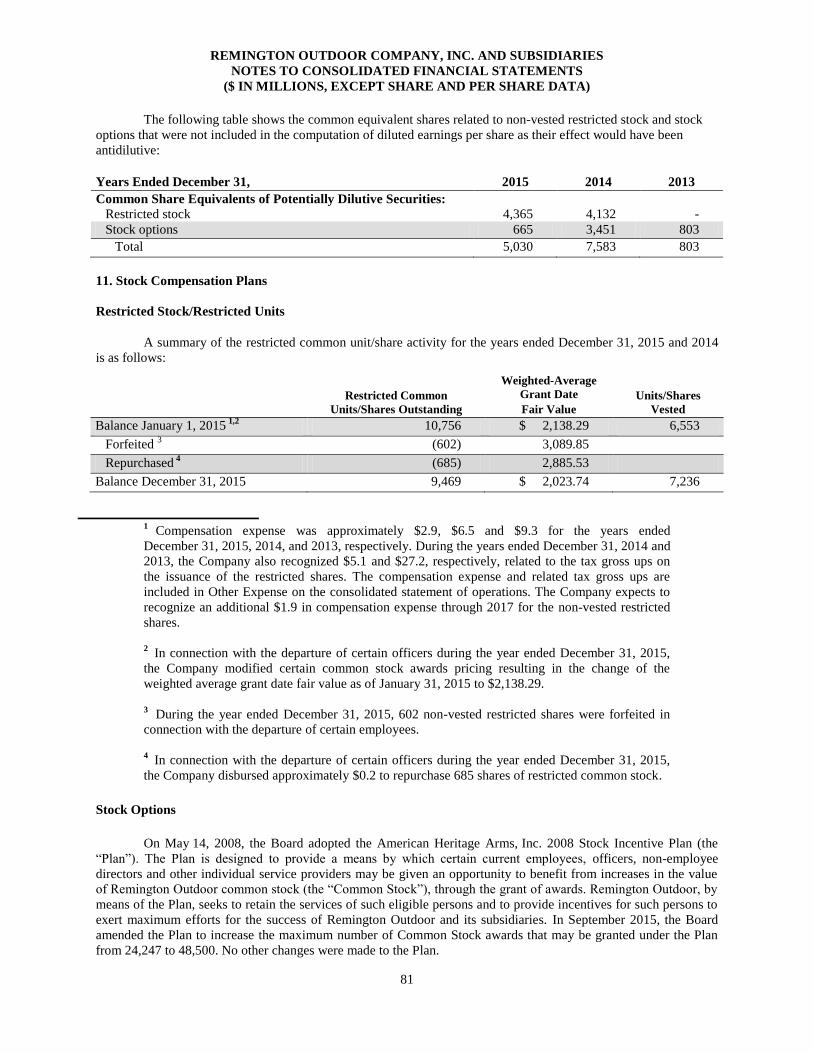
REMINGTON OUTDOOR COMPANY, INC. AND SUBSIDIARIES NOTES TO CONSOLIDATED FINANCIAL STATEMENTS
($ IN MILLIONS, EXCEPT SHARE AND PER SHARE DATA)
81
The following table shows the common equivalent shares related to non-vested restricted stock and stock
options that were not included in the computation of diluted earnings per share as their effect would have been
antidilutive:
Years Ended December 31, 2015 2014 2013
Common Share Equivalents of Potentially Dilutive Securities:
Restricted stock 4,365 4,132 -
Stock options 665 3,451 803
Total 5,030 7,583 803
11. Stock Compensation Plans
Restricted Stock/Restricted Units
A summary of the restricted common unit/share activity for the years ended December 31, 2015 and 2014
is as follows:
Restricted Common
Units/Shares Outstanding
Weighted-Average
Grant Date
Fair Value
Units/Shares
Vested
Balance January 1, 2015 1,2
10,756 $ 2,138.29 6,553
Forfeited 3 (602) 3,089.85
Repurchased 4
(685) 2,885.53
Balance December 31, 2015 9,469 $ 2,023.74 7,236
1
Compensation expense was approximately $2.9, $6.5 and $9.3 for the years ended
December 31, 2015, 2014, and 2013, respectively. During the years ended December 31, 2014 and
2013, the Company also recognized $5.1 and $27.2, respectively, related to the tax gross ups on
the issuance of the restricted shares. The compensation expense and related tax gross ups are
included in Other Expense on the consolidated statement of operations. The Company expects to
recognize an additional $1.9 in compensation expense through 2017 for the non-vested restricted
shares.
2
In connection with the departure of certain officers during the year ended December 31, 2015,
the Company modified certain common stock awards pricing resulting in the change of the
weighted average grant date fair value as of January 31, 2015 to $2,138.29.
3
During the year ended December 31, 2015, 602 non-vested restricted shares were forfeited in
connection with the departure of certain employees.
4
In connection with the departure of certain officers during the year ended December 31, 2015,
the Company disbursed approximately $0.2 to repurchase 685 shares of restricted common stock.
Stock Options
On May 14, 2008, the Board adopted the American Heritage Arms, Inc. 2008 Stock Incentive Plan (the
“Plan”). The Plan is designed to provide a means by which certain current employees, officers, non-employee
directors and other individual service providers may be given an opportunity to benefit from increases in the value
of Remington Outdoor common stock (the “Common Stock”), through the grant of awards. Remington Outdoor, by
means of the Plan, seeks to retain the services of such eligible persons and to provide incentives for such persons to
exert maximum efforts for the success of Remington Outdoor and its subsidiaries. In September 2015, the Board
amended the Plan to increase the maximum number of Common Stock awards that may be granted under the Plan
from 24,247 to 48,500. No other changes were made to the Plan.

REMINGTON OUTDOOR COMPANY, INC. AND SUBSIDIARIES NOTES TO CONSOLIDATED FINANCIAL STATEMENTS
($ IN MILLIONS, EXCEPT SHARE AND PER SHARE DATA)
82
The awards under the Plan may be in the form of incentive stock options, nonqualified stock options, stock
appreciation rights, restricted stock awards and stock unit awards. The maximum aggregate number of shares of
Common Stock that may be issued under all awards granted to participants under the Plan is 48,500 shares,
including approximately 1,234 shares which are restricted shares and not stock options, subject to certain
adjustments as set forth in the Plan.
Also on May 14, 2008, the Board adopted the form of Nonqualified Stock Option Award Agreement (the
“Form Award Agreement”). The Form Award Agreement outlines terms relating to stock option awards, including
(i) the exercise price per share of each option granted, which shall be the fair market value of a share of the Common
Stock on the date of grant (as defined in the Plan), (ii) the vesting schedule of the options granted, and
(iii) acceleration provisions upon the occurrence of a change in control, termination of employment without cause or
termination of employment for good reason.
Although all of the options are fully vested, the Company recognized approximately $0.1 in compensation
expense for the year ended December 31, 2015 as a result of option modifications related to the departure of certain
employees. The Company recognized zero and $0.1 in compensation expense, respectively, for the years ended
December 31, 2014 and 2013. Since all of the Company’s outstanding options are fully vested, no additional
compensation expense is expected to be recognized.
A summary of the stock option activity for the Plan for the year ended December 31, 2014 is as follows:
Number
of Awards
Weighted-Average
Exercise Price
Awards outstanding, January 1, 2015 3,451 $ 300.72
Exercised1
(1,690) 255.00
Forfeited (1,096) 255.00
Awards outstanding, December 31, 2015 665 $ 492.26
Awards vested, December 31, 2015 665 $ 492.26
Shares available for grant, December 31, 2015 21,457
1 During the year ended December 31, 2015, the Company received approximately $0.4 for 1,690
of exercised vested stock options.
The total intrinsic value of options exercised was zero, $0.4 and zero for each of the years ended December
31, 2015, 2014, and 2013. The total intrinsic value of options that have vested and are exercisable for the years
ended December 31, 2015, 2014, and 2013 was zero, $0.9, and $15.4, respectively.
The following table summarizes information about stock options outstanding in connection with the Plan at
December 31, 2015:
Awards Outstanding Awards Vested
Exercise Price
Number
of Shares
Weighted-Average
Remaining
Contractual Life
Weighted-Average
Exercise Price
Number
of Shares
Weighted-Average
Exercise Price
$255.00-$670.20 665 3.69 $ 492.26 665 $ 492.26
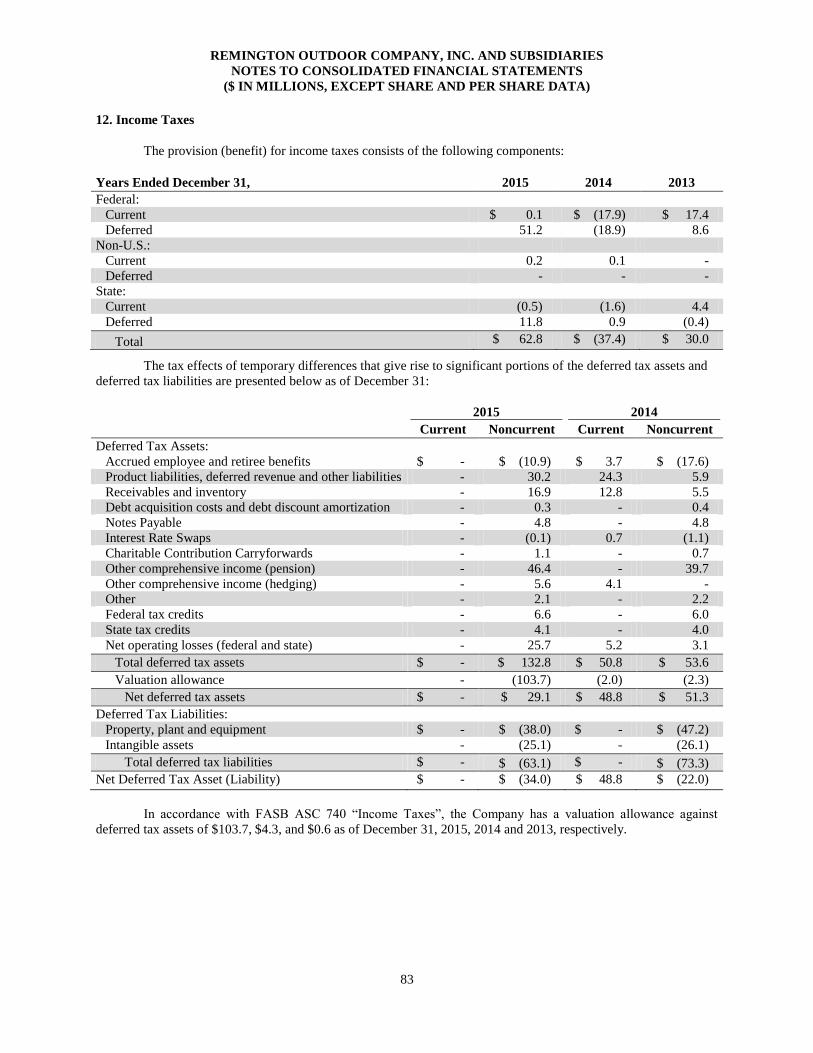
REMINGTON OUTDOOR COMPANY, INC. AND SUBSIDIARIES NOTES TO CONSOLIDATED FINANCIAL STATEMENTS
($ IN MILLIONS, EXCEPT SHARE AND PER SHARE DATA)
83
12. Income Taxes
The provision (benefit) for income taxes consists of the following components:
Years Ended December 31, 2015 2014 2013
Federal:
Current $ 0.1 $ (17.9) $ 17.4
Deferred 51.2 (18.9) 8.6
Non-U.S.:
Current 0.2 0.1 -
Deferred - - -
State:
Current (0.5) (1.6) 4.4
Deferred 11.8 0.9 (0.4)
Total $ 62.8 $ (37.4) $ 30.0
The tax effects of temporary differences that give rise to significant portions of the deferred tax assets and
deferred tax liabilities are presented below as of December 31:
2015 2014
Current Noncurrent Current Noncurrent
Deferred Tax Assets:
Accrued employee and retiree benefits $ - $ (10.9) $ 3.7 $ (17.6)
Product liabilities, deferred revenue and other liabilities - 30.2 24.3 5.9
Receivables and inventory - 16.9 12.8 5.5
Debt acquisition costs and debt discount amortization - 0.3 - 0.4
Notes Payable - 4.8 - 4.8
Interest Rate Swaps - (0.1) 0.7 (1.1)
Charitable Contribution Carryforwards - 1.1 - 0.7
Other comprehensive income (pension) - 46.4 - 39.7
Other comprehensive income (hedging) - 5.6 4.1 -
Other - 2.1 - 2.2
Federal tax credits - 6.6 - 6.0
State tax credits - 4.1 - 4.0
Net operating losses (federal and state) - 25.7 5.2 3.1
Total deferred tax assets $ - $ 132.8 $ 50.8 $ 53.6
Valuation allowance - (103.7) (2.0) (2.3)
Net deferred tax assets $ - $ 29.1 $ 48.8 $ 51.3
Deferred Tax Liabilities:
Property, plant and equipment $ - $ (38.0) $ - $ (47.2)
Intangible assets - (25.1) - (26.1)
Total deferred tax liabilities $ - $ (63.1) $ - $ (73.3)
Net Deferred Tax Asset (Liability) $ - $ (34.0) $ 48.8 $ (22.0)
In accordance with FASB ASC 740 “Income Taxes”, the Company has a valuation allowance against
deferred tax assets of $103.7, $4.3, and $0.6 as of December 31, 2015, 2014 and 2013, respectively.
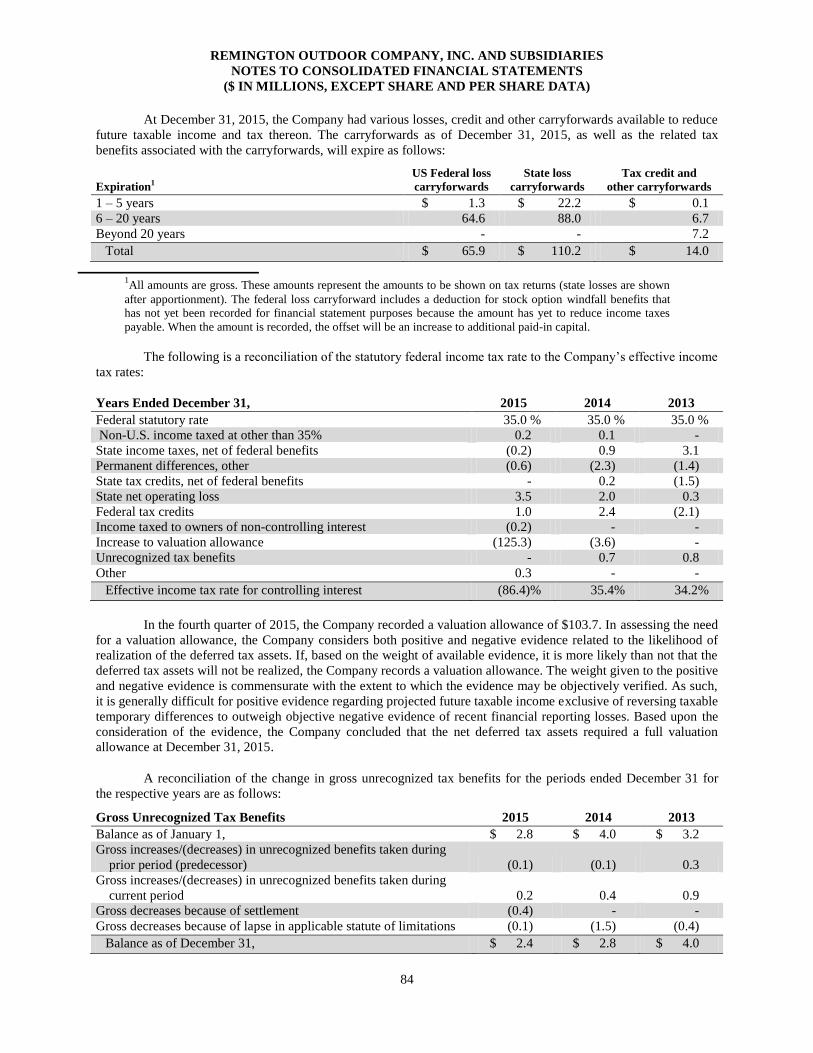
REMINGTON OUTDOOR COMPANY, INC. AND SUBSIDIARIES NOTES TO CONSOLIDATED FINANCIAL STATEMENTS
($ IN MILLIONS, EXCEPT SHARE AND PER SHARE DATA)
84
At December 31, 2015, the Company had various losses, credit and other carryforwards available to reduce
future taxable income and tax thereon. The carryforwards as of December 31, 2015, as well as the related tax
benefits associated with the carryforwards, will expire as follows:
Expiration1 US Federal loss
carryforwards
State loss
carryforwards
Tax credit and
other carryforwards
1 – 5 years $ 1.3 $ 22.2 $ 0.1
6 – 20 years 64.6 88.0 6.7
Beyond 20 years - - 7.2
Total $ 65.9 $ 110.2 $ 14.0
1All amounts are gross. These amounts represent the amounts to be shown on tax returns (state losses are shown
after apportionment). The federal loss carryforward includes a deduction for stock option windfall benefits that
has not yet been recorded for financial statement purposes because the amount has yet to reduce income taxes
payable. When the amount is recorded, the offset will be an increase to additional paid-in capital.
The following is a reconciliation of the statutory federal income tax rate to the Company’s effective income
tax rates:
Years Ended December 31, 2015 2014
2013
Federal statutory rate 35.0 % 35.0 % 35.0 %
Non-U.S. income taxed at other than 35% 0.2 0.1 -
State income taxes, net of federal benefits
(0.2) 0.9 3.1
Permanent differences, other (0.6) (2.3) (1.4)
State tax credits, net of federal benefits - 0.2 (1.5)
State net operating loss 3.5 2.0 0.3
Federal tax credits 1.0 2.4 (2.1)
Income taxed to owners of non-controlling interest (0.2) - -
Increase to valuation allowance (125.3) (3.6) -
Unrecognized tax benefits - 0.7 0.8
Other 0.3 - -
Effective income tax rate for controlling interest (86.4)% 35.4% 34.2%
In the fourth quarter of 2015, the Company recorded a valuation allowance of $103.7. In assessing the need
for a valuation allowance, the Company considers both positive and negative evidence related to the likelihood of
realization of the deferred tax assets. If, based on the weight of available evidence, it is more likely than not that the
deferred tax assets will not be realized, the Company records a valuation allowance. The weight given to the positive
and negative evidence is commensurate with the extent to which the evidence may be objectively verified. As such,
it is generally difficult for positive evidence regarding projected future taxable income exclusive of reversing taxable
temporary differences to outweigh objective negative evidence of recent financial reporting losses. Based upon the
consideration of the evidence, the Company concluded that the net deferred tax assets required a full valuation
allowance at December 31, 2015.
A reconciliation of the change in gross unrecognized tax benefits for the periods ended December 31 for
the respective years are as follows:
Gross Unrecognized Tax Benefits 2015 2014 2013
Balance as of January 1, $ 2.8 $ 4.0 $ 3.2
Gross increases/(decreases) in unrecognized benefits taken during
prior period (predecessor) (0.1) (0.1) 0.3
Gross increases/(decreases) in unrecognized benefits taken during
current period 0.2 0.4 0.9
Gross decreases because of settlement (0.4) - -
Gross decreases because of lapse in applicable statute of limitations (0.1) (1.5) (0.4)
Balance as of December 31, $ 2.4 $ 2.8 $ 4.0
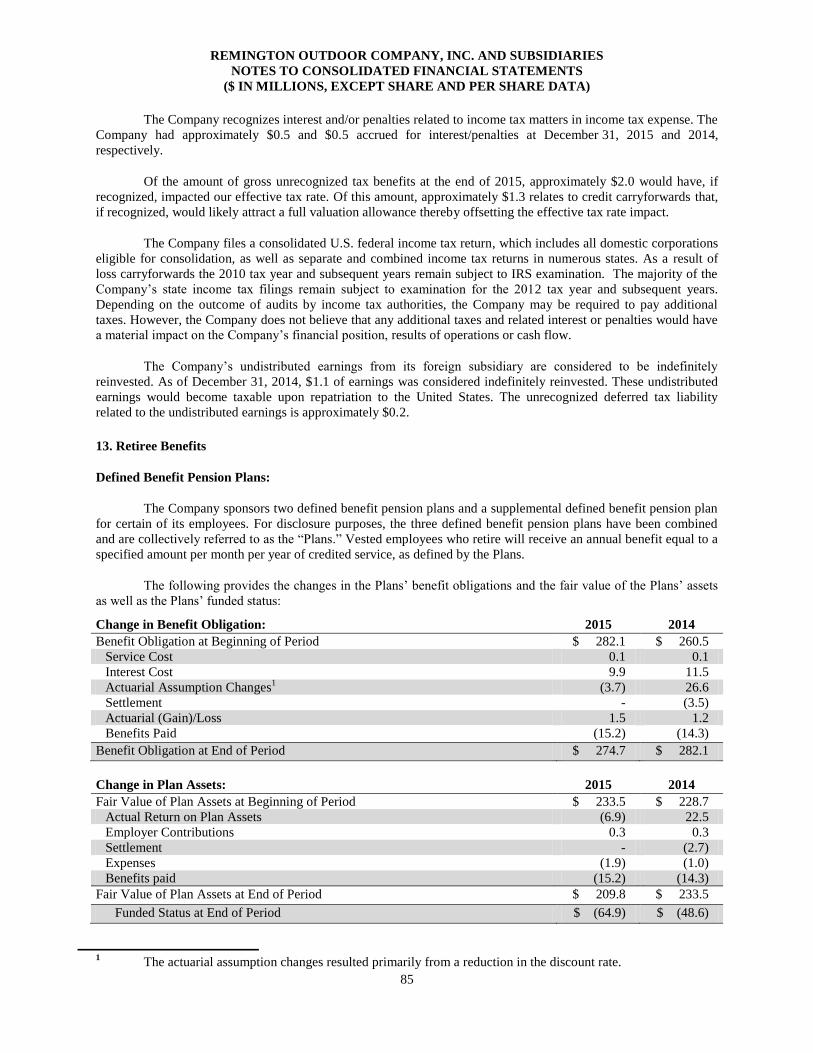
REMINGTON OUTDOOR COMPANY, INC. AND SUBSIDIARIES NOTES TO CONSOLIDATED FINANCIAL STATEMENTS
($ IN MILLIONS, EXCEPT SHARE AND PER SHARE DATA)
85
The Company recognizes interest and/or penalties related to income tax matters in income tax expense. The
Company had approximately $0.5 and $0.5 accrued for interest/penalties at December 31, 2015 and 2014,
respectively.
Of the amount of gross unrecognized tax benefits at the end of 2015, approximately $2.0 would have, if
recognized, impacted our effective tax rate. Of this amount, approximately $1.3 relates to credit carryforwards that,
if recognized, would likely attract a full valuation allowance thereby offsetting the effective tax rate impact.
The Company files a consolidated U.S. federal income tax return, which includes all domestic corporations
eligible for consolidation, as well as separate and combined income tax returns in numerous states. As a result of
loss carryforwards the 2010 tax year and subsequent years remain subject to IRS examination. The majority of the
Company’s state income tax filings remain subject to examination for the 2012 tax year and subsequent years.
Depending on the outcome of audits by income tax authorities, the Company may be required to pay additional
taxes. However, the Company does not believe that any additional taxes and related interest or penalties would have
a material impact on the Company’s financial position, results of operations or cash flow.
The Company’s undistributed earnings from its foreign subsidiary are considered to be indefinitely
reinvested. As of December 31, 2014, $1.1 of earnings was considered indefinitely reinvested. These undistributed
earnings would become taxable upon repatriation to the United States. The unrecognized deferred tax liability
related to the undistributed earnings is approximately $0.2.
13. Retiree Benefits
Defined Benefit Pension Plans:
The Company sponsors two defined benefit pension plans and a supplemental defined benefit pension plan
for certain of its employees. For disclosure purposes, the three defined benefit pension plans have been combined
and are collectively referred to as the “Plans.” Vested employees who retire will receive an annual benefit equal to a
specified amount per month per year of credited service, as defined by the Plans.
The following provides the changes in the Plans’ benefit obligations and the fair value of the Plans’ assets
as well as the Plans’ funded status:
Change in Benefit Obligation: 2015 2014
Benefit Obligation at Beginning of Period $ 282.1 $ 260.5
Service Cost 0.1 0.1
Interest Cost 9.9 11.5
Actuarial Assumption Changes1
(3.7) 26.6
Settlement - (3.5)
Actuarial (Gain)/Loss 1.5 1.2
Benefits Paid (15.2) (14.3)
Benefit Obligation at End of Period $ 274.7 $ 282.1
Change in Plan Assets: 2015 2014
Fair Value of Plan Assets at Beginning of Period $ 233.5 $ 228.7
Actual Return on Plan Assets (6.9) 22.5
Employer Contributions 0.3 0.3
Settlement - (2.7)
Expenses (1.9) (1.0)
Benefits paid (15.2) (14.3)
Fair Value of Plan Assets at End of Period $ 209.8 $ 233.5
Funded Status at End of Period $ (64.9) $ (48.6)
1
The actuarial assumption changes resulted primarily from a reduction in the discount rate.
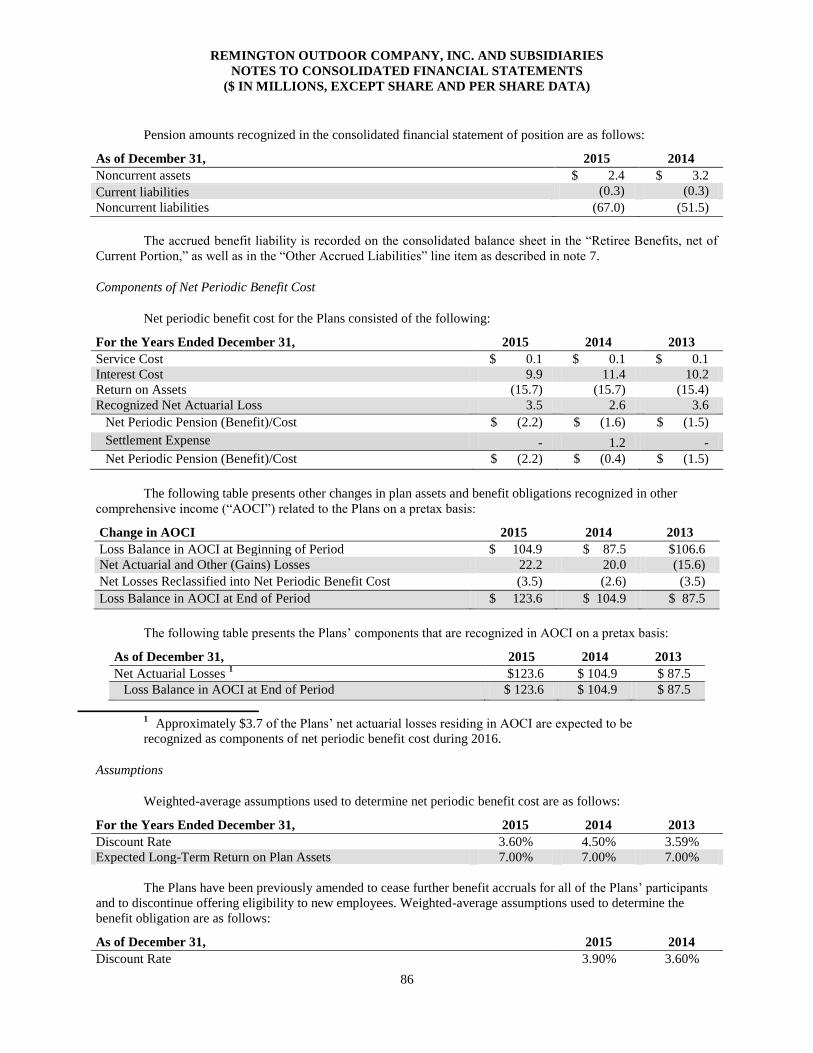
REMINGTON OUTDOOR COMPANY, INC. AND SUBSIDIARIES NOTES TO CONSOLIDATED FINANCIAL STATEMENTS
($ IN MILLIONS, EXCEPT SHARE AND PER SHARE DATA)
86
Pension amounts recognized in the consolidated financial statement of position are as follows:
As of December 31, 2015 2014
Noncurrent assets $ 2.4 $ 3.2
Current liabilities (0.3) (0.3)
Noncurrent liabilities (67.0) (51.5)
The accrued benefit liability is recorded on the consolidated balance sheet in the “Retiree Benefits, net of
Current Portion,” as well as in the “Other Accrued Liabilities” line item as described in note 7.
Components of Net Periodic Benefit Cost
Net periodic benefit cost for the Plans consisted of the following:
For the Years Ended December 31, 2015 2014 2013
Service Cost $ 0.1 $ 0.1 $ 0.1
Interest Cost 9.9 11.4 10.2
Return on Assets (15.7) (15.7) (15.4)
Recognized Net Actuarial Loss 3.5 2.6 3.6
Net Periodic Pension (Benefit)/Cost $ (2.2) $ (1.6) $ (1.5)
Settlement Expense - 1.2 -
Net Periodic Pension (Benefit)/Cost $ (2.2) $ (0.4) $ (1.5)
The following table presents other changes in plan assets and benefit obligations recognized in other
comprehensive income (“AOCI”) related to the Plans on a pretax basis:
Change in AOCI 2015 2014 2013
Loss Balance in AOCI at Beginning of Period $ 104.9 $ 87.5 $106.6
Net Actuarial and Other (Gains) Losses 22.2 20.0 (15.6)
Net Losses Reclassified into Net Periodic Benefit Cost (3.5) (2.6) (3.5)
Loss Balance in AOCI at End of Period $ 123.6 $ 104.9 $ 87.5
The following table presents the Plans’ components that are recognized in AOCI on a pretax basis:
As of December 31, 2015 2014 2013
Net Actuarial Losses 1
$123.6 $ 104.9 $ 87.5
Loss Balance in AOCI at End of Period $ 123.6 $ 104.9 $ 87.5
1
Approximately $3.7 of the Plans’ net actuarial losses residing in AOCI are expected to be
recognized as components of net periodic benefit cost during 2016.
Assumptions
Weighted-average assumptions used to determine net periodic benefit cost are as follows:
For the Years Ended December 31, 2015 2014 2013
Discount Rate 3.60% 4.50% 3.59%
Expected Long-Term Return on Plan Assets 7.00% 7.00% 7.00%
The Plans have been previously amended to cease further benefit accruals for all of the Plans’ participants
and to discontinue offering eligibility to new employees. Weighted-average assumptions used to determine the
benefit obligation are as follows:
As of December 31, 2015 2014
Discount Rate 3.90% 3.60%
REMINGTON OUTDOOR COMPANY, INC. AND SUBSIDIARIES NOTES TO CONSOLIDATED FINANCIAL STATEMENTS
($ IN MILLIONS, EXCEPT SHARE AND PER SHARE DATA)
87
Pension benefit income or expense is determined using assumptions as of the beginning of the year, while
the funded status is determined using assumptions as of the end of the year. The assumptions are determined by
management and established at the respective balance sheet date using the following principles: (1) the expected
long-term rate of return on plan assets is established based upon historical actual asset returns and the expectations
of asset returns over the expected period to fund participant benefits based on the current investment mix of the
Plans; and (2) the discount rate is set based on the yield of high quality fixed income investments expected to be
available in the future when cash flows are paid, adjusted for company specific characteristics. In addition,
management considers advice from independent actuaries on each of these assumptions.
Plan Assets
Our investment strategy for the Plans’ assets is based on the long-term growth of principal while attempting
to mitigate overall risk to ensure that funds are available to pay benefit obligations. The Plans have adopted a
strategic asset allocation designed to meet the Plans’ long-term obligations. The Plans’ target asset allocation are
12.5% domestic equity funds, 9.0% international equity funds, 5.5% of fixed income funds, 18.0% of alternative
investments, and 55.0% in a Liability Driven Investment program. Domestic equity funds primarily include
investments in large-cap and middle-cap companies located with the United States. International equity funds
primarily include large-cap, middle-cap, and small-cap companies located in developed and emerging countries.
Fixed income funds include corporate bonds and U.S. Treasuries. Alternative investments include hedge funds that
follow different strategies that are not currently subject to any direct regulation by the Securities and Exchange
Commission, the Financial Industry Regulatory Authority, or any other federal regulating commissions. Allowable
investment structures include mutual funds, separate accounts, commingled funds, and collective trust funds.
Prohibited investments are defined as commodities, private placements, and derivative instruments used solely for
leverage.
The accounting standards also establish a three-level hierarchy that prioritizes the inputs used in fair value
measurements. The hierarchy consists of three broad levels as follows:
Level 1 – Quoted market prices in active markets for identical assets or liabilities;
Level 2 – Observable inputs other than quoted prices within Level 1, such as quoted prices for similar
assets and liabilities in active markets; quoted prices for identical or similar assets and liabilities in markets
that are not active; or other inputs that are observable or can be corroborated by observable market data;
and
Level 3 – Unobservable inputs that are supported by little or no market activity and that are significant to
the fair value of the assets or liabilities. These include certain pricing models, discounted cash flow
methodologies and similar techniques that use significant unobservable inputs.
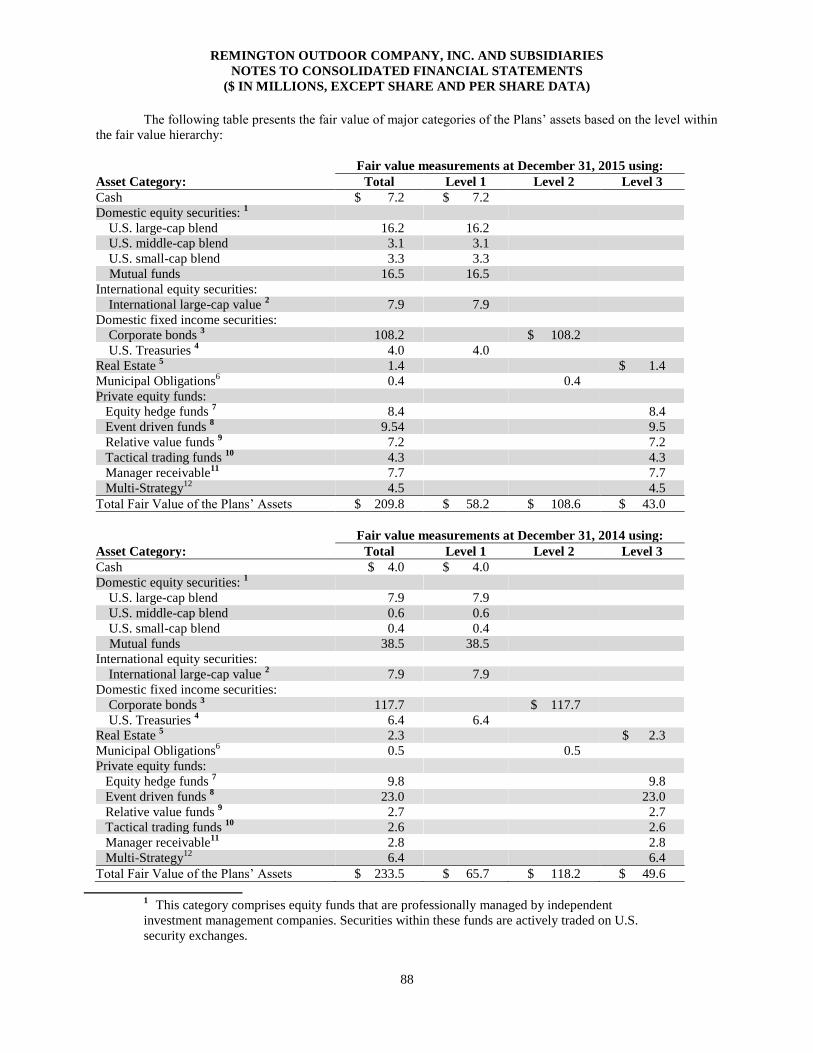
REMINGTON OUTDOOR COMPANY, INC. AND SUBSIDIARIES NOTES TO CONSOLIDATED FINANCIAL STATEMENTS
($ IN MILLIONS, EXCEPT SHARE AND PER SHARE DATA)
88
The following table presents the fair value of major categories of the Plans’ assets based on the level within
the fair value hierarchy:
Fair value measurements at December 31, 2015 using:
Asset Category: Total Level 1 Level 2 Level 3
Cash $ 7.2 $ 7.2
Domestic equity securities: 1
U.S. large-cap blend 16.2 16.2
U.S. middle-cap blend 3.1 3.1
U.S. small-cap blend 3.3 3.3
Mutual funds 16.5 16.5
International equity securities:
International large-cap value 2 7.9 7.9
Domestic fixed income securities:
Corporate bonds 3 108.2 $ 108.2
U.S. Treasuries 4 4.0 4.0
Real Estate 5 1.4 $ 1.4
Municipal Obligations6
0.4 0.4
Private equity funds:
Equity hedge funds 7 8.4 8.4
Event driven funds 8 9.54 9.5
Relative value funds 9 7.2 7.2
Tactical trading funds 10
4.3 4.3
Manager receivable11
7.7 7.7
Multi-Strategy12
4.5 4.5
Total Fair Value of the Plans’ Assets $ 209.8 $ 58.2 $ 108.6 $ 43.0
Fair value measurements at December 31, 2014 using:
Asset Category: Total Level 1 Level 2 Level 3
Cash $ 4.0 $ 4.0
Domestic equity securities: 1
U.S. large-cap blend 7.9 7.9
U.S. middle-cap blend 0.6 0.6
U.S. small-cap blend 0.4 0.4
Mutual funds 38.5 38.5
International equity securities:
International large-cap value 2 7.9 7.9
Domestic fixed income securities:
Corporate bonds 3 117.7 $ 117.7
U.S. Treasuries 4 6.4 6.4
Real Estate 5 2.3 $ 2.3
Municipal Obligations6
0.5 0.5
Private equity funds:
Equity hedge funds 7 9.8 9.8
Event driven funds 8 23.0 23.0
Relative value funds 9 2.7 2.7
Tactical trading funds 10
2.6 2.6
Manager receivable11
2.8 2.8
Multi-Strategy12
6.4 6.4
Total Fair Value of the Plans’ Assets $ 233.5 $ 65.7 $ 118.2 $ 49.6
1
This category comprises equity funds that are professionally managed by independent
investment management companies. Securities within these funds are actively traded on U.S.
security exchanges.
REMINGTON OUTDOOR COMPANY, INC. AND SUBSIDIARIES NOTES TO CONSOLIDATED FINANCIAL STATEMENTS
($ IN MILLIONS, EXCEPT SHARE AND PER SHARE DATA)
89
2
This category comprises equity funds that are professionally managed by independent
investment management companies. Securities within these funds are actively traded on
international security exchanges.
3
This category comprises investment grade bonds of U.S. issuers from multiple industries.
Maturities within these funds range between 1 to 20 years with bond ratings ranging from AAA to
ABB.
4
This category comprises U.S. Treasury Bills and Notes. Maturities within these funds range
between 3 months to 20 years.
5
This category is comprised of Real Estate Investment Trust (REIT) which seeks to pool capital
from investors to purchase and manage property.
6
This category is used to hedge US equities to protect against a large decline in equity markets.
Liquid option contracts are used to help offset unforeseen events that can occur in financial
markets that can cause adverse price movements in securities that we are invested in or similar
securities to what we are invested in.
7 This category comprises hedge funds that invest in both long and short positions in domestic
common stocks. These funds are professionally managed by independent investment management
companies who have the ability to switch from value to growth strategies. These funds invest in
large-cap, middle-cap, and small-cap companies.
8 This category comprises hedge funds that invest in both credit and debt related positions in
international common stocks which may not be actively traded on international security
exchanges. These funds are professionally managed by independent investment management
companies who have the ability to switch from debt focus to multi-strategy focus.
9
This category of funds invests in convertible arbitrage which seeks growth. These funds are
professionally managed by independent investment management companies by engaging in
mergers and acquisitions.
10
This category invests in strategies that speculate on the direction of market prices of currencies,
commodities, equities and or bonds. These funds are professionally managed by independent
investment management companies.
11 This category consists of funds that have been redeemed and are awaiting the receipt of cash.
12 This category invests in private alternative investment vehicles managed by professional money
managers.
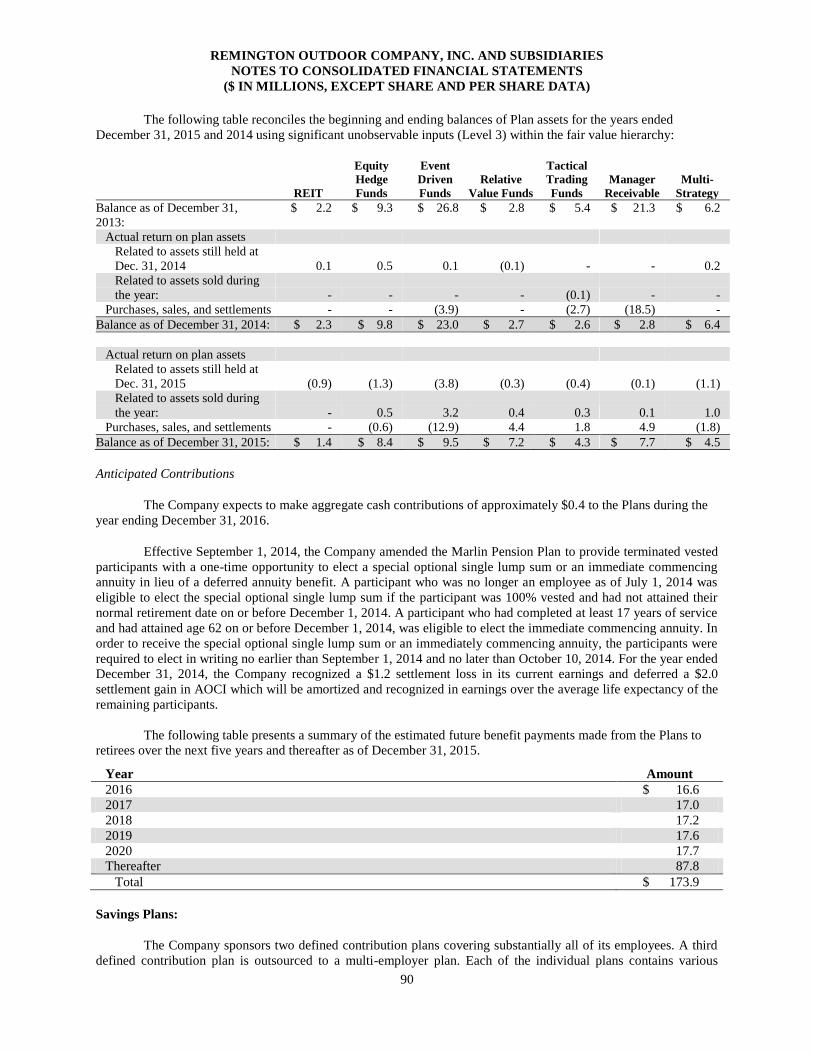
REMINGTON OUTDOOR COMPANY, INC. AND SUBSIDIARIES NOTES TO CONSOLIDATED FINANCIAL STATEMENTS
($ IN MILLIONS, EXCEPT SHARE AND PER SHARE DATA)
90
The following table reconciles the beginning and ending balances of Plan assets for the years ended
December 31, 2015 and 2014 using significant unobservable inputs (Level 3) within the fair value hierarchy:
REIT
Equity
Hedge
Funds
Event
Driven
Funds
Relative
Value Funds
Tactical
Trading
Funds
Manager
Receivable
Multi-
Strategy
Balance as of December 31,
2013:
$ 2.2 $ 9.3 $ 26.8 $ 2.8 $ 5.4 $ 21.3 $ 6.2
Actual return on plan assets
Related to assets still held at
Dec. 31, 2014 0.1 0.5 0.1 (0.1) - - 0.2
Related to assets sold during
the year: - - - - (0.1) - -
Purchases, sales, and settlements - - (3.9) - (2.7) (18.5) -
Balance as of December 31, 2014: $ 2.3 $ 9.8 $ 23.0 $ 2.7 $ 2.6 $ 2.8 $ 6.4
Actual return on plan assets
Related to assets still held at
Dec. 31, 2015 (0.9) (1.3) (3.8) (0.3) (0.4) (0.1) (1.1)
Related to assets sold during
the year: - 0.5 3.2 0.4 0.3 0.1 1.0
Purchases, sales, and settlements - (0.6) (12.9) 4.4 1.8 4.9 (1.8)
Balance as of December 31, 2015: $ 1.4 $ 8.4 $ 9.5 $ 7.2 $ 4.3 $ 7.7 $ 4.5
Anticipated Contributions
The Company expects to make aggregate cash contributions of approximately $0.4 to the Plans during the
year ending December 31, 2016.
Effective September 1, 2014, the Company amended the Marlin Pension Plan to provide terminated vested
participants with a one-time opportunity to elect a special optional single lump sum or an immediate commencing
annuity in lieu of a deferred annuity benefit. A participant who was no longer an employee as of July 1, 2014 was
eligible to elect the special optional single lump sum if the participant was 100% vested and had not attained their
normal retirement date on or before December 1, 2014. A participant who had completed at least 17 years of service
and had attained age 62 on or before December 1, 2014, was eligible to elect the immediate commencing annuity. In
order to receive the special optional single lump sum or an immediately commencing annuity, the participants were
required to elect in writing no earlier than September 1, 2014 and no later than October 10, 2014. For the year ended
December 31, 2014, the Company recognized a $1.2 settlement loss in its current earnings and deferred a $2.0
settlement gain in AOCI which will be amortized and recognized in earnings over the average life expectancy of the
remaining participants.
The following table presents a summary of the estimated future benefit payments made from the Plans to
retirees over the next five years and thereafter as of December 31, 2015.
Year Amount
2016 $ 16.6
2017 17.0
2018 17.2
2019 17.6
2020 17.7
Thereafter 87.8
Total $ 173.9
Savings Plans:
The Company sponsors two defined contribution plans covering substantially all of its employees. A third
defined contribution plan is outsourced to a multi-employer plan. Each of the individual plans contains various
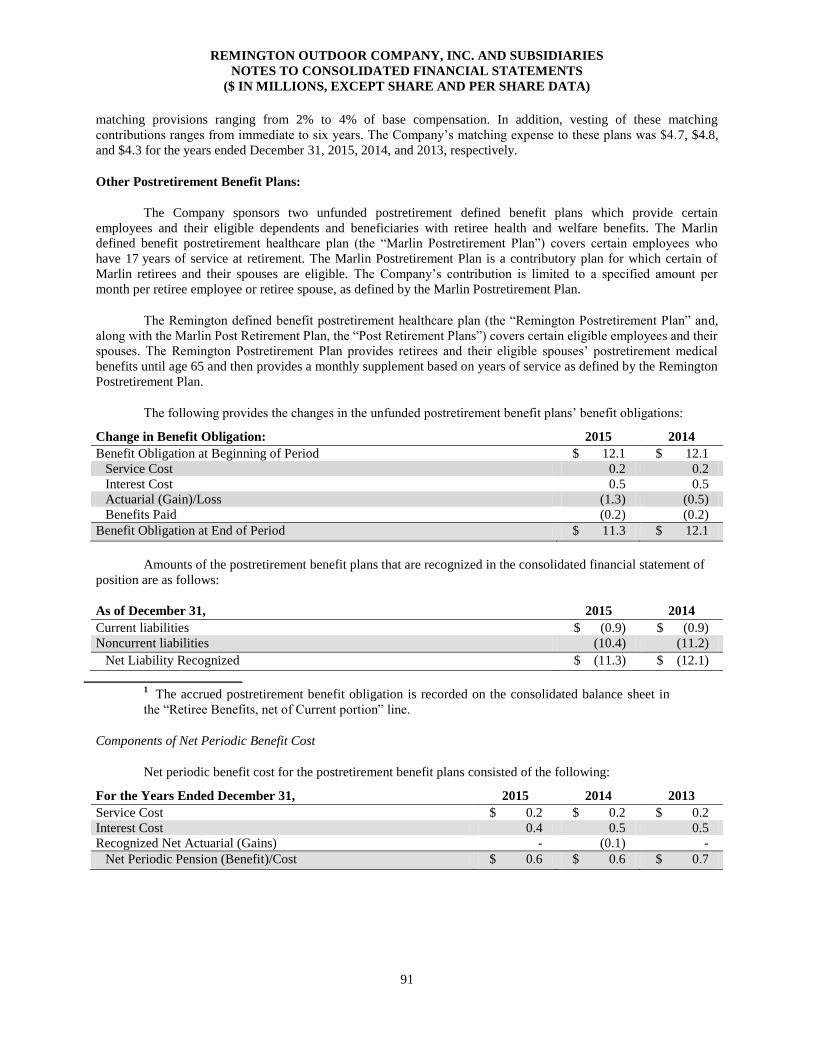
REMINGTON OUTDOOR COMPANY, INC. AND SUBSIDIARIES NOTES TO CONSOLIDATED FINANCIAL STATEMENTS
($ IN MILLIONS, EXCEPT SHARE AND PER SHARE DATA)
91
matching provisions ranging from 2% to 4% of base compensation. In addition, vesting of these matching
contributions ranges from immediate to six years. The Company’s matching expense to these plans was $4.7, $4.8,
and $4.3 for the years ended December 31, 2015, 2014, and 2013, respectively.
Other Postretirement Benefit Plans:
The Company sponsors two unfunded postretirement defined benefit plans which provide certain
employees and their eligible dependents and beneficiaries with retiree health and welfare benefits. The Marlin
defined benefit postretirement healthcare plan (the “Marlin Postretirement Plan”) covers certain employees who
have 17 years of service at retirement. The Marlin Postretirement Plan is a contributory plan for which certain of
Marlin retirees and their spouses are eligible. The Company’s contribution is limited to a specified amount per
month per retiree employee or retiree spouse, as defined by the Marlin Postretirement Plan.
The Remington defined benefit postretirement healthcare plan (the “Remington Postretirement Plan” and,
along with the Marlin Post Retirement Plan, the “Post Retirement Plans”) covers certain eligible employees and their
spouses. The Remington Postretirement Plan provides retirees and their eligible spouses’ postretirement medical
benefits until age 65 and then provides a monthly supplement based on years of service as defined by the Remington
Postretirement Plan.
The following provides the changes in the unfunded postretirement benefit plans’ benefit obligations:
Change in Benefit Obligation: 2015 2014
Benefit Obligation at Beginning of Period $ 12.1 $ 12.1
Service Cost 0.2 0.2
Interest Cost 0.5 0.5
Actuarial (Gain)/Loss (1.3) (0.5)
Benefits Paid (0.2) (0.2)
Benefit Obligation at End of Period $ 11.3 $ 12.1
Amounts of the postretirement benefit plans that are recognized in the consolidated financial statement of
position are as follows:
As of December 31, 2015 2014
Current liabilities $ (0.9) $ (0.9)
Noncurrent liabilities (10.4) (11.2)
Net Liability Recognized $ (11.3) $ (12.1)
1
The accrued postretirement benefit obligation is recorded on the consolidated balance sheet in
the “Retiree Benefits, net of Current portion” line.
Components of Net Periodic Benefit Cost
Net periodic benefit cost for the postretirement benefit plans consisted of the following:
For the Years Ended December 31, 2015 2014 2013
Service Cost $ 0.2 $ 0.2 $ 0.2
Interest Cost 0.4 0.5 0.5
Recognized Net Actuarial (Gains) - (0.1) -
Net Periodic Pension (Benefit)/Cost $ 0.6 $ 0.6 $ 0.7
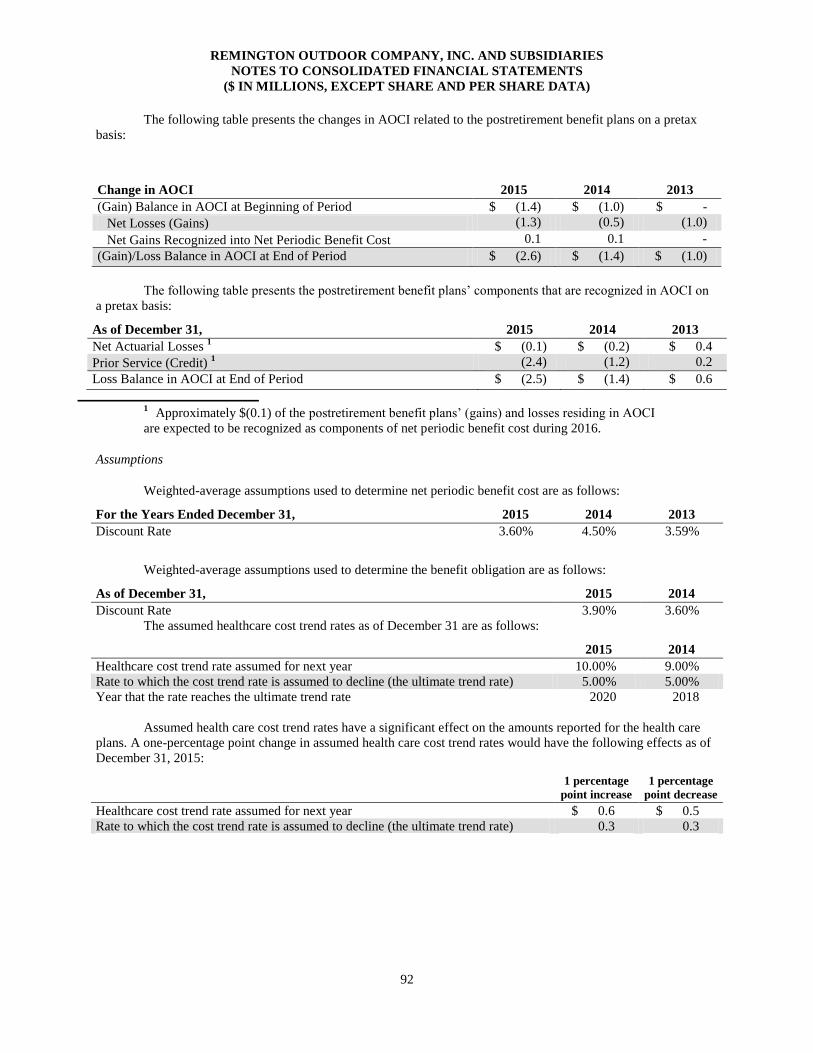
REMINGTON OUTDOOR COMPANY, INC. AND SUBSIDIARIES NOTES TO CONSOLIDATED FINANCIAL STATEMENTS
($ IN MILLIONS, EXCEPT SHARE AND PER SHARE DATA)
92
The following table presents the changes in AOCI related to the postretirement benefit plans on a pretax
basis:
Change in AOCI 2015 2014 2013
(Gain) Balance in AOCI at Beginning of Period $ (1.4) $ (1.0) $ -
Net Losses (Gains) (1.3) (0.5) (1.0)
Net Gains Recognized into Net Periodic Benefit Cost 0.1 0.1 -
(Gain)/Loss Balance in AOCI at End of Period $ (2.6) $ (1.4) $ (1.0)
The following table presents the postretirement benefit plans’ components that are recognized in AOCI on
a pretax basis:
As of December 31, 2015 2014 2013
Net Actuarial Losses 1
$ (0.1) $ (0.2) $ 0.4
Prior Service (Credit) 1 (2.4) (1.2) 0.2
Loss Balance in AOCI at End of Period $ (2.5) $ (1.4) $ 0.6
1
Approximately $(0.1) of the postretirement benefit plans’ (gains) and losses residing in AOCI
are expected to be recognized as components of net periodic benefit cost during 2016.
Assumptions
Weighted-average assumptions used to determine net periodic benefit cost are as follows:
For the Years Ended December 31, 2015 2014 2013
Discount Rate 3.60% 4.50% 3.59%
Weighted-average assumptions used to determine the benefit obligation are as follows:
As of December 31, 2015 2014
Discount Rate 3.90% 3.60%
The assumed healthcare cost trend rates as of December 31 are as follows:
2015 2014
Healthcare cost trend rate assumed for next year 10.00% 9.00%
Rate to which the cost trend rate is assumed to decline (the ultimate trend rate) 5.00% 5.00%
Year that the rate reaches the ultimate trend rate 2020 2018
Assumed health care cost trend rates have a significant effect on the amounts reported for the health care
plans. A one-percentage point change in assumed health care cost trend rates would have the following effects as of
December 31, 2015:
1 percentage
point increase
1 percentage
point decrease
Healthcare cost trend rate assumed for next year $ 0.6 $ 0.5
Rate to which the cost trend rate is assumed to decline (the ultimate trend rate) 0.3 0.3
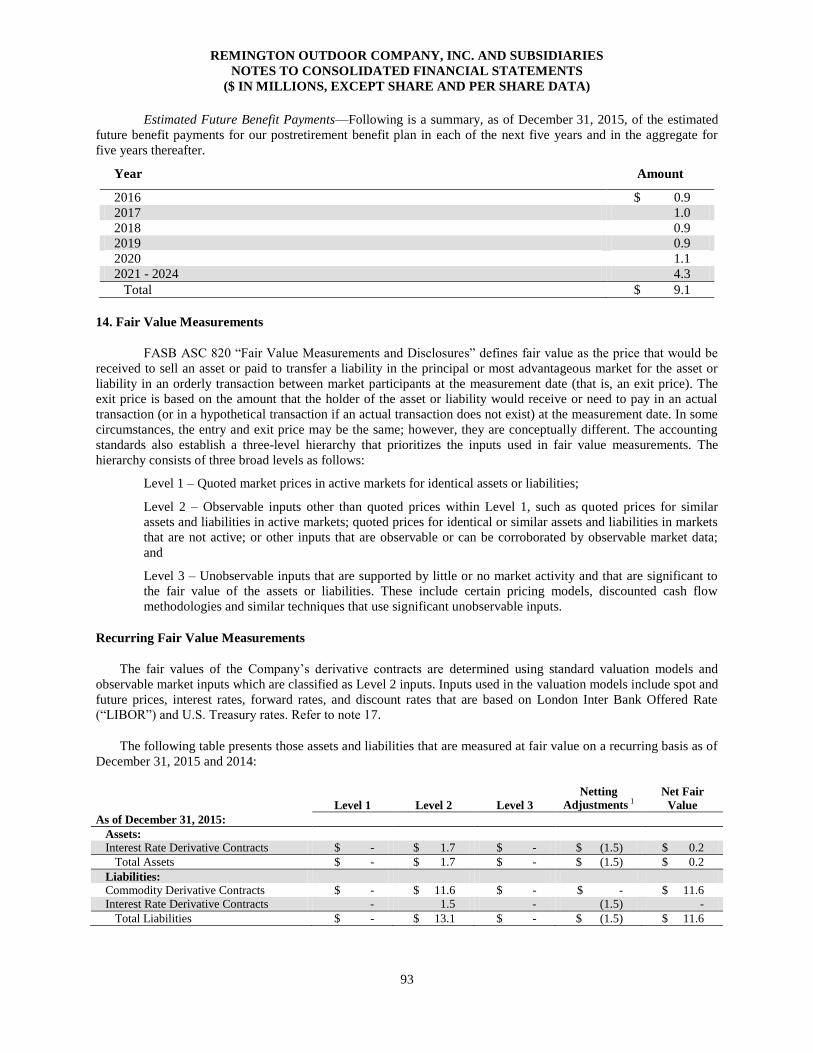
REMINGTON OUTDOOR COMPANY, INC. AND SUBSIDIARIES NOTES TO CONSOLIDATED FINANCIAL STATEMENTS
($ IN MILLIONS, EXCEPT SHARE AND PER SHARE DATA)
93
Estimated Future Benefit Payments—Following is a summary, as of December 31, 2015, of the estimated
future benefit payments for our postretirement benefit plan in each of the next five years and in the aggregate for
five years thereafter.
Year Amount
2016 $ 0.9
2017 1.0
2018 0.9
2019 0.9
2020 1.1
2021 - 2024 4.3
Total $ 9.1
14. Fair Value Measurements
FASB ASC 820 “Fair Value Measurements and Disclosures” defines fair value as the price that would be
received to sell an asset or paid to transfer a liability in the principal or most advantageous market for the asset or
liability in an orderly transaction between market participants at the measurement date (that is, an exit price). The
exit price is based on the amount that the holder of the asset or liability would receive or need to pay in an actual
transaction (or in a hypothetical transaction if an actual transaction does not exist) at the measurement date. In some
circumstances, the entry and exit price may be the same; however, they are conceptually different. The accounting
standards also establish a three-level hierarchy that prioritizes the inputs used in fair value measurements. The
hierarchy consists of three broad levels as follows:
Level 1 – Quoted market prices in active markets for identical assets or liabilities;
Level 2 – Observable inputs other than quoted prices within Level 1, such as quoted prices for similar
assets and liabilities in active markets; quoted prices for identical or similar assets and liabilities in markets
that are not active; or other inputs that are observable or can be corroborated by observable market data;
and
Level 3 – Unobservable inputs that are supported by little or no market activity and that are significant to
the fair value of the assets or liabilities. These include certain pricing models, discounted cash flow
methodologies and similar techniques that use significant unobservable inputs.
Recurring Fair Value Measurements
The fair values of the Company’s derivative contracts are determined using standard valuation models and
observable market inputs which are classified as Level 2 inputs. Inputs used in the valuation models include spot and
future prices, interest rates, forward rates, and discount rates that are based on London Inter Bank Offered Rate
(“LIBOR”) and U.S. Treasury rates. Refer to note 17.
The following table presents those assets and liabilities that are measured at fair value on a recurring basis as of
December 31, 2015 and 2014:
Level 1 Level 2 Level 3
Netting
Adjustments 1 Net Fair
Value
As of December 31, 2015:
Assets:
Interest Rate Derivative Contracts $ - $ 1.7 $ - $ (1.5) $ 0.2
Total Assets $ - $ 1.7 $ - $ (1.5) $ 0.2
Liabilities:
Commodity Derivative Contracts $ - $ 11.6 $ - $ - $ 11.6
Interest Rate Derivative Contracts - 1.5 - (1.5) -
Total Liabilities $ - $ 13.1 $ - $ (1.5) $ 11.6
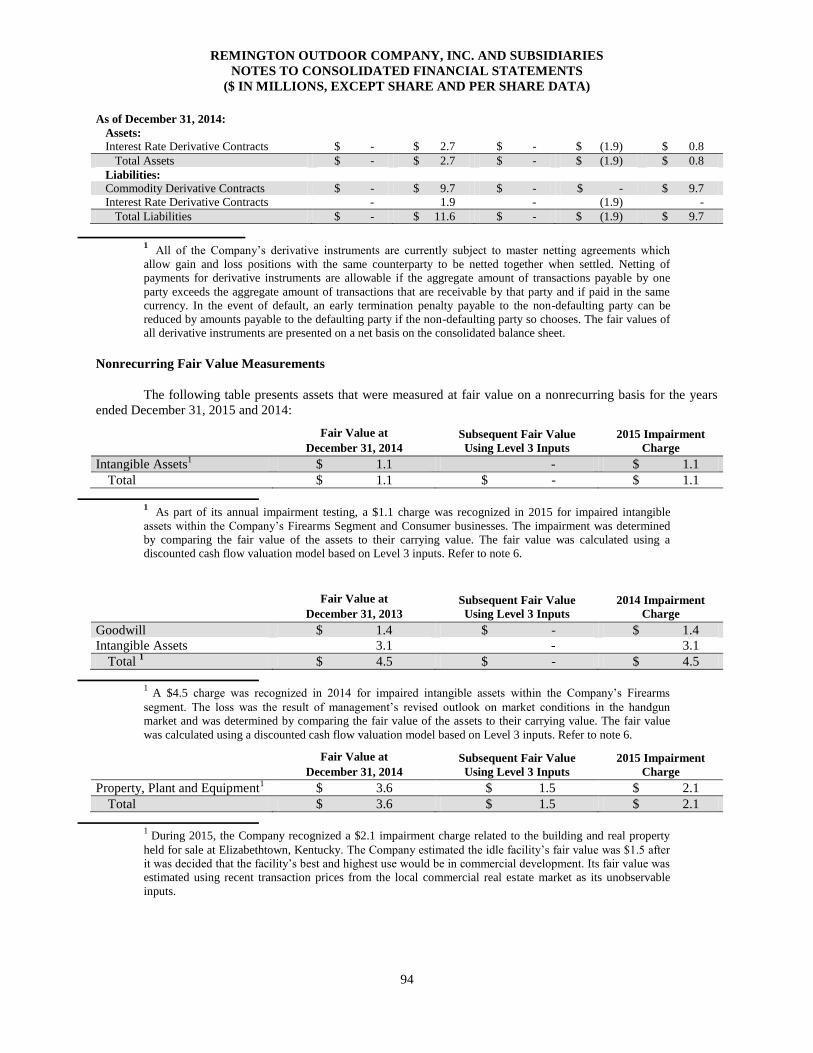
REMINGTON OUTDOOR COMPANY, INC. AND SUBSIDIARIES NOTES TO CONSOLIDATED FINANCIAL STATEMENTS
($ IN MILLIONS, EXCEPT SHARE AND PER SHARE DATA)
94
As of December 31, 2014:
Assets:
Interest Rate Derivative Contracts $ - $ 2.7 $ - $ (1.9) $ 0.8
Total Assets $ - $ 2.7 $ - $ (1.9) $ 0.8
Liabilities:
Commodity Derivative Contracts $ - $ 9.7 $ - $ - $ 9.7
Interest Rate Derivative Contracts - 1.9 - (1.9) -
Total Liabilities $ - $ 11.6 $ - $ (1.9) $ 9.7
1 All of the Company’s derivative instruments are currently subject to master netting agreements which
allow gain and loss positions with the same counterparty to be netted together when settled. Netting of
payments for derivative instruments are allowable if the aggregate amount of transactions payable by one
party exceeds the aggregate amount of transactions that are receivable by that party and if paid in the same
currency. In the event of default, an early termination penalty payable to the non-defaulting party can be
reduced by amounts payable to the defaulting party if the non-defaulting party so chooses. The fair values of
all derivative instruments are presented on a net basis on the consolidated balance sheet.
Nonrecurring Fair Value Measurements
The following table presents assets that were measured at fair value on a nonrecurring basis for the years
ended December 31, 2015 and 2014:
Fair Value at
December 31, 2014
Subsequent Fair Value
Using Level 3 Inputs
2015 Impairment
Charge
Intangible Assets1 $ 1.1 - $ 1.1
Total
$ 1.1 $ - $ 1.1
1
As part of its annual impairment testing, a $1.1 charge was recognized in 2015 for impaired intangible
assets within the Company’s Firearms Segment and Consumer businesses. The impairment was determined
by comparing the fair value of the assets to their carrying value. The fair value was calculated using a
discounted cash flow valuation model based on Level 3 inputs. Refer to note 6.
Fair Value at
December 31, 2013
Subsequent Fair Value
Using Level 3 Inputs
2014 Impairment
Charge
Goodwill
$ 1.4 $ - $ 1.4
Intangible Assets 3.1 - 3.1
Total 1
$ 4.5 $ - $ 4.5
1
A $4.5 charge was recognized in 2014 for impaired intangible assets within the Company’s Firearms
segment. The loss was the result of management’s revised outlook on market conditions in the handgun
market and was determined by comparing the fair value of the assets to their carrying value. The fair value
was calculated using a discounted cash flow valuation model based on Level 3 inputs. Refer to note 6.
Fair Value at
December 31, 2014
Subsequent Fair Value
Using Level 3 Inputs
2015 Impairment
Charge
Property, Plant and Equipment1 $ 3.6 $ 1.5 $ 2.1
Total
$ 3.6 $ 1.5 $ 2.1
1
During 2015, the Company recognized a $2.1 impairment charge related to the building and real property
held for sale at Elizabethtown, Kentucky. The Company estimated the idle facility’s fair value was $1.5 after
it was decided that the facility’s best and highest use would be in commercial development. Its fair value was
estimated using recent transaction prices from the local commercial real estate market as its unobservable
inputs.
REMINGTON OUTDOOR COMPANY, INC. AND SUBSIDIARIES NOTES TO CONSOLIDATED FINANCIAL STATEMENTS
($ IN MILLIONS, EXCEPT SHARE AND PER SHARE DATA)
95
Fair Values of Other Financial Instruments
Fair value measurements, hierarchy levels, valuation techniques, and unobservable input disclosures for the
Company’s pension plans’ assets are disclosed in note 13. Although the Company makes contributions to its pension
plans, it does not maintain control of the plans’ assets as each plan is its own reporting entity. However, actual
returns on the plans’ assets have a direct effect on the Company’s net periodic benefit cost and recognized amounts
on its consolidated balance sheet.
Due to their liquid nature, the carrying values of cash and cash equivalents, accounts receivable, accounts
payable, and other accrued liabilities are considered representative of their fair values. The estimated fair value of
the Company’s debt was $637.9 and $813.2 as of December 31, 2015 and 2014, respectively. The carrying value of
the Company’s debt was $839.1 and $836.3 as of December 31, 2015 and 2014, respectively. The fair value of the
Company’s fixed rate notes was measured using the active quoted trading price of its notes at December 31, 2015
and 2014, which are considered Level 2 inputs.
15. Related Party Transactions
The Company paid Meritage Capital Advisors, LLC (“Meritage”) fees totaling zero, $4.6, and $0.6 in 2015,
2014, and 2013, respectively, in connection with transaction advisory services. A former member of the Board is a
managing director of Meritage.
The Company paid Cerberus Operations and Advisory Company, LLC, an affiliate of Cerberus Capital
Management, L.P. (“Cerberus”), fees totaling $4.1, $1.0, and $1.8 in 2015, 2014, and 2013, respectively, for
consulting services provided in connection with improving operations.
The Company purchased certain products totaling approximately $2.4, $3.2 and $9.8 from other entities
affiliated through common ownership in 2015, 2014, and 2013, respectively.
The Company paid approximately $0.5, $0.5, and $0.4 in 2015, 2014, and 2013, respectively in connection
with certain operating leases to an entity where the owner is a former employee of the Company.
The Company paid approximately $0.8, $0.6 and zero in 2015, 2014 and 2013, respectively, in connection
with certain construction related projects to an entity where the owner has a business relationship with a former
employee of the Company.
16. Commitments and Contingencies
Purchase Commitments
The Company has various purchase commitments, approximating $4.5, $0.7, $0.5, zero and zero for 2016,
2017, 2018, 2019 and 2020, respectively, for services incidental to the ordinary conduct of business, including,
among other things, a services contract with its third party warehouse provider. Such commitments are not at prices
in excess of current market prices. Included in the purchase commitment amounts are the Company’s purchase
contracts with certain raw materials suppliers, for periods ranging from one to four years, some of which contain
firm commitments to purchase minimum specified quantities.
Product Related Litigation
Remington entered into an Asset Purchase Agreement (the “1993 Purchase Agreement”) with E.I. DuPont
Nemours & Company (“DuPont”) and its affiliates (collectively, the “1993 Sellers”) in 1993 (the “1993 Asset
Purchase”). As a result of this agreement and other contractual arrangements, the Company manages the joint
defense of product liability litigation involving Remington brand firearms and the Company’s ammunition products
for both Remington and the 1993 Sellers. As of December 31, 2015, we had a number of individual bodily injury
cases and pre-litigation claims in various stages pending, primarily alleging defective product design, defective
manufacture and/or failure to provide adequate warnings; some of these cases seek punitive as well as compensatory
REMINGTON OUTDOOR COMPANY, INC. AND SUBSIDIARIES NOTES TO CONSOLIDATED FINANCIAL STATEMENTS
($ IN MILLIONS, EXCEPT SHARE AND PER SHARE DATA)
96
damages. The Company has previously disposed of a number of other cases involving post-1993 Asset Purchase
occurrences by settlement. The 41 pending cases and pre-litigation claims involve post-1993 Asset Purchase
occurrences for which the Company bears responsibility under the 1993 Purchase Agreement.
The relief sought in individual cases includes compensatory and, sometimes, punitive damages. Certain of
the claims and cases seek unspecified compensatory and/or punitive damages. In others, compensatory damages
sought may range from less than $0.1 to in excess of $1.0 and punitive damages sought may exceed $1.0. Of the
individual post-1993 Asset Purchase bodily injury cases and claims pending as of December 31, 2015, the plaintiffs
and claimants seek either compensatory and/or punitive damages in unspecified amounts or in amounts within these
general ranges. In the Company’s experience, initial demands do not generally bear a reasonable relationship to the
facts and circumstances of a particular matter, and in any event, are typically reduced significantly as a case
proceeds. The Company believes that its accruals for product liability cases and claims, as described below, are a
reasonable quantitative measure of the cost to it of product liability cases and claims.
At December 31, 2015 and 2014, the Company’s accrual for product liability cases and claims was $26.2
and $18.3, respectively. The amount of the Company’s accrual for product liability cases and claims is based upon
estimates developed as follows. The Company establishes reserves for anticipated defense and disposition costs of
those pending cases and claims for which it is financially responsible. Based on those estimates and an actuarial
analysis of actual defense and disposition costs incurred by the Company with respect to product liability cases and
claims in recent years, the Company determines the estimated defense and disposition costs for unasserted product
liability cases and claims. The Company combines the estimated defense and disposition costs for both pending
cases and threatened, but unasserted claims to determine the amount of the Company’s accrual for product liability
cases and claims. It is reasonably possible additional experience could result in further increases or decreases in the
period in which such information is made available. The Company believes that its accruals for losses relating to
such cases and claims are adequate. The Company’s accruals for losses relating to product liability cases and claims
include accruals for all probable losses the amount of which can be reasonably estimated. Based on the relevant
circumstances (including the current availability of insurance for personal injury and property damage with respect
to cases and claims involving occurrences arising after the 1993 Asset Purchase, the Company’s accruals for the
uninsured costs of such cases and claims and the 1993 Sellers’ agreement to be responsible for a portion of certain
post-1993 Asset Purchase shotgun-related product liability costs, as well as the type of firearms products that the
Company makes), the Company does not believe with respect to product liability cases and claims that any probable
loss exceeding amounts already recognized through the Company’s accruals has been incurred.
Product Safety Warning
In April 2014, the Company announced a product safety warning and recall notice directed towards the
public and its consumers concerning rifles with X-Mark Pro® (“XMP®”) triggers, manufactured from May 1, 2006
to April 9, 2014. In 2014, the Company expensed $30.9 associated with the product safety warning and recall notice.
This expense was recognized in cost of goods sold in the Company’s consolidated statement of operations. Actual
costs related to these actions will depend on several factors, including the number of consumers who respond to the
recall and the costs of administration of the program. We are continually evaluating these factors.
Settlement Reserve
In December 2014, pending court approval, the Company entered into an agreement to settle the economic
loss claims related to the rifle with the Walker Fire Control trigger. Through December 31, 2015, the Company has
expensed $29.7 associated with the settlement reserve, of which $24.7 was expensed in the year ended December
31, 2014 and $5.0 was expensed in the year ended December 31, 2013. This expense was recognized in
administrative expenses in the Company’s consolidated statement of operations.
Litigation Outlook
The Company is involved in lawsuits, claims, investigations and proceedings, including commercial,
environmental and employment matters, which arise in the ordinary course of business. From late 2012 through
2013, five class actions alleging economic harm were filed in four states (Florida, Missouri (two filings),
REMINGTON OUTDOOR COMPANY, INC. AND SUBSIDIARIES NOTES TO CONSOLIDATED FINANCIAL STATEMENTS
($ IN MILLIONS, EXCEPT SHARE AND PER SHARE DATA)
97
Washington and Montana), all of which alleged claims of economic harm to gun owners due to an alleged defect.
The Company believed all of these cases were without merit and has vigorously defended them. However, in order
to avoid the uncertainties and expense of protracted litigation, following mediation, Remington and the plaintiffs
entered into settlement discussions. Three of the cases have been voluntarily dismissed without prejudice pending
the outcome of the potential settlement and the remaining two class actions are still pending. In late 2014, we
entered into a Settlement Agreement for the economic loss claims related to the trigger connector and claims related
to the product safety warning and recall. The parties requested settlement approval from the Court, and thereafter
received preliminary approval. The parties are working to respond to certain requests from the Court and are
currently anticipating final approval will be received in the second quarter of 2016.
Two former employees filed suit against Remington in the federal court for the Southern District of New
York in 2012 alleging breach of their employment agreements and failure to pay earn-outs. In January 2014, the
district court entered its decision finding in favor of these employees. The case was appealed to the United States
Court of Appeals for the Second Circuit and the appellate court affirmed the trial court’s decision in an opinion in
June 2015. In the third quarter of 2015, Remington paid the $10.5 million settlement as affirmed by the United
Statements Court of Appeals for the Second Circuit.
Environmental
The Company does not expect current environmental regulations to have a material adverse effect on its
financial condition, results of operations or cash flows. However, the Company’s liability for future environmental
remediation costs is subject to considerable uncertainty due to the complex, ongoing and evolving process of
identifying the necessity for, and generating cost estimates for, remedial work. Furthermore, there can be no
assurance that environmental regulations will not become more restrictive in the future. We have also conducted
remediation activities at our former facilities. Costs for remediation are not expected to be material.
Leases
Future minimum lease payments under noncancellable operating leases having initial or remaining terms in
excess of one year are presented in the following table:
Years Ending December 31, Operating Lease Payments
2016 $ 2.1
2017 1.2
2018 1.1
2019 1.1
2020 0.4
Thereafter 0.5
Total minimum operating lease payments $ 6.4
Operating lease expense for the periods ended December 31, 2015, 2014, and 2013 were $16.4, $12.5, and
$4.9, respectively. The present value of future minimum lease payments under capital lease arrangements was $0.3
as of December 31, 2015 and will be satisfied over the next two years.
17. Derivatives
The Company’s activities are exposed to several market risks which could have an adverse effect on its
earnings and financial performance. As part of the Company’s risk management program, these market risks are
continually monitored and managed and the Company frequently utilizes derivative instruments to mitigate the
effects of those market risks. Commodity swap contracts are used to minimize price risk associated with the
purchase of raw materials used in its manufacturing. Interest rate swaps are used to minimize interest rate risk
associated with the Company’s variable-rate debt. Foreign currency swaps are used to mitigate foreign currency
exchange rate risks associated with sales and procurement activities that are denominated in currencies other than
the U.S Dollar. Commodity swap contracts are agreements to buy and sell a quantity of commodities at
predetermined prices on predetermined future dates. An interest rate swap is an agreement between two parties to
exchange streams of future interest cash flows based on a specified principal amount. A foreign currency swap is an
REMINGTON OUTDOOR COMPANY, INC. AND SUBSIDIARIES NOTES TO CONSOLIDATED FINANCIAL STATEMENTS
($ IN MILLIONS, EXCEPT SHARE AND PER SHARE DATA)
98
agreement between two parties to exchange two currencies on a specified date at a specified exchange rate. The
Company does not enter into derivative instruments for trading or speculative purposes.
On the date that the Company enters into derivative contracts, it documents and designates all relationships
between the derivative instrument and the hedged item, as well as its risk management objective and strategy. All
derivative instruments are recognized at their fair value on the Company’s consolidated balance sheet in the
applicable line items: prepaid expenses and miscellaneous receivables; other assets; accounts payable; accrued
expenses; and other long-term liabilities. For those derivative instruments subject to master netting agreements
where netting of payments is allowable, the fair values of derivative transactions are presented on a net basis in the
consolidated balance sheet. For those derivative instruments subject to master netting agreements where netting of
payments is not allowable or that are not subject to master netting agreements, the fair values of derivative
transactions are presented on a gross basis in the consolidated balance sheet. The fair value amounts recognized for
derivative instruments are offset against the fair value amounts recognized for the right to reclaim cash collateral or
the obligation to return cash collateral.
Treatment of gains and losses resulting from changes in the fair values of derivative instruments is
dependent upon the instruments’ designation and qualification as hedge instruments. The effective portion of
changes in the fair values of derivative instruments that qualify as cash flow hedges are recorded in AOCI and are
reclassified into the same line item of the consolidated statement of operations as the hedged item is recorded during
the same period the hedged item affects earnings. The ineffective portion of changes in the fair values of derivatives
qualifying as cash flow hedges is immediately recognized into earnings. For those derivatives that were not
designated or that did not qualify as hedging instruments, their changes in fair values are immediately recognized
into earnings within the same line item of the consolidated statement of operations as the hedged item is recorded.
Cash flows from derivative instruments are classified in the same category as cash flows from the hedged item in the
consolidated statement of cash flows.
All of the Company’s derivative instruments are currently subject to master netting agreements and
payments for the derivative contracts are allowed to be netted. Netting of payments for derivative instruments are
allowable if the aggregate amount of transactions payable by one party exceeds the aggregate amount of transactions
that are receivable by that party and if paid in the same currency. In the event of default, an early termination penalty
payable to the non-defaulting party can be reduced by amounts payable to the defaulting party if the non-defaulting
party so chooses. The fair values of all derivative instruments are presented on a net basis on the consolidated
balance sheet. Refer to note 14 for the net fair value presentation of the Company’s derivative instruments as
presented on the consolidated balance sheet.
Cash Flow Hedges
Commodity Contracts
The Company enters into copper and lead commodity swap contracts to mitigate price fluctuations on
future commodity purchases. The Company’s commodity swap contracts qualify for and have been designated as
cash flow hedges and changes in the fair values of these contracts are recorded in AOCI until sales of ammunition
that included previously hedged purchases of copper and lead have been recognized. Approximately $5.3 of the net
commodity contracts’ loss (net of taxes) included in AOCI is expected to be reclassified into earnings over the next
twelve months.
At December 31, 2015, the fair values of the Company’s outstanding swap contracts were $(11.6) and
hedged firm commitments of an aggregate notional amount of 39.2 million pounds of copper and lead. The
commodity swap contracts outstanding at December 31, 2015 will settle over the next 16 months. At December 31,
2014, the fair values of the Company’s outstanding swap contracts were $(9.7) and hedged firm commitments of an
aggregate notional amount of 77.7 million pounds of copper and lead and were expected to settle by December
2016.
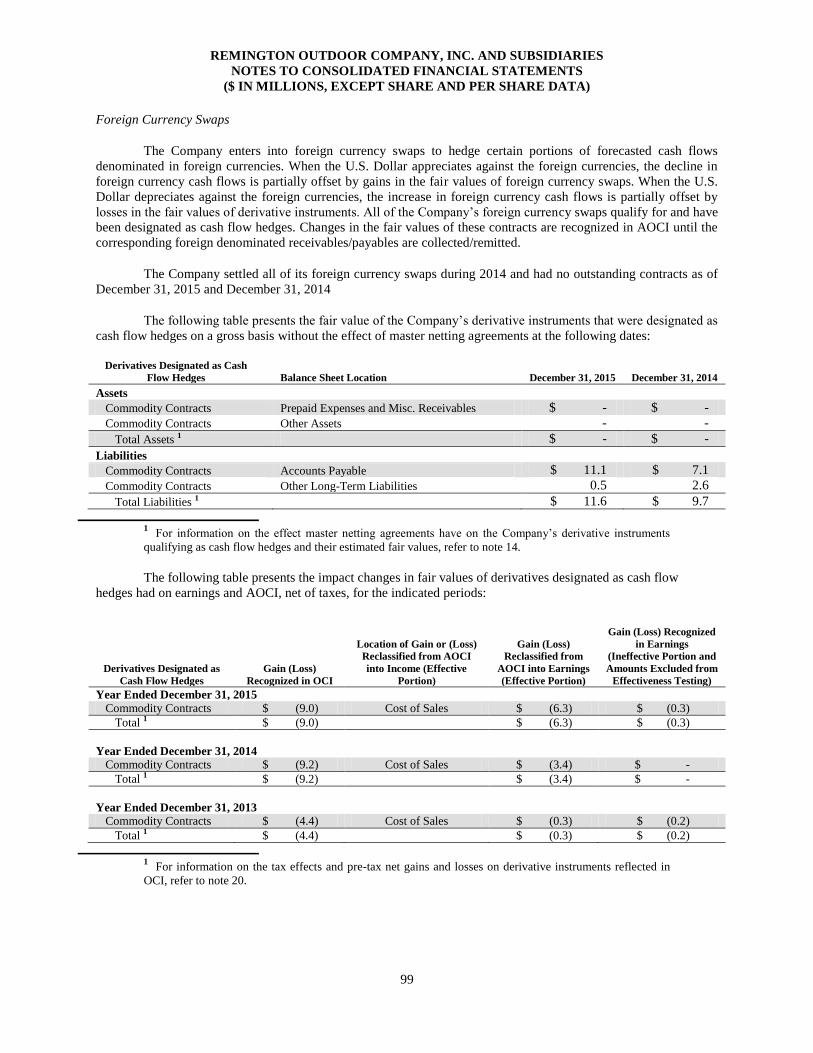
REMINGTON OUTDOOR COMPANY, INC. AND SUBSIDIARIES NOTES TO CONSOLIDATED FINANCIAL STATEMENTS
($ IN MILLIONS, EXCEPT SHARE AND PER SHARE DATA)
99
Foreign Currency Swaps
The Company enters into foreign currency swaps to hedge certain portions of forecasted cash flows
denominated in foreign currencies. When the U.S. Dollar appreciates against the foreign currencies, the decline in
foreign currency cash flows is partially offset by gains in the fair values of foreign currency swaps. When the U.S.
Dollar depreciates against the foreign currencies, the increase in foreign currency cash flows is partially offset by
losses in the fair values of derivative instruments. All of the Company’s foreign currency swaps qualify for and have
been designated as cash flow hedges. Changes in the fair values of these contracts are recognized in AOCI until the
corresponding foreign denominated receivables/payables are collected/remitted.
The Company settled all of its foreign currency swaps during 2014 and had no outstanding contracts as of
December 31, 2015 and December 31, 2014
The following table presents the fair value of the Company’s derivative instruments that were designated as
cash flow hedges on a gross basis without the effect of master netting agreements at the following dates:
Derivatives Designated as Cash
Flow Hedges Balance Sheet Location December 31, 2015 December 31, 2014
Assets
Commodity Contracts Prepaid Expenses and Misc. Receivables $ - $ -
Commodity Contracts Other Assets - -
Total Assets 1 $ - $ -
Liabilities
Commodity Contracts Accounts Payable $ 11.1 $ 7.1
Commodity Contracts Other Long-Term Liabilities 0.5 2.6
Total Liabilities 1 $ 11.6 $ 9.7
1
For information on the effect master netting agreements have on the Company’s derivative instruments
qualifying as cash flow hedges and their estimated fair values, refer to note 14.
The following table presents the impact changes in fair values of derivatives designated as cash flow
hedges had on earnings and AOCI, net of taxes, for the indicated periods:
1
For information on the tax effects and pre-tax net gains and losses on derivative instruments reflected in
OCI, refer to note 20.
Derivatives Designated as
Cash Flow Hedges
Gain (Loss)
Recognized in OCI
Location of Gain or (Loss)
Reclassified from AOCI
into Income (Effective
Portion)
Gain (Loss)
Reclassified from
AOCI into Earnings
(Effective Portion)
Gain (Loss) Recognized
in Earnings
(Ineffective Portion and
Amounts Excluded from
Effectiveness Testing)
Year Ended December 31, 2015
Commodity Contracts $ (9.0) Cost of Sales $ (6.3) $ (0.3)
Total 1 $ (9.0) $ (6.3) $ (0.3)
Year Ended December 31, 2014 Commodity Contracts $ (9.2) Cost of Sales $ (3.4) $ -
Total 1 $ (9.2) $ (3.4) $ -
Year Ended December 31, 2013 Commodity Contracts $ (4.4) Cost of Sales $ (0.3) $ (0.2)
Total 1 $ (4.4) $ (0.3) $ (0.2)
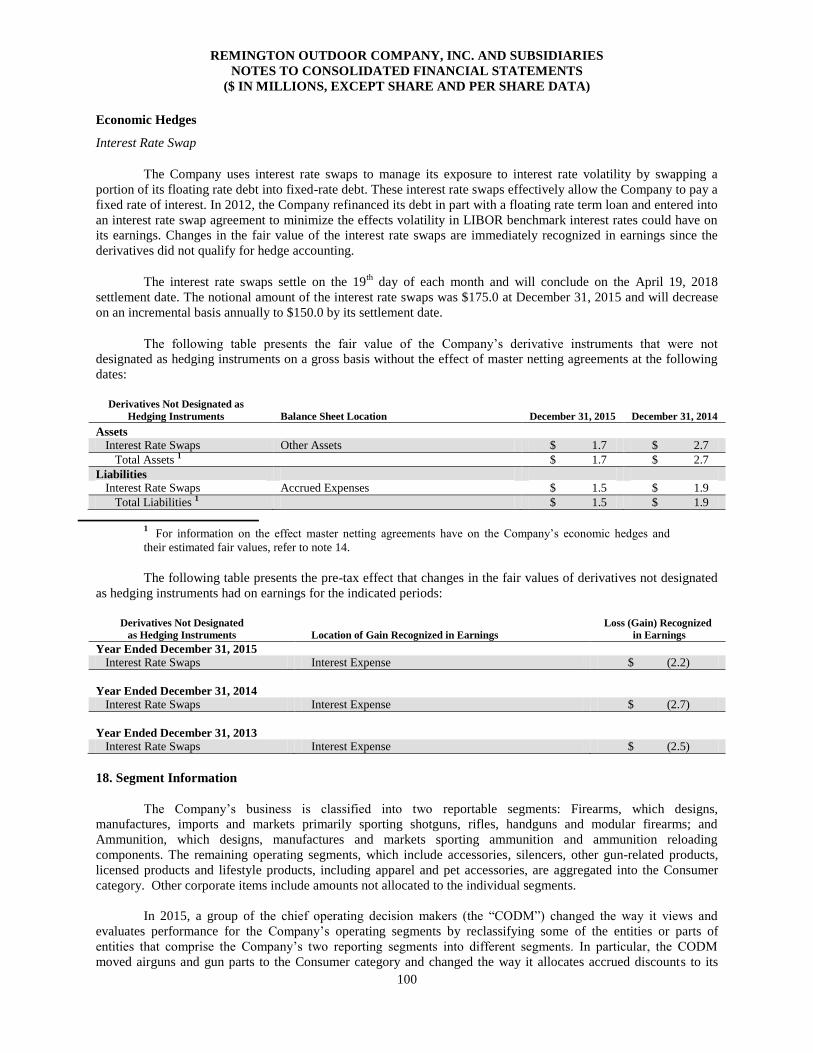
REMINGTON OUTDOOR COMPANY, INC. AND SUBSIDIARIES NOTES TO CONSOLIDATED FINANCIAL STATEMENTS
($ IN MILLIONS, EXCEPT SHARE AND PER SHARE DATA)
100
Economic Hedges
Interest Rate Swap
The Company uses interest rate swaps to manage its exposure to interest rate volatility by swapping a
portion of its floating rate debt into fixed-rate debt. These interest rate swaps effectively allow the Company to pay a
fixed rate of interest. In 2012, the Company refinanced its debt in part with a floating rate term loan and entered into
an interest rate swap agreement to minimize the effects volatility in LIBOR benchmark interest rates could have on
its earnings. Changes in the fair value of the interest rate swaps are immediately recognized in earnings since the
derivatives did not qualify for hedge accounting.
The interest rate swaps settle on the 19th
day of each month and will conclude on the April 19, 2018
settlement date. The notional amount of the interest rate swaps was $175.0 at December 31, 2015 and will decrease
on an incremental basis annually to $150.0 by its settlement date.
The following table presents the fair value of the Company’s derivative instruments that were not
designated as hedging instruments on a gross basis without the effect of master netting agreements at the following
dates:
Derivatives Not Designated as
Hedging Instruments Balance Sheet Location December 31, 2015 December 31, 2014
Assets Interest Rate Swaps Other Assets $ 1.7 $ 2.7
Total Assets 1 $ 1.7 $ 2.7
Liabilities
Interest Rate Swaps Accrued Expenses $ 1.5 $ 1.9
Total Liabilities 1 $ 1.5 $ 1.9
1
For information on the effect master netting agreements have on the Company’s economic hedges and
their estimated fair values, refer to note 14.
The following table presents the pre-tax effect that changes in the fair values of derivatives not designated
as hedging instruments had on earnings for the indicated periods:
Derivatives Not Designated
as Hedging Instruments Location of Gain Recognized in Earnings
Loss (Gain) Recognized
in Earnings
Year Ended December 31, 2015 Interest Rate Swaps Interest Expense $ (2.2)
Year Ended December 31, 2014 Interest Rate Swaps Interest Expense $ (2.7)
Year Ended December 31, 2013 Interest Rate Swaps Interest Expense $ (2.5)
18. Segment Information
The Company’s business is classified into two reportable segments: Firearms, which designs,
manufactures, imports and markets primarily sporting shotguns, rifles, handguns and modular firearms; and
Ammunition, which designs, manufactures and markets sporting ammunition and ammunition reloading
components. The remaining operating segments, which include accessories, silencers, other gun-related products,
licensed products and lifestyle products, including apparel and pet accessories, are aggregated into the Consumer
category. Other corporate items include amounts not allocated to the individual segments.
In 2015, a group of the chief operating decision makers (the “CODM”) changed the way it views and
evaluates performance for the Company’s operating segments by reclassifying some of the entities or parts of
entities that comprise the Company’s two reporting segments into different segments. In particular, the CODM
moved airguns and gun parts to the Consumer category and changed the way it allocates accrued discounts to its
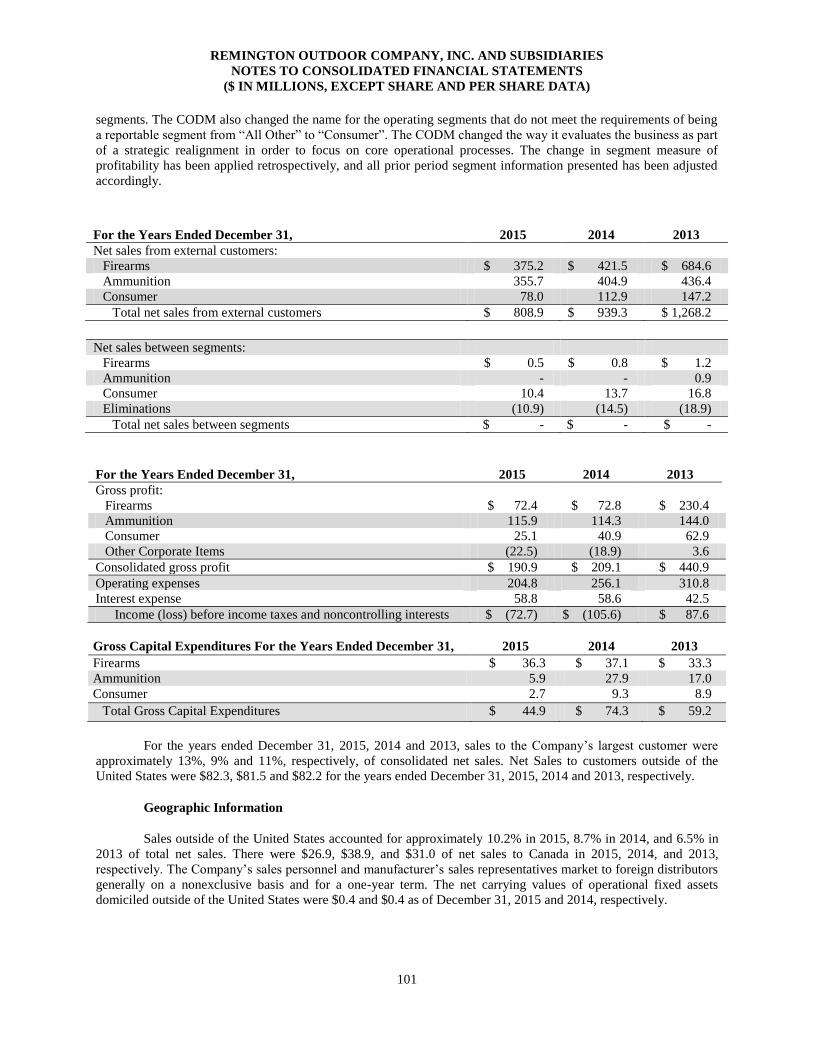
REMINGTON OUTDOOR COMPANY, INC. AND SUBSIDIARIES NOTES TO CONSOLIDATED FINANCIAL STATEMENTS
($ IN MILLIONS, EXCEPT SHARE AND PER SHARE DATA)
101
segments. The CODM also changed the name for the operating segments that do not meet the requirements of being
a reportable segment from “All Other” to “Consumer”. The CODM changed the way it evaluates the business as part
of a strategic realignment in order to focus on core operational processes. The change in segment measure of
profitability has been applied retrospectively, and all prior period segment information presented has been adjusted
accordingly.
For the Years Ended December 31, 2015 2014 2013
Net sales from external customers:
Firearms $ 375.2 $ 421.5 $ 684.6
Ammunition 355.7 404.9 436.4
Consumer 78.0 112.9 147.2
Total net sales from external customers $ 808.9 $ 939.3 $ 1,268.2
Net sales between segments:
Firearms $ 0.5 $ 0.8 $ 1.2
Ammunition - - 0.9
Consumer 10.4 13.7 16.8
Eliminations (10.9) (14.5) (18.9)
Total net sales between segments $ - $ - $ -
For the Years Ended December 31, 2015 2014 2013
Gross profit:
Firearms $ 72.4 $ 72.8 $ 230.4
Ammunition 115.9 114.3 144.0
Consumer 25.1 40.9 62.9
Other Corporate Items
(22.5) (18.9) 3.6
Consolidated gross profit $ 190.9 $ 209.1 $ 440.9
Operating expenses 204.8 256.1 310.8
Interest expense 58.8 58.6 42.5
Income (loss) before income taxes and noncontrolling interests $ (72.7) $ (105.6) $ 87.6
Gross Capital Expenditures For the Years Ended December 31, 2015 2014 2013
Firearms $ 36.3 $ 37.1 $ 33.3
Ammunition 5.9 27.9 17.0
Consumer 2.7 9.3 8.9
Total Gross Capital Expenditures $ 44.9 $ 74.3 $ 59.2
For the years ended December 31, 2015, 2014 and 2013, sales to the Company’s largest customer were
approximately 13%, 9% and 11%, respectively, of consolidated net sales. Net Sales to customers outside of the
United States were $82.3, $81.5 and $82.2 for the years ended December 31, 2015, 2014 and 2013, respectively.
Geographic Information
Sales outside of the United States accounted for approximately 10.2% in 2015, 8.7% in 2014, and 6.5% in
2013 of total net sales. There were $26.9, $38.9, and $31.0 of net sales to Canada in 2015, 2014, and 2013,
respectively. The Company’s sales personnel and manufacturer’s sales representatives market to foreign distributors
generally on a nonexclusive basis and for a one-year term. The net carrying values of operational fixed assets
domiciled outside of the United States were $0.4 and $0.4 as of December 31, 2015 and 2014, respectively.
REMINGTON OUTDOOR COMPANY, INC. AND SUBSIDIARIES NOTES TO CONSOLIDATED FINANCIAL STATEMENTS
($ IN MILLIONS, EXCEPT SHARE AND PER SHARE DATA)
102
19. Restructuring and Start-Up Costs
In March 2014, the Company acquired a facility in Huntsville, Alabama. Since that time, the Company has
been working to make improvements at the facility, including the creation of a new shooting range and state of the
art research and development facility, in addition to the installation of production equipment. As of December 31
2015, the Company had received a total of $33.6 of various state and local incentives for the development,
construction and renovation of buildings and equipment, including $17.5 received in the year ended December 31,
2015. The state incentives received by the Company are subject to claw back provisions. These provisions include
commitments to increase full-time employees and meet minimum estimated payroll and specified capital
investments. The Company must certify it has met the commitments for up to eleven years for a majority of the
incentives. Measurement for the incentives begins March 31, 2016. In 2014, the Company also received $1.9 of
proceeds and entered into a $12.5 Promissory Note with the city of Huntsville in exchange for the purchase of the
facility in Huntsville. All or portions of the Promissory Note may be forgiven if certain conditions are met, such as
certain headcount and salary thresholds, which would be recognized as income at such time. The forgiveness period
related to the payment of principal and interest on the Promissory Note begins in March 2020 and continues ratably
over the next three fiscal years. The Company is also eligible to be reimbursed for certain training and recruiting
costs.
In 2014, the Company announced a vertical integration initiative that resulted in the closures of its facilities
in Lawrenceville, Georgia, St. Cloud, Minnesota, Elizabethtown, Kentucky, West Jordan, Utah, Kalispell, Montana,
and Pineville, North Carolina. The production at these facilities, along with the production of the Bushmaster and
R1 lines at the Ilion, New York facility, was moved to the Company’s Huntsville, Alabama facility by December 31,
2015.
In 2013, the Company announced an expansion at its Lonoke ammunition factory. The new production
facility came on-line in late 2014. As of December 31, 2015, the Company had received various incentives of which
a $0.5 grant is subject to claw back provisions. The first measurement occurred on July 1, 2015; however, the
Company requested and received an extension until June 30, 2016 to meet the headcount and average wage
requirements.
The Company considers restructuring costs as those one-time costs related to severance, retention, and
relocation; equipment transfer, site prep and carrying costs; contract terminations; and other non-cash costs such as
the write-off of inventory and inefficiency variances related to the consolidation of facilities. As a result of these
restructuring activities, the Company disbursed approximately $4.7 during the year ended December 31, 2015 and
approximately $8.2 to date, net of incentives received. At December 31, 2015, the Company had $4.6 accrued for
restructuring costs. As of December 31, 2015, the closures and movement related to the restructuring activities had
been completed. The Company does not anticipate any further material expenses related to the vertical integration
and expansion.
The Company considers start-up costs as those one-time costs related to opening a new facility, introducing
a new product of service, conducting business in a new territory or conducting business with a new class of
customers. These costs include core and support team expenses, consulting, legal expense and the write-off of
inefficiency variances directly related to a new facility prior to its becoming fully operational. As of December 31,
2015, the start-up activities had been completed. The Company does not anticipate any further material expenses
related to the vertical integration and expansion.
Retention related costs, certain variance write-offs and inventory write-offs are recognized in cost of goods
sold, with the remaining restructuring charges being recognized as administrative expenses in the Company’s
consolidated statement of operations. To date, approximately $31.1 of restructuring costs have been recognized in
cost of goods sold, of which $11.0 was recognized during the fiscal year ended December 31, 2015. To date,
approximately $21.5 of restructuring and start-up costs have been recognized as administrative expenses in the
Company’s consolidated statement of operations, of which $6.7 was recognized during the fiscal year ended
December 31, 2015.
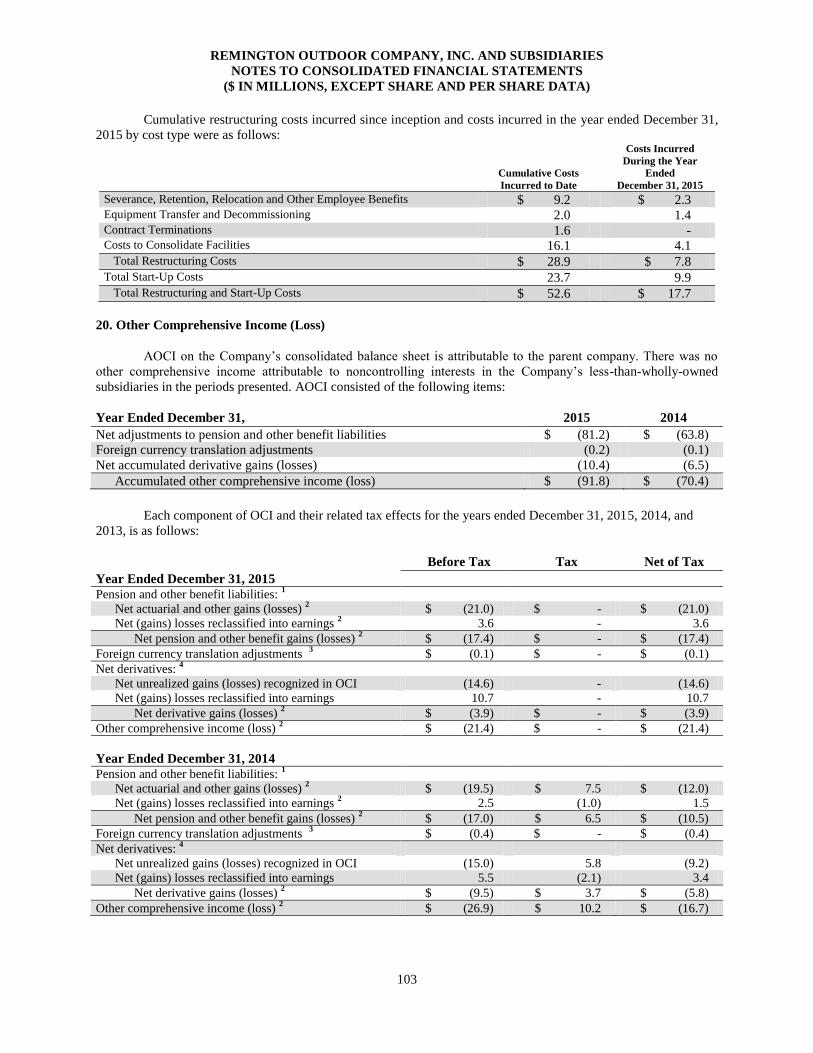
REMINGTON OUTDOOR COMPANY, INC. AND SUBSIDIARIES NOTES TO CONSOLIDATED FINANCIAL STATEMENTS
($ IN MILLIONS, EXCEPT SHARE AND PER SHARE DATA)
103
Cumulative restructuring costs incurred since inception and costs incurred in the year ended December 31,
2015 by cost type were as follows:
Cumulative Costs
Incurred to Date
Costs Incurred
During the Year
Ended
December 31, 2015
Severance, Retention, Relocation and Other Employee Benefits $ 9.2 $ 2.3 Equipment Transfer and Decommissioning 2.0 1.4 Contract Terminations 1.6 - Costs to Consolidate Facilities 16.1 4.1
Total Restructuring Costs $ 28.9 $ 7.8 Total Start-Up Costs 23.7 9.9
Total Restructuring and Start-Up Costs $ 52.6 $ 17.7
20. Other Comprehensive Income (Loss)
AOCI on the Company’s consolidated balance sheet is attributable to the parent company. There was no
other comprehensive income attributable to noncontrolling interests in the Company’s less-than-wholly-owned
subsidiaries in the periods presented. AOCI consisted of the following items:
Year Ended December 31, 2015 2014
Net adjustments to pension and other benefit liabilities $ (81.2) $ (63.8)
Foreign currency translation adjustments (0.2) (0.1)
Net accumulated derivative gains (losses) (10.4) (6.5)
Accumulated other comprehensive income (loss) $ (91.8) $ (70.4)
Each component of OCI and their related tax effects for the years ended December 31, 2015, 2014, and
2013, is as follows:
Before Tax Tax
Net of Tax
Year Ended December 31, 2015
Pension and other benefit liabilities: 1
Net actuarial and other gains (losses) 2
$ (21.0) $ - $ (21.0)
Net (gains) losses reclassified into earnings 2
3.6 - 3.6
Net pension and other benefit gains (losses) 2
$ (17.4) $ - $ (17.4)
Foreign currency translation adjustments 3
$ (0.1) $ - $ (0.1)
Net derivatives: 4
Net unrealized gains (losses) recognized in OCI (14.6) - (14.6)
Net (gains) losses reclassified into earnings 10.7 - 10.7
Net derivative gains (losses) 2
$ (3.9) $ - $ (3.9)
Other comprehensive income (loss) 2
$ (21.4) $ - $ (21.4)
Year Ended December 31, 2014
Pension and other benefit liabilities: 1
Net actuarial and other gains (losses) 2
$ (19.5) $ 7.5 $ (12.0)
Net (gains) losses reclassified into earnings 2
2.5 (1.0) 1.5
Net pension and other benefit gains (losses) 2
$ (17.0) $ 6.5 $ (10.5)
Foreign currency translation adjustments 3
$ (0.4) $ - $ (0.4)
Net derivatives: 4
Net unrealized gains (losses) recognized in OCI (15.0) 5.8 (9.2)
Net (gains) losses reclassified into earnings 5.5 (2.1) 3.4
Net derivative gains (losses) 2
$ (9.5) $ 3.7 $ (5.8)
Other comprehensive income (loss) 2
$ (26.9) $ 10.2 $ (16.7)
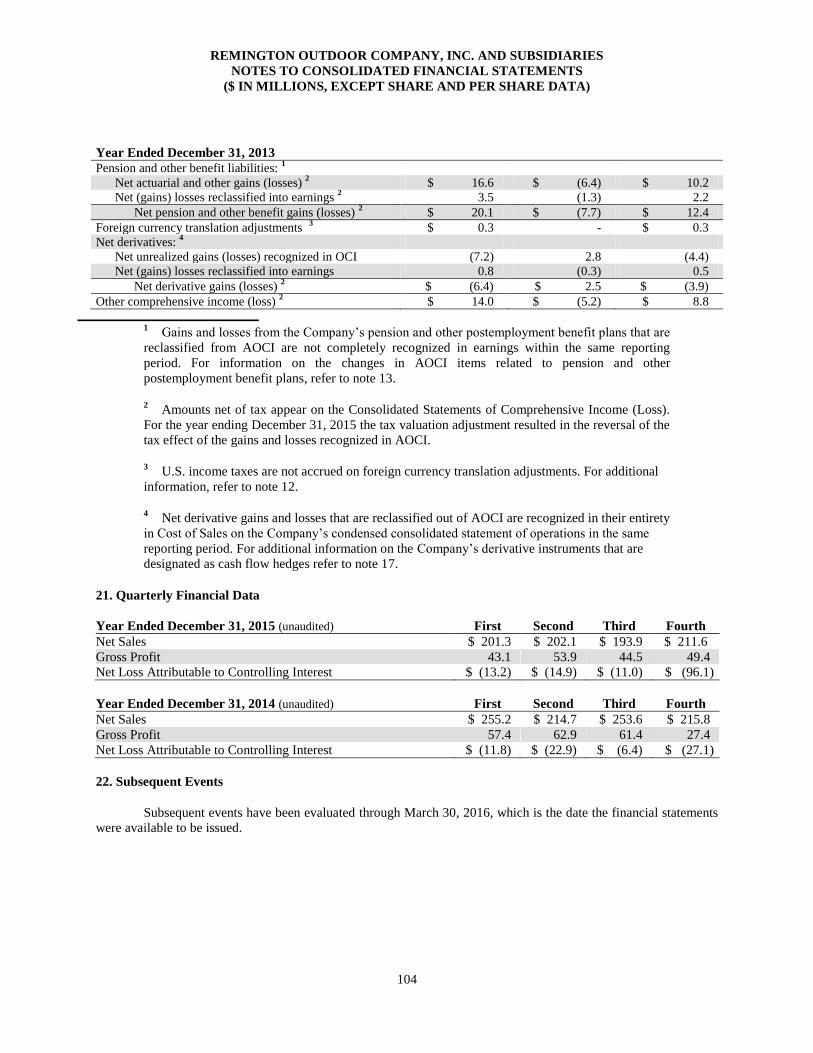
REMINGTON OUTDOOR COMPANY, INC. AND SUBSIDIARIES NOTES TO CONSOLIDATED FINANCIAL STATEMENTS
($ IN MILLIONS, EXCEPT SHARE AND PER SHARE DATA)
104
Year Ended December 31, 2013
Pension and other benefit liabilities: 1
Net actuarial and other gains (losses) 2
$ 16.6 $ (6.4) $ 10.2
Net (gains) losses reclassified into earnings 2
3.5 (1.3) 2.2
Net pension and other benefit gains (losses) 2
$ 20.1 $ (7.7) $ 12.4
Foreign currency translation adjustments 3
$ 0.3 - $ 0.3
Net derivatives: 4
Net unrealized gains (losses) recognized in OCI (7.2) 2.8 (4.4)
Net (gains) losses reclassified into earnings 0.8 (0.3) 0.5
Net derivative gains (losses) 2
$ (6.4) $ 2.5 $ (3.9)
Other comprehensive income (loss) 2
$ 14.0 $ (5.2) $ 8.8
1
Gains and losses from the Company’s pension and other postemployment benefit plans that are
reclassified from AOCI are not completely recognized in earnings within the same reporting
period. For information on the changes in AOCI items related to pension and other
postemployment benefit plans, refer to note 13.
2 Amounts net of tax appear on the Consolidated Statements of Comprehensive Income (Loss).
For the year ending December 31, 2015 the tax valuation adjustment resulted in the reversal of the
tax effect of the gains and losses recognized in AOCI.
3 U.S. income taxes are not accrued on foreign currency translation adjustments. For additional
information, refer to note 12.
4 Net derivative gains and losses that are reclassified out of AOCI are recognized in their entirety
in Cost of Sales on the Company’s condensed consolidated statement of operations in the same
reporting period. For additional information on the Company’s derivative instruments that are
designated as cash flow hedges refer to note 17.
21. Quarterly Financial Data
Year Ended December 31, 2015 (unaudited) First Second Third Fourth
Net Sales $ 201.3 $ 202.1 $ 193.9 $ 211.6
Gross Profit 43.1 53.9 44.5 49.4
Net Loss Attributable to Controlling Interest $ (13.2) $ (14.9) $ (11.0) $ (96.1)
Year Ended December 31, 2014 (unaudited) First Second Third Fourth
Net Sales $ 255.2 $ 214.7 $ 253.6 $ 215.8
Gross Profit 57.4 62.9 61.4 27.4
Net Loss Attributable to Controlling Interest $ (11.8) $ (22.9) $ (6.4) $ (27.1)
22. Subsequent Events
Subsequent events have been evaluated through March 30, 2016, which is the date the financial statements
were available to be issued.
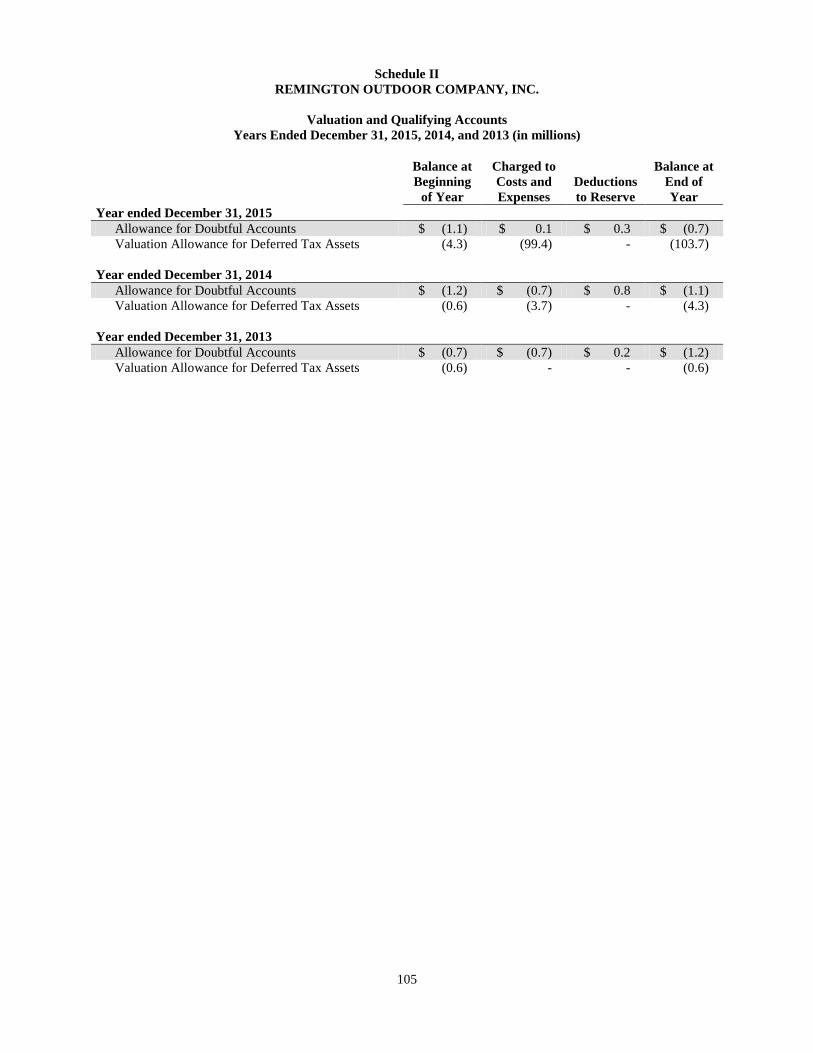
105
Schedule II
REMINGTON OUTDOOR COMPANY, INC.
Valuation and Qualifying Accounts
Years Ended December 31, 2015, 2014, and 2013 (in millions)
Balance at
Beginning
of Year
Charged to
Costs and
Expenses
Deductions
to Reserve
Balance at
End of
Year
Year ended December 31, 2015
Allowance for Doubtful Accounts $ (1.1) $ 0.1 $ 0.3 $ (0.7)
Valuation Allowance for Deferred Tax Assets (4.3) (99.4) - (103.7)
Year ended December 31, 2014
Allowance for Doubtful Accounts $ (1.2) $ (0.7) $ 0.8 $ (1.1)
Valuation Allowance for Deferred Tax Assets (0.6) (3.7) - (4.3)
Year ended December 31, 2013
Allowance for Doubtful Accounts $ (0.7) $ (0.7) $ 0.2 $ (1.2)
Valuation Allowance for Deferred Tax Assets (0.6) - - (0.6)

106
9. CHANGES IN AND DISAGREEMENTS WITH ACCOUNTANTS ON ACCOUNTING AND
FINANCIAL DISCLOSURE
None.
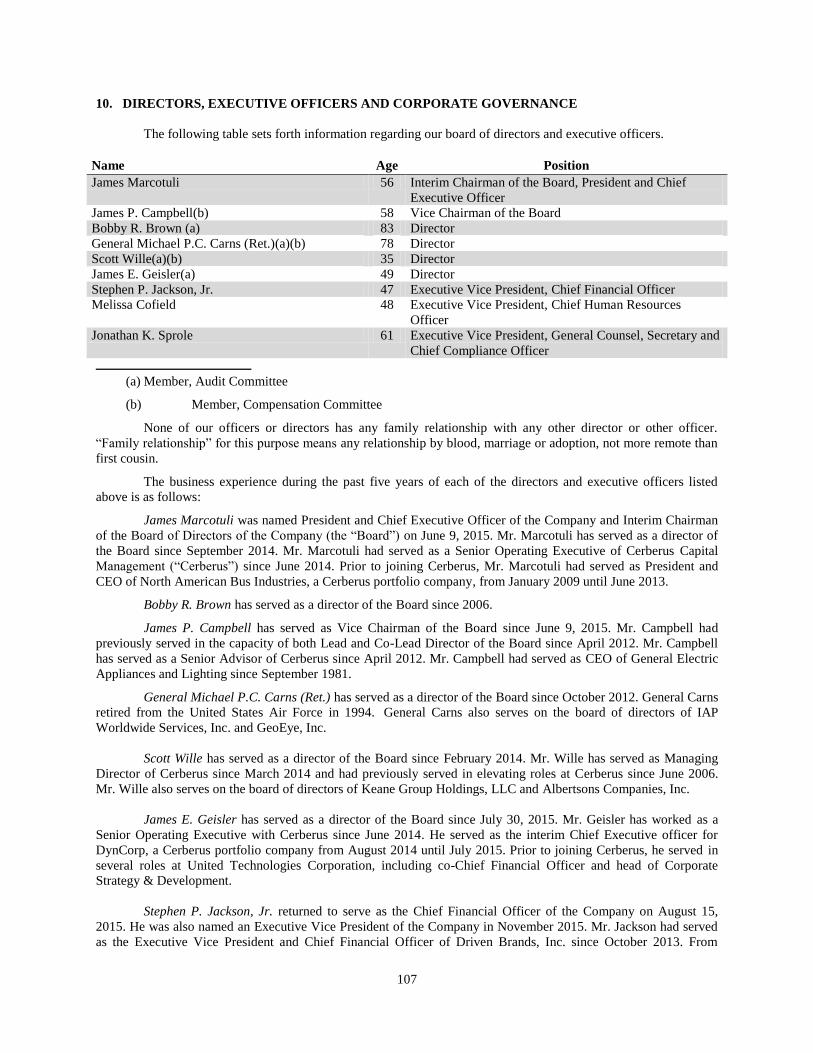
107
10. DIRECTORS, EXECUTIVE OFFICERS AND CORPORATE GOVERNANCE
The following table sets forth information regarding our board of directors and executive officers.
Name Age Position
James Marcotuli 56 Interim Chairman of the Board, President and Chief
Executive Officer
James P. Campbell(b) 58 Vice Chairman of the Board
Bobby R. Brown (a) 83 Director
General Michael P.C. Carns (Ret.)(a)(b) 78 Director
Scott Wille(a)(b) 35 Director
James E. Geisler(a) 49 Director
Stephen P. Jackson, Jr. 47 Executive Vice President, Chief Financial Officer
Melissa Cofield 48 Executive Vice President, Chief Human Resources
Officer
Jonathan K. Sprole 61 Executive Vice President, General Counsel, Secretary and
Chief Compliance Officer
(a) Member, Audit Committee
(b) Member, Compensation Committee
None of our officers or directors has any family relationship with any other director or other officer.
“Family relationship” for this purpose means any relationship by blood, marriage or adoption, not more remote than
first cousin.
The business experience during the past five years of each of the directors and executive officers listed
above is as follows:
James Marcotuli was named President and Chief Executive Officer of the Company and Interim Chairman
of the Board of Directors of the Company (the “Board”) on June 9, 2015. Mr. Marcotuli has served as a director of
the Board since September 2014. Mr. Marcotuli had served as a Senior Operating Executive of Cerberus Capital
Management (“Cerberus”) since June 2014. Prior to joining Cerberus, Mr. Marcotuli had served as President and
CEO of North American Bus Industries, a Cerberus portfolio company, from January 2009 until June 2013.
Bobby R. Brown has served as a director of the Board since 2006.
James P. Campbell has served as Vice Chairman of the Board since June 9, 2015. Mr. Campbell had
previously served in the capacity of both Lead and Co-Lead Director of the Board since April 2012. Mr. Campbell
has served as a Senior Advisor of Cerberus since April 2012. Mr. Campbell had served as CEO of General Electric
Appliances and Lighting since September 1981.
General Michael P.C. Carns (Ret.) has served as a director of the Board since October 2012. General Carns
retired from the United States Air Force in 1994. General Carns also serves on the board of directors of IAP
Worldwide Services, Inc. and GeoEye, Inc.
Scott Wille has served as a director of the Board since February 2014. Mr. Wille has served as Managing
Director of Cerberus since March 2014 and had previously served in elevating roles at Cerberus since June 2006.
Mr. Wille also serves on the board of directors of Keane Group Holdings, LLC and Albertsons Companies, Inc.
James E. Geisler has served as a director of the Board since July 30, 2015. Mr. Geisler has worked as a
Senior Operating Executive with Cerberus since June 2014. He served as the interim Chief Executive officer for
DynCorp, a Cerberus portfolio company from August 2014 until July 2015. Prior to joining Cerberus, he served in
several roles at United Technologies Corporation, including co-Chief Financial Officer and head of Corporate
Strategy & Development.
Stephen P. Jackson, Jr. returned to serve as the Chief Financial Officer of the Company on August 15,
2015. He was also named an Executive Vice President of the Company in November 2015. Mr. Jackson had served
as the Executive Vice President and Chief Financial Officer of Driven Brands, Inc. since October 2013. From
108
February 2009 until October 2013, Mr. Jackson served in a variety of positions, including Chief Financial Officer,
Chief Accounting Officer and Treasurer of the Company.
Melissa Cofield has served as an Executive Vice President of the Company since November 2015 and
Chief Human Resources Officer since July 2009.
Jonathan K. Sprole has served as General Counsel of the Company since August 2012. From August 2011
until joining the Company, Mr. Sprole worked as General Counsel of Versa Capital Management. From May 2008
until August 2011, Mr. Sprole served as a consultant for SRM Business Consulting.
Board Committees
Audit Committee. The audit committee of the Board consists of four members. The committee assists the
Board in its oversight responsibilities relating to the integrity of our financial statements, the qualifications,
independence and performance of our independent auditors, the performance of our internal audit function and the
compliance of our company with any reporting and regulatory requirements we may be subject to. Our Board will
determine which member of our audit committee qualifies as an “audit committee financial expert” under SEC rules
and regulations.
Compensation Committee. The compensation committee of the Board consists of three members. The
compensation committee of the Board is authorized to review our compensation and benefits plans to ensure they
meet our corporate objectives, approve the compensation structure of our executive officers and evaluate our
executive officers’ performance and advise on salary, bonus and other incentive and equity compensation.
Compensation Committee Interlocks and Insider Participation
None of our executive officers serves as a member of the compensation committee or Board of Directors of
any other entity that has an executive officer serving as a member of our Board or compensation committee.
Code of Business Conduct and Ethics
We have adopted a code of business conduct and ethics that applies to all of our employees, officers and
directors, including those officers responsible for financial reporting. The code of business conduct and ethics will
be available on our website at www.freedom-group.com. We expect that any amendments to the code, or any
waivers of its requirements, will be disclosed on our website.
109
12. SECURITY OWNERSHIP OF CERTAIN BENEFICIAL OWNERS AND MANAGEMENT AND
RELATED STOCKHOLDER MATTERS
Shares of common stock of Remington Outdoor Company are held by various entities and individuals.
Each share of the Company’s common stock is entitled to one vote. The following table sets forth the beneficial
owners as of December 31, 2015 of the shares of common stock of the Company by each director, each executive
officer, by all directors and executive officers as a group and by each person who owns beneficially more than five
percent of the outstanding shares of common stock of the Company. The number of shares shown in the table is as
of the latest practicable date. Some directors and officers received shares of common stock and options to purchase
common stock based on service to a separate entity affiliated through common ownership.
The amounts and percentages of common stock beneficially owned are reported on the basis of SEC
regulations governing the determination of beneficial ownership of securities. Under the rules of the SEC, a person
is deemed to be a beneficial owner of a security if that person has or shares voting power, which includes the power
to vote or to direct the voting of such security, or investment power, which includes the power to dispose of or to
direct the disposition of such security. Unless otherwise indicated below, each beneficial owner named in the table
below has sole voting and sole investment power with respect to all shares beneficially owned, subject to
community property laws where applicable.
Series A Preferred Common
Name of Beneficial Owner
Number of
Shares
Percent of
Class
Number of
Shares
Percent of
Class James Marcotuli - - - -
James P. Campbell - - 412 (1) *
Bobby Brown - - 394 (2) *
General Michael P.C. Carns (Ret.) - - 157 (3) *
Scott Wille - - - -
James E. Geisler - - - -
Stephen P. Jackson, Jr. - - - -
Melissa Cofield - - 380 (4) *
Jonathan K. Sprole - - 395 (5) *
George Kollitides II - - 9,250 (6) 2.7%
Walter McLallen IV - - 3,796 (7) 1.1
General Michael Hagee (Ret.) - - 191 (8) *
General George Joulwan (Ret.) - - 191 (9) *
James J. Pike - - 790 (10) *
George J. Zahringer - - 394 (11) *
Ronald E. Kolka - - 1,493 (12) *
Directors and executive officers as a group (12 Persons) - - 17,843 5.2%
5% Stockholders
Cerberus Capital Management, L.P. - - 327,976 (13) 94.8%
Stephen Feinberg - - 327,976 (13) 94.8%
* Less than 1%.
(1) Represents 200 shares of restricted common stock and 212 of common stock issued pursuant
to a pro rata subscription offer directly held by Mr. Campbell (including 17 restricted shares and 17
common shares which will vest within 60 days of March 30, 2016) and an additional 105 of unvested
restricted shares and 113 of unvested common shares, for a total of 628 shares of restricted common
stock.
(2) Represents 394 shares of common stock directly held by Mr. Brown.
(3) Represents 73 shares of restricted common stock and 84 shares of common stock issued
pursuant to a pro rata subscription offer directly held by General Carns (including 6 restricted shares
110
and 13 common shares which will vest within 60 days of March 30, 2016) and an additional 48 of
unvested restricted shares and 46 of unvested common shares, for a total of 251 shares of restricted
common stock.
(4) Represents 380 options that are currently exercisable.
(5) Represents 395 shares of restricted common stock directly held by Mr. Sprole (including 31
shares which will vest within 60 days of March 30, 2016) and an additional 211 of unvested shares, for
a total of 606 shares of restricted common stock.
(6) Represents 4,470 shares of restricted common stock and 4,780 shares of common stock
issued pursuant to a pro rata subscription offer directly held by Mr. Kollitides (including 228 restricted
shares and 243 common shares which will vest within 60 days of March 30, 2016) and an additional
1,589 of unvested restricted shares and 1,701 of unvested common shares, for a total of 12,540 shares
of restricted common stock.
(7) Represents 3,796 shares of common stock directly held by Mr. McLallen. Mr. McLallen
resigned on June 9, 2015.
(8) Represents 96 shares of restricted common stock directly held by General Hagee and 95
shares of common stock directly held by General Hagee. General Hagee resigned on February 10,
2015.
(9) Represents 96 shares of restricted common stock directly held by General Joulwan and 95
options that are currently exercisable. General Joulwan resigned on February 19, 2015. General
Joulwan has until May 28, 2018 to exercise his options.
(10) Represents 191 shares of restricted common stock and 599 shares of common stock issued
pursuant to a pro rata subscription offer directly held by Mr. Pike. Mr. Pike resigned on June 9, 2015.
(11) Represents 394 shares of common stock directly held by Mr. Zahringer. Mr. Zahringer
resigned on February 9, 2015.
(12) Represents 721 shares of restricted stock and 772 shares of common stock issued pursuant to
a pro rata subscription offer directly held by Mr. Kolka. Mr. Kolka Resigned on June 9, 2015
(13) The Company is controlled by Cerberus, which owns 327,796 shares of the common stock.
Stephen Feinberg exercises voting and investment authority over our securities owned by the affiliates
of Cerberus. Thus, pursuant to Rule 13d-3 under the Exchange Act, Stephen Feinberg is deemed to
beneficially own any shares of our common stock owned by Cerberus. The address for each of
Cerberus and Mr. Feinberg is c/o Cerberus Capital Management, L.P., 875 Third Avenue, New York,
New York 10022.
111
13. CERTAIN RELATIONSHIPS AND RELATED TRANSACTIONS, AND DIRECTOR
INDEPENDENCE
We paid Cerberus Operations and Advisory Company, LLC, an affiliate of Cerberus Capital Management,
fees totaling $4.1 million in 2015 for consulting services provided in connection with improving operations.
We purchased certain products totaling approximately $2.4 million for the year ended December 31, 2015
from another entity affiliated through common ownership.
We paid approximately $0.5 million for the year ended December 31, 2015 in connection with a building
lease to an entity owned by a former employee of the Company.
We paid approximately $0.8 for the year ended December 31, 2015 in connection with certain construction
related projects to an entity where the owner has a business relationship with a former employee of the Company.
Review and Approval of Related Party Transactions
We review all relationships and transactions in which we and our Board, executive officers or any
beneficial owner of greater than five percent of our common shares or their immediate family members are
participants to determine whether such persons have a direct or indirect material interest. Our legal staff is primarily
responsible for the development and implementation of processes and controls to obtain information from our
directors and executive officers with respect to related person transactions and for then determining, based on the
facts and circumstances, whether we or a related person has a direct or indirect material interest in the transaction.
In addition, we and our Board follow the requirements set forth in the transactions with affiliates covenant
contained in the indenture governing our 2020 Notes and the credit agreements governing the Term Loan B and the
ABL Revolver. In summary, these agreements provide that we will not, and we will not permit any of our restricted
subsidiaries to, directly or indirectly, enter into or amend any transaction or series of transactions, contract,
agreement, understanding, loan, advance or guarantee with or for the benefit of, any affiliate (as defined in the
agreements) involving aggregate consideration in excess of specified thresholds, unless we determine that the terms
of such transaction are not materially less favorable to such company than those that could have been obtained in a
comparable transaction by such company with an unrelated person and that the terms of such transaction are
substantially as favorable to such company as it would obtain in a comparable arm’s-length transaction with a
person that is not an affiliate, subject to certain exceptions specified in such agreements.
112
14. PRINCIPAL ACCOUNTANT FEES AND SERVICES
Audit Fees
Our audit fees paid to Grant Thornton LLP, our principal accountant, were $0.6 million, $0.6 million and
$0.8 million in 2015, 2014 and 2013, respectively, for professional services rendered in connection with the annual
audits and quarterly reviews of the financial statements.
Audit-Related Fees
In 2015, 2014 and 2013, we paid Grant Thornton LLP less than $0.1 million during each of the respective
years for professional services rendered with respect to our pension and savings plans and debt offerings services.
Tax Fees
Our tax-related fees to Grant Thornton LLP, our principal accountant, were less than $0.1 million in each
of 2015, 2014 and 2013, primarily with respect to professional services rendered in federal and state tax review
services.
Audit Fee Approval
The percentage of fees paid to Grant Thornton LLP for audit fees, audit-related fees, tax fees and all other
fees that were approved by the Company's Audit Committee was 100% in 2015, 2014 and 2013.