remittances as expenditure drivers in rural mexico1 · remittances as expenditure drivers in rural...
TRANSCRIPT

231
ISSN 0187-6961 Estudios Fronterizos, nueva época, vol. 17, núm. 33, enero-junio de 2016, pp. 231-259
Remittances as expenditure drivers in rural Mexico1
Las remesas como factores determinantesdel gasto en las zonas rurales de MéxicoJosé Jorge Mora Rivera* y Jesús Arellano González**
Received: October 20, 2014.Approved: September 2, 2015. 1 The authors would like to thank the Hewlett Foundation and the MacMillan Center at Yale University for their financial support to this work. We specially thank professor Gustav Ranis and the working group formed at the Economic Growth Center of Yale University for their valuable comments and observations.* Instituto Tecnológico de Estudios Superiores de Monterrey-Campus Ciudad de
México, Departamento de Economía y Negocios Internacionales, Mexico, Distrito Federal. Address: Calle del Puente 222, Oficinas III, 2º Piso, Col. Ejidos de Hui-pulco, Delegación Tlalpan, C. P. 14380. E-mail: [email protected]
** University of California, Davis campus. California, United States. E-mail: [email protected]
AbstractIn this work we present different empirical specifications to test for the impact of domes-tic and international remittances on expen-diture patterns in rural Mexican households. Using data from the National Survey of Household Income and Expenditure from 1998 to 2012 we develop an econometric approach that deal with censoring on vari-ous expenditure categories while control-ling for remittances at the household level. Our findings indicate that there is evidence of significant effects of internal and external remittances on household expenditure pat-terns; these income sources are not fungible and reshape household demands in ways that are independent of total income. Effects on each expenditure category are different for each type of remittance income. Internal remittances seem to stimulate more catego-ries related to human development invest-ments, health and education, while external remittances do it with physical capital invest-ments.Keywords: remittances, migration, rural households, expenditure patterns.
ResumenEn este trabajo se presentan diferentes espe-cificaciones empíricas para probar el impacto de las remesas nacionales e internacionales en los patrones de gasto de los hogares ru-rales mexicanos. Utilizando la Encuesta Na-cional de Ingresos y Gastos de los Hogares de 1988 a 2012 se desarrolla un enfoque econométrico que considera la censura en distintas categorías de gasto y controla el efecto de las remesas a nivel hogar. Los re-sultados indican efectos significativos de las remesas internas y externas sobre los patro-nes de gasto de los hogares; estas fuentes de ingreso no son fungibles y remodelan la demanda de los hogares de forma indepen-diente al ingreso total. Los efectos en cada categoría de gasto son diferentes por tipo de remesas. Las remesas internas estimulan en mayor medida categorías relacionadas con las inversiones en desarrollo humano, salud y educación; mientras que las remesas ex-ternas estimulan categorías relacionadas con inversiones en capital físico.Palabras clave: remesas, migración, hogares rurales, patrones de gasto.

232
José Jorge Mora Rivera y Jesús Arellano González / Remittances as expenditure drivers in rural Mexico
Introduction
The number of people living in a country different from their birthplace has been growing and accounts for approximately 3% of the global popula-tion. In 2013, according to the United Nations, 231.5 million people were migrants. The country with the highest number of emigrants in the world was India, with 14.2 million, surpassing Mexico with 13.2 (un, 2013). This flow of migrants all around the world creates an international labor mar-ket that leads to a flow of monetary resources that, in certain proportion, is reallocated to the origin countries in the form of remittances.
In 2013, the World Bank estimated that the total amount of remit-tances reached 548.9 billion dollars of which 76.6% were sent to devel-oping countries, being East Asia and the Pacific, South Asia and Latin America and the Caribbean, the regions with the higher proportions: 27.4%, 27.1% and 14.6%, respectively (World Bank, 2013). The relation-ship between the total amount of international remittances and develop-ing countries is noticeable, from 1990 to 2013 the growth of remittances has been extraordinary. In Latin America and the Caribbean, Mexico is by far the top recipient of remittances in the region, with 22 billion dollars, followed by Guatemala and Colombia with 5.4 and 4.6 billion dollars, re-spectively (World Bank, 2013).
In the case of Mexico, according to El Banco de México, in 1996 inter-national remittances received were around 4 224 million dollars. By 2007, this number had increased to 26 059 million dollars. This represents an annual growth rate of 15.2%. Because of the global recession, uncertainty concerning remittance flows towards developing countries has decreased. Total remittances in 2013 were 17.2% lower than those in 2007. However, the decline in remittance flows is expected to be lower than that of private and official aid flows. Migrant flows from developing countries are also expected to decrease as a result of the global growth slowdown (Ratha, Mohapatra and Xu, 2008). The nature of remittance flows (motivated by altruism towards family) and devaluation of currencies in several recipient countries are very likely to maintain remittances important for developing economies.
The extraordinary growth of international migration and the monetary flow associated with it has motivated a great number of social researchers

233
Estudios Fronterizos, nueva época, vol. 17, núm. 33, enero-junio de 2016, pp. 231-259
to study the diverse effects that migration and remittances might have in origin and destination countries. A basic question is to know if remit-tances have an effect on the economic development of migrant-sending countries. Several studies conclude that there is no automatic mechanism through which migration and the inflow of remittances help to improve the economic development of origin regions (Clément, 2011; Reichert, 1981; Rubenstein, 1992). To what extent migration and remittances can perform this function is a question that must be present in any research agenda about the subject.
Remittances sent to the origin country represent an important re-source that can be devoted to the creation of physical and human capital and thus, means to promote the development of origin regions. Beyond their quantitative importance, the possible impact of remittances should be viewed in terms of their use in a diverse context since they can have multiplier effects on the local economy and even modify the migration dynamics (Haas, 2010).
A fundamental issue when studying the effects of migration on rural development in origin countries is to know the impact of internal and in-ternational remittances on the expenditure patterns of remittance-receiv-ing households. The decision making process of how to spend a limited budget can be different when households receive no remittances.
The migration’s impact on incomes, expenditures and productive activities of rural households has been of particular interest among re-searchers. There are several questions to be answered. One of them, which constitutes the main purpose of this study, is to determine how re-mittances affect the monetary resources allocated to certain expenditure categories. Moreover, our interest is to distinguish the impact of internal remittances versus that of international remittances.
A key question that must also be considered is the impact that remit-tances may have on productive investments since they have been consid-ered part of the growth and development engine of rural communities and could be viewed as a strategy to decrease the need for future mi-gration flows. Some studies have concluded that remittances are devoted mainly to current consumption, with little impact on the productive activi-ties (Chami, Fullenkamp and Jahjah, 2005; Clément, 2011; Durand and Massey, 1992; and Papademetrious and Martin, 1991; Taylor et al., 1996).
234
José Jorge Mora Rivera y Jesús Arellano González / Remittances as expenditure drivers in rural Mexico
In the literature there are at least three views on how remittances are spent. The first, based on remittance use surveys, when those ask remit-tance-receiving households what goods and services they spent their re-mittances on. Remittance-use studies make the mistake of assuming that household income is completely fungible. Most of the time, a distinction between the effects of remittance income and other income is not made, assuming that a dollar increase in remittance income has the same ef-fect of a dollar increase of wage or farm income (Randazzo and Piracha, 2014). Households can distinguish the nature of different income sources attributing them to different uses and managing them using separate ac-counting (Duflo and Udry, 2004). These studies provide little insight into the ways in which remittances actually influence expenditure patterns in remittance-receiving households (Chami et al., 2005).
A second view argues that the receipt of remittances can cause be-havioral changes at the household level that may lower their development impact relative to the receipt of income from other sources (Barham and Boucher, 1998). Because of a moral hazard problem between remitters and recipients, the dependency on these transfers induces recipients to use remittances as a substitute for other income sources. External shocks may lower income from other sources increasing the dependency on re-mittance transfers, and since they do not represent a capital flow, this may reduce economic activity and growth (Chami et al., 2005).
A third view argues that remittances increase investments in human and physical capital. Some examples include Yaméogo (2014), Alderman (1996), Edwards and Ureta (2003), Adams and Cuecuecha (2010), Taylor, Rozelle and Braw (2003), Adams (1998), Yang (2005), López-Córdova, Tokman and Verhoogen (2005) and Adams, Cuecuecha and Page (2008). These findings have been based on econometric techniques that explore the effect of remittances on household expenditure, considering remit-tance income or migration as additional explanatory variables in house-hold demand equations.
Our research offers empirical evidence that remittances (internal and external) reshape rural households’ expenditure patterns. The modeling approach controls for censoring on household consumption categories while testing for differences in expenditure patterns between households receiving remittances and those that do not. These models are estimated

235
Estudios Fronterizos, nueva época, vol. 17, núm. 33, enero-junio de 2016, pp. 231-259
for both external and internal remittances. The data to estimate the model comes from the National Survey of Household Income and Expenditure (enigh).
It should be noted that given the characteristics of rural Mexican households and their income source diversification, domestic and in-ternational remittances do not represent the most important income source. According to Lozano, Huesca and Valdivia (2010), in 2008 inter-national remittances accounted for 20.1% of the total household income, this figure is very similar from those presented by Taylor, Mora, Adams and López-Feldman (2008), which states that, in Mexican rural house-holds, internal and international remittances accounted for 2% and 14%, respectively.
Section two of this paper presents some insights about the relationship between remittances and the expenditures that rural households make; section three offers an overview of the best way to estimate the impact of remittances on different household expenditure categories; the fourth section contains a detailed description of the enigh data set; the fifth sec-tion presents the distinct specifications proposed for the empirical model and our main results and section sixth presents conclusions.
Remittances and expenditures in rural households
Empirical research on expenditures in migrant-sending households often has contributed to a pessimistic view of the impact of migration on devel-opment in migrant-sending areas. Such studies conclude that remittances are consumed instead of invested and thus are not allocate into productive uses in migrant-sending areas (Chami et al., 2005; Clément, 2011). This past research on remittance use offers a partial and possibly distorted view of how remittances influence expenditures. Moreover, it often rests on ar-bitrary definitions of what constitutes productive investments. For exam-ple, schooling often is absent from the list of productive investments. This is probably because expenditures on educating family members usually do not create direct, immediate employment and income linkages within migrant-sending economies. Housing expenditures are also not consid-ered productive investments in many studies, despite their potentially

236
José Jorge Mora Rivera y Jesús Arellano González / Remittances as expenditure drivers in rural Mexico
important effects on mobility, family health and their stimulus to village construction activities (Adams et al., 2008).
Reported use of remittances for productive investment can be signifi-cant. In their review of studies carried out in Mexico, Durand and Massey (1992) found that the relative share of remittances spent on productive activities, although always under 50%, fluctuated considerably from place to place and often reached substantial levels. Remittances enabled many communities to overcome capital constraints to finance public works proj-ects such as parks, churches, schools, electrification, road construction, and sewers (Goldring, 1990; Massey, Alarcón, Durand and González, 1987; Reichert, 1981). Other studies report that remittances have been critical to the capitalization of migrant-owned businesses (Woodruff and Zenteno, 2007). For example, Escobar and Martinez (1990) found that 31% of migrants surveyed in Guadalajara used remittance savings to set up a business. Massey et al. (1987), in their survey of the same city, put the figure at 21%. In a survey of businesses located in three rural Mexican communities, Cornelius (1990) found that 61% were founded with remit-tance earnings. A number of studies from other world regions echo these findings (for a detailed review, see Adams, 2011 and Taylor et al., 1996).
Under the right circumstances, a significant percentage of migrant re-mittances and savings may be devoted to productive enterprises. Rather than concluding that migration inevitably leads to dependency and a lack of development, it is more appropriate to ask why productive investment occurs in some communities and not in others. Negative findings on the productive impacts of remittances may be attributable in part to poor re-search designs that do not consider the direct and indirect ways in which remittances may affect rural household expenditures.
Estimating the impacts of remittanceson expenditure categories
Most models of household expenditures assume that households allocate their budgets across expenditure categories to maximize the utility ob-tained from the consumption of goods and services. Most consumer mod-els assume that households pool their income. This leads them to ignore

237
Estudios Fronterizos, nueva época, vol. 17, núm. 33, enero-junio de 2016, pp. 231-259
income-source effects. The solution to such a consumer model is a set of expenditure functions of the following form:
ehi = f (Ph, Yh, Zh) + uhi (1) Where the subscripts h and i refer to household and expenditure cat-
egories, respectively; ehi denotes expenditure on good i by household h; Ph is a vector of prices faced by the household; Yh is household income; Zh represents other variables influencing marginal utilities and constraints on household behavior (household characteristics), and uhi is an error term that is assumed to be approximately normally distributed with mean zero and variance σ 2. In the standard consumer model, for a household with K diverse sources of income (including remittances), total income is the pooled sum of income from these sources:
(2)
Yh = Ʃ Yhk
k = 1
K
Combining equations (1) and (2), it is evident that a marginal change in income from a given source k (say, remittances) has the same effect on expenditures as a marginal change in any other income source:
(3)
eehi e
Yh
e
Yh e
Yh
ef (Ph, Yh, Zh)
ef (Ph, Yh, Zh)e
yhkʹ
e
yhkʹ—— = —————— —— =——————
Other things equal, an increase in remittances shifts remittance-re-ceiving households’ budget constraints outward by the amount of the re-mittance transfer. In this model, the influence of migrant remittances is assumed to be limited to indirect effects operating through total income; income-source effects are ruled out.
Studies by Adams and Cuecuecha (2010), Adams (1998), Zarate-Hoyos (2004) and Alderman (1996) add a new explanatory variable to the right-hand-side of equation (1): household income from migrant remittances Rh, where Rh is also included in Yh and can contain both internal and ex-ternal remittances as single or independent variables. That is,

238
José Jorge Mora Rivera y Jesús Arellano González / Remittances as expenditure drivers in rural Mexico
ehi = f (Ph, Eh, Zh, Rh) + uhi (4)
Where, as in most demand studies, total expenditures Eh are used in lieu of income. The marginal effect of a change in remittance income, rhkʹ, on household h’s expenditure on good i is thus:
(5)
eehi e
Eh
ef (•) ef (•)e
rhkʹ
e
rhkʹ—— = —— + ——
This is the same as e
Eh
ef (•)—— only if there are no direct effects of remit-
tances on expenditures. In practice either a dummy variable indicat-ing households’ receipt of remittances or the level of remittances can be used. Following this approach Adams and Cuecuecha (2010) found evi-dence that the spending behavior of rural Guatemalan households with remittances was significantly different from that of households without remittances. Specifically, households with remittance income spent less on consumption goods than otherwise similar households without remit-tance income, dispelling the notion that remittances are “conspicuously consumed”. This implies that the second term on the right hand side of equation (5) is nonzero. Similar results are reported in Adams (1998) and Alderman (1996), using data from other less developed countries.
Constraints on household expenditures include not only income but also information, uncertainty, risk aversion and preferences. If migrants provide households with information, they may have various effects on expenditures like broadening the consumption set, creating demand for new goods or switching household production technologies. Even if mi-grants did not contribute to income, their contact with an economy and a society foreign to the village might influence village preferences and de-mands. Consumption is shaped, at least in part, by reference groups and identities. As rural peasants are brought into the global economy —both through their participation in wage work and increasing reliance on re-mittances from other family members, and through their increased con-sumption of non-local commodities— their expenditure patterns change, reflecting both the influence of new cultural standards and a reorganiza-tion of finances within the family.

239
Estudios Fronterizos, nueva época, vol. 17, núm. 33, enero-junio de 2016, pp. 231-259
If the household is risk-averse the effect of remittances on consump-tion and investments is likely to be different from the effect of income with different risk profiles. Households would be expected to allocate income from a risky source more conservatively than income from remittances, if the latter are viewed as more certain. Differences in the effects of income from different sources in this case would reflect the influence of risk and uncertainty on household utility from various consumption and invest-ment choices. Remittance income may be perceived as less transitory than income from other sources (Suarez and Avellaneda, 2007). In this case, a permanent flow of remittances may encourage households to invest in goods whose use and upkeep require additional purchases in the future.
The effects that internal and external remittances have on risk and uncertainty of households may also be different. It is reasonable to assume that internal remittances are associated with a lower level of riskiness than external remittances. This is because of the lower variability that inter-nal remittances may reflect due to the nature of internal versus external migrants (internal migrants are typically more educated than external migrants) or the macroeconomics shocks with which external remittance flows are associated (revaluations of currencies).
Data
Information on household expenditures and income sources was obtained from the enigh which is a nation-wide survey collected on a two-year ba-sis from 1998 until 2012. The sampling design of the enigh guaranties a representative cross-section of Mexico at the national and rural/urban levels. The rural sector is defined as those localities with no more than 2 500 inhabitants. There are altogether 37 505 households located in rural localities and observations can be grouped into Mexico’s 5 geographic re-gions: southeast, center, western, northeast and northwest.2 It includes a very wide disaggregation of expenditure and income records in quarterly
2 Regionalization used in this paper corresponds to that used by the Mexico National Rural Household Survey (enhrum). inegi designed the sampling frame of this survey to provide a statistically reliable characterization of Mexico’s population living in rural areas.

240
José Jorge Mora Rivera y Jesús Arellano González / Remittances as expenditure drivers in rural Mexico
periods. A very rich dataset on households’ socio-demographic character-istics is also available.
This survey is not designed to fully study the migration phenomenon and it poorly defines the concept of remittances. What we call “remittanc-es” is recorded in the enigh as “income coming from other countries” for external remittances or “income coming from other Mexican households” for internal remittances. Though we hypothesize that most of this income represents remittances sent by migrants, we are aware that this concept may also include other kinds of flows such as money earned abroad by professionals or even money coming from a next-door household. Fur-thermore, this concept is not restricted to income coming from the United States. Nevertheless, we emphasize that our focus is on the rural sector and thus, it is very likely that the traditional migration phenomenon dom-inates in the sample and, accordingly, most of the external flows are ex-pected to be remittances from United States.
We take the standardized values of income and expenditure records provided by the enigh as well as their non-monetary counterparts to de-fine income and expenditure categories. The reason to include the non-monetary measures is that self-produced goods represent a very important part of income and consumption, especially for rural households. Income and expenditure records were adjusted to 2002 prices and divided by the household size to obtain a quarterly measure in per capita terms.
Table 1 presents some summary statistics for the sample, with house-holds divided into their remittance-receiving condition. 5 465 households received internal remittances while 3 071 households received external remittances. These numbers represent 14.5% and 8.2% of the sample, respectively. We found 456 households (1.2%) that receive both types of remittances.
Several contrasts emerge when comparing different groups. For in-stance, the proportion of households headed by a female is higher in remittance-receiving households (above 25%) than in non-remittance households (9.6%). 78.4% of non-remittance households are headed by a member who reads and writes; this proportion is always below 63% for any of the remittance-receiving groups. Household heads in the non-re-mittance group are more likely to work in agriculture than those in the remittance-receiving categories.
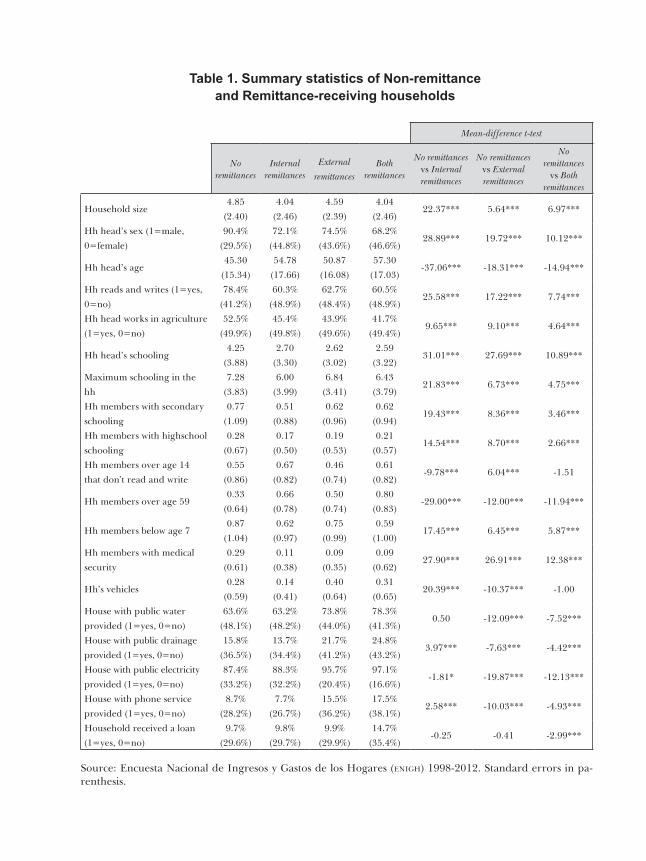
Table 1. Summary statistics of Non-remittanceand Remittance-receiving households
Source: Encuesta Nacional de Ingresos y Gastos de los Hogares (enigh) 1998-2012. Standard errors in pa-renthesis.
Mean-difference t-test
Noremittances
Internal remittances
External
remittances Both
remittances
No remittances vs Internal remittances
No remittances vs External remittances
No remittances
vs Both remittances
Household size4.85
(2.40)
4.04
(2.46)
4.59
(2.39)
4.04
(2.46)22.37*** 5.64*** 6.97***
Hh head’s sex (1=male,
0=female)
90.4%
(29.5%)
72.1%
(44.8%)
74.5%
(43.6%)
68.2%
(46.6%)28.89*** 19.72*** 10.12***
Hh head’s age45.30
(15.34)
54.78
(17.66)
50.87
(16.08)
57.30
(17.03)-37.06*** -18.31*** -14.94***
Hh reads and writes (1=yes,
0=no)
78.4%
(41.2%)
60.3%
(48.9%)
62.7%
(48.4%)
60.5%
(48.9%)25.58*** 17.22*** 7.74***
Hh head works in agriculture
(1=yes, 0=no)
52.5%
(49.9%)
45.4%
(49.8%)
43.9%
(49.6%)
41.7%
(49.4%)9.65*** 9.10*** 4.64***
Hh head’s schooling4.25
(3.88)
2.70
(3.30)
2.62
(3.02)
2.59
(3.22)31.01*** 27.69*** 10.89***
Maximum schooling in the
hh
7.28
(3.83)
6.00
(3.99)
6.84
(3.41)
6.43
(3.79)21.83*** 6.73*** 4.75***
Hh members with secondary
schooling
0.77
(1.09)
0.51
(0.88)
0.62
(0.96)
0.62
(0.94)19.43*** 8.36*** 3.46***
Hh members with highschool
schooling
0.28
(0.67)
0.17
(0.50)
0.19
(0.53)
0.21
(0.57)14.54*** 8.70*** 2.66***
Hh members over age 14
that don’t read and write
0.55
(0.86)
0.67
(0.82)
0.46
(0.74)
0.61
(0.82)-9.78*** 6.04*** -1.51
Hh members over age 59 0.33
(0.64)
0.66
(0.78)
0.50
(0.74)
0.80
(0.83)-29.00*** -12.00*** -11.94***
Hh members below age 70.87
(1.04)
0.62
(0.97)
0.75
(0.99)
0.59
(1.00)17.45*** 6.45*** 5.87***
Hh members with medical
security
0.29
(0.61)
0.11
(0.38)
0.09
(0.35)
0.09
(0.62)27.90*** 26.91*** 12.38***
Hh’s vehicles0.28
(0.59)
0.14
(0.41)
0.40
(0.64)
0.31
(0.65)20.39*** -10.37*** -1.00
House with public water
provided (1=yes, 0=no)
63.6%
(48.1%)
63.2%
(48.2%)
73.8%
(44.0%)
78.3%
(41.3%)0.50 -12.09*** -7.52***
House with public drainage
provided (1=yes, 0=no)
15.8%
(36.5%)
13.7%
(34.4%)
21.7%
(41.2%)
24.8%
(43.2%)3.97*** -7.63*** -4.42***
House with public electricity
provided (1=yes, 0=no)
87.4%
(33.2%)
88.3%
(32.2%)
95.7%
(20.4%)
97.1%
(16.6%)-1.81* -19.87*** -12.13***
House with phone service
provided (1=yes, 0=no)
8.7%
(28.2%)
7.7%
(26.7%)
15.5%
(36.2%)
17.5%
(38.1%)2.58*** -10.03*** -4.93***
Household received a loan
(1=yes, 0=no)
9.7%
(29.6%)
9.8%
(29.7%)
9.9%
(29.9%)
14.7%
(35.4%)-0.25 -0.41 -2.99***

242
José Jorge Mora Rivera y Jesús Arellano González / Remittances as expenditure drivers in rural Mexico
Interestingly, all of the education indicators (head’s schooling, maxi-mum schooling, members with secondary and high school completed) are higher for the non-remittance receiving households. Educational levels are generally low in rural areas. Despite the fact of having higher levels of edu-cation compared to remittance-receiving households, household heads in the non-remittance category have on average only 4.25 years of schooling. Even the average maximum schooling achieved is only enough to have completed primary education.
Remittance-receiving households have more members over age 59 and fewer children below 7 than non-remittance households; further, household heads are older in remittance-receiving households. Access to medical insurance is higher for non-remittance households; on average 0.29 members have medical insurance (either public or private) as part of their job benefits. External-remittance households have, on average, more vehicles than non-remittance households, 0.40 against 0.28, respectively. In general, there is evidence that remittance-receiving households have better access to services (public water, drainage, electricity and phone ser-vice) than non-remittance households. In addition, households receiving both types of remittances seem to have better access to loans than non-remittance households.
The income and remittance figures by household categories are sum-marized in Table 2; data is presented in monthly approximations. External-remittance households seem to be highly dependent on monetary resources coming from abroad, with external remittances representing on average 35% of their total income. This figure is lower for internal-remittance house-holds which are dependent on remittances for 22% of their total income. Households receiving both types of remittances diversify dependence, but still their share of external remittances in total income is slightly higher, representing 22% versus 14% attributed to internal remittances.
It is interesting to note that the total income of external-remittance households is higher than the total income of non-remittance and inter-nal-remittance households in most of the years and, on average, over the whole period. For almost all years, households receiving both kinds of remittances have the highest total income of all household categories.
For this study, household expenditure records have been divided into nine categories: Food, Health (medical services, medicines, health

Tabl
e 2.
Inco
me
and
Rem
ittan
ces
data
of N
on-r
emitt
ance
and
Rem
ittan
ce-r
ecei
ving
hou
seho
lds
(pes
os)
Sour
ce: E
ncue
sta
Nac
iona
l de
Ingr
esos
y G
asto
s de
los
Hog
ares
(en
igh
) 199
8-20
12.
N
ot
rem
ittan
ces
Inte
rnal
rem
ittan
ces
Ext
erna
l rem
ittan
ces
Bot
h re
mitt
ance
s
To
tal
Inco
me
Tota
lIn
com
eR
emitt
ance
s%
Tota
l In
com
eR
emitt
ance
s%
Tota
l In
com
eE
xter
nal
Rem
ittan
ces
Inte
rnal
R
emitt
ance
s% Ext
.% In
t.% Tota
l 19
981
102.
6290
0.62
185.
1520
.61
390.
0341
2.21
29.7
1 1
94.4
3 2
26.3
8 2
19.6
7 19
.018
.437
.320
001
256.
521
171.
3826
1.65
22.3
1 26
2.39
401.
4331
.8 1
312
.75
255
.87
187
.34
19.5
14.3
33.8
2002
1 08
0.39
1 04
3.14
246.
9723
.71
321.
9053
3.56
40.4
1 2
64.5
9 3
34.6
4 1
73.9
1 26
.513
.840
.220
041
383.
461
046.
9424
7.16
23.6
1 48
7.12
542.
8336
.5 1
759
.27
403
.60
228
.81
22.9
13.0
35.9
2006
1 62
1.72
1 34
6.05
357.
9626
.61
769.
0059
2.97
33.5
1 4
89.6
9 2
69.6
2 2
51.4
7 18
.116
.935
.020
081
583.
331
465.
3533
1.73
22.6
1 98
7.82
733.
4136
.9 1
929
.90
455
.46
324
.10
23.6
16.8
40.4
2010
2 43
9.05
2 11
4.04
408.
8919
.32
297.
3080
3.18
35.0
3 1
68.7
5 7
56.7
5 3
28.9
1 23
.910
.434
.320
122
597.
932
259.
9342
4.10
18.8
2 19
0.59
897.
5241
.0 3
045
.45
638
.16
347
.31
21.0
11.4
32.4
Obs
. 28
513
5 46
53
071
456

244
José Jorge Mora Rivera y Jesús Arellano González / Remittances as expenditure drivers in rural Mexico
insurance), Primary Education and Post-primary Education (tuition, materials, transportation), Durable Goods (furniture, household equip-ment, audiovisual equipment, vehicles), Non Durable Goods (household cleaning items, personal care items, clothing), Patrimony (additional constructions/renovations, purchases of houses and land), Business (purchases of machinery or animals for the production process) and Sav-ings (deposits, currencies, metals, stocks and bonds). The rest of house-hold expenditures are lumped into the Other category, (transportation, personal services, culture and entertainment, vehicle services, fuels and services, gifts, other expenditures and transfers, lending, debt service, insurances, inheritances, etc.).
Table 3 presents average budget shares for each of the nine expendi-ture categories defined above. In all, these nine categories make up 69% of total expenditure. As expected, food occupies the highest proportion of total expenditure for all of the household categories, with 41% for the entire sample. However, there seems to be differences in budget shares across household categories. Remittance receiving households devote sig-nificantly more of their total expenditure to health care (always above 5%) than non-remittance households, but less to primary education. Non-re-mittance households spend more on post-primary education than exter-nal-remittance households. Households receiving external and both types of remittances spend more on durable goods (3.62% and 4.21%, respec-tively) than non-remittance households (2.67%). Households receiving ex-ternal remittances have a higher share devoted to the patrimony category (2.25%) compared to non-remittance households (1.11%). There are no significant differences concerning the business category across household categories, although non-remittance households seem to allocate a larger share than internal-remittance households. It seems that external remit-tances create incentives to save as shown by the significantly higher share of savings for the external and both-remittance households, 5.97% and 4.27% respectively, compared to 3.50% for non-remittance households. These differences suggest that the expenditure behavior across household categories is affected by the remittance component.

Tabl
e 3.
Ave
rage
bud
get s
hare
s of
exp
endi
ture
cat
egor
ies
by N
on-r
emitt
ance
and
Rem
ittan
ce-r
ecei
ving
hou
seho
lds
(per
cent
ages
)
Sour
ce: E
ncue
sta
Nac
iona
l de
Ingr
esos
y G
asto
s de
los
Hog
ares
(en
igh
) 199
8-20
12.
Mea
n-di
ffer
ence
t-te
st
N
ot r
emitt
ance
sIn
tern
al
rem
ittan
ces
Ext
erna
l re
mitt
ance
s B
oth
rem
ittan
ces
No
rem
ittan
ces
vs I
nter
nal
rem
ittan
ces
No
rem
ittan
ces
vs E
xter
nal
rem
ittan
ces
No
rem
ittan
ces
vs B
oth
rem
ittan
ces
Food
41.8
242
.82
34.7
335
.98
-3.8
6***
24.2
0***
7.93
***
Prim
ary
Edu
catio
n2.
372.
002.
171.
655.
54**
*2.
35**
4.03
***
Pos-
prim
ary
Edu
catio
n0.
490.
530.
390.
44-0
.91
2.31
**0.
52
Hea
lth3.
605.
165.
186.
74-1
1.50
***
-8.9
5***
-6.2
4***
Dur
able
Goo
ds2.
672.
343.
624.
214.
14**
*-7
.23*
**-4
.21*
**N
on D
uran
le G
oods
13.6
112
.60
13.7
712
.52
8.73
***
-1.0
43.
15**
*Pa
trim
ony
1.11
1.07
2.25
1.46
0.54
-7.4
5***
-1.2
5B
usin
ess
0.19
0.13
0.23
0.36
1.81
*-0
.73
-1.0
9Sa
ving
s3.
502.
645.
974.
277.
35**
*-1
0.76
***
-1.7
3*O
ther
30.5
830
.66
31.6
432
.33
-0.3
2-3
.63*
**-2
.39*
*O
bs.
28 5
135
465
3 07
145
6
246
José Jorge Mora Rivera y Jesús Arellano González / Remittances as expenditure drivers in rural Mexico
Empirical model and results
Empirical Model
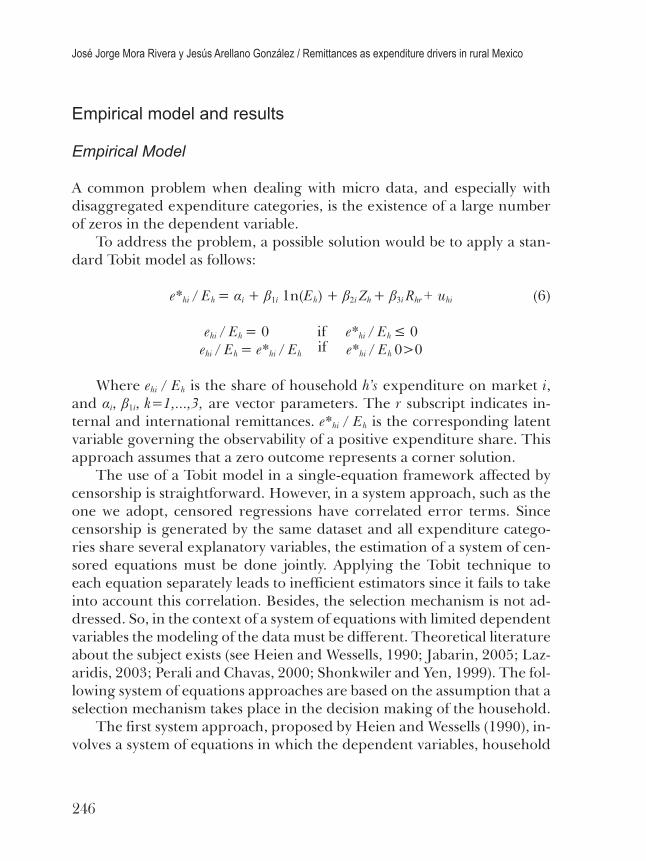
A common problem when dealing with micro data, and especially with disaggregated expenditure categories, is the existence of a large number of zeros in the dependent variable.
To address the problem, a possible solution would be to apply a stan-dard Tobit model as follows:
e*hi / Eh = αi + β1i 1n(Eh) + β2i Zh + β3i Rhr + uhi (6) ehi / Eh = 0 if e*hi / Eh ≤ 0 ehi / Eh = e*hi / Eh if e*hi / Eh 0>0
Where ehi / Eh is the share of household h’s expenditure on market i, and αi, β1i, k=1,...,3, are vector parameters. The r subscript indicates in-ternal and international remittances. e*hi / Eh is the corresponding latent variable governing the observability of a positive expenditure share. This approach assumes that a zero outcome represents a corner solution.
The use of a Tobit model in a single-equation framework affected by censorship is straightforward. However, in a system approach, such as the one we adopt, censored regressions have correlated error terms. Since censorship is generated by the same dataset and all expenditure catego-ries share several explanatory variables, the estimation of a system of cen-sored equations must be done jointly. Applying the Tobit technique to each equation separately leads to inefficient estimators since it fails to take into account this correlation. Besides, the selection mechanism is not ad-dressed. So, in the context of a system of equations with limited dependent variables the modeling of the data must be different. Theoretical literature about the subject exists (see Heien and Wessells, 1990; Jabarin, 2005; Laz-aridis, 2003; Perali and Chavas, 2000; Shonkwiler and Yen, 1999). The fol-lowing system of equations approaches are based on the assumption that a selection mechanism takes place in the decision making of the household.
The first system approach, proposed by Heien and Wessells (1990), in-volves a system of equations in which the dependent variables, household

247
Estudios Fronterizos, nueva época, vol. 17, núm. 33, enero-junio de 2016, pp. 231-259
expenditure shares, are censored by unobserved latent variables influenc-ing the decision to spend income on consumption or investment goods. In the system, expenditure by household h on market i is observed only if the household’s total desired expenditure on the item exceeds some threshold (i.e., ehi>0). This threshold will depend on the lumpiness of the good as well as the opportunity cost (the satisfaction or utility that the household would enjoy by spending this threshold amount on some other item). Assuming that the stochastic errors are approximately normal with zero mean and a finite variance-covariance matrix that is constant over all observations —that is, iid— the system of expenditure equations can be estimated using Lee’s (1981) generalization of Amemiya’s (1974) two-step estimator to a system of equations.
In the first stage, a probit is estimated for participation in each expenditure category as follows:
P*hi = f(δʹXh) + uhi (7)where Phi = 0 if Phi* ehi / Eh ≤ 0 Phi = 1 if Phi* ehi / Eh 0>0
In equation 7, Phi is the latent variable governing the decision of a household participating in market i. That is, the dependent variable in each probit is equal to 1 if ehi>0 and zero otherwise. Xh is a vector contain-ing Eh, Zh and Rh and δ is a vector of parameters to be estimated. In this first stage the vector Rh contains dummy variables indicating the remit-tance-receiving condition of each household.
The probit models are used to calculate a set of Inverse-Mills ratios, one for each expenditure category:
IMRhi = ϕ(δʹXh) / Φ(δʹXh) (8)
Where ϕ(δʹXh) denotes the standard normal density function and Φ(δʹXh) represents the cumulative normal distribution function.
In the second step, the Inverse-Mills ratios are included as right-hand-side variables in the corresponding expenditure equations to correct for self-selection. In this second stage, we replace the remittance-receiving
248
José Jorge Mora Rivera y Jesús Arellano González / Remittances as expenditure drivers in rural Mexico
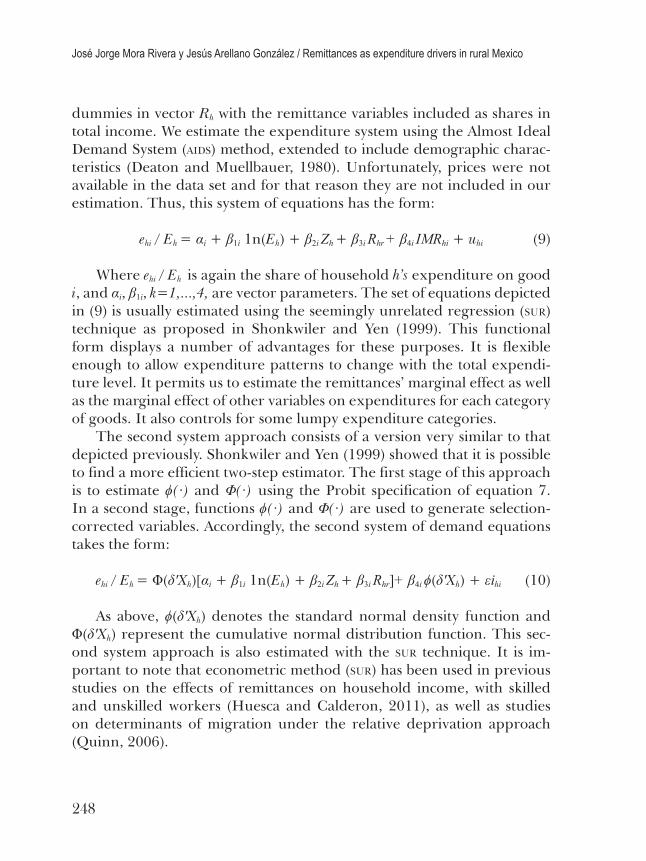
dummies in vector Rh with the remittance variables included as shares in total income. We estimate the expenditure system using the Almost Ideal Demand System (aids) method, extended to include demographic charac-teristics (Deaton and Muellbauer, 1980). Unfortunately, prices were not available in the data set and for that reason they are not included in our estimation. Thus, this system of equations has the form:
ehi / Eh = αi + β1i 1n(Eh) + β2i Zh + β3i Rhr + β4i IMRhi + uhi (9)
Where ehi / Eh is again the share of household h’s expenditure on good i, and αi, β1i, k=1,...,4, are vector parameters. The set of equations depicted in (9) is usually estimated using the seemingly unrelated regression (sur) technique as proposed in Shonkwiler and Yen (1999). This functional form displays a number of advantages for these purposes. It is flexible enough to allow expenditure patterns to change with the total expendi-ture level. It permits us to estimate the remittances’ marginal effect as well as the marginal effect of other variables on expenditures for each category of goods. It also controls for some lumpy expenditure categories.
The second system approach consists of a version very similar to that depicted previously. Shonkwiler and Yen (1999) showed that it is possible to find a more efficient two-step estimator. The first stage of this approach is to estimate ϕ(∙) and Φ(∙) using the Probit specification of equation 7. In a second stage, functions ϕ(∙) and Φ(∙) are used to generate selection-corrected variables. Accordingly, the second system of demand equations takes the form:
ehi / Eh = Φ(δʹXh)[αi + β1i 1n(Eh) + β2i Zh + β3i Rhr]+ β4i ϕ(δʹXh) + εihi (10)
As above, ϕ(δʹXh) denotes the standard normal density function and Φ(δʹXh) represent the cumulative normal distribution function. This sec-ond system approach is also estimated with the sur technique. It is im-portant to note that econometric method (sur) has been used in previous studies on the effects of remittances on household income, with skilled and unskilled workers (Huesca and Calderon, 2011), as well as studies on determinants of migration under the relative deprivation approach (Quinn, 2006).
249
Estudios Fronterizos, nueva época, vol. 17, núm. 33, enero-junio de 2016, pp. 231-259
Our empirical model is developed to test for remittances effects on expenditure patterns. The share of each household expenditure category in total expenditure is regressed, according to equation 10, against house-hold characteristics and the share of internal and external remittances in total income. Dummy variables for years and geographical regions were also included, with year 1998 and Region South as the base cases. The list of variables can be found in Table 4.
Results
Table 4 presents results on the estimation of equation 10. Household char-acteristics were found significant in several cases and mostly according to expectations. For instance, a one-year increase of a household head’s schooling decreases the share devoted to food by 0.30%, while a one-mem-ber increase of illiterate household members over 14 years old increases it by 1.14%. The presence of more people over 59 years old is associated with a lower share spent on food while more children below 7 years old have a positive impact.
A one-year increase in the household head’s schooling increases the share spent on primary education by 0.06%; this effect is 0.13% in the case of post-primary education. A household head working in agriculture is associated with a decrease of the share devoted to primary education and post-primary education by 0.13% and 0.26%, respectively. A household head being male decreases the share devoted to primary education by 0.23% but this effect is bigger for the case of post-primary education with a decrease of 0.75%. Having household members over 14 years old who are illiterate is associated with a decrease in expenditures devoted to primary education (0.13%).
The number of elderly people over 59 years old and children below 7 years old increases the share spent on health by 0.98% and 0.63%, respec-tively. A male household head and a male working in agriculture is associ-ated with higher levels of expenditure devoted to durable goods. A one year increase in household head’s schooling leads to an increase of 0.04% in the share devoted to Non-Durable Goods. It points out that house-holds headed by a male spend less on this category than those headed by

Food
Pri
mar
yE
duca
tion
Post-
prim
ary
Edu
catio
nH
ealth
Dur
able
Goo
dsN
on D
urab
le
Goo
dsPa
trim
ony
Bus
ines
sSa
ving
sO
uttr
ansf
ers
Log
arith
m o
f hou
seho
ld s
ize
-4.3
03(-
22.3
)***
0.53
9(5
.55)
***
4.50
3(1
7.61
)***
0.05
1(0
.35)
0.24
2(1
.82)
*0.
932
(8.9
7)**
*-0
.359
(-0.
96)
3.92
2(3
.46)
***
-0.0
76(-
0.24
)-4
.409
(-24
.7)*
**
Hou
seho
ld h
ead’
s ag
e-0
.162
(-5.
50)*
**-0
.002
(-0.
19)
-0.2
34(-
6.38
)***
-0.0
85(-
3.81
)***
-0.1
83(-
8.32
)***
-0.0
96(-
6.28
)***
-0.1
129
(-1.
71)*
-0.2
20(-
0.91
)0.
082
(1.5
2)0.
492
(17.
74)*
**
Hou
seho
ld h
ead’
s ag
e sq
uare
d0.
002
(5.2
0)**
*0.
0001
(1.5
2)0.
002
(4.7
3)**
*0.
001
(5.3
1)**
*0.
002
(7.0
2)**
*0.
0004
(2.8
3)**
*0.
0003
(0.4
2)0.
0001
(0.0
5)-0
.000
5(-
0.84
)-0
.004
(-14
.8)*
**
Hou
seho
ld h
ead’
s s
ex (1
=m
ale,
0=
fem
ale)
-0.0
91(-
0.38
)-0
.229
(-3.
91)*
**-0
.752
(-4.
03)*
**-0
.144
(-0.
84)
0.62
7(3
.85)
***
-0.2
73(-
2.25
)**
0.02
6(0
.05)
5.73
6(2
.54)
**-0
.202
(-0.
50)
0.42
8(1
.93)
*
Hou
seho
ld h
ead’
s sc
hool
ing
(yea
rs)
-0.3
04(-
11.1
)***
0.06
2(1
0.38
)***
0.12
5(6
.80)
***
-0.0
93(-
4.94
)***
0.00
5(0
.32)
0.03
7(2
.69)
***
-0.0
52(-
1.26
)-0
.885
(-5.
34)*
**-0
.010
(-0.
25)
0.30
9(1
2.08
)***
Hou
seho
ld h
ead
wor
ks
in a
gric
ultu
re (1
=ye
s, 0
=no
)0.
147
(0.8
8)-0
.131
(-3.
63)*
**-0
.261
(-1.
73)*
-0.5
18(-
4.32
)***
0.24
8(2
.27)
**0.
374
(4.3
9)**
*-1
.240
(-3.
56)*
**4.
950
(4.0
6)**
*2.
076
(7.1
6)**
*-1
.194
(-7.
65)*
**
A h
ouse
hold
mem
ber
over
age
14
is
illit
erat
e (1
=ye
s, 0
=no
)1.
139
(6.0
3)**
*-0
.130
(-3.
19)*
**0.
102
(0.5
4)0.
079
(0.5
7)0.
010
(0.0
8)-0
.713
(-7.
40)*
**1.
841
(4.2
5)**
*-5
.000
(-4.
03)*
**0.
535
(1.6
0)-1
.037
(-5.
87)*
**
Hou
seho
ld m
embe
rs o
ver
age
59-1
.178
(-6.
92)*
**-0
.145
(-3.
04)*
**-0
.824
(-4.
75)*
**0.
981
(8.0
3)**
*-0
.278
(-2.
30)*
*-0
.445
(-5.
08)*
**0.
965
(2.5
6)**
-3.6
20(-
3.36
)***
1.03
7(3
.54)
***
0.81
8(5
.13)
***
Hou
seho
ld m
embe
rs b
elow
age
70.
536
(5.6
7)**
*-0
.382
(-17
.4)*
**-0
.312
(-2.
66)*
*0.
628
(9.6
8)**
*0.
013
(0.2
2)-0
.479
(-9.
89)*
**0.
961
(5.0
1)**
*-2
.114
(-3.
53)*
**0.
789
(4.9
5)**
*-0
.539
(-6.
07)*
**
Hou
seho
ld m
embe
rs w
ith m
edic
al
sec
urity
-1.1
27(-
7.73
)***
0.10
1(3
.13)
***
-0.1
86(-
2.25
)**
-0.5
06(-
5.04
)***
0.15
0(1
.88)
*0.
435
(5.8
9)**
*0.
873
(4.1
8)**
*1.
142
(0.5
6)-1
.395
(-7.
46)*
**1.
002
(7.3
4)**
*
Hou
seho
ld h
as p
hone
ser
vice
(1=
yes,
0=
no)
-3.9
15(-
13.3
)***
0.25
9(3
.22)
***
0.22
2(1
.18)
-0.3
84(-
2.03
)**
-0.3
01(-
1.86
)*-0
.707
(-4.
72)*
**-0
.187
(-0.
46)
3.68
9(2
.32)
**-0
.970
(-2.
49)*
**6.
413
(23.
46)*
**
Hou
seho
ld h
as p
ublic
pro
visi
on
of w
ater
(1=
yes,
0=
no)
-0.1
03(-
0.60
)0.
025
(0.6
9)-0
.106
(-0.
65)
0.22
2(1
.77)
*-0
.205
(-1.
77)*
0.18
7(2
.12)
**0.
422
(1.1
4)-7
.882
(-6.
86)*
**0.
305
(1.0
0)-0
.575
(-3.
57)*
**
Hou
seho
ld h
as d
rain
age
(1=
yes,
0
=no
)-0
.538
(-2.
32)*
*0.
118
(2.3
2)**
0.31
0(2
.02)
**-0
.092
(-0.
58)
-0.0
02(-
0.01
)0.
482
(4.0
8)**
*-0
.022
(-0.
06)
-6.4
85(-
4.17
)***
-0.3
45(-
0.99
)1.
167
(5.3
7)**
*
Hou
seho
ld h
as e
lect
rici
ty (1
=ye
s,
0=
no)
-2.4
11(-
9.35
)***
-0.0
02(-
0.03
)-1
.668
(-3.
29)*
**-0
.116
(-0.
55)
1.06
0(4
.93)
***
-0.3
63(-
2.77
)***
0.65
9(0
.71)
6.77
3(3
.64)
***
-0.0
53(-
0.09
)1.
907
(8.0
0)**
*
Hou
seho
ld r
ecei
ved
a lo
an (1
=ye
s,
0
=no
)-2
.399
(-9.
38)*
**-0
.112
(-2.
36)*
*0.
296
(1.5
8)3.
119
(17.
62)*
**-0
.441
(-2.
99)*
**-0
.712
(-5.
47)*
**1.
539
(3.9
4)**
*9.
253
(8.5
5)**
*-4
.733
(-12
.5)*
**0.
493
(2.0
5)**
Prop
ortio
n of
inte
rnal
rem
ittan
ces
o
n to
tal i
ncom
e-0
.034
(-5.
49)*
**0.
004
(2.8
9)**
*0.
015
(2.2
7)**
0.01
8(4
.01)
***
0.00
3(0
.63)
0.01
4(4
.26)
***
0.03
3(2
.11)
**0.
091
(1.3
9)-0
.084
(-6.
25)*
**-0
.003
(-0.
60)
Tabl
e 4.
Hou
seho
ld e
xpen
ditu
re s
hare
s, s
eem
ingl
y un
rela
ted
regr
essi
ons

Not
e: T
otal
obs
erva
tions
: 37
505.
t st
atis
tic in
par
enth
esis
. ***
, **
and
* in
dica
te s
igni
fican
ce o
f par
amet
ers
at 0
.01,
0.0
5 an
d 0.
1, r
espe
ctiv
ely.
Food
Pri
mar
yE
duca
tion
Post-
prim
ary
Edu
catio
nH
ealth
Dur
able
Goo
dsN
on D
urab
le
Goo
dsPa
trim
ony
Bus
ines
sSa
ving
sO
uttr
ansf
ers
Prop
ortio
n of
ext
erna
l rem
ittan
ces
o
n to
tal i
ncom
e-0
.096
(-16
.9)*
**-0
.001
(-0.
98)
0.00
2(0
.30)
0.00
7(1
.87)
*0.
013
(3.9
0)**
*0.
024
(8.3
5)**
*0.
095
(9.8
2)**
*-0
.239
(-6.
13)*
**0.
017
(2.0
2)**
0.01
5(2
.86)
***
Log
arith
m o
f tot
al e
xpen
ditu
re-6
.629
(-50
.1)*
**0.
142
(6.1
8)**
*-0
.023
(-0.
31)
1.08
6(1
5.51
)***
1.13
4(2
0.26
)***
-2.6
57(-
40.6
)***
1.20
3(7
.60)
***
2.00
1(4
.22)
***
1.30
7(9
.93)
***
-0.2
84(-
2.36
)**
Year
Dum
my
=1
994
-3.5
65(-
11.2
)***
0.27
8(3
.03)
***
0.40
8(4
.36)
***
-0.0
14(-
0.09
)-0
.299
(-2.
50)*
*0.
003
(0.0
2)-0
.017
(-0.
15)
-0.0
91(-
1.81
)*0.
248
(1.3
4)2.
031
(6.8
4)**
*
Year
Dum
my
=19
960.
522
(1.6
1)0.
619
(6.6
3)**
*0.
706
(7.4
1)**
*0.
163
(1.0
0)-0
.241
(-1.
97)*
-0.2
07(-
1.30
)0.
237
(2.0
7)**
-0.0
41(-
0.80
)-0
.134
(-0.
71)
-3.2
00(-
10.5
)***
Year
Dum
my
=19
980.
030
(0.0
9)0.
550
(5.6
6)**
*0.
649
(6.5
4)**
*0.
341
(2.0
0)**
-0.2
38(-
1.86
)*0.
752
(4.5
1)**
*0.
107
(0.9
0)-0
.020
(-0.
38)
0.21
6(1
.10)
-3.4
70(-
10.9
)***
Year
Dum
my
=20
00-2
.331
(-6.
53)*
**0.
803
(7.8
6)**
*0.
909
(8.7
3)**
*0.
561
(3.1
4)**
*-0
.284
(-2.
11)*
*1.
851
(10.
52)*
**0.
263
(2.1
0)**
0.03
8(0
.69)
-0.0
29(-
0.14
)-3
.860
(-11
.6)*
**
Year
Dum
my
=20
02-1
.911
(-5.
9)**
*0.
815
(8.7
9)**
*0.
776
(8.1
8)**
*0.
870
(5.3
0)**
*-0
.269
(-2.
20)*
*2.
115
(13.
23)*
**-0
.003
(-0.
03)
-0.0
75(-
1.46
)0.
174
(0.9
3)-3
.044
(-9.
98)*
**
Year
Dum
my
=20
04-2
.009
(-6.
21)*
**0.
936
(10.
3)**
*0.
940
(10.
12)*
**0.
835
(5.0
7)**
*-0
.604
(-4.
97)*
**0.
911
(5.7
2)**
*-0
.075
(-0.
65)
0.02
6(0
.52)
-0.6
65(-
3.59
)***
-2.5
12(-
8.29
)***
Year
Dum
my
=20
05-5
.252
(-16
.7)*
**0.
780
(8.9
2)**
*0.
701
(7.8
1)**
*1.
492
(9.3
4)**
*-0
.171
(-1.
45)
1.54
1(9
.97)
***
0.02
1(0
.19)
0.01
4(0
.29)
-0.3
84(-
2.15
)**
-1.0
90(-
3.71
)***
Cen
ter
Reg
ion
Dum
my
-2.5
46(-
10.9
)***
0.56
0(8
.46)
***
0.64
4(9
.55)
***
0.06
7(0
.57)
-0.3
65(-
4.18
)***
-0.7
34(-
6.42
)***
0.02
7(0
.34)
-0.0
10(-
0.28
)0.
063
(0.4
8)3.
930
(18.
03)*
**
Cen
ter-
Wes
t Reg
ion
Dum
my
-4.0
30(-
18.5
)***
-0.2
13(-
3.53
)***
-0.1
01(-
1.64
)*0.
284
(2.6
0)**
*0.
094
(1.1
5)0.
957
(8.9
2)**
*-0
.158
(-2.
09)*
*0.
017
(0.5
1)0.
185
(1.5
0)3.
880
(19.
07)*
**
Nor
th-E
ast R
egio
n D
umm
y-5
.822
(-18
.7)*
**-0
.588
(-6.
84)*
**-0
.587
(-6.
69)*
**0.
321
(2.0
7)**
0.67
1(5
.78)
***
2.23
0(1
4.61
)***
-0.2
71(-
2.52
)**
0.00
4(0
.08)
0.63
8(3
.65)
***
5.54
7(1
9.18
)***
Nor
t-Wes
t Reg
ion
Dum
my
-6.4
80(-
24.8
)***
-0.5
51(-
7.62
)***
-0.5
02(-
6.79
)***
0.46
8(3
.57)
***
0.87
2(9
.04)
***
2.87
4(2
2.59
)***
-0.3
13(-
3.46
)***
0.05
9(1
.47)
0.77
6(5
.30)
***
4.68
8(1
9.41
)***
ϕ(δʹ
Xh)
-54.
099
(-33
.8)*
**-0
.834
(-7.
39)*
**4.
867
(19.
94)*
**9.
088
(9.6
8)**
*2.
149
(5.0
1)**
*-1
4.72
(-6.
24)*
**1.
712
(2.5
7)**
2.27
3(1
.66)
*7.
435
(10.
94)*
**-5
.415
(-2.
64)*
**
Con
stan
t11
2.89
7(8
7.7)
***
1.29
1(1
6.50
)***
1.24
6(1
5.74
)***
-5.3
60(-
10.0
)***
-1.3
10(-
6.46
)***
35.6
37(5
3.75
)***
-0.0
87(-
0.81
)-0
.049
(-1.
09)
-2.1
98(-
10.8
)***
22.0
02(1
8.70
)***
R2
0.24
0.05
0.06
0.05
0.09
0.13
0.06
0.05
0.10
0.14

252
José Jorge Mora Rivera y Jesús Arellano González / Remittances as expenditure drivers in rural Mexico
a female, with a decrease of 0.27%. Also, households with more illiterate members over 14 years old, children below 7 years old and elderly people over 59 years old are expected to spend less on this consumption category.
Households where the head works in agriculture spend more on the business category, with a significant increase of 9.5% of the share, but spend less on the patrimony category, with a decrease of 1.24%. These same households devote 2.1% more to savings. Also, households with a higher presence of members over 59 and below 7 years old are associated with higher levels of savings.
The loan dummy has significant effects on several categories, espe-cially in physical investment categories. Having a loan increases the share devoted to the patrimony and business categories by 1.5% and 9.3%, re-spectively. It is worth noting that it also has positive and significant effects the health categories, with an increase of 3.1%. This effect can be due to eventual medical needs that arise with a health emergency for which bor-rowing becomes a solution. Year and regional dummies were also found significant in several cases, indicating the presence of important time and location effects.
Moving to our results concerning remittances, we find that an in-crease in the share of internal remittances by 1% significantly decreases the share of food (-0.03%) and of savings (-0.08%) and increases that de-voted to health (0.02%), primary education (0.004%), post-primary edu-cation (0.015%), non-durable goods (0.003%) and patrimony (0.03%). An increase in the share of external remittances by 1% significantly decreases the share devoted to food (-0.10%) and to business (-0.24%) and increas-es that devoted to health (0.007%), durable goods (0.01%), nondurable goods (0.02%), patrimony (0.1%) and savings (0.02%).
These results shows that remittances, whether internal or external, have significant effects on the way households decide how to allocate their resources, these findings are consistent with Adams and Cuecuecha (2010), Adams, et al. (2008), Taylor and Mora (2006), Huesca and Calderón (2011) and Quinn (2006). Both types of income reduce the share devoted to food. Internal remittances seem to encourage education at every level. In contrast, external remittances do not affect education at any level. Both, internal and external remittances have positive effects on health and pat-rimony investments. They also affect positively the “current consumption”

253
Estudios Fronterizos, nueva época, vol. 17, núm. 33, enero-junio de 2016, pp. 231-259
of households captured in the non durable goods category. Only external remittances stimulate investments in Durable Goods, this is consistent with Quinn (2006).
There is no evidence of positive effects of remittances on the business category. We attribute the lack of significant effects of remittances on the business category to the fact that the number of observations might be too small to obtain reliable estimates. Out of 37 505 possible observations, only 471 recorded a positive amount of expenditure on business.
Concerning the results on savings, the two types of remittances have significant but opposite effects. While external remittances have a positive impact on household savings, internal remittances decrease savings, indi-cating a reallocation of household income. It is important to note that the positive effect of external remittances is lower than the negative effect of internal remittances.
Results of internal and external remittances for the food, health, non durable goods and patrimony categories are consistent with Hildebrandt and Mckenzie (2005), Canales and Montiel (2004) and Simiyu (2013). Only internal remittances have a positive effect at every level of education, being primary or post primary. There is no evidence of significant effects of external remittances on education, this result contrasts with the find-ings by Adams and Cuecuecha (2010) and Taylor and Mora (2006); and it is consistent with Hanson and Woodruff (2003), Borraz (2005), Suarez and Avellaneda (2007), Alcaraz, Chiquiar and Salcedo (2012), Pederzini and Meza (2009), Cuecuecha (2008), Medina and Cardona (2010), and Calde-rón and Huesca (2014).
It is important to remark that the effect of external remittances on the food, non durable goods and patrimony categories is higher than that of internal remittances. The opposite happens with health where internal remittances have a higher impact. These findings indicate a differentiated impact of remittances on human and physical capital categories. Internal remittances are mainly devoted to human development while external re-mittances are mainly devoted to physical capital investments. A possible explanation for this result relies on the nature of both types of income. Human capital investments tend to be constant over time, especially those on education. In contrast, physical capital investments are not as frequent and most of the times they are contingent upon the availability of monetary

254
José Jorge Mora Rivera y Jesús Arellano González / Remittances as expenditure drivers in rural Mexico
resources. If internal remittances present a lower variability, then house-holds may decide to use them in an expenditure category that requires a constant injection of resources. On the other side, if external remittances are highly volatile, households may decide to use them in eventual invest-ments such as furnishing or renovating the house as well as purchasing lands or new houses.
A surprising finding is the significant effect of the loan dummy across expenditure categories. Access to capital markets seems to shape con-sumption behavior of rural households which is consistent with standard consumer theory.
Conclusions
Studies of the impact of remittances on local households (Adams and Cue-cuecha, 2010; Alcaraz et al., 2012; Edwards and Ureta, 2003) have neglect-ed the fact that some decisions inside the home can only be imperfectly monitored and household decision-making may not be fully cooperative, and they also have omitted the intra-household approach (Thomas, 1990). The existence of such behavior among household members would suggest that expanding opportunities for migration will have different effects on expenditure patterns than simply increasing the amount of income re-ceived by the household (Chen, 2006). Unfortunately, these subjects are beyond the scope of this paper, but it could be included in future research agenda.
However, considering our findings, a simple comparison of house-holds with and without remittances reveals that the former group spends more of their income on health, durable goods, and patrimony. There are other significant differences that indicate that consumption preferences may be shaped by the remittance-receiving condition. External remittance households have higher incomes than internal or non-remittance house-holds, on average, and socio-demographic characteristics across different household categories differ as well. It is not clear, a priori, whether dif-ferences in average expenditures between remittance-receiving and non-remittance households are due to remittances or to differences in total income or other variables.

255
Estudios Fronterizos, nueva época, vol. 17, núm. 33, enero-junio de 2016, pp. 231-259
In this work, we have presented an empirical specification that controls for censoring on household demands. Our findings indicate that there is evidence of significant effects of internal and external remittances on household expenditure patterns; these income sources are not fungible and reshape household demands in ways that are independent of total income. Moreover, effects are different for each type of remittances. In-ternal remittances seem to stimulate more categories related to human de-velopment investments, health and education, while external remittances affect positively physical capital investments. External remittances have a positive effect on health and no significant effects on education.
Remittances represent a constant and permanent flow of monetary resources for those households that are heavily dependent on such in-come source and can be therefore be viewed as permanent income. In this case households can make consumption and investment decisions based on them.
Our findings do not support the view that households receiving remit-tances disproportionately spend their income on “current consumption”. Besides evidence of positive effects on current consumption, our findings reveal that remittances influence other expenditure patterns in rural ar-eas of Mexico. In particular, the propensity to spend on some investment categories (education, health, durable goods and patrimony) appears to be considerably larger for remittance-receiving households, internal or external, than for non-remittance households.
As rural incomes rise, expenditure patterns change. This is true re-gardless of whether the income gains are from migrant remittances or other sources. The key question that should be of interest to research-ers and policy makers is whether expenditure patterns change differently for households that receive remittances. This study has shown that they indeed change, most of the time in a way improving the well-being of remittance-receiving households.
References
Adams, R. H. Jr. (1998). Remittances, Investment and Rural Asset Accumulation in Pakistan. Economic Development and Cultural Change, 47(1), 155-173.
256
José Jorge Mora Rivera y Jesús Arellano González / Remittances as expenditure drivers in rural Mexico
Adams, R. H. Jr. (2011). Evaluating the Economic Impact of International Re-mittances on Developing Countries Using Household Surveys: A Literature Review. The Journal of Development Studies, 47(6), 809-828.
Adams, R. H. Jr. and Cuecuecha, A. (2010). Remittances, Household Expenditure and Investment in Guatemala. World Development, 38(11), 1626-1641.
Adams, R. H. Jr., Cuecuecha, A. and Page, J. (2008). Remittances, Consumption and Investment in Ghana (World Bank Policy Research Working Paper Series No. 4515). Washington, District of Columbia: World Bank.
Alcaraz, C., Chiquiar, D. and Salcedo, A. (2012). Remittances, Schooling and Child Labor in Mexico. Journal of Development Economics, 97(1), 156-165.
Alderman, H. (1996). Saving and Economic Shocks in Rural Pakistan. Journal of Devel-opment Economics, 51(2), 343-365.
Amemiya, T. (1974). Mutivariate Regression and Simultaneous Equation Models When the Dependent Variables are Truncated Normal. Econometrica, 42(6), 999-1012.
Barham, B. and Boucher, S. (1998). Migration, Remittances and Inequality: Esti-mating the Net Effects of Migration on Income Distribution. Journal of Devel-opment Economics, 55(2), 307–331.
Borraz, F. (2005). Assessing the Impact of Remittances on Schooling: the Mexican Experience. Global Economy Journal, 5(1), 1-32.
Calderón, C. and Huesca, L. (2014). Profile of earners and remittances in Mexi-co: a relative deprivation approach. Accounting and Management: International Journal, 59(3), 11-33.
Canales, A. and Montiel, I. (2004). Remesas e inversión productiva en comuni-dades de alta migración a Estados Unidos. El caso de Teocaltiche, Jalisco. Migraciones Internacionales, 2(3), 142-172.
Chami, R., Fullenkamp, C. and Jahjah, S. (2005). Are Immigrant Remittance Flows a Source of Capital for Development? International Monetary Fund (imf) Staff Paper, 52(1), 55-81.
Chen, J. T. (2006). Migration and Imperfect Monitoring: Implications for Intra-Household Allocation. The American Economic Review, 96(2), 227-231.
Clément, M. (2011). Remittances and Household Expenditure Patterns in Tajiki-stan: A Propensity Score Matching Analysis. Asian Development Review, 28(2), 58-87.
Cornelius, W. (1990). Labor Migration to the United States: Development Outcomes and Alternatives in Mexican Sending Communities. Washington, District of Columbia: Commission for the Study of International Migration and Cooperative Eco-nomic Development.
Cuecuecha, A. (February, 2008). The Effect of Remittances and Migration on Human Capital: Evidence from Mexico (Working paper No. 455). Mexico: Centro de In-vestigación y Docencia Económicas.

257
Estudios Fronterizos, nueva época, vol. 17, núm. 33, enero-junio de 2016, pp. 231-259
Deaton, A. and Muellbauer, J. (1980). An Almost Ideal Demand System. American Economic Review, 70(3), 313-326.
Duflo, E. and Udry, C. (May, 2004). Intrahousehold resource allocation in Cote D’Ivoire: social norms, separate accounts and consumption choices (nber Working Paper No. 10498). Cambridge, Massachusetts: National Bureau of Economic Research.
Durand, J. and Massey, D. S. (1992). Mexican Migration to the United States: A Critical Review. Latin American Research Review, 27, 3-42.
Edwards, A. and Ureta, M. (2003). International Migration, Remittances and Schooling: Evidence from El Salvador. Journal of Development Economics, 72(2), 429-461.
Escobar, A. and Martínez, M. de la O. (1990). Small-scale Industry and Interna-tional Migration in Guadalajara, Mexico (Working Paper No. 53). Washington, District of Columbia: Commission for the Study of International Migration and Cooperative Economic Development.
Goldring, L. (1990). Development and Migration: A Comparative Analysis of Two Mexi-can Migrant Circuits. Washington, District of Columbia: Commission for the Study of International Migration and Cooperative Economic Development.
Haas, H. de (2010). Migration and Development: A Theoretical Perspective. Inter-national Migration Review, 44(1), 227–264.
Hanson, G. H. and Woodruff, C. (2003). Emigration and Educational Attainment in Mexico. United States: National Bureau of Economic Research, University of California-San Diego, Mimeo.
Heien, D. and Wessells, C. R. (1990). Demand systems estimation with microda-ta: a censored regression approach. Journal of Business and Economic Statistics, 8(3), 365-371.
Hildebrandt, N. and McKenzie, D. (2005). The Effects of Migration on Child Health in Mexico. Economía, 6(1), 257-289.
Huesca, L. and Calderón, C. (2011). Determinación de remesas en familias de migrantes calificados y no calificados en México. In J. Aguirre and J. Lenin (Coords.), Transnacionalismo y Desarrollo en México (1ª ed., pp. 39-52). Mexico: Asociación Nacional de Instituciones de Docencia en Investigación Económi-ca, El Colegio de Tlaxcala, Universidad Michoacana de San Nicolás de Hi-dalgo.
Jabarin, A. S. (2005). Estimation of meat demand system in Jordan: an almost ideal demand system. International Journal of Consumer Studies, 29(3), 232-238.
Lazaridis, P. (2003). Household Meat Demand in Greece: A Demand System Approach Using Microdata. Agribusiness, 19(1), 43-59.
Lee, L. (1981). Simultaneous Equation Models with Discrete and Censored De-pendent Variables. In Manski, P. and McFadden, D. (Eds.), Structural Analy-sis and Discrete Data with Econometric Applications (pp. 346-364). Cambridge, Massashusetts: MIT Press.

258
José Jorge Mora Rivera y Jesús Arellano González / Remittances as expenditure drivers in rural Mexico
López-Córdova, E., Tokman, A. and Verhoogen, E. (2005). Globalization, Migra-tion and Development: The role of Mexican Migrant Remittances. Economía, 6(1), 217-256.
Lozano, F., Huesca, L. and Valdivia, M. (March, 2010). Contribución de las remesas a los ingresos públicos en México (Working Paper No. 1). Chicago, Illinois: Na-tional Alliance of Latin American and Caribean Communities.
Massey, D. S., Alarcón, R., Durand, J. and González, H. (Eds.). (1987). Return to Aztlan: The Social Process of International Migration from Western Mexico. United States: University of California Press.
Medina, C. and Cardona, L. (2010). The Effects of Remittances on Household Consumption, Education Attendance and Living Standards: the Case of Co-lombia. Lecturas de Economía, (72), 11-43.
Papademetrious, D. G. and Martin, P. L. (Eds.). (1991). The Unsettled Relationship: Labor Migration and Economic Development. New York: Greenwood Press.
Pederzini, C. and Meza, L. (2009). Migración internacional y escolaridad como medios alternativos de movilidad social: el caso de México. Estudios Económicos, número extraordinario, 163-206.
Perali, F. and Chavas, J. P. (2000). Estimation of Censored Demand Equations from Large Cross-Section Data. American Journal of Agricultural Economics, 82(4), 1022-1037.
Quinn, Michael A. (2006).Relative Deprivation wage differentials and Mexican migration. Review of Development Economics, 10(1) 135-153.
Randazzo, T. and Piracha, M. (2014). Remittances and Household Expenditure Be-haviour in Senegal (Discussion Paper No. 8106). Germany: The Institute for the Study of Labor iza.
Ratha, D., Mohapatra, S. and Xu, Z. (2008). Migration and development brief. Washington, District of Columbia: Migration and Remittances Team, Devel-opment Prospects Group, World Bank.
Reichert, J. S. (1981). The Migrant Syndrome: Seasonal U.S. Wage Labor and Rural Development in Central Mexico. Human Organization, 40(1), 56-66.
Rubenstein, H. (1992). Migration, Development and Remittances in Rural Mexico. International Migration, 30(2), 127-153.
Shonkwiler, J. S. and Yen, S. T. (1999). Two-step estimation of a censored system of equations. American Journal of Agricultural Economics, 81(4), 972-82.
Simiyu, C. N. (2013). Remittance and Household Expenditures in Kenya. Journal of Emerging Issues in Economics, Finance and Banking, 2(3), 718-728.
Suarez, J. C and Avellaneda, Z. (2007). Juanita´s Money Order: Income effects on Hu-man Capital Investment in Mexico. Mexico: Fundación idea.
Taylor, J. E. and Mora, J. (February, 2006). Does Migration Reshape Expenditures in Rural Households? Evidence from Mexico. (World Bank Policy Research Working Paper No. 3842). Washington, District of Columbia: World Bank.
259
Estudios Fronterizos, nueva época, vol. 17, núm. 33, enero-junio de 2016, pp. 231-259
Taylor, J. E., Massey, D. S., Arango, J., Hugo, G., Kouaouci, A. and Pellegrino, A. (1996). International Migration and Community Development. Population Index, 62(3), 397-418.
Taylor, J. E., Mora, J., Adams, R. and López-Feldman, A. (2008). Remittances, Inequality and Poverty: Evidence from Rural Mexico. In J. DeWind and J. Holdaway (Eds.), Migration and Development Within and Across Borders: Research and Policy Perspectives on Internal and International Migration (pp. 101-130). Geneva: International Organization for Migration.
Taylor, J. E., Rozelle, S. and de Brauw, A. (2003). Migration and Incomes in Source Communities: A New Economics of Migration Perspective from Chi-na, Economic Development and Cultural Change, 52(1), 75-101.
Thomas, D. (1990). Intra-household Resource Allocation: An Inferential Ap-proach. The Journal of Human Resources, 25(4), 635-664.
United Nations (UN). (2013). International Migration Report 2013. New York, New York: Department of Economic and Social Affairs, Population Division.
Woodruff, C. and Zenteno, R. (2007). Migration Networks and Microenterprises in Mexico. Journal of Development Economics, 82(2), 509-528.
World Bank. (2013). World Development indicators 2013. Washington, District of Columbia: Author.
Yaméogo, N. D. (2014). Analysis of Household Expenditures and the Impact of Remit-tances using a Latent Class Model: the Case of Burkina Faso (Working Paper Series No 200). Tunis, Tunisia: African Development Bank.
Yang, D. (2005). International Migration, Human Capital and Entrepreneurship: Evi-dence from Philippine Migrants’ Exchange Rate Shocks (Policy Research Working Paper Series No. 3578). Washington, District of Columbia: World Bank.
Zarate-Hoyos, A. (2004). Consumption and Remittances in Migrant Households: Toward a Productive Use of Remittances. Contemporary Economic Policy, 22(4), 555-565.