remittances to latin america and the caribbean · pdf fileel salvador 4.217 costa rica 0.559...
TRANSCRIPT

REMITTANCES TO LATIN AMERICA AND THE CARIBBEAN
SET A NEW RECORD HIGH
IN 2014

pAgE/2
ToTal:
US$65.382 billion
REMITTANCES TO LATIN AMERICA AND THE CARIBBEAN SET A NEW RECORD HIGH IN 2014

pAgE/3REMITTANCES TO LATIN AMERICA AND THE CARIBBEAN SET A NEW RECORD HIGH IN 2014
MExico
23.645
GuaTEMala
5.544
BEliZE
0.126
NicaraGua
1.136TriNidad & ToBaGo
0.138GuyaNa
0.438coloMBia
4.093
SuriNaME
0.151
BraZil
1.910ParaGuay
0.608uruGuay
0.134
arGENTiNa
1.009
VENEZuEla
0.897
HoNduraS
3.353
HaiTi
1.923doMiNicaN rEPuBlic
4.571
El SalVador
4.217 coSTa rica
0.559 PaNaMa
0.847Ecuador
2.462PEru
2.639
cHilE
0.488
BoliVia
1.164
jaMaica
2.160
TOTAL AMOUNT OF REMITTANCES RECEIVED IN 2014By country in billions uS$

Copyright © 2015 Inter-American Development Bank.
This work is licensed under a Creative Commons IgO
3.0 Attribution-NonCommercial-NoDerivatives (CC-
IgO BY-NC-ND 3.0 IgO) license (http://creativecom-
mons.org/licenses/by-nc-nd/3.0/igo/legalcode) and
may be reproduced with attribution to the IDB and for
any non-commercial purpose. No derivative work is
allowed.
Any dispute related to the use of the works of the IDB
that cannot be settled amicably shall be submitted to
arbitration pursuant to the UNCITRAL rules. The use of
the IDB’s name for any purpose other than for attribu-
tion, and the use of IDB’s logo shall be subject to a sep-
arate written license agreement between the IDB and
the user and is not authorized as part of this CC-IgO li-
cense.
Note that link provided above includes additional
terms and conditions of the license.
The opinions expressed in this publication are those of
the authors and do not necessarily reflect the views of
the Inter-American Development Bank, its Board of Di-
rectors, or the countries they represent.
AUTHORS: René Maldonado, coordinator of the MIF
project "Improving Central Bank Remittance Report-
ing and procedures," in collaboration with Maria Lui-
sa Hayem of the MIF's Access to Finance Unit.
SUggESTED CITATION: Maldonado, R., Hayem, M.
"Remittances to Latin America and the Caribbe-
an Set a New Record High in 2014." Multilateral In-
vestment Fund, Inter-American Development Bank.
Washington, D.C., 2015.

/CONTENTS
pART ONE
REMITTANCES IN 2014
pART TWO
THE EFFECT OF THE ECONOMIC SITUATION
IN SENDINg COUNTRIES ON REMITTANCE FLOWS
pART THREE
THE EFFECT OF RECEIVINg COUNTRIES'
STATUS ON INFLOW OF REMITTANCES
CONCLUSIONS AND pROSpECTS FOR 2015
6
12
26
34
pAgE/6 PART ONE
REMITTANCES IN 2014
ParT oNE
1

pAgE/7REMITTANCES TO LATIN AMERICA AND THE CARIBBEAN SET A NEW RECORD HIGH IN 2014 pAgE/7
Ever since the 2008-2009 international financial crisis and up until 2013, remittances sent to the Latin American and Caribbean (LAC) region had been unable to regain sufficient growth to surpass or at least equal the levels observed in 2008, the year in which remittances attained their historic peak. By December 2014, however, total annual remittances sent to the region not only were higher compared with the previous year but also in relation to 2008. The annual variation rate in remittan-ces in 2013 and 2014 was 5.3%, which meant a total income of remittances to LAC of US$ 65.4 billion.
FiGurE 1: rEMiTTaNcES To laTiN aMErica aNd THE cariBBEaN (2001-2014) (US$ BILLIONS)
70
60
50
40
30
20
10
02001 2002 2003 2004 2005 2006 2007 2008 2009 2010 2011 2012 2013 2014
[ Source: Authors' own calculations based on MIF estimates.
21.928.0
33.740.6
48.7
57.564.3
56.464.9
57.9 61.2 61.8 62.1 65.4
Note: Data on remittance trends reflect adjustments to estimates published in reports in Brazil, Chile, El Salvador, Haiti, Honduras, Mexico, Nicaragua, the Dominican Republic, and Suriname.
Without a doubt the sharpest drop in remittance flows into LAC in the last 15 years occurred in 2009, when, as a result of the international financial crisis that had detonated one year earlier, remittance flows fell more than 10% after several years of sustained growth. Since then, remittance flows to LAC recovered slightly in 2010 and 2011, and later stabilized at practically zero growth until 2013. Finally, be-tween 2013 and 2014, remittance growth rates retook their positive trajectory and although still lower than pre-crisis levels, presented significant positive growth for the first time in two years.
pAgE/8 PART ONE
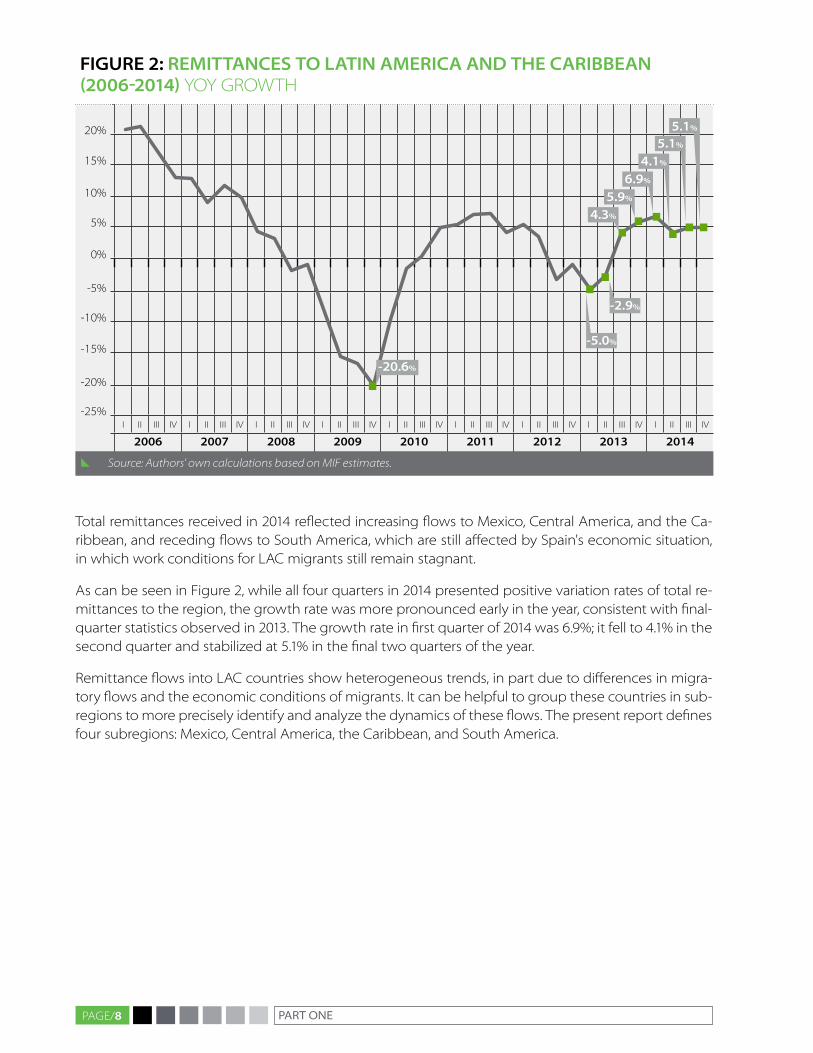
FiGurE 2: rEMiTTaNcES To laTiN aMErica aNd THE cariBBEaN (2006-2014) YOY gROWTH
20%
15%
10%
5%
0%
-5%
-10%
-15%
-20%
-25%I II III IV I II III IV I II III IV I II III IV I II III IV I II III IV I II III IV I II III IV I II III IV
2006 2007 2008 2009 2010 2011 2012 2013 2014
[ Source: Authors' own calculations based on MIF estimates.
-5.0%
-20.6%
5.1%
4.1%
6.9%
5.9%
4.3%
5.1%
-2.9%
Total remittances received in 2014 reflected increasing flows to Mexico, Central America, and the Ca-ribbean, and receding flows to South America, which are still affected by Spain's economic situation, in which work conditions for LAC migrants still remain stagnant.
As can be seen in Figure 2, while all four quarters in 2014 presented positive variation rates of total re-mittances to the region, the growth rate was more pronounced early in the year, consistent with final-quarter statistics observed in 2013. The growth rate in first quarter of 2014 was 6.9%; it fell to 4.1% in the second quarter and stabilized at 5.1% in the final two quarters of the year.
Remittance flows into LAC countries show heterogeneous trends, in part due to differences in migra-tory flows and the economic conditions of migrants. It can be helpful to group these countries in sub-regions to more precisely identify and analyze the dynamics of these flows. The present report defines four subregions: Mexico, Central America, the Caribbean, and South America.

pAgE/9REMITTANCES TO LATIN AMERICA AND THE CARIBBEAN SET A NEW RECORD HIGH IN 2014
FiGurE 3: rEMiTTaNcES To laTiN aMErica aNd THE cariBBEaN (2006-2014)
(US$ BILLIONS)
30
25
20
15
10
5
Mexico central america caribbean South america
2006 2007 2008 2009 2010 2011 2012 2013 2014
[ Source: Authors' own calculations based on MIF estimates.
Mexico alone receives more than one-third of all remittances sent to LAC. The 2008-2009 financial crisis caused an abrupt drop in remittance flows to Mexico, largely due to the country's high depen-dence on the United States, which was deeply affected by the crisis, as its principal source of remit-tance inflows. In the first five years after the crisis, remittances to Mexico showed irregular behavior and even fell into negative growth rates in 2012 and 2013. In 2014, however, remittances to Mexico show positive growth of 8.0% compared with the previous year.
In all four quarters of 2014, growth rates of remittances to Mexico were positive. The highest annu-al growth rate (11.7%) was observed in the first quarter of 2014, and the lowest in the second quar-ter (3.8%). The increase in remittances in this quarter reflects the seasonal spike that regularly occurs in Mexico around Mother's Day (in May). Although remittances in May 2013 fell 13% compared with the previous year, May 2014 was the month in which the highest volume of remittances was received,
both in number of transfers and total amount.1 With these growth rates, remittance flows to Mexico in 2014 attained the highest level in six years: US$23.6 billion.
Remittances to central america, as in previous years, have continued a positive growth trend, and the primary receivers of these flows are El Salvador, guatemala, and Honduras. In 2009, as a result of the international financial crisis, remittance flows to Central America dropped 9.0%, albeit less than to the region as a whole. After 2010, this subregion regained levels similar to pre-crisis growth rates, with sustained rhythm, including up to last year. Remittance flows to Central America in 2014 soared to US$15.8 billion, at an annual growth rate of 7.4%, and Honduras is the country with the greatest in-crease (8.8%), followed by guatemala with an 8.6% increase.
1 Based on Bank of Mexico data, in May 2014 remittances rose 13.0% in number and 9.1% in total amount compared with 2014 averages.
pAgE/10 PART ONE
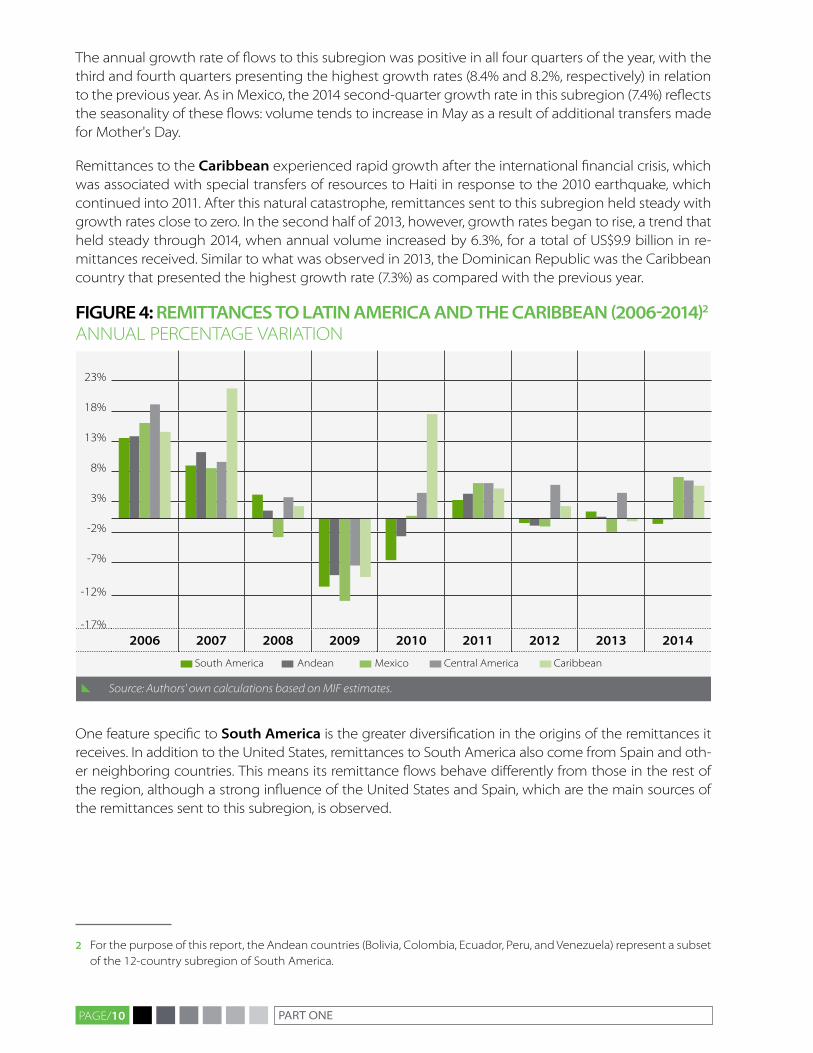
The annual growth rate of flows to this subregion was positive in all four quarters of the year, with the third and fourth quarters presenting the highest growth rates (8.4% and 8.2%, respectively) in relation to the previous year. As in Mexico, the 2014 second-quarter growth rate in this subregion (7.4%) reflects the seasonality of these flows: volume tends to increase in May as a result of additional transfers made for Mother's Day.
Remittances to the caribbean experienced rapid growth after the international financial crisis, which was associated with special transfers of resources to Haiti in response to the 2010 earthquake, which continued into 2011. After this natural catastrophe, remittances sent to this subregion held steady with growth rates close to zero. In the second half of 2013, however, growth rates began to rise, a trend that held steady through 2014, when annual volume increased by 6.3%, for a total of US$9.9 billion in re-mittances received. Similar to what was observed in 2013, the Dominican Republic was the Caribbean country that presented the highest growth rate (7.3%) as compared with the previous year.
FiGurE 4: rEMiTTaNcES To laTiN aMErica aNd THE cariBBEaN (2006-2014)2 ANNUAL pERCENTAgE VARIATION
23%
18%
13%
8%
3%
-2%
-7%
-12%
-17%2006 2007 2008 2009 2010 2011 2012 2013 2014
South America Andean Mexico Central America Caribbean
[ Source: Authors' own calculations based on MIF estimates.
One feature specific to South america is the greater diversification in the origins of the remittances it receives. In addition to the United States, remittances to South America also come from Spain and oth-er neighboring countries. This means its remittance flows behave differently from those in the rest of the region, although a strong influence of the United States and Spain, which are the main sources of the remittances sent to this subregion, is observed.
2 For the purpose of this report, the Andean countries (Bolivia, Colombia, Ecuador, peru, and Venezuela) represent a subset of the 12-country subregion of South America.

pAgE/11REMITTANCES TO LATIN AMERICA AND THE CARIBBEAN SET A NEW RECORD HIGH IN 2014
This subregion's heterogeneity can also be seen in the different economic development levels of the countries that make it up and therefore the wage differences observed between them. This generates intraregional migration and remittance flows within the subregion, in corridors such as those from Ar-gentina and Brazil to Bolivia and paraguay, and from Venezuela to Colombia, although the importance of these flows is relatively low.
In this context, and unlike what occurred in the other LAC subregions, in 2014 remittance flows to South America fell about 1.0% compared with the previous year. Total remittances to this subregion topped US$ 15.9 billion. In previous years, falling rates in remittances to this subregion were related to lower vol-umes of remittances being sent to Brazil. However, in recent years this country has shown greater stabil-ity in remittances received; the growth rate remained negative ( 1.7%), but was significantly less than in earlier years. paraguay was the country that showed the greatest drop in remittance flows with a neg-ative annual growth rate of 18.1%, tied to the reduced flow from Spain. Colombia was the primary re-mittance-receiving country in this subregion and fifth (5th) country in all of LAC, experiencing a slight growth in incoming flows (9.5%) compared with the previous year.
The Andean countries (Bolivia, Colombia, Ecuador, peru, and Venezuela) received almost 70% of the re-mittances sent to South America, presenting a slightly positive growth rate of 0.1% for 2014, so remit-tances sent to this subregion totaled almost US$ 11.3 billion. The constrained growth was associated with a stagnant job market in intraregional remittance-sending countries (Venezuela in particular), as well as in Spain, where the economic situation is still in the recovery process.
FiGurE 5: TrENdS iN rEMiTTaNcES To laTiN aMErica aNd THE cariBBEaN (2002-2015) US$ THOUSANDS
7.000
6.000
5.000
4.000
3.000
3.000
1.000
0I II IIII IV I II IIII IV I II IIII IV I II IIII IV I II IIII IV I II IIII IV I II IIII IV I II IIII IV I II IIII IV I II IIII IV I II IIII IV I II IIII IV I II IIII IV I II IIII IV
2002 2003 2004 2005 2006 2007 2008 2009 2010 2011 2012 2013 2014 2015
South America Andean Mexico Central America Caribbean
[ Source: Authors' own calculations based on MIF estimates.

pAgE/12 PART ONE2THE EFFECT OF THE ECONOMIC SITUATION IN SENDING COUNTRIES ON REMITTANCE FLOWS
ParT TWo
pAgE/13REMITTANCES TO LATIN AMERICA AND THE CARIBBEAN SET A NEW RECORD HIGH IN 2014
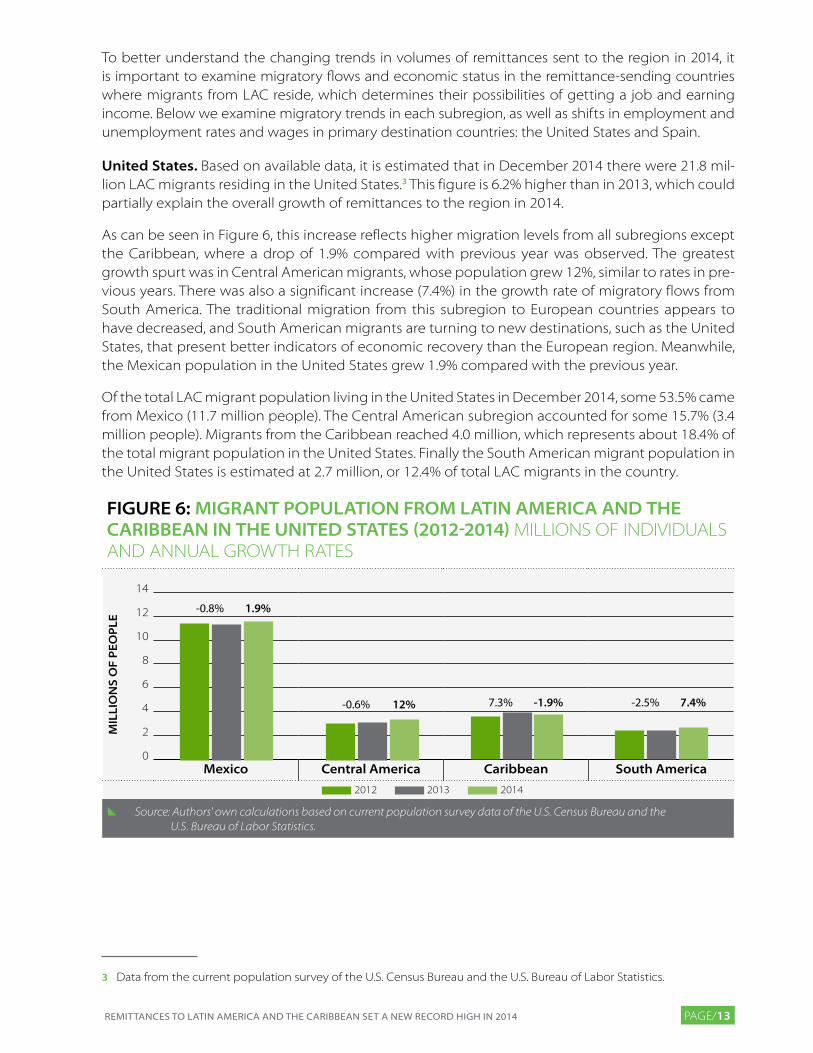
To better understand the changing trends in volumes of remittances sent to the region in 2014, it is important to examine migratory flows and economic status in the remittance-sending countries where migrants from LAC reside, which determines their possibilities of getting a job and earning income. Below we examine migratory trends in each subregion, as well as shifts in employment and unemployment rates and wages in primary destination countries: the United States and Spain.
united States. Based on available data, it is estimated that in December 2014 there were 21.8 mil-lion LAC migrants residing in the United States.3 This figure is 6.2% higher than in 2013, which could partially explain the overall growth of remittances to the region in 2014.
As can be seen in Figure 6, this increase reflects higher migration levels from all subregions except the Caribbean, where a drop of 1.9% compared with previous year was observed. The greatest growth spurt was in Central American migrants, whose population grew 12%, similar to rates in pre-vious years. There was also a significant increase (7.4%) in the growth rate of migratory flows from South America. The traditional migration from this subregion to European countries appears to have decreased, and South American migrants are turning to new destinations, such as the United States, that present better indicators of economic recovery than the European region. Meanwhile, the Mexican population in the United States grew 1.9% compared with the previous year.
Of the total LAC migrant population living in the United States in December 2014, some 53.5% came from Mexico (11.7 million people). The Central American subregion accounted for some 15.7% (3.4 million people). Migrants from the Caribbean reached 4.0 million, which represents about 18.4% of the total migrant population in the United States. Finally the South American migrant population in the United States is estimated at 2.7 million, or 12.4% of total LAC migrants in the country.
3 Data from the current population survey of the U.S. Census Bureau and the U.S. Bureau of Labor Statistics.
FiGurE 6: MiGraNT PoPulaTioN FroM laTiN aMErica aNd THE cariBBEaN iN THE uNiTEd STaTES (2012-2014) MILLIONS OF INDIVIDUALS AND ANNUAL gROWTH RATES
Mil
lio
NS
oF
PEo
PlE
14
12
10
8
6
4
2
0Mexico central america caribbean South america
2012 2013 2014
[ Source: Authors' own calculations based on current population survey data of the U.S. Census Bureau and the U.S. Bureau of Labor Statistics.
-0.8% 1.9%
-0.6% 12% 7.3% -1.9% -2.5% 7.4%

pAgE/14 PART TWO
FEaTurES oF THE MiGraNT PoPulaTioN FroM laTiN aMErica aNd
THE cariBBEaN iN THE uNiTEd STaTES
Of the total migrants from Latin America and the Caribbean living in the United States in Decem-ber 2013, 50.1% were men and 49.9% were women.4 In terms of migratory flow by gender, data have shown that men move more frequently than do women, who tend to be more stable once they have entered the United States.
Annual flow of migrants from Latin America and the Caribbean to the United States by gender (2007-2013)
202,557
2007
-237,378
2008
215,758
2009
219,032
2010-56,1722011
9,930
2012
143,164
2013
150,094
2007
-1,148
2008
147,525
2009
814,262
2010
123,568
2011
152,513
2012
99,187
2013
Men Women
[ Source: Authors' own calculations based on data from the American Community Survey of the U.S. Census Bureau.
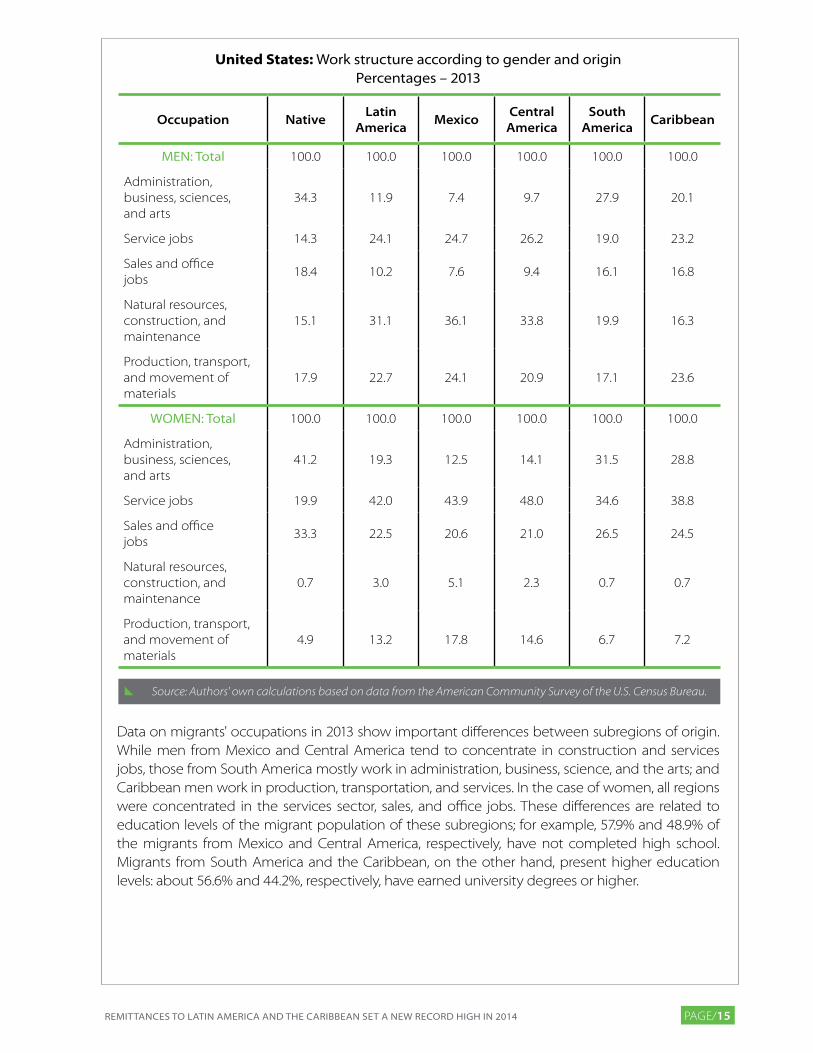
The sectors in which LAC female and male migrants find work vary. Men are concentrated in construc-tion and maintenance, while women are concentrated in other sectors, such as services. In these sec-tors, less employment can be observed by the native population,5 for which both men and women have greater participation in the occupations of administration, business, sciences, and the arts. It is im-portant to underscore that in the services sector, a significant participation of migrant men can also be observed, however, it is much less that that observed among women. Similarly, in the sectors of sales and office jobs, a significant participation of LAC migrant women can be observed.
4 Ibid
5 The American Community Survey defines native population as those individuals born in the United States, puerto Rico, and U.S. islands (guam, the Virgin Islands), as well as those born in foreign countries who have at least one parent who is a U.S. citizen.
pAgE/15REMITTANCES TO LATIN AMERICA AND THE CARIBBEAN SET A NEW RECORD HIGH IN 2014
United States: Work structure according to gender and originPercentages – 2013
occupation Nativelatin
americaMexico
central america
South america
caribbean
MEN: Total 100.0 100.0 100.0 100.0 100.0 100.0
Administration, business, sciences, and arts
34.3 11.9 7.4 9.7 27.9 20.1
Service jobs 14.3 24.1 24.7 26.2 19.0 23.2
Sales and office jobs
18.4 10.2 7.6 9.4 16.1 16.8
Natural resources, construction, and maintenance
15.1 31.1 36.1 33.8 19.9 16.3
production, transport, and movement of materials
17.9 22.7 24.1 20.9 17.1 23.6
WOMEN: Total 100.0 100.0 100.0 100.0 100.0 100.0
Administration, business, sciences, and arts
41.2 19.3 12.5 14.1 31.5 28.8
Service jobs 19.9 42.0 43.9 48.0 34.6 38.8
Sales and office jobs
33.3 22.5 20.6 21.0 26.5 24.5
Natural resources, construction, and maintenance
0.7 3.0 5.1 2.3 0.7 0.7
production, transport, and movement of materials
4.9 13.2 17.8 14.6 6.7 7.2
[ Source: Authors' own calculations based on data from the American Community Survey of the U.S. Census Bureau.
Data on migrants' occupations in 2013 show important differences between subregions of origin. While men from Mexico and Central America tend to concentrate in construction and services jobs, those from South America mostly work in administration, business, science, and the arts; and Caribbean men work in production, transportation, and services. In the case of women, all regions were concentrated in the services sector, sales, and office jobs. These differences are related to education levels of the migrant population of these subregions; for example, 57.9% and 48.9% of the migrants from Mexico and Central America, respectively, have not completed high school. Migrants from South America and the Caribbean, on the other hand, present higher education levels: about 56.6% and 44.2%, respectively, have earned university degrees or higher.
pAgE/16 PART TWO
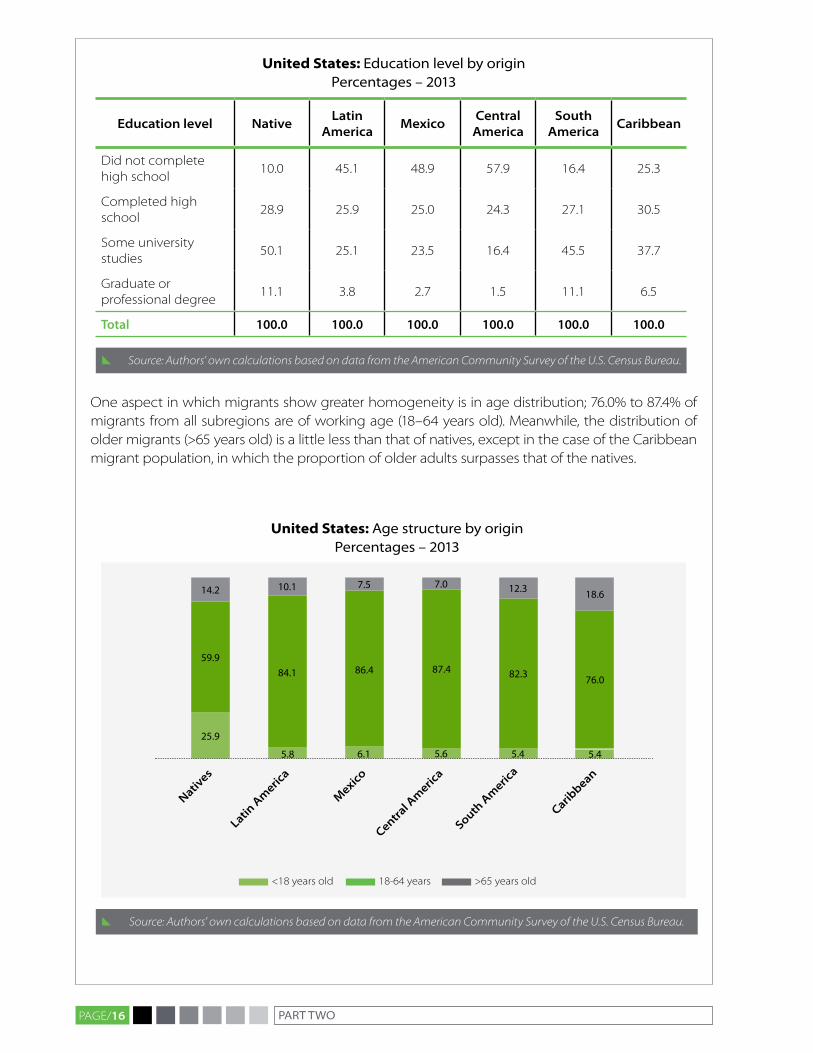
United States: Education level by originPercentages – 2013
Education level Nativelatin
americaMexico
central america
South america
caribbean
Did not complete high school
10.0 45.1 48.9 57.9 16.4 25.3
Completed high school
28.9 25.9 25.0 24.3 27.1 30.5
Some university studies
50.1 25.1 23.5 16.4 45.5 37.7
graduate or professional degree
11.1 3.8 2.7 1.5 11.1 6.5
Total 100.0 100.0 100.0 100.0 100.0 100.0
[ Source: Authors' own calculations based on data from the American Community Survey of the U.S. Census Bureau.
One aspect in which migrants show greater homogeneity is in age distribution; 76.0% to 87.4% of migrants from all subregions are of working age (18–64 years old). Meanwhile, the distribution of older migrants (>65 years old) is a little less than that of natives, except in the case of the Caribbean migrant population, in which the proportion of older adults surpasses that of the natives.
United States: Age structure by originPercentages – 2013
14.2
25.9
59.9
Natives
10.1
5.8
84.1
latin a
meric
a
7.5
6.1
86.4
Mexico
7.0
5.6
87.4
central a
meric
a
12.3
5.4
82.3
South a
meric
a
18.6
5.4
76.0
caribbean
<18 years old 18-64 years >65 years old
[ Source: Authors' own calculations based on data from the American Community Survey of the U.S. Census Bureau.

pAgE/17REMITTANCES TO LATIN AMERICA AND THE CARIBBEAN SET A NEW RECORD HIGH IN 2014
The structure of most migrant households is similar to native households, 75% include a husband, wife and children. This does not hold true for the Central American migrant population, where a higher percentage of households are made up of non-family individuals. In addition, a higher per-centage of migrant households are formed by other relatives as compared with native households.
United States: Household composition by originPercentages – 2013
Household members Nativelatin
americaMexico
central america
South america
caribbean
Head of household, spouse and children
87.7 74.8 75.1 68.6 79.0 74.8
Other relatives 6.5 15.4 15.1 17.0 12.7 15.4
Non-relatives 5.8 9.9 9.8 14.4 8.4 9.9
Total 100.0 100.0 100.0 100.0 100.0 100.0
[ Source: Authors' own calculations based on data from the American Community Survey of the U.S. Census Bureau.

pAgE/18 PART TWO
The LAC migrant population in the United States was negatively impacted by the 2008–2009 finan-cial crisis, which caused a major drop in demand for work in that country. A slight recovery began to be seen in 2010, and by 2014 the employment rate for LAC migrants in the United States grew 4.3% compared with the previous year. The total LAC migrant labor force in the United States in 2014 was estimated at 14.9 million, 94.0% of whom had work and 6.0% of whom were unemployed.6 The num-ber of unemployed LAC migrants in the United States would have fallen at an annual average rate of 17.0% with respect to the previous year, reflecting the strengthening job market in this destina-tion country (see Figure 7).
Improvements in the U.S. job market were more significant in the case of Central American and Mexican migrants with annual increases in employment of 5.3% and 5.1%, respectively, which can be linked to the growing migratory flows from these subregions to the United States.
FiGurE 7: EMPloyMENT aNd laBor ForcE FroM laTiN aMErica aNd THE cariBBEaN iN THE uNiTEd STaTES (2007-2014) ANNUAL pERCENTAgE VARIATIONS
18%
16%
14%
12%
10%
8%
6%
4%
2%
0%
-2%
-4%
-6%
-8%
dec
06
Mar
07
jun
07
Sep
07
dec
07
Mar
08
jun
08
Sep
08
dec
08
Mar
09
jun
09
Sep
09
dec
09
Mar
10
jun
10
Sep
10
dec
10
Mar
11
jun
11
Sep
11
dec
11
Mar
12
jun
12
Sep
12
dec
12
Mar
13
jun
13
Sep
13
dec
13
Mar
14
jun
14
Sep
14
dec
14
Labor Force Employment Unemployment (Right axis)
[ Source: Authors' own calculations based on Bureau of Labor Statistics (BLS).
100%
80%
60%
40%
20%
-20%
0%
-40%
6 Data from the current population survey of the U.S. Census Bureau and Bureau of Labor Statistics in the United States: www.census.gov/cps/
pAgE/19REMITTANCES TO LATIN AMERICA AND THE CARIBBEAN SET A NEW RECORD HIGH IN 2014
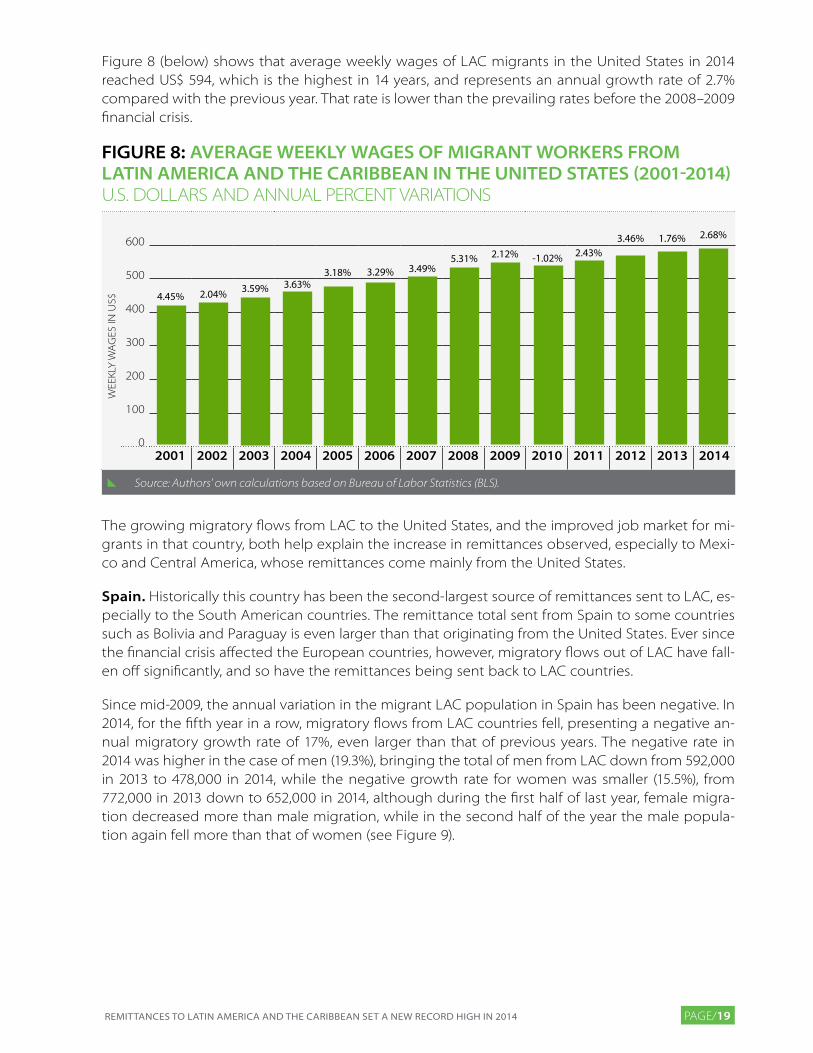
Figure 8 (below) shows that average weekly wages of LAC migrants in the United States in 2014 reached US$ 594, which is the highest in 14 years, and represents an annual growth rate of 2.7% compared with the previous year. That rate is lower than the prevailing rates before the 2008–2009 financial crisis.
FiGurE 8: aVEraGE WEEkly WaGES oF MiGraNT WorkErS FroM laTiN aMErica aNd THE cariBBEaN iN THE uNiTEd STaTES (2001-2014)U.S. DOLLARS AND ANNUAL pERCENT VARIATIONS
WEE
KLY
WA
gES
IN U
S$
600
500
400
300
200
100
02001 2002 2003 2004 2005 2006 2007 2008 2009 2010 2011 2012 2013 2014
[ Source: Authors' own calculations based on Bureau of Labor Statistics (BLS).
4.45% 2.04% 3.59% 3.63%3.29%3.18% 3.49%
2.12% 5.31% -1.02% 2.43%3.46% 1.76% 2.68%
The growing migratory flows from LAC to the United States, and the improved job market for mi-grants in that country, both help explain the increase in remittances observed, especially to Mexi-co and Central America, whose remittances come mainly from the United States.
Spain. Historically this country has been the second-largest source of remittances sent to LAC, es-pecially to the South American countries. The remittance total sent from Spain to some countries such as Bolivia and paraguay is even larger than that originating from the United States. Ever since the financial crisis affected the European countries, however, migratory flows out of LAC have fall-en off significantly, and so have the remittances being sent back to LAC countries.
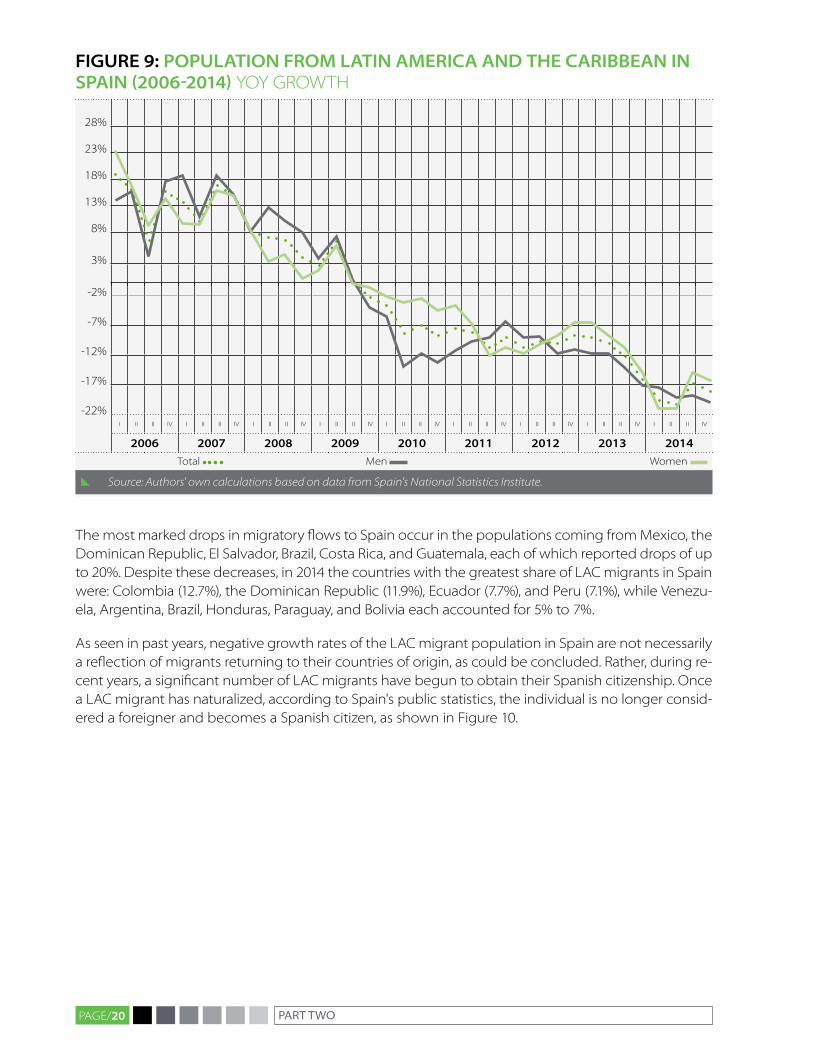
Since mid-2009, the annual variation in the migrant LAC population in Spain has been negative. In 2014, for the fifth year in a row, migratory flows from LAC countries fell, presenting a negative an-nual migratory growth rate of 17%, even larger than that of previous years. The negative rate in 2014 was higher in the case of men (19.3%), bringing the total of men from LAC down from 592,000 in 2013 to 478,000 in 2014, while the negative growth rate for women was smaller (15.5%), from 772,000 in 2013 down to 652,000 in 2014, although during the first half of last year, female migra-tion decreased more than male migration, while in the second half of the year the male popula-tion again fell more than that of women (see Figure 9).
pAgE/20 PART TWO
FiGurE 9: PoPulaTioN FroM laTiN aMErica aNd THE cariBBEaN iN SPaiN (2006-2014) YOY gROWTH
28%
23%
18%
13%
8%
3%
-2%
-7%
-12%
-17%
-22%I II II IV I II II IV I II II IV I II II IV I II II IV I II II IV I II II IV I II II IV I II II IV
2006 2007 2008 2009 2010 2011 2012 2013 2014
Total Men Women
[ Source: Authors' own calculations based on data from Spain's National Statistics Institute.
The most marked drops in migratory flows to Spain occur in the populations coming from Mexico, the Dominican Republic, El Salvador, Brazil, Costa Rica, and guatemala, each of which reported drops of up to 20%. Despite these decreases, in 2014 the countries with the greatest share of LAC migrants in Spain were: Colombia (12.7%), the Dominican Republic (11.9%), Ecuador (7.7%), and peru (7.1%), while Venezu-ela, Argentina, Brazil, Honduras, paraguay, and Bolivia each accounted for 5% to 7%.
As seen in past years, negative growth rates of the LAC migrant population in Spain are not necessarily a reflection of migrants returning to their countries of origin, as could be concluded. Rather, during re-cent years, a significant number of LAC migrants have begun to obtain their Spanish citizenship. Once a LAC migrant has naturalized, according to Spain's public statistics, the individual is no longer consid-ered a foreigner and becomes a Spanish citizen, as shown in Figure 10.

pAgE/21
FiGurE 10: PoPulaTioN FroM laTiN aMErica aNd THE cariBBEaN iN SPaiN (2006-2014) THOUSANDS OF INDIVIDUALS
3,000
2,500
2,000
1,500
1,000
500
0I II II IV I II II IV I II II IV I II II IV I II II IV I II II IV I II II IV I II II IV I II II IV
2006 2007 2008 2009 2010 2011 2012 2013 2014
Foreign LAC population Spanish originally from LAC Total
[ Source: Authors' own calculations based on Spain's National Statistics Institute.
The Latin American and Caribbean population living in Spain is made up of the migrants themselves and Spanish citizens whose origins are in LAC. In the latter case, these are people originally from LAC who succeeded in obtaining Spanish nationality. As shown in Figure 10, ever since the financial crisis of 2008–2009, many migrants have sought to accelerate the naturalization process, probably in order to en-sure their being able to remain in the country and to attempt to improve their income. In 2014, 15.5% of LAC migrants in Spain succeeded in becoming naturalized as Spanish citizens, so the real drop in LAC migrants in Spain was only 4.6% in 2014, higher than that observed in the two previous years when the population declined 3.9% (2013) and 2.0% (2012).
Emigration from LAC to Spain and the volume of remittances sent back are associated with the eco-nomic conditions in the destination country, especially in the sectors that provide the principal source of employment for migrants, such as construction for men and services for women.

pAgE/22 PART TWO
FiGurE 11: EMPloyMENT iN SPaiN By EcoNoMic SEcTor (2007-2014) YOY gROWTH
15%
10%
5%
0%
-5%
-10%
-15%
-20%
-25%
-30%
-35%I II III IV I II III IV I II III IV I II III IV I II III IV I II III IV I II III IV I II III IV
2007 2008 2009 2010 2011 2012 2013 2014
Construction Services
[ Source: Authors' own calculations based on Bank of Spain data.
As can be seen in Figure 11, employment in the construction sector fell each year from 2008 to 2013. In the first three quarters of 2014, negative employment rates were also observed. However, the last quarter of the year presented positive growth of 4.7%, insufficient to compensate for the falling rates in the first three quarters of the year, so the average annual growth rate ended up at negative 2.7% for 2014.
Ever since mid-2007, due to Spain’s economic crisis, unemployment in the construction sector has grown significantly, worsening in 2009 when the highest unemployment rates were observed. In 2014, unem-ployment in the construction sector continued the improvement observed starting in 2013, dropping to an average annual unemployment rate of 17.4%; see Figure 12 (below). This drop in unemployment, however, was not enough to absorb all the employment lost over the last seven years since the crisis be-gan in the country.

pAgE/23REMITTANCES TO LATIN AMERICA AND THE CARIBBEAN SET A NEW RECORD HIGH IN 2014
FiGurE 12: uNEMPloyMENT iN SPaiN By EcoNoMic SEcTor (2006-2014) YOY gROWTH
140%
120%
100%
80%
60%
40%
20%
0%
-20%
jan
06
ap
r 06
jul 0
6
oct
06
jan
07
ap
r 07
jul 0
7
oct
07
jan
08
ap
r 08
jul 0
8
oct
08
jan
09
ap
r 09
jul 0
9
oct
09
jan
10
ap
r 10
jul 1
0
oct
10
jan
11
ap
r 11
jul 1
1
oct
11
jan
12
ap
r 12
jul 1
2
oct
12
jan
13
ap
r 13
jul 1
3
oct
13
jan
14
ap
r 14
jul 1
4
oct
14
jan
15
Services Construction
[ Source: Authors' own calculations based on Bank of Spain data.
The job market in the services sector, on the other hand, remained more stable even after the finan-cial crisis, with rates falling significantly less than those observed in other sectors (such as construc-tion). It had already been observed that the falling employment rate in this sector in 2013 was leveling out during the first quarters, and by the end of the year, employment had stopped falling completely. In 2014, employment in the services sector continued this upward trend, steadily rising as the year ad-vanced, to finish with an average positive annual growth rate of 2.7%. Meanwhile, unemployment in the services sector dropped, with an average rate of negative 3.7% in 2014, reflecting both improved employment in this sector, and the shrinking supply of workers due to reduced migration of women to the country.

pAgE/24 PART TWO
FiGurE 13: MoNTHly WaGES iN SPaiN By EcoNoMic SEcTor (2006–2014) EUROS pER MONTH
3,000
2,500
2,000
1,500
1,000
500
0I II III IV I II III IV I II III IV I II III IV I II III IV I II III IV I II III IV I II III IV I II III IV
2006 2007 2008 2009 2010 2011 2012 2013 2014
Construction Services
[ Source: Authors' own calculations based on Bank of Spain data.
During the first quarter of 2014, monthly wages in Spain's construction and services sectors were ob-served to drop. However, starting in the second quarter, wages in both sectors showed improvements, which at the end of the year closed with annual accumulated growth rates of 0.55% for construction and 0.51% for services, compared with wage increase rates observed in 2013 (see Figure 13).
In 2014 Spain's job market in the construction and services sectors showed signs of stabilization, and even early indications of growth in employment and reduction of unemployment. However, it was not enough to reverse the losses in employment observed since the onset of the financial crisis. In 2014, re-mittance flows from Spain to LAC were still less than the previous year.

pAgE/25REMITTANCES TO LATIN AMERICA AND THE CARIBBEAN SET A NEW RECORD HIGH IN 2014
ProjEcTioNS For 2015
In light of the flow of Mexican migrants observed in 2014 as well as the U.S.'s economic recovery, which could trigger a rise in wages and employment levels for Mexican migrants, it is estimated that incoming remittances to Mexico in 2015 will be similar to or slightly higher than in the previous year. given that the majority of remittances to Central America, as in Mexico, originate in the Unit-ed States, and that Central American migratory flows have presented positive growth rates in re-cent years, it is estimated that the increase in remittance flows to Central America will hold steady or even accelerate in 2015.
With a decline in Caribbean migration to the United States and a Spanish job market that is still in the recovery process, it is estimated that during 2015 remittance flows to the Caribbean will contin-ue to grow more slowly than the rates observed to Mexico and Central America.
The positive outlook for the job markets in the United States and Spain allow us to predict a recu-peration of flows originating from these countries to South America. However, estimates of slower growth in the intraregional countries that are sources of remittances (Argentina, Brazil and Venezu-ela) lead to the prediction that in 2015, remittances will grow less in South America than in the oth-er subregions, and will end the year with slightly higher rates than in 2014.

pAgE/26 PART THREE
THE EFFECT OF RECEIVINGCOUNTRIES’ STATUS ON INFLOW OF REMITTANCES
ParT THrEE
3

pAgE/27REMITTANCES TO LATIN AMERICA AND THE CARIBBEAN SET A NEW RECORD HIGH IN 2014
The economic situation in LAC countries also influences the final value of the remittances received due to fluctuations in exchange rates and inflation, which determine the remittance's purchasing power.
LAC migrants abroad send remittances home based on their income; remittances from the United States are sent in U.S. dollars, and from Spain and other European countries in Euros. However, once a remittance reaches the sender's family in a Latin American or Caribbean country, in most cases the family must change it into local currency.7 Once in local currency, the beneficiaries can then use it to acquire needed goods and services, which are valued at local prices, which ultimately determine the purchasing power, or the real value of the original remittance sent.
As previously mentioned, the total amount of remittances entering the region in 2014 grew 5.3% compared with 2013. In general, local currencies in LAC suffered devaluation against the U.S. dollar, which on average rose 4.4%, enabling even greater increase in the value of remittances in local cur-rency, for a growth rate of 9.6% as compared to the previous year.8 At the subregional level Mexico, Central America and the Caribbean (where increased remittance flows were observed in 2014) ben-efited from the devaluation of their local currency; the devaluation increased the amount they re-ceived in local currency by 12.5% in Mexico, 7.8% in Central America and 10.8% in the Caribbean.
South American countries, which overall presented a negative annual growth rate, also benefited from devaluation of their currencies, ending the year with a remittance growth rate in local currency of 6.4% compared to the previous year. For the subcategory of the Andean countries, a similar phe-nomenon was observed, with a positive growth rate of 4.0%.
In addition, taking into account the inflation experienced by LAC countries in 2014, a loss of 4.5% in the value of remittances was observed compared with the previous year, leaving the growth rate of total remittances in terms of purchasing power at 5.2% higher than that observed the previous year.9 At the subregional level, in South America and Mexico, the combined effect of the devaluation of lo-cal currency along with inflation had a positive impact on the real value of the remittances. Mean-while, there was a negative effect on flows to the Caribbean and Central America, but it did not suc-ceed in reversing the positive growth rates observed in these two regions.
7 There are exceptions: those countries in which the dollar is in common use.
8 Regional and subregional data on local currency depreciation and appreciation were calculated weighting variations in amounts of remittances in local currency in each country, in relation to each country's share of regional and subregional remittance flows.
9 Regional and subregional data on inflation were calculated weighing variations in price index for the consumer in each country, in relation to each country's share in regional and subregional remittance flows.

pAgE/28 PART THREE
TaBlE 1: EFFEcT oF ExcHaNGE raTES aNd iNFlaTioN oN rEMiTTaNcES (2013-2014) BILLIONS OF DOLLARS AND ANNUAL gROWTH RATES
rEMiTTaNcES iN 2014
(uS$ BillioNS)
GroWTH raTES: 2013-2014 (1)
rEMiTTaNcES iN uS$ (2)
iN local currENcy
iN local currENcy aNd adjuSTEd For
iNFlaTioN
SOUTH AmERICA 15.992 -1.0% 6.4% 1.1%
arGENTiNa 1.009 -6.4% 39.6% 35.3%
BoliVia 1.164 -1.5% -2.0% -7.5%
BraZil 1.910 -1.7% 6.6% 1.9%
cHilE 0.488 7.9% 23.9% 19.9%
coloMBia 4.093 0.5% 7.5% 4.6%
Ecuador 2.462 0.5% 0.5% -2.5%
GuyaNa 0.438 5.5% 5.2% 4.6%
ParaGuay 0.608 -18.1% -14.8% -18.9%
PEru 2.639 -2.5% 2.0% -1.2%
SuriNaME 0.151 -1.2% -1.2% -9.0%
uruGuay 0.134 1.2% 15.3% 6.2%
VENEZuEla 0.897 7.2% 11.4% -24.5%
CENTRAL AmERICA 15.782 7.4% 7.8% 4.3%
BEliZE 0.126 5.4% 5.1% 4.0%coSTa rica 0.559 -0.4% 7.6% 4.1%El SalVador 4.217 6.7% 6.7% 6.0%GuaTEMala 5.544 8.6% 6.8% 3.3%HoNduraS 3.353 8.8% 10.4% 4.1%NicaraGua 1.136 5.4% 11.0% 4.7%PaNaMa 0.847 6.7% 6.7% 3.3%
CARIbbEAN (3) 9.962 6.3% 10.8% 6.0%
doMiNicaNrEPuBlic 4.571 7.3% 11.8% 8.5%
HaiTi 1.923 4.7% 4.7% -1.6%jaMaica 2.160 4.6% 15.6% 6.8%TriNidad & ToBaGo 0.138 5.4% 5.5% -0.2%
mEXICO 23.645 8.0% 12.5% 8.1%
MExico 23.645 8.0% 12.5% 8.1%
lac 65.382 5.3% 9.6% 5.2% [Source: Authors' own calculations based on MIF estimates, and central banks and International Monetary Fund (IMF) data.
Notes:
(1) Data aggregated at the subregional level are calculated by weighting individual variations proportionate to the country’s share in remittance subtotals.
(2) Data from 2013 for Mexico, Chile, Brazil, the Dominican Republic, Honduras, Haiti, Suriname, Nicaragua and
El Salvador reflect adjustments in previous estimates.
(3) Total for the Caribbean subregion also includes amounts from other countries in this geographical area.

pAgE/29REMITTANCES TO LATIN AMERICA AND THE CARIBBEAN SET A NEW RECORD HIGH IN 2014
Remittances continue to represent a very important source of foreign currency for many countries in the region. In addition, as can be seen in Figure 14, in many countries such as Haiti, guyana, Honduras, El Sal-vador, and Nicaragua, remittances have a relative importance with respect to the gross Domestic prod-uct (gDp) of over 15%.
given the heterogeneous economic growth and behavior of remittance flows into the countries of the region in 2014, changes in remittances’ proportion of gDp were observed. For countries such as Boliv-ia and paraguay, which experienced positive economic growth and also decreased remittance influx, the relative proportion of remittances with respect to the gDp decreased. In the Dominican Republic, growth in remittances surpassed gDp growth and therefore the relative proportion of remittances to gDp grew. In the case of Mexico, the gDp grew more slowly than remittances, increasing the ratio of re-mittances to gDp.
At the same time, other countries such as Argentina, Brazil, and Jamaica showed slower or even nega-tive growth of gDp. In the case of Argentina and Brazil, in addition to the drop in gDp there was an even larger drop in remittances, so that the relationship between these two variables decreased. Meanwhile, in Jamaica, remittances increased such that they were more important in relation to the gDp.
Finally, for some Central American countries (including guatemala, El Salvador, and Honduras), in recent years remittances have been observed to steadily increase in importance in relation to gDp, consistent with the sustained growth of remittance flows to these countries, originating mainly from the United States.

pAgE/30 PART THREE
FiGurE 14: rEMiTTaNcES To laTiN aMErica aNd THE cariBBEaN (2007–2014) pERCENTAgE OF gDp
35%
30%
25%
20%
15%
5%
0
Hai
ti
gu
yan
a
Ho
nd
ura
s
El S
alva
do
r
Nic
arag
ua
Jam
aica
gua
tem
ala
Beliz
e
Boliv
ia
Do
min
ican
Re
pu
blic
Ecu
ado
r
para
gu
ay
2007 2008 2009 2010 2011 2012 2013 2014
5%
4%
3%
2%
1%
0
Surin
ame
peru
Mex
ico
Co
lom
bia
Co
sta
Rica
pan
ama
Trin
idad
&
Tob
ago
Uru
gu
ay
Ch
ile
Arg
entin
a
Braz
il
Ven
ezu
ela
2007 2008 2009 2010 2011 2012 2013 2014
[ Source: Authors' own calculations based on MIF estimates, central banks and IMF’s data.
As previously mentioned, remittances sent to LAC countries come mostly from the United States, and in the case of South America and the Caribbean, from Spain as well. In addition, as shown in Fig-ure 15, some countries in the region receive flows from neighboring countries, which in certain cases form a significant subtotal of all remittances received. Some of these intraregional corridors are Vene-zuela to Colombia; Brazil and Argentina to paraguay; Mexico and Venezuela to Ecuador; Brazil and Ar-gentina to Bolivia; Costa Rica to Nicaragua; and the Dominican Republic to Haiti.

pAgE/31REMITTANCES TO LATIN AMERICA AND THE CARIBBEAN SET A NEW RECORD HIGH IN 2014
FiGurE 15: rEMiTTaNcES To SElEcT laTiN aMEricaN aNd cariBBEaN couNTriES (2012-2014) pERCENTAgES
70%
60%
50%
40%
30%
20%
10%
0intrarre-
gional uSa Spain intrarre-gional uSa Spain intrarre-
gional uSa Spain intrarre-gional uSa Spain
colombia Paraguay Ecuador Bolivia
2012 2013 2014
75%
60%
45%
30%
15%
intrarregional uSa Spain intrarregional uSa canada
Nicaragua Haiti
2012 2013 2014
[ Source: Authors' own calculations based on central bank data.
After the 2008–2009 financial crisis, intraregional flows showed a positive trend that helped compen-sate for the drop in remittances sent from the United States and Spain, which began to fall as a result of the crisis.10 In 2013, as shown in Figure 15, these flows increased in almost all the countries, largely due to the economic growth observed in the region that year. One exception to the increased remit-tance flows from South American countries was Bolivia, whose economic growth surpassed that of its neighbors, which could have caused a slight decline in the intraregional flows of remittances into the country.
10 Maldonado, R., Hayem, M. "Remittances to Latin America and the Caribbean in 2012: Differing Behavior across Subregions" Multilateral Investment Fund, Inter-American Development Bank, Washington, D.C., 2013.

pAgE/32 PART THREE
In the last year, however, a decrease in relative participation of these intraregional flows in the total amount of remittances received by Colombia and Ecuador was observed, a result of reduced remit-tances from Venezuela, where a portion of the intraregional remittances they receive originates. Mean-while, an increase of 1.1% was observed in paraguay and 2.6% in Bolivia, but given the smaller propor-tion of these flows in their total remittances received, these increases are more related to the decline observed in remittances originating from other parts of the world, including from the United States and Spain. In the case of Nicaragua, the share of remittances it received (primarily from Costa Rica) held steady at levels similar to previous years, but in value, growth of 5.5% was observed compared with the previous year.
The most significant reduction observed in the proportion of intraregional remittances as part of the total amount of remittances received was in Colombia, where the remittances received (mainly from Venezuela) fell some 6.7% in relation to the previous year.
given the positive economic growth expected for LAC countries in 2015, the relative share of intrare-gional remittances in these countries is predicted to hold steady at levels similar to those in 2014. An important exception to these predictions is the case of countries in which intraregional remittances come from Brazil, a country for which projected growth for 2015 is low. This could lead to reductions in remittances sent to countries such as Bolivia and paraguay in the next year.

pAgE/33REMITTANCES TO LATIN AMERICA AND THE CARIBBEAN SET A NEW RECORD HIGH IN 2014
THE coST oF SENdiNG rEMiTTaNcES
Over the years, the LAC region has seen significant progress in reducing costs for sending remit-tances. From 2008 to 2014, the average cost of sending US$200 at the regional level fell almost 2.4 percentage points, from 8.4% in 2008 to 6.0% in 2014. It is estimated that this cost reduction resulted in a savings of US$ 1.5 billion in 2014,11 as compared with costs in 2008.
Analyzing the database of the online platform Envía Centroamérica12 (which contains informa-tion on the cost of sending remittances from the United States to the countries of Central Amer-ica and the Dominican Republic, and also from Costa Rica to Nicaragua), it can be seen that the average cost of sending a remittance in these corridors in 2014 again showed reductions with respect to the previous year. As such, the average cost of sending a lower-value remittance (US$ 200) fell 3.5% in relation to the cost in 2013, from US$ 10.20 in 2013 to US$ 9.84 in 2014.
Similarly, in 2014 the average cost of sending an average-value remittance (US$ 500) fell 9.6% com-pared with the previous year, from US$ 14.50 in 2013 to US$ 13.10 in 2014.
In 2014 the LAC region received a larger total annual amount of remittances (in dollars) than in the previous year, and the amount also surpassed the levels reached in 2008, when remittances to the region marked their record high (until now). From 2013 to 2014, remittances grew some 5.3%, which represented a total inflow of remittances to LAC of US$ 65.3 billion. Mexico, Central America, and the
11 Monroy, p., Cervantes, J., Bonilla, S. “Estudio Regional Comparativo” ["Comparative Regional Study"], Mexico, DF., 2015.
12 Envía Centroamérica is a consulting tool on the costs of sending remittances developed and administered by the Center for Latin American Monetary Studies (CEMLA) and co-funded by the MIF in collaboration with the World Bank; for more information see: www.enviacentroamerica.org.
aVEraGE coSTS (iN PErcENTaGE) oF SENdiNG rEMiTTaNcES FroM THE uNiTEd STaTES To cENTral aMEricaN couNTriES aNd THE doMiNicaN rEPuBlic (2011-2014)
7%
6%
5%
4%
3%
2%
1%
I II III IV I II III IV I II III IV I II III IV
2011 2012 2013 2014 [ Source: Authors' own calculations based on data from www.enviacentroamerica.org.
5.9%
5.3%
5.1% 4.9%
uS$200
2.9% 2.6%
4.1%
uS$500
3.5%

CONCLUSIONS AND PROSPECTS FOR 2015

pAgE/35REMITTANCES TO LATIN AMERICA AND THE CARIBBEAN SET A NEW RECORD HIGH IN 2014
Caribbean showed positive growths of 8.0%, 7.4% and 6.3% respectively, while South America experi-enced a drop of 1% in flows received..
The increase in remittances in 2014 is consistent with the migratory patterns of LAC populations ob-served in recent years, principally to the United States. In addition, these flows have tended to respond to improvements in the job markets in both the United States (where economic growth has been positive in recent years) as well as in Spain (where the trend toward recuperation recently began and is predicted to continue over the next few years).
Taking into account the growth prospects for 2015 in the United States, Spain, and LAC countries, it can be estimated that remittances will continue to make a full recovery, and remittance flows may even accelerate to higher rates than those observed in 2014, to 7%–8% compared with the previous year.
In this context, and in a highly competitive market like the remittances market, the industry must con-tinue to innovate and to expand its models for sending and receiving funds. Technology, including the Internet and mobile phones, presents more and more options for facilitating payments, constitut-ing an opportunity to expand access, as well as provide other financial products and services to help reduce the economic vulnerability of remittance clients in the region. To this end, it will be important to have an enabling regulatory environment, as well as greater availability of information on remittanc-es to help various different stakeholders better understand market dynamics and be able to innovate and offer products and services adapted to the final consumers.

pAgE/36 pÁg./36LAS REMESAS A AMÉRICA LATINA Y EL CARIBE EN 2013: AÚN SIN ALCANZAR NIVELES DE PRE-CRISIS
MulTilaTEral iNVESTMENT FuNd1300 New York Avenue, N.W., Washington, D.C. 20577
www.fomin.org
www.twitter.com/fominbid
www.facebook.com/fominbid