remote airfield lighting: modeling sequential tasks using
TRANSCRIPT

© 2008 Rensselaer Polytechnic Institute. All rights reserved.© 2006 Rensselaer Polytechnic Institute. All rights reserved.
1
Remote Airfield Lighting: Modeling Sequential Tasks Using the
Unified System of Photometry
Mark S. Rea1, Zongjie Yuan2, Andrew Bierman1
CORM 2008
1 Lighting Research Center, 2 W.A.C. Lighting
Sponsor: Federal Aviation Administration

© 2008 Rensselaer Polytechnic Institute. All rights reserved.
2
Problem(FAA Cooperative Agreement No. 04-C-GA-ERAU)
Develop technical specifications for remote airfield lighting systems
› Nighttime operations
› General, non-commercial aircraft
Consortium of universities formed to find solution
› Embry-Riddle Aeronautical University
› University of North Dakota – Aerospace
› University of Alaska
› Rensselaer Polytechnic Institute

© 2008 Rensselaer Polytechnic Institute. All rights reserved.
3
Tasks
Locate the runway
Determine the runway’s orientation
Orient the aircraft to the runway and approach
Land the aircraft
Stop the aircraft

© 2008 Rensselaer Polytechnic Institute. All rights reserved.
4
Assumptions and constraints
Visual identification of runway from a 5-mile radius
Pilots would have been to the airfield previously in the daytime
No blue or red lights or flash frequencies lower than 1.5 Hz› Possible confusion with emergency vehicle lights or
hazard identification on the ground
Use response times and confidence ratings as dependent variables› Confidence ratings considered more important than
response times

© 2008 Rensselaer Polytechnic Institute. All rights reserved.
5
Experimental apparatus

© 2008 Rensselaer Polytechnic Institute. All rights reserved.
6
Assembly of ground scene
Integrating sphere with LED sources

© 2008 Rensselaer Polytechnic Institute. All rights reserved.
7
View of ground scene and computer monitor

© 2008 Rensselaer Polytechnic Institute. All rights reserved.
8
Normalized spectral power distributions
© 2008 Rensselaer Polytechnic Institute. All rights reserved.
9
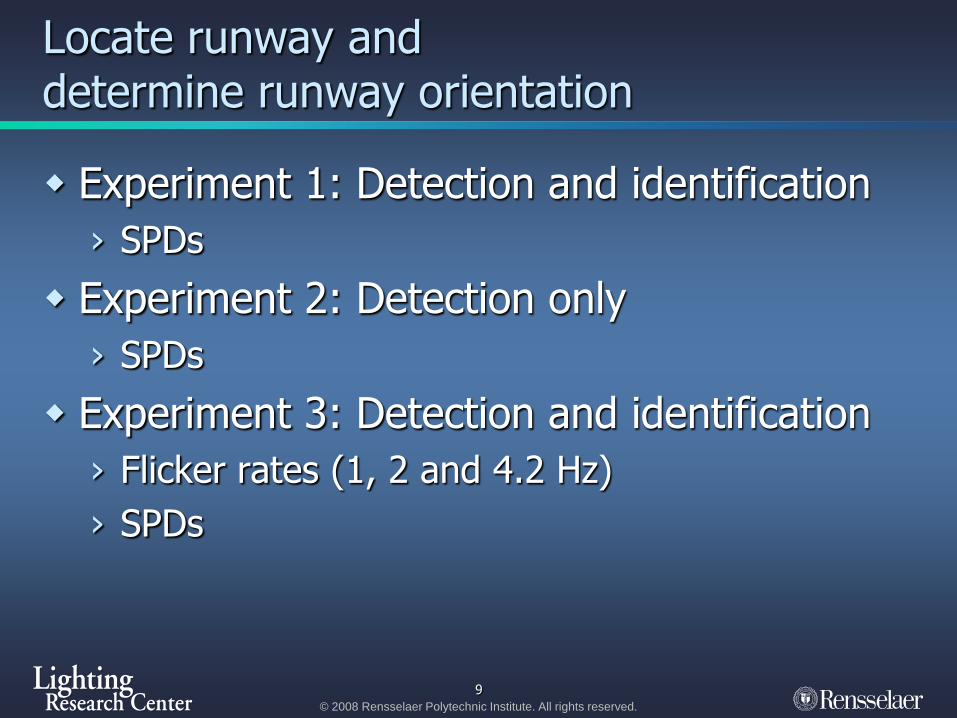
Locate runway and determine runway orientation
Experiment 1: Detection and identification
› SPDs
Experiment 2: Detection only
› SPDs
Experiment 3: Detection and identification
› Flicker rates (1, 2 and 4.2 Hz)
› SPDs
© 2008 Rensselaer Polytechnic Institute. All rights reserved.
10
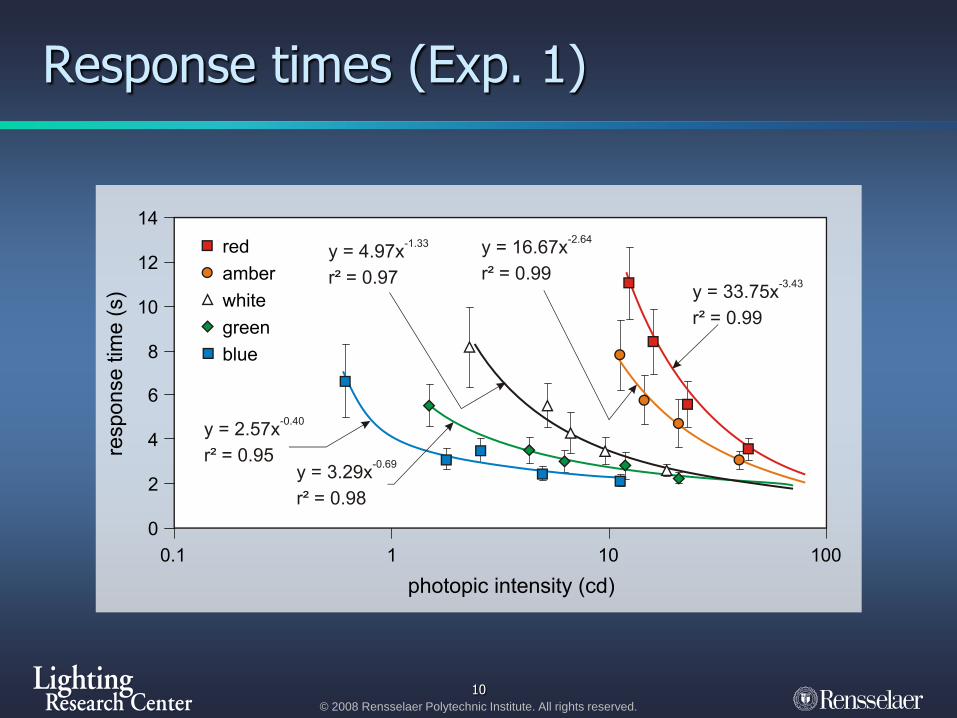
Response times (Exp. 1)

© 2008 Rensselaer Polytechnic Institute. All rights reserved.
11
How is mesopic luminous efficiency characterized?
Starlight Moonlight Dim interiors Office lighting Daylight
Scotopic Mesopic Photopic
Radiant Energy
x
© 2008 Rensselaer Polytechnic Institute. All rights reserved.
12
Introducing the Unified System of Photometry
The relative proportion of photopic and scotopic luminous efficiency for peripheral vision at a given (mesopic) light level (He et al. 1997, 1998)
At high light levels, X = 1
At very low levels, X = 0

© 2008 Rensselaer Polytechnic Institute. All rights reserved.
13
0.00
0.25
0.50
0.75
1.00
400 500 600 700
Wavelength (nm)
Luminous efficiency
Mesopic luminous efficiency functions
X = 0.09
L = 0.02 cd/m²
© 2008 Rensselaer Polytechnic Institute. All rights reserved.
14
0.00
0.25
0.50
0.75
1.00
400 500 600 700
Wavelength (nm)
Luminous efficiency
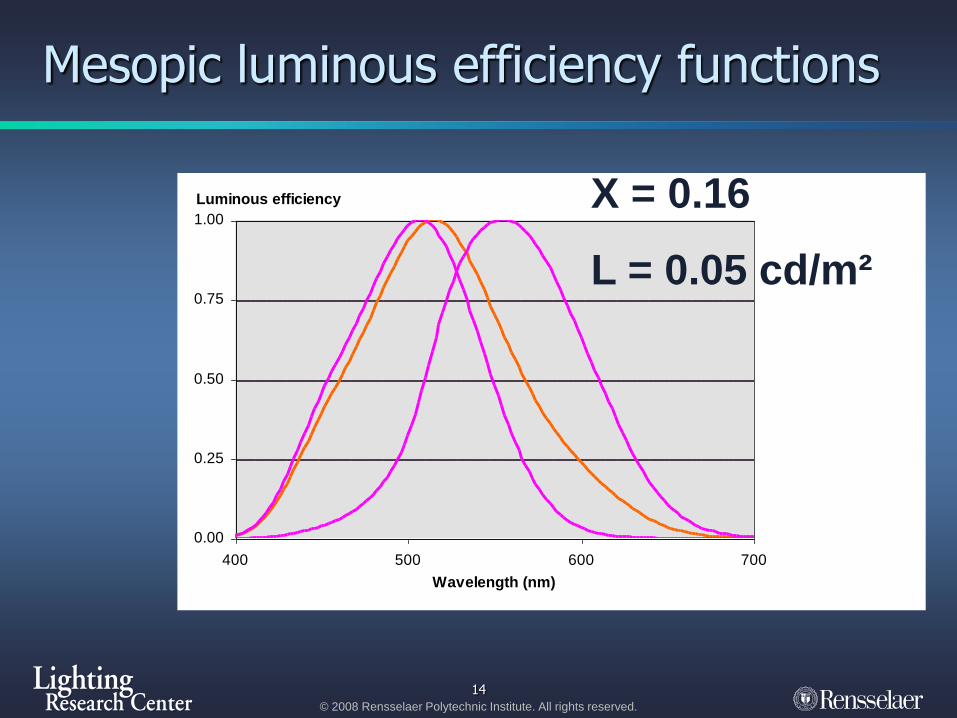
Mesopic luminous efficiency functions
X = 0.16
L = 0.05 cd/m²

© 2008 Rensselaer Polytechnic Institute. All rights reserved.
15
0.00
0.25
0.50
0.75
1.00
400 500 600 700
Wavelength (nm)
Luminous efficiency
Mesopic luminous efficiency functions
Vmes = (X)V(λ) + (1-X)V’(λ)
(mesopic = cones + rods) X = 0.40
L = 0.22 cd/m2
© 2008 Rensselaer Polytechnic Institute. All rights reserved.
16
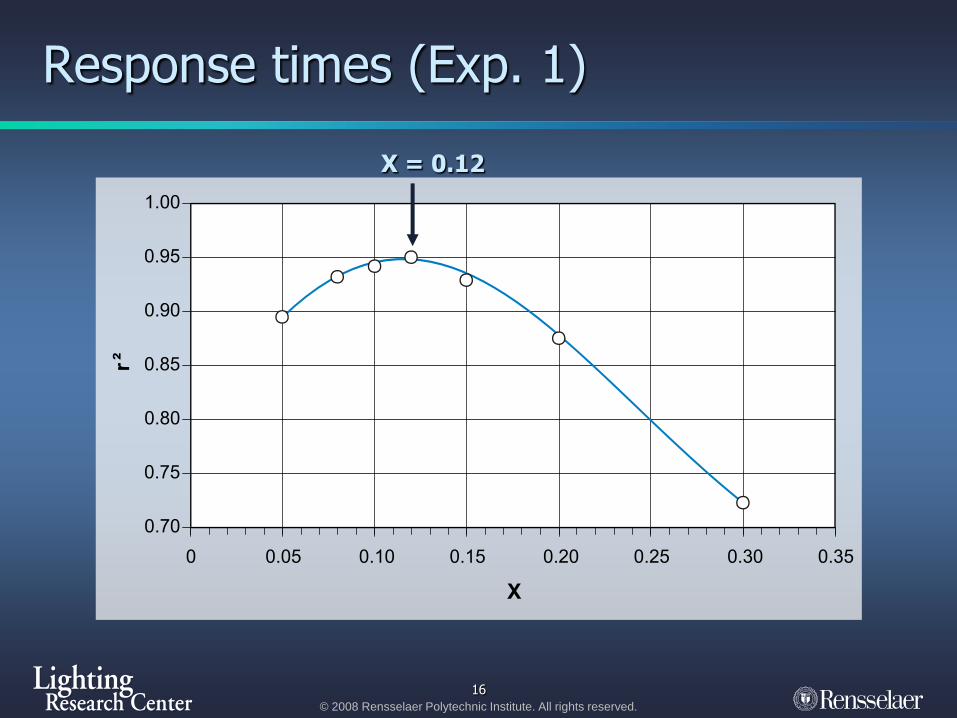
Response times (Exp. 1)
X = 0.12

© 2008 Rensselaer Polytechnic Institute. All rights reserved.
17
Response times (Exp. 1)

© 2008 Rensselaer Polytechnic Institute. All rights reserved.
18
Confidence ratings (Exp. 1)
X = 0.22

© 2008 Rensselaer Polytechnic Institute. All rights reserved.
19
Confidence ratings (Exp. 1)

© 2008 Rensselaer Polytechnic Institute. All rights reserved.
20
Locate runway and determine runway orientation
Experiment 1: Detection and identification
› SPDs
Experiment 2: Detection only
› SPDs
Experiment 3: Detection and identification
› Flicker rates (1, 2 and 4.2 Hz)
› SPDs

© 2008 Rensselaer Polytechnic Institute. All rights reserved.
21
Response times (Exp. 2)
X = 0.0

© 2008 Rensselaer Polytechnic Institute. All rights reserved.
22
Response times (Exp. 2)

© 2008 Rensselaer Polytechnic Institute. All rights reserved.
23
Confidence ratings (Exp. 2)
X = 0.0

© 2008 Rensselaer Polytechnic Institute. All rights reserved.
24
Confidence ratings (Exp. 2)

© 2008 Rensselaer Polytechnic Institute. All rights reserved.
25
Locate runway and determine runway orientation
Experiment 1: Detection and identification
› SPDs
Experiment 2: Detection only
› SPDs
Experiment 3: Detection and identification
› Flicker rates (1, 2 and 4.2 Hz)
› SPDs

© 2008 Rensselaer Polytechnic Institute. All rights reserved.
26
Response times (Exp. 3)
X = 0.12

© 2008 Rensselaer Polytechnic Institute. All rights reserved.
27
Response times (Exp. 3)

© 2008 Rensselaer Polytechnic Institute. All rights reserved.
28
Confidence ratings (Exp. 3)
X = 0.22

© 2008 Rensselaer Polytechnic Institute. All rights reserved.
29
Confidence ratings (Exp. 3)

© 2008 Rensselaer Polytechnic Institute. All rights reserved.
30
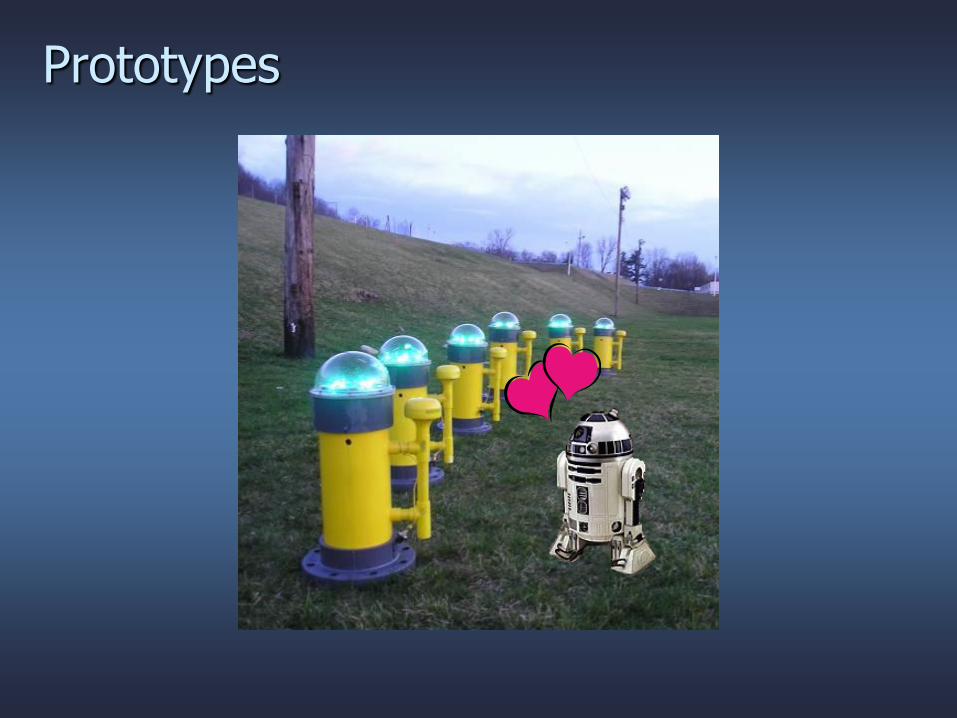
Prototypes

© 2008 Rensselaer Polytechnic Institute. All rights reserved.
32
Final product

© 2008 Rensselaer Polytechnic Institute. All rights reserved.
33
Summary
Unified System of Photometry developed from data on performing a single visual task› Different data sets used different tasks
These results support the inference that sequential tasks can be successfully modeled by the Unified System of Photometry› Sequential tasks: locate airport, then determine orientation
Results imply that the two visual tasks rely on different visual mechanisms but the stimuli for these complex visual tasks can be rectified additively by the Unified System of Photometry
Unified System of Photometry used as basis for specifying remote airfield landing lights

© 2008 Rensselaer Polytechnic Institute. All rights reserved.© 2006 Rensselaer Polytechnic Institute. All rights reserved.
34
Thank you.
Acknowledgements:
Don Gallagher, FAA
Dennis Guyon, LRC
Howard Ohlhous, LRC
Martin Overington, LRC