remote area power supply (raps) load and resource...
TRANSCRIPT

(8-2005)
SAND REPORT SAND2007-4268 Unlimited Release Printed July 2007
Remote Area Power Supply (RAPS) Load and Resource Profiles A Study for the DOE Energy Storage Program Ndeye Fall, Lauren Giles, Brian Marchionini, and Edward G. Skolnik Energetics Incorporated Prepared by Sandia National Laboratories Albuquerque, New Mexico 87185 and Livermore, California 94550 Sandia is a multiprogram laboratory operated by Sandia Corporation, a Lockheed Martin Company, for the United States Department of Energy’s National Nuclear Security Administration under Contract DE-AC04-94AL85000. Approved for public release; further dissemination unlimited.

2
Issued by Sandia National Laboratories, operated for the United States Department of Energy by Sandia Corporation. NOTICE: This report was prepared as an account of work sponsored by an agency of the United States Government. Neither the United States Government, nor any agency thereof, nor any of their employees, nor any of their contractors, subcontractors, or their employees, make any warranty, express or implied, or assume any legal liability or responsibility for the accuracy, completeness, or usefulness of any information, apparatus, product, or process disclosed, or represent that its use would not infringe privately owned rights. Reference herein to any specific commercial product, process, or service by trade name, trademark, manufacturer, or otherwise, does not necessarily constitute or imply its endorsement, recommendation, or favoring by the United States Government, any agency thereof, or any of their contractors or subcontractors. The views and opinions expressed herein do not necessarily state or reflect those of the United States Government, any agency thereof, or any of their contractors. Printed in the United States of America. This report has been reproduced directly from the best available copy. Available to DOE and DOE contractors from U.S. Department of Energy Office of Scientific and Technical Information P.O. Box 62 Oak Ridge, TN 37831 Telephone: (865) 576-8401 Facsimile: (865) 576-5728 E-Mail: [email protected] Online ordering: http://www.osti.gov/bridge Available to the public from U.S. Department of Commerce National Technical Information Service 5285 Port Royal Rd. Springfield, VA 22161 Telephone: (800) 553-6847 Facsimile: (703) 605-6900 E-Mail: [email protected] Online order: http://www.ntis.gov/help/ordermethods.asp?loc=7-4-0#online

3
SAND2007-4268 Unlimited Release Printed July 2007
Remote Area Power Supply (RAPS) Load and Resource Profiles∗
A Study for the DOE Energy Storage Program
Ndeye Fall, Lauren Giles, Brian Marchionini, and Edward G. Skolnik
Energetics, Inc. 901 D Street SW, Suite 100
Washington, DC 20024
Abstract In 1997, an international team interested in the development of Remote Area Power Supply (RAPS) systems for rural electrification projects around the world was organized by the International Lead Zinc Research Organization (ILZRO) with the support of Sandia National Laboratories (SNL). The team focused on defining load and resource profiles for RAPS systems. They identified single family homes, small communities, and villages as candidates for RAPS applications, and defined several different size/power requirements for each. Based on renewable energy and resource data, the team devised a “strawman” series of load profiles. A RAPS system typically consists of a renewable and/or conventional generator, power conversion equipment, and a battery. The purpose of this report is to present data and information on insolation levels and load requirements for “typical” homes, small communities, and larger villages around the world in order to facilitate the development of robust design practices for RAPS systems, and especially for the storage battery component. These systems could have significant impact on areas of the world that would otherwise not be served by conventional electrical grids. ∗ The work described in this report was performed for Sandia National Laboratories under Contract No. BD-0069A

4
Acknowledgement
The authors wish to acknowledge the U.S. Department of Energy, Energy Storage Systems Program for the support of this work. We also gratefully acknowledge the review of this report by Nancy Clark and Tom Hund, Sandia National Laboratories. This work would not have been possible without the vision and leadership of the International Lead Zinc Research Organization, and in particular from Jerry Cole, Pat Moseley, and Carl Parker, and their contributions are gratefully acknowledged. The initial work on this project was performed by Paula Taylor formerly of Energetics, Inc. The Sandia Project Manager for this work was Paul Butler. Sandia acknowledges the final editing of this report by Imelda Francis.

5
Contents 1.0 Introduction................................................................................................................. 9 2.0 Resource Profiles....................................................................................................... 10
2.1 Methodology .................................................................................................. 10 2.2 Results ............................................................................................................ 10
3.0 Load Profiles.............................................................................................................. 16 3.1 Methodology .................................................................................................. 16 3.2 Load Profiles .................................................................................................. 17
3.2.1 Single Family Home ........................................................................................ 17 3.2.2 Small Community ............................................................................................ 20 3.2.3 Village.............................................................................................................. 22
4.0 Conclusions................................................................................................................ 28 APPENDIX A – Resource Data for Sites Discussed in This Report ........................ A-1 APPENDIX B - List of RAPS Projects as of 2001...................................................... B-1
Figures
Figure 1. Monthly Average of Integrated Solar Insolation (Horizontal Surface for Tonopah, Nevada, USA).................................................................................... 11
Figure 2. Ten-Year Monthly Average Temperature for Tonopah, Nevada, USA............ 12
Figure 3. Average Daily Profile of Solar Insolation (Horizontal Surface) for Tonopah, Nevada, USA, in December............................................................................... 12
Figure 4. Average Daily Profile of Solar Insolation (Horizontal Surface) for Tonopah, Nevada, USA, in June. ...................................................................................... 13
Figure 5. The 10-Year Monthly Average of Integrated Solar Insolation (Horizontal Surface) for Chittagong, Bangladesh. .............................................................. 14
Figure 6. Average Annual Insolation (Horizontal Surface) Over the 10-Year Period of 1983-1993. ......................................................................................................... 15
Figure 7. Average December Insolation (Horizontal Surface) over the 10-Year Period of 1983-1993. ......................................................................................................... 15
Figure 8. Average June Insolation (Horizontal Surface) Over the 10-Year Period of 1983-1993. .................................................................................................................. 16
Figure 9. Load Profile of a Single Family Home in Puerto Plata, Dominican Republic.. 19
Figure 10. The Lime Village Data Collection Site. .......................................................... 21
Figure 11. Daily (Winter) High and Average Load Profile in Lime Village (this is a recreation of original load profile data from the Alaska Energy Authority, November 2002). ............................................................................................ 21

6
Figures Figure 12. Load Profile of a School in the Baja California Village of San Juanico,
Mexico. ........................................................................................................... 23
Figure 13. Load Profile of a Health Clinic in San Juanico. .............................................. 24
Figure 14. Load Profile of the San Juanico Village.......................................................... 25
Figure 15. Load Profile of a Village in Alaminos, Philippines. ....................................... 26
Figure 16. Daily Load Profile for Hyderabad, India......................................................... 27
Figure A-1. Daily Profile of Monthly Solar Insolation (Horizontal Surface) for December in Chittagong, Bangladesh. ......................................................................... A-1
Figure A-2. Daily Profile of Monthly Solar Insolation (Horizontal Surface) for June in Chittagong, Bangladesh............................................................................... A-2
Figure A-3. Integrated Solar Insolation (Horizontal Surface) over a 10-Year Period for Chittagong, Bangladesh............................................................................... A-2
Figure A-4. Average Monthly Temperature over a 10-year Period for Chittagong, Bangladesh. ................................................................................................. A-3
Figure A-5. Daily Profile of Monthly Solar Insolation (Horizontal Surface) for December in Rio Negro, Argentina. ............................................................................. A-4
Figure A-6. Daily Profile of Monthly Solar Insolation (Horizontal Surface) for June in Rio Negro, Argentina. ................................................................................. A-4
Figure A-7. Integrated Solar Insolation (Horizontal Surface) over a 10-Year Period for Rio Negro, Argentina. ................................................................................. A-5
Figure A-8. Average Monthly Temperature over a 10-Year Period for Rio Negro, Argentina. .................................................................................................... A-5
Figure A-9. Daily Profile of Monthly Solar Insolation (Horizontal Surface) for December in Alaminos, Philippines. ............................................................................ A-6
Figure A-10. Daily Profile of Monthly Solar Insolation (Horizontal Surface) for June in Alaminos, Philippines. ............................................................................. A-6
Figure A-11. Integrated Solar Insolation (Horizontal Surface) over a 10-Year Period for Alaminos, Philippines. ............................................................................. A-7
Figure A-12. Average Monthly Temperature over a 10-Year Period for Alaminos, Philippines. ............................................................................................... A-7
Figure A-13. Daily Profile of Monthly Solar Insolation (Horizontal Surface) for December in Puerto Plata, Dominican Republic...................................... A-8
Figure A-14. Daily Profile of Monthly Solar Insolation (Horizontal Surface) for June in Puerto Plata, Dominican Republic. .......................................................... A-8

7
Figures Figure A-15. Integrated Solar Insolation (Horizontal Surface) over a 10-Year Period for
Puerto Plata, Dominican Republic. .......................................................... A-9
Figure A-16. Average Monthly Temperature over a 10-Year Period for Puerto Plata, Dominican Republic................................................................................. A-9
Figure A-17. Daily Profile of Monthly Solar Insolation (Horizontal Surface) for December in Hyderabad, India............................................................... A-10
Figure A-18. Daily Profile of Monthly Solar Insolation (Horizontal Surface) for June in Hyderabad, India. ................................................................................... A-10
Figure A-19. Integrated Solar Insolation (Horizontal Surface) over a 10-Year Period for Hyderabad, India. ................................................................................... A-11
Figure A-20. Average Monthly Temperature over a 10-Year Period for Hyderabad, India................................................................................................................. A-11
Figure A-21. Daily Profile of Monthly Solar Insolation (Horizontal Surface) for December in San Juanico, Mexico. ........................................................ A-12
Figure A-22. Daily Profile of Monthly Solar Insolation (Horizontal Surface) for June in San Juanico, Mexico............................................................................... A-12
Figure A-23. Integrated Solar Insolation (Horizontal Surface) over a 10-Year Period for San Juanico, Mexico. ............................................................................... A-13
Figure A-24. Average Monthly Temperature over a 10-Year Period for San Juanico. A-13
Figure A-25. Daily Profile of Monthly Solar Insolation (Horizontal Surface) for December in Lime Village, Alaska, U.S.A. ........................................... A-14
Figure A-26. Daily Profile of Monthly Solar Insolation (Horizontal Surface) for June in Lime Village, Alaska, U.S.A.................................................................. A-14
Figure A-27. Integrated Solar Insolation (Horizontal Surface) over a 10-Year Period for Lime Village, Alaska, U.S.A.................................................................. A-15
Figure A-28. Average Monthly Temperature over a 10-Year Period for Lime Village, Alaska, U.S.A. ......................................................................................... A-15
Tables Table 1. Resource Summary: 10-Year Climatology (1983-1993) of Solar Insolation
(Horizontal Surface). ........................................................................................... 14
Table 2. Single Family Home Profiles by Economic Status in Rio Negro, Argentina..... 18
Table 3. Technical Characteristics of the Lime Village Test Bed. ................................... 20
Table 4. Basic Load for a School in the Baja California Village of San Juanico. ............ 23
Table 5. Load for Clinic in Baja Village of San Juanico, Mexico.................................... 24
Table 6. Basic Load Conditions for Hyderabad, India. .................................................... 27
Table 7. Community Center Load in Hyderabad, India.................................................... 27

8

9
1.0 Introduction In remote areas of the world where grid-supplied electricity is unavailable, unreliable, or prohibitively expensive, an alternative exists in the form of a Remote Area Power Supply (RAPS). A RAPS is an autonomous electricity supply system that relies on one or more energy sources usually in conjunction with a battery and power conversion equipment. Electrification through RAPS enhances social welfare by narrowing the gap in quality of life between urban and rural areas. RAPS systems are not limited to remote areas: many customers close to conventional grids may prefer to use a RAPS system for its positive impact on energy reliability and utilization of renewable resources. Technologies such as wind turbines and photovoltaic (PV) arrays can be used in RAPS systems to meet local energy requirements economically. The motivation for this study came from two workshops attended by energy policy planners and energy industry experts held in Jakarta, Indonesia, (October 17-18, 1997), and Brisbane, Australia (October 23-24, 1997). Discussions included the need to develop robust design practices for RAPS systems. An international team was organized by the International Lead Zinc Research Organization (ILZRO) with the support of Sandia National Laboratories (SNL) to address this need. The team began by defining load and resource profiles. They identified single family homes, small communities, and villages as candidates for RAPS applications, and defined several different size/power requirements for each. Based on renewable energy and resource data, the team devised a “strawman” series of load profiles. The general premise was that electricity was used during three peak time periods: in the morning, afternoon, and evening. At other times, electricity usage was assumed to be zero or near zero. Robust design practices are needed in order to facilitate the proper selection and sizing of storage batteries to be used in RAPS systems. To accomplish this, it is necessary to characterize both the resource profile for the power supply and the load requirements of the consumer. In this document, the focus is on RAPS systems in which the primary resource is solar insolation converted to electricity via a PV array. Therefore, we are interested in the power needs of single family homes, small communities, and larger villages that are not connected to a grid (other than perhaps a stand-alone village mini-grid). The purpose of this report is to provide data and information on insolation levels and load requirements for “typical” single family homes, small communities, and larger villages around the world in order to facilitate the development of robust design practices for RAPS systems, and especially for the storage battery component. The load data provide a “strawman” for time-of-day needs based on location, weather, and economic status of the consumer(s). The resource data (in this case, insolation available to a PV array) provide a measure of available power. In this report, we will discuss existing load and resource data, including our methodology for obtaining such data.

10
2.0 Resource Profiles 2.1 Methodology In order to determine resource profiles (in this case insolation profiles) in the regions where load profiles have been generated, we utilized the National Aeronautics & Space Administration’s (NASA’s) global weather database, “Surface Meteorology and Solar Energy Data Set (SSE) (Release 4)1.” This tool, part of NASA’s Earth Science Enterprise Program carried out at the NASA Langley Research Center, provides access to:
• More than 200 satellite-derived meteorology and solar energy parameters with monthly averages from 10 years of data,
• Color plots on both global and regional scales, and • Global solar energy data for 1,195 ground sites.
These data had previously only been available from a limited number of ground monitoring stations. The Release 4 data set contains new parameters based on recommendations by the renewable energy industry and therefore it is more accurate than previous releases. Its on-line plotting capabilities allow quick evaluation of potential renewable energy projects for any region of the world. The SSE data set is formulated from NASA satellite- and analysis-derived insolation and meteorological data for the 10-year period between July 1983 and June 1993. The user can input either the name of the city or the latitude and longitude coordinates to obtain results.
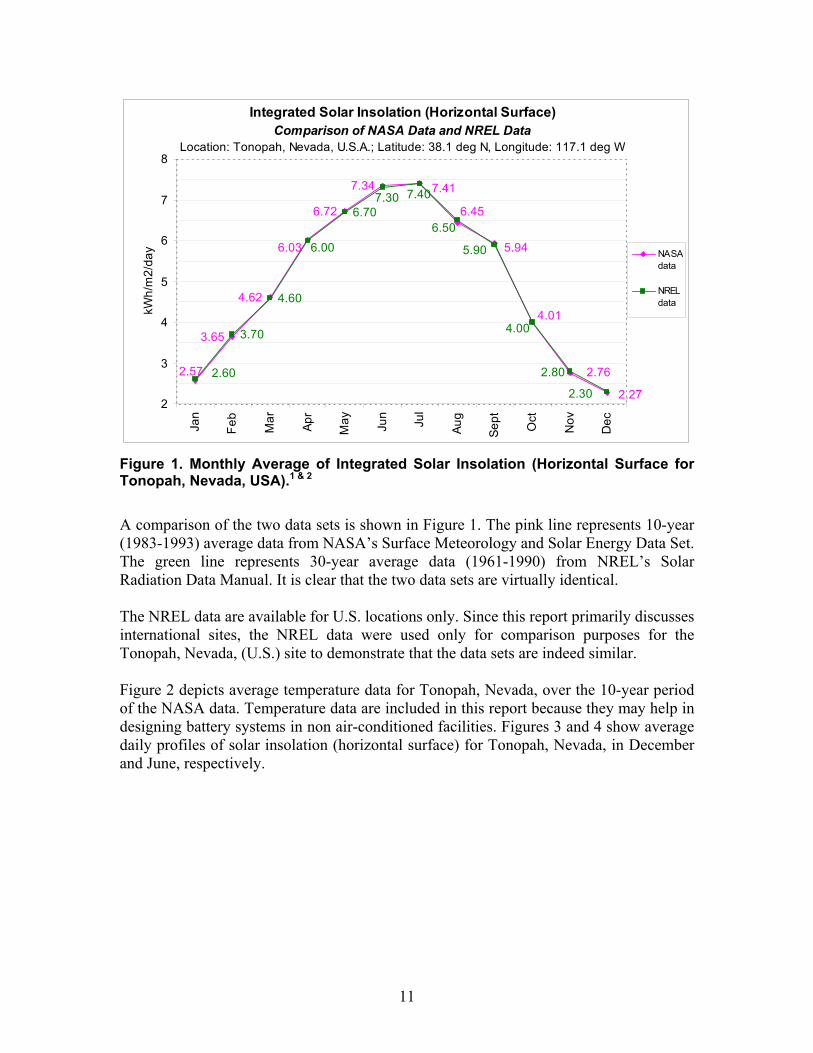
2.2 Results Figure 1 shows a typical integrated solar insolation profile, in this case, for Tonopah, Nevada, which is located 225 miles northwest of Las Vegas, Nevada. This location was chosen because it is a site where solar patterns are considered to be “typical.” Two data sets were used to generate the solar insolation profiles in this case only, in an effort to compare the NASA data with another source: “The National Renewable Energy Laboratory’s (NREL) Solar Radiation Data Manual for Flat-Plate Type and Concentrating Collector Data Sets.” These data sets were derived from the 1961-1990 National Solar Radiation Data Base.2
1 This tool is available free-of-charge at http://eoswfeb.larc.nasa.gov/sse. Release 4 became available in July 2003. The SSE web site is made possible by: NASA, Natural Resources Canada, National Renewable Energy Laboratory, Solar Energy International, Sun Frost, Inc., the Center for Renewable Energy and Sustainable Technology, Solar Household Energy, Inc., Numerical Logics, Inc., and the Atmospheric Sciences Research Center at The University at Albany. 2 NREL’s Solar Radiation Data Manual for Flat-Plate and Concentrating Collectors data sets are derived from the 1961-1990 National Solar Radiation Data Base. This information is available for select U.S. locations only and can be downloaded free-of-charge at http://rredc.nrel.gov/solar/pubs/redbook/.
11
Integrated Solar Insolation (Horizontal Surface) Comparison of NASA Data and NREL Data
Location: Tonopah, Nevada, U.S.A.; Latitude: 38.1 deg N, Longitude: 117.1 deg W
3.65
4.62
6.72
7.34
6.70
2.27
2.76
4.01
5.94
6.45
7.41
6.03
2.57 2.80
6.50
7.407.30
5.90
2.30
4.60
3.70
2.60
4.00
6.00
2
3
4
5
6
7
8
Jan
Feb
Mar
Apr
May Jun
Jul
Aug
Sept
Oct
Nov
Dec
kWh/
m2/
day NASA
data
NRELdata
Figure 1. Monthly Average of Integrated Solar Insolation (Horizontal Surface for Tonopah, Nevada, USA).1 & 2
A comparison of the two data sets is shown in Figure 1. The pink line represents 10-year (1983-1993) average data from NASA’s Surface Meteorology and Solar Energy Data Set. The green line represents 30-year average data (1961-1990) from NREL’s Solar Radiation Data Manual. It is clear that the two data sets are virtually identical. The NREL data are available for U.S. locations only. Since this report primarily discusses international sites, the NREL data were used only for comparison purposes for the Tonopah, Nevada, (U.S.) site to demonstrate that the data sets are indeed similar. Figure 2 depicts average temperature data for Tonopah, Nevada, over the 10-year period of the NASA data. Temperature data are included in this report because they may help in designing battery systems in non air-conditioned facilities. Figures 3 and 4 show average daily profiles of solar insolation (horizontal surface) for Tonopah, Nevada, in December and June, respectively.

12
Average Temperature 10-Year Monthly Average (1983-1993)
Location: Tonopah, Nevada, U.S.A.; Latitude: 38.1 deg N, Longitude: 117.1 deg W
-0.81.0
3.7
7.7
12.1
18.6
23.5 22.8
17.0
10.8
2.6
-1.4
-5
0
5
10
15
20
25
30
Jan
Feb
Mar
Apr
May
Jun
Jul
Aug
Sep
t
Oct
Nov
Dec
deg
C
Figure 2. Ten-Year Monthly Average Temperature for Tonopah, Nevada, USA.1
Daily Profile of Monthly Solar Insolation (Horizontal Surface) 10-Year December Monthly Average (1983-1993)
Location: Tonopah, Nevada, U.S.A.; Latitude: 38.1 deg N, Longitude: 117.1 deg W
0.0
0.1
0.2
0.3
0.4
0.5
0.6
0.7
0.8
0.9
1.0
1:00
4:00
7:00
10:0
0
13:0
0
16:0
0
19:0
0
22:0
0
Time of Day (Local Standard Time)
kW/m
2
Figure 3. Average Daily Profile of Solar Insolation (Horizontal Surface) for Tonopah, Nevada, USA, in December.1

13
Daily Profile of Monthly Solar Insolation (Horizontal Surface) 10-Year June Monthly Average (1983-1993)
Location: Tonopah, Nevada, U.S.A.; Latitude: 38.1 deg N, Longitude: 117.1 deg W
0.0
0.1
0.2
0.3
0.4
0.5
0.6
0.7
0.8
0.9
1.0
1:00
4:00
7:00
10:0
0
13:0
0
16:0
0
19:0
0
22:0
0
Time of Day (Local Standard Time)
kW/m
2
Figure 4. Average Daily Profile of Solar Insolation (Horizontal Surface) for Tonopah, Nevada, USA, in June.1
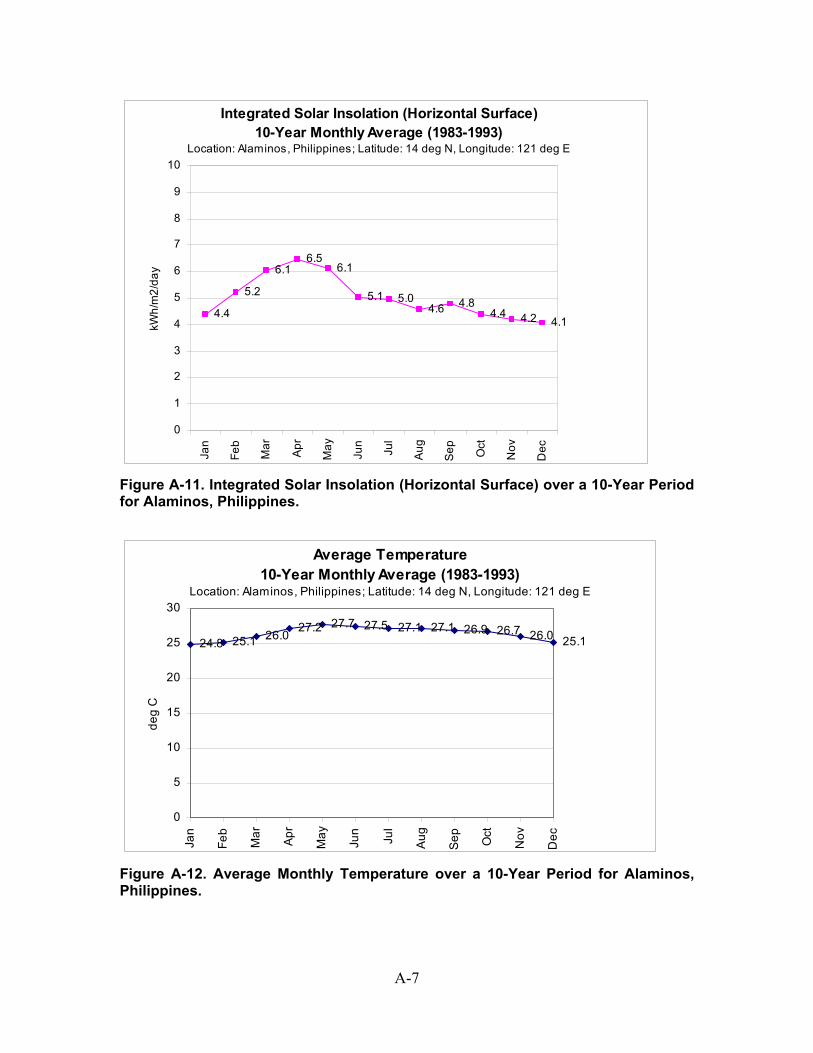
The majority of insolation profiles follow the typical seasonal variations depicted in Figure 1. In some areas, however, this is not the case due to regional climatology. For example, as demonstrated in Figure 5 below, the curve for Chittagong, Bangladesh, is not symmetrical, likely due to the monsoon season occurring in the summer. This causes depressed solar energy for those months. Insolation curves, both typical and atypical, are shown in Appendix A. Table 1 below summarizes these insolation data for the regions that will be discussed in Section 3 of this report: San Juanico, Mexico; Chittagong, Bangladesh; Alaminos, Philippines; Rio Negro, Argentina; Hyderabad, India; Puerto Plata, Dominican Republic; and Lime Village, Alaska, U.S.A. Figures 6, 7, and 8 are false-color images showing the average solar insolation over the entire globe. The colors correspond to values measured every day during a 10-year period by a variety of Earth-observing satellites and integrated by the International Satellite Cloud Climatology Project (ISCCP). NASA's Surface Meteorology and Solar Energy Project compiled these data—collected from July 1983 to June 1993—into a 10-year average for that period.

14
Integrated Solar Insolation (Horizontal Surface) 10-Year Monthly Average (1983-1993)
Location: Chittagong, Bangladesh; Latitude: 22.21 deg N, Longitude: 91.5 deg E
4.65.2
6.0 6.15.6
4.0 3.8 4.1 4.14.5 4.3 4.3
0.0
1.0
2.0
3.0
4.0
5.0
6.0
7.0
8.0
9.0
10.0
Jan
Feb
Mar
Apr
May
Jun
Jul
Aug
Sep Oct
Nov
Dec
kWh/
m2/
day
Figure 5. The 10-Year Monthly Average of Integrated Solar Insolation (Horizontal Surface) for Chittagong, Bangladesh.1 Table 1. Resource Summary: 10-Year Climatology (1983-1993) of Solar Insolation (Horizontal Surface).1
Location Highest Insolation kWh/m2/day
Lowest Insolation kWh/m2/day
San Juanico, Mexico 7.54 3.13
Chittagong, Bangladesh 6.07 3.81
Alaminos, Philippines 6.47 4.05
Rio Negro, Argentina 7.06 1.40
Hyderabad, India 6.56 4.00
Puerto Plata, Dominican Republic 6.08 4.08
Lime Village, Alaska, U.S.A. 4.84 0.12 .

15
Figure 6. Average Annual Insolation (Horizontal Surface) Over the 10-Year Period of 1983-1993.1
Figure 7. Average December Insolation (Horizontal Surface) over the 10-Year Period of 1983-1993.1

16
Figure 8. Average June Insolation (Horizontal Surface) Over the 10-Year Period of 1983-1993. 1
3.0 Load Profiles 3.1 Methodology The methodology for compiling specific load data for RAPS systems involved searches at the Library of Congress and on the Internet for solar, wind, and other resources used in RAPS systems. A list was compiled that includes approximately 65 sites (list was created in 2001, sites created after this date would not be included) that have used some form of RAPS (listed in Appendix B). Where contact information was available, e-mails or phone calls were made to find out more specific load information. The data from several sites were compiled, and typical daily load profiles for several single family homes, health clinics, schools, and villages were created. For several projects, load data were available from a digital recorder. Loads for several small villages as well as single family homes, health clinics and schools were plotted from these data. Combining several load segments together allowed for the construction of average profiles for a range of system sizes and functions. In other cases, however, load data versus time of day was not readily available. RAPS project data often specified only the type of battery, PV array or wind generator used and how long the system had been in use.

17
In the cases where load data were available, extrapolation was performed to ascertain daily profiles. For instance, data collected from a PV system in Bangladesh indicated that a family used a 6-watt light, a 15-watt black and white television, a 3-watt radio, and a 6-watt cassette player for four hours per day. The total load is 120 watt-hours per day, seven days a week. Based on conversations with experts, information was obtained to build a profile that showed a small load in the morning, which indicated only a light being used. A mid-day peak occurred around noon from television usage, and in the evening the load profile generally spiked since this is when most recreational activities take place.
3.2 Load Profiles Actual load data for RAPS systems are often not easily obtainable. Prior to the installation of a RAPS system, estimates are made of a community’s power needs, but these needs have a tendency to increase once RAPS are installed. Thus, some of the load data is presented in a form that show estimates based on projected consumer economic levels.
3.2.1 Single Family Home a) Rio Negro, Argentina Table 2 is a compilation of typical load conditions based on economic status and availability of power in the Rio Negro region of Argentina.

18
Table 2. Single Family Home Profiles by Economic Status in Rio Negro, Argentina.
Profile Economic Level (Pesos/month*)
To ta l Ene rg y Used (Wh/day)
Load Type Watts Duration (hrs/day)
Number in use
Light 15 4 2 1 11 160
Radio 20 2 1
Light 15 6 5
Radio 20 8 1 2 30 635
Tape Recorder 25 1 1
Light 15 12 6
Radio 20 6 1 3 45 1250
Tape Recorder 25 2 1
Light 15 16 7
Radio 20 4 1
Tape Recorder 25 0 0
Television 60 3.5 1
4 60 2030
Video 40 1.5 1
Light 15 16 7
Radio 20 4 1
Tape Recorder 25 0 0
Television 60 10 1
5 75 2760
Video 40 10 1 * Represents the amount of money that a member of this profile group can pay per month. An Argentine peso was worth about $0.34 US as of August 2005. However, an Argentine peso was worth $1.00 US at the time the Transenergie-WBI group study was conducted in 1999. Most profiles, regardless of economic status, showed that electricity was being used during two or three periods a day. All profiles show morning and evening peaks while the more affluent homes showed mid-day peaks as well. In some cases, a non-zero baseload (using a radio all day, for instance) was also found. It was ascertained from conversations with experts in the field who concluded that if a family could afford it, they would “run lights and a television all day.” A basic profile would include only one to two lights and a small radio. Compact fluorescent lights (CFL) are used and typically draw five to twenty watts each. In a study conducted by the Transenergie-WBI group in May 1999, 66% of the villagers of the Rio Negro region of Argentina fell into Profile 1 in Table 23. The Transenergie-WBI group used Graphical Information Systems to determine how many interviews were required to encompass a large enough sample size. Tape recorders, televisions, and video cassette recorders (VCRs) are used in households that can afford to pay the utility costs. Twenty-seven percent of the villagers surveyed said that they could afford lights, radio,
3 Resumen Ejecutivo del estudio de la Provincia de Rio Negro–Mayo 1999

19
and a tape recorder, where only seven percent could afford a television and VCR in addition to lights and a radio. It should be noted that these statistics are region-specific and vary depending on the area. Since cooking with electric stoves and hot plates is costly, propane, natural gas or wood burning grills were used in all of the single family homes. Refrigeration proved to be cost prohibitive in many homes; restaurants and other large commercial facilities were the only establishments that could afford such appliances. b) Puerto Plata, Dominican Republic The small village of Puerto Plata in the Dominican Republic hosts an experimental PV array for a residential electrification project. The project was established in a home that was thought to represent a typical village home with four family members in the dwelling. Initially, designs were made to include a television that would be in use 3 to 4 hours per day, 1 to 2 lights used 4 hours per day, and radio used for most of the day. After the system was installed, it was discovered through remote monitoring that the television was used far more than the original projections estimated. Instead of the projected 3 to 4 hours per day, the television was actually used 8 to10 hours per day. One theory was that other villagers frequented the household since it had a television, hence contributing to the increased usage. Figure 9 shows the home’s load profile.
0
20
40
60
80
100
120
140
160
180
1:00
2:00
3:00
4:00
5:00
6:00
7:00
8:00
9:00
10:00
11:00
12:00
13:00
14:00
15:00
16:00
17:00
18:00
19:00
20:00
21:00
22:00
23:00
0:00
Time of Day
Load
(W)
765 Wh Figure 9. Load Profile of a Single Family Home in Puerto Plata, Dominican Republic.

20
3.2.2 Small Community a) Lime Village, Alaska, United States A hybrid solar-diesel electrical generation system was installed in July 2001 in Lime Village, Alaska, a remote community in the southwestern portion of the state, about 200 miles west of Anchorage, with a population of about 65 people. Temperatures range between -47 and 82 degrees Fahrenheit in Lime Village. Precipitation averages 22 inches, with snowfall of 85 inches per year. The system is a demonstration project designed to test a hybrid generation plant for remote communities of 50 to 100 people. Managed and funded by the Alaska Energy Authority, the Lime Village project is designed to provide the community with reliable and affordable electricity. The village was chosen for the experiment because of its high energy costs, low per-capita power consumption, latitude, and weather conditions. Lime Village was first electrified in 1998. However, the original system failed due to design problems and was in need of an upgrade. The original generator had been damaged and was unusable without major repairs; the original battery bank and PV array were unusable because the system lacked a functioning power conversion device. The original Lime Village system was replaced with a new system that includes an expanded PV array and a new, smaller diesel generator set. The Lime Village data collection site is shown in Figure 10. The system will include 106 solar panels and an inverter. Table 3 provides details on the new system. Table 3. Technical Characteristics of the Lime Village Test Bed.*
Generator Type Generator Size Number of Generators Diesel 35 kW 1
Diesel 21 kW 1
Photovoltaics 12 kW N/A
Generator Description: 21 kW: John Deere engine (manufactured by Yanmar), genset assembled by Bell Power Systems, Massachusetts. 35 kW: assembled by Emerson. Battery Brand: GNB ABSOLYTE valve-regulated lead-acid AHR Capacity: 530 Ah at 8-hr rate Number of Batteries/System: 96 cells orig., 2 removed DC Bus Voltage: 192 V orig., 188 V currently Inverter Brand: AES Static Power Pack * Note: As of September 2003, the battery system had failed and was being replaced with a similar system.
This project is one of the first RAPS experiments in which a small community is not only receiving its power from a hybrid system, but officials from the local energy authority are closely monitoring system efficiency. Performance data and results will be evaluated to assess whether solar power, in combination with diesel generation and battery storage, can be used to reduce power costs and enhance electrical efficiency in other rural

21
communities in Alaska. Determining an optimum combination of diesel and solar power is one of the key objectives of the experiment. Since diesel fuel must be hauled in by aircraft, fuel costs are very high in the village. The hybrid system saved the community $2,000 in diesel fuel costs in its first month of operation alone.
Figure 10. The Lime Village Data Collection Site. Source: NREL Photographic Information Exchange, http://www.nrel.gov/data/pix Figure 11 shows the daily high and average load profiles in Lime Village, AK. And, it shows the load profiles for an average day and for a high-usage winter’s day in Lime Village. In both cases, a single peak in the afternoon and a significant baseload are evident.
0
5
10
15
20
25
10pm to
12am
2am to
4am
6am to
8am
10am
to 12
pm
2 pm to
4pm
6pm to
8pm
Tim e of Day
Load
(kW
)
Average Winter High
Figure 11. Daily (Winter) High and Average Load Profile in Lime Village (this is replotted from original load profile data from the Alaska Energy Authority, November 2002).

22
3.2.3 Village Energy usage has been examined for several villages around the globe during different seasons. Typical villages consist of approximately thirty homes, a clinic, a school, and a cottage industry. Each home may have a television, some light bulbs, and a radio. A school may have four to six light bulbs. A clinic uses light bulbs, a refrigerator, a television, communication equipment, and an autoclave to sterilize instruments. The cottage industry generally has light bulbs and other equipment required by the industry. Because appliances are either turned on or off, there is no cycling load and during the off-peak time periods, the load is either zero or the base load. The load profile of a village could be obtained by summing the energy usage of its individual components (homes, school, clinic, and industry) during every hour. The load profile may have three peaks: • The morning peak during which some lights and the radio are used while preparing
breakfast; • The afternoon peak characterized by lunch preparation during which the radio may be
used as well as the television; • The evening peak characterized by meal preparation and leisure activities after sunset
with all lights, television, and radio turned on. a) San Juanico, Baja California, Mexico The village of San Juanico has three schools, two of which require little or no electricity. The town has two restaurants or cantinas. Twenty-five of the villagers have satellite dishes, reinforcing the importance of television viewing. In several situations, televisions were used more frequently than originally anticipated. Television usage typically began early in the morning while the family was preparing for school and work. Load spikes in the middle of the day and evening were attributed to television use. Remote power systems designed for 3-4 hours a day, in some cases ended up being used for 8-10 hours a day like in the Dominican Republic village of Puerto Plata. In this small Baja town of 400 villagers, homes with a television and VCR combination can become very popular places. During World Cup soccer games, some homes have been filled with 40 people watching a single 10-inch television. Also in the case of San Juanico, once every two years the village population doubles when the famous biennial Baja off-road car race passes through the town. This additional variable would have to be factored into the overall load profile. A social survey conducted by the National Renewable Energy Laboratory’s Renewables for Sustainable Village Power Program in the San Juanico village supports the notion that the load the household values most is the television. A washing machine, radio, and refrigerator were the next most necessary items for this village, respectively. It was found that families would conserve electricity by turning off the light just to have longer playing time for the television.
23
0
50
100
150
200
250
1:00
2:00
3:00
4:00
5:00
6:00
7:00
8:00
9:00
10:0
0
11:0
0
12:0
0
13:0
0
14:0
0
15:0
0
16:0
0
17:0
0
18:0
0
19:0
0
20:0
0
21:0
0
22:0
0
23:0
0
24:0
0:00
Time of Day
Wat
ts
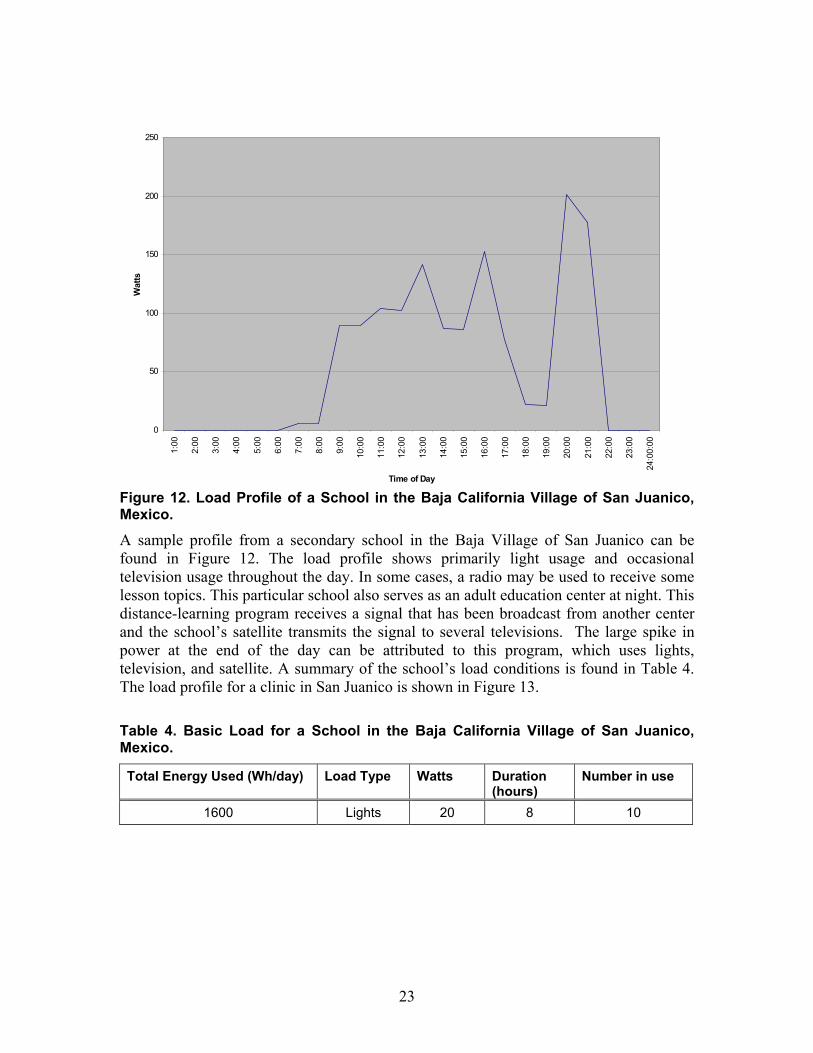
Figure 12. Load Profile of a School in the Baja California Village of San Juanico, Mexico.
A sample profile from a secondary school in the Baja Village of San Juanico can be found in Figure 12. The load profile shows primarily light usage and occasional television usage throughout the day. In some cases, a radio may be used to receive some lesson topics. This particular school also serves as an adult education center at night. This distance-learning program receives a signal that has been broadcast from another center and the school’s satellite transmits the signal to several televisions. The large spike in power at the end of the day can be attributed to this program, which uses lights, television, and satellite. A summary of the school’s load conditions is found in Table 4. The load profile for a clinic in San Juanico is shown in Figure 13. Table 4. Basic Load for a School in the Baja California Village of San Juanico, Mexico.
Total Energy Used (Wh/day) Load Type Watts Duration (hours)
Number in use
1600 Lights 20 8 10

24
0
50
100
150
200
250
300
350
1:00
2:00
3:00
4:00
5:00
6:00
7:00
8:00
9:00
10:0
0
11:0
0
12:0
0
13:0
0
14:0
0
15:0
0
16:0
0
17:0
0
18:0
0
19:0
0
20:0
0
21:0
0
22:0
0
23:0
0
0:00
Time of Day
Wat
ts
2000 Wh/day
Figure 13. Load Profile of a Health Clinic in San Juanico, Mexico.
The profile shows refrigeration equipment used around the clock with a baseline load of about 40 watts. Refrigerators are generally 40-120 watts, depending on size and efficiency. The refrigerator is used to keep vaccines and other temperature-sensitive medicines from spoiling. Communication equipment such as a satellite or radio device can be used for emergencies when a clinic staff member needs to consult a specialist or to arrange for evacuation of a seriously ill or injured patient. As the workers arrived in the morning, several lights are turned on as well as the television. Each day the workers sterilize their instruments in an autoclave, which usually occurs near the end of the day. The autoclave generally runs for approximately 2 hours at around 125 watts. After the instruments are clean, there may be some additional television usage at night along with one to two lights being used. The load conditions are outlined in Table 5. Figure 14 represents an actual overall load profile from a data recorder for the village of San Juanico. A single peak, large baseload profile is depicted. Table 5. Load for Clinic in Baja Village of San Juanico, Mexico.
Total Energy Used (Wh/day)
Load Type Watts Average Duration (hrs)
Number in use
Television 60 4 1
Refrigerator/Comm. Equip.
40 24 1
Lights 15 10 5 2000
Autoclave 125 2 1

25
0
5000
10000
15000
20000
25000
1:00
2:00
3:00
4:00
5:00
6:00
7:00
8:00
9:00
10:0
0
11:0
0
12:0
0
13:0
0
14:0
0
15:0
0
16:0
0
17:0
0
18:0
0
19:0
0
20:0
0
21:0
0
22:0
0
23:0
0
0:00
Time of Day
Wat
ts
Figure 14. Load Profile of the San Juanico, Mexico.
b) Alaminos, Philippines A load profile for the Alaminos, Philippines village can be found in Figure 15. This curve typifies the single family home profile, but on a larger scale. The Alaminos load profile data were taken from a PV mini-grid that powers 60 homes. The system averages out to approximately 2000 Wh/day per home, which is similar to the Single Family Home Profile from Rio Negro, Argentina, shown in Table 2. This system is large enough to support several lights, a radio, tape recorder, television, and VCR. In the GTX Philippines solar project, monitoring was done to see if villagers followed the recommended practice of reducing consumption, e.g. less television viewing or using fewer lights for a shorter period during rainy days. It was found that the households did not reduce consumption during rainy days as recommended. They experienced load disconnects from the controller when the cloudiness lasted for several days. This shows that the system should provide a particular minimum amount of energy even in the worst weather. Under this configuration, the battery only lasted for two years. It was also of interest to find out if television use increased on weekends. It was found that weekend television use was less when compared to weekdays with good shows. In homes where there was not a television, a radio was used for the majority of the day.

26
0
500
1000
1500
2000
2500
3000
3500
4000
0:00
1:00
2:00
3:00
4:00
5:00
6:00
7:00
8:00
9:00
10:0
0
11:0
0
12:0
0
13:0
0
14:0
0
15:0
0
16:0
0
17:0
0
18:0
0
19:0
0
20:0
0
21:0
0
22:0
0
23:0
0
Time of day
Wat
ts
Figure 15. Load Profile of a Village in Alaminos, Philippines.
c) Hyderabad, India An additional village load profile was created from data collected from the Hyderabad, India region. Several things were taken into account before selection of this village for electrification. Preference was given to villages that had organized communities and townships. In addition, priority was given to villages whose per capita income could be increased through harnessing the electricity for agricultural and industrial purposes. Hyderabad has approximately 60 households and 300 people where the basic load profile includes private houses, streetlights, a community center, health center, and water pump. The load conditions are detailed in Table 6 and a load profile is represented in Figure 16. Again the profile duplicates the general, three-peak, single family home profiles shown earlier. The Hyderabad, India, village site included a community center load (See Table 7).

27
Table 6. Basic Load Conditions for Hyderabad, India.
Total Energy Used (Wh/day)
Load Type Watts Duration (hours/day)
Number in use
CFL He 9 4 120
Street lighting 11 4 12
CFL 9 3 2 Comm. Center
Television 100 3 1
CFL 9 5 1 Health Center Vaccine
Refrigerator 40 24 1
Hyderabad, India 12927
Water Pump 840 8 1
Table 7. Community Center Load in Hyderabad, India.
Load Type Watts Duration (hours/day)
Number in use
CFL 9 3 2 Community Center Televisi
on 100 3 1
0
500
1000
1500
2000
2500
1:00
2:00
3:00
4:00
5:00
6:00
7:00
8:00
9:00
10:0
0
11:0
0
12:0
0
13:0
0
14:0
0
15:0
0
16:0
0
17:0
0
18:0
0
19:0
0
20:0
0
21:0
0
22:0
0
23:0
0
24:0
0:00
Time of Day
Wat
ts
Figure 16. Daily Load Profile for Hyderabad, India.

28
These centers can alleviate household crowding by creating a central location where villagers can convene to watch television. For a flat fee, villagers can gather and watch television in a large hall. This activity generally occurs at night and requires adequate lighting conditions. Resource data for the communities discussed here are shown in Appendix A. Load and resource data can be fit to equations where power is expressed as a function of time of day. A comparison of these equations could provide a means for determining how well the supply matches demand (i.e., how much power can be supplied directly from the PV array), and how much storage capacity is needed. These equations would also allow for the design of an adequate battery storage system. The equations can be made available upon request to Energetics, Inc.
4.0 Conclusions The motivation for this study came from workshops with energy policy planners and energy industry experts held in Jakarta, Indonesia, and Brisbane, Australia in 1997, to discuss the need to develop robust design practices for RAPS systems. Representatives from ILZRO and SNL, and these industry experts began this project by identifying single family homes, communities, and villages as candidates for RAPS applications, and defined several different sizes/power requirements for each. The team then devised a “strawman” series of load profiles. The general premise was that electricity was used during three peak time periods: in the morning, afternoon, and evening. At other times, electricity usage was zero or near zero. This premise appears to be supported by the data presented in this report. Most available data for single family homes tend to support load requirements in which power is used in two or three peak periods. Morning and evening peaks are typically present, and a noontime peak often is apparent except in the lowest economic cases. Baseload usage is often zero for single family homes, although small, non-zero baseloads exist during the daylight hours in some cases. In general, the single family homes, community, and village systems being studied serve loads in which the base load is small relative to peak loads that occur in the morning, mid-day and evening. In fact, if all of the appliances used in the village have no parasitic load, then the base load is equal to zero. In some cases in the larger villages, the individual systems tend to become lost in the baseload. When designing remote area power systems, several factors should be taken into account in addition to load profiles. Some areas have seasonal events that increase power consumption such as a heavy tourist season or, in the case of San Juanico, the famous biennial Baja off-road car race which has a significant effect on power use. Special events can lead to temporary load increases that need to be considered when designing systems and projecting loads.

A-1
APPENDIX A – Resource Data for Sites Discussed in This Report The source for all data in Appendix A is the NASA Surface Meteorology and Solar Energy Data Set. Averages are over the 10-year period from July 1983 to June 1993. The following resource data are presented in Appendix A: • Daily Profile of Solar Insolation (Horizontal Surface) for December and June • Average Integrated Solar Insolation (Horizontal Surface) • Average Temperature Chittagong, Bangladesh Figure A-1 shows a daily profile of the solar insolation (horizontal surface) for December in Chittagong, Bangladesh, based on a 10-year (1983-1993) monthly average. Figure A-2 shows a daily profile of the solar insolation (horizontal surface) for June in Chittagong based on a 10-year (1983-1993) monthly average. Figure A-3 shows the integrated solar insolation (horizontal surface) over a 10-year period (1983-1993) for Chittagong. Figure A-4 shows average monthly temperature for this same period.
0.0
0.10.2
0.3
0.4
0.50.6
0.7
0.80.9
1.0
0:00
3:00
6:00
9:00
12:0
0
15:0
0
18:0
0
21:0
0
Time of Day (Local Standard Time)
kW/m
2
Daily Profile of Monthly Solar Insolation (Horizontal Surface) 10-Year December Monthly Average (1983-1993)
Location: Chittagong, Bangladesh; Latitude: 22.21 deg N, Longitude: 91.5 deg E
Figure A-1. Daily Profile of Monthly Solar Insolation (Horizontal Surface) for December in Chittagong, Bangladesh.

A-2
Daily Profile of Monthly Solar Insolation (Horizontal Surface) 10-Year June Monthly Average (1983-1993)
Location: Chittagong, Bangladesh; Latitude: 22.21 deg N, Longitude: 91.5 deg E
0.0
0.10.2
0.3
0.40.50.6
0.7
0.80.9
1.0
0:00
3:00
6:00
9:00
12:0
0
15:0
0
18:0
0
21:0
0
Time of Day (Local Standard Time)
kW/m
2
Figure A-2. Daily Profile of Monthly Solar Insolation (Horizontal Surface) for June in Chittagong, Bangladesh.
Integrated Solar Insolation (Horizontal Surface) 10-Year Monthly Average (1983-1993)
Location: Chittagong, Bangladesh; Latitude: 22.21 deg N, Longitude: 91.5 deg E
4.65.2
6.0 6.15.6
4.0 3.8 4.1 4.14.5 4.3 4.3
0.0
1.0
2.0
3.0
4.0
5.0
6.0
7.0
8.0
9.0
10.0
Jan
Feb
Mar
Apr
May
Jun
Jul
Aug
Sep Oct
Nov
Dec
kWh/
m2/
day
Figure A-3. Integrated Solar Insolation (Horizontal Surface) over a 10-Year Period for Chittagong, Bangladesh.

A-3
Average Temperature 10-Year Monthly Average (1983-1993)
Location: Chittagong, Bangladesh; Latitude: 22.21 deg N, Longitude: 91.5 deg E
17.2
20.1
23.4 24.2 24.825.8 25.6 25.7 25
23.6
20.6
17.8
0
5
10
15
20
25
30Ja
n
Feb
Mar
Apr
May
Jun
Jul
Aug
Sep Oct
Nov
Dec
deg
C
Figure A-4. Average Monthly Temperature over a 10-year Period for Chittagong, Bangladesh.
Rio Negro, Argentina Figure A-5 shows a daily profile of the solar insolation (horizontal surface) for December in Rio Negro, Argentina, based on a 10-year (1983-1993) monthly average. The range of insolation data for Rio Negro is wider than other regions because of its close proximity to the South Pole. Regions farther away from the equator have long nights or days, depending on the season. Figure A-6 shows a daily profile of the solar insolation (horizontal surface) for June in Rio Negro based on a 10-year (1983-1993) monthly average. Also for Rio Negro, Figures A-7 and A-8 show an integrated solar insolation over a 10-year period, and an average monthly temperature over a 10-year period, respectively. Other Sites Figures A-9 through A-28 show the integrated solar insolation (horizontal surface) over a 10-year period, average monthly temperature over a 10-year period, and the daily profiles of monthly solar insulation (horizontal surface) for Alaminos, Philippines (A-9 – A-12), Puerto Plata, Dominican Republic (A-13 – A-16), Hyderabad, India (A-17 – 20), San Juanico, Mexico (A-21 – A-24), and Lime Village, Alaska (A-25 – A-28).

A-4
Daily Profile of Monthly Solar Insolation (Horizontal Surface) 10-Year December Monthly Average (1983-1993)
Location: Rio Negro, Argentina; Latitude: 40.1 deg S, Longitude: 69.3 deg W
0.0
0.1
0.2
0.3
0.4
0.5
0.6
0.7
0.8
0.9
1.0
0:00
3:00
6:00
9:00
12:0
0
15:0
0
18:0
0
21:0
0
Time of Day (Local Standard Time)
kW/m
2
Figure A-5. Daily Profile of Monthly Solar Insolation (Horizontal Surface) for December in Rio Negro, Argentina.
Daily Profile of Monthly Solar Insolation (Horizontal Surface) 10-Year June Monthly Average (1983-1993)
Location: Rio Negro, Argentina; Latitude: 40.1 deg S, Longitude: 69.3 deg W
0.0
0.1
0.20.3
0.4
0.5
0.6
0.7
0.8
0.9
1.0
0:00
3:00
6:00
9:00
12:0
0
15:0
0
18:0
0
21:0
0
Time of Day (Local Standard Time)
kW/m
2
Figure A-6. Daily Profile of Monthly Solar Insolation (Horizontal Surface) for June in Rio Negro, Argentina.

A-5
Integrated Solar Insolation (Horizontal Surface) 10-Year Monthly Average (1983-1993)
Location: Rio Negro, Argentina; Latitude: 40.1 deg S, Longitude: 69.3 deg W
7.1
6.4
4.5
3.2
2.1
1.41.7
2.6
3.6
5.0
6.7 6.8
0
1
2
3
4
5
6
7
8
9
10
Jan
Feb
Mar
Apr
May
Jun
Jul
Aug
Sep Oct
Nov
Dec
kWh/
m2/
day
Figure A-7. Integrated Solar Insolation (Horizontal Surface) over a 10-Year Period for Rio Negro, Argentina.
Average Temperature10-Year Monthly Average (1983-1993)
Location: Rio Negro, Argentina; Latitude: 40.1 deg S, Longitude: 69.3 deg W
14.8 15.0
12.2
7.4
4.32.9
1.93.3
5.58.1
11.213.1
0
5
10
15
20
25
30
Jan
Feb
Mar
Apr
May
Jun
Jul
Aug
Sep Oct
Nov
Dec
deg
C
Figure A-8. Average Monthly Temperature over a 10-Year Period for Rio Negro, Argentina.

A-6
Daily Profile of Monthly Solar Insolation (Horizontal Surface) 10-Year December Monthly Average (1983-1993)
Location: Alaminos, Philippines; Latitude: 14 deg N, Longitude: 121 deg E
0.0
0.1
0.2
0.3
0.4
0.5
0.6
0.7
0.8
0.9
1.0
2:00
5:00
8:00
11:0
0
14:0
0
17:0
0
20:0
0
23:0
0
Time of Day (Local Standard Time)
kW/m
2
Figure A-9. Daily Profile of Monthly Solar Insolation (Horizontal Surface) for December in Alaminos, Philippines.
Daily Profile of Monthly Solar Insolation (Horizontal Surface) 10-Year June Monthly Average (1983-1993)
Location: Alaminos, Philippines; Latitude: 14 deg N, Longitude: 121 deg E
0.0
0.1
0.2
0.3
0.4
0.5
0.6
0.7
0.8
0.9
1.0
2:00
5:00
8:00
11:0
0
14:0
0
17:0
0
20:0
0
23:0
0
Time of Day (Local Standard Time)
kW/m
2
Figure A-10. Daily Profile of Monthly Solar Insolation (Horizontal Surface) for June in Alaminos, Philippines.
A-7
Integrated Solar Insolation (Horizontal Surface) 10-Year Monthly Average (1983-1993)
Location: Alaminos, Philippines; Latitude: 14 deg N, Longitude: 121 deg E
4.4
5.2
6.16.5
6.1
5.1 5.04.6 4.8
4.4 4.2 4.1
0
1
2
3
4
5
6
7
8
9
10
Jan
Feb
Mar
Apr
May
Jun
Jul
Aug
Sep Oct
Nov
Dec
kWh/
m2/
day
Figure A-11. Integrated Solar Insolation (Horizontal Surface) over a 10-Year Period for Alaminos, Philippines.
Average Temperature10-Year Monthly Average (1983-1993)
Location: Alaminos, Philippines; Latitude: 14 deg N, Longitude: 121 deg E
24.8 25.1 26.027.2 27.7 27.5 27.1 27.1 26.9 26.7 26.0 25.1
0
5
10
15
20
25
30
Jan
Feb
Mar
Apr
May
Jun
Jul
Aug
Sep Oct
Nov
Dec
deg
C
Figure A-12. Average Monthly Temperature over a 10-Year Period for Alaminos, Philippines.

A-8
Daily Profile of Monthly Solar Insolation (Horizontal Surface) 10-Year December Monthly Average (1983-1993)
Location: Puerto Plata, Dominican Republic; Latitude: 19.45 deg N, Longitude: 70.34 deg W
0.0
0.1
0.2
0.30.4
0.5
0.6
0.7
0.8
0.9
1.0
2:00
5:00
8:00
11:0
0
14:0
0
17:0
0
20:0
0
23:0
0
Time of Day (Local Standard Time)
kW/m
2
Figure A-13. Daily Profile of Monthly Solar Insolation (Horizontal Surface) for December in Puerto Plata, Dominican Republic.
Daily Profile of Monthly Solar Insolation (Horizontal Surface) 10-Year June Monthly Average (1983-1993)
Location: Puerto Plata, Dominican Republic; Latitude: 19.45 deg N, Longitude: 70.34 deg W
0.0
0.1
0.2
0.3
0.4
0.5
0.6
0.7
0.8
0.9
1.0
2:00
5:00
8:00
11:0
0
14:0
0
17:0
0
20:0
0
23:0
0
Time of Day (Local Standard Time)
kW/m
2
Figure A-14. Daily Profile of Monthly Solar Insolation (Horizontal Surface) for June in Puerto Plata, Dominican Republic.

A-9
Integrated Solar Insolation (Horizontal Surface) 10-Year Monthly Average (1983-1993)
Location: Puerto Plata, Dominican Republic; Latitude: 19.45 deg N, Longitude: 70.34 deg W
4.45.1
5.86.1 5.9
5.6 5.6 5.5 5.24.7
4.3 4.1
0
1
2
3
4
5
6
7
8
9
10
Jan
Feb
Mar
Apr
May
Jun
Jul
Aug
Sep Oct
Nov
Dec
kWh/
m2/
day
Figure A-15. Integrated Solar Insolation (Horizontal Surface) over a 10-Year Period for Puerto Plata, Dominican Republic.
Average Temperature 10-Year Monthly Average (1983-1993)
Location: Puerto Plata, Dominican Republic; Latitude: 19.45 deg N, Longitude: 70.34 deg W
25.3 25.0 25.0 25.6 26.227.1 27.4 27.6 27.7 27.5 26.9
25.9
0
5
10
15
20
25
30
Jan
Feb
Mar
Apr
May
Jun
Jul
Aug
Sep Oct
Nov
Dec
deg
C
Figure A-16. Average Monthly Temperature over a 10-Year Period for Puerto Plata, Dominican Republic.

A-10
Daily Profile of Monthly Solar Insolation (Horizontal Surface) 10-Year December Monthly Average (1983-1993)
Location: Hyderabad, India; Latitude: 17.42 deg N, Longitude: 78.55 deg E
0.0
0.1
0.2
0.3
0.4
0.5
0.6
0.7
0.8
0.9
1.0
2:00
5:00
8:00
11:0
0
14:0
0
17:0
0
20:0
0
23:0
0
Time of Day (Local Standard Time)
kW/m
2
Figure A-17. Daily Profile of Monthly Solar Insolation (Horizontal Surface) for December in Hyderabad, India.
Daily Profile of Monthly Solar Insolation (Horizontal Surface) 10-Year June Monthly Average (1983-1993)
Location: Hyderabad, India; Latitude: 17.42 deg N, Longitude: 78.55 deg E
0.0
0.1
0.2
0.3
0.4
0.5
0.6
0.7
0.8
0.9
1.0
2:00
5:00
8:00
11:0
0
14:0
0
17:0
0
20:0
0
23:0
0
Time of Day (Local Standard Time)
kW/m
2
Figure A-18. Daily Profile of Monthly Solar Insolation (Horizontal Surface) for June in Hyderabad, India.

A-11
Integrated Solar Insolation (Horizontal Surface) 10-Year Monthly Average (1983-1993)
Location: Hyderabad, India; Latitude: 17.42 deg N, Longitude: 78.55 deg E
4.8
5.76.2
6.6 6.4
4.9
4.1 4.04.6 4.8
4.5 4.4
0
1
2
3
4
5
6
7
8
9
10
Jan
Feb
Mar
Apr
May
Jun
Jul
Aug
Sep Oct
Nov
Dec
kWh/
m2/
day
Figure A-19. Integrated Solar Insolation (Horizontal Surface) over a 10-Year Period for Hyderabad, India.
Average Temperature 10-Year Monthly Average (1983-1993)
Location: Hyderabad, India; Latitude: 17.42 deg N, Longitude: 78.55 deg E
22.625.0
28.730.9 30.9
26.625.0 24.7 24.6 23.6
21.5 20.6
0
5
10
15
20
25
30
35
Jan
Feb
Mar
Apr
May
Jun
Jul
Aug
Sep Oct
Nov
Dec
deg
C
Figure A-20. Average Monthly Temperature over a 10-Year Period for Hyderabad, India.

A-12
Daily Profile of Monthly Solar Insolation (Horizontal Surface) 10-Year December Monthly Average (1983-1993)
Location: San Juanico, Mexico; Latitude: 26.25 deg N, Longitude: 112.46 deg W
0.0
0.1
0.2
0.3
0.4
0.5
0.6
0.7
0.8
0.9
1.01:
00
4:00
7:00
10:0
0
13:0
0
16:0
0
19:0
0
22:0
0
Time of Day (Local Standard Time)
kW/m
2
Figure A-21. Daily Profile of Monthly Solar Insolation (Horizontal Surface) for December in San Juanico, Mexico.
Daily Profile of Monthly Solar Insolation (Horizontal Surface) 10-Year June Monthly Average (1983-1993)
Location: San Juanico, Mexico; Latitude: 26.25 deg N, Longitude: 112.46 deg W
0.0
0.1
0.2
0.3
0.4
0.5
0.6
0.7
0.8
0.9
1.0
1:00
4:00
7:00
10:0
0
13:0
0
16:0
0
19:0
0
22:0
0
Time of Day (Local Standard Time)
kW/m
2
Figure A-22. Daily Profile of Monthly Solar Insolation (Horizontal Surface) for June in San Juanico, Mexico.

A-13
Integrated Solar Insolation (Horizontal Surface) 10-Year Monthly Average (1983-1993)
Location: San Juanico, Mexico; Latitude: 26.25 deg N, Longitude: 112.46 deg W
4.0
4.9
6.0
7.07.5
5.2 5.34.9 5.1
4.5
3.73.1
0
1
2
3
4
5
6
7
8
9
10
Jan
Feb
Mar
Apr
May
Jun
Jul
Aug
Sep Oct
Nov
Dec
kWh/
m2/
day
Figure A-23. Integrated Solar Insolation (Horizontal Surface) over a 10-Year Period for San Juanico, Mexico.
Average Temperature 10-Year Monthly Average (1983-1993)
Location: San Juanico, Mexico; Latitude: 26.25 deg N, Longitude: 112.46 deg W
16.0 16.9 18.121.1
23.5
27.129.6 29.8 28.7
25.0
20.016.7
0
5
10
15
20
25
30
35
Jan
Feb
Mar
Apr
May
Jun
Jul
Aug
Sep Oct
Nov
Dec
deg
C
Figure A-24. Average Monthly Temperature over a 10-Year Period for San Juanico, Mexico.

A-14
Daily Profile of Monthly Solar Insolation (Horizontal Surface) 10-Year December Monthly Average (1983-1993)
Location: Lime Village, Alaska, U.S.A.; Latitude: 61.35 deg N, Longitude: 155.43 deg W
0.0
0.1
0.2
0.3
0.4
0.5
0.6
0.7
0.8
0.9
1.0
2:00
5:00
8:00
11:0
0
14:0
0
17:0
0
20:0
0
23:0
0
Time of Day (Local Standard Time)
kW/m
2
Figure A-25. Daily Profile of Monthly Solar Insolation (Horizontal Surface) for December in Lime Village, Alaska, U.S.A.
Daily Profile of Monthly Solar Insolation (Horizontal Surface) 10-Year June Monthly Average (1983-1993)
Location: Lime Village, Alaska, U.S.A.; Latitude: 61.35 deg N, Longitude: 155.43 deg W
0.0
0.1
0.2
0.3
0.4
0.5
0.6
0.7
0.8
0.9
1.0
2:00
5:00
8:00
11:0
0
14:0
0
17:0
0
20:0
0
23:0
0
Time of Day (Local Standard Time)
kW/m
2
Figure A-26. Daily Profile of Monthly Solar Insolation (Horizontal Surface) for June in Lime Village, Alaska, U.S.A.

A-15
Integrated Solar Insolation (Horizontal Surface) 10-Year Monthly Average (1983-1993)
Location: Lime Village, Alaska, U.S.A.; Latitude: 61.35 deg N, Longitude: 155.43 deg W
0.20.8
1.9
3.6
4.44.8
4.4
3.1
2.0
1.00.4 0.10
1
2
3
4
5
6
7
8
9
10
Jan
Feb
Mar
Apr
May
Jun
Jul
Aug
Sep Oct
Nov
Dec
kWh/
m2/
day
Figure A-27. Integrated Solar Insolation (Horizontal Surface) over a 10-Year Period for Lime Village, Alaska, U.S.A.
Average Temperature 10-Year Monthly Average (1983-1993)
Location: Lime Village, Alaska, U.S.A.; Latitude: 61.35 deg N, Longitude: 155.43 deg W
-16.1 -15.8
-8.55
-4.47
1.62
10
15.412
4.99
-6.66
-14.6 -13.9
-20
-15
-10
-5
0
5
10
15
20
25
Jan
Feb
Mar
Apr
May
Jun
Jul
Aug
Sep Oct
Nov
Dec
deg
C
Figure A-28. Average Monthly Temperature over a 10-Year Period for Lime Village, Alaska, U.S.A.

B-1
APPENDIX B - List of RAPS Projects as of 20014 Name of Project Country Notes
Balde de Leyes Argentina
First village in Argentina to be completely electrified by PV. In 1994, individual solar home systems were installed, followed by the installation of a PV-driven water pump. In addition, the village school has been electrified.
Buenos Aires Schools Argentina 400 schools to be electrified with wind or PV power; less than 1 kWh/day will be supplied with wind or PV.
Jujuy Microhydro Argentina School, police office, health post, and post office
Microhydro in Misiones Argentina Micro-hydro power assists the development of communities.
Misiones Cooperatives PV Electrification Argentina Tractor battery could be charged and used 3 to 4 hours/day; radio/tape players were used 3 hours/day.
Rio Negro Argentina PV, battery system on selected single family homes allows limited use of lights, radios, tape recorders; some television and VCR use. Range: 15 to 60 watts
Transenergie-WBI Argentina Economic load profiles derived from questionnaire
Wind for Schools in Chubut Argentina Provides light for rural schools; powered by wind/diesel power
Wind/PV Hybrid: Lagunillas del Farallon Argentina Loads: Public lighting, television repeater, school, church
Grameen Shakti Solar Home Systems (SHSs) Bangladesh Lights installed in 125 homes; all appliances used for 4 hours/day,
7 days/week
Narsingdi PV Battery Charging Station Bangladesh Battery charging stations to provide electricity
COAINE Coffee Cooperative Bolivia 200 solar home systems installed for coffee farmers
Cordeor/Cordebeni Municipal PV Bolivia 280 homes use 8-watt lamps and/or radios and televisions
NRECA PV Water Pumping Bolivia Provides potable water with a solar water pump
Manyana Project Botswana 42 users pay $8.75 a month for basic service
Joint U.S./Brazilian Rural Electrification Brazil 14 schools will be electrified.
Village of Campinas Brazil "Grid" operates for six hours per day from 6 p.m. to midnight.
Village of Joanes Hybrid Power Systems Brazil Four 10-kW wind generators with 10 kW of PV
Ayllo de Solar, San Pedro de Atacama Chile 26 homes share a community center & solar jack pump.
“Solar Village” Project China Project is electrifying homes in Mongolia.
Househould Wind PV/Hybrid Systems China 240 small wind/PV systems
Puerto Plata Dominican Republic PV, battery system allows use of lights, radio, and television.
Community Center, Nueva El Salvador A small solar still is used to produce distilled water.
Bus shelter and toilets France PV powers the lights and fan for the toilets.
CAF refuges (France) France PV was used in severe mountain conditions.
Cycling Museum France PV array now also powers a restaurant and museum.
GTA Refuges in France France 13 mountain refuges were electrified
Lightbuoys France 1060 lightbuoys are being powered by PV.
PV Homes in France France 40 homes use PV for lighting, refrigerators, and televisions.
4 Sources: Internet searches and research at the Library of Congress. (Specifically, much of this information was found at the Global Village Energy Partnership Project Database Web site, www.rsvp.nrel.gov.)

B-2
Name of Project Country Notes PV National Park of Vecors France A pollution-free power source is very attractive to the park.
Zigliara water pump France No batteries are used—surplus water is stored.
Rotenbach House Germany The PV array provides relief to peak demands on the grid.
Scharhorn Bird Sanctuary Germany PV was environmentally benign to birds.
Renewable Energy in Rural Ghana Ghana PV/diesel-hybrid systems will be installed in three villages.
Antikithira repeater Greece The battery was designed with 9-10 days autonomy.
Health Clinic, Barra Lampara Guatemala Clinic provides medical care for up to 40 people per day.
Village Water Pumping, Baie de Henne Haiti PV modules provide power to pump.
Water Purification, El Volcan Honduras Treats water - enough to fill a 40,000 liter tank each day.
Hyderabad India Approximately 60 households and 300 people; the basic load profile includes private houses, streetlights, a community center, health center, and water pump.
Assam India The project electrified 368 homes and 9 community centers.
Ramakhrishna Mission PV Project India Village will have lights and televisions.
Abruzzi, milk cooling Italy PV is installed for 50-catttle farm.
Ginostra Italy 30 homes have stand-alone PV.
Lucca airport lighting Italy Provides lighting for the landing strip and tower
Palmaiola Lighthouse Italy A PV generator and lamp were used to increase the range of the lighthouse.
Railway crossing signals Italy PV arrays are used to power the warning lights.
Miyako Photovoltaic Power Generation Systems Japan
Okinawa Electric Power Company (OEPC) is conducting a photovoltaic power generation system demonstration project on the islands of Kita-Daitojima and Ishigaki. The project uses a Sodium-Sulfur (NAS) battery. The design, operational features, and control techniques will be studied over the next four years.
San Juanico, Baja California Mexico PV/hybrid system powers village of 400.
Hybrid System for Xcalak Mexico Produces between 120 kWh/day and 250 kWh/day
Power Pod System Mexico System supports, television, lights, and radio.
Water Pumping, Quintana Roo Mexico PV array replaced a windmill and a diesel generator.
Xcalak hybrid wind/PV system Mexico 6 wind turbines, PV array, and a 400-kWh battery bank
PUCP Wind Energy Peru 1000 households use system.
Alaminos Philippines PV mini-grid that powers 60 homes—system is large enough to support several lights, a radio, tape recorder, television, and VCR.
Malalison Island Battery Charging Station Philippines PV battery station for 108 homes
Serra Da Estrella Portugal 53 PV generators were installed at 45 isolated sites.
Diaoule Power Station Senegal Hooked up to a network with two lights and a power point
Ndiebel Power Station Senegal Uses lights, radios, cassette recorders, televisions
Senegal Micro Power Station Senegal 4 micro power stations have been installed.
Senegal Standard Domestic PV Systems Senegal Power is provided to health posts, maternity units, and homes.
Basic Lighting in Schools South Africa 1,200 completed schools
Utha South Africa Battery Charging System runs televisions and lights.
Eskom Tri southern Africa System is a PV/diesel hybrid genset.
Tabarca Spain Power station serves about 100 families in the summer.
Hydrogen Remote Power Project United States University of Alaska at Fairbanks is currently testing fuel cells for future use in remote villages.
Lime Village United States Experimental hybrid solar-diesel electrical generation system; about 65 people live in the village.

Distribution
Richard Baxter Ardour Capital Investments, LLC 127 Mt. Auburn St., Suite 17 Cambridge, MA 02138
Imelda G. Francis Just Do IT 21658 W. Ravine Lake Zurich, IL 60047
Michael Hughes ZBB Technologies Inc. N93 W14475 Whittaker Way Menomonee Falls, WI 53051
Albert R. Landgrebe 1604 Fairways Oaks Dr. Palmetto, FL 34221
Peter Lex ZBB Technologies, Inc. N93 W14475 Whittaker Way Menomonee Falls, WI 53051
Bor Yann Liaw University of Hawaii 1680 East West Road, Post 112A Honolulu, HI 96822
Robert Parry ZBB Energy Corporation N93 W14475 Whittaker Way Menomonee Falls, WI 53051
Anthony Price Swanbarton Ltd Barton House, Swan Barton, Sherston Malmesbury, Wiltshire SN16 0LJ UNITED KINGDOM
Brad Roberts S&C Electric Company 5251 West Franklin Drive Franklin, WI 53132
Susan Schoenung Longitude 122 West, Inc. 1010 Doyle Street, Suite 10 Menlo Park, CA 94025
10 MS0614 Paul C. Butler, 05400 1 MS0614 Nancy H. Clark, 02547 2 MS9018 Central Technical Files, 08944 2 MS0899 Technical Library, 04536