remote network monitoring (rmon) * * mani subramanian “network management: principles and...
TRANSCRIPT
Remote Network Monitoring (RMON)*
*Mani Subramanian “Network Management: Principles and practice”, Addison-Wesley, 2000.
Outline
Basic Conceptso RMON Goalso Control of Remote Monitorso Multiple Managerso Table Management
Statistics group History group Host and hostTopN groups Matrix group Alarm group Filter and packet Capture group
Basic Concepts
Extends the SNMP functionality without changing the protocol
Allows the monitoring of remote networks (inter-network management)
MAC-layer (layer 2 in OSI) monitoring
Defines a Remote MONitoring (RMON) MIB that supplements MIB-IIo with MIB-II, the manager can obtain information on
individual devices onlyo with RMON MIB, the manager can obtain information
on the LAN as a whole
Basic Concepts
called network monitors, analyzers or probes A monitor generally can produce summary
information on o error statistics, e.g., counts # of collisions on a LANo Performance statistics: #packets delivered per
second, packet size distribution, etc.
A monitor also can store packets for later analysis
A Monitor may also filter data to limit the # packets counted or captured o filter based on packet type or characteristics (e.g.,
packets with certain source address, erroneous packets)
Basic Concepts
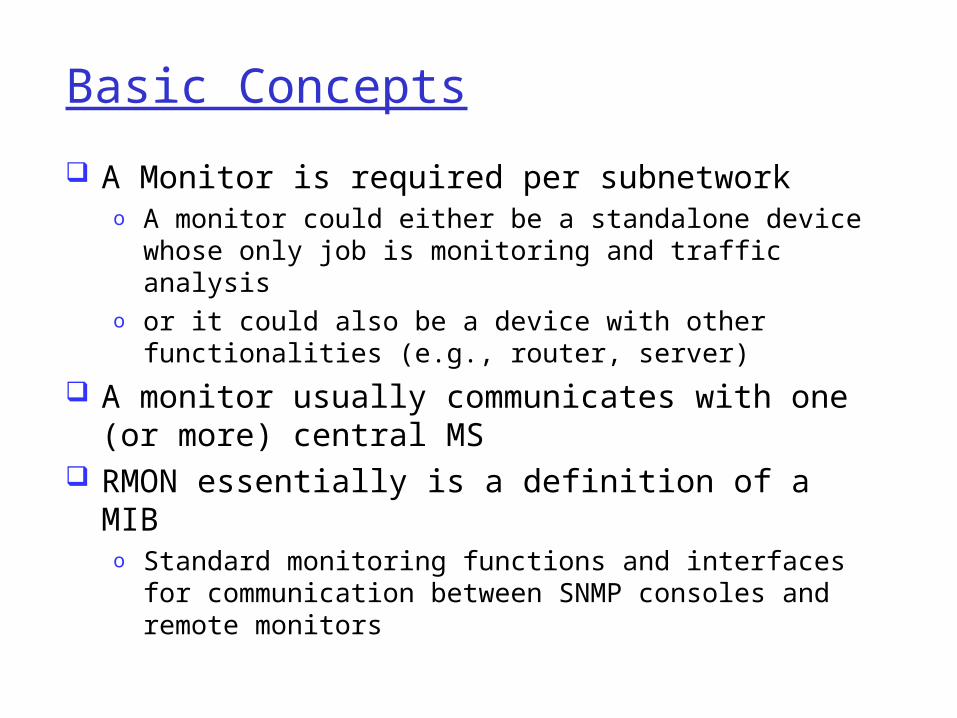
A Monitor is required per subnetwork o A monitor could either be a standalone device whose
only job is monitoring and traffic analysis o or it could also be a device with other functionalities
(e.g., router, server)
A monitor usually communicates with one (or more) central MS
RMON essentially is a definition of a MIBo Standard monitoring functions and interfaces for
communication between SNMP consoles and remote monitors
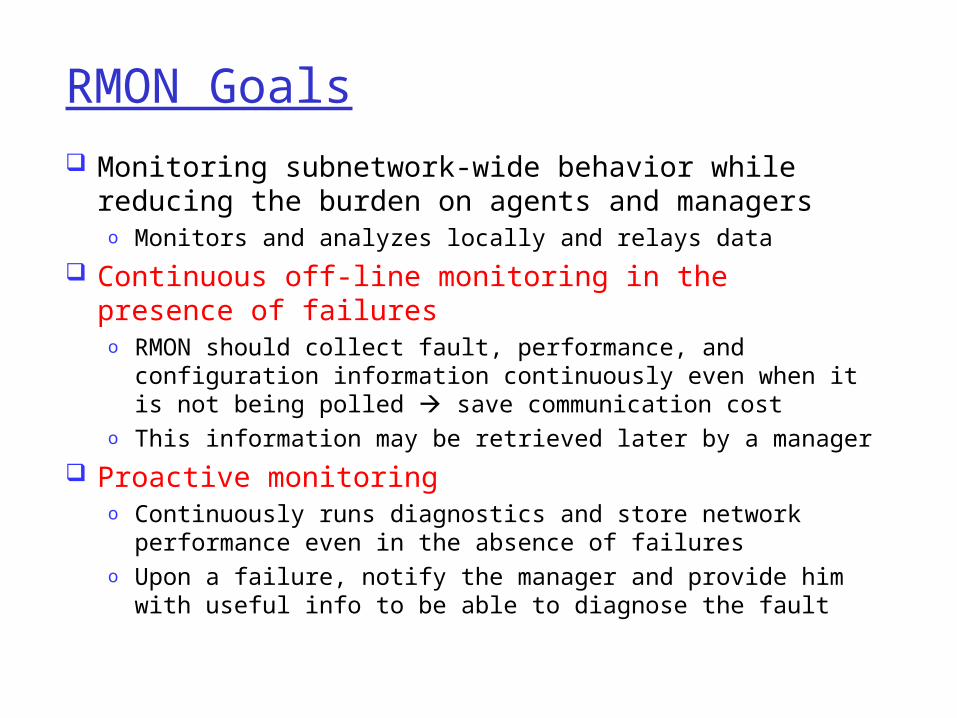
RMON Goals Monitoring subnetwork-wide behavior while
reducing the burden on agents and managerso Monitors and analyzes locally and relays data
Continuous off-line monitoring in the presence of failureso RMON should collect fault, performance, and configuration
information continuously even when it is not being polled save communication cost
o This information may be retrieved later by a manager
Proactive monitoring o Continuously runs diagnostics and store network
performance even in the absence of failureso Upon a failure, notify the manager and provide him with
useful info to be able to diagnose the fault
RMON Goals
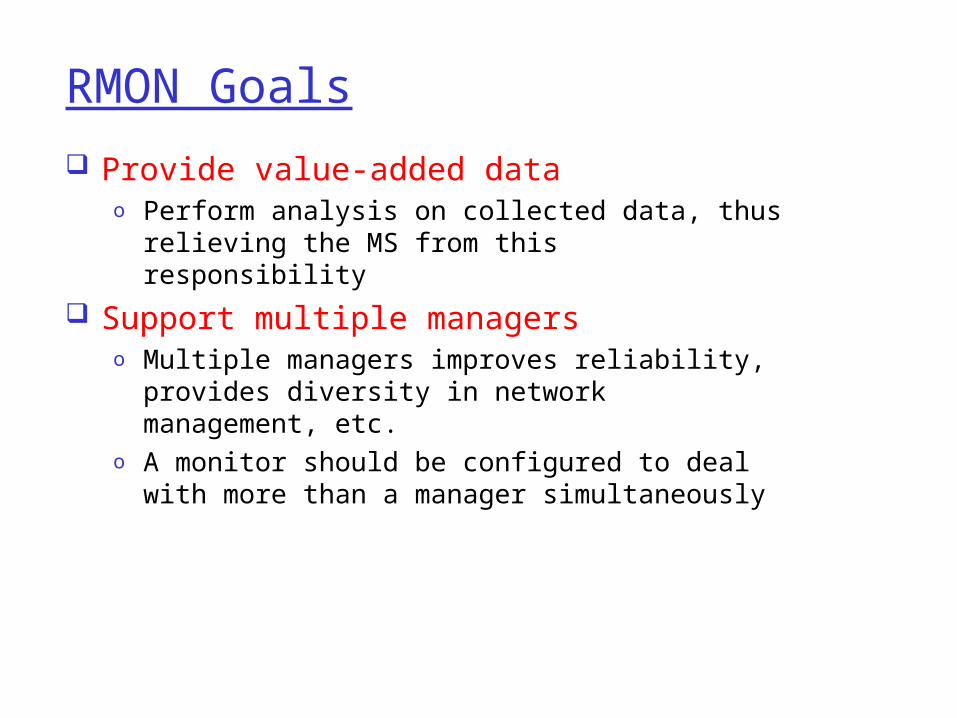
Provide value-added datao Perform analysis on collected data, thus
relieving the MS from this responsibility
Support multiple managerso Multiple managers improves reliability, provides
diversity in network management, etc.o A monitor should be configured to deal with
more than a manager simultaneously
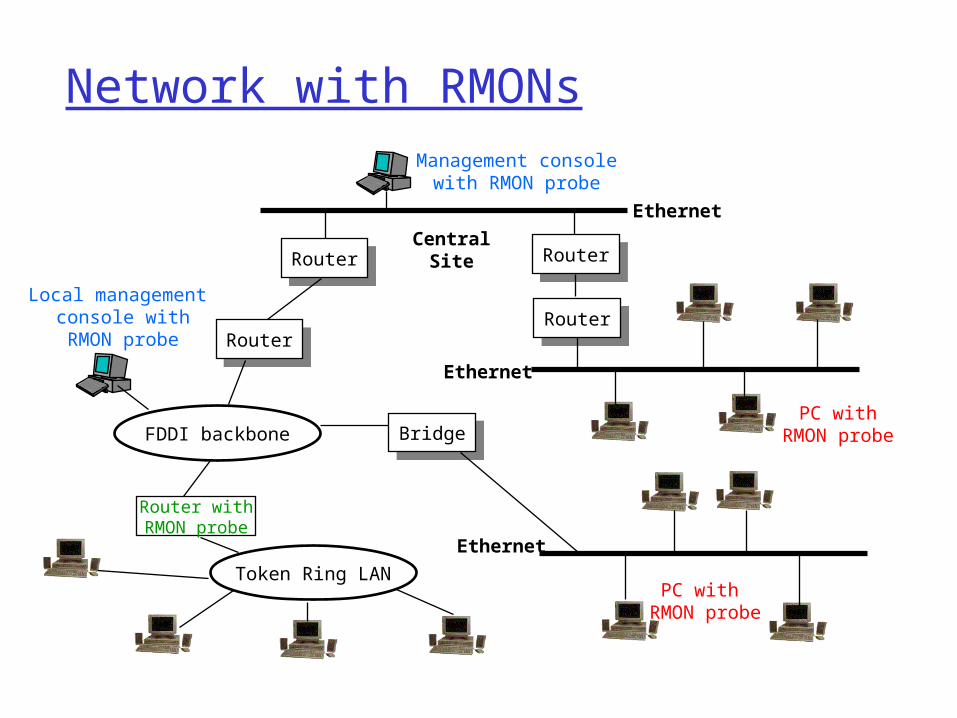
Network with RMONs
BridgeBridge
RouterRouter
RouterRouter
RouterRouter
RouterRouter
FDDI backbone
Token Ring LAN
Router withRMON probe
Management consolewith RMON probe
Central Site
Local management console withRMON probe
PC with RMON probe
PC withRMON probe
Ethernet
Ethernet
Ethernet
Control of RMON- Configuration
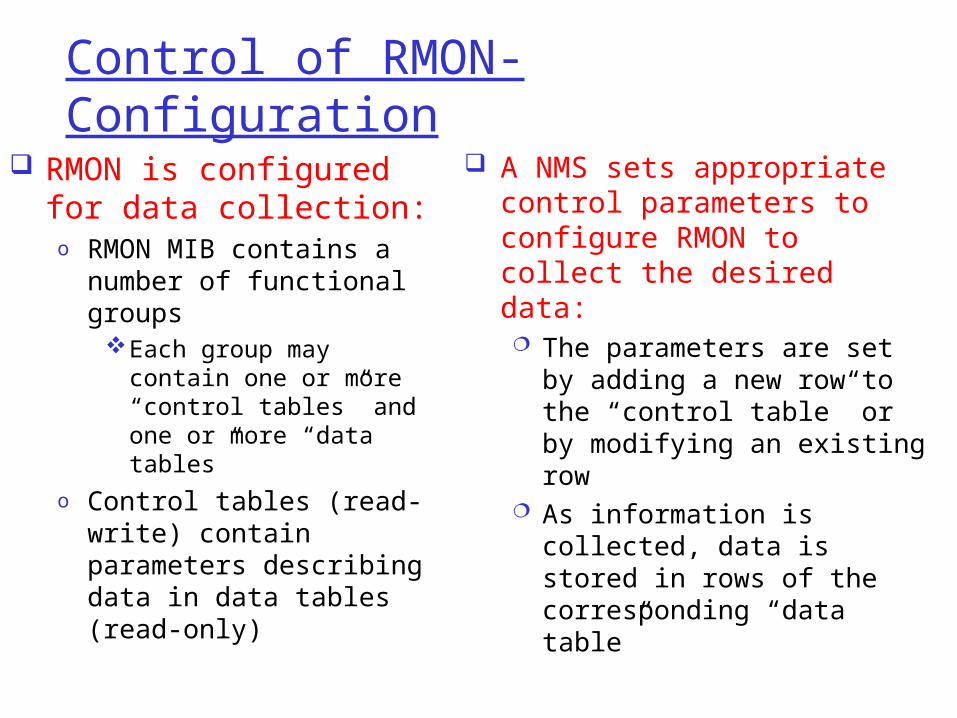
RMON is configured for data collection:o RMON MIB contains a
number of functional groups
Each group may contain one or more “control tables” and one or more “data tables”
o Control tables (read-write) contain parameters describing data in data tables (read-only)
A NMS sets appropriate control parameters to configure RMON to collect the desired data: The parameters are set by
adding a new row to the “control table” or by modifying an existing row
As information is collected, data is stored in rows of the corresponding “data table”
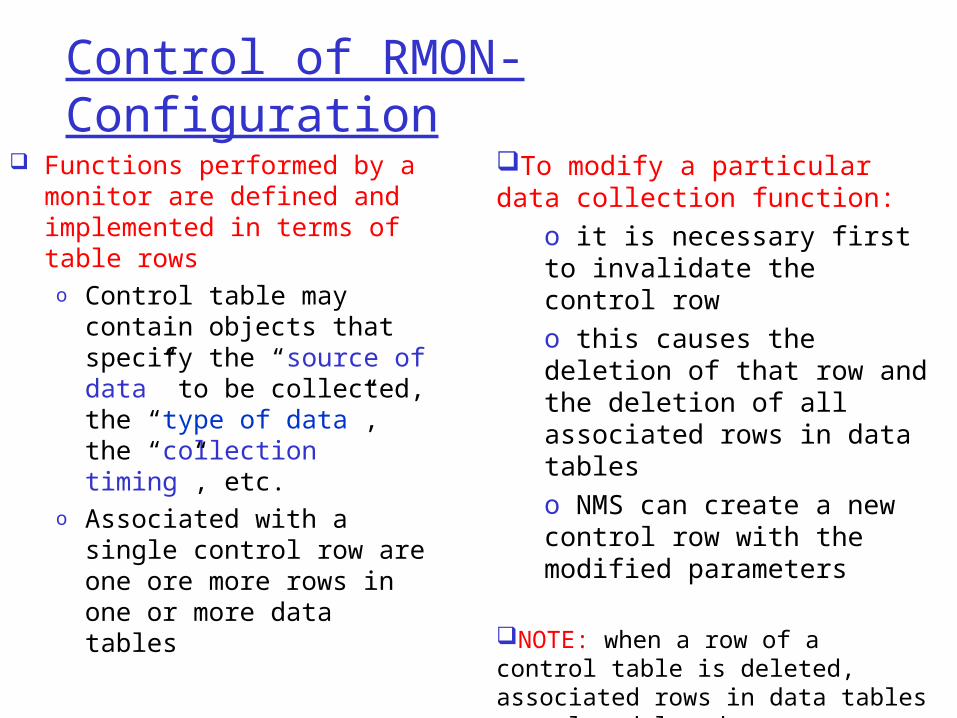
Control of RMON- Configuration Functions performed by a
monitor are defined and implemented in terms of table rowso Control table may
contain objects that specify the “source of data” to be collected, the “type of data”, the “collection timing”, etc.
o Associated with a single control row are one ore more rows in one or more data tables
To modify a particular data collection function:
o it is necessary first to invalidate the control rowo this causes the deletion of that row and the deletion of all associated rows in data tableso NMS can create a new control row with the modified parameters
NOTE: when a row of a control table is deleted, associated rows in data tables are also deleted.
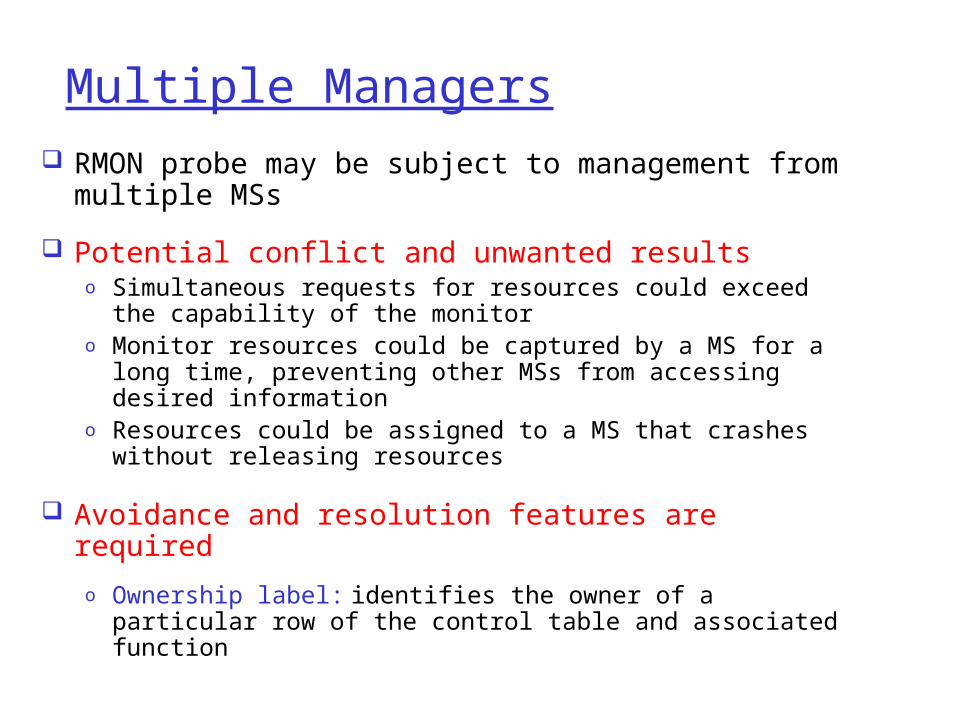
Multiple Managers RMON probe may be subject to management
from multiple MSs
Potential conflict and unwanted resultso Simultaneous requests for resources could exceed the
capability of the monitoro Monitor resources could be captured by a MS for a
long time, preventing other MSs from accessing desired information
o Resources could be assigned to a MS that crashes without releasing resources
Avoidance and resolution features are required
o Ownership label: identifies the owner of a particular row of the control table and associated function
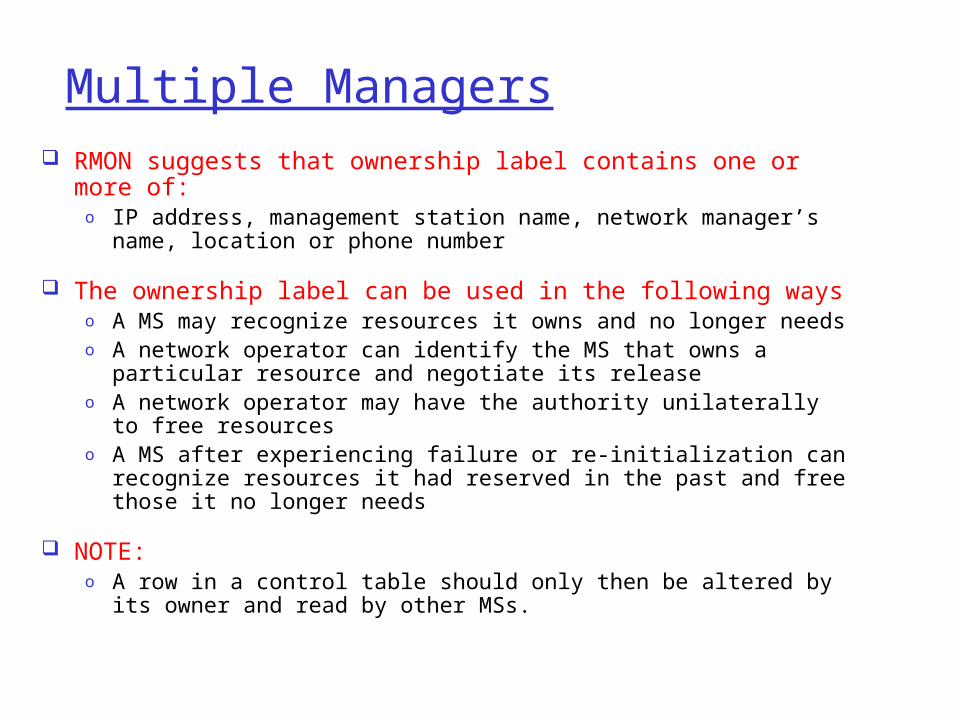
Multiple Managers RMON suggests that ownership label contains one or
more of:o IP address, management station name, network manager’s
name, location or phone number
The ownership label can be used in the following wayso A MS may recognize resources it owns and no longer needso A network operator can identify the MS that owns a
particular resource and negotiate its releaseo A network operator may have the authority unilaterally to
free resourceso A MS after experiencing failure or re-initialization can
recognize resources it had reserved in the past and free those it no longer needs
NOTE: o A row in a control table should only then be altered by its
owner and read by other MSs.
Multiple Managers
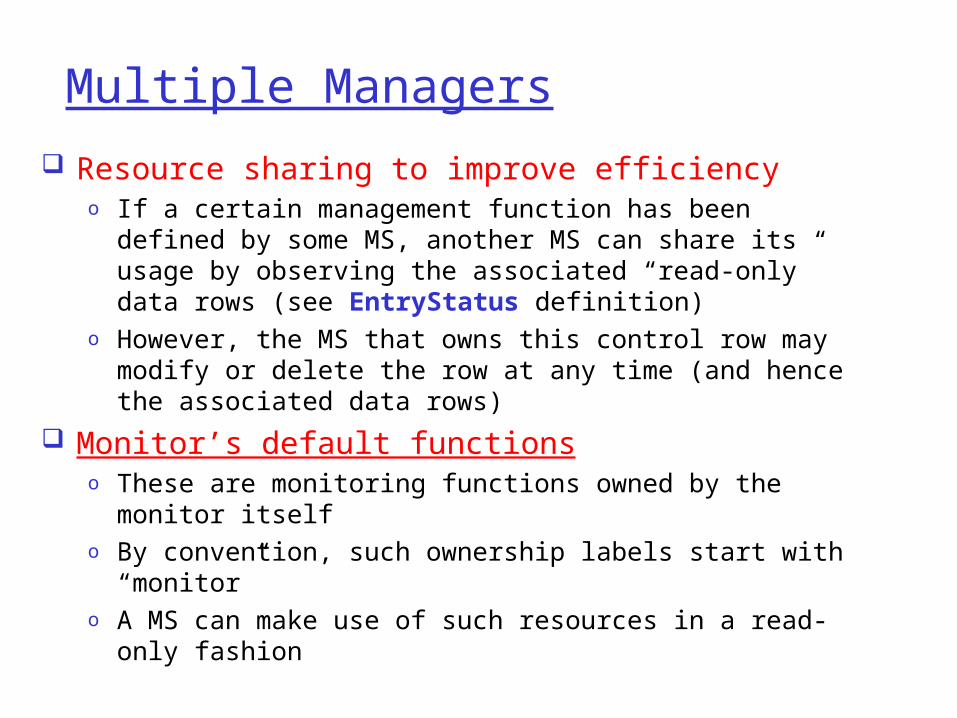
Resource sharing to improve efficiencyo If a certain management function has been defined by
some MS, another MS can share its usage by observing the associated “read-only” data rows (see EntryStatus definition)
o However, the MS that owns this control row may modify or delete the row at any time (and hence the associated data rows)
Monitor’s default functionso These are monitoring functions owned by the monitor
itselfo By convention, such ownership labels start with
“monitor”o A MS can make use of such resources in a read-only
fashion
Indicates the status of the row
Indicates the owner of a row in control table
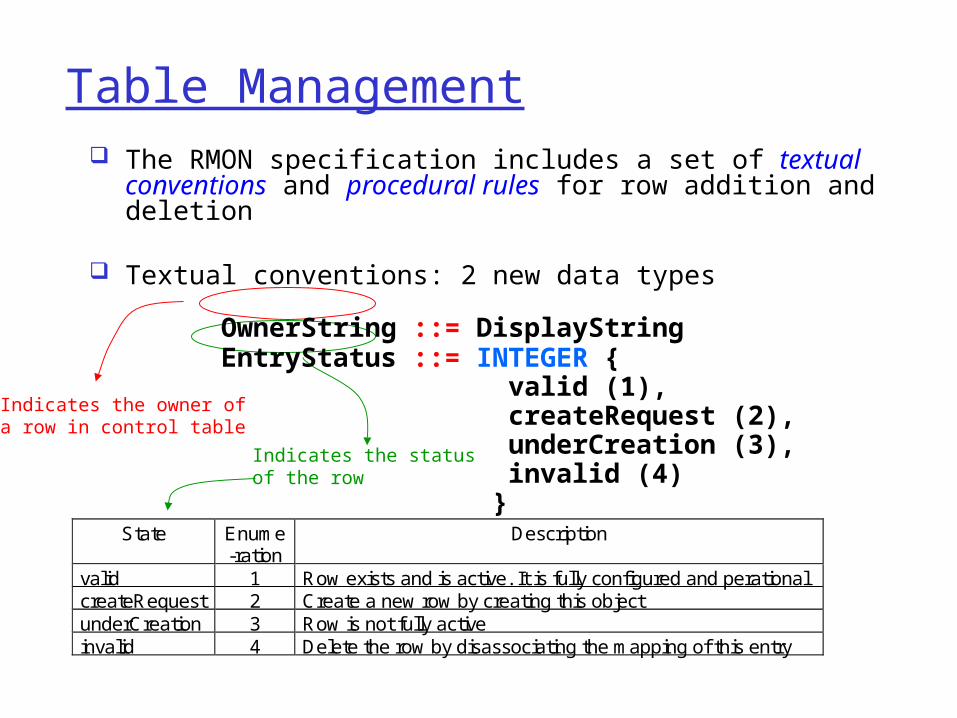
Table Management The RMON specification includes a set of textual
conventions and procedural rules for row addition and deletion
Textual conventions: 2 new data types
OwnerString ::= DisplayStringEntryStatus ::= INTEGER {
valid (1),createRequest (2),underCreation (3),invalid (4)
}State Enume
-ration Description
valid 1 Row exists and is active. It is fully configured and perational createRequest 2 Create a new row by creating this object underCreation 3 Row is not fully active invalid 4 Delete the row by disassociating the mapping of this entry
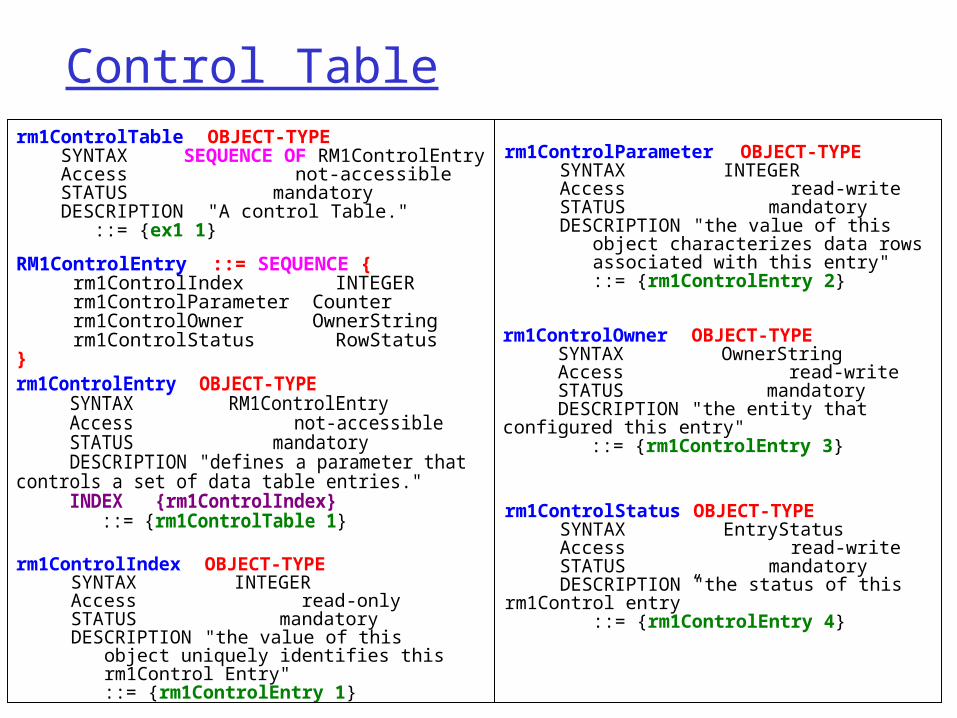
Control Tablerm1ControlTable OBJECT-TYPE SYNTAX SEQUENCE OF RM1ControlEntry Access not-accessible STATUS mandatory DESCRIPTION "A control Table." ::= {ex1 1}
rm1ControlEntry OBJECT-TYPE SYNTAX RM1ControlEntry Access not-accessible STATUS mandatory DESCRIPTION "defines a parameter that controls a set of data table entries." INDEX {rm1ControlIndex} ::= {rm1ControlTable 1}
rm1ControlIndex OBJECT-TYPE SYNTAX INTEGER Access read-only STATUS mandatory DESCRIPTION "the value of this object uniquely identifies this rm1Control Entry" ::= {rm1ControlEntry 1}
RM1ControlEntry ::= SEQUENCE { rm1ControlIndex INTEGER rm1ControlParameter Counter rm1ControlOwner OwnerString rm1ControlStatus RowStatus }
rm1ControlParameter OBJECT-TYPE SYNTAX INTEGER Access read-write STATUS mandatory DESCRIPTION "the value of this object characterizes data rows associated with this entry" ::= {rm1ControlEntry 2}
rm1ControlOwner OBJECT-TYPE SYNTAX OwnerString Access read-write STATUS mandatory DESCRIPTION "the entity that configured this entry" ::= {rm1ControlEntry 3}
rm1ControlStatus OBJECT-TYPE SYNTAX EntryStatus Access read-write STATUS mandatory DESCRIPTION "the status of this rm1Control entry” ::= {rm1ControlEntry 4}
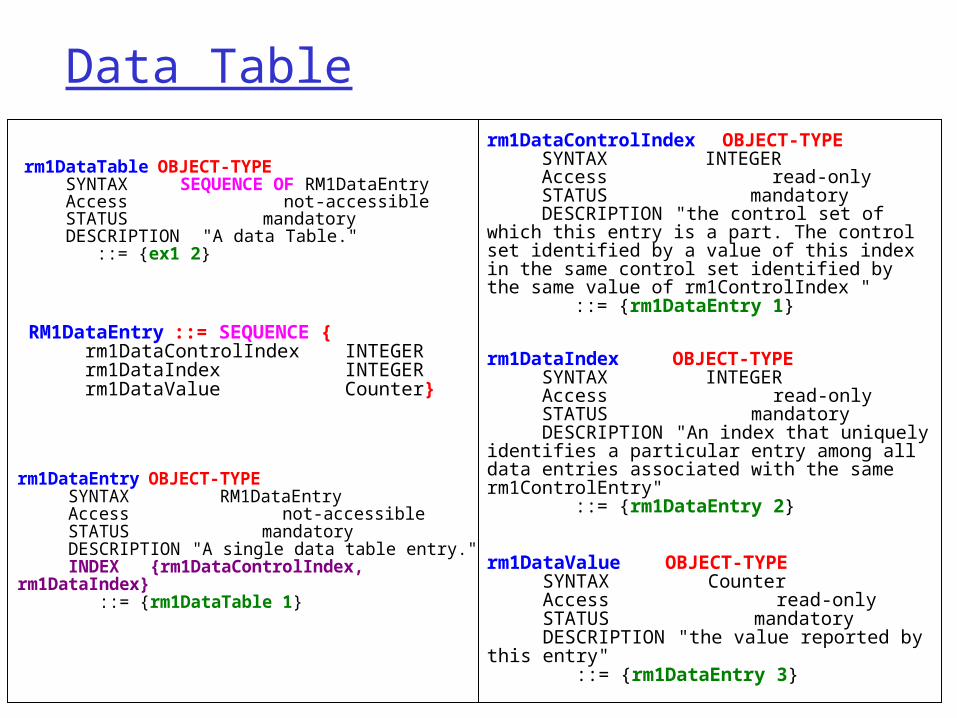
Data Table
rm1DataTable OBJECT-TYPE SYNTAX SEQUENCE OF RM1DataEntry Access not-accessible STATUS mandatory DESCRIPTION "A data Table." ::= {ex1 2}
rm1DataEntry OBJECT-TYPE SYNTAX RM1DataEntry Access not-accessible STATUS mandatory DESCRIPTION "A single data table entry." INDEX {rm1DataControlIndex, rm1DataIndex} ::= {rm1DataTable 1}
RM1DataEntry ::= SEQUENCE { rm1DataControlIndex INTEGER rm1DataIndex INTEGER rm1DataValue Counter}
rm1DataControlIndex OBJECT-TYPE SYNTAX INTEGER Access read-only STATUS mandatory DESCRIPTION "the control set of which this entry is a part. The control set identified by a value of this index in the same control set identified by the same value of rm1ControlIndex " ::= {rm1DataEntry 1}
rm1DataIndex OBJECT-TYPE SYNTAX INTEGER Access read-only STATUS mandatory DESCRIPTION "An index that uniquely identifies a particular entry among all data entries associated with the same rm1ControlEntry" ::= {rm1DataEntry 2}
rm1DataValue OBJECT-TYPE SYNTAX Counter Access read-only STATUS mandatory DESCRIPTION "the value reported by this entry" ::= {rm1DataEntry 3}
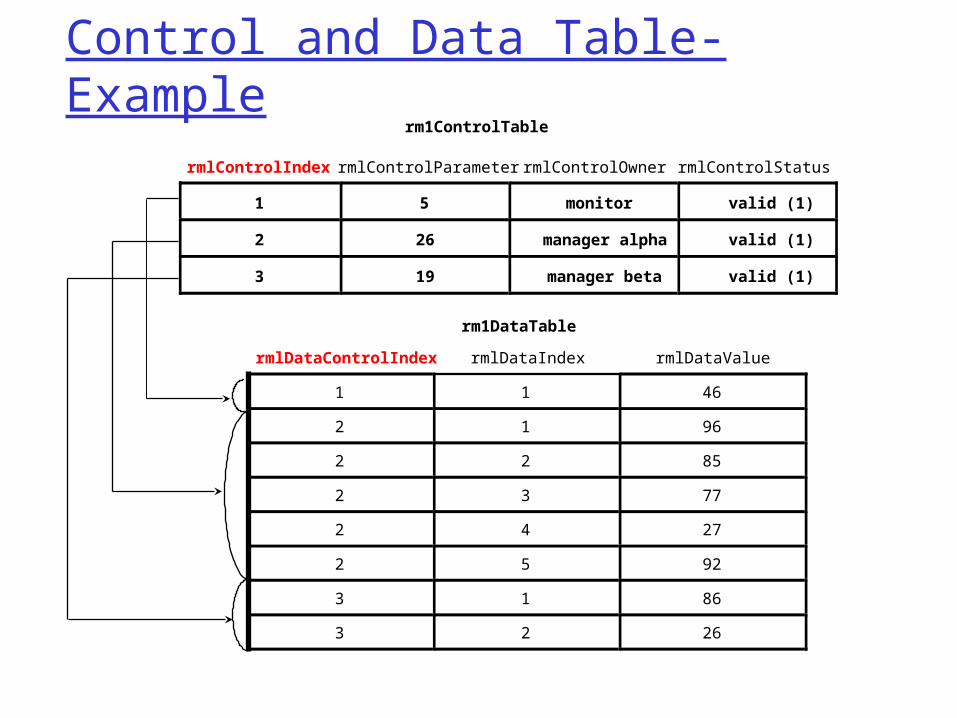
Control and Data Table- Examplerm1ControlTable
1 5 monitor valid (1)
2 26 manager alpha valid (1)
3 19 manager beta valid (1)
1 46
1 96
2 85
3 77
4 27
5 92
1 86
2 26
rmlControlIndex rmlControlParameter rmlControlOwner rmlControlStatus
rm1DataTable
rmlDataControlIndex rmlDataIndex rmlDataValue
1
2
2
2
2
2
3
3
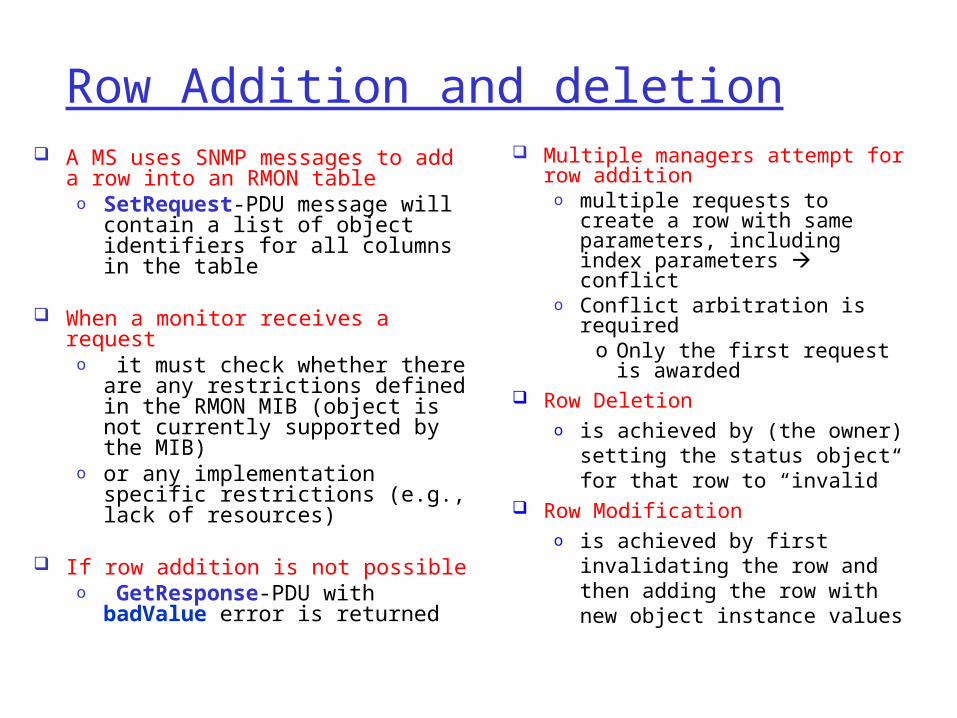
Row Addition and deletion A MS uses SNMP messages to add
a row into an RMON tableo SetRequest-PDU message will
contain a list of object identifiers for all columns in the table
When a monitor receives a request
o it must check whether there are any restrictions defined in the RMON MIB (object is not currently supported by the MIB)
o or any implementation specific restrictions (e.g., lack of resources)
If row addition is not possibleo GetResponse-PDU with
badValue error is returned
Multiple managers attempt for row addition
o multiple requests to create a row with same parameters, including index parameters conflict
o Conflict arbitration is required
o Only the first request is awarded
Row Deletiono is achieved by (the owner)
setting the status object for that row to “invalid”
Row Modificationo is achieved by first
invalidating the row and then adding the row with new object instance values
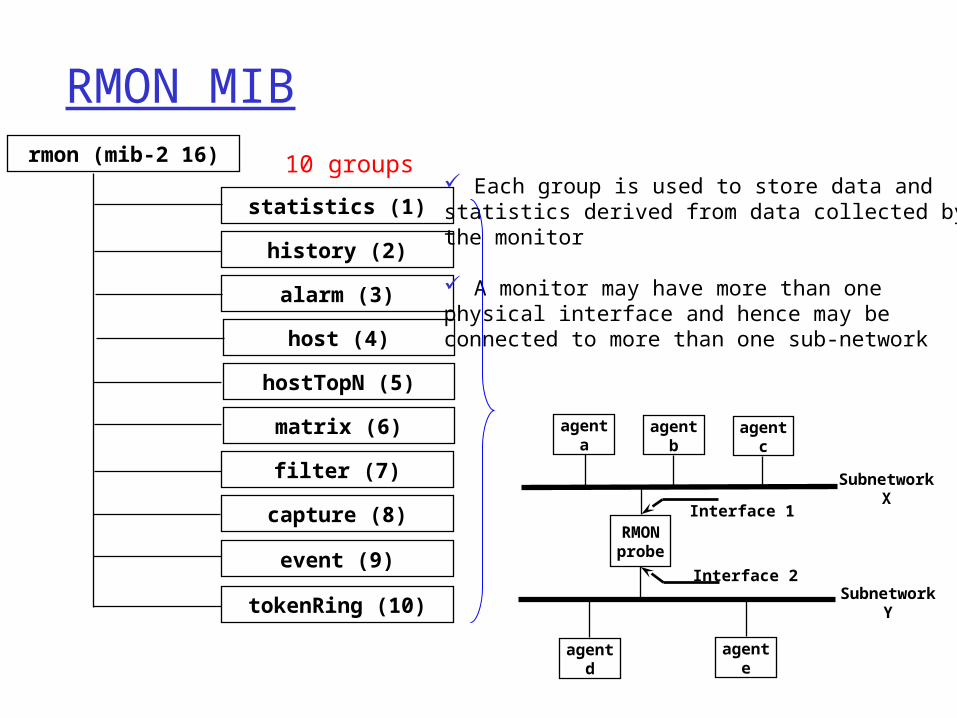
RMON MIBrmon (mib-2 16)
statistics (1)
history (2)
alarm (3)
host (4)
hostTopN (5)
matrix (6)
filter (7)
capture (8)
event (9)
tokenRing (10)
Each group is used to store data and statistics derived from data collected by the monitor
A monitor may have more than one physical interface and hence may be connected to more than one sub-network
10 groups
agenta
agentb
RMONprobe
agentc
agente
agentd
Interface 1
Interface 2
SubnetworkX
SubnetworkY
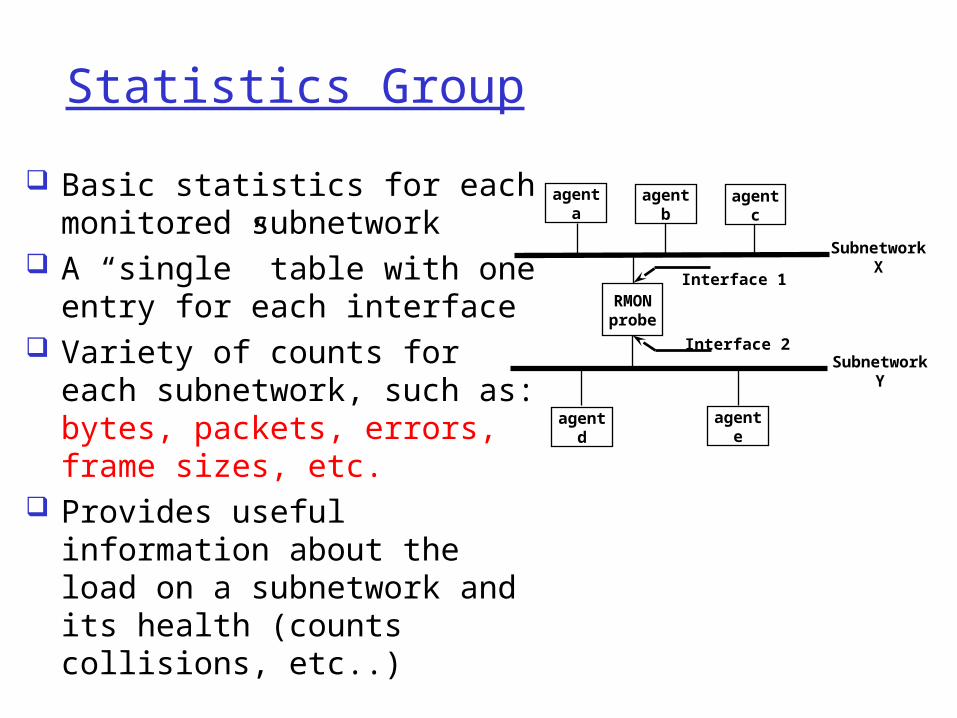
Statistics Group
Basic statistics for each monitored subnetwork
A “single” table with one entry for each interface
Variety of counts for each subnetwork, such as: bytes, packets, errors, frame sizes, etc.
Provides useful information about the load on a subnetwork and its health (counts collisions, etc..)
agenta
agentb
RMONprobe
agentc
agente
agentd
Interface 1
Interface 2
SubnetworkX
SubnetworkY
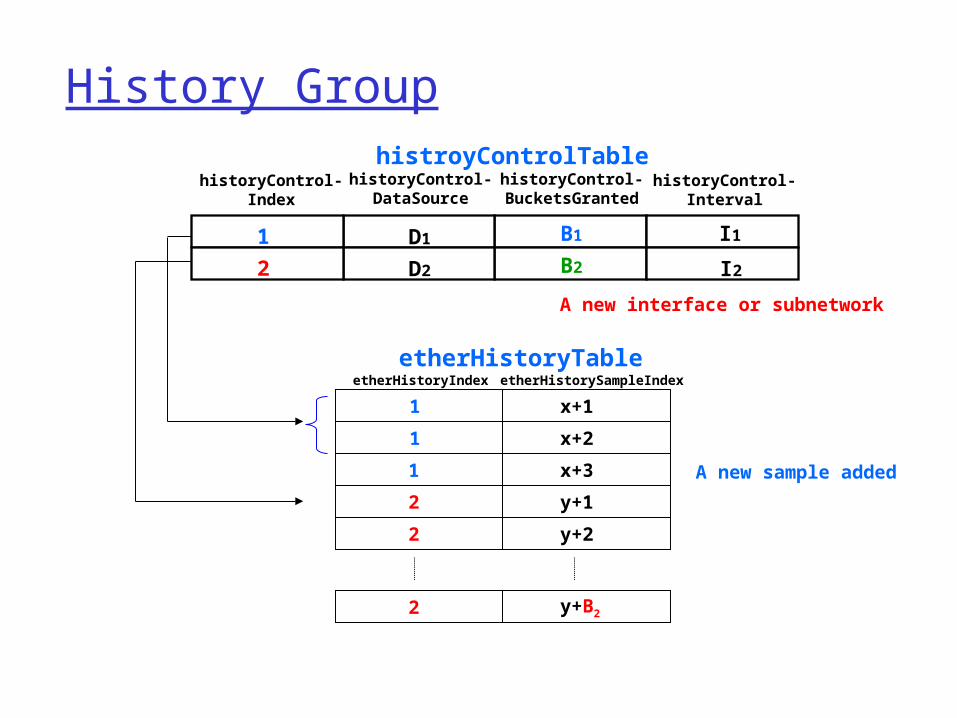
History Group
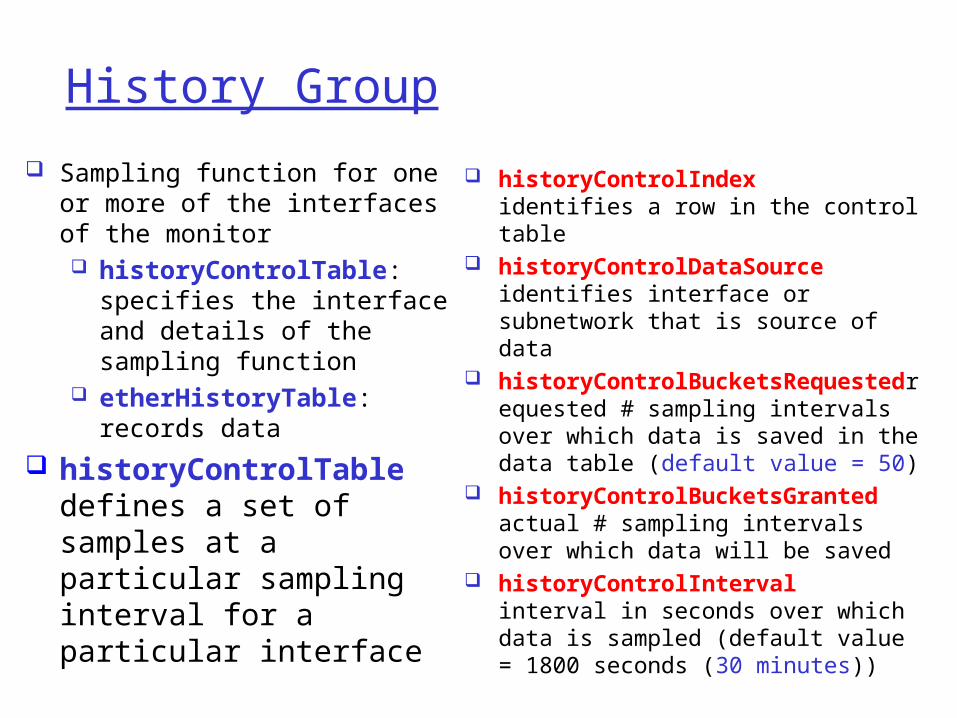
Sampling function for one or more of the interfaces of the monitor historyControlTable:
specifies the interface and details of the sampling function
etherHistoryTable: records data
historyControlTable defines a set of samples at a particular sampling interval for a particular interface
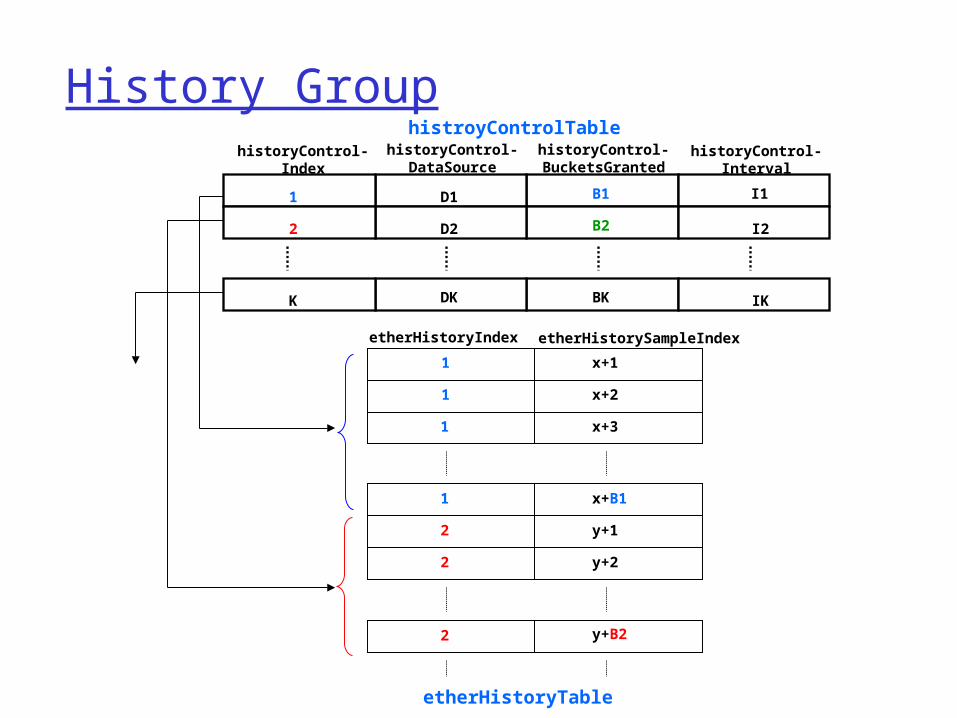
historyControlIndex identifies a row in the control table
historyControlDataSource identifies interface or subnetwork that is source of data
historyControlBucketsRequestedrequested # sampling intervals over which data is saved in the data table (default value = 50)
historyControlBucketsGranted actual # sampling intervals over which data will be saved
historyControlInterval interval in seconds over which data is sampled (default value = 1800 seconds (30 minutes))
History GrouphistoryControl-
IndexhistoryControl-
DataSourcehistoryControl-BucketsGranted
historyControl-Interval
1
2
K
D1
D2
DK BK
B2
B1 I1
I2
IK
histroyControlTable
1
1
1
1
2
2
2
x+1
x+2
x+3
x+B1
y+1
y+2
y+B2
etherHistoryTable
etherHistoryIndex etherHistorySampleIndex
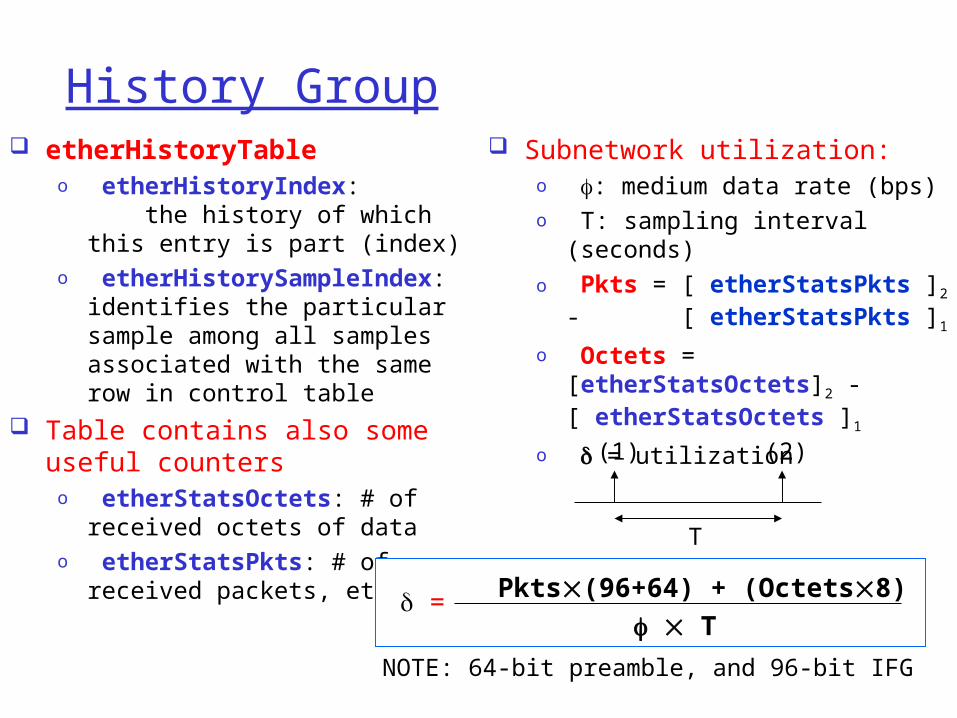
History Group etherHistoryTable
o etherHistoryIndex: the history of which this entry is part (index)
o etherHistorySampleIndex: identifies the particular sample among all samples associated with the same row in control table
Table contains also some useful counterso etherStatsOctets: # of
received octets of datao etherStatsPkts: # of
received packets, etc…
Subnetwork utilization:o : medium data rate (bps)o T: sampling interval (seconds)o Pkts = [ etherStatsPkts ]2 -
[ etherStatsPkts ]1
o Octets = [etherStatsOctets]2 - [ etherStatsOctets ]1
o = utilization
T
(1) (2)
Pkts(96+64) + (Octets8) = T
NOTE: 64-bit preamble, and 96-bit IFG
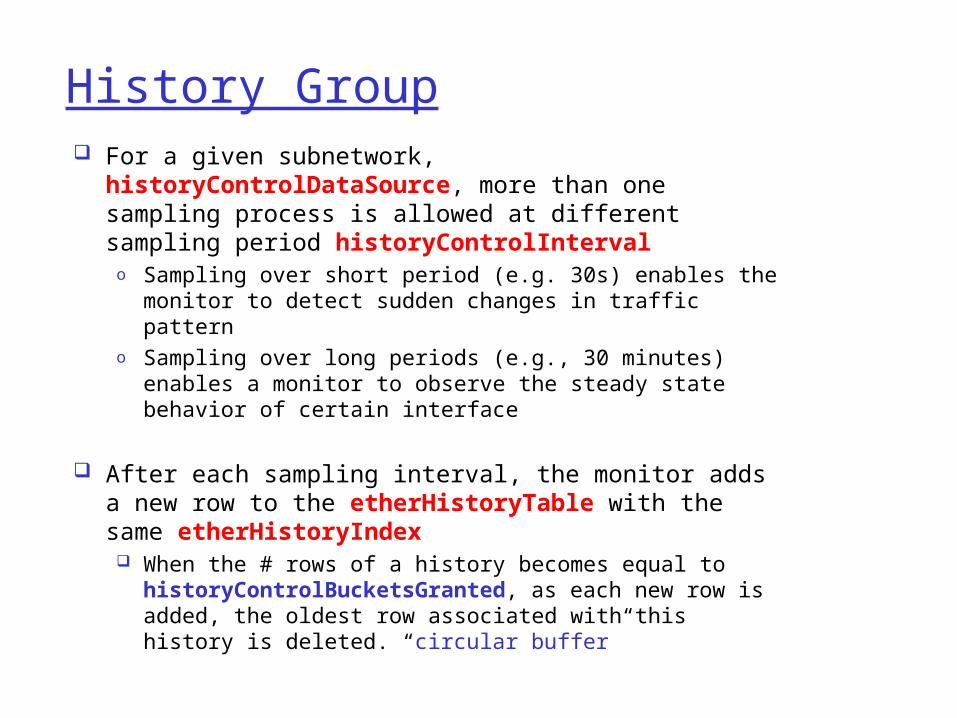
History Group For a given subnetwork,
historyControlDataSource, more than one sampling process is allowed at different sampling period historyControlInterval
o Sampling over short period (e.g. 30s) enables the monitor to detect sudden changes in traffic pattern
o Sampling over long periods (e.g., 30 minutes) enables a monitor to observe the steady state behavior of certain interface
After each sampling interval, the monitor adds a new row to the etherHistoryTable with the same etherHistoryIndex When the # rows of a history becomes equal to
historyControlBucketsGranted, as each new row is added, the oldest row associated with this history is deleted. “circular buffer”
History Group
historyControl-Index
historyControl-DataSource
historyControl-BucketsGranted
historyControl-Interval
1 D1 B1 I1
histroyControlTable
1
1
x+1
x+2
2 y+1
etherHistoryTableetherHistorySampleIndexetherHistoryIndex
1 x+3 A new sample added
2 D2 B2 I2
A new interface or subnetwork
2
2
y+2
y+B2
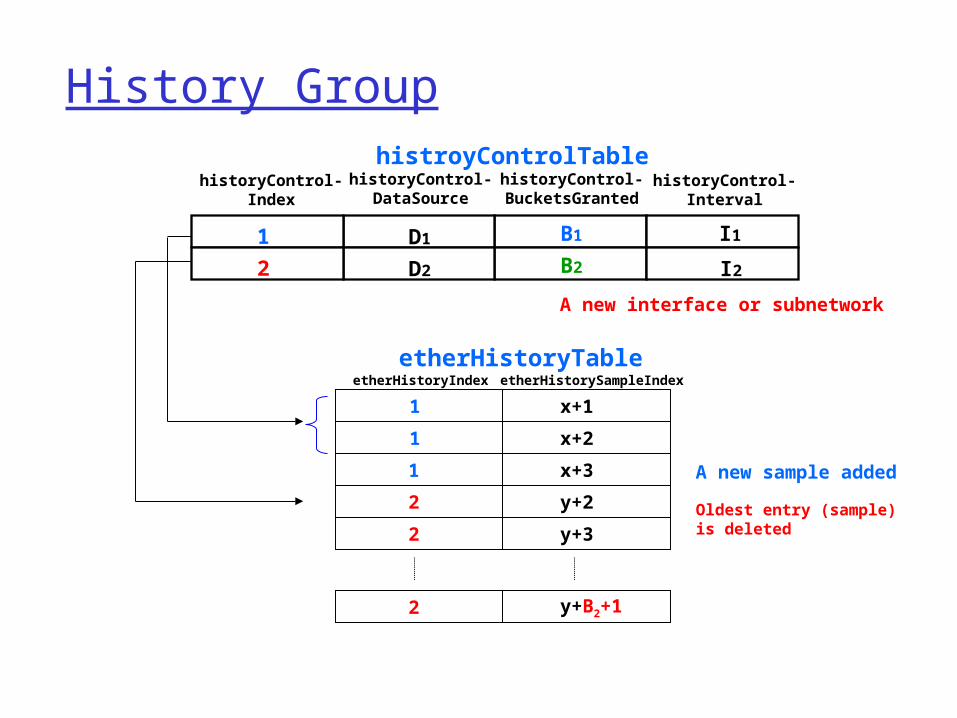
History Group
historyControl-Index
historyControl-DataSource
historyControl-BucketsGranted
historyControl-Interval
1 D1 B1 I1
histroyControlTable
1
1
x+1
x+2
2 y+2
etherHistoryTableetherHistorySampleIndexetherHistoryIndex
1 x+3 A new sample added
2 D2 B2 I2
A new interface or subnetwork
2
2
y+3
y+B2+1
Oldest entry (sample) is deleted
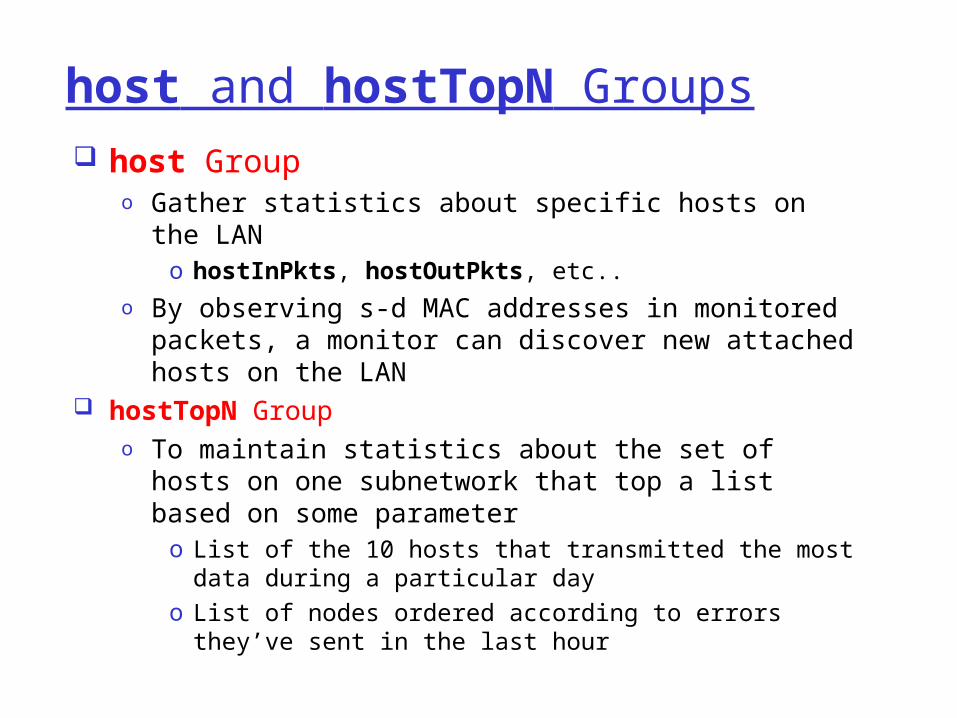
host and hostTopN Groups host Group
o Gather statistics about specific hosts on the LANo hostInPkts, hostOutPkts, etc..
o By observing s-d MAC addresses in monitored packets, a monitor can discover new attached hosts on the LAN
hostTopN Groupo To maintain statistics about the set of hosts on one
subnetwork that top a list based on some parametero List of the 10 hosts that transmitted the most data
during a particular dayo List of nodes ordered according to errors they’ve sent
in the last hour
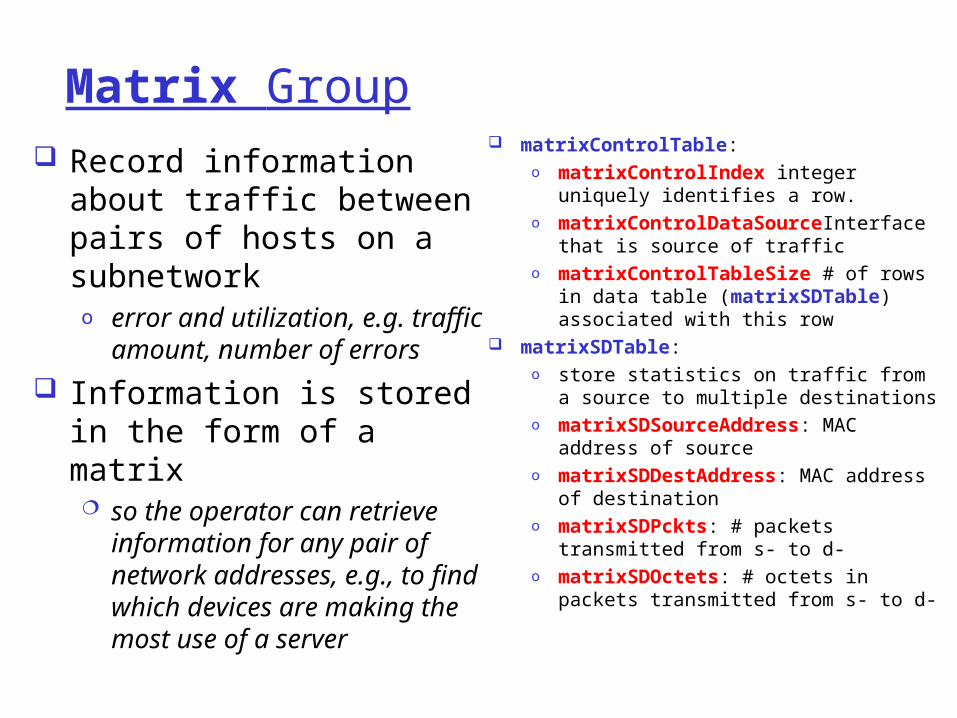
Matrix Group Record information about
traffic between pairs of hosts on a subnetwork
o error and utilization, e.g. traffic amount, number of errors
Information is stored in the form of a matrix so the operator can
retrieve information for any pair of network addresses, e.g., to find which devices are making the most use of a server
matrixControlTable:o matrixControlIndex integer
uniquely identifies a row.o matrixControlDataSourceInterface
that is source of traffico matrixControlTableSize # of rows
in data table (matrixSDTable) associated with this row
matrixSDTable: o store statistics on traffic from a
source to multiple destinationso matrixSDSourceAddress: MAC
address of sourceo matrixSDDestAddress: MAC
address of destinationo matrixSDPckts: # packets
transmitted from s- to d-o matrixSDOctets: # octets in
packets transmitted from s- to d-
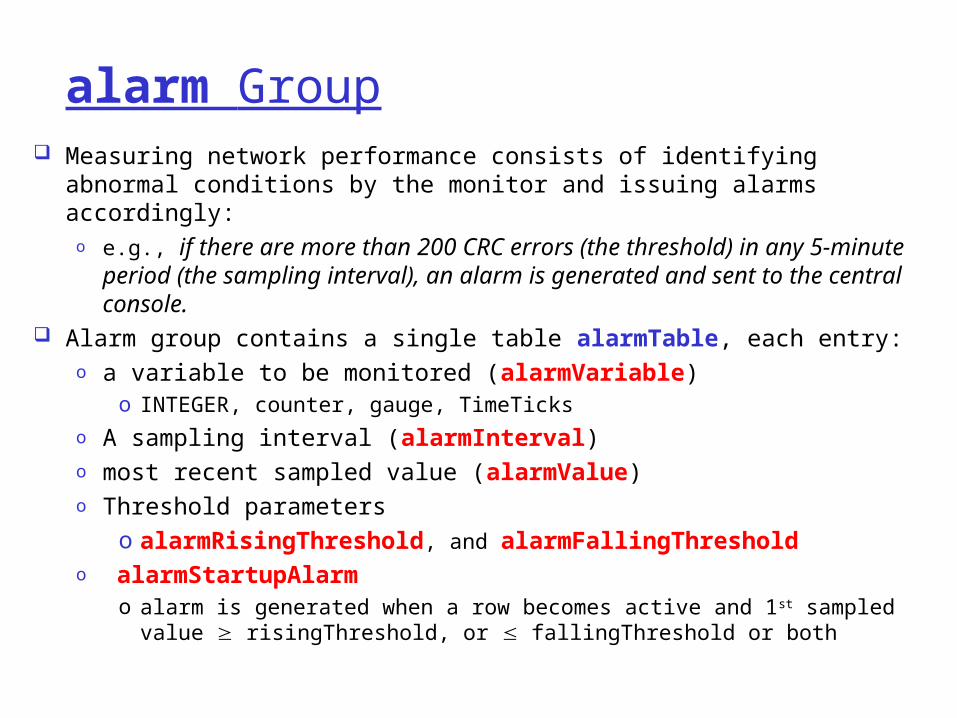
alarm Group Measuring network performance consists of identifying
abnormal conditions by the monitor and issuing alarms accordingly:
o e.g., if there are more than 200 CRC errors (the threshold) in any 5-minute period (the sampling interval), an alarm is generated and sent to the central console.
Alarm group contains a single table alarmTable, each entry:o a variable to be monitored (alarmVariable)
o INTEGER, counter, gauge, TimeTickso A sampling interval (alarmInterval)o most recent sampled value (alarmValue)o Threshold parameters
o alarmRisingThreshold, and alarmFallingThresholdo alarmStartupAlarm
o alarm is generated when a row becomes active and 1st sampled value risingThreshold, or fallingThreshold or both
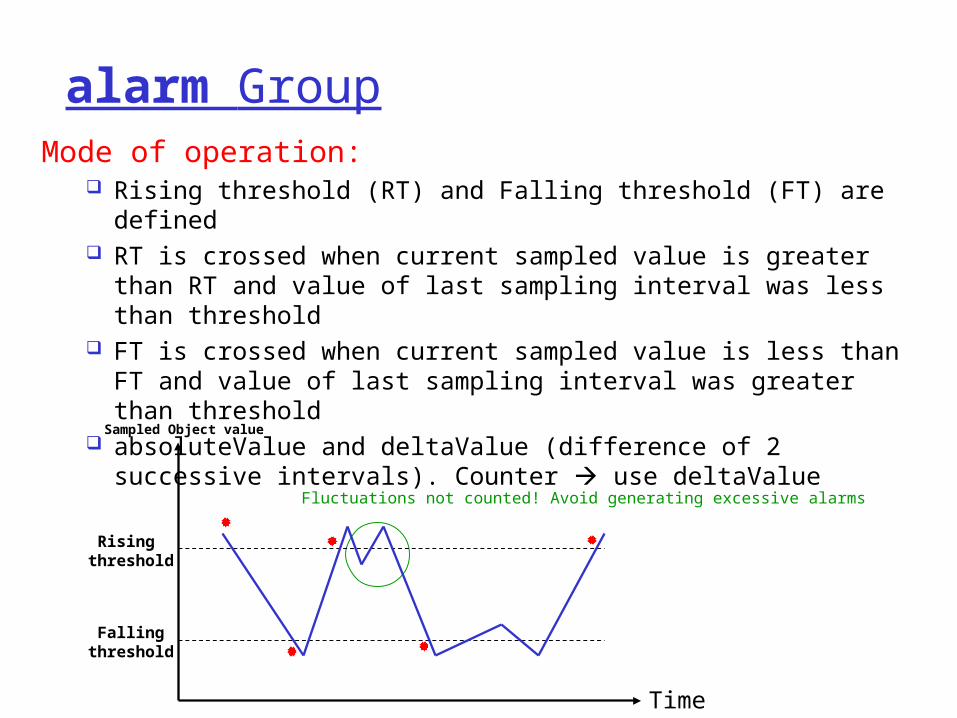
alarm GroupMode of operation:
Rising threshold (RT) and Falling threshold (FT) are defined RT is crossed when current sampled value is greater than
RT and value of last sampling interval was less than threshold
FT is crossed when current sampled value is less than FT and value of last sampling interval was greater than threshold
absoluteValue and deltaValue (difference of 2 successive intervals). Counter use deltaValue
Fluctuations not counted! Avoid generating excessive alarms
Time
Sampled Object value
Rising threshold
Fallingthreshold
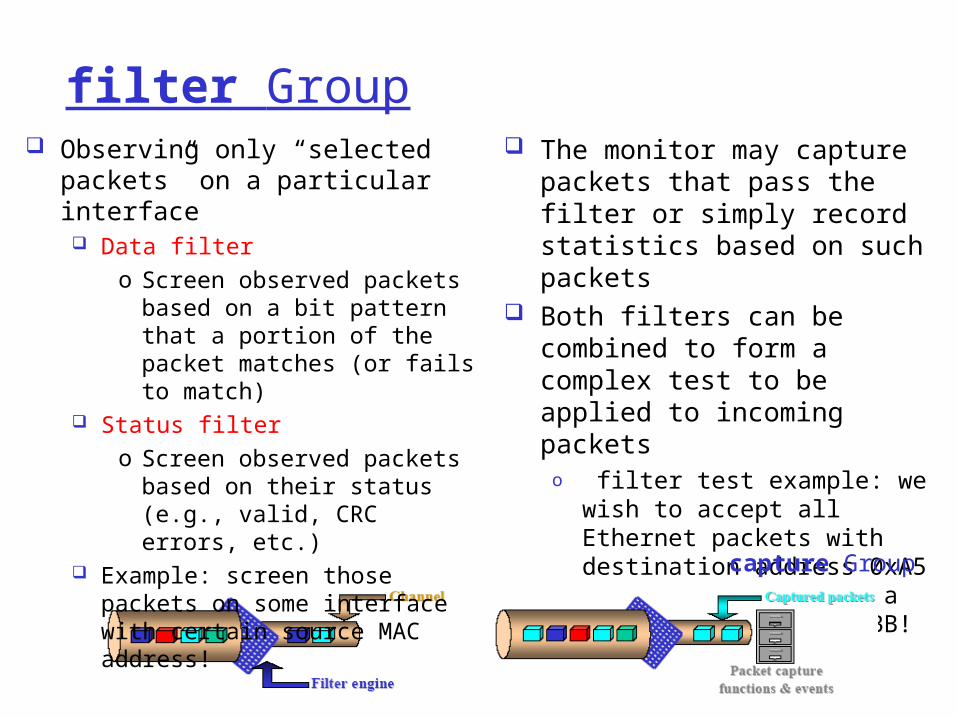
filter Group Observing only “selected
packets” on a particular interface Data filter
o Screen observed packets based on a bit pattern that a portion of the packet matches (or fails to match)
Status filtero Screen observed packets
based on their status (e.g., valid, CRC errors, etc.)
Example: screen those packets on some interface with certain source MAC address!
The monitor may capture packets that pass the filter or simply record statistics based on such packets
Both filters can be combined to form a complex test to be applied to incoming packets
o filter test example: we wish to accept all Ethernet packets with destination address 0xA5 and that do not have a source address of 0xBB!
capture Group
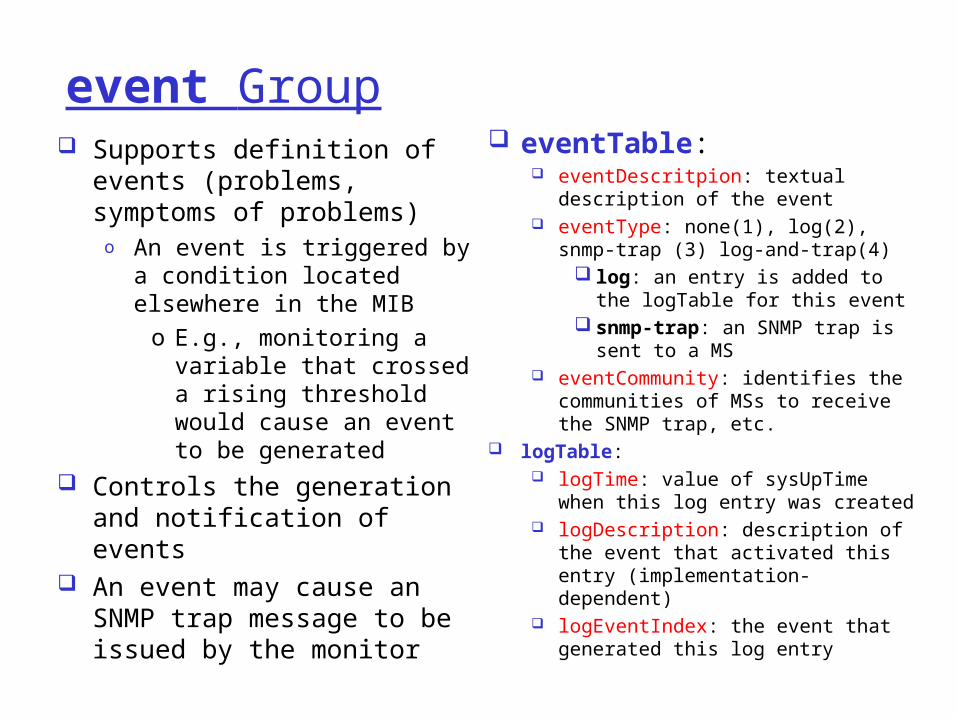
event Group Supports definition of
events (problems, symptoms of problems)
o An event is triggered by a condition located elsewhere in the MIB
o E.g., monitoring a variable that crossed a rising threshold would cause an event to be generated
Controls the generation and notification of events
An event may cause an SNMP trap message to be issued by the monitor
eventTable: eventDescritpion: textual
description of the event eventType: none(1), log(2), snmp-
trap (3) log-and-trap(4) log: an entry is added to the
logTable for this event snmp-trap: an SNMP trap is
sent to a MS eventCommunity: identifies the
communities of MSs to receive the SNMP trap, etc.
logTable: logTime: value of sysUpTime
when this log entry was created logDescription: description of the
event that activated this entry (implementation-dependent)
logEventIndex: the event that generated this log entry
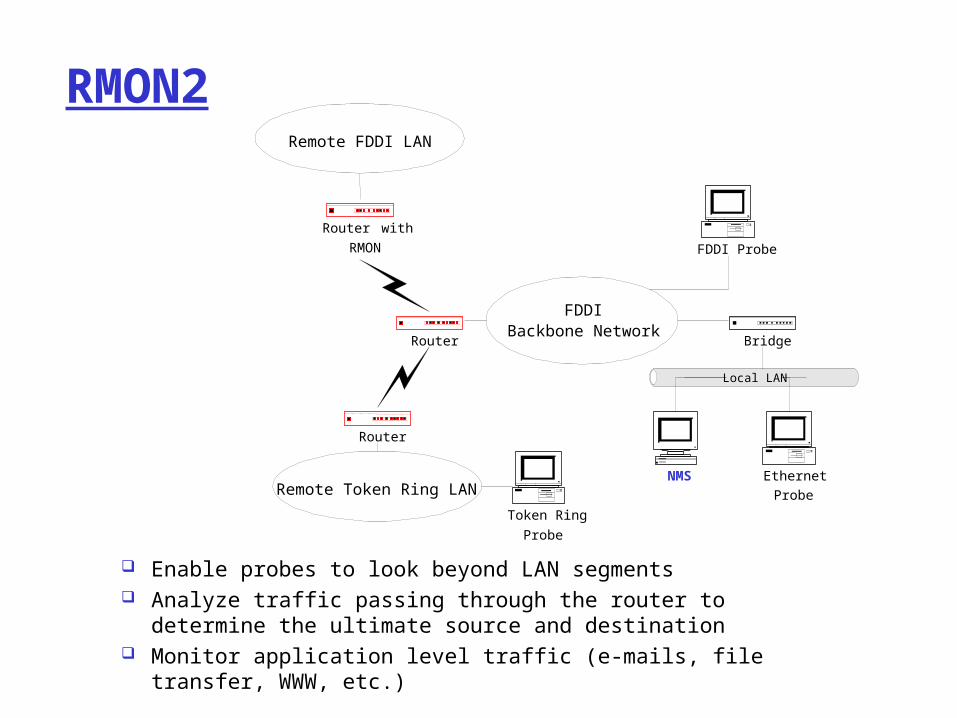
RMON2
FDDIBackbone Network
Remote Token Ring LANNMS
Router Bridge
Token Ring
Probe
Ethernet
Probe
Local LAN
Router with
RMON
Router
Remote FDDI LAN
FDDI Probe
Enable probes to look beyond LAN segments Analyze traffic passing through the router to determine the
ultimate source and destination Monitor application level traffic (e-mails, file transfer,
WWW, etc.)