remote sensing techniques for geological mapping …stonafigsi.com/figsi/images/gadagkar.pdf ·...
TRANSCRIPT

6/4/2016
1
Remote Sensing Techniques for Geological Mapping
with special reference to ornamental stones
N.S.Gadagkar
Director
Remote Sensing and Aerial Surveys
GSI, Bengaluru
Remote sensing concepts-Data products
Elements of Image Interpretation and
Newer technologies in Image analysis and interpretation
I
III
II
VI
Image analysis for geological mapping
Contents of presentation

6/4/2016
2
ELECTRO MAGNETIC SPECTRUM
OPTICAL REMOTE SENSING : LISS PAN,LANDSAT,ASTER
THERMAL REMOTE SENSING : LS-TM-TIR,ASTER
MICROWAVE REMOTE SENSING : SAR, SLAR
GEOLOGICALLY SIGNIFICANT REGIONS OF
THE ELECTROMAGNETIC SPECTRUM
Wavelength
region
Wavelength
(nm) rangeMineralogy
Associated
molecular feature
VNIR 400-1100 Fe and Mn oxides, rare
earths
Crystal field
absorption, charge
transfer absorption
SWIR 1100-2500
Hydroxyls, carbonates,
sulphates, micas,
amphiboles
Al(OH)2, Fe(OH)2,
Mg(OH)2, NH4, SO4
absorption, CO3
TIR 8000-14000 Carbonates, silicates Si-O bond distortion

6/4/2016
3
Satellite Data products used in GSI
IRS-IC RESOURCESAT LISS –III 23.5m Spatial resolution
Freely downloadable from Bhuvan Portal of NRSC
CartoDEM for DEM applications
IRS-IC RESOURCESAT LISS –IV 5.8M Spatial Reoluation
LANDSAT 7 ETM + (8 band data) from USGS/Glovis with
30m Resolution
LANDSAT 8 OLI (11 band data) from USGS/H/Glovis with
30m resolution
ASTER (14 band data) of Japan Space System purchased
through NRSC 15/30M resolution
• Tone
• Colour True Colour and False colour
• Texture
• Pattern . 1Drainage 2.Erosional 3.Vegetation 4.Outcrop
• Shape
• Size
• Association
• Landform & Landuse
ELEMENTS OF PHOTO/ IMAGE INTERPRETATION
6/4/2016
4
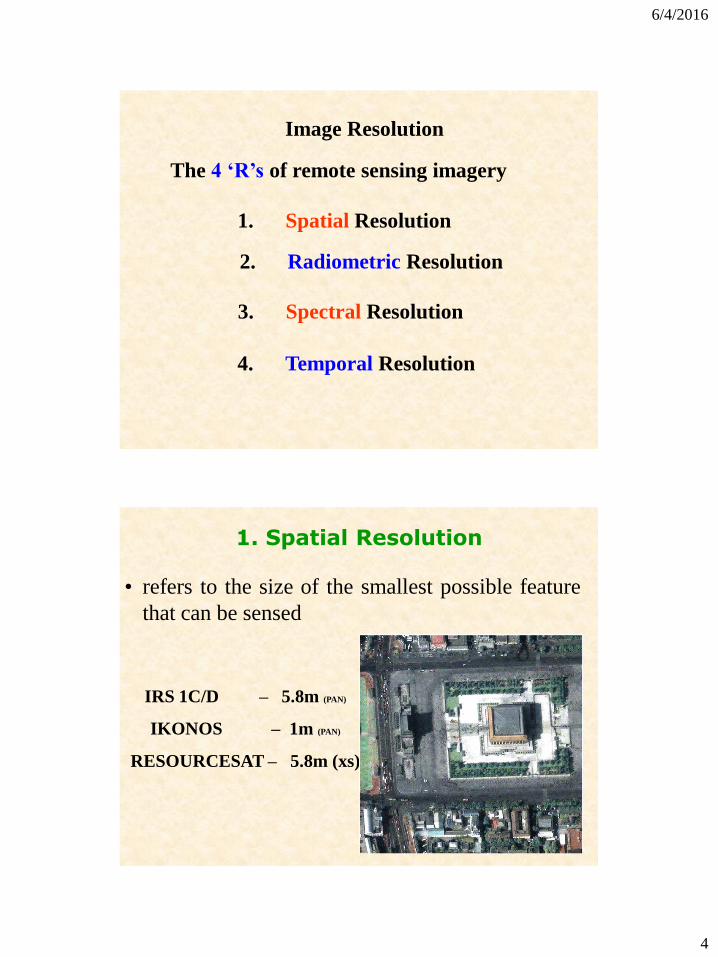
Image Resolution
The 4 ‘R’s of remote sensing imagery
1. Spatial Resolution
2. Radiometric Resolution
3. Spectral Resolution
4. Temporal Resolution
1. Spatial Resolution
• refers to the size of the smallest possible feature
that can be sensed
IRS 1C/D – 5.8m (PAN)
IKONOS – 1m (PAN)
RESOURCESAT – 5.8m (xs)

6/4/2016
5
The finer the radiometric resolution of a sensor, the moresensitive it is to detect small differences in reflected oremitted energy.
2. Radiometric Resolution
0 255 0 127 0 63
The number of brightness levels which the sensor can record
3. Spectral Resolution
6/4/2016
6
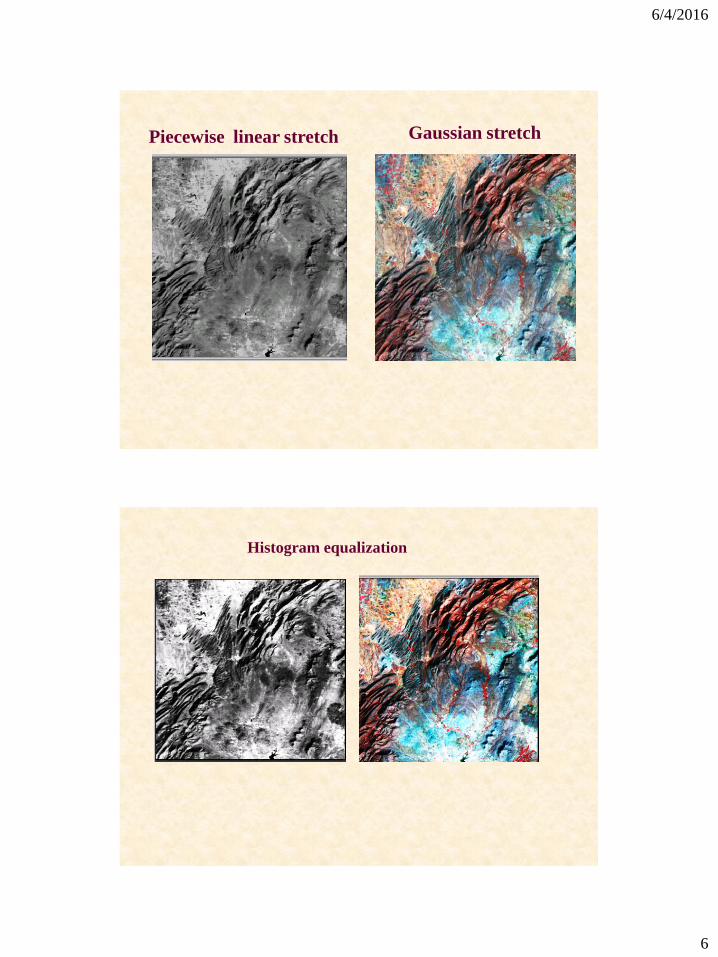
Piecewise linear stretch Gaussian stretch
Histogram equalization

6/4/2016
7
True colour Image of part of Cuddapah basin
Spectrally enhanced image

6/4/2016
8
Decorrelated stretch
Lithological mapping from TM Imagery Part of
Chitradurga Schist Belt.

6/4/2016
9
Lithological mapping from IRS Imagery Part of
Ramagiri Schist Belt and surrounding area
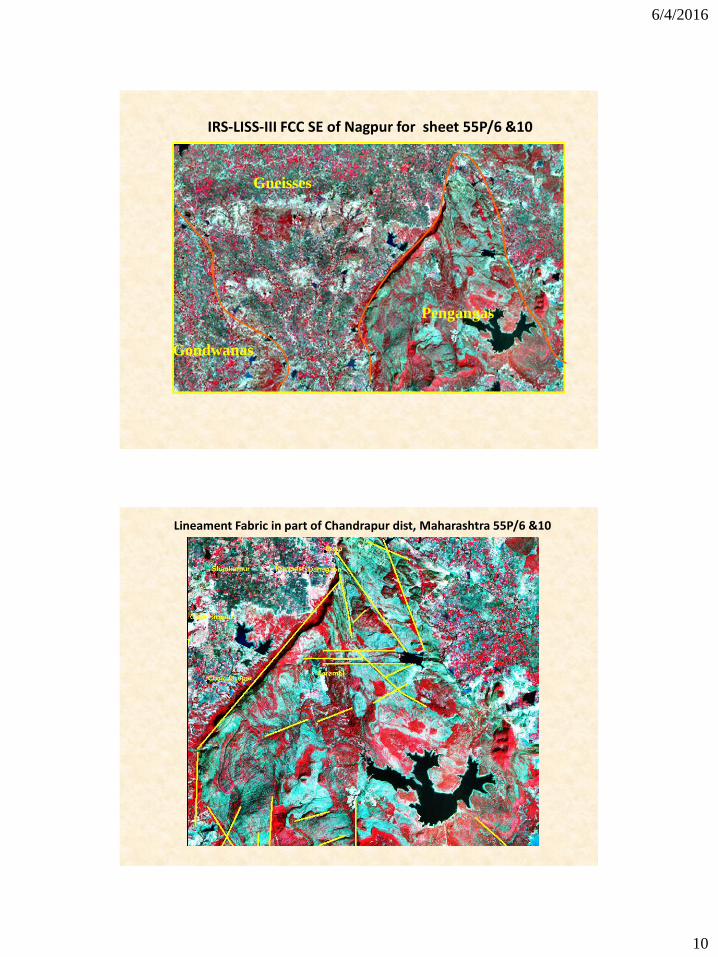
IRS-LISS-III FCC SE of Nagpur
TADOBA-ANDHERI TIGER
RESERVE
NAWARGAON
CHIMUR
6/4/2016
10
IRS-LISS-III FCC SE of Nagpur for sheet 55P/6 &10
Pengangas
Gneisses
Gondwanas
Lineament Fabric in part of Chandrapur dist, Maharashtra 55P/6 &10

6/4/2016
11
IRS-L3-FCC of part of SAUSARS Maharashtra
DEM IMAGE FROM SRTM DATA OVERLAID WITH TOPOSHEET & GEOLOGICAL MAP OF
PART OF SAUSAR BELT /TBG FOR SHEET 55O/2 ,3,10&11
Saleghat
Bhandetal
SonpurChandakpur
Dhavalpur
Mugnapal
Surewani

6/4/2016
12
27
Landsat ETM RGB = 432 Landsat ETM RGB = 532
Deccan
Traps
Nagpur-Wardha area Maharashtra
Granite outcrop with convex slope

6/4/2016
13
Exfoliation in Syenite
Granites with vertical joints

6/4/2016
14
Dongargarh Granite, Amgaon,
Gondia Dist
Dongargarh Granite near Amgaon,Gondia

6/4/2016
15
Deccan basaltic flows near Pune
Andesite flow

6/4/2016
16
Pitepani Andesites near Duggipar,Gondia,Maharashta
Typical Schist Belt Topography

6/4/2016
17
Schistose rock exposure
Surface level phyllite rocks
6/4/2016
18
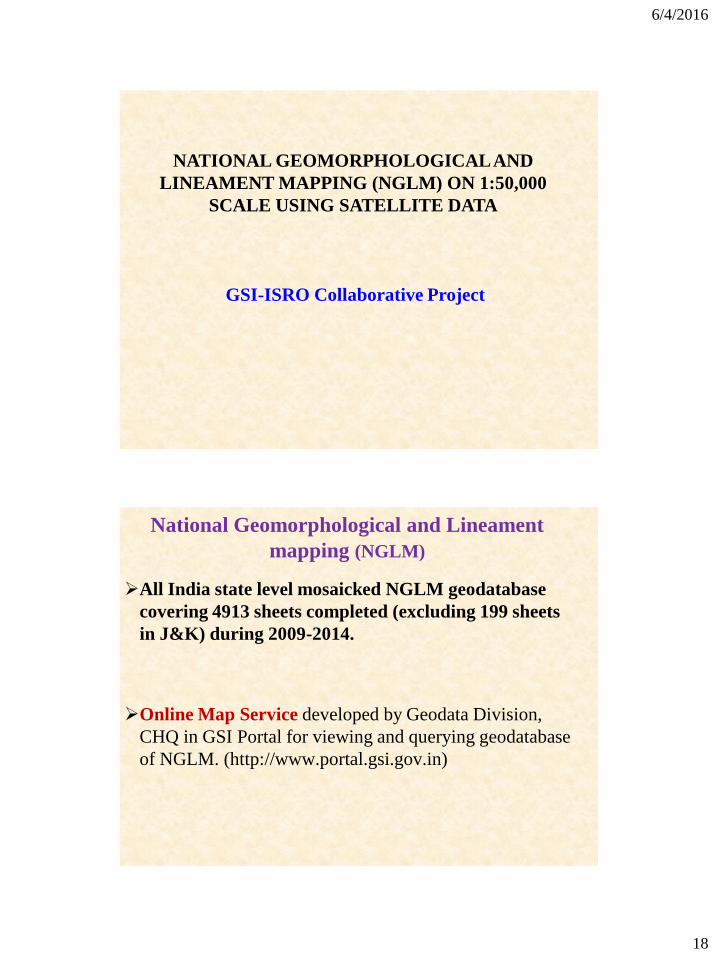
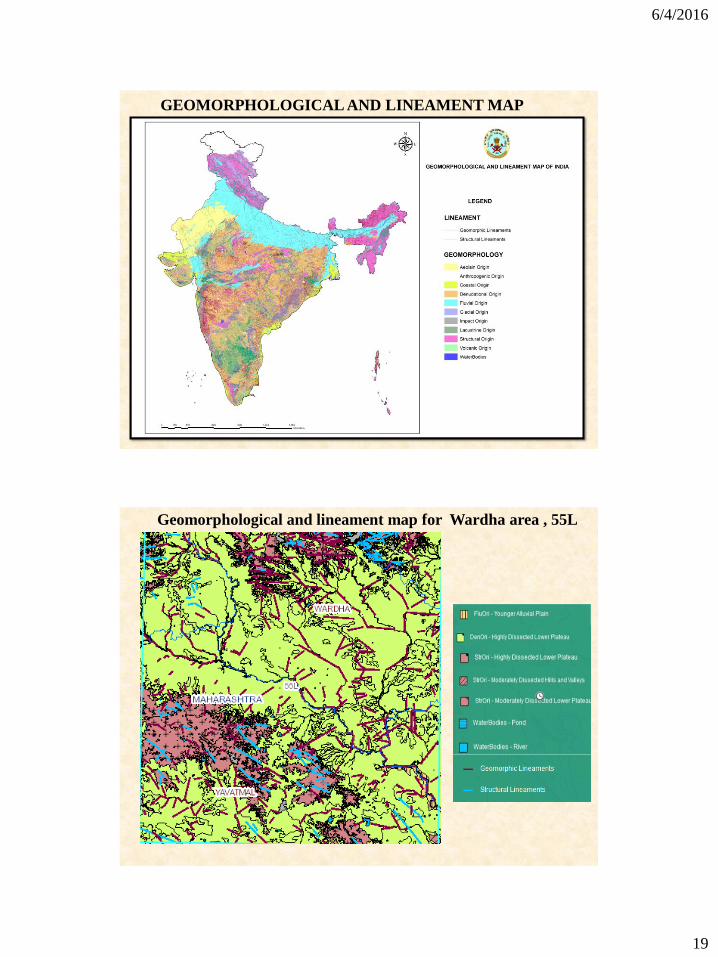
NATIONAL GEOMORPHOLOGICAL AND
LINEAMENT MAPPING (NGLM) ON 1:50,000
SCALE USING SATELLITE DATA
GSI-ISRO Collaborative Project
National Geomorphological and Lineament
mapping (NGLM)
All India state level mosaicked NGLM geodatabase
covering 4913 sheets completed (excluding 199 sheets
in J&K) during 2009-2014.
Online Map Service developed by Geodata Division,
CHQ in GSI Portal for viewing and querying geodatabase
of NGLM. (http://www.portal.gsi.gov.in)
6/4/2016
19
GEOMORPHOLOGICAL AND LINEAMENT MAP
Geomorphological and lineament map for Wardha area , 55L

6/4/2016
20
Geomorphlogical and Lineament Map for parts of
Chitradurga Schist belt- 57B
140 30
0
140 00
760 00 760 45
760 45
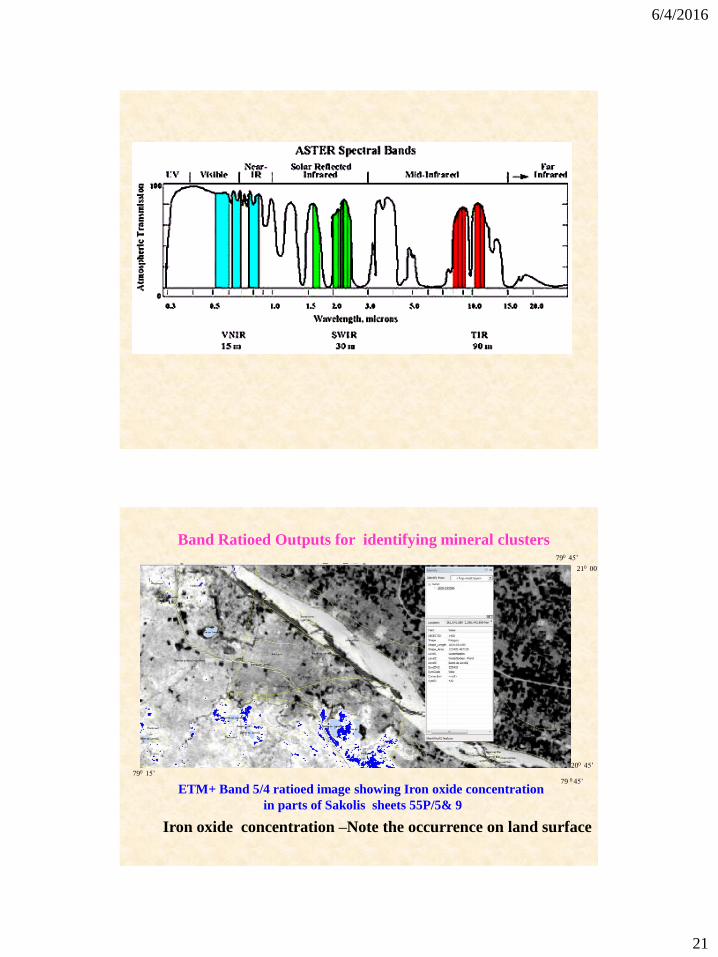
Newer Technologies in use
ASTER for Shortwave and
Thermal Infrared windows
for geological mapping
Hyperspectral Imaging
6/4/2016
21
Iron oxide concentration –Note the occurrence on land surface
ETM+ Band 5/4 ratioed image showing Iron oxide concentration
in parts of Sakolis sheets 55P/5& 9
790 15’79 0 45’
200 45’
790 45’
210 00’
Band Ratioed Outputs for identifying mineral clusters

6/4/2016
22
Clay mineral concentration in alluvium
ETM+ Band ratioed 5/7 image showing clay mineral
concentration in sheets 55P/5& 9
790 15’79 0 45’
200 45’
790 45’210 00’
Clay and Iron oxide cluster zones in Sakolis
from Band ratioed ETM+ data
790 15’ 79 0 45’
200 45’
790 45’
210 00’

6/4/2016
23
The science of acquiring digital imagery ofearth materials in many narrow contiguousspectral bands.
Hyperspectral Remote Sensing
What is it?
Also referred to as imaging spectrometry.
Differs from conventional remote sensing in that it
covers many narrowly defined spectral channels,
where as, conventional remote sensing looks at several
broadly defined spectral regions.
CONCEPTS

6/4/2016
24
Hyperspectral sensors
AIRBORNE HYPERSPECTRAL
• AVIRIS – NASA -224 – 0.4 TO 2.5
( 10 NM, 20M SP,12 KM SWATH SNR
500:1)
• HYDICE – NAVAL RESEARCH LAB-
210 – 0.4 TO 2.5
• DIAS –GERMAN – 79 – VISBLE –TIR
• HYMAP – ITRES RESEACH LIMITED –
200 – VISIBLE TO THERMAL

6/4/2016
25
Sensor
Lamp
White Panel
ASD Spectroradiometr
Laptop
Laboratory Set up of Hyperspectral Remote sensing
Reflectance spectra of clay minerals and micas contains distinctive absorption
features (T shaped symbols) due to the bending of Al-OH and Mg-OH bonds. Such
features help in discriminating between such minerals of hydrothermal and
sedimentary process.

6/4/2016
26
Reflectance spectra of carbonates contains distinctive
absorption features (T shaped symbols) due to
vibrational transitions related to C-O bonds. Most
distinctive features is near 2.35 microns, which helps
in discriminating between carbonates and clays.
Lab spectra of few rockktypes of Sakoli belt

6/4/2016
27
Serpentinite: Absorption
point at: 1391 nm, 1980 nm,
2107 nm, 2140 nm, 2328
nm
Microphotograph of
Serpentinite
Hornblendite: absorption
feature at: 1379 nm, 1907
nm, 2305 nm, 2385 nm
Microphotograph of
Hornblendite

6/4/2016
28
Talc-Tremolite-Serpentine
schist: Absorption at: 1394
nm, 1910 nm, 2325 nm
Microphotograph of Talc-
Tremolite-Serpentine schist
Tonalitic rock: Absorption
feature at: 1408 nm, 1920
nm, 2205 nm.
Microphotograph of
Tonalitic Rock
6/4/2016
29
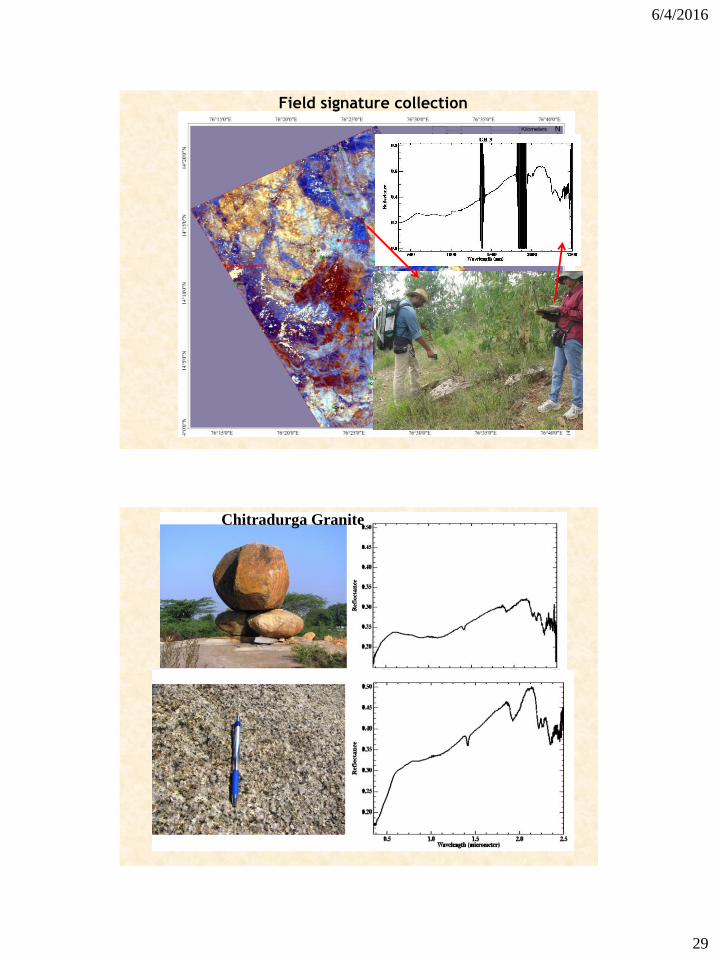
Field signature collection
Chitradurga Granite
6/4/2016
30
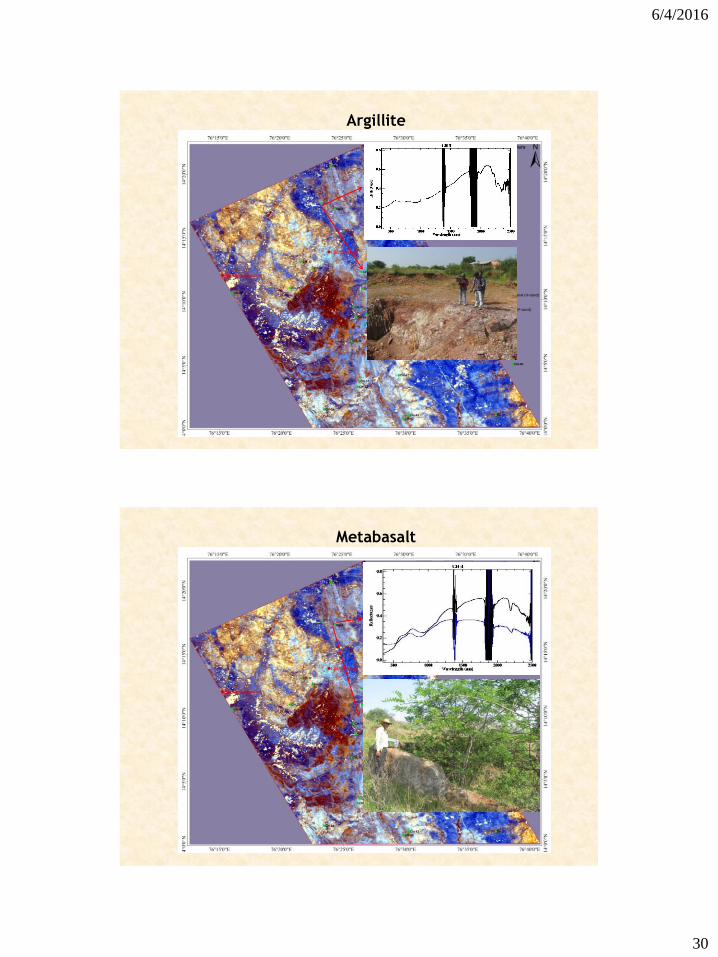
Argillite
Metabasalt
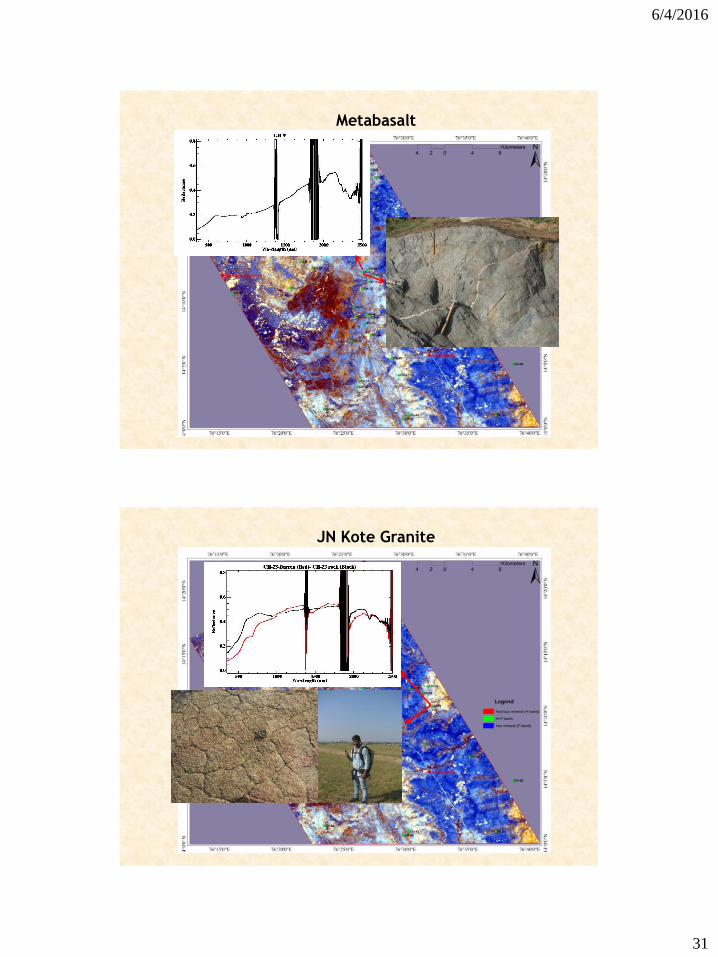
6/4/2016
31
Metabasalt
JN Kote Granite

6/4/2016
32
Spectra of J.N.Kote Granite
Spectra of Marble

6/4/2016
33
Spectra of Dolomite
Mineral abundance map around Dighori Moti & Sakra village (55 P/13)
6/4/2016
34
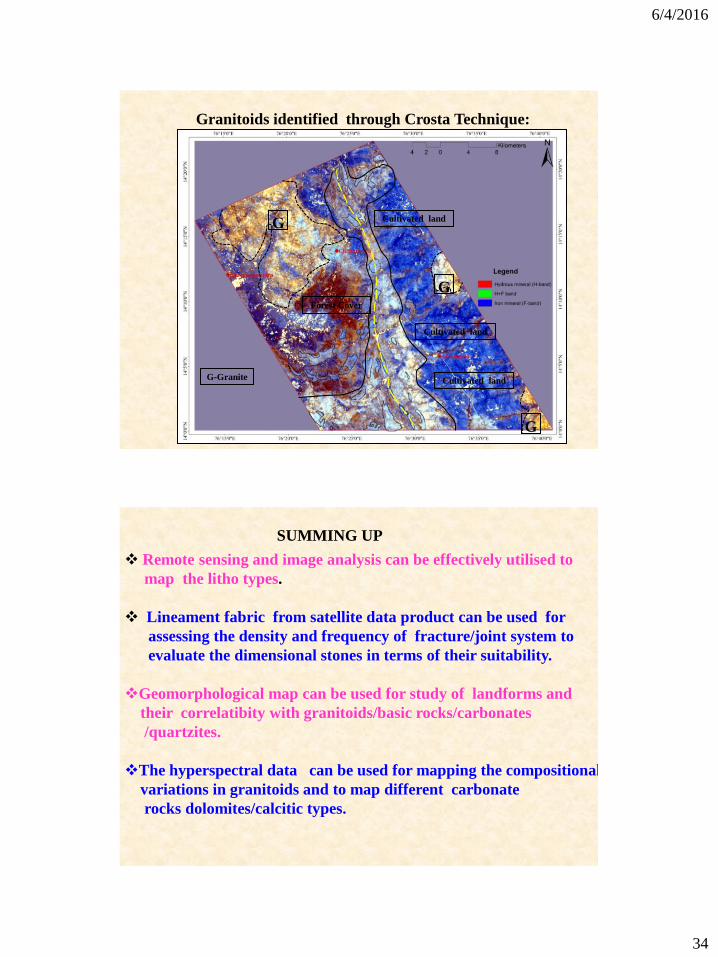
Granitoids identified through Crosta Technique:
G
G-Granite
G
G
Cultivated land
Forest Cover
Cultivated land
Cultivated land
SUMMING UP
Remote sensing and image analysis can be effectively utilised to
map the litho types.
Lineament fabric from satellite data product can be used for
assessing the density and frequency of fracture/joint system to
evaluate the dimensional stones in terms of their suitability.
Geomorphological map can be used for study of landforms and
their correlatibity with granitoids/basic rocks/carbonates
/quartzites.
The hyperspectral data can be used for mapping the compositional
variations in granitoids and to map different carbonate
rocks dolomites/calcitic types.

6/4/2016
35
Thank youThank you
Geological MapTernary Image Map

6/4/2016
36
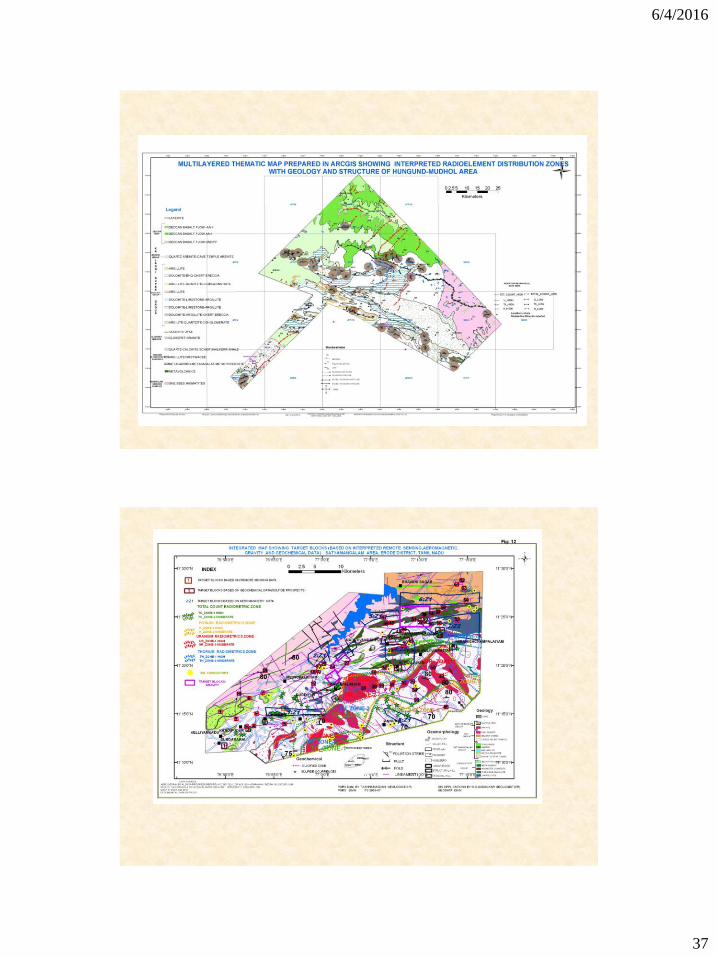
HUNGUND-MUDHOL AREA,
PARTS OF KARNATAKA
The aeromagnetic map clearly brought
out the extensions of the Hungund-
Kustigi Schist belt in N-W direction under
the Kaladgi sediments
Significant Uranium anomalies around
Nidagundi
6/4/2016
37

6/4/2016
38
Volcanic flow of Rhyolite
exposed near Markandi temple
in Waingangā river bed
Flow banding within Rhyolite exposed
near Shankarpur village
Photo-micrograph of Rhyolite
Landsat
7
Wavelength
(micromete
rs)
Resolution
(meters)
Band 1 0.45-0.52 30
Band 2 0.52-0.60 30
Band 3 0.63-0.69 30
Band 4 0.77-0.90 30
Band 5 1.55-1.75 30
Band 6 10.40-12.50 60 * (30)
Band 7 2.09-2.35 30
Band 8 .52-.90 15
Enhanced Thematic Mapper plus (ETM+)
BandsWavelength
(micrometers)
Resolution
(meters)
Band 1 - Coastal
aerosol0.43 - 0.45 30
Band 2 - Blue 0.45 - 0.51 30
Band 3 - Green 0.53 - 0.59 30
Band 4 - Red 0.64 - 0.67 30
Band 5 - Near
Infrared (NIR)0.85 - 0.88 30
Band 6 - SWIR 1 1.57 - 1.65 30
Band 7 - SWIR 2 2.11 - 2.29 30
Band 8 -
Panchromatic0.50 - 0.68 15
Band 9 - Cirrus 1.36 - 1.38 30
Band 10 - Thermal
Infrared (TIRS) 110.60 - 11.19 100
Band 11 - Thermal
Infrared (TIRS) 2 11.50 - 12.51 100
Landsat 8
Operational Land Imager (OLI) and Thermal Infrared Sensor