removal of basic dye auramine-o by zns:cu nanoparticles
TRANSCRIPT
RSC Advances
PAPER
Publ
ishe
d on
04
Febr
uary
201
5. D
ownl
oade
d on
12/
19/2
021
1:18
:43
PM.
View Article OnlineView Journal | View Issue
Removal of basic
aChemistry Department, Yasouj University, YbDepartment of Chemistry, Indian Institute
India. E-mail: [email protected]; vinodfcy
+91 1332285801cCenter for Environment and Water, The Re
Petroleum and Minerals Dhahran, Saudi Ar
Cite this: RSC Adv., 2015, 5, 18438
Received 2nd December 2014Accepted 4th February 2015
DOI: 10.1039/c4ra15637d
www.rsc.org/advances
18438 | RSC Adv., 2015, 5, 18438–1845
dye Auramine-O by ZnS:Cunanoparticles loaded on activated carbon:optimization of parameters using response surfacemethodology with central composite design
Arash Asfaram,a Mehrorang Ghaedi,a Shilpi Agarwal,b Inderjeet Tyagib
and Vinod Kumar Gupta*bc
This research is focused on the ultrasound-assisted removal of Auramine-O (AO) dye from aqueous
solutions using ZnS:Cu nanoparticles loaded on activated carbon (ZnS:Cu-NP-AC) as an adsorbent.
ZnS:Cu nanoparticles were synthesized and characterized using FESEM (Field-Emission Scanning
Electron Microscopy) and XRD (X-Ray Diffraction) analysis. The experiments were designed by response
surface methodology. A quadratic model was used to predict the variables. Analysis of variance was used
for investigation of variables and interaction between them. High F-value (48.91), very low P-value
(<0.00001), non-significant lack of fit, and the determination coefficient (R2 ¼ 0.977) demonstrate good
correlation between experimental and predicted values of the response. The highest removal percent
attained was 99.76%, and the optimum parameters achieved are: adsorbent amount (0.02 g), initial dye
concentration (20 mg L�1), sonication time (3 min) and pH ¼ 7. Adsorption processes of AO by ZnS:Cu-
NP-AC could be well described by a Langmuir isotherm and a pseudo-second-order kinetic model. The
maximum adsorption capacity of AO by ZnS:Cu-NP-AC was determined as 183.15 mg g�1, suggesting a
highly promising potential for ZnS:Cu-NP-AC to be used as a new adsorbent.
1. Introduction
The discharge of dyes into the biological ecosystem is worryingfor both toxicological and esthetical aspects.1 Almost 45% oftextile dyes produced worldwide belong to the reactive class.2
Reactive dyes are common dyes used for dying cellulosic bresdue to their favorable characteristics of bright color, water-fastness, simple application techniques and low energyconsumption.3 Auramine-O (AO) and its hydrochloride salts areused as coloring agent in paper, textiles and leather industries.4
International agency for research on cancer (IARC) included AOamong chemicals for which there is sufficient evidence of car-cinogenicity due to its bio-transformation to reactive species intarget organs of both rats and humans.5,6 Auramine-O (AO) isyellow in color and is frequently used in paper mills, textilemills, leather and carpet industry. Presence of these dyes ishighly persistent and the manufacturers always go for the moststable dye. For the efficient removal of hazardous impurities,several physical and chemical methods such as coagulation,7
asouj 75914-35, Iran
of Technology Roorkee, Roorkee-247 667,
@gmail.com; Fax: +91 1332273560; Tel:
search Institute, King Fahd University of
abia
0
reverse osmosis,8 photo degradation,9 electrochemical oxida-tion,10 ozonation,11 biosorption12 and adsorption are used.Among all, adsorption as a popular alternative procedure,especially based on low cost adsorbent benet from remarkssuch as, simple design, easy operation and the possibility ofusing green and non-toxic adsorbent. Many adsorbent weretested on the possibility of the hazardous dye removal such ascarbon nanotube,13–21 MWCNTs22,23 activated carbon,24,25 yash,26 chitin,27 zeolite,28 polymer,29 low cost adsorbents,30–40
lignin,41,42 barley straw,43 nanocomposites44–47 and grapheneoxide.48 Design and application of non-toxic adsorbent that wasable to remove a huge amount of hazardous dyes molecule inshort time are crucial requirements for the wastewater treat-ment. Nanoparticles exhibit intrinsic surface activity, highsurface areas and reactive atom or functional group stronglychemisorbed many hazardous chemical compounds. The size,surface structure and interparticle interaction of nanomaterialsdetermine their unique properties which proved nanoparticlean efficient adsorbent as well as several other potential appli-cations in many relevant research areas. The key objective of thepresent work is the synthesis of ZnS:Cu nanoparticle loaded onAC, which is followed by a characterization via differentanalytical techniques such as UV-vis, SEM and XRD. Thepotential feasibility of ZnS:Cu-NP-AC for the adsorption processof AO was investigated and the inuence of certain variables
This journal is © The Royal Society of Chemistry 2015
Paper RSC Advances
Publ
ishe
d on
04
Febr
uary
201
5. D
ownl
oade
d on
12/
19/2
021
1:18
:43
PM.
View Article Online
was studied and optimized by central composite design (CCD)combined with response surface methodology (RSM) using thedesirability function (DF) as maximize criterion of the response.The results obtained from the presentedmodels were comparedwith the experimental values. The adsorption kinetics andisotherms of dye removal on this adsorbent was also investi-gated. The adsorption rates were evaluated by tting theexperimental data to traditional kinetic models such as pseudorst-order, second-order and intraparticle diffusion models.The proposed sorbent will be useful for quantitative adsorptionof the dye with high sorption capacities in short time.
2. Materials and methods2.1. Materials and instruments
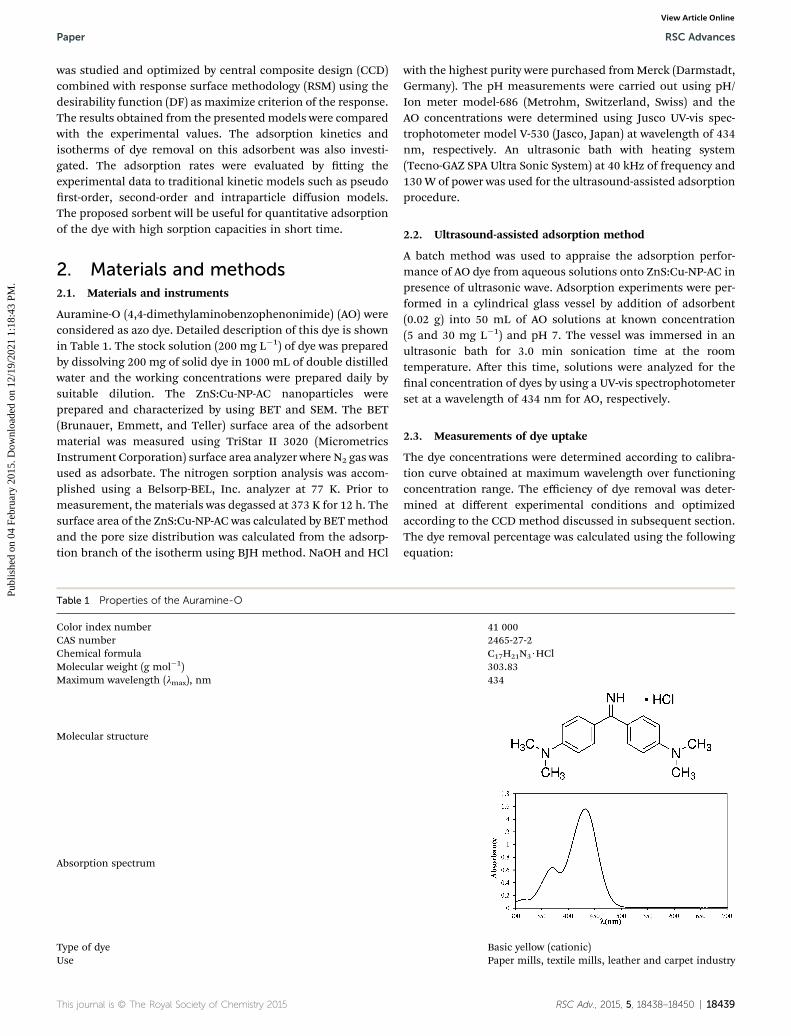
Auramine-O (4,4-dimethylaminobenzophenonimide) (AO) wereconsidered as azo dye. Detailed description of this dye is shownin Table 1. The stock solution (200 mg L�1) of dye was preparedby dissolving 200 mg of solid dye in 1000 mL of double distilledwater and the working concentrations were prepared daily bysuitable dilution. The ZnS:Cu-NP-AC nanoparticles wereprepared and characterized by using BET and SEM. The BET(Brunauer, Emmett, and Teller) surface area of the adsorbentmaterial was measured using TriStar II 3020 (MicrometricsInstrument Corporation) surface area analyzer where N2 gas wasused as adsorbate. The nitrogen sorption analysis was accom-plished using a Belsorp-BEL, Inc. analyzer at 77 K. Prior tomeasurement, the materials was degassed at 373 K for 12 h. Thesurface area of the ZnS:Cu-NP-AC was calculated by BETmethodand the pore size distribution was calculated from the adsorp-tion branch of the isotherm using BJH method. NaOH and HCl
Table 1 Properties of the Auramine-O
Color index numberCAS numberChemical formulaMolecular weight (g mol�1)Maximum wavelength (lmax), nm
Molecular structure
Absorption spectrum
Type of dyeUse
This journal is © The Royal Society of Chemistry 2015
with the highest purity were purchased fromMerck (Darmstadt,Germany). The pH measurements were carried out using pH/Ion meter model-686 (Metrohm, Switzerland, Swiss) and theAO concentrations were determined using Jusco UV-vis spec-trophotometer model V-530 (Jasco, Japan) at wavelength of 434nm, respectively. An ultrasonic bath with heating system(Tecno-GAZ SPA Ultra Sonic System) at 40 kHz of frequency and130W of power was used for the ultrasound-assisted adsorptionprocedure.
2.2. Ultrasound-assisted adsorption method
A batch method was used to appraise the adsorption perfor-mance of AO dye from aqueous solutions onto ZnS:Cu-NP-AC inpresence of ultrasonic wave. Adsorption experiments were per-formed in a cylindrical glass vessel by addition of adsorbent(0.02 g) into 50 mL of AO solutions at known concentration(5 and 30 mg L�1) and pH 7. The vessel was immersed in anultrasonic bath for 3.0 min sonication time at the roomtemperature. Aer this time, solutions were analyzed for thenal concentration of dyes by using a UV-vis spectrophotometerset at a wavelength of 434 nm for AO, respectively.
2.3. Measurements of dye uptake
The dye concentrations were determined according to calibra-tion curve obtained at maximum wavelength over functioningconcentration range. The efficiency of dye removal was deter-mined at different experimental conditions and optimizedaccording to the CCD method discussed in subsequent section.The dye removal percentage was calculated using the followingequation:
41 0002465-27-2C17H21N3$HCl303.83434
Basic yellow (cationic)Paper mills, textile mills, leather and carpet industry
RSC Adv., 2015, 5, 18438–18450 | 18439
RSC Advances Paper
Publ
ishe
d on
04
Febr
uary
201
5. D
ownl
oade
d on
12/
19/2
021
1:18
:43
PM.
View Article Online
%R JSB ¼ C0 � Ct
C0
� 100 (1)
where C0 (mg L�1) and Ct (mg L�1) is the concentration of dye atinitial and aer time t, respectively.49
2.4. Kinetic experiments
Kinetic adsorption is performed to investigate the mechanismof adsorption and to determine the equilibrium time.50 For thispurpose 0.01 and 0.02 g of adsorbent was contacted with 50 mLof AO solution with an initial concentration of AO, 10, 20 and 30mg L�1, in ultrasonic at temperature for different time intervalsat the optimum pH 7. The samples were ltered and determinedusing Jusco UV-vis spectrophotometer model V-530 (Jasco,Japan) at wavelength of 434 nm, respectively.51
2.5. Adsorption isotherms
Adsorption isotherms are used to describe the equilibriumbehaviors of adsorbate uptake.52 For isotherms experiments,various amounts of adsorbents (0.01, 0.015 and 0.02 g) werecontacted with 50 mL of solution AO with an initial concen-tration of (5–30 mg L�1), in 6 asks at the optimum pH 7. Thecontainers were mechanically agitated in a shaker at ultrasonicin room temperature for 3 min. The samples were ltered anddetermined using Jusco UV-vis spectrophotometer model V-530(Jasco, Japan) at wavelength of 434 nm, respectively. Theadsorbed dye amount (qe (mg g�1)) was calculated by thefollowing mass balance relationship:
qe ¼ ðC0 � CeÞVW
(2)
where qe is the amount of adsorbed manganese per gramadsorbent at equilibrium (mg g�1) and C0 and Ce are theconcentrations of the metal ions before and aer adsorption(mg L�1), V the volume of the aqueous phase (L) andm the massof the adsorbent (g).53
2.6. Preparation of ZnS:Cu-NP-AC
Analytical reagent grade zinc sulfate (ZnSO4$2H2O), cupper(II)acetate (Cu(CH3COO)2) and thiourea (SC(NH2)2) werepurchased from Merck company and used without furtherpurication. The preparation of ZnS:Cu-NPs were carried out attwo steps. In the rst step, ZnS nanoparticles (ZnS-NPs) weresynthesized. The precursor solution for synthesis of ZnS-NPswas prepared as follows: 0.6 mmol of zinc sulfate solution wasmixed with 30 mL of 0.5 M thiourea solution at pH ¼ 5.5 anddeionized water was added to the mixed solutions to make atotal volume of 250 mL. Then, 250 mL of the precursor solutionin a baker was transferred to an autoclave at pressure of 1.25 barfor 3 h. The temperature of the autoclave was 125 �C. Aer 3hours, the baker containing the reaction solution containingwhite colored ZnS-NPs in bottom of the baker was removedfrom autoclave. The obtained ZnS-NPs were ltered and washedseveral times by deionized water. In the second step, ZnS:Cu-NPs-AC was prepared. 250 mL of deionized water was addedto the ZnS-NPs prepared from step 1 to form an insoluble
18440 | RSC Adv., 2015, 5, 18438–18450
suspension. 1 mL 0.2 M (Cu(CH3COO)2) solution was added tothe ZnS-NPs suspension along with vigorous stirring for 5 min.Aer adding Cu2+ solution to ZnS-NPs suspension, its colorslightly changes from milky white to light green because of thediffusion of Cu2+ ions to ZnS-NPs and formation of ZnS:Cu-NPssuspension. Finally, the homogenous deposition of ZnS:Cu-NPson activated carbon (AC) was carried out by adding 10 g of AC tothe obtained ZnS:Cu-NPs suspension and strong stirring for 20h at room temperature. The prepared ZnS:Cu-NPs-AC were thenltered, washed several times by deionized water, dried at 60 �Cfor 3 h and used as an absorbent for adsorption experiments,the major impurities that may be present during the synthesisof ZnS:Cu nanoparticles are ZnO and Zn(OH)2, but the XRDpattern conrm high purity of ZnS:Cu-NP and its agreementwith reference material without any further impurity.
2.7. Role of ZnS:Cu nanoparticles
ZnS:Cu nanoparticle posses a crucial role on the adsorptionphenomenon, it lead to the enhancement of the surface areaand number of active sites, hence it is an efficient adsorbent,when loaded on AC, it causes very rapid adsorption ofhazardous materials i.e. dyes, even by using a very low amountof adsorbent dose i.e. 0.02, maximum 99.76% of the adsorptiontakes place. Hence to carry out at an efficient and maximumadsorption it is needed to coat ZnS:Cu nanoparticles on to theactivated carbon because several parameters are effected likesonication time, pH, and adsorbent dose, a major change isreported in the sonication time parameter from 120 and 300minutes it reduces to only 3 minutes to achieve the maximumadsorption.
2.8. Reusable capacity of ZnS:Cu nanoparticles
Like the other nanoparticles adsorbent i.e. Fe2O3, MnO etc, theycan be reused as adsorbent aer magnetic separation forremoving the noxious toxic contaminants, it is seen that it canbe used maximum four times without any change and modi-cation in the developed adsorbent.54,55
2.9. Central composite design (CCD)
A central composite design (CCD) was used to determine theoptimal conditions for the critical factors. For the adsorptionprocess, signicant variables, such as pH, AO concentration,adsorbent and sonication time, were chosen as the independentvariables and designated as X1–X4, respectively. The pH (X1)ranged from 5 to 9, adsorbent (X2) ranged from 0.005 to 0.025 g,sonication time (X3) ranged from 1 to 5 min and the AOconcentration (X4) ranged from 10 to 30 mg L�1, as shown inTable 2. The real values of the independent variables (Xi) werecoded to zi according to eqn (3) by setting the lowest values as�2 and the highest values as +2:
zi ¼ xi � x0
Dxi
(3)
where zi is the dimensionless value of an independent variable,xi represents the real value of the independent variable, x0 is thereal value of the independent variable at the center point, and
This journal is © The Royal Society of Chemistry 2015
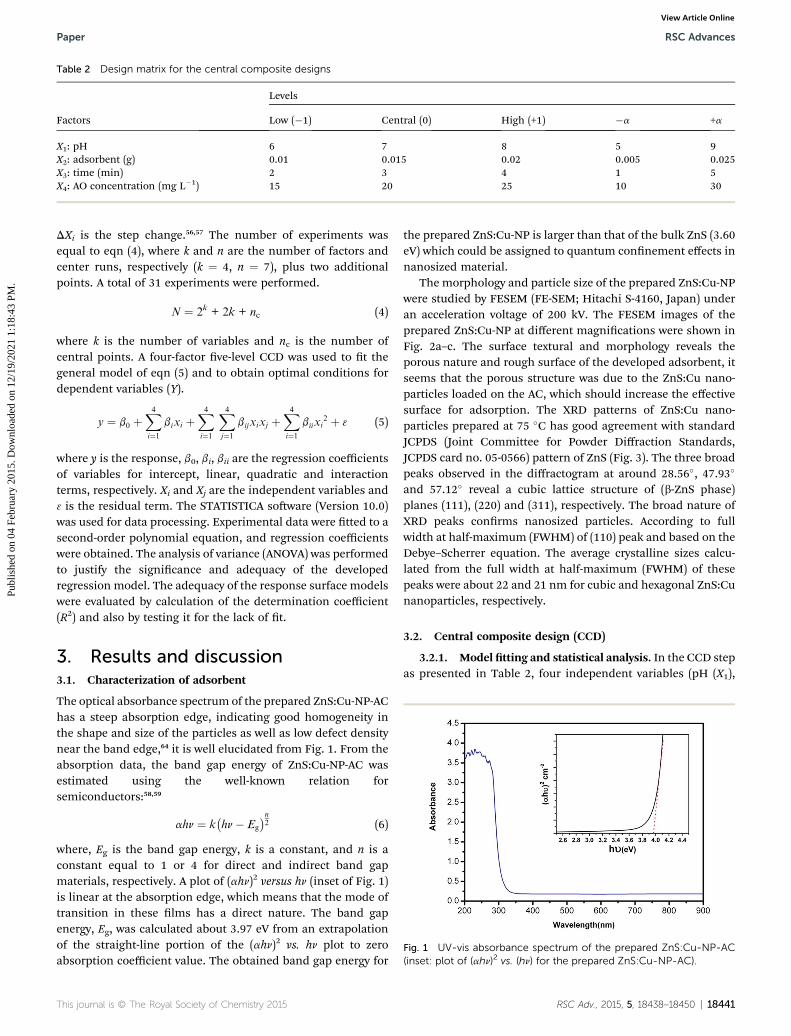
Table 2 Design matrix for the central composite designs
Factors
Levels
Low (�1) Central (0) High (+1) �a +a
X1: pH 6 7 8 5 9X2: adsorbent (g) 0.01 0.015 0.02 0.005 0.025X3: time (min) 2 3 4 1 5X4: AO concentration (mg L�1) 15 20 25 10 30
Paper RSC Advances
Publ
ishe
d on
04
Febr
uary
201
5. D
ownl
oade
d on
12/
19/2
021
1:18
:43
PM.
View Article Online
DXi is the step change.56,57 The number of experiments wasequal to eqn (4), where k and n are the number of factors andcenter runs, respectively (k ¼ 4, n ¼ 7), plus two additionalpoints. A total of 31 experiments were performed.
N ¼ 2k + 2k + nc (4)
where k is the number of variables and nc is the number ofcentral points. A four-factor ve-level CCD was used to t thegeneral model of eqn (5) and to obtain optimal conditions fordependent variables (Y).
y ¼ b0 þX4
i¼1
bixi þX4
i¼1
X4
j¼1
bijxixj þX4
i¼1
biixi2 þ 3 (5)
where y is the response, b0, bi, bii are the regression coefficientsof variables for intercept, linear, quadratic and interactionterms, respectively. Xi and Xj are the independent variables and3 is the residual term. The STATISTICA soware (Version 10.0)was used for data processing. Experimental data were tted to asecond-order polynomial equation, and regression coefficientswere obtained. The analysis of variance (ANOVA) was performedto justify the signicance and adequacy of the developedregression model. The adequacy of the response surface modelswere evaluated by calculation of the determination coefficient(R2) and also by testing it for the lack of t.
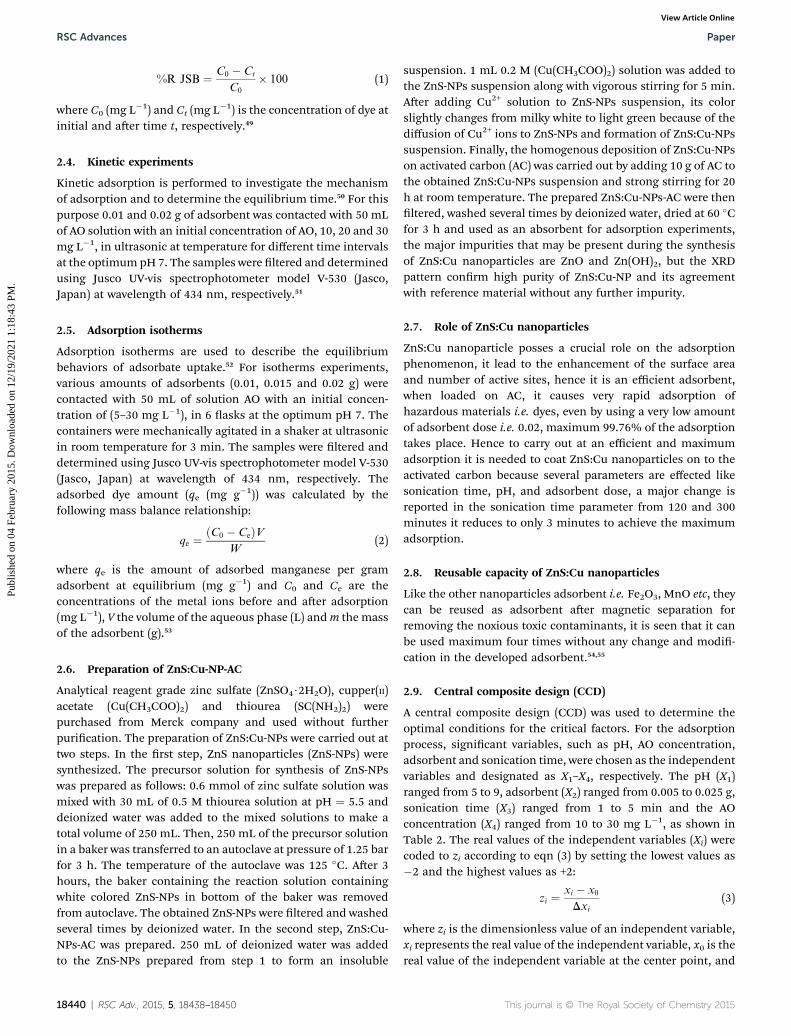
Fig. 1 UV-vis absorbance spectrum of the prepared ZnS:Cu-NP-AC(inset: plot of (ahn)2 vs. (hn) for the prepared ZnS:Cu-NP-AC).
3. Results and discussion3.1. Characterization of adsorbent
The optical absorbance spectrum of the prepared ZnS:Cu-NP-AChas a steep absorption edge, indicating good homogeneity inthe shape and size of the particles as well as low defect densitynear the band edge,64 it is well elucidated from Fig. 1. From theabsorption data, the band gap energy of ZnS:Cu-NP-AC wasestimated using the well-known relation forsemiconductors:58,59
ahn ¼ k�hn� Eg
�n2 (6)
where, Eg is the band gap energy, k is a constant, and n is aconstant equal to 1 or 4 for direct and indirect band gapmaterials, respectively. A plot of (ahn)2 versus hn (inset of Fig. 1)is linear at the absorption edge, which means that the mode oftransition in these lms has a direct nature. The band gapenergy, Eg, was calculated about 3.97 eV from an extrapolationof the straight-line portion of the (ahn)2 vs. hn plot to zeroabsorption coefficient value. The obtained band gap energy for
This journal is © The Royal Society of Chemistry 2015
the prepared ZnS:Cu-NP is larger than that of the bulk ZnS (3.60eV) which could be assigned to quantum connement effects innanosized material.
The morphology and particle size of the prepared ZnS:Cu-NPwere studied by FESEM (FE-SEM; Hitachi S-4160, Japan) underan acceleration voltage of 200 kV. The FESEM images of theprepared ZnS:Cu-NP at different magnications were shown inFig. 2a–c. The surface textural and morphology reveals theporous nature and rough surface of the developed adsorbent, itseems that the porous structure was due to the ZnS:Cu nano-particles loaded on the AC, which should increase the effectivesurface for adsorption. The XRD patterns of ZnS:Cu nano-particles prepared at 75 �C has good agreement with standardJCPDS (Joint Committee for Powder Diffraction Standards,JCPDS card no. 05-0566) pattern of ZnS (Fig. 3). The three broadpeaks observed in the diffractogram at around 28.56�, 47.93�
and 57.12� reveal a cubic lattice structure of (b-ZnS phase)planes (111), (220) and (311), respectively. The broad nature ofXRD peaks conrms nanosized particles. According to fullwidth at half-maximum (FWHM) of (110) peak and based on theDebye–Scherrer equation. The average crystalline sizes calcu-lated from the full width at half-maximum (FWHM) of thesepeaks were about 22 and 21 nm for cubic and hexagonal ZnS:Cunanoparticles, respectively.
3.2. Central composite design (CCD)
3.2.1. Model tting and statistical analysis. In the CCD stepas presented in Table 2, four independent variables (pH (X1),
RSC Adv., 2015, 5, 18438–18450 | 18441
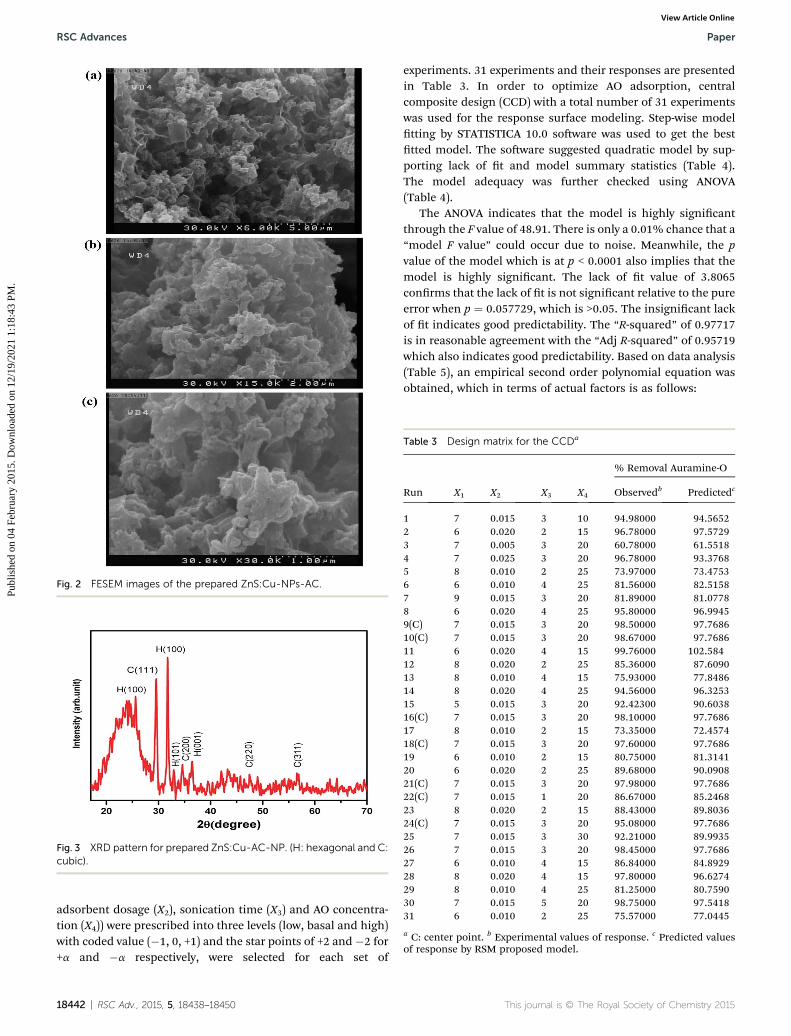
Fig. 2 FESEM images of the prepared ZnS:Cu-NPs-AC.
Fig. 3 XRD pattern for prepared ZnS:Cu-AC-NP. (H: hexagonal and C:cubic).
Table 3 Design matrix for the CCDa
Run X1 X2 X3 X4
% Removal Auramine-O
Observedb Predictedc
1 7 0.015 3 10 94.98000 94.56522 6 0.020 2 15 96.78000 97.57293 7 0.005 3 20 60.78000 61.55184 7 0.025 3 20 96.78000 93.37685 8 0.010 2 25 73.97000 73.47536 6 0.010 4 25 81.56000 82.51587 9 0.015 3 20 81.89000 81.07788 6 0.020 4 25 95.80000 96.99459(C) 7 0.015 3 20 98.50000 97.768610(C) 7 0.015 3 20 98.67000 97.768611 6 0.020 4 15 99.76000 102.58412 8 0.020 2 25 85.36000 87.609013 8 0.010 4 15 75.93000 77.848614 8 0.020 4 25 94.56000 96.325315 5 0.015 3 20 92.42300 90.603816(C) 7 0.015 3 20 98.10000 97.768617 8 0.010 2 15 73.35000 72.457418(C) 7 0.015 3 20 97.60000 97.768619 6 0.010 2 15 80.75000 81.314120 6 0.020 2 25 89.68000 90.090821(C) 7 0.015 3 20 97.98000 97.768622(C) 7 0.015 1 20 86.67000 85.246823 8 0.020 2 15 88.43000 89.803624(C) 7 0.015 3 20 95.08000 97.768625 7 0.015 3 30 92.21000 89.993526 7 0.015 3 20 98.45000 97.768627 6 0.010 4 15 86.84000 84.892928 8 0.020 4 15 97.80000 96.627429 8 0.010 4 25 81.25000 80.759030 7 0.015 5 20 98.75000 97.541831 6 0.010 2 25 75.57000 77.0445
a C: center point. b Experimental values of response. c Predicted valuesof response by RSM proposed model.
RSC Advances Paper
Publ
ishe
d on
04
Febr
uary
201
5. D
ownl
oade
d on
12/
19/2
021
1:18
:43
PM.
View Article Online
adsorbent dosage (X2), sonication time (X3) and AO concentra-tion (X4)) were prescribed into three levels (low, basal and high)with coded value (�1, 0, +1) and the star points of +2 and�2 for+a and �a respectively, were selected for each set of
18442 | RSC Adv., 2015, 5, 18438–18450
experiments. 31 experiments and their responses are presentedin Table 3. In order to optimize AO adsorption, centralcomposite design (CCD) with a total number of 31 experimentswas used for the response surface modeling. Step-wise modeltting by STATISTICA 10.0 soware was used to get the besttted model. The soware suggested quadratic model by sup-porting lack of t and model summary statistics (Table 4).The model adequacy was further checked using ANOVA(Table 4).
The ANOVA indicates that the model is highly signicantthrough the F value of 48.91. There is only a 0.01% chance that a“model F value” could occur due to noise. Meanwhile, the pvalue of the model which is at p < 0.0001 also implies that themodel is highly signicant. The lack of t value of 3.8065conrms that the lack of t is not signicant relative to the pureerror when p ¼ 0.057729, which is >0.05. The insignicant lackof t indicates good predictability. The “R-squared” of 0.97717is in reasonable agreement with the “Adj R-squared” of 0.95719which also indicates good predictability. Based on data analysis(Table 5), an empirical second order polynomial equation wasobtained, which in terms of actual factors is as follows:
This journal is © The Royal Society of Chemistry 2015
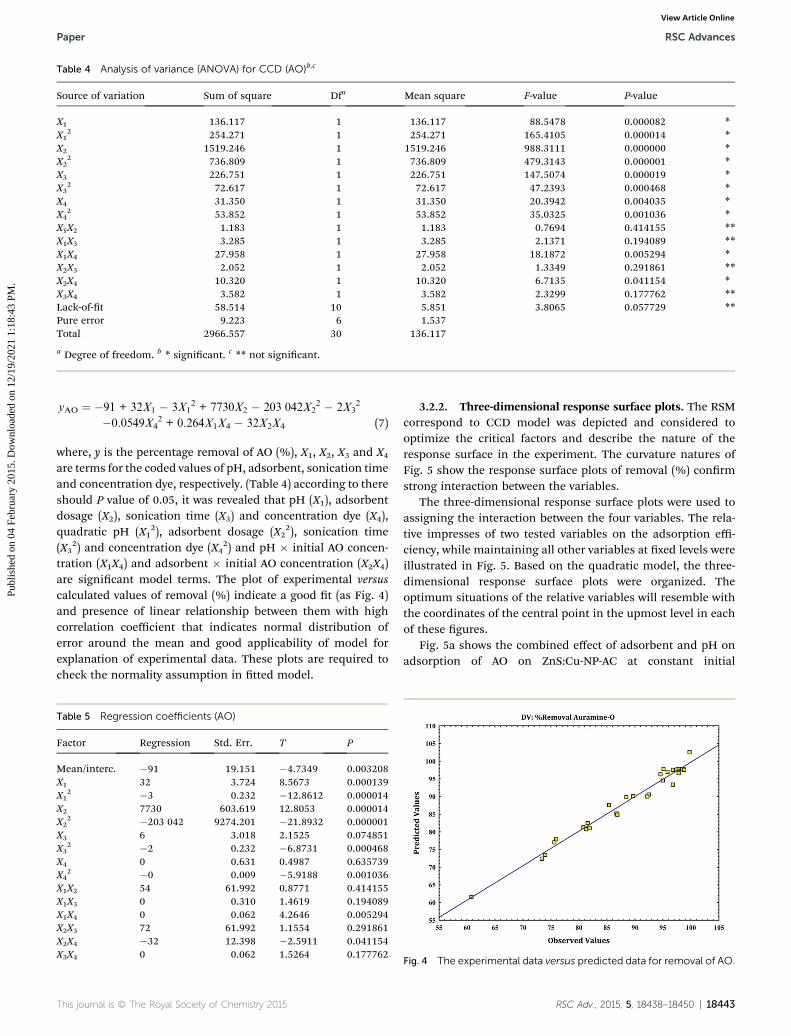
Table 4 Analysis of variance (ANOVA) for CCD (AO)b,c
Source of variation Sum of square Dfa Mean square F-value P-value
X1 136.117 1 136.117 88.5478 0.000082 *
X12 254.271 1 254.271 165.4105 0.000014 *
X2 1519.246 1 1519.246 988.3111 0.000000 *
X22 736.809 1 736.809 479.3143 0.000001 *
X3 226.751 1 226.751 147.5074 0.000019 *
X32 72.617 1 72.617 47.2393 0.000468 *
X4 31.350 1 31.350 20.3942 0.004035 *
X42 53.852 1 53.852 35.0325 0.001036 *
X1X2 1.183 1 1.183 0.7694 0.414155 **
X1X3 3.285 1 3.285 2.1371 0.194089 **
X1X4 27.958 1 27.958 18.1872 0.005294 *
X2X3 2.052 1 2.052 1.3349 0.291861 **
X2X4 10.320 1 10.320 6.7135 0.041154 *
X3X4 3.582 1 3.582 2.3299 0.177762 **
Lack-of-t 58.514 10 5.851 3.8065 0.057729 **
Pure error 9.223 6 1.537Total 2966.557 30 136.117
a Degree of freedom. b * signicant. c ** not signicant.
Paper RSC Advances
Publ
ishe
d on
04
Febr
uary
201
5. D
ownl
oade
d on
12/
19/2
021
1:18
:43
PM.
View Article Online
yAO ¼ �91 + 32X1 � 3X12 + 7730X2 � 203 042X2
2 � 2X32
�0.0549X42 + 0.264X1X4 � 32X2X4 (7)
where, y is the percentage removal of AO (%), X1, X2, X3 and X4
are terms for the coded values of pH, adsorbent, sonication timeand concentration dye, respectively. (Table 4) according to thereshould P value of 0.05, it was revealed that pH (X1), adsorbentdosage (X2), sonication time (X3) and concentration dye (X4),quadratic pH (X1
2), adsorbent dosage (X22), sonication time
(X32) and concentration dye (X4
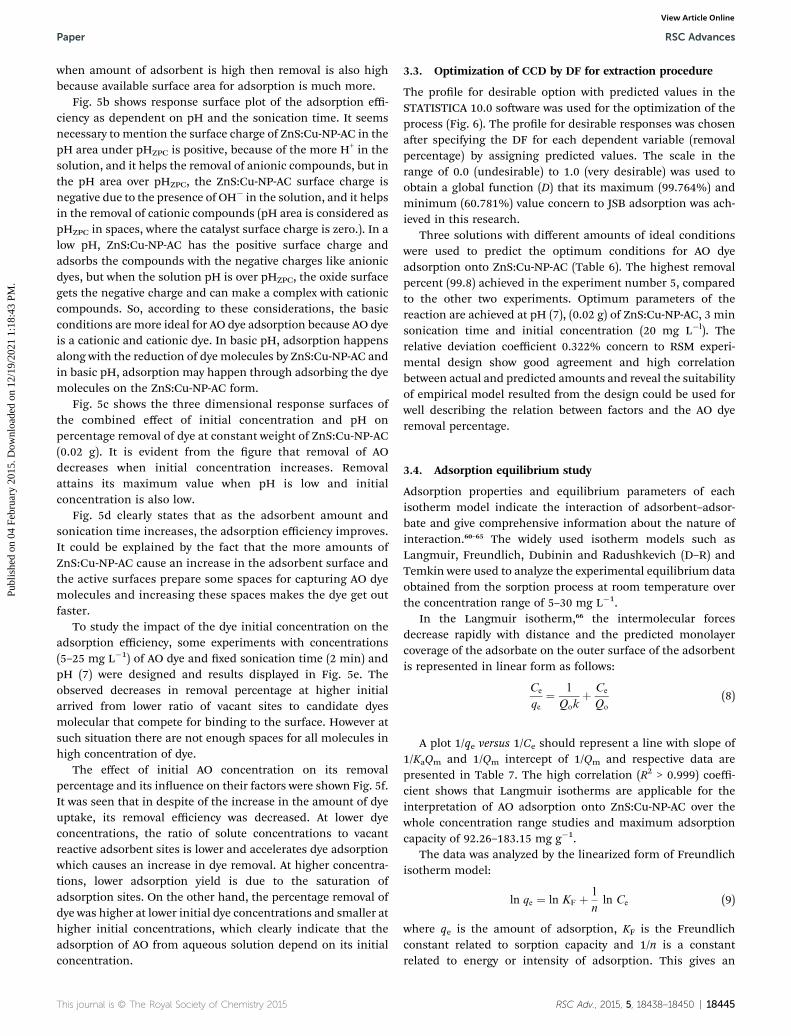
2) and pH � initial AO concen-tration (X1X4) and adsorbent � initial AO concentration (X2X4)are signicant model terms. The plot of experimental versuscalculated values of removal (%) indicate a good t (as Fig. 4)and presence of linear relationship between them with highcorrelation coefficient that indicates normal distribution oferror around the mean and good applicability of model forexplanation of experimental data. These plots are required tocheck the normality assumption in tted model.
Table 5 Regression coefficients (AO)
Factor Regression Std. Err. T P
Mean/interc. �91 19.151 �4.7349 0.003208X1 32 3.724 8.5673 0.000139X1
2 �3 0.232 �12.8612 0.000014X2 7730 603.619 12.8053 0.000014X2
2 �203 042 9274.201 �21.8932 0.000001X3 6 3.018 2.1525 0.074851X3
2 �2 0.232 �6.8731 0.000468X4 0 0.631 0.4987 0.635739X4
2 �0 0.009 �5.9188 0.001036X1X2 54 61.992 0.8771 0.414155X1X3 0 0.310 1.4619 0.194089X1X4 0 0.062 4.2646 0.005294X2X3 72 61.992 1.1554 0.291861X2X4 �32 12.398 �2.5911 0.041154X3X4 0 0.062 1.5264 0.177762
This journal is © The Royal Society of Chemistry 2015
3.2.2. Three-dimensional response surface plots. The RSMcorrespond to CCD model was depicted and considered tooptimize the critical factors and describe the nature of theresponse surface in the experiment. The curvature natures ofFig. 5 show the response surface plots of removal (%) conrmstrong interaction between the variables.
The three-dimensional response surface plots were used toassigning the interaction between the four variables. The rela-tive impresses of two tested variables on the adsorption effi-ciency, while maintaining all other variables at xed levels wereillustrated in Fig. 5. Based on the quadratic model, the three-dimensional response surface plots were organized. Theoptimum situations of the relative variables will resemble withthe coordinates of the central point in the upmost level in eachof these gures.
Fig. 5a shows the combined effect of adsorbent and pH onadsorption of AO on ZnS:Cu-NP-AC at constant initial
Fig. 4 The experimental data versus predicted data for removal of AO.
RSC Adv., 2015, 5, 18438–18450 | 18443
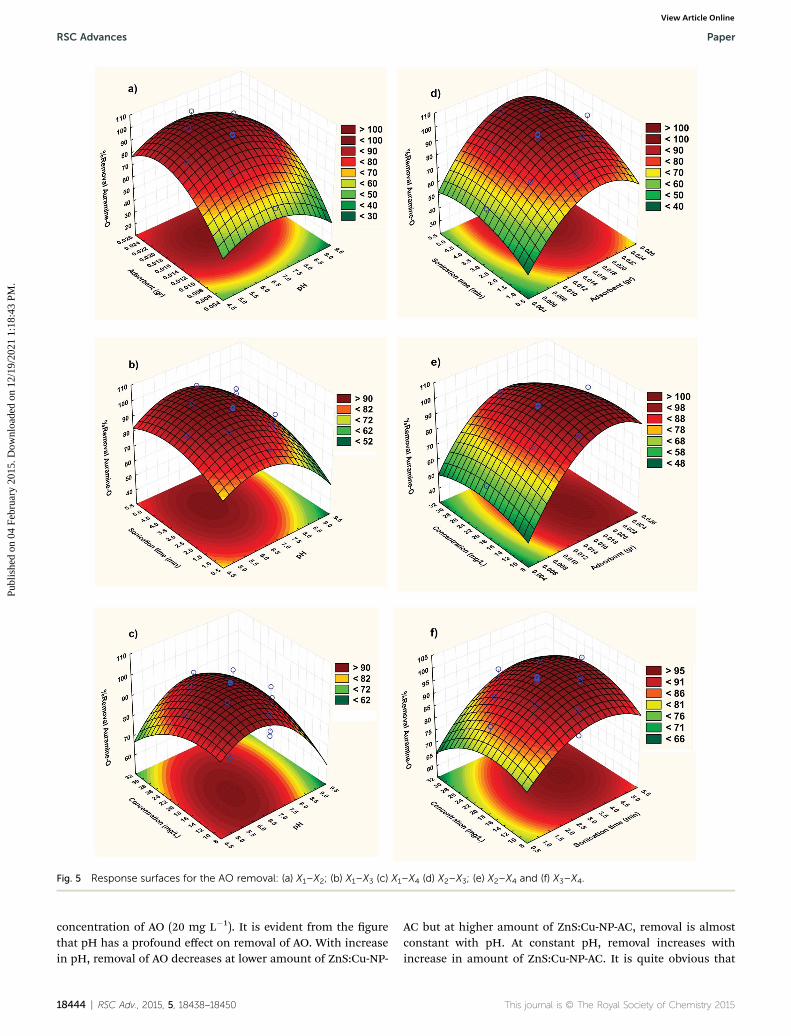
Fig. 5 Response surfaces for the AO removal: (a) X1–X2; (b) X1–X3 (c) X1–X4 (d) X2–X3; (e) X2–X4 and (f) X3–X4.
RSC Advances Paper
Publ
ishe
d on
04
Febr
uary
201
5. D
ownl
oade
d on
12/
19/2
021
1:18
:43
PM.
View Article Online
concentration of AO (20 mg L�1). It is evident from the gurethat pH has a profound effect on removal of AO. With increasein pH, removal of AO decreases at lower amount of ZnS:Cu-NP-
18444 | RSC Adv., 2015, 5, 18438–18450
AC but at higher amount of ZnS:Cu-NP-AC, removal is almostconstant with pH. At constant pH, removal increases withincrease in amount of ZnS:Cu-NP-AC. It is quite obvious that
This journal is © The Royal Society of Chemistry 2015
Paper RSC Advances
Publ
ishe
d on
04
Febr
uary
201
5. D
ownl
oade
d on
12/
19/2
021
1:18
:43
PM.
View Article Online
when amount of adsorbent is high then removal is also highbecause available surface area for adsorption is much more.
Fig. 5b shows response surface plot of the adsorption effi-ciency as dependent on pH and the sonication time. It seemsnecessary to mention the surface charge of ZnS:Cu-NP-AC in thepH area under pHZPC is positive, because of the more H+ in thesolution, and it helps the removal of anionic compounds, but inthe pH area over pHZPC, the ZnS:Cu-NP-AC surface charge isnegative due to the presence of OH� in the solution, and it helpsin the removal of cationic compounds (pH area is considered aspHZPC in spaces, where the catalyst surface charge is zero.). In alow pH, ZnS:Cu-NP-AC has the positive surface charge andadsorbs the compounds with the negative charges like anionicdyes, but when the solution pH is over pHZPC, the oxide surfacegets the negative charge and can make a complex with cationiccompounds. So, according to these considerations, the basicconditions are more ideal for AO dye adsorption because AO dyeis a cationic and cationic dye. In basic pH, adsorption happensalong with the reduction of dye molecules by ZnS:Cu-NP-AC andin basic pH, adsorption may happen through adsorbing the dyemolecules on the ZnS:Cu-NP-AC form.
Fig. 5c shows the three dimensional response surfaces ofthe combined effect of initial concentration and pH onpercentage removal of dye at constant weight of ZnS:Cu-NP-AC(0.02 g). It is evident from the gure that removal of AOdecreases when initial concentration increases. Removalattains its maximum value when pH is low and initialconcentration is also low.
Fig. 5d clearly states that as the adsorbent amount andsonication time increases, the adsorption efficiency improves.It could be explained by the fact that the more amounts ofZnS:Cu-NP-AC cause an increase in the adsorbent surface andthe active surfaces prepare some spaces for capturing AO dyemolecules and increasing these spaces makes the dye get outfaster.
To study the impact of the dye initial concentration on theadsorption efficiency, some experiments with concentrations(5–25 mg L�1) of AO dye and xed sonication time (2 min) andpH (7) were designed and results displayed in Fig. 5e. Theobserved decreases in removal percentage at higher initialarrived from lower ratio of vacant sites to candidate dyesmolecular that compete for binding to the surface. However atsuch situation there are not enough spaces for all molecules inhigh concentration of dye.
The effect of initial AO concentration on its removalpercentage and its inuence on their factors were shown Fig. 5f.It was seen that in despite of the increase in the amount of dyeuptake, its removal efficiency was decreased. At lower dyeconcentrations, the ratio of solute concentrations to vacantreactive adsorbent sites is lower and accelerates dye adsorptionwhich causes an increase in dye removal. At higher concentra-tions, lower adsorption yield is due to the saturation ofadsorption sites. On the other hand, the percentage removal ofdye was higher at lower initial dye concentrations and smaller athigher initial concentrations, which clearly indicate that theadsorption of AO from aqueous solution depend on its initialconcentration.
This journal is © The Royal Society of Chemistry 2015
3.3. Optimization of CCD by DF for extraction procedure
The prole for desirable option with predicted values in theSTATISTICA 10.0 soware was used for the optimization of theprocess (Fig. 6). The prole for desirable responses was chosenaer specifying the DF for each dependent variable (removalpercentage) by assigning predicted values. The scale in therange of 0.0 (undesirable) to 1.0 (very desirable) was used toobtain a global function (D) that its maximum (99.764%) andminimum (60.781%) value concern to JSB adsorption was ach-ieved in this research.
Three solutions with different amounts of ideal conditionswere used to predict the optimum conditions for AO dyeadsorption onto ZnS:Cu-NP-AC (Table 6). The highest removalpercent (99.8) achieved in the experiment number 5, comparedto the other two experiments. Optimum parameters of thereaction are achieved at pH (7), (0.02 g) of ZnS:Cu-NP-AC, 3 minsonication time and initial concentration (20 mg L�l). Therelative deviation coefficient 0.322% concern to RSM experi-mental design show good agreement and high correlationbetween actual and predicted amounts and reveal the suitabilityof empirical model resulted from the design could be used forwell describing the relation between factors and the AO dyeremoval percentage.
3.4. Adsorption equilibrium study
Adsorption properties and equilibrium parameters of eachisotherm model indicate the interaction of adsorbent–adsor-bate and give comprehensive information about the nature ofinteraction.60–65 The widely used isotherm models such asLangmuir, Freundlich, Dubinin and Radushkevich (D–R) andTemkin were used to analyze the experimental equilibrium dataobtained from the sorption process at room temperature overthe concentration range of 5–30 mg L�1.
In the Langmuir isotherm,66 the intermolecular forcesdecrease rapidly with distance and the predicted monolayercoverage of the adsorbate on the outer surface of the adsorbentis represented in linear form as follows:
Ce
qe¼ 1
Qokþ Ce
Qo
(8)
A plot 1/qe versus 1/Ce should represent a line with slope of1/KaQm and 1/Qm intercept of 1/Qm and respective data arepresented in Table 7. The high correlation (R2 > 0.999) coeffi-cient shows that Langmuir isotherms are applicable for theinterpretation of AO adsorption onto ZnS:Cu-NP-AC over thewhole concentration range studies and maximum adsorptioncapacity of 92.26–183.15 mg g�1.
The data was analyzed by the linearized form of Freundlichisotherm model:
ln qe ¼ ln KF þ 1
nln Ce (9)
where qe is the amount of adsorption, KF is the Freundlichconstant related to sorption capacity and 1/n is a constantrelated to energy or intensity of adsorption. This gives an
RSC Adv., 2015, 5, 18438–18450 | 18445
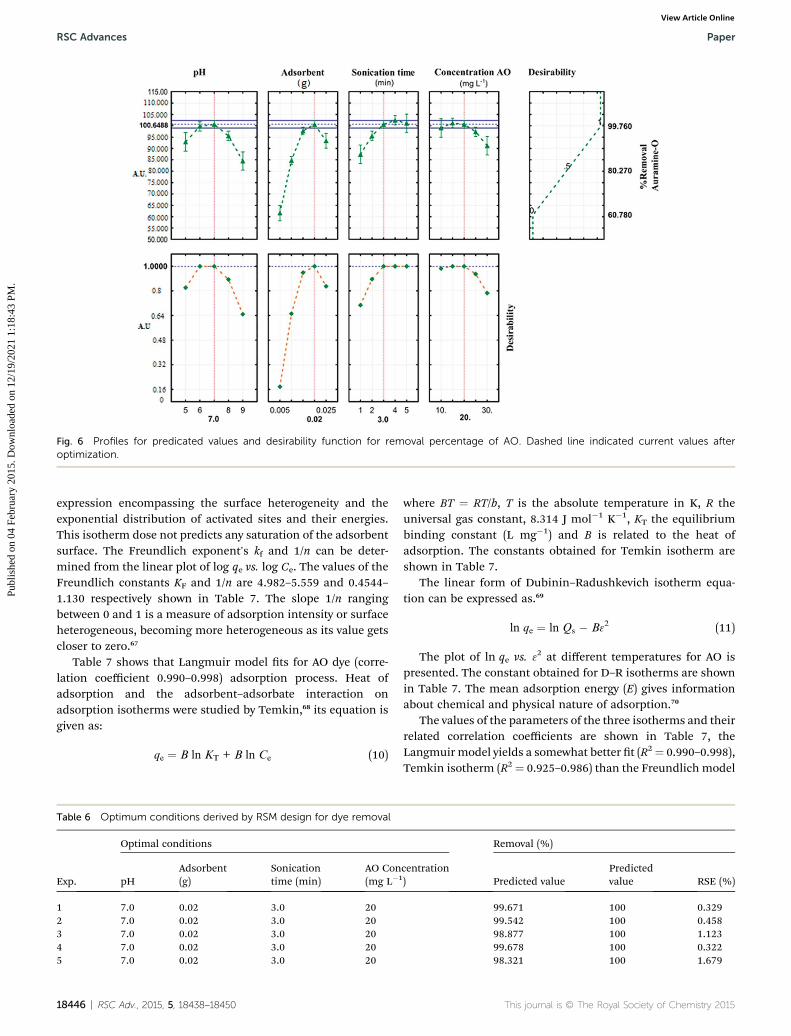
Fig. 6 Profiles for predicated values and desirability function for removal percentage of AO. Dashed line indicated current values afteroptimization.
RSC Advances Paper
Publ
ishe
d on
04
Febr
uary
201
5. D
ownl
oade
d on
12/
19/2
021
1:18
:43
PM.
View Article Online
expression encompassing the surface heterogeneity and theexponential distribution of activated sites and their energies.This isotherm dose not predicts any saturation of the adsorbentsurface. The Freundlich exponent's kf and 1/n can be deter-mined from the linear plot of log qe vs. log Ce. The values of theFreundlich constants KF and 1/n are 4.982–5.559 and 0.4544–1.130 respectively shown in Table 7. The slope 1/n rangingbetween 0 and 1 is a measure of adsorption intensity or surfaceheterogeneous, becoming more heterogeneous as its value getscloser to zero.67
Table 7 shows that Langmuir model ts for AO dye (corre-lation coefficient 0.990–0.998) adsorption process. Heat ofadsorption and the adsorbent–adsorbate interaction onadsorption isotherms were studied by Temkin,68 its equation isgiven as:
qe ¼ B ln KT + B ln Ce (10)
Table 6 Optimum conditions derived by RSM design for dye removal
Exp.
Optimal conditions
pHAdsorbent(g)
Sonicationtime (min)
AO Con(mg L�1
1 7.0 0.02 3.0 202 7.0 0.02 3.0 203 7.0 0.02 3.0 204 7.0 0.02 3.0 205 7.0 0.02 3.0 20
18446 | RSC Adv., 2015, 5, 18438–18450
where BT ¼ RT/b, T is the absolute temperature in K, R theuniversal gas constant, 8.314 J mol�1 K�1, KT the equilibriumbinding constant (L mg�1) and B is related to the heat ofadsorption. The constants obtained for Temkin isotherm areshown in Table 7.
The linear form of Dubinin–Radushkevich isotherm equa-tion can be expressed as.69
ln qe ¼ ln Qs � B32 (11)
The plot of ln qe vs. 32 at different temperatures for AO ispresented. The constant obtained for D–R isotherms are shownin Table 7. The mean adsorption energy (E) gives informationabout chemical and physical nature of adsorption.70
The values of the parameters of the three isotherms and theirrelated correlation coefficients are shown in Table 7, theLangmuir model yields a somewhat better t (R2¼ 0.990–0.998),Temkin isotherm (R2 ¼ 0.925–0.986) than the Freundlich model
Removal (%)
centration) Predicted value
Predictedvalue RSE (%)
99.671 100 0.32999.542 100 0.45898.877 100 1.12399.678 100 0.32298.321 100 1.679
This journal is © The Royal Society of Chemistry 2015
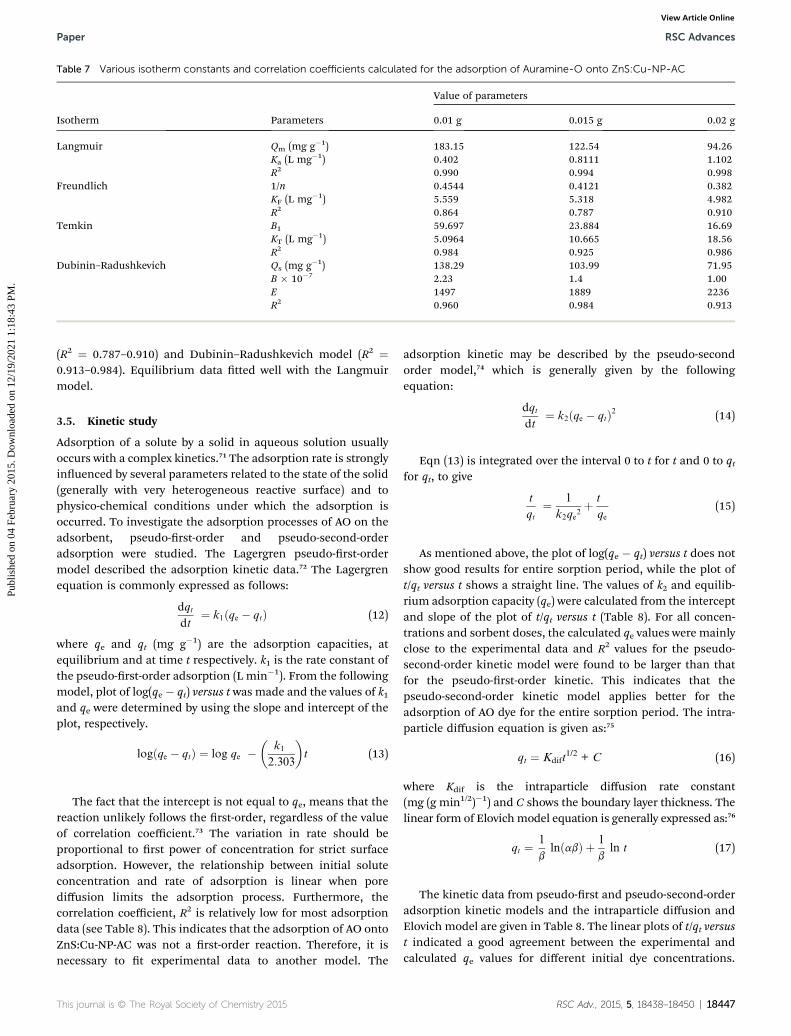
Table 7 Various isotherm constants and correlation coefficients calculated for the adsorption of Auramine-O onto ZnS:Cu-NP-AC
Isotherm Parameters
Value of parameters
0.01 g 0.015 g 0.02 g
Langmuir Qm (mg g�1) 183.15 122.54 94.26Ka (L mg�1) 0.402 0.8111 1.102R2 0.990 0.994 0.998
Freundlich 1/n 0.4544 0.4121 0.382KF (L mg�1) 5.559 5.318 4.982R2 0.864 0.787 0.910
Temkin B1 59.697 23.884 16.69KT (L mg�1) 5.0964 10.665 18.56R2 0.984 0.925 0.986
Dubinin–Radushkevich Qs (mg g�1) 138.29 103.99 71.95B � 10�7 2.23 1.4 1.00E 1497 1889 2236R2 0.960 0.984 0.913
Paper RSC Advances
Publ
ishe
d on
04
Febr
uary
201
5. D
ownl
oade
d on
12/
19/2
021
1:18
:43
PM.
View Article Online
(R2 ¼ 0.787–0.910) and Dubinin–Radushkevich model (R2 ¼0.913–0.984). Equilibrium data tted well with the Langmuirmodel.
3.5. Kinetic study
Adsorption of a solute by a solid in aqueous solution usuallyoccurs with a complex kinetics.71 The adsorption rate is stronglyinuenced by several parameters related to the state of the solid(generally with very heterogeneous reactive surface) and tophysico-chemical conditions under which the adsorption isoccurred. To investigate the adsorption processes of AO on theadsorbent, pseudo-rst-order and pseudo-second-orderadsorption were studied. The Lagergren pseudo-rst-ordermodel described the adsorption kinetic data.72 The Lagergrenequation is commonly expressed as follows:
dqt
dt¼ k1ðqe � qtÞ (12)
where qe and qt (mg g�1) are the adsorption capacities, atequilibrium and at time t respectively. k1 is the rate constant ofthe pseudo-rst-order adsorption (L min�1). From the followingmodel, plot of log(qe � qt) versus t was made and the values of k1and qe were determined by using the slope and intercept of theplot, respectively.
logðqe � qtÞ ¼ log qe ��
k1
2:303
�t (13)
The fact that the intercept is not equal to qe, means that thereaction unlikely follows the rst-order, regardless of the valueof correlation coefficient.73 The variation in rate should beproportional to rst power of concentration for strict surfaceadsorption. However, the relationship between initial soluteconcentration and rate of adsorption is linear when porediffusion limits the adsorption process. Furthermore, thecorrelation coefficient, R2 is relatively low for most adsorptiondata (see Table 8). This indicates that the adsorption of AO ontoZnS:Cu-NP-AC was not a rst-order reaction. Therefore, it isnecessary to t experimental data to another model. The
This journal is © The Royal Society of Chemistry 2015
adsorption kinetic may be described by the pseudo-secondorder model,74 which is generally given by the followingequation:
dqt
dt¼ k2ðqe � qtÞ2 (14)
Eqn (13) is integrated over the interval 0 to t for t and 0 to qtfor qt, to give
t
qt¼ 1
k2qe2þ t
qe(15)
As mentioned above, the plot of log(qe � qt) versus t does notshow good results for entire sorption period, while the plot oft/qt versus t shows a straight line. The values of k2 and equilib-rium adsorption capacity (qe) were calculated from the interceptand slope of the plot of t/qt versus t (Table 8). For all concen-trations and sorbent doses, the calculated qe values were mainlyclose to the experimental data and R2 values for the pseudo-second-order kinetic model were found to be larger than thatfor the pseudo-rst-order kinetic. This indicates that thepseudo-second-order kinetic model applies better for theadsorption of AO dye for the entire sorption period. The intra-particle diffusion equation is given as:75
qt ¼ Kdift1/2 + C (16)
where Kdif is the intraparticle diffusion rate constant(mg (g min1/2)�1) and C shows the boundary layer thickness. Thelinear form of Elovich model equation is generally expressed as:76
qt ¼ 1
blnðabÞ þ 1
bln t (17)
The kinetic data from pseudo-rst and pseudo-second-orderadsorption kinetic models and the intraparticle diffusion andElovich model are given in Table 8. The linear plots of t/qt versust indicated a good agreement between the experimental andcalculated qe values for different initial dye concentrations.
RSC Adv., 2015, 5, 18438–18450 | 18447

Table 8 Kinetic parameters for the adsorption of Auramine-O onto ZnS:Cu-NP-AC adsorbents
Model Parameters
Value of parameters
0.01 (g) 0.02 (g)
10 (mg L�1) 20 (mg L�1) 30 (mg L�1) 10 (mg L�1) 20 (mg L�1) 30 (mg L�1)
First-order kinetic k1 (min�1) 0.0145 0.0131 0.0175 0.016 0.0135 0.024qe(calc) (mg g�1) 3.907 5.844 8.385 7.23 11.716 25.14R2 0.969 0.983 0.922 0.972 0.863 0.965
Pseudo-second-order kinetic k2 (min�1) 0.001 0.0003 0.00018 0.004 0.0021 0.002qe(calc) (mg g�1) 49.75 102.04 147.06 25.12 48.309 65.56R2 0.999 0.998 0.997 0.999 0.999 0.999
Intraparticle diffusion Kdiff (mg g�1 min�1/2) 1.363 2.958 4.822 0.372 0.758 0.484C (mg g�1) 28.883 44.77 52.579 18.62 34.935 59.12R2 0.904 0.960 0.936 0.817 0.730 0.832
Elovich b (g mg�1) 0.159 0.0804 0.0545 0.475 0.544 0.382a (mg g�1 min�1) 42.42 84.93 85.77 95.6 2899 28976R2 0.976 0.976 0.957 0.923 0.940 0.930qe(exp) (mg g�1) 46.978 92.64 129.53 24.39 46.597 66.14
RSC Advances Paper
Publ
ishe
d on
04
Febr
uary
201
5. D
ownl
oade
d on
12/
19/2
021
1:18
:43
PM.
View Article Online
Furthermore, the correlation coefficients of the pseudo-second-order kinetic model (R2 $ 0.999) were greater than that of thepseudo-rst-order model (R2 # 0.983). As a result, it can be saidthat the adsorption ts to the pseudo-second-order better thanthe pseudo-rst-order kinetic model.
3.6. Comparison with other methods
The ZnS:Cu-NP-AC prepared in this work had a relatively largeadsorption capacity on AO compared to some other adsorbentsreported in the literature, primarily when ZnS:Cu loaded on AC,it lead to rapid decrease in contact time parameter, it is reportedthat time taken by activated carbon is about 120 minutes,77 timetaken by graphite loaded with titania is about 300 minutes,78
but when AC loaded with ZnS:Cu nanoparticle time taken by theadsorbent rapidly decrease and it takes nearly 3 minutes toadsorb the maximum amount of Auramine-O. Secondly themaximum amount of the adsorbate adsorbed on the adsorbentalso increases form 1.509 mg g�1 (for AC) it becomes 94.26 mgg�1 (for ZnS:Cu nanoparticles loaded on AC).
Table 9 lists the comparison of maximum monolayeradsorption capacity of AO on various adsorbents. The adsorp-tion capacity and contact time for proposed method in
Table 9 Comparison for the removal of Auramine-O by different metho
Adsorbent Adsorbent dosage (g) D
Bagasse y ash (BFA) 0.001 AActivated carbon-commercial grade(ACC)
0.020 A
Activated carbon-laboratory grade (ACL) 0.002 AGraphite loaded with titania 0.050 AAg-NPs-AC 8 MAg-NPs-AC 8 CAu-NPs-AC 10 CZnS:Cu-NP-AC 0.020 A
18448 | RSC Adv., 2015, 5, 18438–18450
comparison with all of the adsorbents are preferable andsuperior to the literature which shows satisfactory removalperformance for AO as compared to other reported adsor-bents.77–80 The results indicated that the ultrasound assistedremoval method has a remarkable ability to improve theremoval efficiency of dyes. The ultrasonic-assisted enhance-ment of removal could be attributed to the high-pressure shockwaves and high-speed microjets during the violent collapse ofcavitation bubbles.81,82
4. Conclusion
The results of the present studies showed that ZnS:Cu-NP-ACprepared by synthesis method was an efficient adsorbent forthe Auramine-O removal. The use of response surface meth-odology involving central composite design for optimization ofprocess parameters was studied. Experiments were performedas a function of initial pH, dye concentration, sonication timeand absorbent dosage, these factors are well studied and opti-mized. The optimized values, at which the highest removalpercent (99.76%) was attained, are achieved: pH ¼ 7, initialconcentration dye (20 mg L�1), sonication time (3 min) and
ds and adsorbents
ye Concentration (mg L�1) Contact time (min) References
O 10 30–240 77O 10 120–240 77
O 10 120–240 77O 50 300 78B 2 16 79R 2 6 80R 2 5 80O 20 3 Proposed
method
This journal is © The Royal Society of Chemistry 2015
Paper RSC Advances
Publ
ishe
d on
04
Febr
uary
201
5. D
ownl
oade
d on
12/
19/2
021
1:18
:43
PM.
View Article Online
adsorbent amount (0.02 g). In the present study, the analyticalutility of experimental design for evaluation of optimumcondition for the removal of AO in aqueous solution by ZnS:Cu-NP-AC coupled with ultrasound assisted adsorptionmethod hasbeen investigated. The equilibrium and kinetic studies wereinvestigated for the adsorption process. The isotherm modelssuch as Langmuir, Freundlich, Temkin, and Dubinin–Radush-kevich were evaluated and the equilibrium data were bestdescribed by the Langmuir model. The high correlation (R2 >0.999) coefficient shows that Langmuir isotherms are applicablefor the interpretation of AO adsorption onto ZnS:Cu-NP-AC overthe whole concentration range studies and maximum adsorp-tion capacity of 92.26–183.15 mg g�1. The process kinetics canbe successfully tted to the pseudo-second-order kinetic model.
Acknowledgements
The authors express their appreciation to the Graduate Schooland Research Council of the University of Yasouj for nancialsupport of this work.
References
1 H. M. Pignon, C. F. Brasquet and P. L. Cloirec, Sep. Purif.Technol., 2003, 31, 3–11.
2 O. Tunc, H. Tanac and Z. Aksu, J. Hazard. Mater., 2009, 163,187–198.
3 S. Dutta, A. Bhattacharyya, A. Ganguly, S. Gupta and S. Basu,Desalination, 2011, 275, 26–36.
4 A. Martelli, G. B. Campart, R. Canonero, R. Carrozzino,F. Mattioli, L. Robbiano and M. Cavanna, Mutat. Res.,1998, 414, 37–47.
5 ARC, Monographs on the Evaluation of Carcinogenic Risk toHumans, Supplement 7: Overall Evaluations ofCarcinogenicity: an Updating of IARC Monographs,International Agency for Research on Cancer, Lyon, France,1987, vol. 1–42, pp. 118–119.
6 A. Dabrowski, Adv. Colloid Interface Sci., 2001, 93, 135–224.7 O. Tunay, I. Kabdasli, G. Eremektar and D. Orhon,Water Sci.Technol., 1996, 34, 9–16.
8 E. Forgacs, T. Cserhat and G. Oros, Environ. Int., 2004, 30,953–971.
9 K. Wu, Y. X. J. Zhao and H. Hidaka, J. Mol. Catal. A: Chem.,1999, 144, 77–86.
10 E. Kusvuran, O. Gulnaz, S. Irmak, O. M. Atanur, H. I. Yavuzand O. Erbatur, J. Hazard. Mater., 2004, 109, 85–93.
11 T. Robinson, G. McMullan, R. Marchant and P. Nigam,Bioresour. Technol., 2001, 77, 247–255.
12 M. Ghaedi, A. G. Nasab, S. Khodadoust, M. Rajabi andS. Azizian, J. Ind. Eng. Chem., 2014, 20, 2317–2324.
13 H. Mahmoodian, O. Moradi, B. Shariatzadeha, T. A. Saleh,I. Tyagi, A. Maity, M. Asif and V. K. Gupta, J. Mol. Liq.,2014, 202, 189–198.
14 B. J. Sanghavi, S. Sitaula, M. H. Griep, S. P. Karna, M. F. Aliand N. S. Swami, Anal. Chem., 2013, 85, 8158–8165.
15 V. K. Gupta, R. Prasad, R. Mangla and P. Kumar, Anal. Chim.Acta, 2009, 420, 19–27.
This journal is © The Royal Society of Chemistry 2015
16 B. J. Sanghavi, W. Varhue, J. L. Chavez, C. F. Chou andN. S. Swami, Anal. Chem., 2014, 86, 4120–4125.
17 R. N. Goal, V. K. Gupta and S. Chatterjee, Talanta, 2008, 76,662–668.
18 B. J. Sanghavi, O. S. Woleis, T. Hirsch and N. S. Swami,Microchim. Acta, 2015, 182, 1–41.
19 S. Wang, C. W. Ng, W. Wang, Q. Li and L. Li, J. Chem. Eng.Data, 2012, 57, 1563–1569.
20 T. A. Saleh and V. K. Gupta, Environ. Sci. Pollut. Res., 2012, 19,1224–1228.
21 V. K. Gupta, S. Agarwal and T. A. Saleh, J. Hazard. Mater.,2011, 185, 17–23.
22 H. Khani, M. K. Rofouei, P. Arab, V. K. Gupta and Z. Vafaei, J.Hazard. Mater., 2010, 183, 402–409.
23 T. A. Saleh and V. K. Gupta, J. Colloid Interface Sci., 2012, 371,101–106.
24 A. R. Dinçer, Y. Gunes, N. Karakaya and E. Gunes, Bioresour.Technol., 2007, 98, 834–839.
25 T. E. Kose, H. Demiral and N. Ozturk, Desalin. Water Treat.,2011, 29, 110–118.
26 P. Janos, H. Buchtova and M. Ryznarova, Water Res., 2003,37, 4938–4944.
27 G. McKay, H. S. Blair and J. R. Gardner, J. Appl. Polym. Sci.,1982, 27, 3043–3057.
28 S. K. Alpat, O. Ozbayrak, S. Alpat and H. Akçay, J. Hazard.Mater., 2008, 151, 213–220.
29 G. Crini, Dyes Pigm., 2008, 77, 415–426.30 I. Ali and V. K. Gupta, Advance in water treatment by
adsorption technology, Nat. Protoc., 2006, 1, 2661–2667.31 V. K. Gupta, A. K. Singh, M. Al Khayat and B. Gupta, Anal.
Chim. Acta, 2007, 590, 81–90.32 I. Ali, Chem. Rev., 2012, 112, 5073–5091.33 R. Jain, V. K. Gupta, N. Jadon and K. Radhapyari, Anal.
Biochem., 2010, 407, 79–88.34 I. Ali, Sep. Purif. Rev., 2014, 43, 175–2015.35 V. K. Gupta, A. Mittal and J. Mittal, J. Colloid Interface Sci.,
2010, 344, 497–507.36 V. K. Gupta, S. K. Srivastava, D. Mohan and S. Sharma,Waste
Manage., 1998, 17, 517–522.37 V. K. Gupta, A. Mittal and J. Mittal, J. Colloid Interface Sci.,
2010, 342, 518–527.38 V. K. Gupta, A. Mittal, D. Kaur, A. Malviya and J. Mittal, J.
Colloid Interface Sci., 2009, 337, 345–354.39 V. K. Gupta, I. Ali, T. A. Saleh, A. Nayak and S. Agarwal, RSC
Adv., 2012, 2, 6380–6388.40 A. Mittal, A. Malviya, J. Mittal and V. K. Gupta, J. Colloid
Interface Sci., 2009, 340, 16–26.41 P. J. M. Carrott, Suhas, M. M. L. Ribeiro Carrott,
C. I. Guerrero and L. A. Delgado, J. Anal. Appl. Pyrolysis,2008, 82, 264–271.
42 Suhas, P. J. M. Carrott and M. M. L. Ribeiro Carrott, Carbon,2009, 47, 1012–1017.
43 B. C. Oei, S. Ibrahim, S. Wang and H. M. Ang, Bioresour.Technol., 2009, 100, 4292–4295.
44 Y. Yao, S. Miao, S. Liu, L. P. Ma, H. Sun and S. Wang, Chem.Eng. J., 2012, 184, 326–332.
RSC Adv., 2015, 5, 18438–18450 | 18449
RSC Advances Paper
Publ
ishe
d on
04
Febr
uary
201
5. D
ownl
oade
d on
12/
19/2
021
1:18
:43
PM.
View Article Online
45 V. K. Gupta, R. Jain, A. Mittal, S. Agarwal and S. Sikarwar,Mater. Sci. Eng C., 2012, 32, 12–17.
46 V. K. Gupta and A. Nayak, Chem. Eng. J., 2012, 180, 81–90.47 V. K. Gupta, R. Jain, S. Agarwal and M. Shrivastava, Mater.
Sci. Eng C., 2011, 31, 1062–1067.48 P. Bradder, S. K. Ling, S. Wang, S. Liu and J. Chem, Eng. Data,
2011, 56, 138–141.49 A. Shamsizadeh, M. Ghaedi, A. Ansari, S. Azizian and
M. K. Purkait, J. Mol. Liq., 2014, 195, 212–218.50 Y. Liu, Colloids Surf., A, 2006, 274, 34–36.51 M. Ravanan, M. Ghaedi, A. Ansari, F. Taghizadeh and
D. Elhamifar, Spectrochim. Acta, Part A, 2014, 123, 467–472.52 J. R. Utrilla, I. B. Toledo, M. A. F. Garcy and C. Moreno, J.
Chem. Technol. Biotechnol., 2001, 76, 1209–1215.53 A. Omri and M. Benzina, Alexandria Eng. J., 2012, 51, 343–
350.54 Y. G. Zhao, H. Y. Shen, S. D. Pan, M. Q. Hu and Q. H. Xia, J.
Mater. Sci., 2010, 45(19), 5291–5301.55 L. Wang, J. Li, Q. Jiang and L. Zhao, Dalton Trans., 2012,
41(15), 4544–4551.56 V. Gunaraj and N. Murugan, J. Mater. Process. Technol., 1999,
88, 266–275.57 A. R. Khataee, M. Zarei, M. Fathinia and M. Khobnasab
Jafari, Desalination, 2011, 268, 126–133.58 A. Goudarzi, G. Motedayen Aval, R. Sahraei and
H. Ahmadpoor, Thin Solid Films, 2008, 516, 4953–4957.59 S. D. Sartale, B. R. Sankapal, M. L. Steiner and A. Ennaui,
Thin Solid Films, 2005, 480, 168–172.60 R. Liu, B. Zhang, D. Mei, H. Zhang and J. Liu, Desalination,
2011, 268, 111–116.61 N. Kannan andM.M. Sundaram, Dyes Pigm., 2001, 51, 25–40.62 I. Langmuir, J. Am. Chem. Soc., 1916, 38, 2221–2295.63 A. Asfaram, M. R. Fathi, S. Khodadoust and M. Naraki,
Spectrochim. Acta, Part A, 2014, 127, 415–421.
18450 | RSC Adv., 2015, 5, 18438–18450
64 M. Ghaedi, M. Pakniat, Z. Mahmoudi, S. Hajati, R. Sahraeiand A. Daneshfar, Spectrochim. Acta, Part A, 2014, 123, 402–409.
65 A. Mittal, D. Kaur and J. Mittal, J. Colloid Interface Sci., 2008,326, 8–17.
66 M. Ghaedi, H. Tavallali, M. Shari, S. Nasiri Kokhdan andA. Asghari, Spectrochim. Acta, Part A, 2011, 86, 107–114.
67 F. Haghseresht and G. Lu, Energy Fuels, 1998, 12, 1100–1107.68 M. J. Temkin and V. Pyzhev, Acta Physicochim. URSS, 1940,
12, 217–222.69 M. M. Dubinin and L. V. Radushkevich, Chem. Zentralbl.,
1947, 1, 875–889.70 G. Renmin, S. Yingzhi, C. Jian, L. Huijun and y. Chao, Dyes
Pigm., 2005, 67, 175–181.71 M. J. Culzoni, A. V. Schenone, N. E. Llamas, M. Garrido,
et al., J. Chromatogr. A, 2009, 1216, 7063–7070.72 R. S. Juang, F. C. Wu and R. L. Tseng, Environ. Technol., 1997,
18, 525–531.73 T. Robinson, G. McMullan, R. Marchant and P. Nigam,
Bioresour. Technol., 2001, 77, 247–255.74 M. R. Fathi, A. Asfaram and A. Farhangi, Spectrochim. Acta,
Part A, 2015, 135, 364–372.75 W. J. Weber Jr and J. C. Morris, J. Sanit. Eng. Div., Am. Soc.
Civ. Eng., 1963, 89, 31–59.76 Y. S. Ho and G. McKay, Biochemistry, 1999, 34, 451–465.77 I. D. Mall, V. C. Srivastava and N. K. Agarwal, J. Hazard.
Mater., 2007, 143, 386–395.78 X.-Y. Pang, Eur. J. Chem., 2011, 8(4), 1644–1653.79 J. Pal and M. K. Deb, Appl. Nanosci., 2014, 4, 967–978.80 J. Pal, M. K. Deb, D. K. Deshmukh and D. Verma, Appl. Water
Sci., 2013, 3, 367–374.81 S. R. Shirsath, D. V. Pinjari, P. R. Gogate, S. H. Sonawane and
A. B. Pandit, Ultrason. Sonochem., 2013, 20, 277–286.82 P. R. Gogate, V. S. Sutkar and A. B. Pandit, Chem. Eng. J.,
2011, 166, 1066–1082.
This journal is © The Royal Society of Chemistry 2015