removal of hexavalent chromium in wastewater using...
TRANSCRIPT
Removal of hexavalent chromium in wastewater using granular ferric
hydroxides
Projektarbete i miljö- och vattenteknik, 15 hp
Sandra Levin, Jessica Lovell
2015-06-20
ii
Abstract
This study took place in Malawi, south eastern Africa. Metal contamination of water and soil is a
threat to the environment and human health and is a serious concern in many countries
including Malawi. Blantyre is the city of commerce where most of the industry is located along
the banks of the main rivers. Some of the industries produce wastewater, which due to poor
access to wastewater treatment plants, is discharged without treatment into the environment. A
match factory in Blantyre uses chromium as a colouring agent for match heads and very high
concentrations of chromium(VI) have been measured downstream the factory with
concentrations up to 56 mg/l, which is much higher than the WHO guidelines of 0.05 mg/l.
Chromium(VI) mainly occurs as chromate CrO42- and dichromate Cr2O72- ions. They are both
toxic and carcinogenic and can cause mutations and chromosomal aberrations.
The aim of the study was to evaluate the efficiency of Granular Ferric Hydroxide (GFH) in
adsorbing and removing chromium from an aqueous phase. Wastewater was collected from the
match factory and by optimizing relevant parameters the removal efficiency was maximized.
The parameters optimized were pH, dosage and contact time and the effect of initial
concentration. After respective experiment, all samples were analysed for chromium using
microwave plasma atomic emission spectroscopy (MP-AES).
The optimum pH was chosen to 8.0, the dosage to 17.4 g GFH/l and the contact time to 2 hours
for a 95% removal of total chromium in undiluted wastewater. The removal efficiency of the
GFH was 2.84 mg Cr/g GFH. To implement wastewater purification with GFH a number of
practical issues have to be taken into consideration. Above all, a sufficient stirring method has to
be devised as the removal efficiency is much affected by improper stirring.
Keywords: granular ferric hydroxides (GFH), chromium(VI), microwave plasma atomic emission
spectroscopy (MP-AES), heavy metal contamination, waste water treatment, adsorption, Malawi,
Department of Chemistry and Biotechnology, Swedish University of Agricultural Sciences (SLU).
Almas allé 5, SE 756-51 Uppsala
Department of Chemistry, Chancellor College, P.O. Box 280, Zomba, Malawi

iii
Sammanfattning
Denna studie genomfördes i Malawi, sydöstra Afrika. Metallföroreningar i vatten och mark är ett
stort problem i många länder, inklusive Malawi. Landets centrum för industri och handel ligger i
Blantyre där de flesta av industrierna ligger längs med floderna. En del industrier genererar
utsläppsvatten och på grund av dålig tillgång till vattenreningsteknik och
vattenreningsanläggningar släpps mycket av det förorenade vattnet obehandlat ut i naturen. En
tändsticksfabrik i Blantyre använder kromsalter för att färga tändstickshuvudena röda och höga
koncentrationer av sexvärt krom har uppmätts nedströms fabriken. De uppmätta
koncentrationerna var upp till 56 mg/l vilket är betydligt högre än WHO:s riktvärde på 0,05
mg/l. Sexvärt krom förekommer som kromat CrO42- och dikromat Cr2O72- joner vilka båda är
mycket toxiska och cancerframkallande och därmed ett hot mot miljö och människor.
Syftet med studien var att undersöka om granulära järnoxider (GFH) kunde användas som en
adsorbent för att rena utsläppsvatten från kromater. Utsläppsvatten hämtades från
tändsticksfabriken och genom att optimera relevanta parametrar kunde GFHns
adsorbtionseffektivitet maximeras. Parametrarna som optimerades var pH, dos, kontakttid och
initialkoncentration. Efter respektive experiment mättes kromkoncentrationen med
mikrovågsplasma atomemissionsspektroskopi (MP-AES)
Det optimala pH-värdet valdes till 8.0, dosen till 17.4 g GFH/l med en kontakttid på 2 timmar för
en 95.3% reningsgrad på outspätt utsläppsvatten. Adsorptionseffektiviteten på GFHn var 2.84
mg Cr/g GFH. För att implementera vattenrening med GFH behöver flera praktiska aspekter tas
med i beaktning. Framförallt är det viktigt med en bra omrörning för att GFHn ska kunna
adsorbera effektivt.
Nyckelord: granular ferric hydroxides (GFH), krom(VI), mikrovågsplasma
atomemissionsspektroskopi (MP-AES), tungmetaller, adsorption, avloppsvattenrening, Malawi
Institutionen för kemi och bioteknologi Sveriges lantbruksuniversitet (SLU). Almas allé 5,
SE 756-51 Uppsala
Department of Chemistry, Chancellor College, P.O. Box 280, Zomba, Malawi

iv
Preface
This report was made possible through a scholarship from the Swedish International
Development Cooperation Agency (SIDA) to do a minor field study (MFS) in a developing
country. The scholarship was distributed through the Swedish University of Agricultural
Sciences (SLU). The study was performed in Zomba, Malawi from the beginning of June to the
end of July in 2013. The experimental work took place at the Chancellor College Department of
Chemistry, thanks to a long term collaboration between Chancellor College and SLU.
The MFS will be included in our Master degree in Environmental and Water Engineering as a 15
credit course.
Acknowledgements
Both this study and our time in Malawi has been a wonderful and enriching experience from day
one and until we left Zomba and Malawi eight weeks later. Being able to carry out a study like
this has been a dream for both of us. Thanks to a number of helpful people we have been able to
perform this study. We therefore want to express our gratitude to (in no particular order):
The Swedish International Development Agency (SIDA) for funding this study through
International Students Office at the Swedish University of Agricultural Sciences in
Uppsala.
Professor Ingmar Persson at the Department of Chemistry, Swedish University of Agricultural Sciences in Uppsala for acting as our supervisor, introducing us to our
Malawian contacts and supporting us throughout the study.
Johan Mähler, Swedish University of Agricultural Sciences, Department of Chemistry, for
practical advice regarding Granular Ferric Hydroxide.
Dr. Jonas Mwatseteza, our supervisor in Malawi, for your time and support, for providing
new perspectives on our results and lots of valuable advice.
Dr. Samson Sajidu, for acting as a bonus-supervisor to us, lending an ear when needed and providing useful advice on our lab-work.
Lab-technician C.M.H Kayira for helping us to get started in the lab and for helping and giving good advice in lab-related matters.
Instrument technician Idriss Mtewa, for your time and patience and invaluable help with
the MP-AES.
Thimothy Mguntha and Upile Chitete, for helping us out with practicalities in the lab when needed.
And a big thank you to all other staff members at the Department of Chemistry,
Chancellor College in Zomba for your hospitality, help and time.
Thank you all for making this possible, and for making our stay memorable.
Jessica Lovell and Sandra Levin

v
Contents
Abstract ............................................................................................................................................................... ii
Sammanfattning ............................................................................................................................................. iii
Preface ................................................................................................................................................................ iv
Acknowledgements ........................................................................................................................................ iv
Contents ............................................................................................................................................................... v
1 Introduction .............................................................................................................................................. 1
2 Background ............................................................................................................................................... 2
3 Theory ......................................................................................................................................................... 2
3.1 Chromium ................................................................................................................................ 2
3.2 Adsorption ............................................................................................................................... 3
3.3 Granular Ferric Hydroxides (GFH) ........................................................................................... 4
3.4 Microwave plasma – atomic emission spectroscopy (MP-AES) .............................................. 5
4 Materials and methods .......................................................................................................................... 6
4.1 Preparation of waste water samples....................................................................................... 7
4.2 Optimization of pH .................................................................................................................. 7
4.2.1 Change of chromium concentration by adjusting pH ..................................................... 7
4.2.2 Optimization of pH for chromium removal using GFH .................................................... 7
4.3 Optimization of dosage ........................................................................................................... 7
4.4 Optimization of contact time .................................................................................................. 7
4.5 Effect of initial concentration .................................................................................................. 7
4.6 Effect of optimized parameters on standard chromium solutions ......................................... 8
4.7 Test of optimized parameters on undiluted filtered wastewater ........................................... 8
4.8 Test for iron in treated wastewater ........................................................................................ 8
5 Results ......................................................................................................................................................... 8
5.1 Change of chromium concentration by adjusting pH ............................................................. 8
5.2 Optimization of pH .................................................................................................................. 8
5.3 Optimization of dosage ......................................................................................................... 10
5.4 Optimization of contact time ................................................................................................ 11
5.5 Effect of optimized parameters on standard chromium solutions ....................................... 12
5.6 Effect of initial concentration ................................................................................................ 12
5.7 Dosage optimization on undiluted wastewater .................................................................... 13
5.8 Test for iron in treated wastewater ...................................................................................... 14
6 Discussion ............................................................................................................................................... 14
vi
6.1 Experiments ........................................................................................................................... 14
6.2 Practical challenges and future perspectives ........................................................................ 15
Conclusions ..................................................................................................................................................... 16
7 References .............................................................................................................................................. 17
8 Appendices ............................................................................................................................................. 18
A.1 Optimization of wastewater pH .................................................................................................. 18
A2. Optimization of pH, range 5.5-10.0 .......................................................................................... 19
A3. Optimization of dosage at pH 8.0 ............................................................................................. 20
A4. Optimization of contact time at pH 8.0 .................................................................................... 21
A5. Effect of initial concentration...................................................................................................... 22
A6. Effect of optimized parameters on standard chromium solutions........................................ 23
A.7 Averages of chromium removal at pH 4.0 and pH 8.0 ............................................................ 23

vii
List of figures
Figure 1. Political map of Malawi ................................................................................................................................ 1
Figure 2. Eh-pH diagram of chromium in aqueous solutions .......................................................................... 3
Figure 3. Surface charges of ferric oxide with a phosphate ion ...................................................................... 4
Figure 4. Phosphate ion binding to surface of ferric oxide ............................................................................... 4
Figure 5. Inner-sphere and outer-sphere complexes. Modified from .......................................................... 4
Figure 6. Illustration of MP-AES. .................................................................................................................................. 6
Figure 7. pH 2.0- 6.8 Effect of changing pH only and average percent removal of total chromium.
Dosage of GFH: 0.25g/L ................................................................................................................................................... 9
Figure 8. pH 5.5- 10.0 Effect of changing pH only and average percent removal of total
chromium. Dosage of GFH: 0,25g/L ........................................................................................................................... 9
Figure 9. Percent removal as a function of GFH-dosage at pH 8.0 .............................................................. 10
Figure 10. Efficiency of adsorption as a function of dosage .......................................................................... 11
Figure 11. Average percent removal as a function of contact time ............................................................ 11
Figure 12. Adsorption of chromium as a function of initial concentration (dilution). ....................... 12
Figure 13. Percent removal as a function of dosage ......................................................................................... 13
Figure 14. Efficiency of adsorption as a function of dosage .......................................................................... 13
List of tables
Table 1. Properties of GFH produced by GEH Wasserchemie GmbH & Co. KG ................................. 5
Table 2. Average adsorption of chromium per gram GFH ............................................................... 10
Table 3. Average adsorption of chromium per gram GFH ................................................................ 12
Table 4. Comparison with starndard solutions using optimized parameters ................................ 12
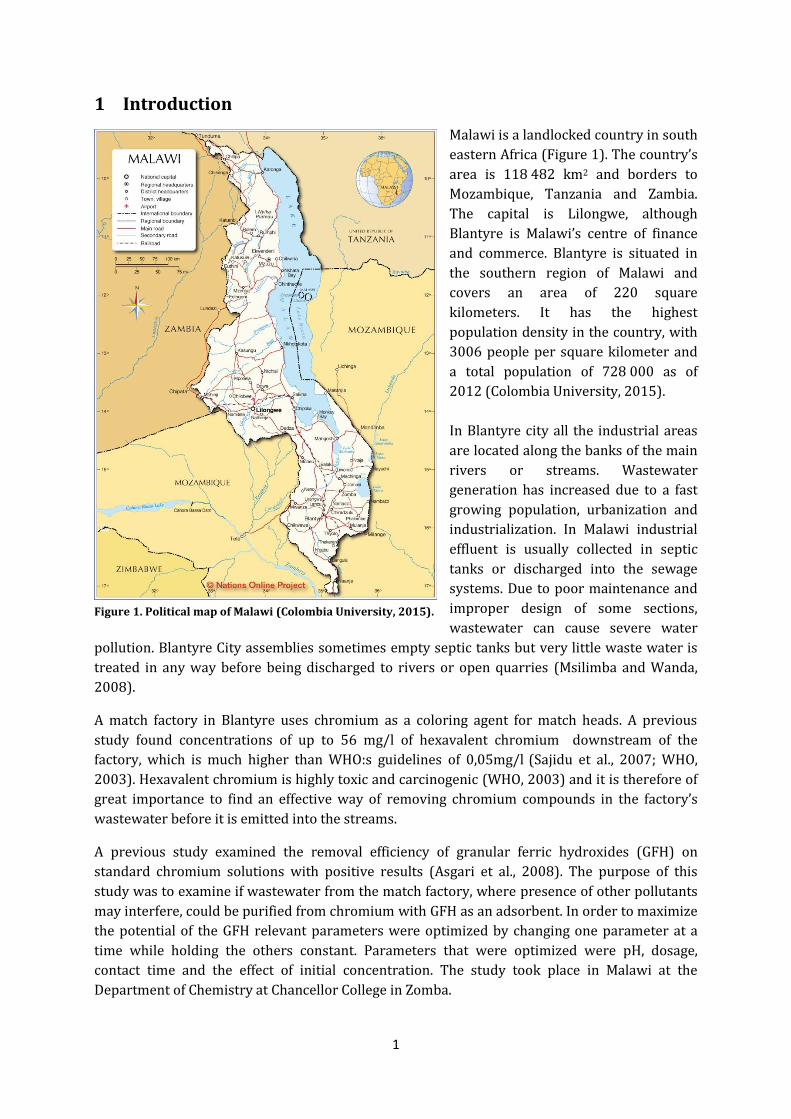
1
1 Introduction
Malawi is a landlocked country in south
eastern Africa (Figure 1). The country’s
area is 118 482 km2 and borders to
Mozambique, Tanzania and Zambia.
The capital is Lilongwe, although
Blantyre is Malawi’s centre of finance
and commerce. Blantyre is situated in
the southern region of Malawi and
covers an area of 220 square
kilometers. It has the highest
population density in the country, with
3006 people per square kilometer and
a total population of 728 000 as of
2012 (Colombia University, 2015).
In Blantyre city all the industrial areas
are located along the banks of the main
rivers or streams. Wastewater
generation has increased due to a fast
growing population, urbanization and
industrialization. In Malawi industrial
effluent is usually collected in septic
tanks or discharged into the sewage
systems. Due to poor maintenance and
improper design of some sections,
wastewater can cause severe water
pollution. Blantyre City assemblies sometimes empty septic tanks but very little waste water is
treated in any way before being discharged to rivers or open quarries (Msilimba and Wanda,
2008).
A match factory in Blantyre uses chromium as a coloring agent for match heads. A previous
study found concentrations of up to 56 mg/l of hexavalent chromium downstream of the
factory, which is much higher than WHO:s guidelines of 0,05mg/l (Sajidu et al., 2007; WHO,
2003). Hexavalent chromium is highly toxic and carcinogenic (WHO, 2003) and it is therefore of
great importance to find an effective way of removing chromium compounds in the factory’s
wastewater before it is emitted into the streams.
A previous study examined the removal efficiency of granular ferric hydroxides (GFH) on
standard chromium solutions with positive results (Asgari et al., 2008). The purpose of this
study was to examine if wastewater from the match factory, where presence of other pollutants
may interfere, could be purified from chromium with GFH as an adsorbent. In order to maximize
the potential of the GFH relevant parameters were optimized by changing one parameter at a
time while holding the others constant. Parameters that were optimized were pH, dosage,
contact time and the effect of initial concentration. The study took place in Malawi at the
Department of Chemistry at Chancellor College in Zomba.
Figure 1. Political map of Malawi (Colombia University, 2015).

2
2 Background
Metal contamination of water and soil is a threat to the environment and human health and is of
serious concern in many countries. They occur naturally in soil and most of them are essential to
plants and animals but become toxic in excess. Metal pollution comes from farming practices,
atmospheric deposition, and wastewater discharge from industry and sewage plants amongst
other sources.
Conventional methods for water treatment include chemical precipitation, physical treatment
such as ion exchange, solvent extraction and adsorption. These methods are often unsustainable
in developing countries due to high maintenance and costs. In recent time much attention has
been directed towards natural minerals as adsorbents, as they are cheap and easily obtainable
(Sajidu et al., 2006). GFH could also serve as a cheap adsorbent of chromium since it has
previously been proven efficient in removal of arsenic which has similar chemical properties
(Mähler and Persson, 2013).
Previous studies in Malawi have revealed very high levels of heavy metals in streams and other
water bodies particularly within urban areas. A previous study in Blantyre showed that
concentrations at some of the sampling points were substantially higher than the World Health
Organization maximum allowable limits for drinking water (Sajidu et al., 2006). Attempts have
been made to remove heavy metals with locally found clays, Fe(II) sulfate and bauxite as
reducing agents, with varying results (Sajidu et al., 2006; Danielsson and Söderberg, 2013). The
results from one of the previous studies showed that clay minerals can be used for adsorption of
Cr(III) with removal from pH 3 to complete removal above pH 5 (Sajidu et al., 2006). A study
performed on the same wastewater as in this study investigated the possibility to remove
chromium(VI) by sorption to clay minerals or by reducing Cr(VI) to Cr(III) and removing by
precipitation from solution. The results showed that the clays used were unsuccessful in
removing chromium(VI) (Danielsson and Söderberg, 2013).
3 Theory
3.1 Chromium
Chromium is a transition metal and a relatively abundant element in the earth’s crust
(Britannica Online Encyclopedia, 2013). It is essential to some species, including humans. Like
other metals it can be toxic in excess (Emsley, 2011). It can exist in the oxidation states of +II,
+III, +IV and +VI. Chromium(III) is the most stable form and is not considered hazardous.
Chromium(VI) mainly occurs in water as chromate CrO42- and dichromate Cr2O72-, ions. They are
both very toxic and carcinogenic and most often a result of human activity
(Kemikalieinspektionen, 2013; WHO, 2003). In soil, chromium(VI) can be reduced to
chromium(III) by organic matter (WHO, 2003).
The distribution of different chromium species depends on factors like redox potential, pH, the
presence of oxidizing or reducing agents, the kinetics of the redox reactions, the formation of
chromium(III) complexes or salts and the total chromium concentration. In water the ratio
between chromium(III) and chromium(VI) varies widely. In general chromium(VI) salts are
more soluble than those of chromium(III) making them much more mobile (WHO, 2003). The
chromium Pourbaix diagram in Figure 2 maps out the possible equilibrium phases of different
chromium compounds depending on pH and oxidation potential Eh.

3
Chromium and its salts are used for
pigments and paints, leather tanning,
fungicides, ceramics and glass,
manufacturing of catalysts, in
photography, chromium alloy and
chromium metal production,
chromium plating and corrosion
control (WHO, 2003). Chromium(VI)
salts are often coloured and strongly
oxidizing. (Kemikalieinspektionen,
2013).
The toxicity of chromium(VI) is due to
its strong oxidative properties. Its
compounds can cause mutations and
chromosomal aberrations, and are also
highly carcinogenic. In animals
chromium(VI) can penetrate cell
membranes whereby it is reduced to
chromium(III), and subsequently binds
to macromolecules. In animal studies chromium was found to accumulate mainly in liver,
kidney, spleen and bone marrow. In humans the highest concentrations are found in lungs and
hilar lymph nodes, followed by spleen, liver and kidneys, damaging organ functions (WHO,
2003).
The natural total chromium content of surface waters is approximately 0.5-2μg/litre and the
dissolved chromium content 0.02-0.32μg/litre. WHO’s current limit value is a total chromium
concentration of 50 μg/litre (WHO, 2003).
3.2 Adsorption
Adsorption is the process where a substance in an aqueous solution is bound (by weak or strong
forces) to a surface. This leads to an equilibrium between the adsorbed phase and the dissolved
phase of the substance. There are different mechanisms for adsorption. One is through ion-
exchange, where an ion in the solution is attracted to a charge on the surface and binds
electrostatically, see figures 3 and 4. By adsorption an ion may replace another ion on the
surface due to a stronger affinity for the surface. Another mechanism is surface complexation
where ions in solution react chemically with functional groups on the surface. For instance,
cations can create complexes with carboxyl- or hydroxyl groups while many anions create
complexes with ferric or aluminum oxide (Kleja et al., 2006). In the case with ferric hydroxides,
surface complexation is considered to be the dominating mechanism (Gunnarsson, 2002).
Figure 2. Eh-pH diagram of chromium in aqueous solutions (US EPA, 2000)

4
Figure 3. Surface charges of ferric oxide with a phosphate ion (Reefkeeping, 2004)
There are different kinds of surface complexation. Inner-sphere surface complexes are the most
stable and arise when the adsorbate binds directly to the surface. No water molecules are found
between the adsorbate and the adsorbent since the ion is not completely hydrated. The bonding
is of covalent character resulting in a strong and stable adsorption with little desorption unless
the conditions in the solution changes. As seen in figure 5, outer-sphere complexes have a
complete hydration shell and the ion does therefore not have direct contact with the surface. It
binds to the surface through electrostatic forces, thus outer-sphere complexes are not as stable
as inner-sphere complexes (Eriksson et al., 2011).
All types of adsorption are highly dependent on pH, which is considered to be the single most
important parameter influencing adsorption apart from the characteristics of the surface itself.
The pH affects the net charge on the surface and therefore the amount of available binding sites
(charged surface functional groups) for the ion (Kleja et al., 2006).
3.3 Granular Ferric Hydroxides (GFH)
Granular Ferric Hydroxides were developed at the Technical University in Berlin, Germany as an
adsorbent for arsenic with the purpose of purifying water from naturally occurring arsenic. The
Figure 5. Inner-sphere and outer-sphere complexes. Modified from Payne et al. (2001)
Figure 4. Phosphate ion binding to surface of ferric oxide (Reefkeeping, 2004)

5
product used in this study is produced by GEH Wasserchemie GmbH & Co. KG. It is a granular
medium constituted by akaganeite (𝛽-FeOOH) and ferrihydrite (Fe2O3•0.5H2O) (Mähler and
Persson, 2013). It has a small particle size and thus a large specific area, see details in table 1.
The GFH has a point of zero charge at pH 7.5 (Asgari et al., 2008). The point of zero charge is
when the surface has a neutral net charge and the pH when this occurs is abbreviated as pHpzc.
At pH values below pHpzc the surface holds a positive net charge (Sposito, 1998). In this study, in
a solution with pH ≤ 7.5 the surfaces of the GFH hold positive net charges which enables
adsorption of anions such as Cr2O72- or CrO42- both as inner and outer sphere complexes.
Table 1. Properties of GFH produced by GEH Wasserchemie GmbH & Co. KG
Dry substance content 57% (±10%)
Iron content (dry substance) 610 g/kg (±10%)
Particle size 0.2 - 2.0 mm
Specific area ca. 300 m2/g
GFH has been shown to have a high adsorption capacity for arsenic (Mähler and Persson, 2013).
Adsorption of pure hexavalent chromium by GFH has previously been studied with good results
(Asgari et al., 2008).
In previous studies the material has shown successful removal of both chromium and arsenic
using low amounts of GFH. Asgari et al (2008) determined the maximum adsorption capacity for
Cr(VI) to 0.788 mg chromium/g GFH. Highfield (2002) examined the adsorption capacity for
arsenic, which was determined to 15 mg/g GFH.
3.4 Microwave plasma – atomic emission spectroscopy (MP-AES)
MP-AES is a technique for elemental determination using atomic emission. It has many benefits
as it is faster, cheaper and safer compared to other spectroscopy methods. It is also easy to use
and has wider dynamic detection range. The detection range for chromium is 0,07-0,6 mg/L
(Shrader et al., 2012).
MP-AES uses nitrogen as the plasma gas. Light emission from the plasma excites the electrons in
the sample which subsequently emits light (photons) to a monochromator and detector (Agilent
Technologies, 2011). The photons emitted are of a certain wavelength that is characteristic for
the corresponding element, figure 6 shows a simple illustration of the process. The photon
intensity is proportional to the concentration (Harvey, 2000).

6
4 Materials and methods
To make the removal of chromium as efficient as possible the parameters pH, dosage, contact-
time and the effect of initial concentration were optimized. pH is an important parameter since it
affects both the number of negatively charged sites on the surfaces of the GFH, the distribution
of chromium species and can cause precipitation. It was therefore the first parameter to be
optimized.
The volume of all the samples were 25 ml and measured using a 5000 μl automatic pipette. The
GFH dosages were measured using an analytical balance with an accuracy of ±0,0001g. A blank
with no GFH was prepared for each experiment to obtain background values for comparison.
After respective experiment all samples were filtered through Whatman nr. 1 filter papers. The
chromium concentration was measured with MP-AES. All samples were prepared in triplicates.
The removal (adsorption) of chromium [%] in each sample was calculated using equation 1.
% Removal = 100 - 𝐶1[𝑝𝑝𝑚]
𝐶0[𝑝𝑝𝑚] · 100 (equation 1)
The average mg Cr adsorbed per g GFH was calculated using equation 2.
mg Cr /g GFH = 𝐶0[𝑚𝑔/𝐿]∙𝑉𝑠[𝐿]−𝐶1[𝑚𝑔/𝐿]∙𝑉𝑠[𝐿]
𝑚𝐺𝐹𝐻[𝑔] (equation 2)
C0 = Initial chromium concentration of sample
C1 = Chromium concentration of sample after treatment with GFH
Vs = Sample volume
mGFH = Mass of GFH
Figure 6. Illustration of MP-AES. (Shrader et al., 2012).
7
4.1 Preparation of waste water samples
1000 ml of waste water was filtrated through a glass funnel with Whatman filter paper # 1. The
filtrate went through a second filtration using a vacuum pump and a membrane filter to remove
particles with a diameter < 0.45 µm. The initial chromium concentration was 120 mg/L. In order
to reach a concentration measurable with MP-AES dilution was necessary. The solution was
diluted with distilled water with a factor of 300.
4.2 Optimization of pH
4.2.1 Change of chromium concentration by adjusting pH
To account for possible effects caused by precipitation, samples with no GFH added were
prepared for each pH in the ranges 2.0-6.8 and 5.5-10.0. The efficiency of the GFH is the
difference in chromium concentration between the samples with only pH adjusted and the ones
that have been treated with GFH. A Metrohm 827 pH-meter was used for all pH-measurements.
4.2.2 Optimization of pH for chromium removal using GFH
The lower range samples were measured and poured in to glass sample tubes. The dosage was
held constant to 0.063 g/25 ml (0.025 g/L) for each sample. The contact time was held constant
to 30 minutes for each sample, during which the samples were shaken 3 times for 2 minutes
each time using a Vortex Genie-2 from Scientific Industries.
A second range of pH was examined to obtain a broader perspective of the effects of pH on the
GFH. The pH-values of this set were 5.5, 6.5, 7.4, 8.1, 8.5, 8.9, 9.5 and 10.0. The pH was adjusted
with NaOH. The dosage of GFH was held constant to 0.0063 g/25 ml (0,25g/L) and the time of
contact was fixed at 30 minutes. After filtration the samples were transferred to 50 ml
Erlenmeyer flasks and shaken in a Stuart mini orbital shaker (SSM1) at 300 rpm.
4.3 Optimization of dosage
GFH was measured in different dosages (see Appendix A3) using an analysis balance and added
to a wastewater solution with pH 8.0. The pH was adjusted with 0.25 M NaOH using a Metrohm
Dosimat (775). After filtration they were transferred to 50 ml Erlenmeyer flasks and shaken in a
Stuart mini orbital shaker (SSM1) at 300 rpm.
4.4 Optimization of contact time
To optimize the contact time pH and dosage were fixed to 8.0 respectively 0.0125 g/25 ml (0.5
g/L). The GFH was measured using an analysis balance according to appendix A4. Each set of
triplicates had the same contact time. The different times were 15, 30, 45, 60, 90 and 120
minutes respectively. The samples were prepared in volumetric flasks. After filtration they were
transferred to 50 ml Erlenmeyer flasks and shaken in a Stuart mini orbital shaker (SSM1) at 300
rpm.
4.5 Effect of initial concentration
The relationship between the initial concentration and the amount of adsorbed chromium can
also effect the removal efficiency of the GFH. The other parameters were held constant.
Wastewater was diluted to different concentrations, the pH was adjusted to 8.0 and the amount
of GFH was held constant to 0.5 g/L. The dilution factors were 0, 10, 25, 50, 100, 200 and 300.
8
Due to precipitation during the adjustment of pH the undiluted solution was filtered using
Whatman nr. 1 filter paper.
GFH and diluted wastewater was measured and put into Erlenmeyer flasks. They were then
shaken for 60 minutes in a Stuart mini orbital shaker (SSM1) at 300 rpm. In order to reach a
measurable concentration further dilution was necessary for the samples with the dilution
factor 0 and 10. Those samples were diluted with a dilution factor of 200 after the GFH
treatment.
4.6 Effect of optimized parameters on standard chromium solutions
Ions in the wastewater could potentially interfere with the efficiency of the GFH. Therefore a test
on a pure chromium solution was made using the optimized parameters. Standard solutions
with initial concentration of 0.4 ppm were prepared. The pH was adjusted to 4.0 and 8.0
respectively. The dosage of GFH was 0.5 g/L and the contact time was 2 hours.
4.7 Test of optimized parameters on undiluted filtered wastewater
The amount of GFH that would be needed to purify 1L of undiluted filtered wastewater was
determined. The optimized parameters obtained in previous experiments were tested on 25 ml
samples with pH adjusted to 8.0. Since the dosage-removal relationship was not linear a new
dosage optimization was made for undiluted wastewater. The dosages used were 1.57, 3.14,
6.28, 8.69, 17.38 and 34.76 g/L. The dosages were chosen based on the results obtained in the
optimization of initial concentration.
4.8 Test for iron in treated wastewater
Colouration of the samples after treatment made it relevant to examine if the iron in the GFH
leached into the samples during treatment. After treatment using different dosages of GFH at pH
8.1 the samples were filtered and measured for iron using the MP-AES. The dosages used were
1.57, 3.14, 6.28, 8.69, 17.38 and 34.76 g/L. The pH was 8.1 and the contact time was 120
minutes.
5 Results
5.1 Change of chromium concentration by adjusting pH
In Figures 7 and 8 the effects on the chromium concentration by only adjusting pH can be seen.
The blue plot shows the average percent removal which was calculated using equation 1. The
initial chromium concentration of the diluted wastewater was 0.4 ppm and the initial pH was
3.45. For the pH range 5.5-10.0 a white coloured precipitation appeared after the addition of
NaOH.
5.2 Optimization of pH
During the pH optimization the amount of GFH (0.25g/L) and contact time (30 minutes) were
fixed. Figures 7 and 8 show the chromium removal using GFH at two different pH ranges. Figure
7 shows that the GFH is less efficient at low pH and the efficiency increases with increased pH. It
was found that pH 8.5 gave the highest percent removal of chromium at an average of 72.5 %, as
shown in figure 8. The difference from the result at pH 8.1 (72.0%) is however small. Due to

9
practical reasons pH 8.0 was chosen for the experiments that followed. Table 2 shows the
efficiency expressed in adsorbed amount of chromium per gram GFH at each pH.
Figure 7. pH 2.0- 6.8 Effect of changing pH only and average percent removal of total chromium. Dosage of GFH: 0.25g/L
Figure 8. pH 5.5- 10.0 Effect of changing pH only and average percent removal of total chromium. Dosage of GFH: 0,25g/L
0.00
10.00
20.00
30.00
40.00
50.00
60.00
70.00
0.0 2.0 4.0 6.0
% R
emo
val
pH
Average%removalusing GFHEffect ofchangingpH only
0
10
20
30
40
50
60
70
80
5 6 7 8 9 10
% R
emo
val
pH
Average%Removalusing GFH
Effect ofchanging pHonly
10
Table 2. Average adsorption of chromium per gram GFH
pH Average % removal normalized
Average mg Cr / g GFH
2.0 31.3 0.18
2.9 34.8 0.20
4.0 45.0 0.30
5.1 49.6 0.28
5.5 65.0 0.79
6.1 48.4 0.14
6.5 71.7 0.79
6.8 58.6 0.32
7.4 65.8 0.65
8.1 72.0 0.86
8.5 72.5 0.75
8.9 70.8 0.65
9.5 64.2 0.58
10.0 62.0 0.62
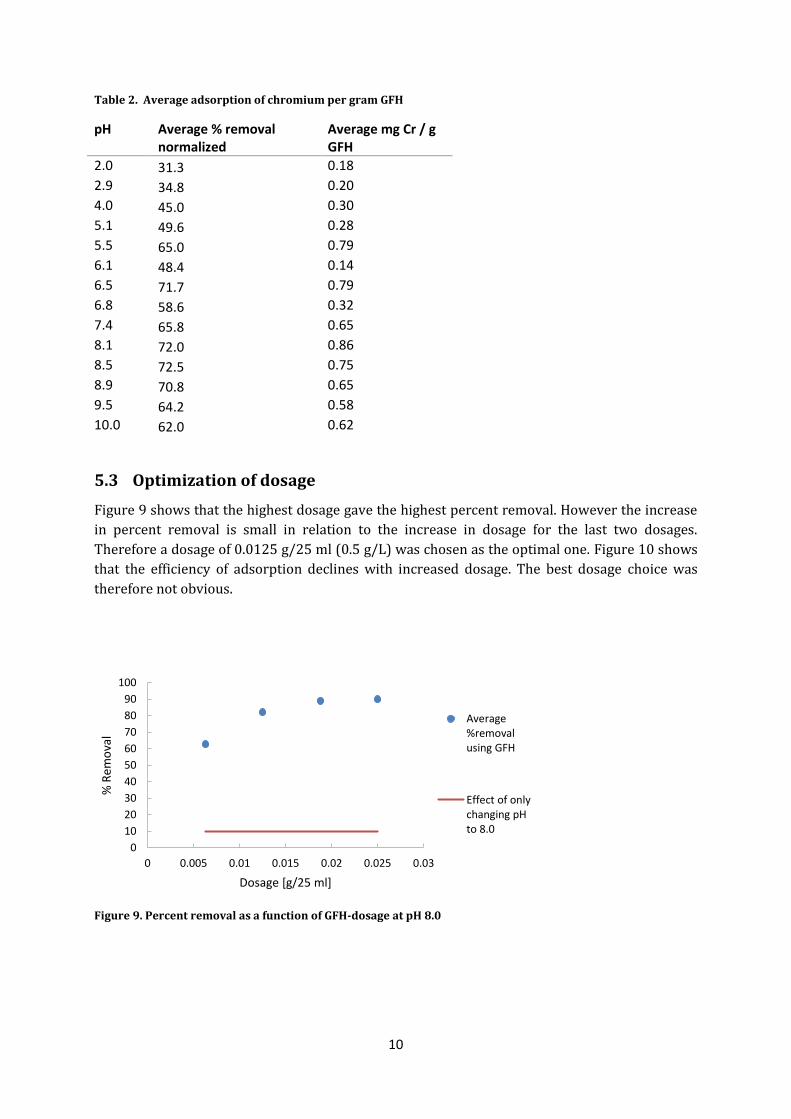
5.3 Optimization of dosage
Figure 9 shows that the highest dosage gave the highest percent removal. However the increase
in percent removal is small in relation to the increase in dosage for the last two dosages.
Therefore a dosage of 0.0125 g/25 ml (0.5 g/L) was chosen as the optimal one. Figure 10 shows
that the efficiency of adsorption declines with increased dosage. The best dosage choice was
therefore not obvious.
Figure 9. Percent removal as a function of GFH-dosage at pH 8.0
0
10
20
30
40
50
60
70
80
90
100
0 0.005 0.01 0.015 0.02 0.025 0.03
% R
emo
val
Dosage [g/25 ml]
Average%removalusing GFH
Effect of onlychanging pHto 8.0

11
0.00
0.20
0.40
0.60
0.80
1.00
1.20
1.40
1.60
0 0.005 0.01 0.015 0.02 0.025 0.03
mg
Cr
/g G
FH
m GFH [g]
Actualadsorptionof Cr per gGFH
Maximumpossibleadsorption
Figure 10. Efficiency of adsorption as a function of dosage
5.4 Optimization of contact time
Figure 11 shows that the percent removal increases with contact time. The optimal time was
chosen to 120 minutes since it’s unlikely that a longer time of contact will increase the efficiency
significantly. The chromium removal after 120 minutes was 96.7%, the corresponding amount
of adsorbed chromium per gram GFH is shown in Table 3.
Figure 11. Average percent removal as a function of contact time
0.00
25.00
50.00
75.00
100.00
0 50 100 150
% R
emo
val
time [min]
Effect ofcontacttime
Effect ofonlychanging pHto 8.0

12
Table 3. Average adsorption of chromium per gram GFH
Time Average mg Cr/g GFH
15 0.51
30 0.62
45 0.65
60 0.67
90 0.67
120 0.69
5.5 Effect of optimized parameters on standard chromium solutions
As seen in Table 4 there was no interference from other ions in the wastewater since the %
removal does not differ between standard solution and wastewater.
Table 4. Comparison with standard solutions using optimized parameters
Average % removal Average mg Cr/g GFH
Wastewater 96.4 0.69
Standard solution 95.8 0.73
5.6 Effect of initial concentration
Figure 12 shows that the efficiency of the GFH depends on the initial chromium concentration.
At zero dilution the removal reached 15.12 mg chromium per gram GFH. The dosage was 0.0125
g/25 ml (0.5 g/L).
Figure 12. Adsorption of chromium as a function of initial concentration (dilution).
0.00
10.00
20.00
30.00
40.00
50.00
60.00
70.00
80.00
90.00
0.00 10.00 20.00 30.00 40.00 50.00
mg
Cr/
g G
FH
Initial Chromium concentration [ppm]
Actualadsorptionof Cr per gGFH
Maximumpossibleadsorption

13
0
10
20
30
40
50
60
70
80
0 0.2 0.4 0.6 0.8 1
mg
Cr/
g G
FH
m GFH [g]
Actualadsorptionof Cr per gGFH
Maxpossibleadsorption
5.7 Dosage optimization on undiluted wastewater
Since the efficiency of GFH depends on the chromium concentration another dosage
optimization was made for undiluted wastewater. After pH adjustment a white coloured
precipitation appeared that had to be removed by filtration. The optimal dosage was chosen to
0.435 g/ 25 ml (17.4 g/L) with a 95.4% removal, se figure 13. The efficiency of adsorption as a
function of dosage is shown in figure 14.
Figure 14. Efficiency of adsorption as a function of dosage
0
20
40
60
80
100
0 0.2 0.4 0.6 0.8 1
% R
emo
val
m GFH [g]
Figure 13. Percent removal as a function of dosage

14
5.8 Test for iron in treated wastewater
After treatment with GFH the samples were coloured brown, the strength of the colour increased
with increased dosage of GFH. After filtration however the colour was clear which indicated that
the iron leached was in particle-form. This was confirmed by measurements with the MP-AES
that showed no measurable amounts of iron.
6 Discussion
6.1 Experiments
For the samples with dilution factor 300 the highest removal was reached at pH 8.5 with 72.5%
of the chromium removed. However, 72.0% removal was reached already at pH 8.1 where the
efficiency (mg adsorbed chromium per gram GFH) was at its’ highest with 0.86 mg Cr/ g GFH
(see table 2). Therefore pH 8.1 was chosen as the optimal pH (see figures 7 & 8). The plot seems
to be somewhat scattered but since the experiments were made in triplicates, which all showed
similar values, the results are considered reliable. The values for the effect of changing pH only,
for both pH-ranges, however were prepared in singles which make the results uncertain (shown
as the red graphs in Figures 7 & 8).
For the pH range 5.5-10.0 (see figure 8) a white precipitate became clearly visible after adding
NaOH. This would not happen if the wastewater only contained hexavalent chromium. Trivalent
chromium however forms hydroxides that precipitate at higher pH. Therefore it seems that both
hexavalent chromium and trivalent chromium were present in the wastewater. The chromium
speciation was not known at the time of the study.
At acidic conditions there is a positive net charge on the surfaces of the GFH (pHpzc = 7.5) but
only a fraction of the total chromium consists of chromium(VI) (HCrO4- or CrO42-, see Figure 2).
Instead the wastewater is dominated by chromium(III). At pH 8.0 the GFH still holds a sufficient
positive net charge and at the same time the concentration of chromium(VI) is significantly
higher than at acidic conditions. If the pH is to be raised the concentration of chromium(VI)
could increase further (depending on initial speciation and presence of electron acceptors) but
the positive net charge would decrease and thus the efficiency decreases, as seen in figure 8. At
the time of the study the speciation of chromium had not been determined for the wastewater
from the match factory.
Higher pH values require more modification than lower pH-values but the high increase in
efficiency and the fact that a slightly alkaline effluent is preferable from an environmental aspect
motivates a higher degree of modification. If lime or another cheap substance is used to increase
the pH the costs for the modification can be kept low.
When choosing an optimal dosage both the percent removal and GFH efficiency have to be taken
into consideration. Figure 10 shows that the efficiency of adsorption declines with increased
dosage. Figure 9 shows that the highest dosage gave the highest percent removal (90.0%).
However the increase in percent removal is small in relation to the increase in dosage for the
last two dosages. Therefore a dosage of 0.0125 g/25 ml (0.5 g/L) was chosen as the optimal one
with 82.10% removal.
The percent removal increases with time of contact as seen in figure 11. The optimal contact
time was chosen to 120 minutes since it was unlikely that a longer time of contact would

15
increase the efficiency significantly. Already after 30 minutes a removal of 87.26% was achieved
but since a longer time of contact gave a higher percent removal and time is not an issue for the
factory, a contact time of 2 hours was chosen with a 96.68% removal. Also, at 120 min the
amount of chromium adsorbed per gram of GFH was at its highest with 0.69 mg Cr/g GFH (see
table 3)
The optimized parameters were tested for different dilutions and undiluted water in order to
see the effect of initial concentration on the efficiency of the GFH. At first it was expected that
dilution would be necessary after purification in order to reach measurable concentrations. This
was however only necessary for the two highest initial concentrations since the GFH was much
more efficient than expected. At zero dilution the removal reached 15.12 mg chromium per gram
GFH. The dosage was 0.0125 g/25 ml (0.5 g/L) (see figure 12).
These results motivated another dosage optimization on undiluted filtered wastewater. The
optimal dosage was chosen to 0.435 g/ 25 ml (17.38 g/L) with a 95.4% removal. Although
99.08% removal was reached at a dosage of 0.870 g/25 ml (34.8 g /L) the increase in dosage
was too high compared to the increase in percent removal and therefore the higher dosage was
not motivated (see Figure 13). In Figures 13 and 14 there are two outliers at the dosages 0.0393
g/25ml (1.57g/l) and 0.0785 g/25 ml (3.14 g/l). Due to lack of time the experiments could not
be repeated.
There are a number of potential sources of error in the experiments. It would have been
preferable to work with larger volumes and doses but due to scarcity of the material this was not
possible. The small volumes caused problems when modifying the pH making it difficult to
stabilize the pH to a specific value. Measurement errors may have arisen from difficulties in
weighing in the GFH in such small doses, contaminated glassware and power cuts during
stirring. Triplicates were made in most of the experiments to increase the reliability of the
results and apparent outliers have been removed.
6.2 Practical challenges and future perspectives
It is of outmost importance that the GFH is well stirred during the whole experiment, otherwise
the chromium removal can be drastically reduced. A few experiments in the beginning of the
study had to be discarded when using sample tubes and a vortex genie. Another stirring method
was chosen with 50 ml Erlenmeyer flasks in a Stuart mini orbital shaker with much more
reliable results. The experiments with a pH range of 2.0-6.8 were done using the vortex genie
which may have affected the results negatively. Due to this sensitivity it is highly relevant to
examine how the stirring could be solved in the easiest, cheapest and most efficient way for both
small and large scale use. In cases with availability of electricity for pumping and a low presence
of particles, and thus low risk of clogging, columns might be a good alternative to basins with
stirring. It would be of interest to examine the efficiency using columns (or other methods) in
search of further improvements.
To implement wastewater purification with GFH a number of additional practical issues have to
be taken into consideration. The GFH has to be imported from Europe which can be a problem as
transport is a cost and it may take time for it to arrive. It also requires a will from the factory
management to voluntary implement treatment of their wastewater, since at the moment legal
control of industrial effluents is not prioritized by the Malawian government. The factory’s
sedimentation tank for wastewater is approximately 9 m3. One full tank would require

16
approximately 52 kg of GFH for a 95.3% reduction of total chromium after the pH has been
adjusted. Theoretically the GFH could be reused if flushed with a strong base and the chromium
could be collected in a concentrated solution. Unfortunately it is not thought possible to reuse
the chromium in production because of practical limitations and the concentrated chromium
solution will still be a potential environmental hazard. The efficiency of the GFH will also be
reduced and therefore the consumed GFH will have to be discarded and put on landfill. The GFH-
bound chromium will then be less of an environmental threat as it will no longer be mobile in
natural conditions.
Another way of implementing wastewater purification with GFH is by using filtration through
columns. Since the wastewater contains a large amount of particles there is a high risk of
clogging and it is not thought to be practically feasible. The wastewater could also be pumped up
through a column with reduced risk of clogging but this requires a reliable supply of electricity
which is not always the case in Blantyre. If the pump stops working the GFH will be exposed to
air which reduces its’ efficiency. Stirring also requires electricity but the GFH is not sensitive to
interruptions and can be continued to be stirred after a power cut.
In this study, the wastewater has been filtered before the treatment with GFH. This might not be
possible in reality and therefore it is necessary to examine how the efficiency of the GFH is
affected by particles. It might also be of use to examine possible pre-treatments for the
wastewater in order to reduce expenditures.
As a sustainable alternative it would be interesting to examine whether iron oxide coated sand
could be used in the same way as GFH for the purpose of removal of chromium(VI). Iron oxide
coated sand can be made from cheap and often available materials (mainly sand and scrap iron)
which makes this material accessible for a larger number of operators.
Conclusions
To optimize chromium removal the parameters pH, dosage and contact time were determined as
well as the effect of initial concentration. pH was chosen to 8,0, the dosage to 17,4 g/L and a
contact time of 2 hours for a 95,3% removal of total chromium in undiluted wastewater. The
removal efficiency of the GFH was 2.84 mg Cr/g GFH. The factory’s sedimentation tank for
wastewater is approximately 9 m3 and holds 9000 liters of wastewater. One full tank requires
approximately 52 kg of GFH after the pH has been adjusted.
To implement wastewater purification with GFH a number of practical issues have to be taken
into consideration Above all a sufficient stirring method has to be devised. It also requires a will
from the factory to implement. A limitation may be that unfiltered wastewater can decrease the
efficiency of the GFH.
Previous studies on GFH have focused on arsenic removal and it is therefore interesting to see
that this material has a large potential for removal of chromium(VI) as well. It has a potential to
be used as a cheap adsorbent when conventional water treatment methods can not be used. This
creates new possibilities for small operators to purify their wastewater in a sustainable way.

17
7 References
Agilent Technologies, 2011. Runs On Air - Agilent 4100 Microwave Plasma Atomic Emission Spectrometer. Agilent Technologies.
Asgari, A.R., Vaezi, F., Nasseri, S., Dördelmann, O., Mahvi, A.H., Dehghani Fard, E., 2008. Removal of hexavalent chromium from drinkingwater by granular ferric hydroxide. Deparment of Environmental Health Engineering, School of Public Health, Tehran University of Medical Sciences, Tehran.
Berggren Kleja, D., Elert, M., Gustafsson, J.P., Jarvis, N., Norrström, A.-C., 2006. Metallers mobilitet i mark, Report No. 5536. Naturvårdsverket, Stockholm.
Britannica Online Encyclopedia, 2013. chromium. Br. Online Encycl. URL http://www.britannica.com/EBchecked/topic/115973/chromium-Cr (accessed 6.18.13).
Colombia University, 2015. Blantyre, Malawi – Millennium Cities Initiative. URL http://mci.ei.columbia.edu/millennium-cities/blantyre-malawi/ (accessed 6.16.15).
Danielsson, L., Söderberg, L., 2013. Removal of chromium in wastewater with natural clays in southern Malawi. Uppsala University
Emsley, J., 2011. Natures building blocks. Oxford University Press. Eriksson, J., Dahlin, S., Nilsson, I., Somonsson, Ma., 2011. Marklära, 1st ed. Studentlitteratur AB. Msilimba, G., Wanda, E.M.M., 2008. Wastewater Production, Treatment, and Use in Malawi.
Department of chemistry, Mzuzu University, Mzuzu, Malawi. Gunnarsson, M., 2002. Surface Complexation at the Iron Oxid/Water interface. PhD Thesis.
Instutitionen för kemi, Göteborgs universitet, Göteborg. Harvey, D., 2000. Modern Analytical Chemistry, First Edition, International. ed. Mc Graw Hill. Highfield, D.E., 2002. Arsenic occurence in Metro Phoenix groundwater and treatment by
Granular Ferric Hydroxide. MSc Thesis. Arizona State University. Kemikalieinspektionen, 2013. Oorganiska kromsalter. Kemikalieinspektionen.
URL http://apps.kemi.se/flodessok/floden/kemamne/oorganiska_kromsalter.htm (accessed 6.17.13).
Mähler, J., Persson, I., 2013. Rapid adsorption of arsenic from aqueous solution by ferrihydrite-coated sand and granular ferric hydroxide. Department of chemistry, Swedish University of Agricultural Sciences, Uppsala, Sweden.
Reefkeeping, 2004 URL http://www.reefkeeping.com/issues/2004-11/rhf/(acessed 6.18.13)
Sajidu, S.M.., Masamba, W.R.., Henry, E.M.T., Kuyeli, S.., 2007. Water quality assessment in streams and wastewater treatment plants of Blantyre, Malawi. Department of Chemistry, Chancellor college, Univertity of Malawi, Zomba, Malawi.
Sajidu, S., Persson, I., Masamba, W., Kayambazinthu, D., 2006. Removal of Cd2+, Cr3+, Cu2+, Hg2+, Pb2+ and Zn2+ cations and AsO43- anions from aqueous solutions by mixed clay from Tundulu in Malawi and characterisation of the clay. Department of Chemistry, Chancellor college, Univertity of Malawi, Zomba, Malawi.
Shrader, D., Lowenstern, P., Simmons, P., 2012. Chemical and Petrochemical Applications of Microwave Plasma - Atomic Emission Spectroscopy (MP-AES). Agilent Technologies.
Sposito, G., 1998. On Points of Zero Charge. University of California, Berkeley. URL http://pubs.acs.org/doi/pdf/10.1021/es9802347 (accessed 6.17.2013)
WHO, 2003. Chromium in drinking-water. (No. WHO/SDE/WSH/03.404/04). World Health Organization, Geneva.

18
8 Appendices
A.1 Optimization of wastewater pH
Table 5. Data from pH optimization, range 2.0-6.8. Initial concentration: 0.4 ppm * data has been eliminated from the analysis due to errors introduced during the experiment.
Sample nr
mGFH [g]
pH CCr [ppm] % removal %removal (normalized)
mg Cr/g GFH
1.1 0.0063 2.0 0.28 33 33 0.16
1.2 0.0064 2.9 0.26 35 35 0.20
1.3* 0.0062 4.0 0.19* 45* 45* 0.52*
1.4 0.0063 5.1 0.20 50 49 0.28
1.5* 0.0063 6.1 0.16* 50* 50* 0.32*
1.6 0.0063 6.8 0.17 60 60 0.32
2.1 0.0063 2.0 0.27 32 33 0.20
2.2 0.0063 2.9 0.26 35 35 0.20
2.3 0.0063 4.0 0.22 45 45 0.40
2.4 0.0064 5.1 0.20 50 49 0.27
2.5 0.0063 6.1 0.20 50 50 0.16
2.6 0.0063 6.8 0.16 45 45 0.36
3.1 0.0063 4.0 0.22 48 47 0.20
3.2 0.0064 6.1 0.21 58 58 0.12
3.3 0.0062 6.8 0.17 45 45 0.32
Table 6. Average values based on table 1
pH average % removal normalized
average mg Cr / g GFH
2.0 31 0.18
2.9 35 0.20
4.0 45 0.30
5.1 50 0.28
6.1 48 0.14
6.8 59 0.32
Table 7. Blanks for pH optimization with no GFH added
Sample pH mGFH [g]
CCr [ppm] % removal
blank 2.0 0 0.32 20.0
blank 2.9 0 0.31 22.5
blank 4.0 0 0.32 20.0
blank 5.1 0 0.27 32.5
blank 6.1 0 0.24 40.0
blank 6.8 0 0.25 37.5
19
Table 8. Initial chromium concentration at pH 4.0
Sample pH mGFH [g]
CCr [ppm]
blank 4.00 0 0.32
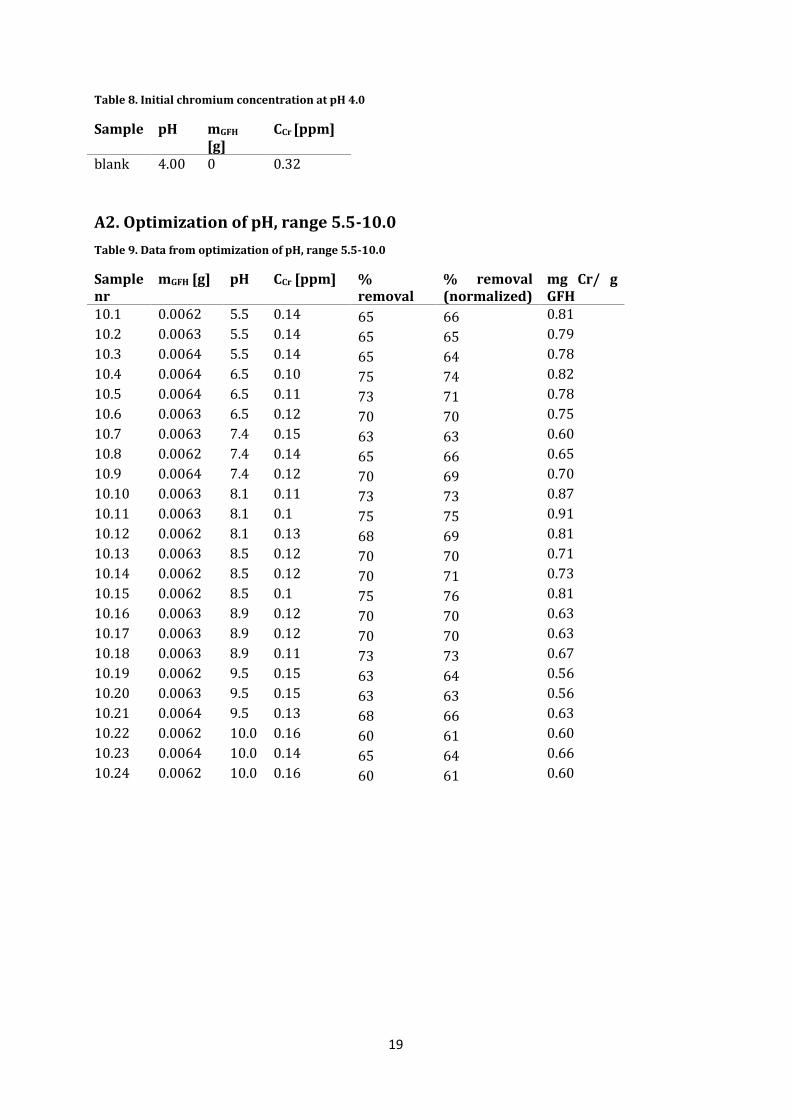
A2. Optimization of pH, range 5.5-10.0
Table 9. Data from optimization of pH, range 5.5-10.0
Sample nr
mGFH [g] pH CCr [ppm] % removal
% removal (normalized)
mg Cr/ g GFH
10.1 0.0062 5.5 0.14 65 66 0.81
10.2 0.0063 5.5 0.14 65 65 0.79
10.3 0.0064 5.5 0.14 65 64 0.78
10.4 0.0064 6.5 0.10 75 74 0.82
10.5 0.0064 6.5 0.11 73 71 0.78
10.6 0.0063 6.5 0.12 70 70 0.75
10.7 0.0063 7.4 0.15 63 63 0.60
10.8 0.0062 7.4 0.14 65 66 0.65
10.9 0.0064 7.4 0.12 70 69 0.70
10.10 0.0063 8.1 0.11 73 73 0.87
10.11 0.0063 8.1 0.1 75 75 0.91
10.12 0.0062 8.1 0.13 68 69 0.81
10.13 0.0063 8.5 0.12 70 70 0.71
10.14 0.0062 8.5 0.12 70 71 0.73
10.15 0.0062 8.5 0.1 75 76 0.81
10.16 0.0063 8.9 0.12 70 70 0.63
10.17 0.0063 8.9 0.12 70 70 0.63
10.18 0.0063 8.9 0.11 73 73 0.67
10.19 0.0062 9.5 0.15 63 64 0.56
10.20 0.0063 9.5 0.15 63 63 0.56
10.21 0.0064 9.5 0.13 68 66 0.63
10.22 0.0062 10.0 0.16 60 61 0.60
10.23 0.0064 10.0 0.14 65 64 0.66
10.24 0.0062 10.0 0.16 60 61 0.60

20
Table 10. Average values based on data in table 5
pH Average CCr
[ppm]
Average %removal (normalized)
Average mg Cr/ g GFH
5.5 0.14 65 0.79
6.5 0.11 72 0.79
7.4 0.14 66 0.65
8.1 0.11 72 0.86
8.5 0.11 72 0.75
8.9 0.12 71 0.65
9.5 0.14 64 0.58
10.00 0.15 62 0.62
Table 11. Effect of only changing pH, no GFH added
Sample pH CCr [ppm]
% removal
blank 5.5 0.34 15.0
blank 6.5 0.31 22.5
blank 7.4 0.30 25.0
blank 8.1 0.33 17.5
blank 8.5 0.30 25.0
blank 8.9 0.28 30.0
blank 9.5 0.29 27.5
blank 10.0 0.31 22.5
A3. Optimization of dosage at pH 8.0
Table 12. Data from dosage optimization at pH 8.0, initial chromium concentration was 0.4 ppm
Sample nr
mGFH [g]
CCr [ppm]
% Removal
% Removal (normalized)
mg Cr/ g GFH
11.1 0.0062 0.16 60 61 0.81
11.2 0.0062 0.14 65 66 0.89
11.3 0.0064 0.15 63 62 0.82
11.4 0.0124 0.07 83 83 0.58
11.5 0.0124 0.08 80 81 0.56
11.6 0.0125 0.07 83 83 0.58
11.7 0.0188 0.05 88 88 0.41
11.8 0.0189 0.04 90 90 0.42
11.9 0.0188 0.04 90 90 0.43
11.10 0.0251 0.04 90 90 0.32
11.11 0.0250 0.04 90 90 0.32
11.12 0.0249 0.04 90 90 0.32

21
Table 13. Average values based on data in table 8
mGFH [g] Average mg Cr/g GFH
Average % Removal
0.0063 0.84 63 0.0125 0.58 82 0.0188 0.42 89 0.0250 0.32 90
A4. Optimization of contact time at pH 8.0
Table 14. Data from optimization of contact time at pH 8.0, initial chromium concentration was 0.4 ppm
Sample nr
Time [min]
mGFH [g]
CCr [ppm]
% removal
% Removal (normalized)
mg Cr/ g GFH
12.1 15 0.0126 0.10 75 74 0.52
12.2 15 0.0125 0.10 75 75 0.52
12.3 15 0.0126 0.11 73 72 0.50
12.4 30 0.0124 0.06 85 86 0.60
12.5 30 0.0126 0.05 88 87 0.62
12.6 30 0.0126 0.04 90 89 0.63
12.7 45 0.0125 0.04 90 90 0.64
12.8 45 0.0124 0.02 95 96 0.69
12.9 45 0.0124 0.05 88 88 0.63
12.10 60 0.0124 0.03 93 93 0.67
12.11 60 0.0124 0.02 95 96 0.69
12.12 60 0.0125 0.03 93 93 0.66
13.1 90 0.0125 0.02 95 95 0.68
13.2 90 0.0125 0.03 93 93 0.66
13.3 90 0.0126 0.02 95 94 0.67
13.4 120 0.0125 0.01 98 98 0.70
13.5 120 0.0126 0.02 95 94 0.67
13.6 120 0.0124 0.01 98 98 0.71
Table 15. Average values based on data in table 10
Time Average % removal
Average mg Cr/g GFH
15 74 0.51
30 87 0.62
45 91 0.65
60 94 0.67
90 94 0.67
120 97 0.69

22
A5. Effect of initial concentration
Table 16. Data from optimization of initial concentration. * data has been eliminated from the analysis due to deviation.
Sample nr m GFH [g]
Dilution factor
CCr [ppm] CCr "undiluted" [ppm]
% Removal
% Removal (normalized)
mg Cr/ g GFH
15.7 0.0126 25 0.92 23 76 76 5.93
15.8 0.0125 25 1.12 28 71 71 5.58
15.9 0.0125 25 0.68 17 83 83 6.46
15.1 0.0125 50 0.26 13 86 86 3.11
15.11 0.0124 50 0.23 11.5 87 88 3.20
15.12 0.0125 50 0.27 13.5 85 85 3.09
15.1 0.0126 100 0.08 8 88 88 1.20
15.2 0.0125 100 0.09 9 87 87 1.19
15.3* 0.0125 100 0.17* 17* 75* 75* 1.03*
15.4 0.0125 200 0.02 4 95 95 0.76
15.5 0.0125 200 0.03 6 93 93 0.74
15.6 0.0125 200 0.03 6 93 93 0.74
19.10' 0.0124 0 0.17 34 15 16 12.48
19.11' 0.0124 0 0.16 32 20 21 16.51
19.12' 0.0125 0 0.16 32 20 20 16.38
18.1 0.0125 10 0.01 20 69 69 8.83
18.2 0.0125 10 0.01 20 69 69 8.36
18.3 0.0125 10 0.01 20 69 69 8.36
18.4 0.0124 100 0.07 7 90 90 1.24
18.5 0.0126 100 0.06 6 91 91 1.24
18.6 0.0124 100 0.06 6 91 92 1.26
18.7 0.0125 200 0.03 6 93 93 0.74
18.8 0.0124 200 0.04 8 90 91 0.73
18.9 0.0125 200 0.04 8 90 90 0.72
Table 17. Blanks for optimization of initial concentration. No GFH added
Sample nr Dilution factor 1
Dilution factor pH adjustment
Dilution factor 2
C Cr [ppm]
C Cr "undiluted" [ppm]
S 0 0 1.21784 300 0.11 40
S 10 10 1.04335 15 0.41 64
S 25 25 1.01851 12 0.32 98
S 50 50 1.00929 6 0.30 91
S 100 100 1.00509 4 0.17 68
S 200 200 1.00486 2 0.20 80

23
Table 18. Averages of data in table 12
Dilution factor
Initial Ccr [ppm]
Average % removal
Average mg Cr/ g GFH
0 40.19 19 15.12
10 6.42 69 8.52
25 3.91 77 5.99
50 1.82 86 3.14
100 0.68 91 1.24
200 0.40 91 0.73
300 0.37 96 0.69
A6. Effect of optimized parameters on standard chromium solutions
Table 19. Data from using optimized parameters on standard chromium solutions
Sample nr
mGFH [g]
pH CCr % Removal
mg Cr/ g GFH
19.1 0.0126 4 0.07 83 0.65
19.2 0.0126 4 0.04 90 0.71
19.3 0.0125 4 0.03 93 0.74
19.4 0.0124 8 0.02 95 0.73
19.5 0.0125 8 0.01 97 0.74
19.6 0.0124 8 0.02 95 0.73
Table 20. Blanks for test on standard solutions at pH 4.0 and 8.0. No GFH added
Sample nr mGFH [g]
pH CCr [ppm]
Blank pH 4.0 0 4 0.40
Blank pH 8.0 0 8 0.38
A.7 Averages of chromium removal at pH 4.0 and pH 8.0
Table 21. Averages of data in table 14
pH Average % removal
Average mg Cr/g GFH
4.0 88 0.70
8.0 96 0.73