removal of natural organic matter by enhanced coagulation...
TRANSCRIPT

Removal of natural organic matter by enhanced coagulation in Nicaragua
Indiana García
Licentiate Thesis
Department of Chemical Engineering and Technology Royal Institute of Technology
Stockholm, Sweden, December 2005
Removal of Organic Matter by Enhanced Coagulation in Nicaragua Indiana Garcia Licentiate Thesis Department of Chemical Engineering and Technology Division of Chemical Engineering Royal Institute of Technology Stockholm, Sweden TRITA-KET-R-225 ISSN 1104-3466 ISRN KTH/KET/R-225-SE Copyright © 2005 by Indiana Garcia

To my parents

Title: Removal of Organic Matter by Enhanced Coagulation in Nicaragua Author: Indiana Garcia Department of Chemical Engineering and Technology, Royal Institute of Technology, SE-100 44 Stockholm, Sweden Language: English ABSTRACT
The existence of trihalomethanes (THMs) in a drinking water plant of Nicaragua has been investigated in order to see whether the concentration exceeded the maximum contaminant level recommended by the environmental protection agency of the United States (USEPA) and the Nicaragua guidelines. The influence of pH, temperature, chlorine dose and contact time on the formation of THMs were studied. The contents of organic matter measured by surrogate parameters such as total organic carbon, dissolved organic carbon, ultraviolet absorbance and specific ultraviolet absorbance were also determined in order to show which type of organic matter is most reactive with chlorine to form THMs. Models developed by other researchers to predict the formation of trihalomethanes were tested to see whether they can be used to estimate the trihalomethane concentration. In addition, empirical models were development to predict the THM concentration of the drinking water plant analysed. The raw water was treated by conventional and enhanced coagulation and these processes were compared with regard to the removal of natural organic matter (NOM). The significance of the results was assessed using statistic procedures.
The average concentration of THMs found at the facility is below the USEPA and Nicaragua guideline values. Nevertheless the maximum contaminant level set by USEPA is sometimes exceeded in the rainy season when the raw water is rich in humic substances. Comparison between the water treated by conventional and enhanced coagulation shows that enhanced coagulation considerably diminished the trihalomethane formation and the value after enhanced coagulation never exceeded the guidelines. This is because enhanced coagulation considerably decreases the organic matter due to the high coagulant dose applied. The study of the trihalomethane formation when varying pH, time, temperature and chlorine dose using water treated by conventional and enhanced coagulation showed that higher doses of chlorine, higher pH, higher temperature and a longer time increases the formation of THMs. However, combinations of two and three factors are the opposite. The predicted THM formation equations cannot be used for the water at this facility, since the results shown that the measured THM differs significantly from the THM concentration predicted. Two empirical models were developed from the data for enhanced coagulation, using linear and non-linear regression. These models were tested using the database obtained with conventional coagulation. The non-linear model was shown to be able to predict the formation of THMs in the Boaco drinking water plant. Keywords: drinking water, surrogate parameters, enhanced coagulation, natural organic
matter; trihalomethanes


ACKNOWLEDGMENTS I would like to express my gratitude to my supervisor Luis Moreno, for his encouragement, questioning, support and patience in all the discussions that we have had. Thanks to Joaquin Martinez by believe in the Nicaraguan people. Special thanks to the Swedish International Development Cooperation Agency (SIDA) for funding this research. I am grateful to Rodolfo Espinosa for his great advice, love and patience, and to my daughters Laura, Lucia, Fernanda and my son Jose Rodolfo who are growing up without sharing so much time with me. Especially, I beg the forgiveness of Lucia and Jose Rodolfo because I had missed many of your birthdays to be in Sweden.


LIST OF PAPERS This thesis is based on the following papers referred to by Roman numerals I to V: I. Garcia, I and Moreno, L (2003). Drinking Water Treatment Plants in Nicaragua:
A Short Review. Proceeding of the IWA Asia Pacific Regional Conference. Bangkok, Thailand. October, 19-23. CD-ROM, paper ID 1QHLO5.
II. Garcia, I and Moreno, L (2004). Influence of Enhanced Coagulation in the
removal of Natural Organic Matter to avoid formation of Trihalomethane in a drinking water plant in Nicaragua. Conference Proceeding of the 4th IWA World Water Congress and Exhibition. Marrakech, Morocco. September, 19-24. CD-ROM, paper ID 23946.
III. Garcia, I and Moreno, L. Presence of Trihalomethanes in Four Drinking Water
Plants in Nicaragua. Accepted for publication with modifications in Journal of Water Supply: Research and Technology-AQUA, September, 2005.
IV. Garcia, I and Moreno, L (2005). Use of two different coagulants for the removal
of organic matter from a drinking water. Conference Proceeding of the 3rd IWA Leading-Edge Conference on Water and Wastewater Treatment and Technologies. Sapporo, Japan. June, 6-8. CD-ROM
V. Garcia, I and Moreno, L (2005). Use of pH, contact time, chlorine dose,
temperature on the formation of trihalomethane and some empirical models for predicting trihalomethane formation. Submitted to the 5th IWA World Water Congress to be held in Beijing China, September 2006.
These papers are appended at the end of the thesis.

TABLE OF CONTENTS Chapter Page
1. INTRODUCTION 1 1.1 Background 1 1.2 Objectives 2 1.3 Outlines 3
2. MECHANISM AND FACTORS THAT AFFECT THE 4 FORMATION OF CHLORINATION BY-PRODUCTS (CBPs)
2.1 CBP Formation mechanism 5 2.2 Factors affecting CBP formation 6
3. TREATMENT FOR CONTROL OF CBPs AND PREDICTIVE 12
MODELS
3.1 Coagulation 12 3.2 Enhanced coagulation 17 3.3 Chlorination by-products models 19
4. EXPERIMENTAL WORK 23
4.1 Sampling sites 23 4.2 Analytical procedures 24
4.3 Jar Test enhanced coagulation experiments 25 4.4 The influences of pH, chlorine dose, contact time, 25 and temperature on the THMs formation 4.5 Comparison with existing empirical model 27 4.6 Development of empirical models for THM formation 28
5. RESULTS AND DISCUSSION 29 5.1 Natural organic matter in the raw water 29 5.2 Natural organic matter after conventional (CC) 30 and enhanced coagulation (EC)
5.3 Presence of trihalomethanes after conventional 31 and enhanced coagulation 5.4 Trihalomethanes formation: Impact of the operating 32
parameters 5.5 ANOVA for the variation of four parameters 36 5.6 Comparison between predictive and measured THMs 40 5.7 Empirical model for predict THMs formation in the 41 drinking water of Boaco
6. CONCLUSIONS 44 NOTATION 45 ABREVIATIONS 46 REFERENCES 47 APPENDICES 53
1
1 INTRODUCTION This thesis discusses the formation of chlorination by-products (CBP) by reaction with the natural organic matter (NOM) when drinking water is treated with chlorine. Many of these by-products are potentially carcinogenic and their formation should therefore be avoided. A way to achieve this is by removal of the NOM, which may be carried out, for example, for enhanced coagulation. Below, a short description of the drinking water situation in Nicaragua is presented. Then the objectives of the research are defined, and an outline is presented. 1.1 Background The delivery of safe drinking water in sufficient quantities has become a difficult task in many countries because of water pollution and drought problems. The situation is worse in developing countries due to economic limitations, lack of education, and problems with law application. Nicaragua does not escape that situation, although it still has plenty of water sources. Nicaragua has problems of water scarcity in some regions due to an imbalance in the distribution of the water sources. Most of the population is settled in the Pacific region towards which only 10% of the watersheds drains. Since large aquifers are located at that region, near the lakes and some mountain valleys, the population is supplied by groundwater. In the Caribbean region, towards which 90% of the watersheds drains and only 6 % of the Nicaraguan population live, few aquifers has been dug and mainly surface water is utilised to supply drinking water. In the central region, the type of soil limits the use of groundwater. Some small aquifers are localised in fractured rock, and these are used to supply drinking water to small communities. The governmental Nicaraguan water supply and sewerage (ENACAL) company is trying to solve the problem of the scarcity of groundwater by using surface water in the central region. The drinking water system reaches 67% of the Nicaragua population. Of the total urban population, 89% is covered, whereas for rural inhabitants, the figure is only 35% (CEPIS-OMS-MS, 2000). ENACAL has 148 minor urban systems for water treatment; 72% of which use groundwater, 10% surface water and 18% a combination of different sources. In the rural area, there are 3185 minor systems using mainly groundwater and a little surface water. These minor systems are of two types: for groundwater, they comprise extraction, natural aeration, and disinfection, and for surface water, they comprise intake, a roughing filter, and disinfection. Surface water treatment in Nicaragua can be divided in two types: a conventional treatment including coagulation, flocculation, sedimentation, rapid sand filtration and disinfection, and an alternative treatment based on pre-treatment and slow sand filtration (SSF). At the present time, only ten drinking water treatment plants exist in Nicaragua; one in the pacific region (SSF), and nine in the central region; two of which are of the SSF-type and seven are working with a conventional system. None is working in the Caribbean region. The research into drinking water in Nicaragua is sparse because of economic limitations. ENACAL had earlier developed some research programme through funding given by the

2
Dutch and Swedish Cooperation Agencies (NUFFIC and SAREC/SIDA) to the universities. They were mainly directed towards solving operational and maintenance problems in the treatment of surface water. The consumers often report deficiencies regarding the continuity, coverage, quantity, and quality of the water supplied. The problems generated by drinking water that does not fulfil the established quality standards are reflected in the statistics of diarrhoea. About 240,000 cases of diarrhoea are reported annually; with a mortality of 500 persons per year, mostly children under the age of four years. 32,142 cases of cholera were treated in the Nicaraguan Health Centre with a mortality of 743 persons between 1992 and 1999 (CEPIS-OMS-MS, 2000). Due to this concern, a survey of four of the ten surface water treatment plants in Nicaragua was made (Publication I) with regard to the quality of the supplied water. It was found that most of values obtained in the analysis exceed the recommended values given by the Nicaraguan guidelines (CAPRE) and World Health Organisation (WHO). The evaluated parameters meet only the maximum allowable values given in the two guidelines. In that evaluation, it was also observed that the use of high chlorine doses to overcome some of the deficiencies of the water treatment plants caused rejection of the water by the consumers because of disagreeable odour, flavour and stomach irritation. Based on these results and considering the risk to the population health of using high chlorine doses in the drinking water treatment, it was decided to study the chlorination by-products (CBPs) which are formed when organic matter reacts with chlorine. Trihalomethanes (THMs), which are by-products of the disinfection with chlorine, were found at the four plants evaluated (Publication III), with concentrations exceeding, in many cases, the maximum contaminant levels set by the United States Environmental Protection Agency, USEPA (1998). Finally a detailed study was carried out in order to study the effects on THM formation of variations in pH, temperature, contact time, and chlorine dose. The THM formation was studied for waters treated by conventional coagulation and by enhanced coagulation. Empirical statistical models were also developed using the database generated in this research. 1.2 Objectives The main objective of this research was to study the formation of trihalomethanes in a conventional facility in Nicaragua. The effects of variations in pH, contact time, chlorine dose, and temperature on the THM formation was investigated on a laboratory scale for waters treated by conventional and enhanced coagulation. The results were compared with some predictive models as well. Since the results obtained using the predictive models were not sufficiently good, empirical models were developed using the database generated in this study.

3
1.3 Outlines Chapter 2 presents the mechanisms and factors influencing the formation of chlorination by-products (CBPs). In Chapter 3, treatments to reduce the concentration of CBPs are shown, and empirical model equations for predicting trihalomethane formation are also included. Chapter 4 then describes the experimental part; and the results and discussions are presented in Chapter 5. Finally, Chapter 6 concludes this work.
4
2 MECHANISM AND FACTORS THAT AFFECT THE FORMATION OF CHLORINATION BY-PRODUCTS (CBPs)
Rook (1974) observed that chlorine can react with organic matter such as humic and fulvic acid to form chlorination by-products (CBPs) like trihalomethanes (THMs) and haloacetic acids (HAAs), which are considered to be potentially carcinogenic. CBPs have different chemical and toxicological properties and they may enter the human body by ingestion, inhalation or dermal absorption. Several researchers (Ivancev et al. 1999; Diehl et al. 2000; Mougdal et al. 2000; Graves et al. 2001; Hsu et al. 2001; Takanashi et al. 2001; Cedergren et al. 2002) have found that disinfection by-products have a great influence on the occurrence of cancer, growth retardation, urinary tract anomalies, spontaneous abortions, and congenital cardiac defects. Other authors (Williams et al. 1982; Kool et al. 1984; Utsumi, et al. 1992; Ueno, et al. 1996; Nissinen et al. 2002) had reported a high mutagenicity (pollutants capable of forming mutagens) in tap water. Takanashi et al. (2001) found that the level of mutagenicity in tap water was 19 times greater than in raw water. Besides, they had observed that the mutagenicity of river water was extremely low compared to that of tap water and that the mutagenicity increases dramatically as a result of chlorination during the water purification process. The concern about the health risk for the population meant that many countries have established maximum contaminant levels (MCLs) for THMs and HAAs. In 1998, the United States Environmental Protection Agency (USEPA) published the Stage 1 disinfection by-products (DBPs) rule that specified the maximum contaminant levels allowable in drinking water at 0.080, 0.060, 0.010 and 1 mg/l for THMs, HAA5, bromate, and chlorite respectively. It also suggested that enhanced coagulation (EC) was one of the best ways of removing DBP precursor material; diminishing the formation of identified and unidentified DBPs. In 2002 USEPA launched the Stage 2 disinfectants and disinfection by-products rule (DBPR), which retains the same maximum concentrations as in Stage 1. The best available technologies suggested in this Stage 2 are granular activated carbon (GAC) and nanofiltration (NF) with the reservation regarding the formation of dioxin as a by-product of GAC regeneration, while nanofiltration cannot effectively remove THMs and HAAs. Recently developed techniques indicate that sonolysis (high energy ultrasonic (US)) and ultraviolet irradiation (UV) can be used to reduce the CBP formation (Naffrechoux et al. 2003). The presence of natural organic matter in the water is measured through indicators such as total organic carbon (TOC), dissolved organic carbon (DOC), ultraviolet absorbance (UV254) and specific ultraviolet absorbance (SUVA). Other indicators are colour and turbidity. New techniques such as adsorption chromatography, membrane filtration and fluorescence spectrometry are being developed to isolate aquatic organic matter in order to determine whether hydrophilic or hydrophobic matter or both have an influence on the formation of disinfection by-products (Kitis, 2001). Information relating to the mechanism of formation of THMs is still limited; attempts to develop kinetic or statistical models for the formation of disinfection by-products (DBP) have been impeded by the substantial costs and effort required for analysing the DBPs. These difficulties restrict the amount of data that can be obtained by the chlorination

5
reaction in laboratory or field studies, and they thus limit the information available to formulate or test models of a reaction sequence. The distribution of the halogenated CBPs depends upon a number of factors: bromine and/or chlorine concentration, contact time, pH, temperature, and the natural organic matter (NOM). Generally, trihalomethanes are the most common compounds of the CBPs found in drinking water (Singer, 1999; Wattanachira et al. 2004). In Nicaragua, three years after the publication of the DBP regulations (USEPA, 1998), maximum contaminant levels of THMs (0.460 mg/l) and HAAs (0.25 mg/l) were included in the guideline for drinking water but the values are far from of those defined by USEPA (1998). ENACAL does not analyse surrogate NOM and DBPs parameters because the equipment to measure these parameters is not available in the country. 2.1 CBP Formation Mechanism The formation of chlorination by-products in drinking water is the result of a reaction between natural organic matter (NOM) and chlorine: NOM + Chlorine Compound → CBPs (2.1) Natural organic matter is a heterogeneous mixture of humic substances, hydrophilic acids, proteins, lipids, carbohydrates, carboxylic acids, amino acids, and hydrocarbons. Reaction mechanisms between halogens and NOM include substitution into the NOM producing organic halides and oxidation of carbon bonds. Because of a lack of information on the chemical structures of humic and fulvic substances, the mechanism of CBP formation is not well understood. The site-specific behaviour and the heterogeneous nature of the natural organic matter make the situation more difficult. Rook (1997) set the base for the study of the mechanism of formation of DBPs and proposed a pathway for this reaction type. He indicated that the haloform reaction occurs with the resorcinol type component of fulvic acids. The proposed pathway involves a fast chlorination of the carbon atom that is activated by OH- substituents or phenoxide ions in an alkaline environment. Hypochlorous acid (HOCl) is the typical source of the electrophilic halogenating species Cl+. The reaction initially gives an intermediate carbanion (a carbon atom which has a negative charge) which is rapidly halogenated to the product presented in Figure 2.1. After the aromatic structure has been halogenated and opened, a break at a will result in the formation of a THM. Alternatively, an oxidative and hydrolytic break at b will yield an HAA or chloral hydrate, whereas a break in c will yield a haloketone. If bromide is present, mixed bromochloro by-products will be formed. Westerhoff et al. (2004) reported that this is because electrophilic (aromatic) substitution for electron release to stabilize carbocation is more favourable for the bromine atom due to its higher electron density and smaller bond strength than the chlorine atom. This is despite the fact that hypochlorous acid, HOCl (Eo
red = +1.630 V) has a higher redox potential than hypobromous acid, HOBr (Eo
red = +1.331 V). Chlorine may cleave aromatic rings producing both chlorinated and oxygenated by-products. Bromine may substitute into the ring structure without cleavage.

6
Figure 2.1 Haloform reactions with fulvic acid and resorcinol. Source: Taken from Krasner, S.W. In Formation and Control of Disinfection Byproducts in Drinking Water. 1999, AWWA.
Other authors like Christman et al. (1978); Norwood et al. (1980); Reckhow and Singer (1985); Norwood et al. (1987); and Amy et al. (1998) have studied the reaction mechanisms of aromatic compounds with chlorine and have confirmed Rock’s hypothesis (1977) that two mechanisms are present in the formation of DBPs; substitution and oxidation. 2.2 Factors Affecting CBP Formation The concentration and speciation of the CBP depends on the water quality and operating conditions of the drinking water facility, including NOM concentration (hydrophobic and hydrophilic fraction), residual chlorine, reaction time, pH and bromide concentration. Effect of NOM Natural organic matter exists in surface and ground water at concentrations between 2-10 mg/l (Bolto et al. 2002), although much higher levels are sometimes found depending mainly on the watershed state. Ground water generally has a lower concentration of NOM than surface water. Organic matter in natural waters is often arbitrarily divided into dissolved (DOC) and particulate organic carbon (POC), based on filtration through a 0.45 µm filter. No natural cut off exists between these two fractions and the distinction is arbitrary, based on the filtration procedure. The definition of terms is, therefore, operational. Overlapping the dissolved and particulate fractions is the colloidal fraction, which consists of suspended solids that are operationally considered to be solutes. Generally, DOC is more abundant than POC, accounting for approximately 90% of the total organic carbon in most waters. Thurman and Malcolm (1981) reported that dissolved organic matter (DOM) is composed of a heterogeneous mixture of humic substances and non-humic substances (Figure 2.2). DOM also acts as a precursor of undesirable disinfection by-products (DBPs) such as trihalomethanes (THMs) and haloacetic acids (HAAs). At pH 1, the precipitate is called humic acid and the soluble fraction is called fulvic acid (Marhaba and Pipada, 2000). The hydrophobic fraction is generally less soluble, is of higher molecular size and contains greater aromaticity than the hydrophilic fraction and basically consists of humic and fulvic acids. The humic acid fraction is highly reactive and removable by coagulation, whereas the fulvic acid is less reactive. Nevertheless, Lin et al. (2000) and Krasner et al. (1996) have shown that the fulvic fraction has trihalomethane formation

7
potential per unit DOC comparable to that of the humic fraction. Also, Imai et al. (2003) and Owen et al. (1995) reported that the non-humic fraction reacts with chlorine and produces THM per unit DOC to an extent comparable to that of the hydrophobic fraction.
Figure 2.2 Natural organic matter. Humic substances are complex and multicomponent in nature and they cannot be described in a specific molecular term. Other constituents of NOM are amino-acids, carbohydrates, and carboxylic acids which are generally present in such low concentrations that the qualitative and quantitative analyses of specific molecules are difficult. As a result of its heterogeneous and undefined character, the amount of NOM is measured through surrogate parameters as total organic carbon (TOC), or dissolved organic carbon (DOC), or ultraviolet absorbance at 254 nm. This latter parameter is higher for humic acids because of the higher aromatic content and greater molecular size of this type of compound (Reckhow et al. 1990). Another indicator is the specific ultraviolet absorbance (SUVA), which is equal to the UV absorbance divided by the dissolved organic carbon concentration. This value has been found to be a good surrogate for the humic content of water. According with Owen et al. (1993), and Krasner (1999), humic substances have higher SUVAs and higher CBPs formation potentials (CBPFPs) than the non-humic fraction. SUVA can also provide an indication of the possible reactivity of the organic matter to form THMs and other DBPs. The formation of CBPs can be affected by the concentration and characteristics of the NOM in two ways. First, an increase in NOM concentration raises the level of CBP precursors, and this increases CBP formation. Second, an increase in the NOM concentration increases the chlorine demand of the water. A high chlorine dosage will be necessary to maintain proper chlorine residual in the distribution system. This high chlorine dose leads to a further increase in the formation of CBPs. Under the same chlorination conditions, each fraction of NOM results in a different CBP yield (Croué et al. 1999). The sources of NOM can also affect the CBP formation. There is limited information available related to the effects of NOM on CBP speciation. Xie (2004) has reported that in water containing bromide a low level of NOM generally leads to a higher percentage of brominated CBPs than a high level of NOM. This is due the fact that a higher NOM level requires a higher chlorine dosage, which leads to a lower ratio of bromide to chlorine.
NOM
Humic Fraction(Hydrophobic)
Non-Humic Fraction(less Hydrophobic)
Humic Acids
(precipitate at pH < 1)
Fulvic Acids
(precipitate at pH > 1)
Hydrophilic Acids
Proteins
Aminoacids
Carbohydrates
8
In typical drinking water, a high concentration of NOM results in high levels of THMs and HAAs. Therefore, NOM removal from the water is the key to control CBP formation in chlorinated waters. Effects of Algae The algae biomass and their extracellular products can easily react with chlorine to produce CBP precursors. Hoehn et al. (1990) observed that algal extra-cellular products, on reaction with chlorine, yielded a greater quantity of chloroform (trichloromethane) from the available TOC than did the algal biomass. They also observed that algae liberated high-yielding THM precursors in greater abundance during the late exponential phase of growth than at any other time during the algal life cycle. Trehy and Bieber (1981) found that the chlorination of certain amino acids (from algae sources) and humic acid formed acetronile acids (HANs) which are also DBPs. Effects of Bromide Bromide, an inorganic ion, does not react with NOM directly. However, inorganic bromide can be oxidized by chlorine or ozone to hypobromous acid or hypobromite depending on the pH. By analogy with hypochlorous acid and hypochlorite, both hypobromous acid and hypobromite react with NOM to form brominated DBPs. Bromine is more reactive with NOM than chlorine. In water containing bromide, brominated DBPs are formed upon chlorination and ozonation. Since bromine uses the chlorine substitution sites, the formation of chlorinated species is reduced. HOCl + Br- → HOBr + Cl- (2.2) HOCl + HOBr + NOM → DBPs (2.3) Since bromine (atomic weight 80) is much heavier than chlorine (atomic weight 35.5), the concentration of the correlated bromoform will be twice that of the chloroform. Therefore, under given chlorination conditions, an increase in bromide could significantly increase the concentration of the four THMs regulated by USEPA (Appendix A). An increase in bromide level also increases the formation of brominated HAAs and reduces the formation of chlorinated HAAs. Amy et al. (1991) found that HOCl acts as a more effective oxidant, whereas HOBr behaves as a more efficient halogen substitution agent. In addition, these authors found that, as the ratio of bromide to TOC increased, the percentage of brominated DBPs increased. This can occur when there is either an increase in bromide concentration or a decrease in TOC concentration. Effect of Chlorine Dose Chlorine is one of the two major reactants for the formation of chlorinated by-products. Some CBPs are intermediate products of chlorination reaction and others are end products. The intermediate products can be oxidized into end products according to the equations developed by Xie (2004):

9
NOM + HOCl → Intermediate Products (2.4) Intermediate Products + HOCl → End Products (2.5) In general, an increasing chlorine dose increases the formation of chlorination end products in the treated water. THMs are typical end products of chlorination reactions. Many monohalogenated and dihalogenated CBPs are intermediate products, with the exception of monohaloacetic acids and dihaloacetic acids. Further chlorination of these intermediate by-products can result in the formation of dihalogenated, trihalogenated, and other CBPs. At a moderate level of chlorine residual, dihalogenated CBPs are formed. A further increase in the chlorine dosage leads to an increase in trihalogenated CBPs and a reduction in dihalogenated CBPs. In the HAAs, both monohaloacetic acids and dihaloacetic acids are end products. The reaction between dichloroacetic acid and chlorine is not the mechanism for the formation of trichloroacetic acid. In the case of dichloroacetonitrile, an increase in free chlorine residual may result in the formation of chloroacetic acid.
0
0.01
0.02
0.03
0.04
0.05
THM
s (m
g/l)
0.5 1 1.5 2
Chlorine dose (mg/l)
CC
EC
Figure 2.3 Influence of chlorine dose on THM formation.
Bank and Wilson (2002), and Xie (2004) reported that increasing the chlorine dose increases the formation of THMs, HAAs and many other chlorinated disinfection by-products (Figure 2.3). However, Singer (1994) indicated that a high chlorine dose favoured HAA rather than THM formation, the formation of trihalogenated HAAs being higher than that of di-and mono-halogenated HAAs. A similar finding was reported earlier by Reckhow and Singer in 1985. Effect of Temperature Krasner (1999) analyzed the data of 35 utilities in United States and found that the mean THM formation was highest in summer and lowest in winter. Most of the other CBPs, except the haloketones, followed the same behaviour as the THMs. Stevens et al. (1976) and Singer (1999) found the same tendency. The lower temperature in the winter suggests less reactivity and a lower rate of production of final end products.

10
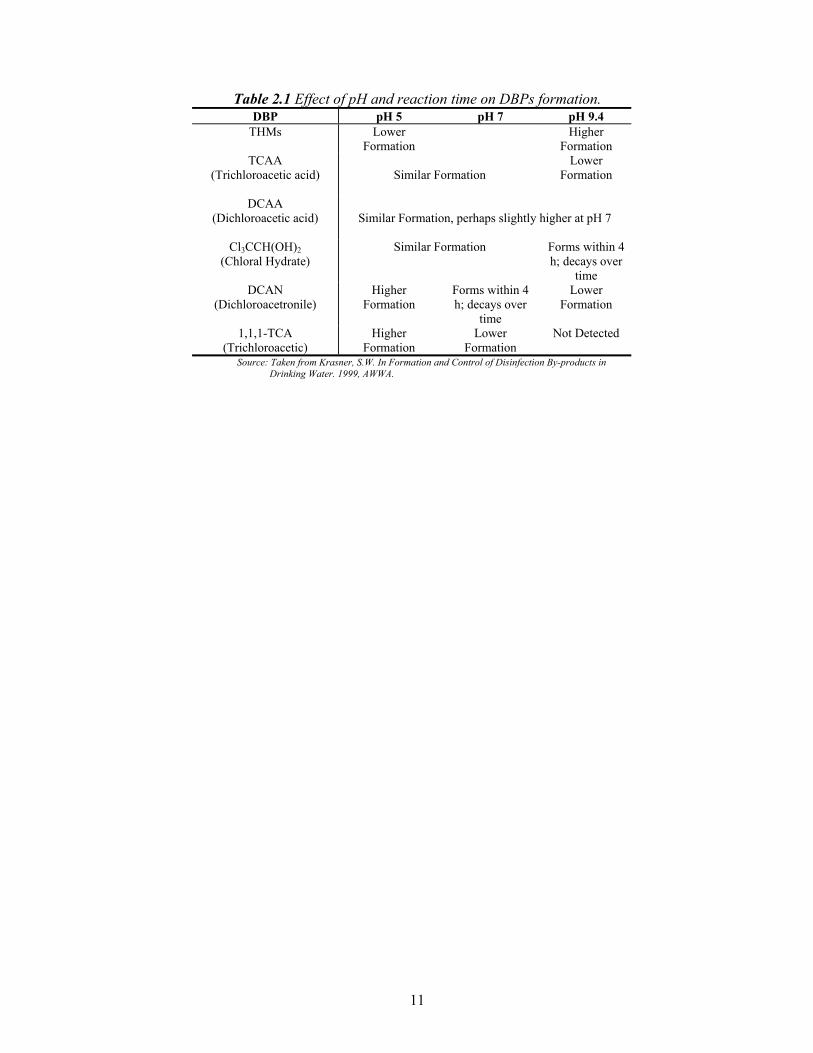
Williams et al. (1997) in a review of disinfection by-products in Canadian drinking water, found that the total trihalomethane (TTHM) levels were higher in summer than in winter. They showed that TTHMs and HAAs were the major DBPs found in all the facilities evaluated, the HAA levels often equalled or exceeded the total THMs concentrations. Krasner (1999) also showed that seasonal variations would also affect the nature of the organic precursors, which may vary in composition with the season. He also observed that DOC and UV values were higher after rainfall. These increases can be attributed to the leaching of soil organic matter during high river discharges. Effect of Contact Time One of the most important factors in THM formation is the time during which a particular disinfectant remains in contact with the precursors. Koch et al. (1991) and Singer (1999) indicate that the concentration of THMs rises quickly during the first hours. Xie (2004) also reported that if CBPs are an end product, increasing the reaction time will increase the formation of CBPs (THMs and HAAs). However, if CBPs are an intermediate product (dichloroacetonitrite, dichloropropanone), increasing the reaction time may decrease the formation of CBPs, especially at high chlorine doses. Since THMs are typical hydrolysis products and chlorination end products, the formation of THMs is increased by increasing the reaction time. Effect of pH In general, a high pH results in a higher level of THMs but a lower level of HAAs and other halogenated CBPs including total organic halide (TOX). Several authors, such as Morris and Baum (1978), Stevens et al. (1976), Fleischacker and Randtke (1983), Reckhow and Singer (1985) have observed that the chlorination of most of organic compounds led to larger amounts of chloroform at higher pH values. Stevens et al. (1989) evaluated the effects of pH and reaction time on CBP formation. They observed that the formation of THM increased with time especially over the first 48 hours. However, THM formation was higher at a higher pH. The HAA formation increased over time, but in the range from 5 to 9.4 the pH had no significant effect on dichloroacetic acid (DCCA) formation. Trichloroacetic acid (TCAA) formation was lower at a pH of 9.4 than at the lower pH levels. The speciation of chlorine can also be affected by pH. At low pH, the dominant chlorine species is HClO. At high pH, the dominant species is ClO-. In general, a low pH favours the formation of HAAs, trihaloacetalhydes, trihalopropanones, and cyanogen halides, whereas a high pH favours the formation of trihalomethanes. Krasner (1999) presents a summary of the effect of pH and reaction time on the formation of DBPs as in Table 2.1.
11
Table 2.1 Effect of pH and reaction time on DBPs formation. DBP pH 5 pH 7 pH 9.4
THMs Lower Formation
Higher Formation
TCAA (Trichloroacetic acid)
Similar Formation
Lower Formation
DCAA (Dichloroacetic acid)
Similar Formation, perhaps slightly higher at pH 7
Cl3CCH(OH)2 (Chloral Hydrate)
Similar Formation Forms within 4 h; decays over
time DCAN
(Dichloroacetronile) Higher
Formation Forms within 4 h; decays over
time
Lower Formation
1,1,1-TCA (Trichloroacetic)
Higher Formation
Lower Formation
Not Detected
Source: Taken from Krasner, S.W. In Formation and Control of Disinfection By-products in Drinking Water. 1999, AWWA.
12
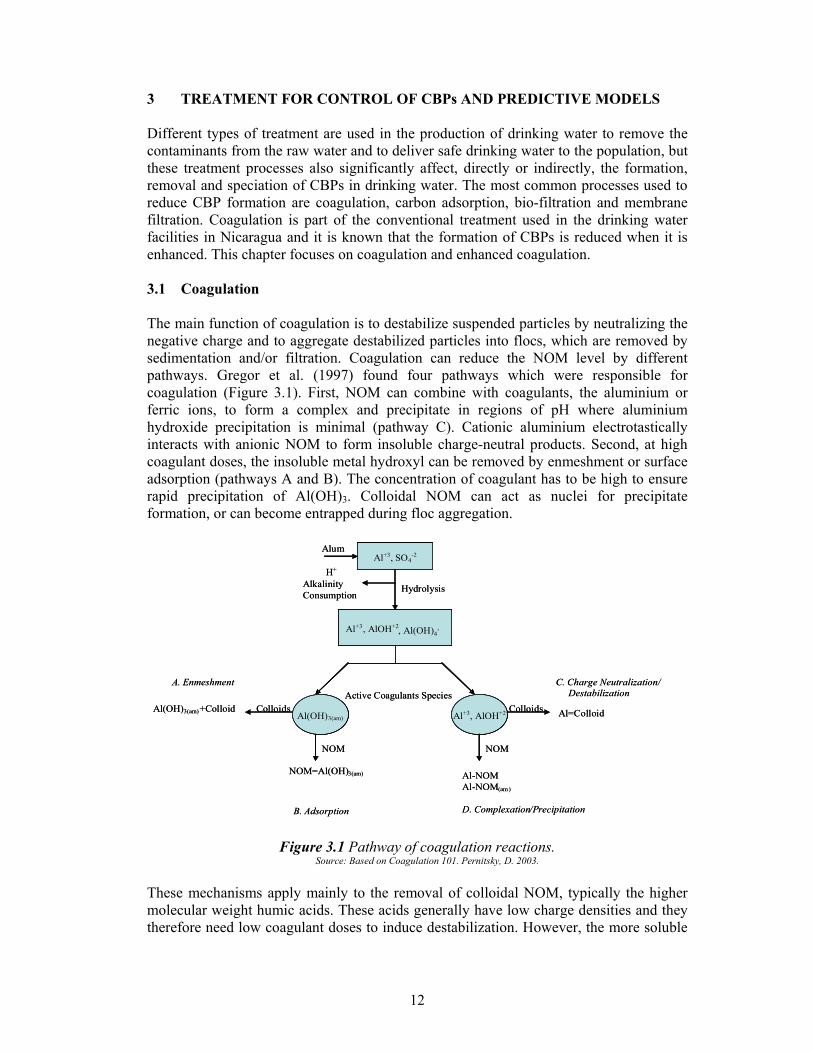
3 TREATMENT FOR CONTROL OF CBPs AND PREDICTIVE MODELS Different types of treatment are used in the production of drinking water to remove the contaminants from the raw water and to deliver safe drinking water to the population, but these treatment processes also significantly affect, directly or indirectly, the formation, removal and speciation of CBPs in drinking water. The most common processes used to reduce CBP formation are coagulation, carbon adsorption, bio-filtration and membrane filtration. Coagulation is part of the conventional treatment used in the drinking water facilities in Nicaragua and it is known that the formation of CBPs is reduced when it is enhanced. This chapter focuses on coagulation and enhanced coagulation. 3.1 Coagulation The main function of coagulation is to destabilize suspended particles by neutralizing the negative charge and to aggregate destabilized particles into flocs, which are removed by sedimentation and/or filtration. Coagulation can reduce the NOM level by different pathways. Gregor et al. (1997) found four pathways which were responsible for coagulation (Figure 3.1). First, NOM can combine with coagulants, the aluminium or ferric ions, to form a complex and precipitate in regions of pH where aluminium hydroxide precipitation is minimal (pathway C). Cationic aluminium electrotastically interacts with anionic NOM to form insoluble charge-neutral products. Second, at high coagulant doses, the insoluble metal hydroxyl can be removed by enmeshment or surface adsorption (pathways A and B). The concentration of coagulant has to be high to ensure rapid precipitation of Al(OH)3. Colloidal NOM can act as nuclei for precipitate formation, or can become entrapped during floc aggregation.
Al+3, SO4-2
Alum
H+
AlkalinityConsumption
Hydrolysis
Al+3, AlOH+2, Al(OH)4-
Al(OH)3(am) Al+3, AlOH+2
Active Coagulants SpeciesColloids
NOM
Colloids
NOM
Al=Colloid
C. Charge Neutralization/Destabilization
Al-NOMAl-NOM(am)
D. Complexation/PrecipitationB. Adsorption
NOM=Al(OH)3(am)
Al(OH)3(am)+Colloid
A. Enmeshment
Figure 3.1 Pathway of coagulation reactions. Source: Based on Coagulation 101. Pernitsky, D. 2003.
These mechanisms apply mainly to the removal of colloidal NOM, typically the higher molecular weight humic acids. These acids generally have low charge densities and they therefore need low coagulant doses to induce destabilization. However, the more soluble
13
fraction of NOM (fulvic acids) has a higher anionic charge density that facilitates their dissolution. The sweep coagulation (enmeshment) mechanism (pathway A), which operates most effectively on colloidal NOM, does not seem to be effective for these soluble fulvic acids. Charge neutralization (pathway C) may remove soluble fulvic acids, but high doses of coagulants are necessary to neutralise the high anionic charge. The high coagulant dose required by soluble fulvic acids seems to correspond to an overdosing of humic acid colloids which leads to a restabilisation of the colloids. A mechanism that is seldom mentioned is the chemical interaction of soluble NOM with soluble coagulant metal ions such as aluminium (pathway D). The metal cation and the complexed NOM remain in solution until either the binding capacity of the NOM has been satisfied, or the solubility of the metal–NOM complex is exceeded. The complex does not need to be charge-neutral to precipitate. A considerable amount of NOM can thus be removed by coagulation, sedimentation and filtration, especially at low pH (5.5 for alum) and/or higher coagulant doses.
Omelia et al. (1999) indicate that the doses of coagulants required are determined by the content of NOM rather than by the turbidity. Primarily due to the negative charge carried by NOM, there is a stoichiometric relationship between the required dose of coagulant and the TOC concentration in the water to be treated. After coagulation, the dominance of lower molecular weight materials increases considerably. Chemistry of Particulates Inorganic particles are found in large quantities in natural waters. They consist of clay, iron oxides, silicates, calcites, aluminium oxides and many other minerals. However, all these particles in the watersheds show similar electrochemical behaviour, since their surfaces are generally covered with surface hydroxyl (OH-) groups. Depending of the solution pH, the charges of these hydroxyl groups may be positive or negative. Similar surfaces are also found on organic particles. Under certain conditions, particles can be effectively destabilized by the neutralization of these surface charges by positively charged coagulant species (pathway C). The dosage of coagulants that destabilize particles by charge neutralization will depend on the turbidity. In many cases, an amount of coagulant in excess of that required for reaction with the particle charge is needed to react with NOM. An excess of coagulant is added to produce large amount of flocs that settle quickly. In these situations, suspended particles are removed by enmeshment in precipitated flocs, and turbidity has little effect on the required coagulant dose (pathway A). Chemistry of NOM NOM is produced by decaying vegetation, organic soils, and biological activity. NOMs from different source materials have different characteristics. NOMs generally have large molecules and contains many functional groups that affect their chemical behaviour. The charges of these functional groups can also change with pH. Many authors have demonstrated that, for most surface waters, coagulation doses are dominated by NOM concentration rather than by turbidity (Thurman, 1981; Edzwald and Van Benschoten, 1990; Croué et al. 1999).

14
Positively charged coagulation species can form Al-NOM precipitates that can be removed in subsequent solids separation processes (pathway D). The charge density of these functional groups is typically 10 to 100 times greater than the charge density of inorganic particles (Pernitsky, 2003). The characteristics and quantities of NOM present in the water determine whether the NOM controls the coagulant doses and how much NOM is removed by coagulation. Coagulation has been shown to be most effective in removing NOMs in the intermediate and high molecular weight ranges. Analytical techniques to fractionate organic matter are very complex and expensive, and this makes it impossible to routinely monitor parameters to control coagulation at the drinking water plants on a daily basis. For that reason, the concept of specific ultraviolet absorbance (SUVA) was developed as an indicator of the nature of NOM and the effectiveness of coagulation in removing NOM, TOC, and DBP precursors (Edzwald and Van Benschoten, 1990; Edzwald and Tobiason, 1999). SUVA offers a simple characterization of the NOM based on UV absorbance by a water sample with respect to DOC. SUVA is expressed as the absorbance in m-1 per mg/l of DOC.
)(
100*)( 1254
lmgDOC
cmUVSUVA
−
= (3.1)
A water facility having a SUVA value less than 2 l/mg-m in a month is in compliance with the regulations of USEPA (1998) for DBPs and it is then not necessary to practice removal of TOC by enhanced coagulation or precipitative softening. Edzwald and Tobiason, (1999) present the guidelines for the interpretation of SUVA shown in Table 3.1. Water with a SUVA value of 2 l/mg-m or less is considered difficult to treat by coagulation and TOC will not control the coagulant doses. In contrast, water with a higher SUVA is considered to be easy to treat because the amount of NOM present in the water typically has a greater coagulant demand than the particles. For these waters, the required coagulant dose increases with increasing TOC.
Table 3.1 Guideline on the nature of NOM and expected DOC removal. SUVA Composition Coagulation DOC Removals
< 2 Mostly Non-Humics Low Hydrophobicity
Low molecular weight
NOM has little influence Poor DOC removals
< 25% for Alum Little greater for ferric
2 – 4 Mixture of Aquatic Humic and other NOM
Mixture of Hydrophobic and Hydrophilic NOM
Mixture of Molecular Weights
NOM influences
DOC removal should be fair to good
25-50% for Alum
Little greater for ferric
> 4 Mostly Aquatic Humics High Hydrophobicity
High Molecular weight
NOM control Good DOC removals
50% for Alum Little greater for ferric
Source: Taken from Edzwald and Tobiason, 1999.

15
Xie (2004) reported that the reduction of NOM after coagulation lowers the chlorine demand and chlorine dose. This can result in a significant reduction in chlorinated DBPs and a dramatic increase in brominated DBPs if bromides are present. Coagulant Chemistry In developing countries, alum is the main coagulant used in the drinking water plants. Under water treatment conditions, alum chemistry can be described by the presence of three species, Al+3, Al(OH)+2, and Al(OH)4
-, in equilibrium with an amorphous Al(OH)3(am) solid phase (Edzwald and Van Beschoten, 1990). The distribution of these species depends on the pH, as shown in Figure 3.2. The figure shows that alum is least soluble at pH 6. This means that, at pH 6, the maximum amount of coagulant is converted to solid-phase floc particles. At pH values higher or lower than this pH of minimum solubility, dissolved Al levels in the treated water increase. At pH values less than the pH minimum solubility, the charged Al+3, and Al(OH)4
- species are the most prevalent dissolved species. The solid phase formed upon precipitation, Al(OH)3(am), has a surface charge that is dependent on the pH, due to the hydroxyl groups present. For inorganic material and NOM, the surface charge is more positive at lower pH. This has implications for the adsorption of NOM onto the floc surface and the filterability of the floc. Another coagulant is the polyaluminium chloride (PACl) that has chemistry similar to that of alum, except that PACls contain highly charged polymeric aluminium species as well as the monomers mentioned above. PACls are more soluble and have a higher pH of minimum solubility than alum. For different PACls, the pH of minimum solubility increases with increasing basicity and is higher than that of alum. This means that PACls can be used at a higher pH values without resulting in elevated dissolved Al levels (Pernitsky and Edzwald, 2003).
0
10
20
30
40
50
60
70
80
90
100
3 4 5 6 7 8 9 10
pH
Perc
ent o
f Tot
al D
osed
Soluble Forms
Insoluble Forms
Al+3Al(OH)4-
Al(OH)+2
Figure 3.2 Aluminium solubility as a function of pH.
16
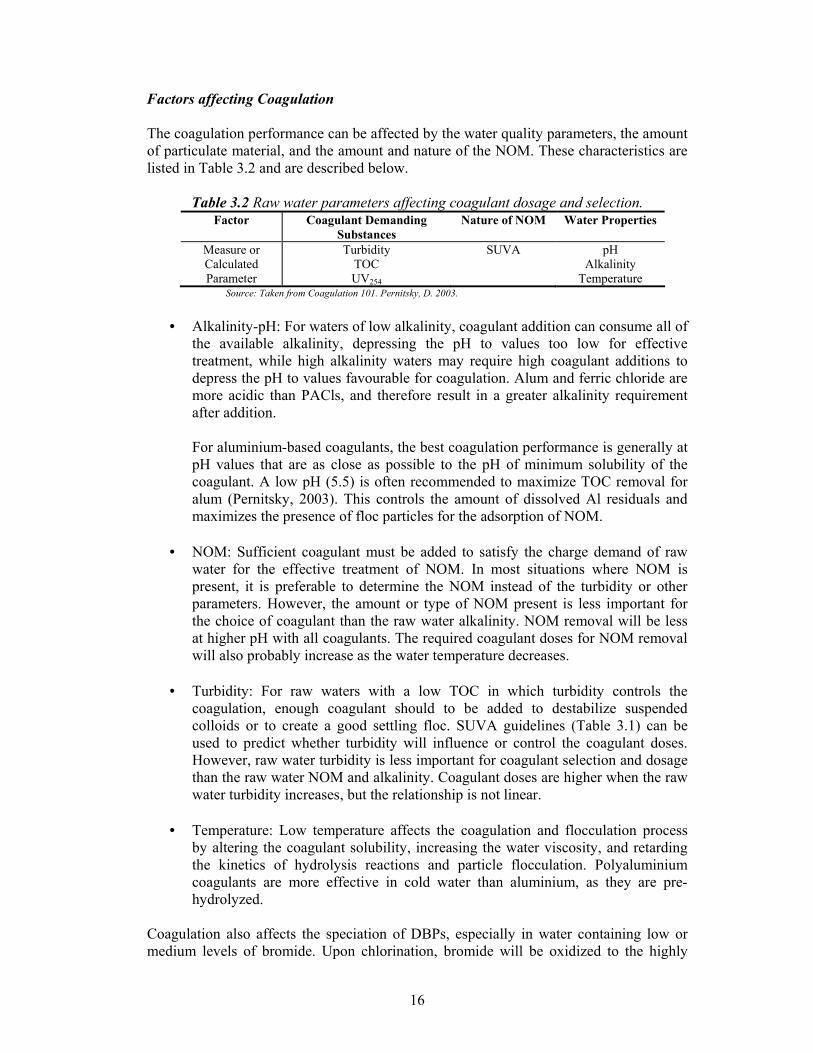
Factors affecting Coagulation The coagulation performance can be affected by the water quality parameters, the amount of particulate material, and the amount and nature of the NOM. These characteristics are listed in Table 3.2 and are described below.
Table 3.2 Raw water parameters affecting coagulant dosage and selection. Factor Coagulant Demanding
Substances Nature of NOM Water Properties
Measure or Calculated Parameter
Turbidity TOC UV254
SUVA pH Alkalinity
Temperature Source: Taken from Coagulation 101. Pernitsky, D. 2003.
• Alkalinity-pH: For waters of low alkalinity, coagulant addition can consume all of
the available alkalinity, depressing the pH to values too low for effective treatment, while high alkalinity waters may require high coagulant additions to depress the pH to values favourable for coagulation. Alum and ferric chloride are more acidic than PACls, and therefore result in a greater alkalinity requirement after addition.
For aluminium-based coagulants, the best coagulation performance is generally at pH values that are as close as possible to the pH of minimum solubility of the coagulant. A low pH (5.5) is often recommended to maximize TOC removal for alum (Pernitsky, 2003). This controls the amount of dissolved Al residuals and maximizes the presence of floc particles for the adsorption of NOM.
• NOM: Sufficient coagulant must be added to satisfy the charge demand of raw
water for the effective treatment of NOM. In most situations where NOM is present, it is preferable to determine the NOM instead of the turbidity or other parameters. However, the amount or type of NOM present is less important for the choice of coagulant than the raw water alkalinity. NOM removal will be less at higher pH with all coagulants. The required coagulant doses for NOM removal will also probably increase as the water temperature decreases.
• Turbidity: For raw waters with a low TOC in which turbidity controls the
coagulation, enough coagulant should to be added to destabilize suspended colloids or to create a good settling floc. SUVA guidelines (Table 3.1) can be used to predict whether turbidity will influence or control the coagulant doses. However, raw water turbidity is less important for coagulant selection and dosage than the raw water NOM and alkalinity. Coagulant doses are higher when the raw water turbidity increases, but the relationship is not linear.
• Temperature: Low temperature affects the coagulation and flocculation process
by altering the coagulant solubility, increasing the water viscosity, and retarding the kinetics of hydrolysis reactions and particle flocculation. Polyaluminium coagulants are more effective in cold water than aluminium, as they are pre-hydrolyzed.
Coagulation also affects the speciation of DBPs, especially in water containing low or medium levels of bromide. Upon chlorination, bromide will be oxidized to the highly

17
reactive hypobromous acid and hypobromite. Prior to coagulation, a large quantity of NOM is available to react with both free chlorine and reactive hypobromous acid and hypobromite. At low bromide levels, a large amount of chloroform and some brominated THMs will be formed upon chlorination. Coagulation selectively removes NOM but not bromide from the water. Because of the reduced level of NOM and a relatively higher level of bromide after coagulation, more brominated THMs will be formed although the total THM level, especially of chloroform, is reduced. 3.2 Enhanced Coagulation In some cases, conventional coagulation is not sufficient to remove natural organic matter in the quantities that are necessary to stop the formation of DBPs. USEPA (1998) under the disinfectants and disinfection by-products (DBPR) rule identified enhanced coagulation as one of the two best technologies to control DBPs. The enhanced coagulation process is defined as an optimized coagulation process for removing DBP precursors, or natural organic matter (NOM). NOM is measured as total organic carbon (TOC) or dissolved organic carbon (DOC). In general, enhanced coagulation is practiced at higher coagulation doses and lower pH values. Crozes et al. (1995) report that enhanced coagulation is a valuable method of controlling DBP formation which does not require significant capital investments, a process that can be useful in developing countries where it is almost impossible to afford high technologies. An example of the effect of enhanced coagulation on the raw water TOC is shown in Figure 3.3 (In Publication III). With alum doses of 20 to 60 mg/l, TOC removals of approximately 85-90% were obtained. UV254 was also removed almost completely when a dose of 60 mg/l of alum was used.
0
5
10
15
20
25
0 20 40 60 80
Alum Dosages (mg/l)
TOC
(mg/
l)
P1
P2
P3
P4
Figure 3.3 Enhanced coagulation of the different raw water sources.
Enhanced Coagulation Requirement According to USEPA Stage 1 (1999), a TOC concentration higher than 2 mg/l in the raw water is the trigger for the implementation of enhanced coagulation or softening. Waters with a TOC level less than 2 mg/l do not require enhanced coagulation or softening, since the NOM is formed mainly by fulvic acids which are less reactive with chlorine. Stage 1
18
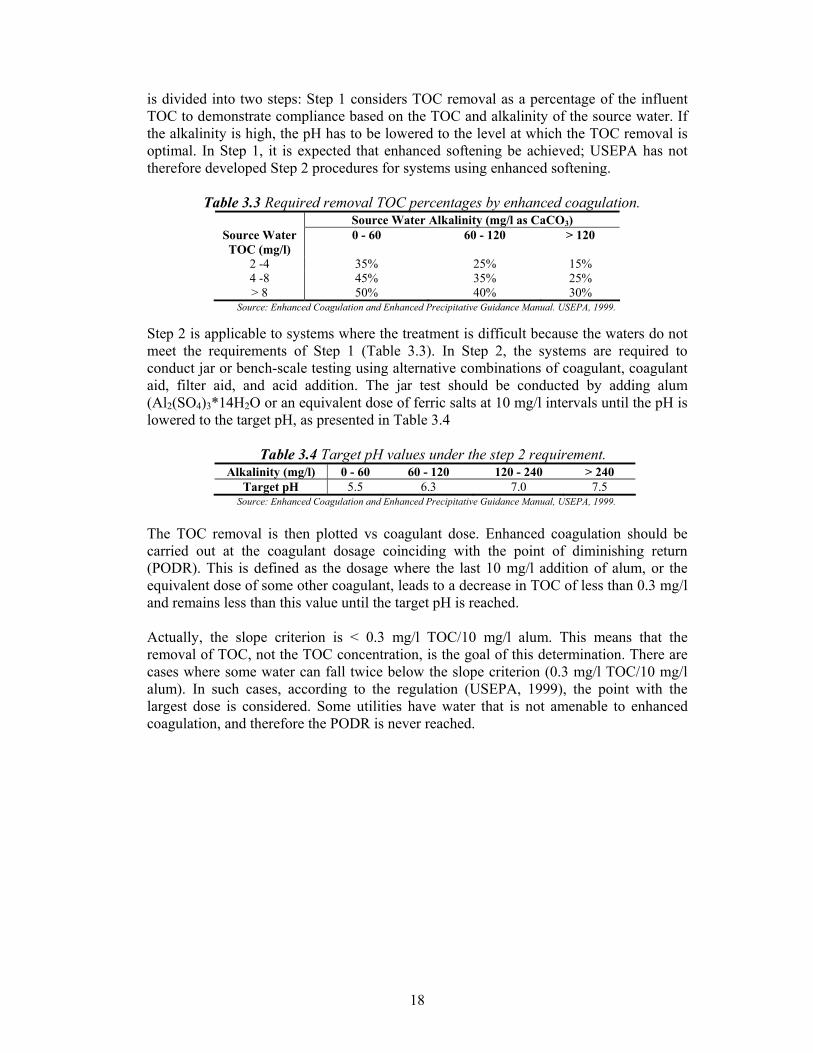
is divided into two steps: Step 1 considers TOC removal as a percentage of the influent TOC to demonstrate compliance based on the TOC and alkalinity of the source water. If the alkalinity is high, the pH has to be lowered to the level at which the TOC removal is optimal. In Step 1, it is expected that enhanced softening be achieved; USEPA has not therefore developed Step 2 procedures for systems using enhanced softening.
Table 3.3 Required removal TOC percentages by enhanced coagulation. Source Water Alkalinity (mg/l as CaCO3)
Source Water TOC (mg/l)
0 - 60 60 - 120 > 120
2 -4 35% 25% 15% 4 -8 45% 35% 25% > 8 50% 40% 30%
Source: Enhanced Coagulation and Enhanced Precipitative Guidance Manual. USEPA, 1999. Step 2 is applicable to systems where the treatment is difficult because the waters do not meet the requirements of Step 1 (Table 3.3). In Step 2, the systems are required to conduct jar or bench-scale testing using alternative combinations of coagulant, coagulant aid, filter aid, and acid addition. The jar test should be conducted by adding alum (Al2(SO4)3*14H2O or an equivalent dose of ferric salts at 10 mg/l intervals until the pH is lowered to the target pH, as presented in Table 3.4
Table 3.4 Target pH values under the step 2 requirement. Alkalinity (mg/l) 0 - 60 60 - 120 120 - 240 > 240
Target pH 5.5 6.3 7.0 7.5 Source: Enhanced Coagulation and Enhanced Precipitative Guidance Manual, USEPA, 1999.
The TOC removal is then plotted vs coagulant dose. Enhanced coagulation should be carried out at the coagulant dosage coinciding with the point of diminishing return (PODR). This is defined as the dosage where the last 10 mg/l addition of alum, or the equivalent dose of some other coagulant, leads to a decrease in TOC of less than 0.3 mg/l and remains less than this value until the target pH is reached. Actually, the slope criterion is < 0.3 mg/l TOC/10 mg/l alum. This means that the removal of TOC, not the TOC concentration, is the goal of this determination. There are cases where some water can fall twice below the slope criterion (0.3 mg/l TOC/10 mg/l alum). In such cases, according to the regulation (USEPA, 1999), the point with the largest dose is considered. Some utilities have water that is not amenable to enhanced coagulation, and therefore the PODR is never reached.

19
0
1
2
3
4
5
6
7
8
9
0 10 20 30 40 50 60 70Equivalent Alum Dosages (mg/l)
Settl
ed W
ater
TO
C (m
g/l)
Figure 3.4 PODR after enhanced coagulation application.
The Figure 3.4 shows the point of diminishing return (PODR) at an alum dosage of 40 mg/l for a raw water source at one of the drinking water plants evaluated (Publication III). The figure also shows that TOC concentration before the PODR is reached decreases from 8.03 to 3.44 mg/l, equivalent to a removal of 57.2 %. Enhanced coagulation can however be accompanied by secondary effects, such as corrosion, primary disinfection, inorganic constituent levels, and particle removal. It can also require process modifications due to the handling, treatment, operation and disposal of the sludge generated. According to Carlson et al. (2000), none of these secondary effects are sufficient to make it impossible to use enhanced coagulation, but mitigating action may be required in some cases. 3.3 Chlorination By-products Models Two types of models have been used to describe the CBP behaviour; empirical models and chlorination decay models (mechanistic models). The importance of the models lies in that they can be useful to predict the concentration of THMs without making additional tests, so that they reduce the time and cost of the operation at the facility. Also, the models are powerful in assessing the effects of operating conditions such as changing pH, temperature, time, and disinfection doses. Empirical models for predicting the formation of DBPs and their precursors have been developed on the basis of pilot study data and statistical approaches. Chlorination by-product precursors or chlorination by-products themselves are treated as dependent variables and the water quality parameters and process parameters are the independent variables. These empirical relationships which allow THM and HAA concentrations to be estimated from more easily measured parameters are therefore of practical interest. They may be used in several ways. They can be used for process control, where the needed information can thus be obtained faster and with less expense. Empirical models can also be used to evaluate the relative impact of individual parameters on process performance. Moreover, a sensitivity analysis is directly included in the model. Finally, empirical

20
models can also provide a convenient way of summarizing large data sets and of determine the treatability of different waters.
Mechanistic models are expected to be more robust and flexible than purely empirical models. Mechanistic models may also provide an insight into the processes being modelled and may capture the features of chlorine/NOM reactions. For kinetic models, it is therefore desirable to reflect the underlying chemistry to the greatest extent possible. Mechanistic modelling has been considered impractical due to the complexity of the NOM molecules and the NOM/chlorine reaction pathways. However, more complex computations have become feasible as a result of recent advances in computer technology. Efforts to model chlorine decay in natural waters began before 1950 (McClellan et al. 2004) and a number of studies have been conducted where chlorine decay has been modelled in the contexts of drinking water, waste water, and power plant cooling water. The most widely used equation for modelling chlorine decay has been a first-order exponential decay function. Empirical Models Amy et al. (1987) developed an empirical model which was the base for the USEPA (1998) water treatment plant model. This Amy model was based on high chlorine doses applied to raw/untreated water sources. Simulations using the model were reported to under-predict full-scale data (Yoon et al. 2004). In 1998, Amy et al. presented additional models that were based on lower chlorine doses applied to either raw untreated water or chemically coagulated (conventional) treated waters. These new models can predict THMs (total and four species), HAA6 (total and six species), and chloral hydrate (CH). These models are usually of two types: multiple linear and multiple non-linear regressions (Amy et al. 1998): Linear models: .....11 ++= XbbY o (3.2) Logarithmic models: logY = logbo + b1 log X1 + ..... (3.3) Multiple power function: Y =10bo (X1)
b1 ..... (3.4) Non-linear models: .....2
11 ++= bo XbbY (3.5)
Where Y is the dependent variable (e.g. DBP concentration) and Xis are the independent variables, i.e. water parameters (e.g., pH, T, DOC and UV concentration) and treatment variables (chlorine doses and time). The multiple power function models are equivalent to the logarithmic models. For example, models for raw waters may take the form of a multiple power function (Yoon et al. 2004):
fedcba timepHClTempBrDOCkTHMs )()()()()()( 2−= (3.6)
where the independent parameters DOC, Br-, Temp, Cl2, pH and time correspond to the dissolved organic carbon (mg/l), bromide concentration (µg/l), temperature (oC), chlorine
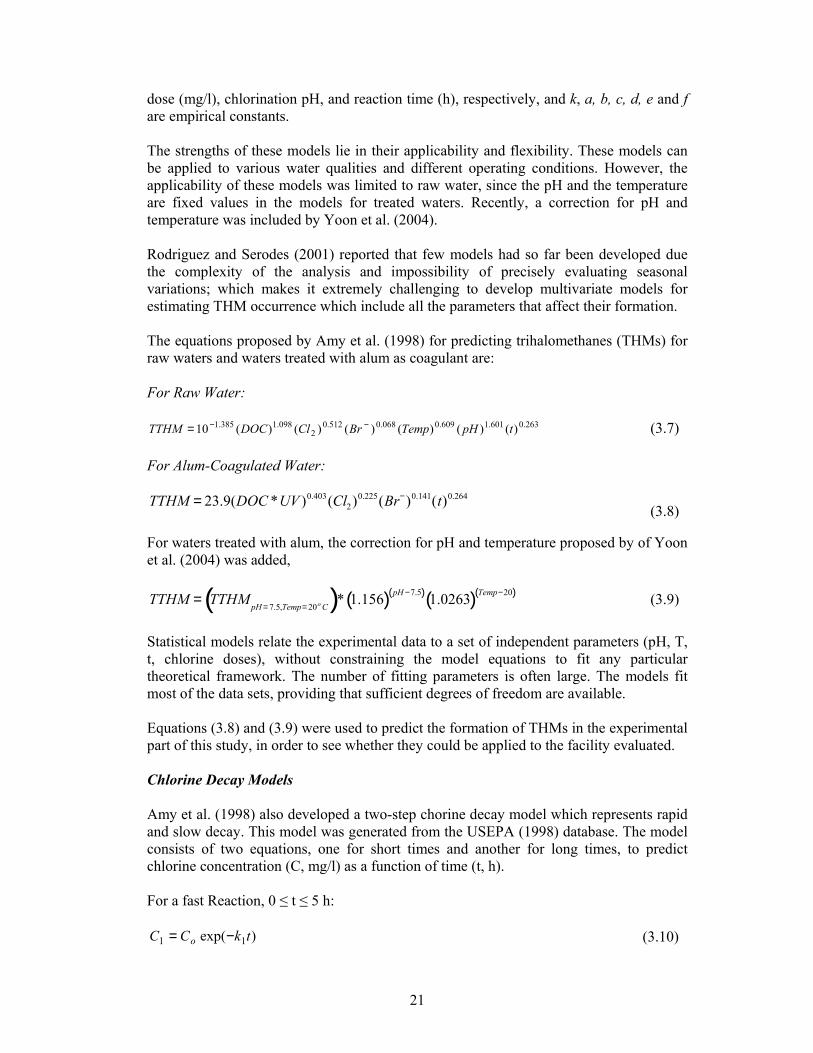
21
dose (mg/l), chlorination pH, and reaction time (h), respectively, and k, a, b, c, d, e and f are empirical constants. The strengths of these models lie in their applicability and flexibility. These models can be applied to various water qualities and different operating conditions. However, the applicability of these models was limited to raw water, since the pH and the temperature are fixed values in the models for treated waters. Recently, a correction for pH and temperature was included by Yoon et al. (2004). Rodriguez and Serodes (2001) reported that few models had so far been developed due the complexity of the analysis and impossibility of precisely evaluating seasonal variations; which makes it extremely challenging to develop multivariate models for estimating THM occurrence which include all the parameters that affect their formation. The equations proposed by Amy et al. (1998) for predicting trihalomethanes (THMs) for raw waters and waters treated with alum as coagulant are: For Raw Water:
263.0601.1609.0068.0512.02
098.1385.1 )()()()()()(10 tpHTempBrClDOCTTHM −−= (3.7) For Alum-Coagulated Water: TTHM = 23.9(DOC *UV )0.403(Cl2)0.225(Br−)0.141(t)0.264
(3.8)
For waters treated with alum, the correction for pH and temperature proposed by of Yoon et al. (2004) was added, TTHM = TTHM
pH =7.5,Temp=20o C( )* 1.156( ) pH −7.5( ) 1.0263( ) Temp−20( ) (3.9)
Statistical models relate the experimental data to a set of independent parameters (pH, T, t, chlorine doses), without constraining the model equations to fit any particular theoretical framework. The number of fitting parameters is often large. The models fit most of the data sets, providing that sufficient degrees of freedom are available. Equations (3.8) and (3.9) were used to predict the formation of THMs in the experimental part of this study, in order to see whether they could be applied to the facility evaluated. Chlorine Decay Models Amy et al. (1998) also developed a two-step chorine decay model which represents rapid and slow decay. This model was generated from the USEPA (1998) database. The model consists of two equations, one for short times and another for long times, to predict chlorine concentration (C, mg/l) as a function of time (t, h). For a fast Reaction, 0 ≤ t ≤ 5 h:
)exp( 11 tkCC o −= (3.10)

22
+−−++−=DOCClCNNHDOCk o
231 ln912.0)ln(082.1)6.7ln(345.0)ln(889.0442.0ln (3.11)
For a slow Reaction, 5 ≤ t ≤ 168 h:
[ ] )exp()(5exp 2122 tkkkCC o −−= (3.12)
−−−++−=DOCCl
CNNHDOCk o2
32 ln27.0)ln(82.0)6.7ln(102.0)ln(19.182.4ln (3.13)
Haas and Karra (1984) evaluated five different chlorine models and concluded that the two-phase model (Equation 3.14) provided the best result of five different models:
[ ])exp()1()exp( 21 tkAtkACC o −−+−= (3.14) Where A is the ratio of the rate of formation of the rapidly decomposing species to that of the slowly decomposing species. Yoon et al. (2004), adapting the Haas and Karra model and using the USEPA (1998) database, derived the parameter A and the rate constant k1 and k2. They also compared both models (Amy et al. 1998; and Haas and Karra, 1984) and showed that the two-phase model gave better predictions than the two-step models of Amy. Yoon et al. (2004) also tested the two-phase models to predict THMs and HAAs formation but no significant improvements were observed compared with empirical power function model of Amy et al. (1998).
23
4 EXPERIMENTAL WORK
In order to accomplish with the main objectives of this research, the work was divided into the following parts:
• Determination of trihalomethane concentration at the Boaco facility. • Use of enhanced coagulation as a technique to reduce trihalomethane formation
using raw water from the Boaco facility on a laboratory scale. • Study of trihalomethane formation by varying the pH, reaction time, temperature
and chlorine doses to the filtered water after conventional or enhanced coagulation.
• Comparison of experimental results with the empirical predictive model of Amy et al. (1998) for trihalomethane.
• Elaboration of predictive models using the database created during the evaluation of the Boaco facility.
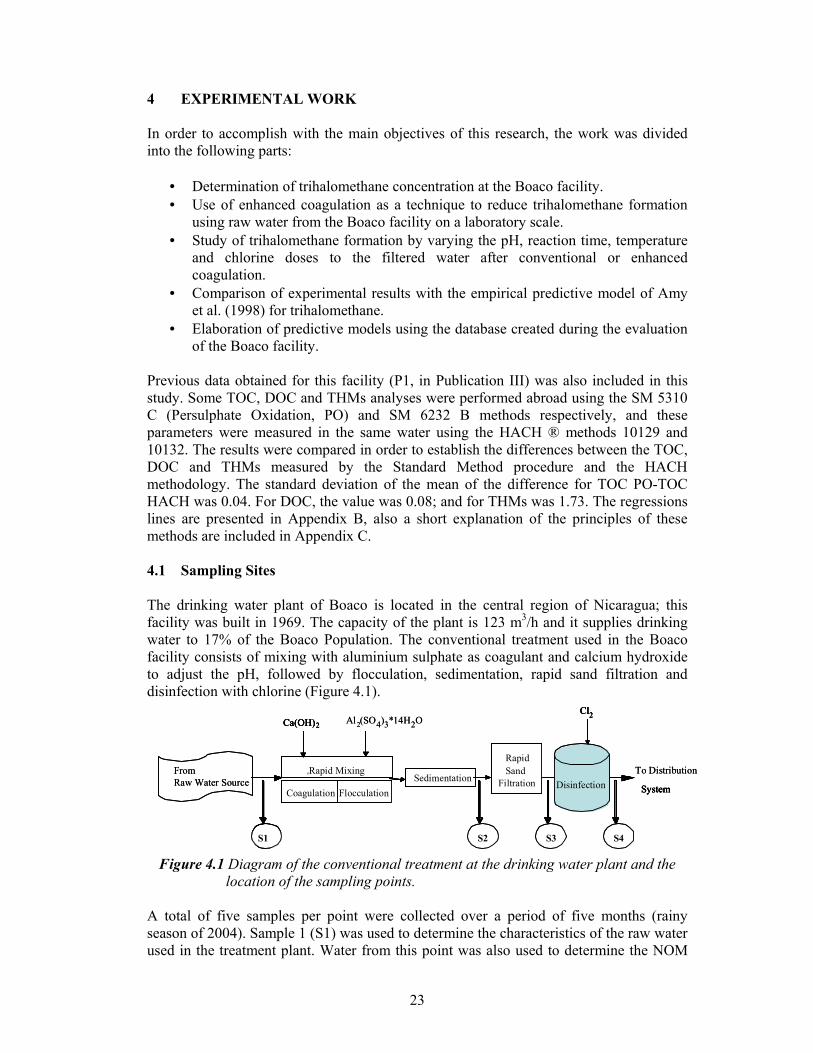
Previous data obtained for this facility (P1, in Publication III) was also included in this study. Some TOC, DOC and THMs analyses were performed abroad using the SM 5310 C (Persulphate Oxidation, PO) and SM 6232 B methods respectively, and these parameters were measured in the same water using the HACH ® methods 10129 and 10132. The results were compared in order to establish the differences between the TOC, DOC and THMs measured by the Standard Method procedure and the HACH methodology. The standard deviation of the mean of the difference for TOC PO-TOC HACH was 0.04. For DOC, the value was 0.08; and for THMs was 1.73. The regressions lines are presented in Appendix B, also a short explanation of the principles of these methods are included in Appendix C. 4.1 Sampling Sites The drinking water plant of Boaco is located in the central region of Nicaragua; this facility was built in 1969. The capacity of the plant is 123 m3/h and it supplies drinking water to 17% of the Boaco Population. The conventional treatment used in the Boaco facility consists of mixing with aluminium sulphate as coagulant and calcium hydroxide to adjust the pH, followed by flocculation, sedimentation, rapid sand filtration and disinfection with chlorine (Figure 4.1).
Figure 4.1 Diagram of the conventional treatment at the drinking water plant and the
location of the sampling points. A total of five samples per point were collected over a period of five months (rainy season of 2004). Sample 1 (S1) was used to determine the characteristics of the raw water used in the treatment plant. Water from this point was also used to determine the NOM
Ca(OH)Cl2
Ca(OH)Cl2Al2(SO4)3*14H2O
•Rapid Mixing
2
Coagulation FlocculationSedimentation
RapidSand
Filtration
S1
To Distribution
System•Rapid Mixing
2
Coagulation FlocculationSedimentation
RapidSand
Filtration
S1
System
FromRaw Water Source
S4S3S2
Disinfection
Ca(OH)Cl2
Ca(OH)Cl2Al2(SO4)3*14H2O
•Rapid Mixing
2
Coagulation FlocculationSedimentation
RapidSand
Filtration
S1
To Distribution
System•Rapid Mixing
2
Coagulation FlocculationSedimentation
RapidSand
Filtration
S1
System
FromRaw Water Source
S4S3S2
Disinfection
24
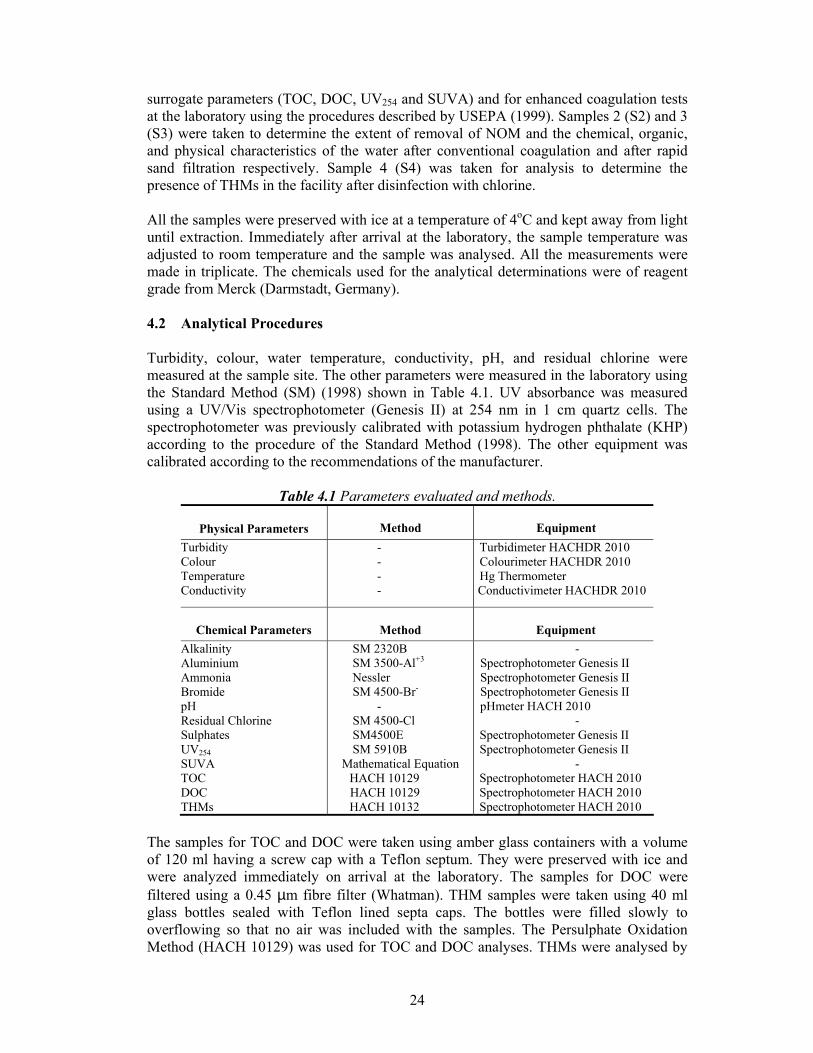
surrogate parameters (TOC, DOC, UV254 and SUVA) and for enhanced coagulation tests at the laboratory using the procedures described by USEPA (1999). Samples 2 (S2) and 3 (S3) were taken to determine the extent of removal of NOM and the chemical, organic, and physical characteristics of the water after conventional coagulation and after rapid sand filtration respectively. Sample 4 (S4) was taken for analysis to determine the presence of THMs in the facility after disinfection with chlorine. All the samples were preserved with ice at a temperature of 4oC and kept away from light until extraction. Immediately after arrival at the laboratory, the sample temperature was adjusted to room temperature and the sample was analysed. All the measurements were made in triplicate. The chemicals used for the analytical determinations were of reagent grade from Merck (Darmstadt, Germany). 4.2 Analytical Procedures Turbidity, colour, water temperature, conductivity, pH, and residual chlorine were measured at the sample site. The other parameters were measured in the laboratory using the Standard Method (SM) (1998) shown in Table 4.1. UV absorbance was measured using a UV/Vis spectrophotometer (Genesis II) at 254 nm in 1 cm quartz cells. The spectrophotometer was previously calibrated with potassium hydrogen phthalate (KHP) according to the procedure of the Standard Method (1998). The other equipment was calibrated according to the recommendations of the manufacturer.
Table 4.1 Parameters evaluated and methods.
Physical Parameters
Method
Equipment Turbidity Colour Temperature Conductivity
- - - -
Turbidimeter HACHDR 2010 Colourimeter HACHDR 2010 Hg Thermometer Conductivimeter HACHDR 2010
Chemical Parameters Method Equipment Alkalinity Aluminium Ammonia Bromide pH Residual Chlorine Sulphates UV254 SUVA TOC DOC THMs
SM 2320B SM 3500-Al+3 Nessler SM 4500-Br-
- SM 4500-Cl SM4500E SM 5910B
Mathematical Equation HACH 10129
HACH 10129 HACH 10132
- Spectrophotometer Genesis II Spectrophotometer Genesis II Spectrophotometer Genesis II pHmeter HACH 2010
- Spectrophotometer Genesis II Spectrophotometer Genesis II
- Spectrophotometer HACH 2010 Spectrophotometer HACH 2010 Spectrophotometer HACH 2010
The samples for TOC and DOC were taken using amber glass containers with a volume of 120 ml having a screw cap with a Teflon septum. They were preserved with ice and were analyzed immediately on arrival at the laboratory. The samples for DOC were filtered using a 0.45 µm fibre filter (Whatman). THM samples were taken using 40 ml glass bottles sealed with Teflon lined septa caps. The bottles were filled slowly to overflowing so that no air was included with the samples. The Persulphate Oxidation Method (HACH 10129) was used for TOC and DOC analyses. THMs were analysed by

25
HACH method 10132. The accuracy of both HACH methods was determined using the standard addition method. Preparation of all glassware used during the analysis included washing with biodegradable detergent, rinsing with tap water, ultrapure water and acetone and drying in an oven at 150oC for 2 h. All solutions were prepared with deionised water. 4.3 Jar Test Enhanced Coagulation Experiments Water taken at the sampling point S1 was used for enhanced coagulation experiments at the laboratory, following the procedure described by USEPA (1999). The same coagulant type (Al2(SO4)3*14H2O) as that used at the drinking water plant was applied in these experiments. The common dosage of coagulants at the facility is 20-30 mg/l of Al2(SO4)3*14H2O, depending on the turbidity of the raw water source. Enhanced coagulation experiments were performed using two Jar Test apparatuses (Phipps and Bird). The coagulant dose used in the enhanced coagulation tests depends on the TOC removal requirement according to the USEPA procedure (1999). The ranges of doses used for the different raw waters were 20-70 mg/l. Each Jar Test was surrounded with a Plexyglass box to keep the temperature at 25oC±0.1. The effectiveness of the enhanced coagulation was evaluated in terms of the removal of precursors of THMs, and the decrease in THM level. Figure 4.2 presents a summary of the Enhanced Coagulation procedure which is described in more detail in 3.2.
Step 1
Enhanced Coagulationis not necessary
TOC removal at the plant >TOC removal required by
USEPA
Check AlkalinityAdjust pH target
Apply Jar TestIncrement Coagulant
Dosages
NO
YES
Step 2
Figure 4.2 Enhanced coagulation procedures. 4.4 The Influences of pH, Chlorine Dose, Contact Time and Temperature on the
THM Formation The influence of pH, chlorine dose, contact time and temperature on the formation of trihalomethane was investigated for raw water treated with conventional and enhanced
26
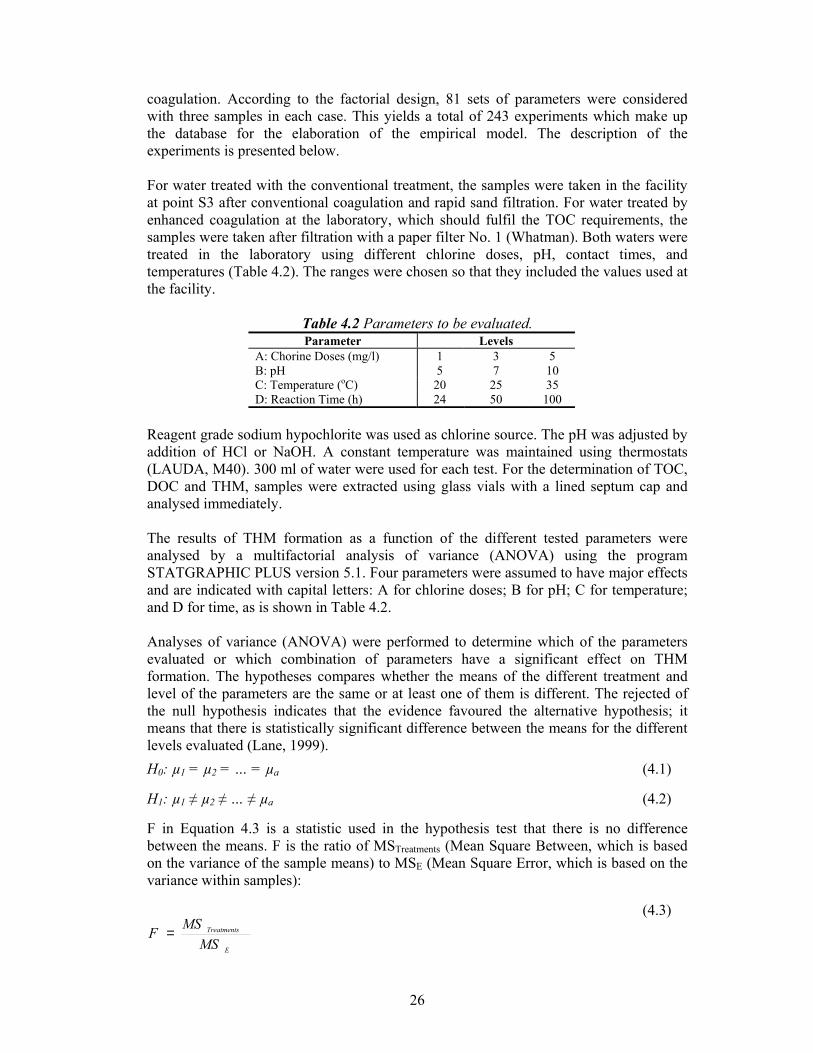
coagulation. According to the factorial design, 81 sets of parameters were considered with three samples in each case. This yields a total of 243 experiments which make up the database for the elaboration of the empirical model. The description of the experiments is presented below. For water treated with the conventional treatment, the samples were taken in the facility at point S3 after conventional coagulation and rapid sand filtration. For water treated by enhanced coagulation at the laboratory, which should fulfil the TOC requirements, the samples were taken after filtration with a paper filter No. 1 (Whatman). Both waters were treated in the laboratory using different chlorine doses, pH, contact times, and temperatures (Table 4.2). The ranges were chosen so that they included the values used at the facility.
Table 4.2 Parameters to be evaluated. Parameter Levels
A: Chorine Doses (mg/l) 1 3 5 B: pH 5 7 10 C: Temperature (oC) 20 25 35 D: Reaction Time (h) 24 50 100
Reagent grade sodium hypochlorite was used as chlorine source. The pH was adjusted by addition of HCl or NaOH. A constant temperature was maintained using thermostats (LAUDA, M40). 300 ml of water were used for each test. For the determination of TOC, DOC and THM, samples were extracted using glass vials with a lined septum cap and analysed immediately. The results of THM formation as a function of the different tested parameters were analysed by a multifactorial analysis of variance (ANOVA) using the program STATGRAPHIC PLUS version 5.1. Four parameters were assumed to have major effects and are indicated with capital letters: A for chlorine doses; B for pH; C for temperature; and D for time, as is shown in Table 4.2. Analyses of variance (ANOVA) were performed to determine which of the parameters evaluated or which combination of parameters have a significant effect on THM formation. The hypotheses compares whether the means of the different treatment and level of the parameters are the same or at least one of them is different. The rejected of the null hypothesis indicates that the evidence favoured the alternative hypothesis; it means that there is statistically significant difference between the means for the different levels evaluated (Lane, 1999). H0: µ1 = µ2 = … = µa (4.1)
H1: µ1 ≠ µ2 ≠ … ≠ µa (4.2)
F in Equation 4.3 is a statistic used in the hypothesis test that there is no difference between the means. F is the ratio of MSTreatments (Mean Square Between, which is based on the variance of the sample means) to MSE (Mean Square Error, which is based on the variance within samples):
E
Treatments
MSMSF =
(4.3)

27
If the null hypothesis is true, then the F ratio should be approximately equal to one, since the MSTreatments and MSE should be about the same. If the ratio is much greater than one, the null hypothesis, Ho, is rejected. The F test in ANOVA allows significant parameters for the formation of THMs to be identified. Each individual effect is tested for significance using the F statistic at the 95% confidence level for decision making. If the p-value (Probability>F) is less than 0.05, the parameters evaluated are significant in the formation of THMs. MSTreatments is estimated by the equation:
2
1 ...
11 −
−
=−
=∑=
a
yyn
aSSMS
a
i iTreatments
Treatments
(4.4)
where SSTreatment is the sum of squares due to the treatments, n is the number of replicates (3 for the experiments), a is the number of levels for each parameter evaluated (3 levels for each parameter analysed), .iy is the average of the observations under the ith treatment and ..y is the grand average of all the observations (Montgomery, 1997).
MSE in the analysis of variance is calculated by the equation
( )[ ]aN
yy
aNSSMS
a
i
n
j iijE
E −
−=
−=
∑ ∑= =1
2
1. (4.5)
where SSE is the sum of squares due to error, N is the total number of observation by parameters evaluated, in this case N is 9, ijy is the jth observation taken under parameter
level or treatment i (Montgomery, 1997).
The variation among all the data in an experiment is measured by the total sum of squares or SST. It is equal to the sum of squares of the differences between the treatment averages and the grand average plus the sum of squares of the differences of observations within treatments from the treatment average (Montgomery, 1997):
( )[ ]∑ ∑∑= ==
−+
−=+= a
i
n
j iij
a
i iETreatmentsT yyyynSSSSSS1
2
11 ... . (4.6)
4.5 Comparison with existing Empirical Model Equations (3.8)–(3.9) were used to compare the THM concentrations determined experimentally and the THMs predicted by these equations. The comparison was done for waters treated by both conventional and enhanced coagulation. The Amy equations were selected to predict the THMs measured in this research because these equations are most widely used by other researchers, due the amount of data that Amy use to develop the empirical models and also due the conditions and parameters evaluated by him in the models. The comparison was statistically validated through the hypotheses test, in which the null hypothesis (Ho) is the mean of the difference (µd), equal to 0.0 (Montgomery, 1997); versus the alternative hypothesis (H1) where the mean of the difference is distinct to 0.0.

28
The statistical test for this hypothesis is to. Ho: µd = 0 would be rejected if | to| > tα/2n-1. Because the observations from the levels factor are paired on each experiment unit, this procedure is usually called the paired t-test. tα/2n-1 is 1.645 for 243 paired data when the probability (α) value is 0.05 to the 95% of confidence level. The comparison was also made using the recommended criteria of Yoon et al. (2004) that a perfect model simulation corresponds to an intercept of 0, a slope of 1 and R2 equal to 1. The coefficient of determination, R2, indicates the percentage of variability explained by the model after taking into account the number of parameters that were estimated. A high R2 indicates a high accuracy in the model. The adjusted R2 is a variation of the ordinary R2 statistic that reflects the number of factors in the model. Correlation coefficient values explain the strength of the relationship between the variables.
4.6 Development of Empirical Models for THM formation Statistical modelling was carried out in order to identify the most important parameters responsible for the variations in THM in this research, and to develop a statistical model that can be used to predict concentrations of THMs. The development of this type of model consists of establishing statistical relationships among the parameters that can affect the THM concentration, and not relying on assumptions about the mechanism of chlorine interaction with NOM and the DBP cleavage reactions. Linear and power models were used. The linear multiple regression models are described by the following equation (Amy et al. 1998):
∑=
+=m
iiio XY
1
ββ (4.7)
The nonlinear power model is a transformation of Equation 4.6 with variables which are subjected to a log-log transformation:
∏=
=m
i
iiXY
10
ββ (4.8)
For both equations, Y denotes the variables to being modelled (THM concentration in this case) and X is a vector independent of predictive variables (NOM surrogate parameters, pH, temperature, chlorine doses and contact time) with m denoting the number of predictive variables considered, βo is the intercept and βi the partial slope coefficients providing a partial prediction of Y. Parameters such as correlation coefficient (r), percentage variance explained (R2), adjusted R2, and the hypothesis that the difference between population means is equal to zero for both THMs measured and predicted were used to validate the models developed at the 95% confidence level.

29
5 RESULTS AND DISCUSSION The results presented in this thesis cover the measurements carried out from May 2003 to October 2004. First, the influence of enhanced coagulation on the removal of NOM was studied in the Boaco drinking water plant (Publication II). Later, these measurements were extended to included data from three other plants; Camoapa, Juigalpa, and Santo Tomas (Publication III). In this publication, the influence of chlorine dose, temperature and contact time on the formation of THM was studied. Since, the variations in the results (THM formation) were to a large extent caused by variations in the raw water source, a new extensive study was performed using raw water from only one source, Boaco. A large number of samples were taken from this facility during this new study. The concentration of trihalomethane found under normal working conditions in the Boaco drinking water plant is first presented together with the values of the surrogate parameters of natural organic matter for the raw water. The amounts of NOM after conventional and enhanced coagulation are compared. The formation of THMs after enhanced coagulation on a laboratory scale is also studied. In addition, the changes in trihalomethane formation due to variations in pH, contact time, chlorine dose, and pH applied to the filtered water after conventional or enhanced coagulation were studied. Finally, the database obtained in this research was compared with the predictive model of Amy and a new empirical model was developed using this database. 5.1 Natural Organic Matter in the Raw Water The surrogate parameters of NOM such as TOC, DOC, UV254, SUVA and Colour were measured in the raw water of the facility in order to determine the type of organic matter present. The mean values are showed at the Table 5.1. These are mean values and standard deviations for 13 samples; where each test was done in triplicate.
Table 5.1 Average values of surrogate NOM parameters. TOC (mg/l) DOC
(mg/l) UV254 (cm-1)
SUVA (l/mg-m)
Colour (mg/l Pt-Co)
16.4 ± 9.0 7.6 ± 5.1 0.27 ± 0.16 4.1 ± 2.0 97.7 ± 90.4 The TOC mean is 16.4 mg/l, a value which is in the range of 1-40 mg/l (Croué et al. 2001) that is the typical interval for surface raw water, but it is a high value indicative of erosion problems at the watershed. It is reinforced with the high average value found for colour (97.7 mg/l). The DOC value is within the typical range of surface waters (Croué et al. 2001). The high SUVA value indicates that most of the organic matter is hydrophobic, of high molecular weight, and can be removed easily by enhanced coagulation because the NOM typically has a greater coagulant demand than the amount of particles present in the raw water. The UV absorbance on the other hand was relatively low compared with that of water samples with similar DOC values (Croué et al. 2001). A lower UV per mass of DOC would likely result in less CBP formation since the UV absorbance and CBP are strongly correlated.
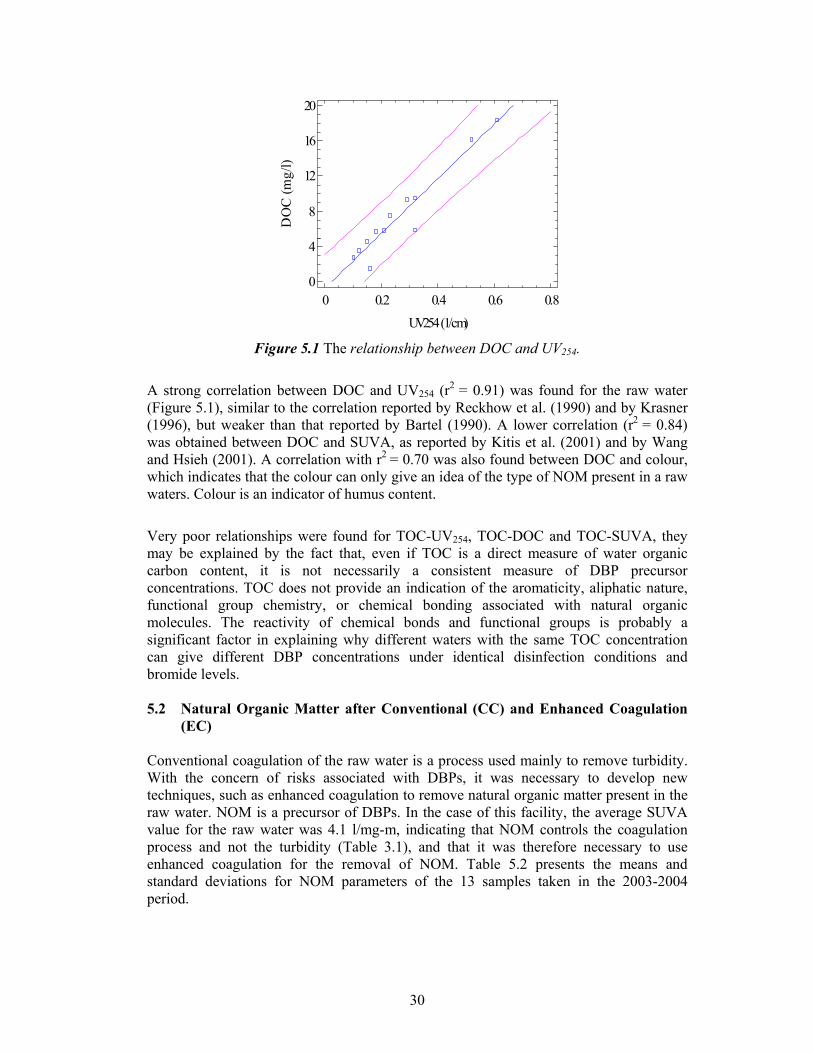
30
UV254 (1/cm)
DO
C (m
g/l)
0 0.2 0.4 0.6 0.80
4
8
12
16
20
Figure 5.1 The relationship between DOC and UV254.
A strong correlation between DOC and UV254 (r2 = 0.91) was found for the raw water (Figure 5.1), similar to the correlation reported by Reckhow et al. (1990) and by Krasner (1996), but weaker than that reported by Bartel (1990). A lower correlation (r2 = 0.84) was obtained between DOC and SUVA, as reported by Kitis et al. (2001) and by Wang and Hsieh (2001). A correlation with r2 = 0.70 was also found between DOC and colour, which indicates that the colour can only give an idea of the type of NOM present in a raw waters. Colour is an indicator of humus content.
Very poor relationships were found for TOC-UV254, TOC-DOC and TOC-SUVA, they may be explained by the fact that, even if TOC is a direct measure of water organic carbon content, it is not necessarily a consistent measure of DBP precursor concentrations. TOC does not provide an indication of the aromaticity, aliphatic nature, functional group chemistry, or chemical bonding associated with natural organic molecules. The reactivity of chemical bonds and functional groups is probably a significant factor in explaining why different waters with the same TOC concentration can give different DBP concentrations under identical disinfection conditions and bromide levels. 5.2 Natural Organic Matter after Conventional (CC) and Enhanced Coagulation
(EC) Conventional coagulation of the raw water is a process used mainly to remove turbidity. With the concern of risks associated with DBPs, it was necessary to develop new techniques, such as enhanced coagulation to remove natural organic matter present in the raw water. NOM is a precursor of DBPs. In the case of this facility, the average SUVA value for the raw water was 4.1 l/mg-m, indicating that NOM controls the coagulation process and not the turbidity (Table 3.1), and that it was therefore necessary to use enhanced coagulation for the removal of NOM. Table 5.2 presents the means and standard deviations for NOM parameters of the 13 samples taken in the 2003-2004 period.
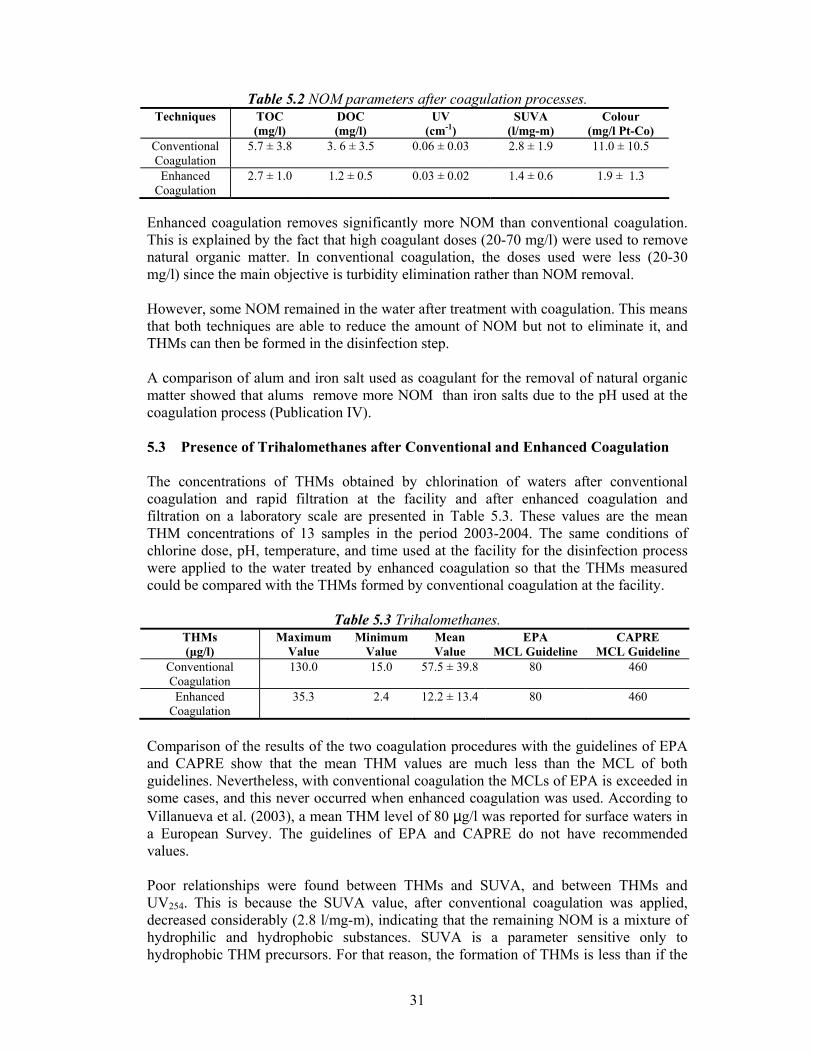
31
Table 5.2 NOM parameters after coagulation processes. Techniques TOC
(mg/l) DOC (mg/l)
UV (cm-1)
SUVA (l/mg-m)
Colour (mg/l Pt-Co)
Conventional Coagulation
5.7 ± 3.8 3. 6 ± 3.5 0.06 ± 0.03 2.8 ± 1.9 11.0 ± 10.5
Enhanced Coagulation
2.7 ± 1.0 1.2 ± 0.5 0.03 ± 0.02 1.4 ± 0.6 1.9 ± 1.3
Enhanced coagulation removes significantly more NOM than conventional coagulation. This is explained by the fact that high coagulant doses (20-70 mg/l) were used to remove natural organic matter. In conventional coagulation, the doses used were less (20-30 mg/l) since the main objective is turbidity elimination rather than NOM removal. However, some NOM remained in the water after treatment with coagulation. This means that both techniques are able to reduce the amount of NOM but not to eliminate it, and THMs can then be formed in the disinfection step. A comparison of alum and iron salt used as coagulant for the removal of natural organic matter showed that alums remove more NOM than iron salts due to the pH used at the coagulation process (Publication IV). 5.3 Presence of Trihalomethanes after Conventional and Enhanced Coagulation The concentrations of THMs obtained by chlorination of waters after conventional coagulation and rapid filtration at the facility and after enhanced coagulation and filtration on a laboratory scale are presented in Table 5.3. These values are the mean THM concentrations of 13 samples in the period 2003-2004. The same conditions of chlorine dose, pH, temperature, and time used at the facility for the disinfection process were applied to the water treated by enhanced coagulation so that the THMs measured could be compared with the THMs formed by conventional coagulation at the facility.
Table 5.3 Trihalomethanes. THMs (µg/l)
Maximum Value
MinimumValue
Mean Value
EPA MCL Guideline
CAPRE MCL Guideline
Conventional Coagulation
130.0 15.0 57.5 ± 39.8 80 460
Enhanced Coagulation
35.3 2.4 12.2 ± 13.4 80 460
Comparison of the results of the two coagulation procedures with the guidelines of EPA and CAPRE show that the mean THM values are much less than the MCL of both guidelines. Nevertheless, with conventional coagulation the MCLs of EPA is exceeded in some cases, and this never occurred when enhanced coagulation was used. According to Villanueva et al. (2003), a mean THM level of 80 µg/l was reported for surface waters in a European Survey. The guidelines of EPA and CAPRE do not have recommended values. Poor relationships were found between THMs and SUVA, and between THMs and UV254. This is because the SUVA value, after conventional coagulation was applied, decreased considerably (2.8 l/mg-m), indicating that the remaining NOM is a mixture of hydrophilic and hydrophobic substances. SUVA is a parameter sensitive only to hydrophobic THM precursors. For that reason, the formation of THMs is less than if the
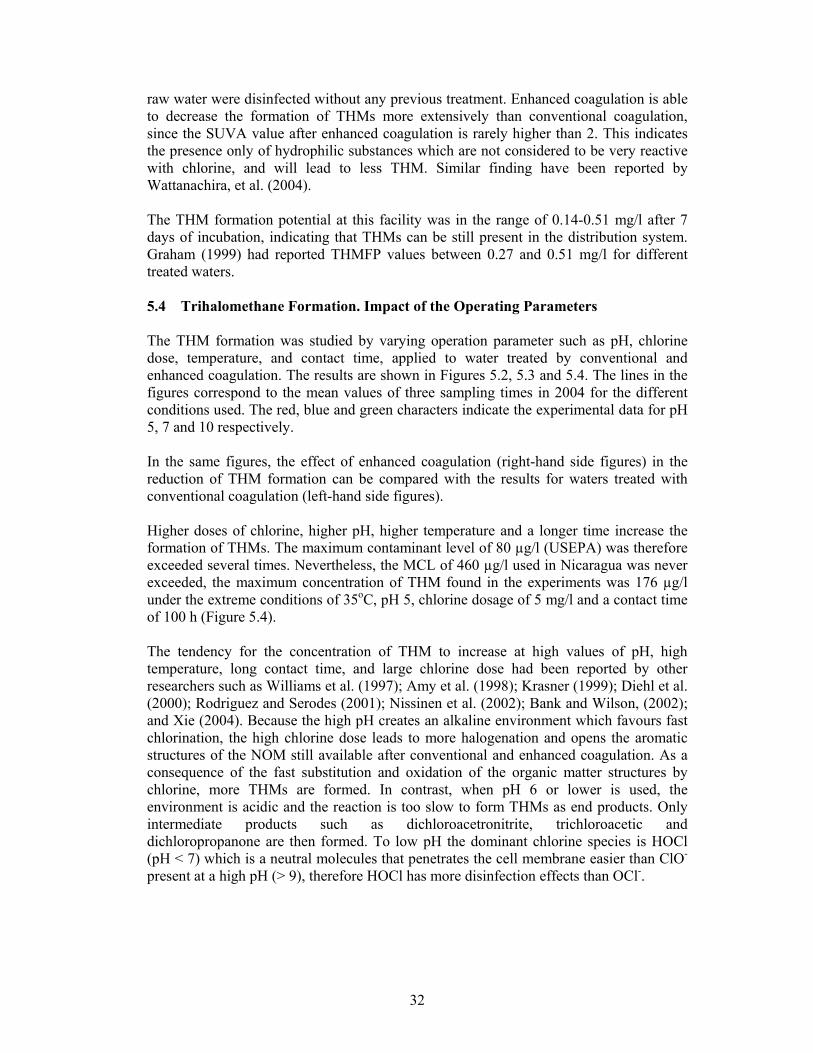
32
raw water were disinfected without any previous treatment. Enhanced coagulation is able to decrease the formation of THMs more extensively than conventional coagulation, since the SUVA value after enhanced coagulation is rarely higher than 2. This indicates the presence only of hydrophilic substances which are not considered to be very reactive with chlorine, and will lead to less THM. Similar finding have been reported by Wattanachira, et al. (2004). The THM formation potential at this facility was in the range of 0.14-0.51 mg/l after 7 days of incubation, indicating that THMs can be still present in the distribution system. Graham (1999) had reported THMFP values between 0.27 and 0.51 mg/l for different treated waters. 5.4 Trihalomethane Formation. Impact of the Operating Parameters The THM formation was studied by varying operation parameter such as pH, chlorine dose, temperature, and contact time, applied to water treated by conventional and enhanced coagulation. The results are shown in Figures 5.2, 5.3 and 5.4. The lines in the figures correspond to the mean values of three sampling times in 2004 for the different conditions used. The red, blue and green characters indicate the experimental data for pH 5, 7 and 10 respectively. In the same figures, the effect of enhanced coagulation (right-hand side figures) in the reduction of THM formation can be compared with the results for waters treated with conventional coagulation (left-hand side figures). Higher doses of chlorine, higher pH, higher temperature and a longer time increase the formation of THMs. The maximum contaminant level of 80 µg/l (USEPA) was therefore exceeded several times. Nevertheless, the MCL of 460 µg/l used in Nicaragua was never exceeded, the maximum concentration of THM found in the experiments was 176 µg/l under the extreme conditions of 35oC, pH 5, chlorine dosage of 5 mg/l and a contact time of 100 h (Figure 5.4). The tendency for the concentration of THM to increase at high values of pH, high temperature, long contact time, and large chlorine dose had been reported by other researchers such as Williams et al. (1997); Amy et al. (1998); Krasner (1999); Diehl et al. (2000); Rodriguez and Serodes (2001); Nissinen et al. (2002); Bank and Wilson, (2002); and Xie (2004). Because the high pH creates an alkaline environment which favours fast chlorination, the high chlorine dose leads to more halogenation and opens the aromatic structures of the NOM still available after conventional and enhanced coagulation. As a consequence of the fast substitution and oxidation of the organic matter structures by chlorine, more THMs are formed. In contrast, when pH 6 or lower is used, the environment is acidic and the reaction is too slow to form THMs as end products. Only intermediate products such as dichloroacetronitrite, trichloroacetic and dichloropropanone are then formed. To low pH the dominant chlorine species is HOCl (pH < 7) which is a neutral molecules that penetrates the cell membrane easier than ClO- present at a high pH (> 9), therefore HOCl has more disinfection effects than OCl-.

33
0 20 40 60 80 100 1200
10
20
30
40
50
60
Time ( h )
THM
s ( µ
g/l
)
CC ; T: 20ºCChlorine Dose: 1 mg/l
0 20 40 60 80 100 1200
10
20
30
40
50
60
Time ( h )
THM
s ( µ
g/l
)
EC ; T: 20ºCChlorine Dose: 1 mg/l
0 20 40 60 80 100 1200
20
40
60
80
100
120
140
Time ( h )
THM
s ( µ
g/l
)
CC ; T: 25ºCChlorine Dose: 1 mg/l
0 20 40 60 80 100 1200
20
40
60
80
100
120
140
Time ( h )
THM
s ( µ
g/l
)
EC ; T: 25ºCChlorine Dose: 1 mg/l
0 20 40 60 80 100 1200
20
40
60
80
100
120
140
Time ( h )
THM
s ( µ
g/l
)
CC ; T: 35ºCChlorine Dose: 1 mg/l
0 20 40 60 80 100 1200
20
40
60
80
100
120
140
Time ( h )
THM
s ( µ
g/l
)
EC ; T: 35ºCChlorine Dose: 1 mg/l
Figure 5.2 Influence of temperature, pH and time on THMs for a chlorine dose of
1 mg/l.

34
0 20 40 60 80 100 1200
20
40
60
80
100
Time ( h )
THM
s ( µ
g/l
)
CC ; T: 20ºCChlorine Dose: 3 mg/l
0 20 40 60 80 100 1200
20
40
60
80
100
Time ( h )
THM
s ( µ
g/l
)
EC ; T: 20ºCChlorine Dose: 3 mg/l
0 20 40 60 80 100 1200
20
40
60
80
100
120
140
Time ( h )
THM
s ( µ
g/l
)
CC ; T: 25ºCChlorine Dose: 3 mg/l
0 20 40 60 80 100 1200
20
40
60
80
100
120
140
Time ( h )
THM
s ( µ
g/l
)
EC ; T: 25ºCChlorine Dose: 3 mg/l
0 20 40 60 80 100 1200
20
40
60
80
100
120
140
160
Time ( h )
THM
s ( µ
g/l
)
CC ; T: 35ºCChlorine Dose: 3 mg/l
0 20 40 60 80 100 1200
20
40
60
80
100
120
140
160
Time ( h )
THM
s ( µ
g/l
)
EC ; T: 35ºCChlorine Dose: 3 mg/l
Figure 5.3 Influence of temperature, pH and time on THMs for a chlorine dose of 3 mg/l.
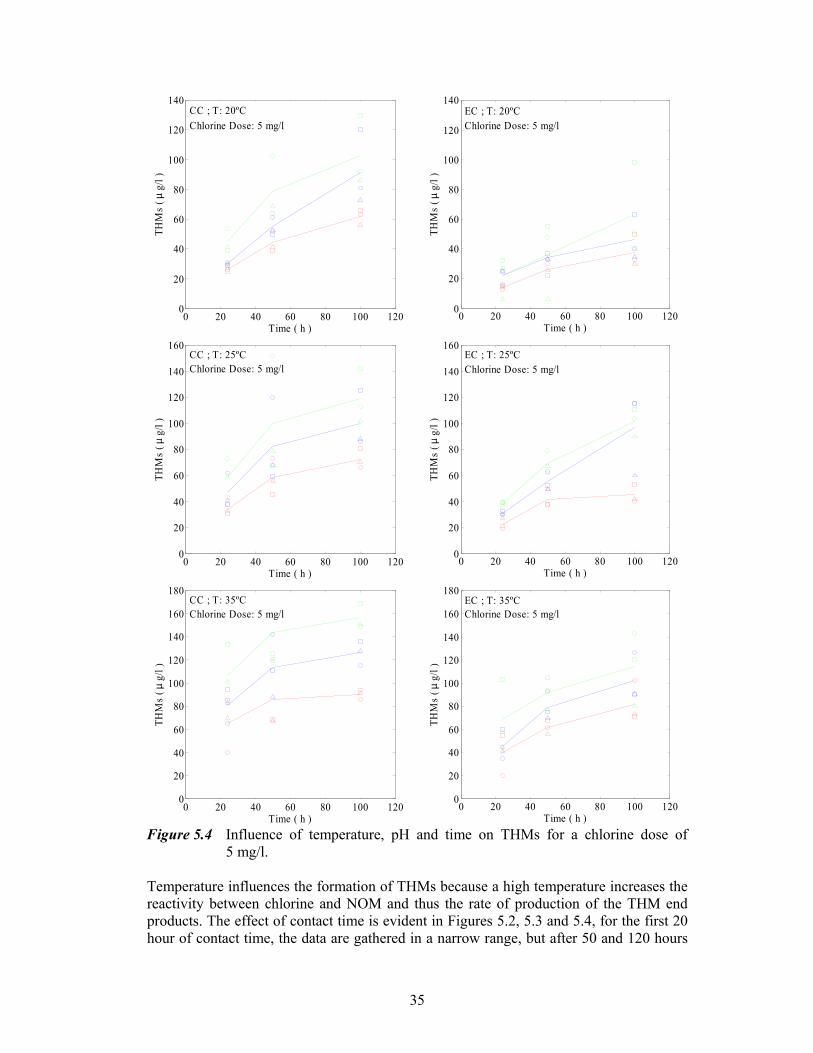
35
0 20 40 60 80 100 1200
20
40
60
80
100
120
140
Time ( h )
THM
s ( µ
g/l
)
CC ; T: 20ºCChlorine Dose: 5 mg/l
0 20 40 60 80 100 1200
20
40
60
80
100
120
140
Time ( h )
THM
s ( µ
g/l
)
EC ; T: 20ºCChlorine Dose: 5 mg/l
0 20 40 60 80 100 1200
20
40
60
80
100
120
140
160
Time ( h )
THM
s ( µ
g/l
)
CC ; T: 25ºCChlorine Dose: 5 mg/l
0 20 40 60 80 100 1200
20
40
60
80
100
120
140
160
Time ( h )
THM
s ( µ
g/l
)
EC ; T: 25ºCChlorine Dose: 5 mg/l
0 20 40 60 80 100 1200
20
40
60
80
100
120
140
160
180
Time ( h )
THM
s ( µ
g/l
)
CC ; T: 35ºCChlorine Dose: 5 mg/l
0 20 40 60 80 100 1200
20
40
60
80
100
120
140
160
180
Time ( h )
THM
s ( µ
g/l
)
EC ; T: 35ºCChlorine Dose: 5 mg/l
Figure 5.4 Influence of temperature, pH and time on THMs for a chlorine dose of
5 mg/l. Temperature influences the formation of THMs because a high temperature increases the reactivity between chlorine and NOM and thus the rate of production of the THM end products. The effect of contact time is evident in Figures 5.2, 5.3 and 5.4, for the first 20 hour of contact time, the data are gathered in a narrow range, but after 50 and 120 hours

36
the THM values extend over a wide interval. THMs are the end product and with increasing the time, there is more opportunity for the reaction to be completed. Steven et al. (1989) evaluated the effects of some parameters on THMs formation. They found that THM formation increased with time, especially within the first 48 h. However, THM formation was higher with increasing pH, increasing chlorine dose and increasing temperature. After the chlorine is exhausted, the formation of THMs decreases considerably because there is no longer any agent available to halogenate the organic matter. In order to validate these results statistically an analysis of variance was performed. Part of the variation is attributed to variations in raw water quality. 5.5 ANOVA for the Variation of four Parameters ANOVA was executed on the total quantity of data. Since four parameters were studied at three levels, and the samples were taken on three different occasions, the ANOVA was performed on a total of 243 values. The levels for the different parameters applied to the filtered water treated by conventional (CC) and enhanced coagulation (EC) are shown in Table 5.4. The experiments were carried out using coagulant doses of 20-30 mg/l for conventional coagulation and 20-70 mg/l for enhanced coagulation. The DOC concentrations were 1.2-2.0 and 0.76-1.23 mg/l and the UV254 values were 0.05-0.09 and 0.04-0.09 cm-1 for conventional and enhanced coagulation respectively.
Table 5.4 Parameter levels used for the CC and EC experiments. Parameter Conditions
Chlorine Doses (mg/l) pH Temperature (oC) Time (h)
1, 3, 5 5, 7, 10
20, 25, 35 24, 50, 100
According to the ANOVA, the parameters evaluated have statistically significant effects on the THM formation since the p-values for each parameter were much lower than 0.05 (Table 5.5, at the 95.0% confidence level). The sums of squares, shown in Table 5.5, are lower for enhanced coagulation; which means that the variance of the data for enhanced coagulation is less than that for conventional coagulation. F-Ratios for enhanced coagulation were lower for chlorine doses and pH than for those same parameters for conventional coagulation. However, the F-ratios for the parameters evaluated in both coagulation modes were high, indicating that each parameter has a great influence on the formation of THMs.
Table 5.5 Analysis of variance for THMs. Conventional Coagulation Enhanced Coagulation
Main Effects Sum of Squares
F-Ratio P-Value Sum of Squares
F-Ratio p-Value
A: Chlorine Doses B: pH C: Temperature D: Time
5.4 x 10⁴ 4.2 x 10⁴ 7.1 x 10⁴ 5.7 x 10⁴
83.3 65.4 108.1 87.5
0.00 0.00 0.00 0.00
2.6 x 10⁴ 2.1 x 10⁴ 5.9 x 10⁴ 4.4 x 10⁴
59.1 48.3 135.7 102.4
0.00 0.00 0.00 0.00
The influences of these parameters on the formation of trihalomethanes are shown in Figures 5.5-5.8. The bars represent upper and low limits of THMs for each evaluated

37
condition at the 95% confidence level. THM concentrations were lower when enhanced coagulation (right-hand side figures) was applied, as indicated above. When high values of the parameters were applied to the water treated by conventional coagulation, the MCL of THMs (80 µg/l) was exceeded in most cases. Effects of the variation of pH It is evident in both figures that at pH 5, the formation of THMs was less than at pH 10. At the low pH, the hydrolysis reaction rate is too slow to complete the halogenation, and only the intermediate carbanion is formed. At pH 10, a fast chlorination of carbon atoms is involved because the activation of OH- in alkaline medium ruptures the aromatic structure more rapidly allowing halogenation and the formation of THM. At a pH lower than 7, the formation of THM is weak due the lack of an alkaline environment and because the species of chlorine available is HOCl instead of the more reactive OCl-. The recommended pH range for delivery of water to the population is 6.5-8.5. Ideally the pH should be 7 to keep a neutral environment and avoid the formation of THMs. At a pH lower than 6, other disinfection by-products such as trichloroacetic and dichloroacetronile can be formed; and at a pH higher than 7 more THMs can be formed.
pH
THM
s (µg
/l)
5 7 1025
40
55
70
85
pH
THM
s (µg
/l)
5 7 1025
40
55
70
85
Figure 5.5 Influence of pH on the formation of THMs after conventional (left) and
enhanced coagulation treatment (right). Effects of Chlorine Doses Chlorine is one of the two major reactants leading to occurrence of THMs. The chlorine dose is the keys factor for THM formation. The THM concentration increases with increasing chlorine dose, because HOCl is the main source of the electrophilic halogenating species, oxidizing the organic matter and reacting by hydrolysis to form THMs, which is the end product. If more chlorine is available to react with the organic matter, more THMs can be formed. The common chlorine concentration in the drinking water plants is 2 mg/l to ensure that the residual chlorine level is higher than 0.5 mg/l to all the consumers and to avoid water-borne diseases. Disinfection at a concentration lower than 2 mg/l should be avoided overall, when the pipes in the distribution system have problems of leakage and microbial re-growth. Figure 5.6 show that a high chlorine dose increases the concentration of THMs. The speciation of chlorine can also be affected
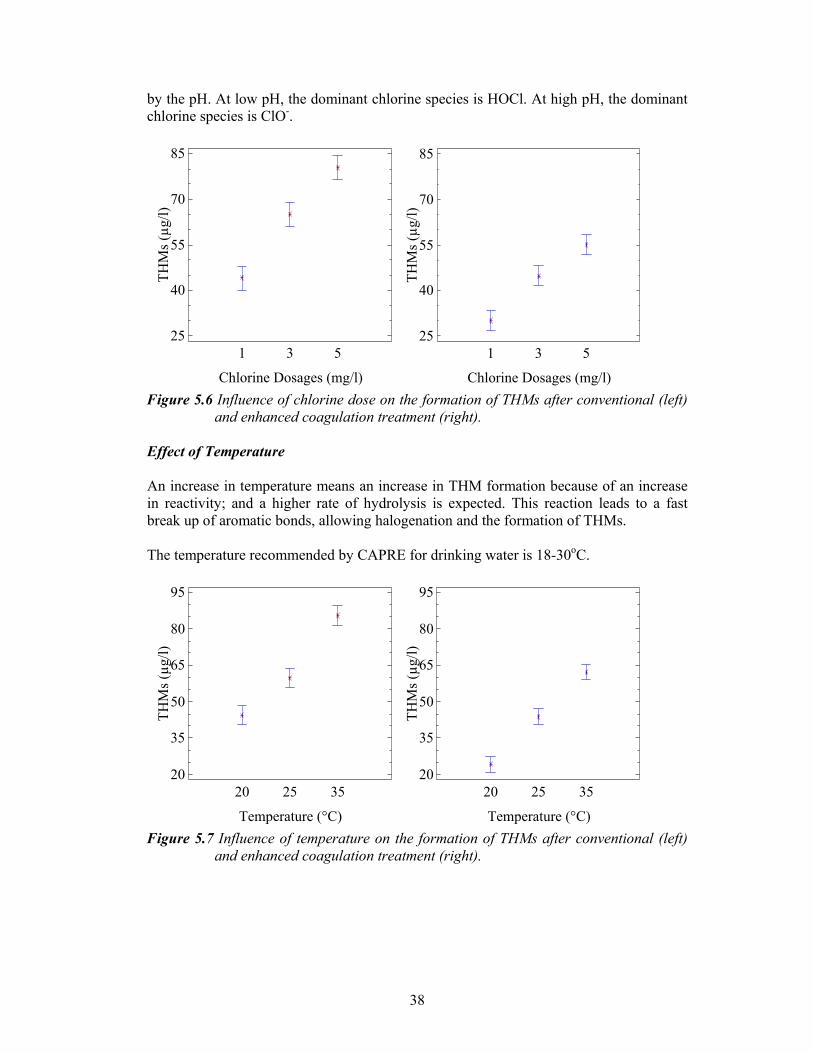
38
by the pH. At low pH, the dominant chlorine species is HOCl. At high pH, the dominant chlorine species is ClO-.
Chlorine Dosages (mg/l)
THM
s (µg
/l)
1 3 525
40
55
70
85
Chlorine Dosages (mg/l)
THM
s (µg
/l)
1 3 525
40
55
70
85
Figure 5.6 Influence of chlorine dose on the formation of THMs after conventional (left)
and enhanced coagulation treatment (right). Effect of Temperature An increase in temperature means an increase in THM formation because of an increase in reactivity; and a higher rate of hydrolysis is expected. This reaction leads to a fast break up of aromatic bonds, allowing halogenation and the formation of THMs. The temperature recommended by CAPRE for drinking water is 18-30oC.
Temperature (°C)
THM
s (µg
/l)
20 25 3520
35
50
65
80
95
Temperature (°C)
THM
s (µg
/l)
20 25 3520
35
50
65
80
95
Figure 5.7 Influence of temperature on the formation of THMs after conventional (left)
and enhanced coagulation treatment (right).
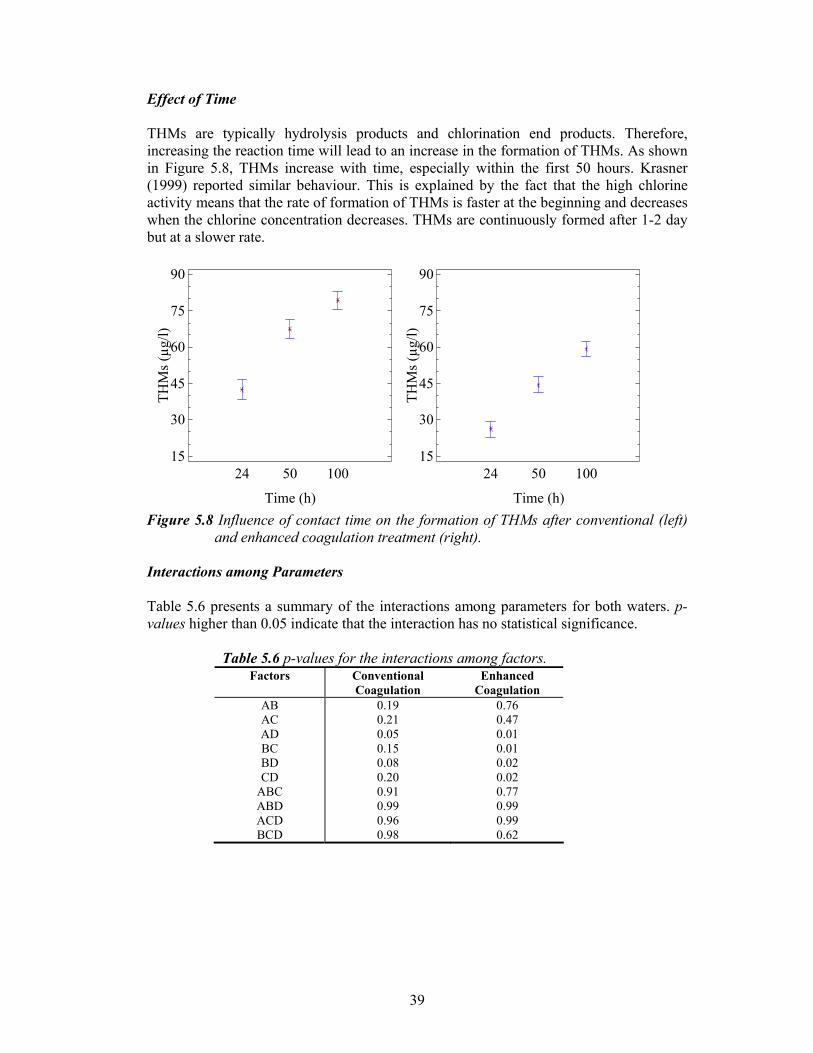
39
Effect of Time THMs are typically hydrolysis products and chlorination end products. Therefore, increasing the reaction time will lead to an increase in the formation of THMs. As shown in Figure 5.8, THMs increase with time, especially within the first 50 hours. Krasner (1999) reported similar behaviour. This is explained by the fact that the high chlorine activity means that the rate of formation of THMs is faster at the beginning and decreases when the chlorine concentration decreases. THMs are continuously formed after 1-2 day but at a slower rate.
Time (h)
THM
s (µg
/l)
24 50 10015
30
45
60
75
90
Time (h)
THM
s (µg
/l)
24 50 10015
30
45
60
75
90
Figure 5.8 Influence of contact time on the formation of THMs after conventional (left)
and enhanced coagulation treatment (right). Interactions among Parameters Table 5.6 presents a summary of the interactions among parameters for both waters. p-values higher than 0.05 indicate that the interaction has no statistical significance.
Table 5.6 p-values for the interactions among factors.
Factors Conventional Coagulation
Enhanced Coagulation
AB AC AD BC BD CD
ABC ABD ACD BCD
0.19 0.21 0.05 0.15 0.08 0.20 0.91 0.99 0.96 0.98
0.76 0.47 0.01 0.01 0.02 0.02 0.77 0.99 0.99 0.62
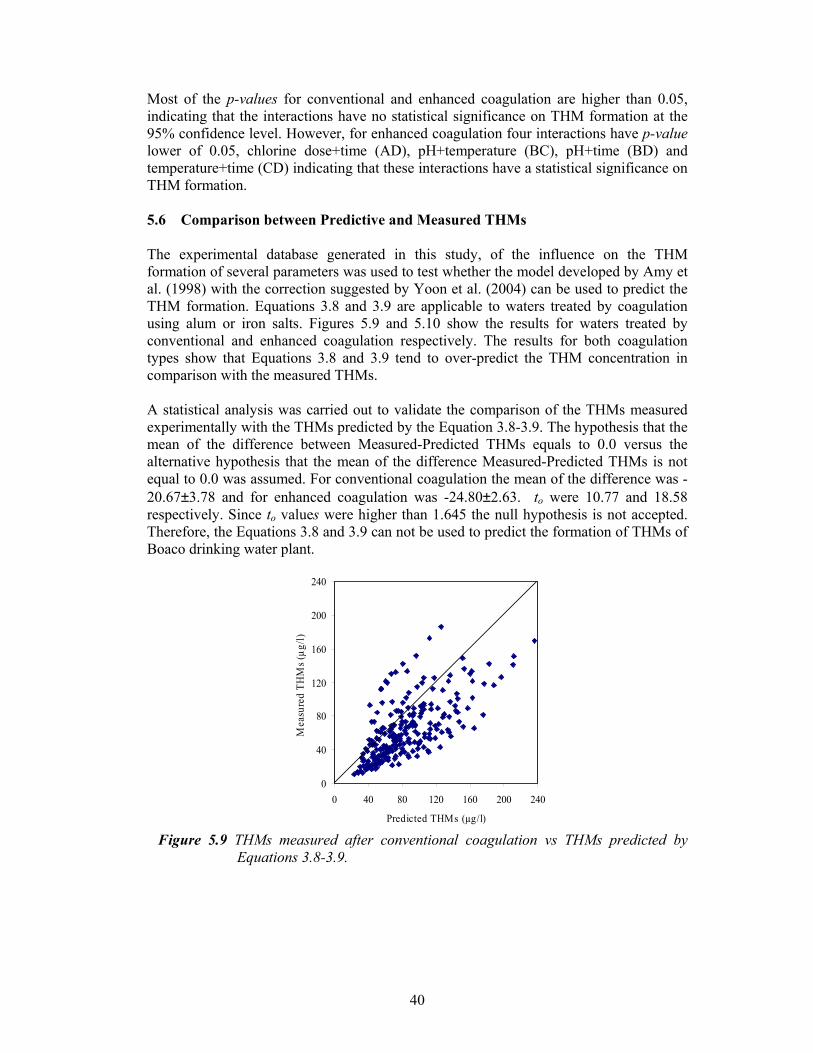
40
Most of the p-values for conventional and enhanced coagulation are higher than 0.05, indicating that the interactions have no statistical significance on THM formation at the 95% confidence level. However, for enhanced coagulation four interactions have p-value lower of 0.05, chlorine dose+time (AD), pH+temperature (BC), pH+time (BD) and temperature+time (CD) indicating that these interactions have a statistical significance on THM formation. 5.6 Comparison between Predictive and Measured THMs The experimental database generated in this study, of the influence on the THM formation of several parameters was used to test whether the model developed by Amy et al. (1998) with the correction suggested by Yoon et al. (2004) can be used to predict the THM formation. Equations 3.8 and 3.9 are applicable to waters treated by coagulation using alum or iron salts. Figures 5.9 and 5.10 show the results for waters treated by conventional and enhanced coagulation respectively. The results for both coagulation types show that Equations 3.8 and 3.9 tend to over-predict the THM concentration in comparison with the measured THMs. A statistical analysis was carried out to validate the comparison of the THMs measured experimentally with the THMs predicted by the Equation 3.8-3.9. The hypothesis that the mean of the difference between Measured-Predicted THMs equals to 0.0 versus the alternative hypothesis that the mean of the difference Measured-Predicted THMs is not equal to 0.0 was assumed. For conventional coagulation the mean of the difference was -20.67±3.78 and for enhanced coagulation was -24.80±2.63. to were 10.77 and 18.58 respectively. Since to values were higher than 1.645 the null hypothesis is not accepted. Therefore, the Equations 3.8 and 3.9 can not be used to predict the formation of THMs of Boaco drinking water plant.
0
40
80
120
160
200
240
0 40 80 120 160 200 240
Predicted THMs (µg/l)
Mea
sure
d TH
Ms (
µg/l)
Figure 5.9 THMs measured after conventional coagulation vs THMs predicted by
Equations 3.8-3.9.

41
0
40
80
120
160
200
240
0 40 80 120 160 200 240
Predicted THMs (µg/l)
Mea
sure
d TH
Ms (
µg/l)
Figure 5.10 THMs measured after enhanced coagulation vs THMs predicted by
Equations 3.8-3.9. Other statistics are shown in Table 5.7. They also show that there is a statistically significance difference between the measured and predicted THMs. The slopes are 0.6 and 0.7; the intercepts are 11.7 and -4.0 for conventional and enhanced coagulation, at 95% confidence level. The R2 statistic indicates that the models explain 50% and 60% of the variance in the measured THMs. Correlation coefficients are 0.7 and 0.8 respectively, indicating a moderately strong relationship between the variables.
Table 5.7 Statistical evaluation of Equations 3.8-3.9 for THMs. N Slope Intercept R2 Correlation
Coefficient CC 243 0.6 11.7 0.5 0.7 EC 243 0.7 -4.0 0.6 0.8
The values of the parameters used in Equations 3.8-3.9 for the prediction of THMs for conventional and enhanced coagulated waters are those presented in Table 5.4. 5.7 Empirical Model for Predict THMs formation in the Drinking Water of Boaco Using the database generated from the enhanced coagulation experiments, two empirical models were developed to predict the formation of THMs after the raw water had been treated by enhanced coagulation, sedimentation and filtration. These models are based on linear and non-linear regression. The equation for the linear model is THMs = 28.05 + 2.49(Cl2) – 11.85(pH) + 0.27(T) – 0.42(t) – 36.1(DOC) +0.06(Cl2*t) + 0.20(pH*T) +
0.04(pH*t) + 8.15(pH*DOC) + 0.01 (t*T) (5.1) Figure 5.11 shows the relationship for the linear model and the statistics are shown in Table 5.8. The value of R2 indicates that the model explains 78% of the variance in the THM, i.e., there is a strong relationship between the predicted and measured values.
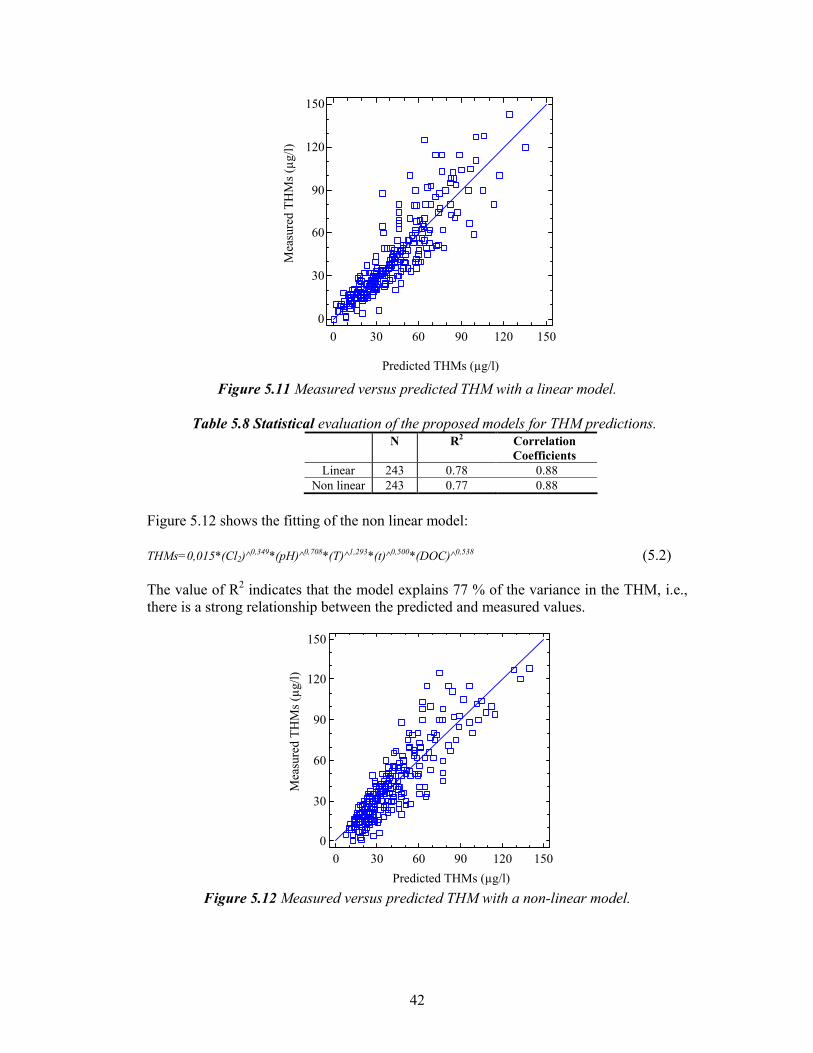
42
Predicted THMs (µg/l)
Mea
sure
d TH
Ms (
µg/l)
0 30 60 90 120 1500
30
60
90
120
150
Figure 5.11 Measured versus predicted THM with a linear model.
Table 5.8 Statistical evaluation of the proposed models for THM predictions.
N
R2 Correlation Coefficients
Linear 243 0.78 0.88 Non linear 243 0.77 0.88
Figure 5.12 shows the fitting of the non linear model: THMs=0,015*(Cl2)^0,349*(pH)^0,708*(T)^1,293*(t)^0,500*(DOC)^0,538 (5.2) The value of R2 indicates that the model explains 77 % of the variance in the THM, i.e., there is a strong relationship between the predicted and measured values.
Predicted THMs (µg/l)
Mea
sure
d TH
Ms (
µg/l)
0 30 60 90 120 1500
30
60
90
120
150
Figure 5.12 Measured versus predicted THM with a non-linear model.
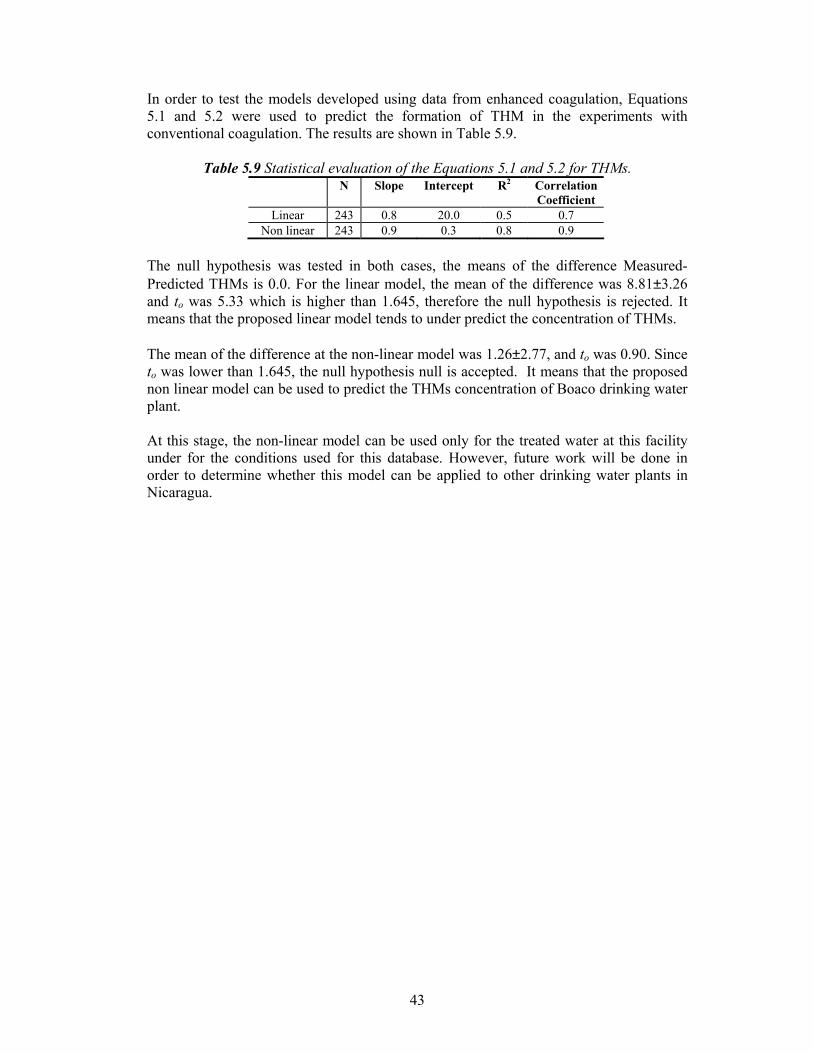
43
In order to test the models developed using data from enhanced coagulation, Equations 5.1 and 5.2 were used to predict the formation of THM in the experiments with conventional coagulation. The results are shown in Table 5.9.
Table 5.9 Statistical evaluation of the Equations 5.1 and 5.2 for THMs. N Slope Intercept R2 Correlation
Coefficient Linear 243 0.8 20.0 0.5 0.7
Non linear 243 0.9 0.3 0.8 0.9 The null hypothesis was tested in both cases, the means of the difference Measured-Predicted THMs is 0.0. For the linear model, the mean of the difference was 8.81±3.26 and to was 5.33 which is higher than 1.645, therefore the null hypothesis is rejected. It means that the proposed linear model tends to under predict the concentration of THMs. The mean of the difference at the non-linear model was 1.26±2.77, and to was 0.90. Since to was lower than 1.645, the null hypothesis null is accepted. It means that the proposed non linear model can be used to predict the THMs concentration of Boaco drinking water plant. At this stage, the non-linear model can be used only for the treated water at this facility under for the conditions used for this database. However, future work will be done in order to determine whether this model can be applied to other drinking water plants in Nicaragua.

44
6 CONCLUSIONS The average concentration of THMs found at the facility is below the USEPA and Nicaragua guidelines. Nevertheless, the MCLs of 80 µ/1 set by USEPA is sometimes exceeded at the plant in the rainy season when the raw water is rich in humic substances. Comparison between the water treated by conventional and enhanced coagulation shows that enhanced coagulation considerably reduces the THM concentration and that, after coagulation, it never exceeds any of these guidelines. This is because enhanced coagulation decreases the organic matter considerably due to the high coagulant dose applied. A study of trihalomethane formation when varying the pH, time, temperature, and chlorine dose using water treated by conventional and enhanced coagulation has shown that these factors has a great influence on the concentration of trihalomethanes. Higher doses of chlorine, higher pH, higher temperature and a longer time increase the formation of THMs. The equations presented by Amy for predicting THM formation cannot be used for the water at this facility, since the results shown that the equations tends to over predict the results in comparison with the measured THMs. Statistically, the comparison between both THMs gave the same results. Two empirical models were developed from the data for enhanced coagulation, using linear and non-linear regression. These models were tested using the database obtained with conventional coagulation. The non-linear model was shown to be able to predict the formation of THMs in the Boaco drinking water plant. Results showing the variability of the THM concentration and the number of factors influencing their formation and fate confirm that it is difficult for a drinking water plant manager to satisfy the dual objectives of the chlorination process: to maintain an acceptable microbiological water quality and to minimize THM formation. Future work will be executed regarding to improve the empirical predictive equations and also to develop a kinetic model to attempt to understand more the formation of THMs.

45
NOTATION Latin letters A ratio of the rate of formation of decomposing species - Co initial chlorine concentration (mg l-1) C1 chlorine concentration at time 1 (mg l-1) C2 chlorine concentration at time 2 (mg/l) exp exponential - Eo
red standard potential of reduction (V) Ho null hypothesis - H1 alternative hypothesis - k empirical constant k1 kinetic constant, rate of fast reaction - k2 kinetic constant, rate of slow reaction - t time (h) t0 t de student - Xi independent variables - Yi dependent variables - Greek letters βo intercept β1 partial slope coefficients Superscripts a empirical constant b empirical constant c empirical constant d empirical constant e empirical constant f empirical constant m number of predictive variables

46
ABREVIATIONS ANOVA Analysis of Variance CAPRE Regional Committee for Drinking Water Institution and Sanitation
for Central America, Panamá and Dominican Republic CBPs Chlorination By-products CBPFPs Chlorination By-products Formation Potential CC Conventional Coagulation CT Contact Time DBPR Disinfection By-products Rule DBPs Disinfection By-products DCCA Dichloroacetic Acid DOC Dissolved Organic Carbon DOM Dissolved Organic Matter EC Enhanced Coagulation ENACAL Nicaragua Enterprise of Water Supply and Sewerages GAC Granular Activated Carbon HAAs Haloacetic Acids HAA5 Five Haloacetic Acids HAA6 Six Haloacetic Acids HANs Acetronile Acids MCLs Maximum Contaminant Levels NF Nanofiltration NOM Natural Organic Matter PODR Point of Diminishing Return S1 Raw Water S2 Settled Water S3 Filtered Water S4 Disinfected Water SM Standard Method SSF Slow Sand Filtration SUVA Specific Ultraviolet Absorbance TCAA Trichloroacetic Acid THMFP Trihalomethane Formation Potential THMs Trihalomethanes TOC Total Organic Carbon TOX Total Organic Halide US Ultrasonic USEPA Unites States Environmental Protection Agency UV254 Ultraviolet Absorbance at 254 nm WHO World Health Organization

47
REFERENCES Amy G.L., Minear, R.A., Cooper, W.J. (1987). Testing and validation of a multiple nonlinear regression model for predicting trihalomethane formation potential. J. Water Research. 21, 649-659. Amy, G.L., Tan, L., Davis, M.K. (1991). The effects of ozonation and activated carbon adsorption on trihalomethane speciation. J. Water Research. 25(2), 191-202. Amy, G., Siddiqui, M., Ozekin, K., Zhu, H.W., Wang, Ch. (1998). Empirically based models for predicting chlorination and ozonation by-products; trihalomethanes, haloacetic acids, chloral hydrate, and bromate. USEPA Reports CX 819579. Bank, J., Wilson, D. (2002). Low cost solution for trihalomethanes compliance. Journal of the Chartered e Institution of Water and Environmental Management. 16(4), 264-269. Bartels, U. (1990). Organischer kohlenstoff im niederschlag nordrheinwestfälisher fichten und Buchenbestäande. Z. Pflanzenernäahr, Bodenkd. 153, 125-127. Bolto, B., Dixon, D., Eldridge, R., Simon, K. Removal of THM precursors by coagulation or ion exchange. J. Water Research. 36(2), 5066-5073. Cancho, B and Ventura, F. 2005. Optimization of methods for the determination of DBPs. Global Nest: The International Journal. 7(1), 16-36. CAPRE Guidelines. (2000). Regional committee for drinking water institution and sanitation for Central America, Panama and Dominican Republic. Carlson, K., Via, S., Bellamy, B., Carlson, M. (2000). Secondary effects of enhanced coagulation and softening. J. American Water Work Association. 92(6), 63-75. Cedergren, M.I., Selbing, A.J., Lofman, O., Källen, A.J. (2002). Chlorination by-products and nitrate in drinking water and risk for congenital cardiac defects. J. Environmental Research Section. A(89), 124-130. CEPIS-OPS-MS. (2000). Evaluación de los Servicios de Agua Potable Saneamiento 2000 en las Americas. Panamerican Centre of Sanitary Engineering and Environmental Science (CEPIS). Lima, Peru. Christman, R.F., Johnson, J.R., Hass, F.K., Faender, W.T., Liao, W.T., Norwood, D.L., Alexander, H.J. (1978). Natural and model aquatic humic: reactions with chlorine. In Water Chlorination: Environmental Impact and Health Effects. Vol 2. Ann Arbor Science Publishers. Croué, J.P., Violleau, D., Bodaire, C., Legubre, B. (1999). Removal of hydrophobic and hydrophilic constituents by anion exchange resin. J. Water Science Technology. 40(9), 207-214.
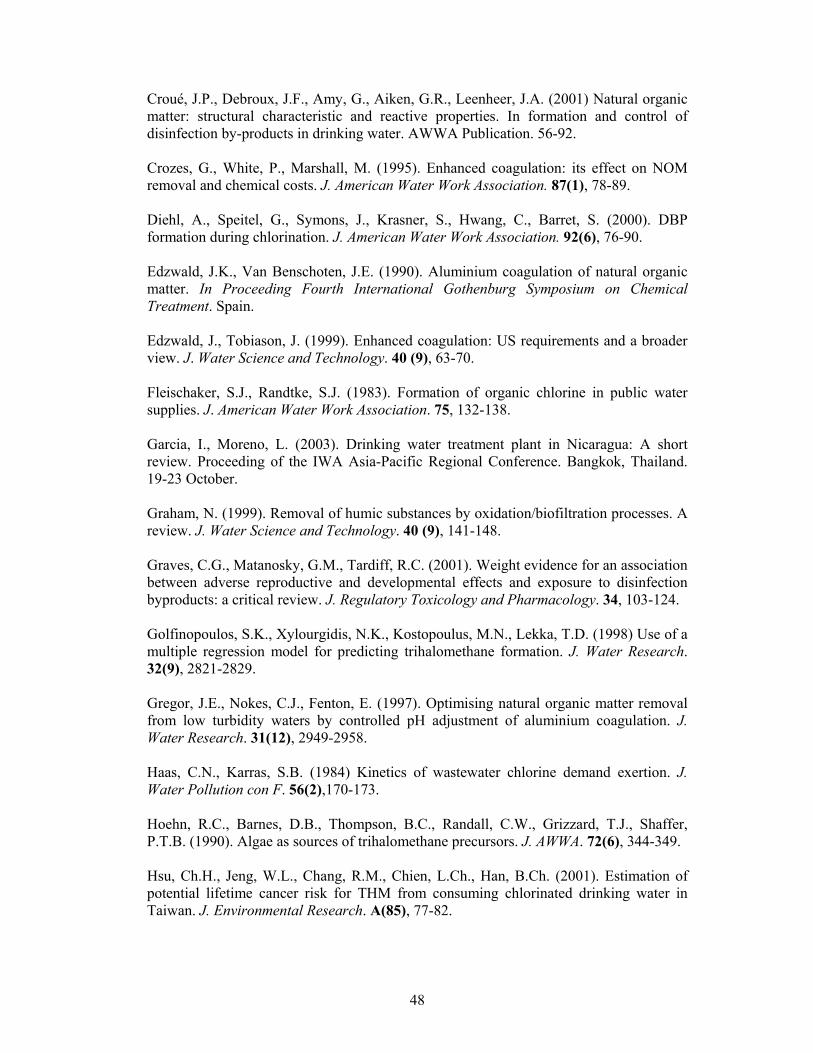
48
Croué, J.P., Debroux, J.F., Amy, G., Aiken, G.R., Leenheer, J.A. (2001) Natural organic matter: structural characteristic and reactive properties. In formation and control of disinfection by-products in drinking water. AWWA Publication. 56-92. Crozes, G., White, P., Marshall, M. (1995). Enhanced coagulation: its effect on NOM removal and chemical costs. J. American Water Work Association. 87(1), 78-89. Diehl, A., Speitel, G., Symons, J., Krasner, S., Hwang, C., Barret, S. (2000). DBP formation during chlorination. J. American Water Work Association. 92(6), 76-90. Edzwald, J.K., Van Benschoten, J.E. (1990). Aluminium coagulation of natural organic matter. In Proceeding Fourth International Gothenburg Symposium on Chemical Treatment. Spain. Edzwald, J., Tobiason, J. (1999). Enhanced coagulation: US requirements and a broader view. J. Water Science and Technology. 40 (9), 63-70. Fleischaker, S.J., Randtke, S.J. (1983). Formation of organic chlorine in public water supplies. J. American Water Work Association. 75, 132-138. Garcia, I., Moreno, L. (2003). Drinking water treatment plant in Nicaragua: A short review. Proceeding of the IWA Asia-Pacific Regional Conference. Bangkok, Thailand. 19-23 October. Graham, N. (1999). Removal of humic substances by oxidation/biofiltration processes. A review. J. Water Science and Technology. 40 (9), 141-148. Graves, C.G., Matanosky, G.M., Tardiff, R.C. (2001). Weight evidence for an association between adverse reproductive and developmental effects and exposure to disinfection byproducts: a critical review. J. Regulatory Toxicology and Pharmacology. 34, 103-124. Golfinopoulos, S.K., Xylourgidis, N.K., Kostopoulus, M.N., Lekka, T.D. (1998) Use of a multiple regression model for predicting trihalomethane formation. J. Water Research. 32(9), 2821-2829. Gregor, J.E., Nokes, C.J., Fenton, E. (1997). Optimising natural organic matter removal from low turbidity waters by controlled pH adjustment of aluminium coagulation. J. Water Research. 31(12), 2949-2958. Haas, C.N., Karras, S.B. (1984) Kinetics of wastewater chlorine demand exertion. J. Water Pollution con F. 56(2),170-173. Hoehn, R.C., Barnes, D.B., Thompson, B.C., Randall, C.W., Grizzard, T.J., Shaffer, P.T.B. (1990). Algae as sources of trihalomethane precursors. J. AWWA. 72(6), 344-349. Hsu, Ch.H., Jeng, W.L., Chang, R.M., Chien, L.Ch., Han, B.Ch. (2001). Estimation of potential lifetime cancer risk for THM from consuming chlorinated drinking water in Taiwan. J. Environmental Research. A(85), 77-82.

49
Imai, A., Kazuo, M., Nagai, T. (2003). Trihalomethane formation potential of dissolved organic matter in a shallow eutrophic lake. J. Water Research. 37, 4284-4294. Ivancev, I., Dalmacija, B., Tamas, Z., Karlovic, E. (1999). The effect of different drinking water treatment process on the rate of chloroform formation in the reactions of natural organic matter with hypochlorite. J. Water Research. 33(18), 3715-3722. Kitis, M., Kilduff, J., Karanfil, T. (2001). Isolation of dissolved organic matter (DOM) from surface waters using reverse osmosis and its impact on the reactivity of DOM to formation and speciation of disinfection by-products. J. Water Research. 35(9), 2225-2234. Koch, B., Krasner, S.W., Sclimenti, M.J., Schimpff, W.K. (1991). Predicting the formation of DBPs by the simulated distribution system. J. AWWA. 83(10), 62-68. Kool, H.H., Kreijl, V.C.F., Oers, V.H. (1984). Mutagenic activity in drinking water in the Netherlands: a survey and a correlation. J. Toxicology Environmental Chemistry. 7(2), 111-129. Krasner, S.W., Croue, J.P., Buffle, J., Perdue, E.M. (1996). Three approaches for characterizing NOM. J. American Water Works Association. 88. 66-79. Krasner, S.W. (1999). Chemistry of disinfection by-products formation on formation and control of disinfection by-products in drinking water, Chapter 2. AWWA. Lane, D. 1999. Hyperstat. Atomic Dog Publishing. USA Lin, C.F., Lin, T.Y., Hao, O.J. 2000. Effectos of humic substances characteristic on UF performance. J. Water Research. 34(4), 1097-1106. Marhaba, T., Pipada, N. (2000). Coagulation: effectiveness in removing dissolved organic matter fractions. J. Environmental Engineering Science. 17(2), 107-115. McClellan, D., Reckhow, D., Tobiason. J., Edzwald, J. (2004). A comprehensive kinetic model for chlorine decay and chlorination by-product formation. Department of civil and environmental engineering. University of Massachusetts. Montgomery, D.C. (1997). Design and Analysis of Experiments. Fifth Edition. John Wiley & Sons. Inc. USA Morris, J.C., Baum, B. (1978). Precursors and mechanism of haloform formation in the chlorination of water supplies. In Water Chlorination: Environmental Impact and Health Effects. Vol 2. Ann Arbour Science Publisher. Mougdal, C.J., Lipscomb, J.C., Bruce, R.M. (2000). Potential health effect of drinking water disinfection by-products using quantitative structures toxicity relationship. J. Toxicology. 147, 109-131.
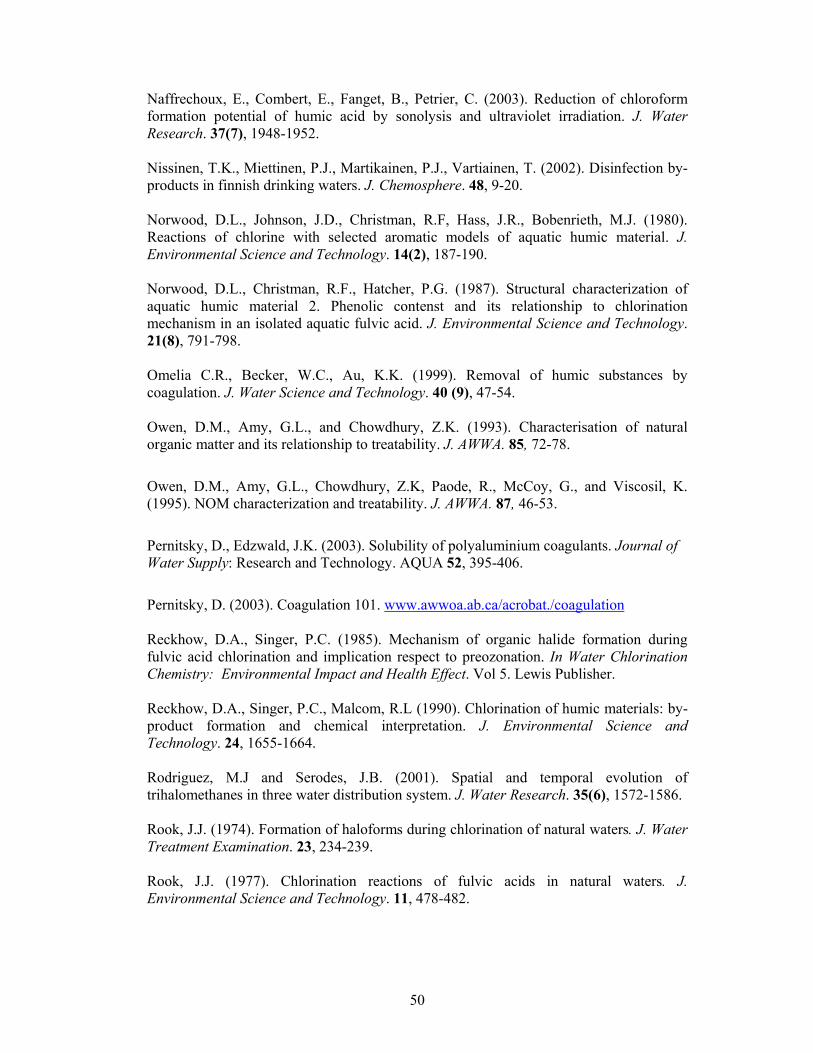
50
Naffrechoux, E., Combert, E., Fanget, B., Petrier, C. (2003). Reduction of chloroform formation potential of humic acid by sonolysis and ultraviolet irradiation. J. Water Research. 37(7), 1948-1952. Nissinen, T.K., Miettinen, P.J., Martikainen, P.J., Vartiainen, T. (2002). Disinfection by-products in finnish drinking waters. J. Chemosphere. 48, 9-20. Norwood, D.L., Johnson, J.D., Christman, R.F, Hass, J.R., Bobenrieth, M.J. (1980). Reactions of chlorine with selected aromatic models of aquatic humic material. J. Environmental Science and Technology. 14(2), 187-190. Norwood, D.L., Christman, R.F., Hatcher, P.G. (1987). Structural characterization of aquatic humic material 2. Phenolic contenst and its relationship to chlorination mechanism in an isolated aquatic fulvic acid. J. Environmental Science and Technology. 21(8), 791-798. Omelia C.R., Becker, W.C., Au, K.K. (1999). Removal of humic substances by coagulation. J. Water Science and Technology. 40 (9), 47-54. Owen, D.M., Amy, G.L., and Chowdhury, Z.K. (1993). Characterisation of natural organic matter and its relationship to treatability. J. AWWA. 85, 72-78.
Owen, D.M., Amy, G.L., Chowdhury, Z.K, Paode, R., McCoy, G., and Viscosil, K. (1995). NOM characterization and treatability. J. AWWA. 87, 46-53.
Pernitsky, D., Edzwald, J.K. (2003). Solubility of polyaluminium coagulants. Journal of Water Supply: Research and Technology. AQUA 52, 395-406.
Pernitsky, D. (2003). Coagulation 101. www.awwoa.ab.ca/acrobat./coagulation Reckhow, D.A., Singer, P.C. (1985). Mechanism of organic halide formation during fulvic acid chlorination and implication respect to preozonation. In Water Chlorination Chemistry: Environmental Impact and Health Effect. Vol 5. Lewis Publisher. Reckhow, D.A., Singer, P.C., Malcom, R.L (1990). Chlorination of humic materials: by-product formation and chemical interpretation. J. Environmental Science and Technology. 24, 1655-1664. Rodriguez, M.J and Serodes, J.B. (2001). Spatial and temporal evolution of trihalomethanes in three water distribution system. J. Water Research. 35(6), 1572-1586. Rook, J.J. (1974). Formation of haloforms during chlorination of natural waters. J. Water Treatment Examination. 23, 234-239. Rook, J.J. (1977). Chlorination reactions of fulvic acids in natural waters. J. Environmental Science and Technology. 11, 478-482.

51
Standard Methods for the examination of water and wastewater. (1998). 20th Ed. American Public Health Association/American Water Works Association/Water Environment Federation, Washington DC, USA. Singer, P.C. (1994). Control of disinfection by-products in drinking water. J. Environmental Engineering. 120, 727-743. Singer, P.C. (1999). Humic substances as precursors for potentially harmful disinfection by-products. J. Water Science Technology. 40(9), 25-30. Stevens, A.A., Slocum, C.J., Seeger, D.R., Robert, G.G. (1976). Chlorination of organics in drinking water. J. American Water Work Association. 68, 615-620. Stevens, A.A., Moore, L.A., Miltner, R.J. (1989). Formation and control of non trihalomethane disinfection by-products. J. AWWA. 81(8), 54-59. Takanashi, H., Urano, K., Hirata, M., Hano, T., Ohgaki, S. (2001). Method for measuring mutagen formation potential (MFP) on chlorination as a new water quality index. J. Water Research. 35(7), 1627-1634. Thurman, E.M., Malcom, R.L. (1981). Isolation of natural organic matter by resin adsorption. J. Environment Science and Technology. 15(4), 463-466. Trehy, M.L., Bieber, T.I. (1981). Detection, identification and quantitative analysis of dihaloacetroniles in chlorinated natural waters. In advances in the identification and analysis of organic pollutants in water. Vol 2. Ann Arbour Science Publishers. Ueno, H., Sayato, Y., Nakamuro, K., Moto, K. (1996). Mutagenicity of volatile chlorination by-products and their occurrence in tap water. J. Water Works Association. 65(2), 20-27. USEPA. (1998). National primary drinking water regulations: disinfectant and disinfection by-products D/DBP, Final Rule. EPA 69389-9476. USEPA. (1999). Enhanced coagulation and enhanced precipitative softening guidance manual. Environmental Protection Agency. United States. Office of Water. EPA 815-R-99-012. USEPA. (2002). Long term 2 enhanced surface water treatment preamble and rule language. Draft. Utsumi, H., Kiyoshige, K., Mitade, C., Han, K.S., Hakoda, M., Manabe, H., Hamada, A. (1992). Mutagenicity and cytotoxicity of tap and raw water and their potential risk. J. Water Science and Technology. 26(1-2), 247-254. Villanueva, C.M., Kogevinas, M., Grimalt, J.O. (2003). Haloacteic acids and trihalometahnes in finished drinking waters from heterogeneous sources. J. Water Research. 37, 953-958.

52
Wang, G.S., Hssieh, S.T. (2001). Monitoring natural organic matter in water with scanning spectrophotometer. J. Environmental Engineering. (26). 205-212. Wattanachira, S., Musikavong, Ch., Permsuk, O., Pavasant, Pr. (2004). Removal of surrogates for natural organic matter and the probability of finding trihalomethanes in the produced water supply from small waterworks in Chiang Mai, Thailand. J. of Science and Technology. 29(1), 25-36. Westerhoff, P., Chao, P., Mash, H. (2004). Reactivity of natural organic matter with aqueous chlorine and bromine. J. Water Research. 38, 1502-1513. Williams, D.T., Nestmann, E.R., LeBel, G.L., Benoit, F.M., Otson, R. (1982). Determination of mutagenic potential and organic contaminants of great lakes drinking water. J. Chemosphere Chem. Biol. Toxicol. Related Environmental Problems. 11(3), 263-276. Williams, D., LeBel, G.L., Benoit, F. (1997). Disinfection by-products in Canadian drinking water. J. Chemosphere. 34(29), 299-316. Xie, Y.F. (2004). Disinfection by-products in drinking water: formation, analysis and control. Lewish Publishers. USA. Yoon, Y., Sohn, H., Amy, G., Cho, J., Lee, Y. (2004). Disinfectant decay and disinfection by-products formation model development: chlorination and ozonation by-products. J. Water Research. 38, 2461-2478.
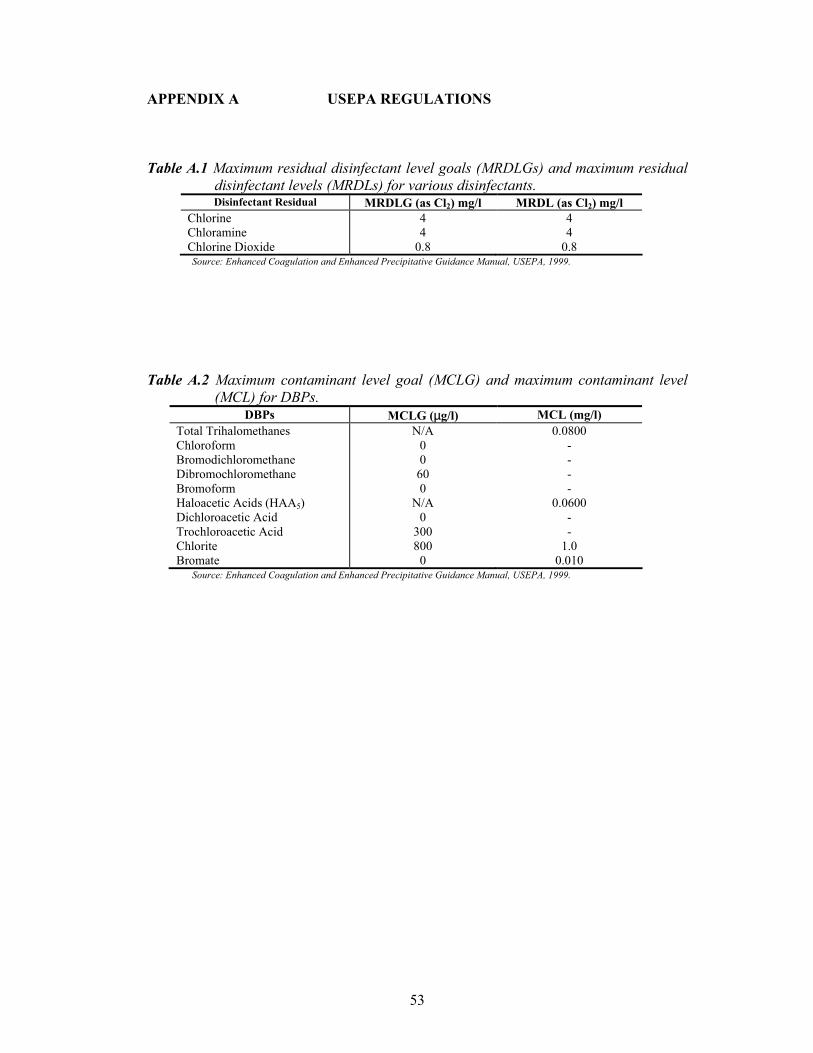
53
APPENDIX A USEPA REGULATIONS Table A.1 Maximum residual disinfectant level goals (MRDLGs) and maximum residual
disinfectant levels (MRDLs) for various disinfectants. Disinfectant Residual MRDLG (as Cl2) mg/l MRDL (as Cl2) mg/l
Chlorine Chloramine Chlorine Dioxide
4 4
0.8
4 4
0.8 Source: Enhanced Coagulation and Enhanced Precipitative Guidance Manual, USEPA, 1999.
Table A.2 Maximum contaminant level goal (MCLG) and maximum contaminant level (MCL) for DBPs.
DBPs MCLG (µg/l) MCL (mg/l) Total Trihalomethanes Chloroform Bromodichloromethane Dibromochloromethane Bromoform Haloacetic Acids (HAA5) Dichloroacetic Acid Trochloroacetic Acid Chlorite Bromate
N/A 0 0 60 0
N/A 0
300 800
0
0.0800 - - - -
0.0600 - -
1.0 0.010
Source: Enhanced Coagulation and Enhanced Precipitative Guidance Manual, USEPA, 1999.
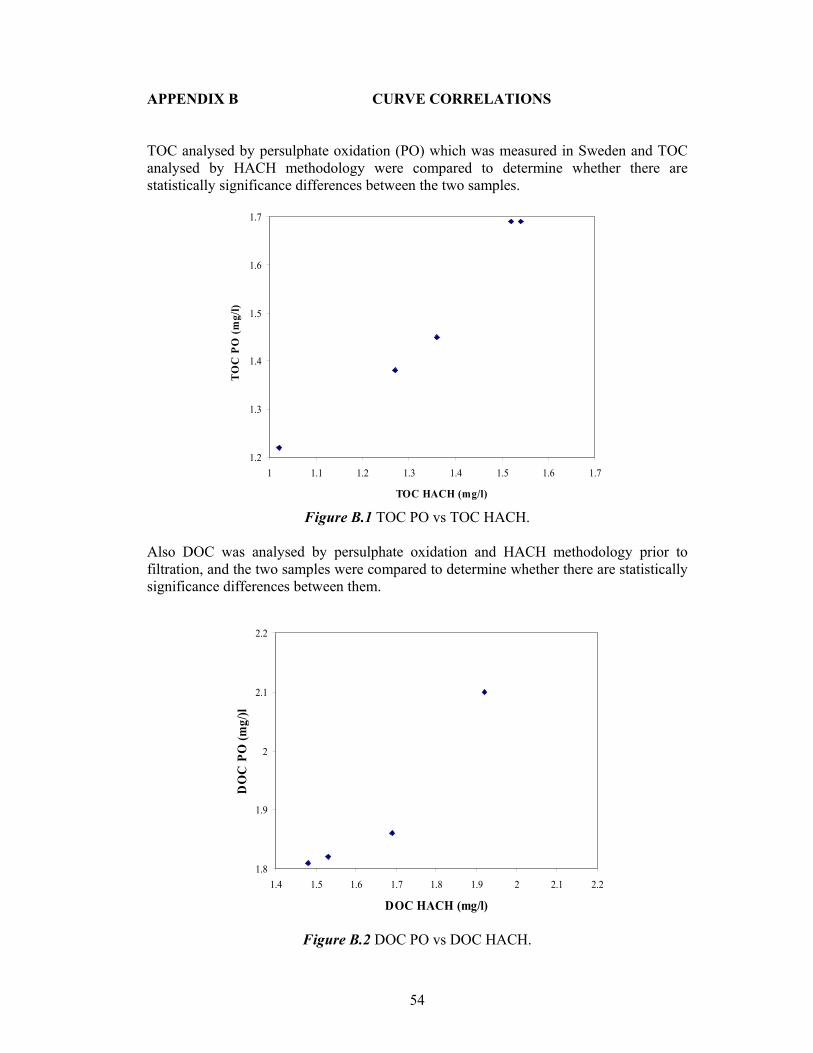
54
APPENDIX B CURVE CORRELATIONS TOC analysed by persulphate oxidation (PO) which was measured in Sweden and TOC analysed by HACH methodology were compared to determine whether there are statistically significance differences between the two samples.
1.2
1.3
1.4
1.5
1.6
1.7
1 1.1 1.2 1.3 1.4 1.5 1.6 1.7
TOC HACH (mg/l)
TOC
PO
(mg/
l)
Figure B.1 TOC PO vs TOC HACH.
Also DOC was analysed by persulphate oxidation and HACH methodology prior to filtration, and the two samples were compared to determine whether there are statistically significance differences between them.
1.8
1.9
2
2.1
2.2
1.4 1.5 1.6 1.7 1.8 1.9 2 2.1 2.2
DOC HACH (mg/l)
DO
C P
O (m
g/)l
Figure B.2 DOC PO vs DOC HACH.
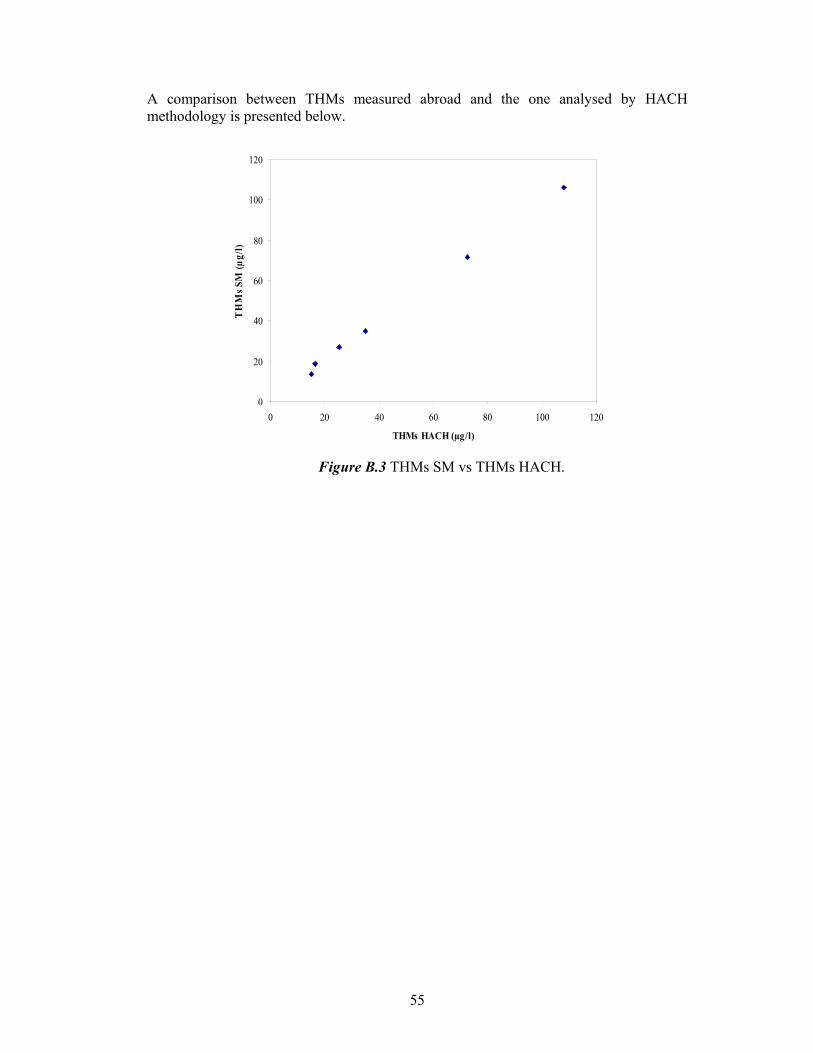
55
A comparison between THMs measured abroad and the one analysed by HACH methodology is presented below.
Figure B.3 THMs SM vs THMs HACH.
0
20
40
60
80
100
120
0 20 40 60 80 100 120
THMs HACH (µg/l)
TH
Ms S
M (µ
g/l)

56
APPENDIX C SUMMARY OF TOC, DOC AND THMs METHOD Total Organic Carbon (TOC) The total organic carbon (TOC) is determined by first sparging the sample under slightly acidic conditions to remove the inorganic carbon interferences. The organic carbon in the samples is digested by persulphate and acid to form carbon dioxide. During digestion, the carbon dioxide diffuses into a pH indicator reagent. The adsorption of carbon dioxide into the indicator forms carbonic acid. Carbonic acid changes the pH of the indicator solution which, in turn, changes the colour. The amount of colour change is related to the original amount of carbon present in the sample. The results are measured at 598 nm. Dissolved Organic Carbon (DOC) DOC measurements are performed using the same analytical techniques used to measure TOC. However, samples for DOC measurement must be through a 0.45 µm pore size filter prior analysis. Trihalomethanes (THMs) In the THMs Plus method, THM compounds present in the sample react with N,N-diethylnicotinamide under heated alkaline conditions to form a dialdehyde intermediate (5-hydroxy-2-(N,N-diethylcarboxamyde) 2,4-pentadienal). The samples is then cooled and acidified to pH 2.5. The dialdehyde intermediate formed is then reacted with 7-amino-1,3 napthalene disulfonic acid to form a coloured Shiff base. The colour formed is directly proportional to the total amount of THM compounds present in the sample. Test results are measured at 515 nm. Cancho and Ventura (2005) reported that multiple samples from across the United Sates were analysed by THMs HACH method, and the accuracy, precision and equivalency of the new method was determined by comparing the new method results to the three EPA methods (524.2, 551.1 and 552.2).