removal of pesticides from aqueous solutions by adsorption ...ecozeo.eu/docs/adsorption.pdf457...
TRANSCRIPT

Reprinted from
Adsorption Science & Technology2015 Volume 33 Number 5
Multi-Science Publishing Co. Ltd.5 Wates Way, Brentwood, Essex CM15 9TB, United Kingdom
Removal of Pesticides from Aqueous Solutionsby Adsorption on Zeolites as Solid Adsorbents
C. De Smedt, F. Ferrer, K. Leus and P. Spanoghe

457
Removal of Pesticides from Aqueous Solutions by Adsorption on Zeolites as Solid Adsorbents
C. De Smedt1,*, F. Ferrer2, K. Leus3 and P. Spanoghe1 (1) Laboratory of Crop Protection Chemistry,Faculty of Bio-Science Engineering, Ghent University, Coupure Links 653, 9000 Ghent, Belgium. (2) Lab Ferrer, FerranCatolic 3, 25200 Cervera Lleida, Spain. (3) Department of Inorganic and Physical Chemistry, Center for OrderedMaterials, Organometallics and Catalysis (COMOC), Ghent University, Krijgslaan 281-S3, 9000 Ghent, Belgium.
(Received date: 13 January 2015; Accepted date: 14 April 2015)
ABSTRACT: To prevent the contamination of groundwater and surface waterby pesticides, appropriate measures should be taken to treat the contaminatedwater before discharge. Zeolites seem to be a promising material to adsorbpesticides. This paper deals with the removal of mobile pesticides from water ondifferent types of zeolites. Experiments were performed to understand theadsorption mechanisms of bentazon, clopyralid, imidacloprid, isoproturon andmetalaxyl-m on zeolites and to determine the most efficient adsorbent for thepurification of water contaminated by these pesticides. More immobilepesticides (imidacloprid, isoproturon and metalaxyl-m) tended to associate withthe zeolites, whereas more mobile pesticides (bentazon and clopyralid)partitioned in water. According to the adsorption percentage, zeolite of the typesBEA and FAU showed the best results for adsorbing the pesticides. Twodifferent kinetic models, namely, pseudo-first-order and pseudo-second-ordermodels, were used to fit the kinetics data. The experimental data were bestdescribed by the pseudo-second-order model. The rate of adsorption was also inline with the mobility of the pesticides. The adsorption isotherms weredetermined and modelled based on the observed types according to InternationalUnion of Pure and Applied Chemistry. The type III isotherm was mostfrequently observed in this case. The Freundlich model, which describes thistype of isotherm, gave a good fit for the adsorption of the pesticides. Differentassumptions, that could describe the meaning of these type III isotherms, arediscussed in this paper. These assumptions are based on the particle size of theadsorbates, the water adsorption on the zeolites and the modifications of thecrystal structures.
INTRODUCTION
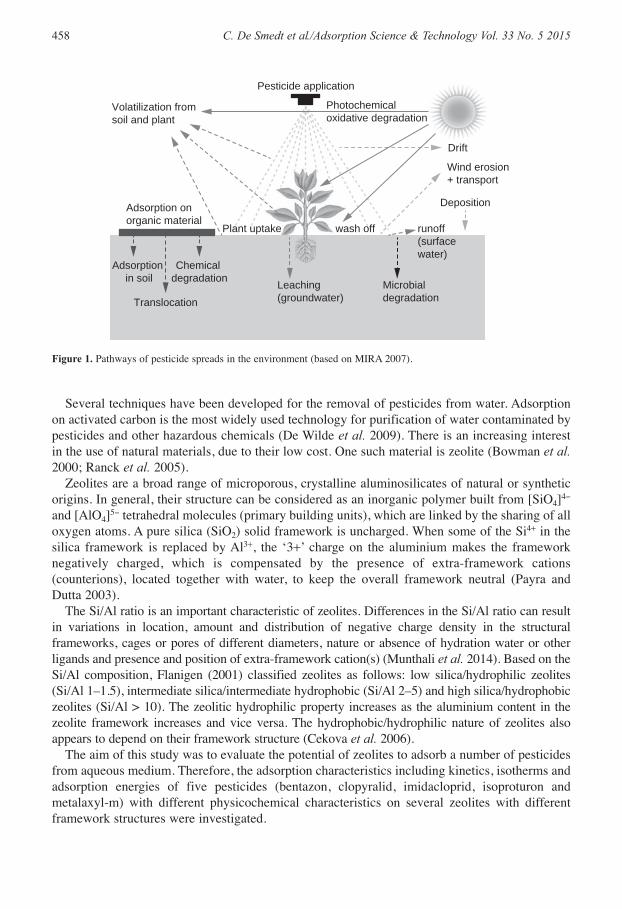
Environmental problems associated with the use of pesticides are a matter of concern becausepesticides can move through the air and may eventually end up in other parts of the environment,such as in soil or water. It is estimated that only 80% of the applied pesticides reach their targetedareas (Forster 2004). The different pathways by which pesticides spread in the environment areshown in Figure 1. One of the major concerns about the use of these organic compounds inagronomy and horticulture is their ability to leach into groundwater (Colella 2007); especially, thehighly mobile pesticides are a matter of current concern (Kalkhoff et al. 1998; Kolpin et al. 1998).
*Authors to whom all correspondence should be addressed. E-mail: [email protected] (C. De Smedt).
Several techniques have been developed for the removal of pesticides from water. Adsorptionon activated carbon is the most widely used technology for purification of water contaminated bypesticides and other hazardous chemicals (De Wilde et al. 2009). There is an increasing interestin the use of natural materials, due to their low cost. One such material is zeolite (Bowman et al.2000; Ranck et al. 2005).
Zeolites are a broad range of microporous, crystalline aluminosilicates of natural or syntheticorigins. In general, their structure can be considered as an inorganic polymer built from [SiO4]4-
and [AlO4]5- tetrahedral molecules (primary building units), which are linked by the sharing of alloxygen atoms. A pure silica (SiO2) solid framework is uncharged. When some of the Si4+ in thesilica framework is replaced by Al3+, the ‘3+’ charge on the aluminium makes the frameworknegatively charged, which is compensated by the presence of extra-framework cations(counterions), located together with water, to keep the overall framework neutral (Payra and Dutta 2003).
The Si/Al ratio is an important characteristic of zeolites. Differences in the Si/Al ratio can resultin variations in location, amount and distribution of negative charge density in the structuralframeworks, cages or pores of different diameters, nature or absence of hydration water or otherligands and presence and position of extra-framework cation(s) (Munthali et al. 2014). Based on theSi/Al composition, Flanigen (2001) classified zeolites as follows: low silica/hydrophilic zeolites(Si/Al 1–1.5), intermediate silica/intermediate hydrophobic (Si/Al 2–5) and high silica/hydrophobiczeolites (Si/Al > 10). The zeolitic hydrophilic property increases as the aluminium content in thezeolite framework increases and vice versa. The hydrophobic/hydrophilic nature of zeolites alsoappears to depend on their framework structure (Cekova et al. 2006).
The aim of this study was to evaluate the potential of zeolites to adsorb a number of pesticidesfrom aqueous medium. Therefore, the adsorption characteristics including kinetics, isotherms andadsorption energies of five pesticides (bentazon, clopyralid, imidacloprid, isoproturon andmetalaxyl-m) with different physicochemical characteristics on several zeolites with differentframework structures were investigated.
458 C. De Smedt et al./Adsorption Science & Technology Vol. 33 No. 5 2015
Photochemical oxidative degradation
Pesticide application
Drift
Wind erosion + transport
Deposition
runoff(surfacewater)
Microbial degradation
Volatilization fromsoil and plant
Adsorption on organic material
Plant uptake
Adsorption in soil
Translocation
Chemical degradation Leaching
(groundwater)
wash off
Figure 1. Pathways of pesticide spreads in the environment (based on MIRA 2007).

EXPERIMENTAL ANALYSISPesticide Selection (Adsorbates)
The studied pesticides were selected based on their physicochemical characteristics and were dividedinto five categories based on their mobility (Koc) (Pesticide Properties Database 2014). In addition,the groundwater ubiquity score (GUS) indicator could be used to describe the mobility of thepesticides (Gustafson 1989). A GUS indicator lower than 1.8 indicates an immobile pesticide (DeWilde et al. 2008). One or more pesticides were selected from the mobile category to be used in batchadsorption experiments. Clopyralid (Sigma Aldrich) was selected as a strongly mobile pesticide andbentazon (Sigma Aldrich) as a mobile pesticide. Pesticides selected from the moderately mobilecategory were imidacloprid (Bayer Crop Protection) and isoproturon (Sigma Aldrich). Metalaxyl-M(Syngenta Crop Protection) was selected as a slightly mobile pesticide. The chemical structures ofthese technical-grade pesticides and their chemical properties are shown in Table 1. The test solutionswere prepared by diluting the stock solutions to the desired concentration of 10 mg l-1.
Zeolite Selection (Adsorbents)
Seven commercially available zeolite structures were selected, including zeolite beta (BEA),chabazite (CHA), zeolite Y (FAU), clinoptilolite (HEU), zeolite 4A (LTA), ZSM-5/silicalite-1 (MFI)and mordenite (MOR). The varying arrangement of the structural unit in zeolite frameworks resultsin the generation of pores and cavities of various dimensions, responsible for the confinement effectsduring adsorption of molecules. Two quantities of particular interest for characterizing pores are thelargest cavity diameter (LCD) and the pore-limiting diameter (PLD). The LCD corresponds to themaximum of the pore-size distribution and the PLD corresponds to the largest characteristic guest
Removal of Pesticides from Aqueous Solutions by Adsorption on Zeolites as Solid Adsorbents 459
TABLE 1. Pesticide Properties
Bentazon Clopyralid Imidacloprid Isoproturon Metalaxyl-M
Molecules
Purity (%) 97 100 99 99.5 96.6Size (Å)a <3 × 10 × 5 <3 × 7 × 7 10 × 6 × 5 <3 × 12 × 6 <3 × 12 × 7.6Chemicalformula C10H12N2O3S C6H3Cl2NO2 C9H10ClN5O2 C12H18N2O C15H21NO4
MM(g mol-1) 240.3 192.0 255.66 206.28 279.33Swater
(20 °C; mg l-1) 570 1,43,000 610 70.2 26,000Log Kow
(20 °C; pH 7) –0.46 –2.63 0.57 2.5 1.71Koc orKfoc (ml g-1) 55.3 5.0 225 122 660GUS 2.59 3.44 3.69 2.61 1.88
aAll molecular size calculations were performed using the Gaussian 09 program (Frisch et al. 2009).Koc or Kfoc = adsorption coefficient; log Kow = octanol–water partition coefficient; MM = molecular weight; Swater = water solubility.
NH
N
O
SO
ON
OHO
Cl
Cl
N
NO2
N N
HN-
Cl
NH N
ON
OO
O
O

molecule size for which there is a non-zero accessible volume (Table 2; Baerlocher and McCusker2014). These quantities are also plotted in Figure 2. The utility of such a plot is apparent for theconsideration of a chemical reaction. A desirable zeolite would require a PLD larger than all speciesinvolved and an LCD larger than the transition state structure (First et al. 2014).
Zeolite Characterization
The specific surface area of the zeolites was determined using nitrogen adsorption/desorptionmeasurements. The isotherms were recorded on a BELSORP Mini II equipment (Bel Japan Inc.,Osaka, Japan) at –196 °C. The samples were pre-treated at 150 °C under vacuum. The results forthe different selected zeolites are presented in Table 3. X-ray diffraction was performed with anARL X’TRA X-ray diffractometer (Thermo Fisher Scientific, Waltham, MA, USA) equipped witha Cu KR1 tube and a Peltier cooled lithium-drifted silicon solid stage detector. The XRD patternsof the different zeolites showed their characteristic peaks. Finally, the Si/Al ratio of the sampleswas determined by X-ray fluorescence analysis. This analysis is based on the emission of X-raysby the material when an electron drops down to a vacant level and releases energy. Themeasurements were performed on an NEX CG (Rigaku) using a Mo–X-ray source.
460 C. De Smedt et al./Adsorption Science & Technology Vol. 33 No. 5 2015
0
2
4
6
8
10
12
14
16
18
0 2 4 6 8 10 12 14
Pore limiting diameter, PLD (Å)
1
7 6
5
4
3
2
Larg
est c
avity
dia
met
er, L
CD
(Å)
Figure 2. Largest cavity diameter (LCD) plotted against pore limiting diameter (PLD) for structures in the 'Database ofzeolite structures', with 1 = BEA; 2 = CHA; 3 = FAU; 4 = HEU; 5 = LTA; 6 = MFI and 7 = MOR (Baerlocher andMcCusker 2014; First et al. 2014).
TABLE 2. Accessibility of the Different Zeolites
Framework Crystal Channel Pore volumeMaterial name type code structure structure (cm3 g–1) LCD (Å) PLD (Å)
Zeolite beta BEA Tetragonal 3D 0.416 6.9 6.7Chabazite CHA Rhombohedral 3D 0.434 8.0 4.2Zeolite Y FAU Cubic 3D 0.506 11.9 6.7Clinoptilolite HEU Monoclinic 2D 0.279 6.6 4.3Zeolite 4A LTA Cubic 3D 0.508 11.7 4.9ZSM-5/Silicalite-1 MFI Orthorhombic 3D 0.242 7.0 5.0Mordenite MOR Orthorhombic 1D 0.293 6.5 6.5

Adsorption Experiments
Adsorption experiments, performed in a batch reactor system, were conducted in three ways,namely, dependent on adsorption (percentage), time (kinetic) and concentration (isotherm). Thesuspensions (adsorbent and pesticide aqueous solution) were shaken on an orbital shaker at 150 rpm at room temperature (22 °C). The supernatants were then filtered with a syringe filtercontaining a polyvinylidene difluoride membrane with a pore size of 0.22 mm (Carl Roth,Karlsruhe-Rheinhafen, Germany). The aliquots with bentazone, clopyralid, imidacloprid,isoproturon, linuron and metalaxyl-m were injected into the high-performance liquidchromatography column with photodiode array detector, and the aliquots with bifenthrin andfenpropimorph (after hexane extraction) were injected into the gas chromatography column forpesticide concentration measurements. The amounts adsorbed were determined from the initialand final concentrations of the contaminant solution. All tests were carried out in triplicate andcontrol runs containing the pesticide but without the addition of an adsorbent were also included.
Selection Based on Adsorption Percentage
Adsorption kinetics and isotherms were not determined for all zeolites, but only for those that bestadsorbed the pesticides. For these tests, 0.1 ± 0.001 g zeolite was shaken in 100-ml conical flaskswith 20 ml of 10 mg l-1 solution of the respective pesticide. The adsorption percentage ofpesticides on zeolites was calculated as follows:
(1)
where Ci and Cf are the initial and final pesticide concentrations (mg l–1), respectively.
= − ×Adsorption (%)C C
C100i f
i
Removal of Pesticides from Aqueous Solutions by Adsorption on Zeolites as Solid Adsorbents 461
TABLE 3. Zeolite Properties
FTC Si/Alpractical SBET (m2 g–1)practical Product name
BEA 1 11.84 365 H-BEA-25 (Clariant, Germany)2 15.87 413 H-BEA-35 (Clariant, Germany)3 49.34 348 CP 811C-300 (Zeolyst, USA)
CHA 4 3.08 8a Siliz MFD CH 200 (Somez, France)5 3.12 11a Siliz MFD CH 70 (Somez, France)
FAU 6 15.40 661 CBV 720 (Zeolyst, The Netherlands)7 32.91 642 CBV 780 (Zeolyst, The Netherlands)
HEU 8 5.60 21a Slowakije (Zeoliet, Belgium)9 5.45 23a Turkije (Zeoliet, Belgium)10 5.58 11a Hungary (Terra Humana, Hungary)
LTA 11 1.15 1a Wetstop (FMC, Spain)12 1.12 2a Zeolite 4A pH 8 (FMC, Spain)
MFI 13 13.19 8a TZP-302 (Clariant, Germany)14 30.19 314 H-MFI-90 (Clariant, Germany)15 57.54 198 H-CZP-300 (Clariant, Germany)16 17.83 6a NH4-CZP-55 (Clariant, Germany)17 – 266 H-CZP-800 (Clariant, Germany)
MOR 18 6.64 16 H-MOR-14 (Clariant, Germany)19 10.53 34 H-MOR-20 (Clariant, Germany)
aExternal surface area.

Adsorption Kinetics
The adsorption kinetic study predicts the rate at which adsorption takes place. An amount of 0.1 ± 0.001 g of the respective zeolite was added to 100 ml of 10 mg l–1 solution of the respectivepesticide in a 250-ml flat-bottomed flask. The samples were collected after 0, 0.25, 0.50, 1, 3, 6,24 and 48 hours. The most commonly used kinetic models, that is, the pseudo-first-order equation(Lagergren’s equation) and the pseudo-second-order equation (Ho equation), were applied to theobtained experimental data. The equations can be described as shown in Table 4, where k1 and k2
are the rate constants of first-order adsorption (hour–1) and second-order adsorption (hour–1), andqe and qs are the adsorbed concentration (mg g–1) at equilibrium and at time t (hour).
The adsorbed pesticide concentration was calculated as follows:
(2)
where qe represents the adsorbed concentration (mg g–1), V the volume of pesticide solution added(l), m the weight of the adsorbent (g) and Ci and Ce are the initial and equilibrium pesticideconcentrations (mg l–1), respectively.
Adsorption Isotherms
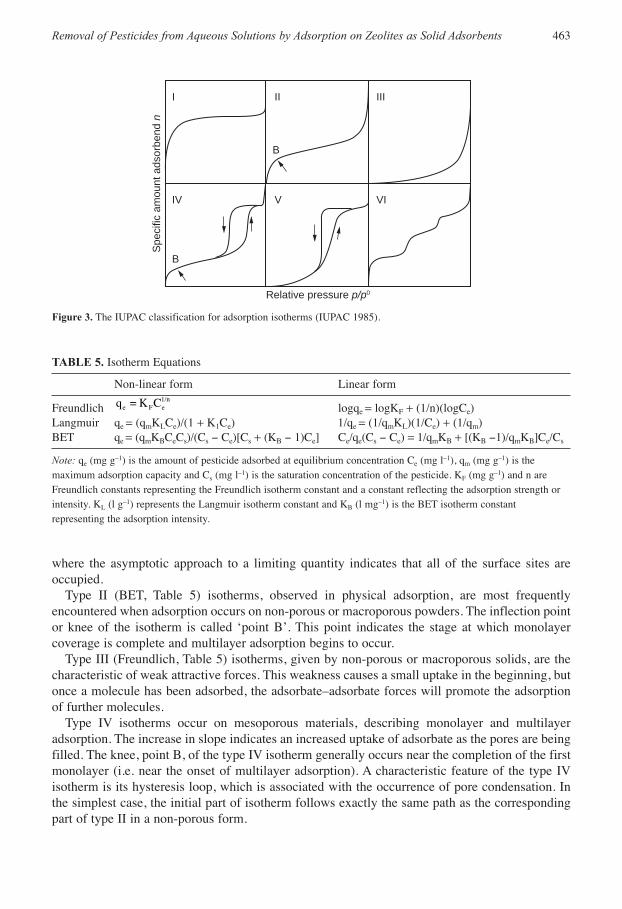
An adsorption isotherm is a simple description of the performance of an adsorbent for the removalof a given target substance. From this isotherm, the adsorption capacity can be derived, whichmakes it possible to compare the adsorption capacities of the different adsorbents for pollutants inaqueous solutions. The adsorption isotherms of the pesticides on the zeolites were also measuredwith the batch equilibration technique. These adsorption isotherms provide information about thesurface properties and affinity of the adsorbent. In this experiment, 100 mg zeolite was added to100 ml of pesticide solution at five different concentrations (50, 100, 250, 500 and 1000 mg l–1).All stock solutions were prepared in distilled water. Adsorption isotherms were obtained byplotting the amount of pesticide adsorbed by the substrate (g kg–1) versus the respectiveconcentration in equilibrium solution (mg l–1). The experimental adsorption isotherms mayconveniently be grouped into six classes according to the International Union of Pure and AppliedChemistry (IUPAC) classification (Figure 3). The first five characteristic types were originallyproposed by Brunauer and his co-workers as the Brunauer, Deming, Deming and Teller (BDDT)classification (IUPAC 1985).
Type I (Langmuir, Table 5) isotherm is observed during the adsorption on a microporous solid(pore widths < 2 nm). It represents an adsorption process with a low affinity for the adsorbate andthe plateau indicates monolayer coverage. This type of behaviour is typical for chemisorption,
= −q
(c c )V
mei e
462 C. De Smedt et al./Adsorption Science & Technology Vol. 33 No. 5 2015
TABLE 4. Pseudo-First-Order Equation (Lagergren) and Pseudo-Second-Order Equation (Ho)
Integration: Amount adsorbedDifferential equation qt = 0, t = 0 and qt = qt, t = t (mg g–1) at time t (h)
First-orderequation dqt/dt = k1(qe – qt) ln(qe – qt) = lnqe – k1t qt = qe(1 – e– k1t)Second-orderequation dqt/dt = k2(qe – qt)2 1/qt = 1/qe
2 + (1/qe)t qt = [t/(1/k2qe2) + t/qe]
where the asymptotic approach to a limiting quantity indicates that all of the surface sites areoccupied.
Type II (BET, Table 5) isotherms, observed in physical adsorption, are most frequentlyencountered when adsorption occurs on non-porous or macroporous powders. The inflection pointor knee of the isotherm is called ‘point B’. This point indicates the stage at which monolayercoverage is complete and multilayer adsorption begins to occur.
Type III (Freundlich, Table 5) isotherms, given by non-porous or macroporous solids, are thecharacteristic of weak attractive forces. This weakness causes a small uptake in the beginning, butonce a molecule has been adsorbed, the adsorbate–adsorbate forces will promote the adsorptionof further molecules.
Type IV isotherms occur on mesoporous materials, describing monolayer and multilayeradsorption. The increase in slope indicates an increased uptake of adsorbate as the pores are beingfilled. The knee, point B, of the type IV isotherm generally occurs near the completion of the firstmonolayer (i.e. near the onset of multilayer adsorption). A characteristic feature of the type IVisotherm is its hysteresis loop, which is associated with the occurrence of pore condensation. Inthe simplest case, the initial part of isotherm follows exactly the same path as the correspondingpart of type II in a non-porous form.
Removal of Pesticides from Aqueous Solutions by Adsorption on Zeolites as Solid Adsorbents 463
I II III
IV V
B
Relative pressure p/p0
Spe
cific
am
ount
ads
orbe
nd n
B
VI
Figure 3. The IUPAC classification for adsorption isotherms (IUPAC 1985).
TABLE 5. Isotherm Equations
Non-linear form Linear form
Freundlich logqe = logKF + (1/n)(logCe)Langmuir qe = (qmKLCe)/(1 + K1Ce) 1/qe = (1/qmKL)(1/Ce) + (1/qm)BET qe = (qmKBCeCs)/(Cs - Ce)[Cs + (KB - 1)Ce] Ce/qe(Cs - Ce) = 1/qmKB + [(KB -1)/qmKB]Ce/Cs
Note: qe (mg g–1) is the amount of pesticide adsorbed at equilibrium concentration Ce (mg l–1), qm (mg g–1) is themaximum adsorption capacity and Cs (mg l–1) is the saturation concentration of the pesticide. KF (mg g–1) and n areFreundlich constants representing the Freundlich isotherm constant and a constant reflecting the adsorption strength orintensity. KL (l g–1) represents the Langmuir isotherm constant and KB (l mg–1) is the BET isotherm constantrepresenting the adsorption intensity.
q = K Ce F e1/n

Type V isotherms are given by microporous or mesoporous solids and show pore condensationand hysteresis. However, in contrast to type IV, the initial part of this adsorption isotherm is verymuch similar to type III, indicating relatively weak attractive interactions between the adsorbentand the adsorbate.
Type VI isotherms are borderline cases between two or more of the aforementioned types. Thisstepped isotherm is relatively rare and is associated with layer-by-layer adsorption on a highlyuniform surface. The sharpness of the steps is dependent on the system (Rouquerol et al. 2014).
The essential features of the Langmuir isotherm may be expressed in terms of the separationfactor RL. Based on the shape of the isotherm of an adsorption system, this dimensionless constantpredicts whether the system is favourable or unfavourable (Ghaemi et al. 2011). The value of theseparation factor can be interpreted as given in Table 6.
(3)
Hygroscopicity
A measure of the hygroscopicity of a product is a consequence of the magnitude of the increaseor decrease in its water content as a function of relative humidity at a certain temperature. Thegeneration of the moisture isotherms will give more information about the hygroscopic effect ofzeolites and describe their relationship with water content. These adsorption isotherms weremeasured with a fully automated vapour adsorption analyzer (Decagon Devices Inc., Pullman,WA, USA).
The double log polynomial model was used to predict the moisture content at a given wateractivity (Decagon Devices 2015).
m = b3c3 + b2c2 + b1c + b0 (4)
where m is the moisture in g/100 solids or g/g solids, c = ln[–ln(aw)] and b0–b3 are empiricalconstants.
The moisture content value was introduced for calculating weight change at the different aw values. The water holding capacity (WHC) is the difference between the weight at maximumaw value and the weight at minimum aw value divided by the initial weight.
WHC = (weight aw,max - weight aw,min)/weightinitial (5)
The temperature used was 25 °C; aw,min = 0.125 and aw,max = 0.900. The water mass (or weight)is the difference between the weights of the wet and oven-dry samples (24 hours, 105 °C).
R =1
1+K CLL i
464 C. De Smedt et al./Adsorption Science & Technology Vol. 33 No. 5 2015
TABLE 6. Separation Factor Based on the Shape of the Langmuir Isotherm
Value RL Type of adsorption
RL > 1.0 UnfavourableRL = 1.0 Linear0 < RL < 1.0 FavourableRL = 0 Irreversible

RESULTS AND DISCUSSIONAdsorption Percentage
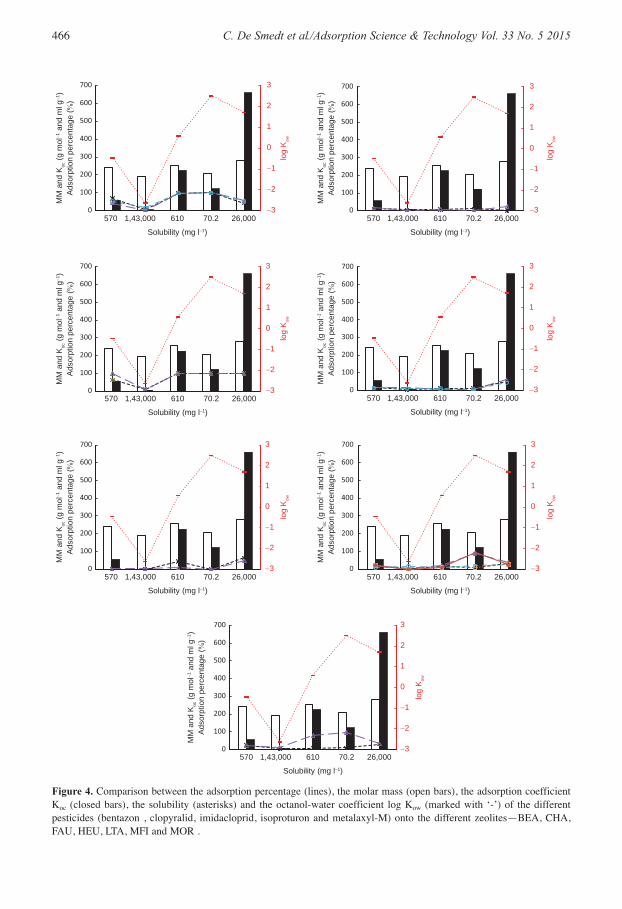
An initial evaluation of the different zeolites was made based on their pesticide adsorptioncapacity. The adsorption capacity is represented by the adsorption coefficient (Koc) and theoctanol–water partition coefficient (Kow) of the pesticides, which is also closely related to thewater solubility (S). The logarithmic value (log Kow) is used to describe the hydrophobicity orpolarity of a compound. Values of log Kow < 0 are considered as hydrophilic/polar, log Kow
between 0.5 and 2.5 as intermediate hydrophobic/polar and log Kow > 3 as hydrophobic/non-polar(Wang and Liu 2007). As described in literature, pesticides that have high solubility in water willremain in water and tend to not adsorb onto non-polar zeolites. This in contrast to non-polarpesticides, which tend to be pushed out of the water (Bansal 2012).
From the adsorption percentages obtained, shown in Table 7, it can be seen that clopyralid didnot adsorb onto the zeolites. The high water solubility, low Koc and Kow of clopyralid indicate thatthis polar pesticide prefers to stay in the aqueous phase. The combination of these properties mightexplain the fewer adsorption capacity for bentazon and the better adsorption capacity forimidacloprid, isoproturon and metalaxyl-m (Figure 4).
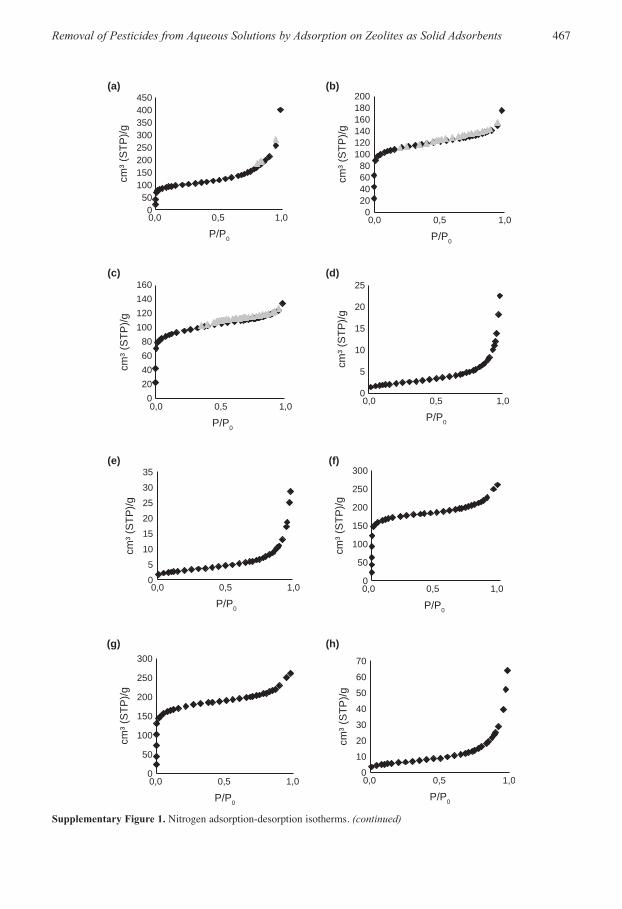
An adsorption trend can be established between the different zeolites. Zeolite beta and zeoliteY had the best adsorption capacity, compared with other zeolites. These results are consistent withthe higher values of the surface area (porosity) and PLD for these zeolites. Some nitrogenadsorption and desorption isotherms of the different zeolites (Figure S1, SupplementaryInformation) are type II isotherms, indicating a non-porous powder, which suggests that the poreopenings are too small for nitrogen (0.364 nm) to enter at 77 K (de Lange et al. 1995; Jagiello and
Removal of Pesticides from Aqueous Solutions by Adsorption on Zeolites as Solid Adsorbents 465
TABLE 7. Adsorption Percentage (% ± Standard Deviation) Determined at an Initial Concentration of 10 mg l–1
Adsorption (%) Bentazone Clopyralid Imidacloprid Isoproturon Metalaxyl-M
BEA 1 69.56 ± 2.46 9.12 ± 1.20 98.78 ± 0.03 100.00 ± 0.00 42.01 ± 0.792 42.77 ± 2.26 3.55 ± 0.49 98.51 ± 0.02 100.00 ± 0.00 55.19 ± 3.153 50.58 ± 2.17 16.94 ± 1.75 98.02 ± 0.04 100.00 ± 0.00 50.97 ± 1.98
CHA 4 9.90 ± 2.94 3.90 ± 0.33 5.78 ± 1.61 11.07 ± 0.32 0.40 ± 0.785 15.50 ± 2.20 2.72 ± 0.01 8.37 ± 1.31 3.70 ± 0.60 24.06 ± 1.59
FAU 6 63.22 ± 1.63 10.67 ± 1.76 99.75 ± 0.02 100.00 ± 0.00 99.84 ± 0.197 100.00 ± 0.00 10.81 ± 1.53 99.72 ± 0.02 100.00 ± 0.00 99.34 ± 0.14
HEU 8 14.53 ± 3.10 4.24 ± 1.13 10.48 ± 0.93 11.49 ± 1.50 51.48 ± 0.369 14.69 ± 2.76 13.60 ± 1.91 7.47 ± 0.85 7.83 ± 1.77 58.91 ± 1.3910 14.01 ± 3.39 9.06 ± 1.23 10.08 ± 0.23 7.06 ± 1.09 42.43 ± 0.80
LTA 11 0.23 ± 0.35 0.00 ± 0.00 44.18 ± 1.02 0.00 ± 0.00 64.56 ± 1.8812 1.59 ± 1.63 5.04 ± 0.97 7.26 ± 0.95 0.00 ± 0.00 46.53 ± 6.25
MFI 13 15.93 ± 1.04 2.72 ± 0.47 13.89 ± 0.71 7.21 ± 1.87 29.43 ± 1.6214 21.74 ± 2.95 3.87 ± 0.54 21.17 ± 0.80 86.10 ± 0.79 36.87 ± 1.3415 7.00 ± 0.96 15.02 ± 1.45 8.46 ± 0.88 18.15 ± 1.46 28.62 ± 1.9816 22.16 ± 1.94 0.00 ± 0.00 8.95 ± 0.30 8.74 ± 1.83 27.56 ± 1.5217 23.06 ± 2.06 0.00 ± 0.00 8.12 ± 3.69 92.77 ± 0.29 27.04 ± 4.12
MOR 18 24.34 ± 4.88 4.04 ± 0.91 8.17 ± 1.05 9.60 ± 1.89 30.11 ± 2.4719 22.05 ± 0.58 12.32 ± 0.70 79.48 ± 0.61 94.71 ± 0.39 31.23 ± 4.30
466 C. De Smedt et al./Adsorption Science & Technology Vol. 33 No. 5 2015
−3
−2
−1
0
1
2
3
0
100
200
300
400
500
600
700
−3
−2
−1
0
1
2
3
0
100
200
300
400
500
600
700
−3
−2
−1
0
1
2
3
0
100
200
300
400
500
600
700
−3
−2
−1
0
1
2
3
0
100
200
300
400
500
600
700
−3
−2
−1
0
1
2
3
0
100
200
300
400
500
600
700
570 1,43,000 610 70.2 26,000
log
Kow
Solubility (mg l−1)
MM
and
Koc
(g m
ol−1
and
ml g
−1)
Ads
orpt
ion
perc
enta
ge (%
)
570 1,43,000 610 70.2 26,000
Solubility (mg l−1)
log
Kow
570 1,43,000 610 70.2 26,000
Solubility (mg l−1)
MM
and
Koc
(g m
ol−1
and
ml g
−1)
Ads
orpt
ion
perc
enta
ge (%
)
MM
and
Koc
(g m
ol−1
and
ml g
−1)
Ads
orpt
ion
perc
enta
ge (%
)
570 1,43,000 610 70.2 26,000
Solubility (mg l−1)
log
Kow
log
Kow
log
Kow
570 1,43,000 610 70.2 26,000
Solubility (mg l−1)
MM
and
Koc
(g m
ol−1
and
ml g
−1)
Ads
orpt
ion
perc
enta
ge (%
)
MM
and
Koc
(g m
ol−1
and
ml g
−1)
Ads
orpt
ion
perc
enta
ge (%
)
−3
−2
−1
0
1
2
3
0
100
200
300
400
500
600
700
−3
−2
−1
0
1
2
3
0
100
200
300
400
500
600
700
570 1,43,000 610 70.2 26,000
Solubility (mg l−1)
log
Kow
MM
and
Koc
(g m
ol−1
and
ml g
−1)
Ads
orpt
ion
perc
enta
ge (%
)
570 1,43,000 610 70.2 26,000
Solubility (mg l−1)
MM
and
Koc
(g m
ol−1
and
ml g
−1)
Ads
orpt
ion
perc
enta
ge (%
)
log
Kow
Figure 4. Comparison between the adsorption percentage (lines), the molar mass (open bars), the adsorption coefficientKoc (closed bars), the solubility (asterisks) and the octanol-water coefficient log Kow (marked with ‘-’) of the differentpesticides (bentazon , clopyralid, imidacloprid, isoproturon and metalaxyl-M) onto the different zeolites—BEA, CHA,FAU, HEU, LTA, MFI and MOR .
Removal of Pesticides from Aqueous Solutions by Adsorption on Zeolites as Solid Adsorbents 467
0
50
100
150
200
250
300
0,0 0,5 1,0
cm³ (
STP
)/g
P/P0P/P0
0
10
20
30
40
50
60
70
0,0 0,5 1,0
cm³ (
STP
)/g
050
100150200250300350400450
0,0 0,5 1,0
cm³ (
STP
)/g
P/P0
P/P0
P/P0 P/P0
P/P0
P/P0
(a) (b)
(c) (d)
(e) (f)
020406080
100120140160180200
0,0 0,5 1,0
cm³ (
STP
)/g
020406080
100120140160
0,0 0,5 1,0
cm³ (
STP
)/g
0
5
10
15
20
25
0,0 0,5 1,0
cm³ (
STP
)/g
05
101520253035
0,0 0,5 1,0
cm³ (
STP
)/g
0
50
100
150
200
250
300
0,0 0,5 1,0
cm³ (
STP
)/g
(g) (h)
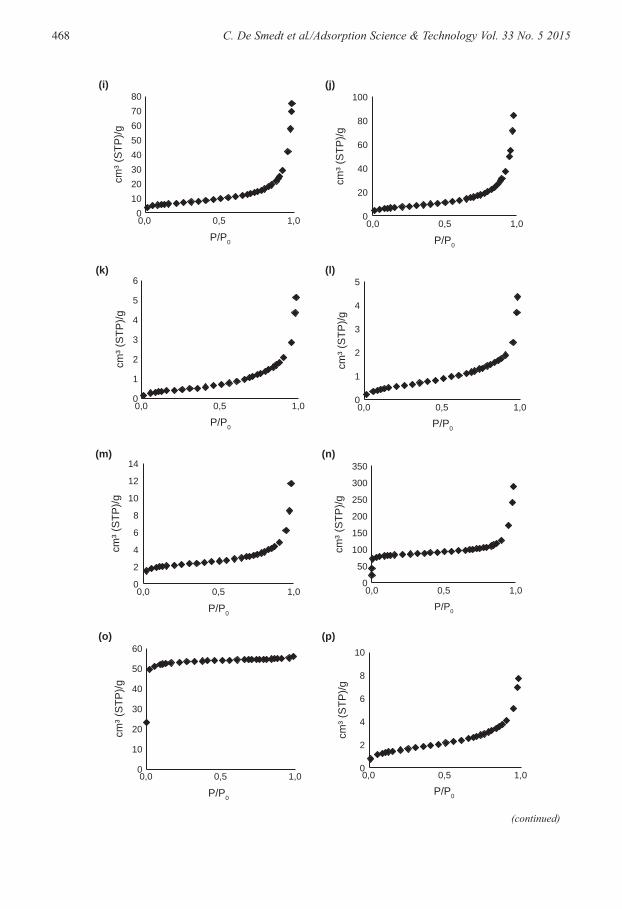
Supplementary Figure 1. Nitrogen adsorption-desorption isotherms. (continued)
468 C. De Smedt et al./Adsorption Science & Technology Vol. 33 No. 5 2015
P/P0
(m) (n)
(o) (p)
0
2
4
6
8
10
12
14
0,0 0,5 1,0
cm³ (
STP
)/g
0
50
100
150
200
250
300
350
0,0 0,5 1,0
cm³ (
STP
)/g
0
10
20
30
40
50
60
0,0 0,5 1,0
cm³ (
STP
)/g
0
2
4
6
8
10
0,0 0,5 1,0
cm³ (
STP
)/g
P/P0
P/P0P/P0
P/P0 P/P0
P/P0 P/P0
01020304050607080
0,0 0,5 1,0
cm³ (
STP
)/g
0
20
40
60
80
100
0,0 0,5 1,0
cm³ (
STP
)/g
0
1
2
3
4
5
6
0,0 0,5 1,0
cm³ (
STP
)/g
0
1
2
3
4
5
0,0 0,5 1,0
cm³ (
STP
)/g
(i) (j)
(k) (l)
(continued)

Removal of Pesticides from Aqueous Solutions by Adsorption on Zeolites as Solid Adsorbents 469
Thommes 2004; Shakarova et al. 2014; Valtchev et al. 2005). This means that the measured BETsurface areas in Table 3 for most zeolites correspond with their external surface area. Rezaei andWembley (2009) have reported that the external surface area per unit volume is one of theimportant parameters in this regard and determines the mass transfer in an adsorbent. The higherthe external surface area, the better the adsorption of molecules. The large-pore zeolites BEA andFAU, which were able to measure the BET surface area, showed better adsorption results. Accordingto literature sources, the external surface areas of these zeolites are as follows: H-BEA-25,130 m2 g–1; H-BEA-35, 41 m2 g–1; CP 811C-300, not available; CBV 720, 93 m2 g–1; and CBV780, 77 m2 g–1 (Kobayashi et al. 2015; Wagholika et al. 2004). A comparison between theadsorption percentages and the obtained surface areas is shown in Figure 5.
An additional explanation can be given by the hydrophobic properties, depending on the Si/Alratio, of the zeolites. The zeolitic hydrophobic property decreases as the aluminium content in thezeolite framework decreases and vice versa. These Si/Al values, summarized in Table 3, show thatzeolites BEA and FAU are hydrophobic zeolites, and therefore, preferentially adsorb theintermediate and non-polar pesticides (Figure 5). This hydrophobic/hydrophilic nature of zeolitesalso appears to depend on their framework structure, which explains why the MFI zeolites did notadsorb the pesticides well (Cekova et al. 2006). Based on these outcomes, zeolites beta and Y,having the highest adsorption percentages, were selected to determine the kinetic and isothermadsorption characteristics.
Supplementary Figure 1. (continued)
(s)
0
10
20
30
40
50
60
0,0 0,5 1,0
cm³ (
STP
)/g
P/P0
(q) (r)
0
5
10
15
20
25
30
35
0,0 0,5 1,0
cm³ (
STP
)/g
0
20
40
60
80
100
0,0 0,5 1,0
cm³ (
STP
)/g
P/P0P/P0

470 C. De Smedt et al./Adsorption Science & Technology Vol. 33 No. 5 2015
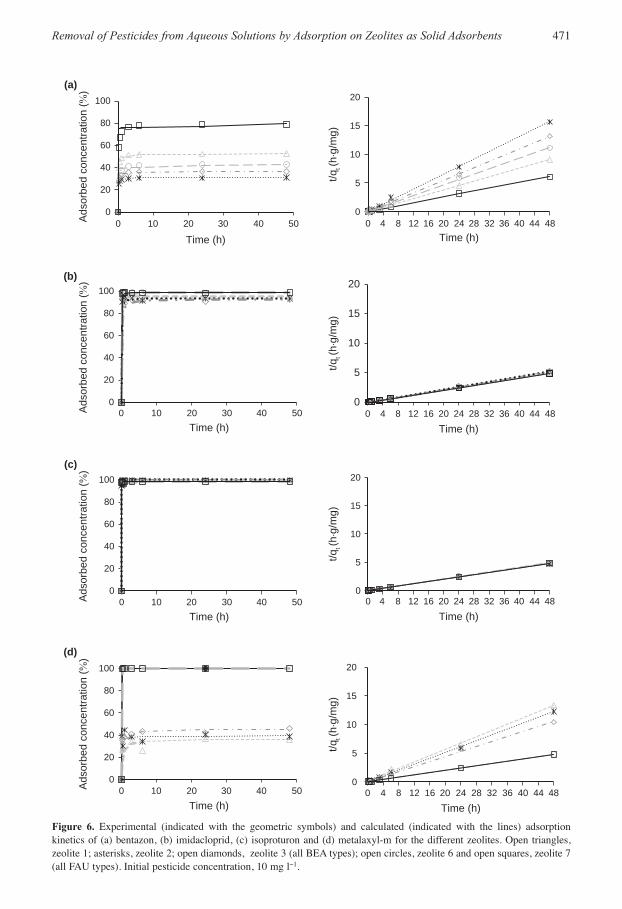
Adsorption Kinetics
The adsorption kinetics of the pesticides on zeolite types BEA and FAU are presented in Figure 6.An initial steep increase in the adsorbed pesticide concentration was observed in all cases with72–100% of the equilibrium concentration adsorbed after 1 hour. (The equilibrium concentrationsadsorbed was different for each zeolite and each pesticide. This equilibrium concentration can bederived from Figure 6.) Isoproturon was adsorbed quickly by all zeolites during the first hour ofsolid–solution contact time, followed by a quick progress towards an apparent equilibrium after15 and 30 minutes on zeolites BEA and FAU, respectively. Metalaxyl-m was adsorbed best onzeolite FAU, for which the equilibrium was achieved after 15 minutes. Bentazon was less quicklyadsorbed on the adsorbents, followed by imidacloprid.
To shed more light on the kinetic process, two kinetic models, which are commonly used tostudy the kinetics of adsorption, namely, the pseudo-first-order and the pseudo-second-ordermodels, were applied to the experimental data obtained in Figure 6. These results are
0
10
20
30
40
50
60
70
80
90
100
0
100
200
300
400
500
600
700
1 2 3 4 5 6 7 8 9 10 11 12 13 14 15 16 17 18 19
Ads
orpt
ion
perc
enta
ge (%
)0
10
20
30
40
50
60
70
80
90
100
0
10
20
30
40
50
60
70
Ads
orpt
ion
perc
enta
ge (%
)
e
BE
T va
lue
(m2 ·g
−1)
Si/A
l rat
io (−
)
1 2 3 4 5 6 7 8 9 10 11 12 13 14 15 16 17 18 19
Figure 5. Comparison between the adsorption percentage (points), the specific surface area (open bars, first image) andthe Si/Al-ratio (open bars, second image) of the different zeolites (1-19) for the different pesticides. Open diamonds,bentazon; open circles, clopyralid; open squares, imidacloprid; asterisks, isoproturon; open triangles, metalaxyl-M.
Removal of Pesticides from Aqueous Solutions by Adsorption on Zeolites as Solid Adsorbents 471
0
20
40
60
80
100
0 10 20 30 40 50
Time (h)
0
5
10
15
20
0 4 8 12 16 20 24 28 32 36 40 44 48Time (h)
0
20
40
60
80
100
0 10 20 30 40 50Time (h)
0
5
10
15
20
0 4 8 12 16 20 24 28 32 36 40 44 48
Time (h)
0
20
40
60
80
100
0 10 20 30 40 50Time (h)
0
5
10
15
20
0 4 8 12 16 20 24 28 32 36 40 44 48
Time (h)
0
20
40
60
80
100
0 10 20 30 40 50Time (h)
Ads
orbe
d co
ncen
tratio
n (%
)
t/qt (h
⋅g/m
g)
0
5
10
15
20
0 4 8 12 16 20 24 28 32 36 40 44 48
Time (h)
(a)
(d)
(c)
(b)
Ads
orbe
d co
ncen
tratio
n (%
)
t/qt (h
⋅g/m
g)t/q
t (h⋅g
/mg)
Ads
orbe
d co
ncen
tratio
n (%
)A
dsor
bed
conc
entra
tion
(%)
t/qt (h
⋅g/m
g)
Figure 6. Experimental (indicated with the geometric symbols) and calculated (indicated with the lines) adsorptionkinetics of (a) bentazon, (b) imidacloprid, (c) isoproturon and (d) metalaxyl-m for the different zeolites. Open triangles,zeolite 1; asterisks, zeolite 2; open diamonds, zeolite 3 (all BEA types); open circles, zeolite 6 and open squares, zeolite 7(all FAU types). Initial pesticide concentration, 10 mg l-1.
472 C. De Smedt et al./Adsorption Science & Technology Vol. 33 No. 5 2015
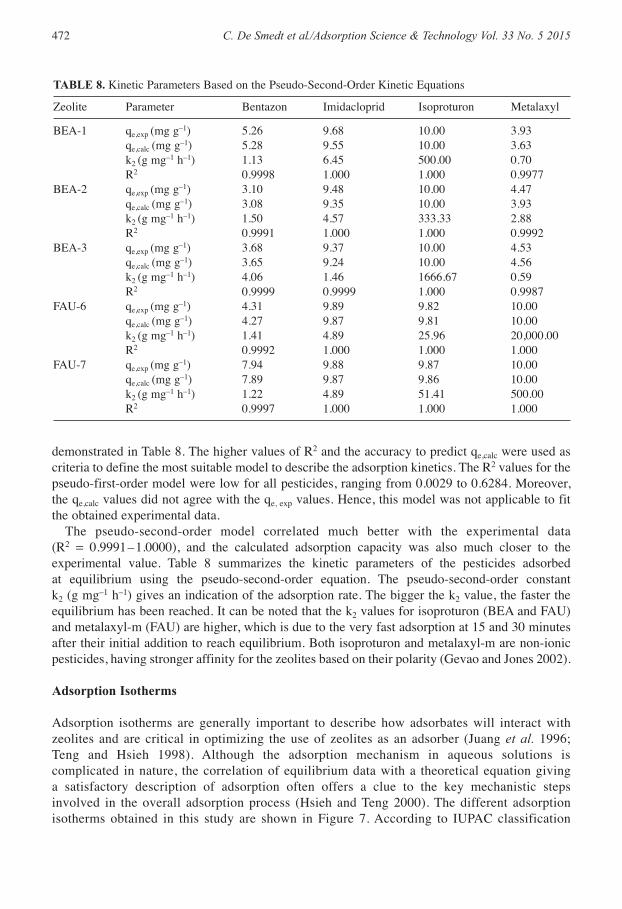
TABLE 8. Kinetic Parameters Based on the Pseudo-Second-Order Kinetic Equations
Zeolite Parameter Bentazon Imidacloprid Isoproturon Metalaxyl
BEA-1 qe,exp (mg g–1) 5.26 9.68 10.00 3.93qe,calc (mg g–1) 5.28 9.55 10.00 3.63k2 (g mg–1 h–1) 1.13 6.45 500.00 0.70R2 0.9998 1.000 1.000 0.9977
BEA-2 qe,exp (mg g–1) 3.10 9.48 10.00 4.47qe,calc (mg g–1) 3.08 9.35 10.00 3.93k2 (g mg–1 h–1) 1.50 4.57 333.33 2.88R2 0.9991 1.000 1.000 0.9992
BEA-3 qe,exp (mg g–1) 3.68 9.37 10.00 4.53qe,calc (mg g–1) 3.65 9.24 10.00 4.56k2 (g mg–1 h–1) 4.06 1.46 1666.67 0.59R2 0.9999 0.9999 1.000 0.9987
FAU-6 qe,exp (mg g–1) 4.31 9.89 9.82 10.00qe,calc (mg g–1) 4.27 9.87 9.81 10.00k2 (g mg–1 h–1) 1.41 4.89 25.96 20,000.00R2 0.9992 1.000 1.000 1.000
FAU-7 qe,exp (mg g–1) 7.94 9.88 9.87 10.00qe,calc (mg g–1) 7.89 9.87 9.86 10.00k2 (g mg–1 h–1) 1.22 4.89 51.41 500.00R2 0.9997 1.000 1.000 1.000
demonstrated in Table 8. The higher values of R2 and the accuracy to predict qe,calc were used ascriteria to define the most suitable model to describe the adsorption kinetics. The R2 values for thepseudo-first-order model were low for all pesticides, ranging from 0.0029 to 0.6284. Moreover,the qe,calc values did not agree with the qe, exp values. Hence, this model was not applicable to fitthe obtained experimental data.
The pseudo-second-order model correlated much better with the experimental data (R2 = 0.9991–1.0000), and the calculated adsorption capacity was also much closer to theexperimental value. Table 8 summarizes the kinetic parameters of the pesticides adsorbed at equilibrium using the pseudo-second-order equation. The pseudo-second-order constant k2 (g mg–1 h–1) gives an indication of the adsorption rate. The bigger the k2 value, the faster theequilibrium has been reached. It can be noted that the k2 values for isoproturon (BEA and FAU)and metalaxyl-m (FAU) are higher, which is due to the very fast adsorption at 15 and 30 minutesafter their initial addition to reach equilibrium. Both isoproturon and metalaxyl-m are non-ionicpesticides, having stronger affinity for the zeolites based on their polarity (Gevao and Jones 2002).
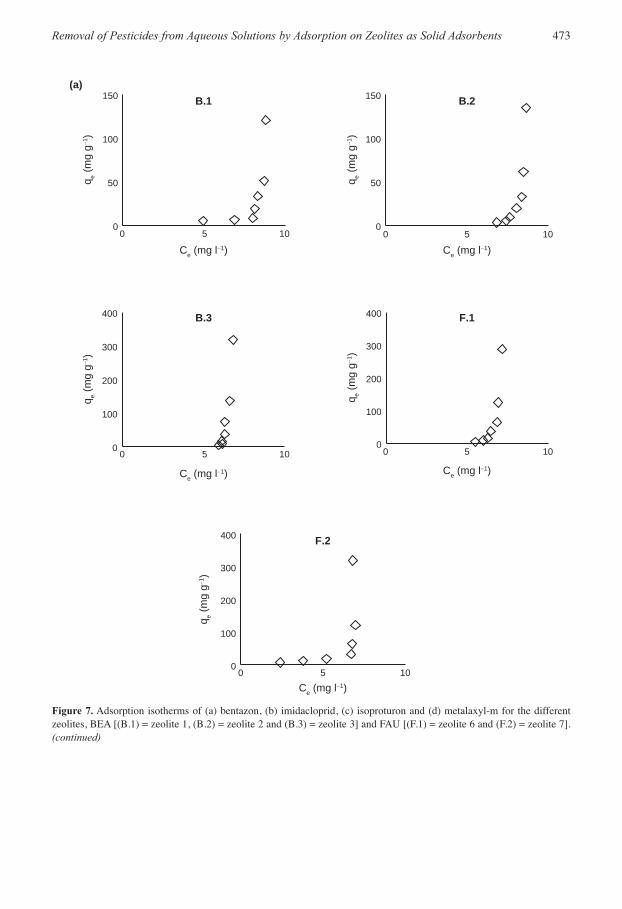
Adsorption Isotherms
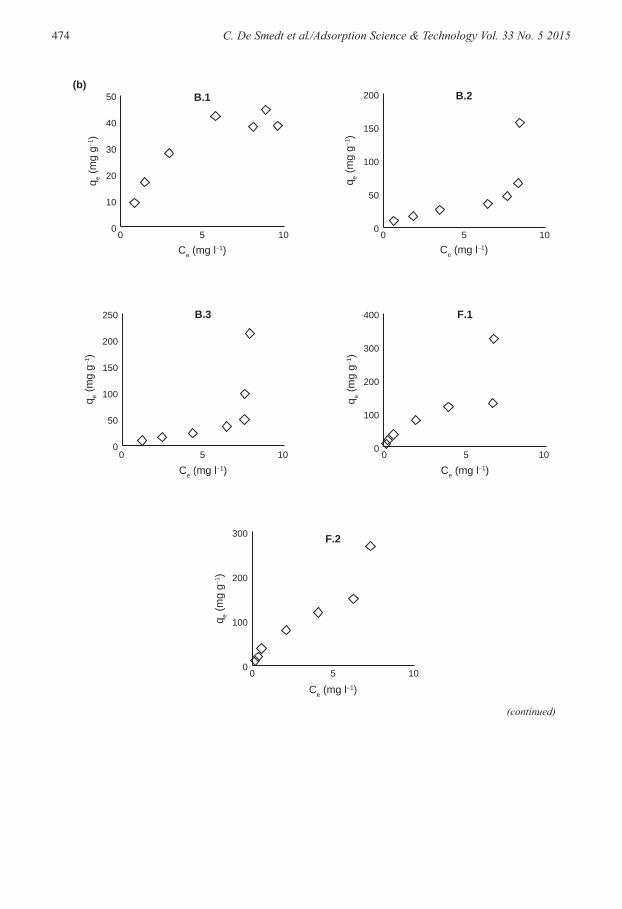
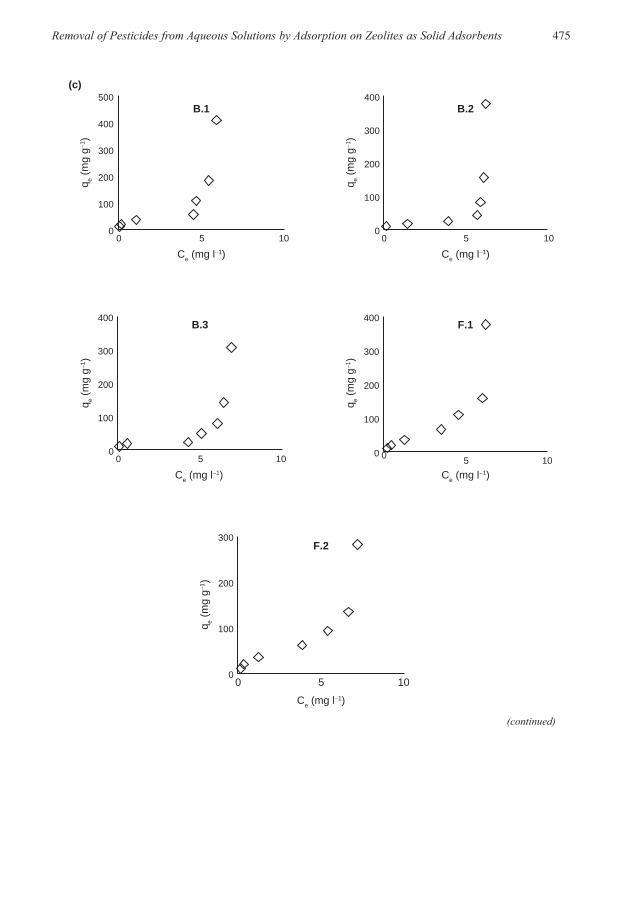
Adsorption isotherms are generally important to describe how adsorbates will interact withzeolites and are critical in optimizing the use of zeolites as an adsorber (Juang et al. 1996;Teng and Hsieh 1998). Although the adsorption mechanism in aqueous solutions iscomplicated in nature, the correlation of equilibrium data with a theoretical equation giving a satisfactory description of adsorption often offers a clue to the key mechanistic stepsinvolved in the overall adsorption process (Hsieh and Teng 2000). The different adsorptionisotherms obtained in this study are shown in Figure 7. According to IUPAC classification
Removal of Pesticides from Aqueous Solutions by Adsorption on Zeolites as Solid Adsorbents 473
(a)
0
100
200
300
400
0 5 10
F.2
q e (m
g g−1
)
Ce (mg l−1)
0
50
100
150
0 5 10
B.1
0
50
100
150
0 5 10
Ce (mg l−1) Ce (mg l−1)
B.2
q e (m
g g−1
)
q e (m
g g−1
)
0
100
200
300
400
0
100
200
300
400
q e (m
g g−1
)
0 5 10
Ce (mg l−1)
0 5 10
Ce (mg l−1)
q e (m
g g−1
)
F.1B.3
Figure 7. Adsorption isotherms of (a) bentazon, (b) imidacloprid, (c) isoproturon and (d) metalaxyl-m for the differentzeolites, BEA [(B.1) = zeolite 1, (B.2) = zeolite 2 and (B.3) = zeolite 3] and FAU [(F.1) = zeolite 6 and (F.2) = zeolite 7].(continued)
474 C. De Smedt et al./Adsorption Science & Technology Vol. 33 No. 5 2015
(b)
0
100
200
300
0 5 10
q e (m
g g−1
)
Ce (mg l−1)
F.2
0
10
20
30
40
50
0 5 10
q e (m
g g−1
)
Ce (mg l−1)
0
50
100
150
200
0 5 10Ce (mg l−1)
q e (m
g g−1
)
B.1 B.2
0
50
100
150
200
250
q e (m
g g−1
)
0 5 10
Ce (mg l−1)
0
100
200
300
400
0 5 10
q e (m
g g−1
)
Ce (mg l−1)
F.1B.3
(continued)
Removal of Pesticides from Aqueous Solutions by Adsorption on Zeolites as Solid Adsorbents 475
(c)
Ce (mg l−1)Ce (mg l−1)
0
100
200
300
0 5 10
Ce (mg l−1)
q e (m
g g−1
)
F.2
0
100
200
300
400
500
0 5 10
Ce (mg l−1)
0
100
200
300
400
0 5 10
q e (m
g g−1
)
Ce (mg l−1)
0
100
200
300
400
0 5 100
100
200
300
400
0 5 10
q e (m
g g−1
)
q e (m
g g−1
)
q e (m
g g−1
)
B.1 B.2
F.1B.3
(continued)

476 C. De Smedt et al./Adsorption Science & Technology Vol. 33 No. 5 2015
Figure 7 (continued)
(d)
0
100
200
300
400
0 5 100
100
200
300
400
500
0 5 10
Ce (mg l−1) Ce (mg l−1)
q e (m
g g−1
)
B.1 B.2q e (
mg
g−1)
0
100
200
300
400
500
0 5 10
Ce (mg l−1)
q e (m
g g−1
)
F.2
400 400
0
100
200
300
0
100
200
300
0 5 10 0 5 10Ce (mg l−1) Ce (mg l−1)
q e (m
g g−1
)
q e (m
g g−1
)
F.1B.3
(1985), these isotherms can be divided into six different types. Based on the results, types I, IIand III were observed (Table 9). Although these isotherms shed no light on the mechanism ofadsorption, they are useful for comparing results from different sources on a quantitative basis,providing information about the adsorption potential of a material with easily interpretableconstants (Dawodu et al. 2012).
Langmuir Adsorption Isotherms
The Langmuir model is probably the best known and most widely applied adsorption isotherm(Ho et al. 2002). The Langmuir equation quantitatively describes the formation of an adsorbatemonolayer on the outer surface of a microporous adsorbent containing a finite number of identicalbinding sites (Dawodu et al. 2012; Yousef et al. 2011). This type of behaviour is typical forchemisorption. The determination coefficients suggest that the applied Langmuir isotherm appearsto produce a reasonable model of the adsorption system and the separation values indicate that theequilibrium adsorption was favourable for imidacloprid and isoproturon onto all zeolites. Thenegative values in Table 10 observed for KL and qm are improbable (Monkiedje and Spiteller2002). These values, together with a small number of type I isotherms, indicate that the Langmuirmodel is not suitable to describe the adsorption of the pesticides on the zeolites (Carberry 2001).
BET Adsorption Isotherms
Type II adsorption isotherms show a large deviation from the Langmuir model of adsorption. Thebig difference between type II (BET) model and Langmuir model is that the BET theorycorresponds to multilayer physical adsorption (Bansal and Goyal 2005). This isotherm is mostfrequently found when adsorption occurs on non-porous powders or powders with diametersexceeding micropores (Bandos et al. 2003). Because the pesticides are large molecules, it is moreplausible that these molecules did not want to/could not adsorb in the micropores. Instead, theyadsorb in the mesopores, forming type II isotherms (Storck et al. 1998). As is the case with theLangmuir equation, the determination coefficients suggest that the BET model appears to be agood model to interpret the adsorption behaviour. However, negative values for KB and qm wereobserved in Table 10. The isotherms for imidacloprid seem to fit the experimental data better thanthose for the other pesticides considered.
Freundlich Adsorption Isotherms
In this case, type III isotherms were the most frequently obtained. This isotherm is seen in systemsin which the adsorbate–adsorbent interaction is small compared with the adsorbate–adsorbatereaction. The uptake of the adsorbate is initially slow until surface coverage is sufficient when theinteractions between adsorbed and free molecules start to dominate the process (IUPAC 1985).The Freundlich model, which describes this type of isotherm, is found to give a good fit for theadsorption of the pesticides (Table 11). The Freundlich isotherm is the earliest known adsorptionisotherm equation and is commonly used to describe the adsorption characteristics for theheterogeneous zeolite surface and considers multilayer adsorption (Boivon et al. 2005; Ho et al.2002; Romero et al. 2006).
Removal of Pesticides from Aqueous Solutions by Adsorption on Zeolites as Solid Adsorbents 477
TABLE 9. Types of Adsorption Isotherm
Zeolite Bentazon Imidacloprid Isoproturon Metalaxyl
BEA-1 III I III IIIBEA-2 III III III IIIBEA-3 III III III IIIFAU-6 III II III IFAU-7 III II II/III I
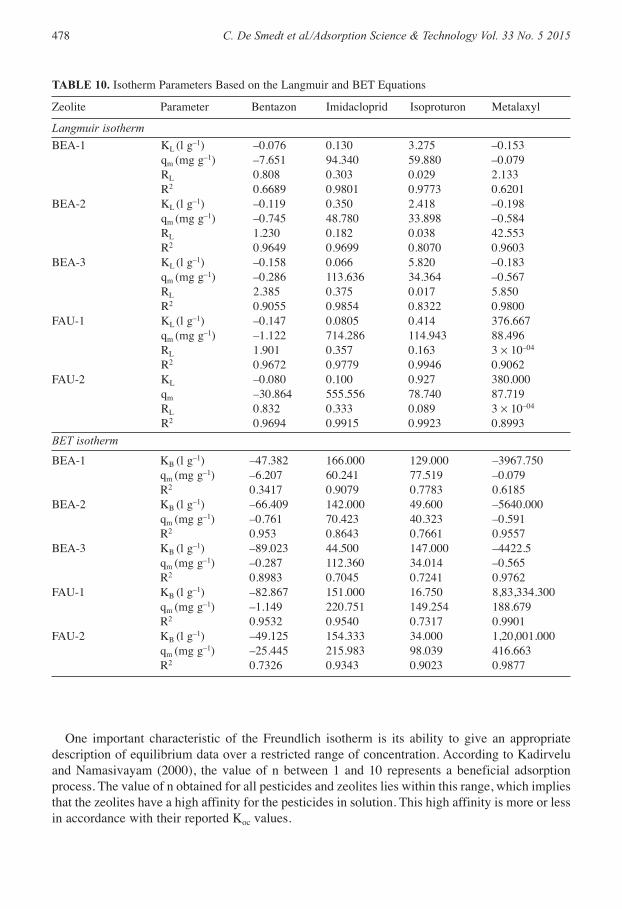
One important characteristic of the Freundlich isotherm is its ability to give an appropriatedescription of equilibrium data over a restricted range of concentration. According to Kadirveluand Namasivayam (2000), the value of n between 1 and 10 represents a beneficial adsorptionprocess. The value of n obtained for all pesticides and zeolites lies within this range, which impliesthat the zeolites have a high affinity for the pesticides in solution. This high affinity is more or lessin accordance with their reported Koc values.
478 C. De Smedt et al./Adsorption Science & Technology Vol. 33 No. 5 2015
TABLE 10. Isotherm Parameters Based on the Langmuir and BET Equations
Zeolite Parameter Bentazon Imidacloprid Isoproturon Metalaxyl
Langmuir isothermBEA-1 KL (l g–1) –0.076 0.130 3.275 –0.153
qm (mg g–1) –7.651 94.340 59.880 –0.079RL 0.808 0.303 0.029 2.133R2 0.6689 0.9801 0.9773 0.6201
BEA-2 KL (l g–1) –0.119 0.350 2.418 –0.198qm (mg g–1) –0.745 48.780 33.898 –0.584RL 1.230 0.182 0.038 42.553R2 0.9649 0.9699 0.8070 0.9603
BEA-3 KL (l g–1) –0.158 0.066 5.820 –0.183qm (mg g–1) –0.286 113.636 34.364 –0.567RL 2.385 0.375 0.017 5.850R2 0.9055 0.9854 0.8322 0.9800
FAU-1 KL (l g–1) –0.147 0.0805 0.414 376.667qm (mg g–1) –1.122 714.286 114.943 88.496RL 1.901 0.357 0.163 3 × 10–04
R2 0.9672 0.9779 0.9946 0.9062FAU-2 KL –0.080 0.100 0.927 380.000
qm –30.864 555.556 78.740 87.719RL 0.832 0.333 0.089 3 × 10–04
R2 0.9694 0.9915 0.9923 0.8993
BET isotherm
BEA-1 KB (l g–1) –47.382 166.000 129.000 –3967.750qm (mg g–1) –6.207 60.241 77.519 –0.079R2 0.3417 0.9079 0.7783 0.6185
BEA-2 KB (l g–1) –66.409 142.000 49.600 –5640.000qm (mg g–1) –0.761 70.423 40.323 –0.591R2 0.953 0.8643 0.7661 0.9557
BEA-3 KB (l g–1) –89.023 44.500 147.000 –4422.5qm (mg g–1) –0.287 112.360 34.014 –0.565R2 0.8983 0.7045 0.7241 0.9762
FAU-1 KB (l g–1) –82.867 151.000 16.750 8,83,334.300qm (mg g–1) –1.149 220.751 149.254 188.679R2 0.9532 0.9540 0.7317 0.9901
FAU-2 KB (l g–1) –49.125 154.333 34.000 1,20,001.000qm (mg g–1) –25.445 215.983 98.039 416.663R2 0.7326 0.9343 0.9023 0.9877
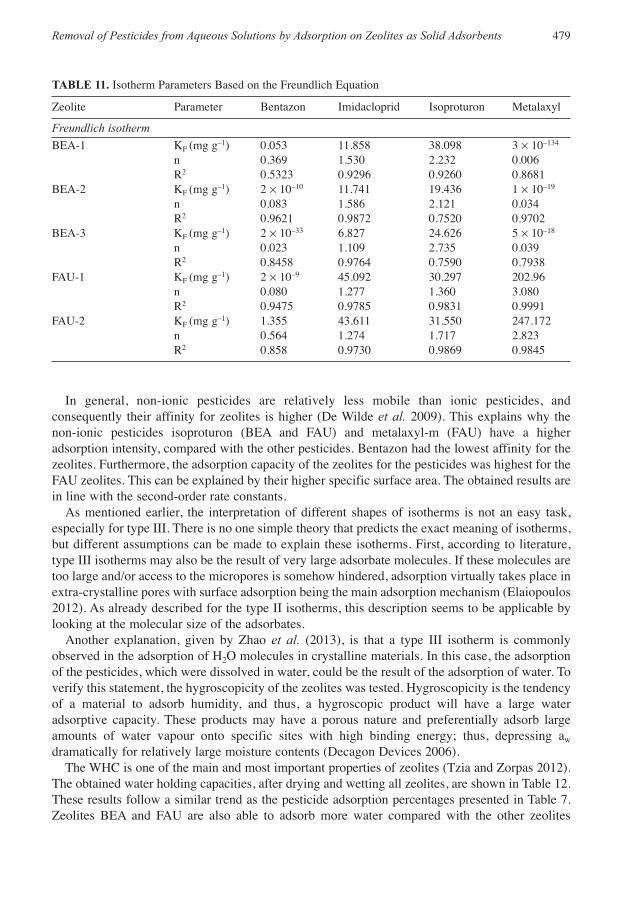
In general, non-ionic pesticides are relatively less mobile than ionic pesticides, andconsequently their affinity for zeolites is higher (De Wilde et al. 2009). This explains why the non-ionic pesticides isoproturon (BEA and FAU) and metalaxyl-m (FAU) have a higheradsorption intensity, compared with the other pesticides. Bentazon had the lowest affinity for thezeolites. Furthermore, the adsorption capacity of the zeolites for the pesticides was highest for theFAU zeolites. This can be explained by their higher specific surface area. The obtained results arein line with the second-order rate constants.
As mentioned earlier, the interpretation of different shapes of isotherms is not an easy task,especially for type III. There is no one simple theory that predicts the exact meaning of isotherms,but different assumptions can be made to explain these isotherms. First, according to literature,type III isotherms may also be the result of very large adsorbate molecules. If these molecules aretoo large and/or access to the micropores is somehow hindered, adsorption virtually takes place inextra-crystalline pores with surface adsorption being the main adsorption mechanism (Elaiopoulos2012). As already described for the type II isotherms, this description seems to be applicable bylooking at the molecular size of the adsorbates.
Another explanation, given by Zhao et al. (2013), is that a type III isotherm is commonlyobserved in the adsorption of H2O molecules in crystalline materials. In this case, the adsorptionof the pesticides, which were dissolved in water, could be the result of the adsorption of water. Toverify this statement, the hygroscopicity of the zeolites was tested. Hygroscopicity is the tendencyof a material to adsorb humidity, and thus, a hygroscopic product will have a large wateradsorptive capacity. These products may have a porous nature and preferentially adsorb largeamounts of water vapour onto specific sites with high binding energy; thus, depressing aw
dramatically for relatively large moisture contents (Decagon Devices 2006).The WHC is one of the main and most important properties of zeolites (Tzia and Zorpas 2012).
The obtained water holding capacities, after drying and wetting all zeolites, are shown in Table 12.These results follow a similar trend as the pesticide adsorption percentages presented in Table 7.Zeolites BEA and FAU are also able to adsorb more water compared with the other zeolites
Removal of Pesticides from Aqueous Solutions by Adsorption on Zeolites as Solid Adsorbents 479
TABLE 11. Isotherm Parameters Based on the Freundlich Equation
Zeolite Parameter Bentazon Imidacloprid Isoproturon Metalaxyl
Freundlich isothermBEA-1 KF (mg g–1) 0.053 11.858 38.098 3 × 10–134
n 0.369 1.530 2.232 0.006R2 0.5323 0.9296 0.9260 0.8681
BEA-2 KF (mg g–1) 2 × 10⁻¹⁰ 11.741 19.436 1 × 10–19
n 0.083 1.586 2.121 0.034R2 0.9621 0.9872 0.7520 0.9702
BEA-3 KF (mg g–1) 2 × 10–33 6.827 24.626 5 × 10–18
n 0.023 1.109 2.735 0.039R2 0.8458 0.9764 0.7590 0.7938
FAU-1 KF (mg g–1) 2 × 10⁻⁹ 45.092 30.297 202.96n 0.080 1.277 1.360 3.080R2 0.9475 0.9785 0.9831 0.9991
FAU-2 KF (mg g–1) 1.355 43.611 31.550 247.172n 0.564 1.274 1.717 2.823R2 0.858 0.9730 0.9869 0.9845

(Figure 8). This is in contrast to the hydrophobic properties based on the measured Si/Al ratio.According to Corma (2003), all zeolites containing charges are normally more hydrophilicmaterials which, depending on the number of charges (extra-framework cations and frameworkSi/Al ratio), can be more or less selective adsorbents for polar or non-polar molecules. However,pure silica zeolites with no positive charges are highly hydrophobic materials. This is proven bya WHC of 0.52% for the pure silica zeolite 17.
The obtained water adsorption isotherms represented type II instead of type III isotherms, whichcan be explained in the same way as explained in the “BET Adsorption Isotherms” section. Theseresults were also observed by Halasz et al. (2002), who found that less hydrophobic zeolites giverise to a type II isotherm, indicating that water adsorption does not take place in its microchannels.This means that the higher water adsorption of zeolites BEA and FAU can be the result of higherexternal surface areas. As was also observed by others, the surface area increased with increasingSi/Al ratios of the zeolites (Figure 9; Ali et al. 2003; Shanjiao et al. 2007). The external surface ofzeolites consists of bridging hydroxyls and silanol groups (SiOH), which can form hydrogen bondswith water, making the zeolite hydrophilic (Kühl 1999). These last two statements in turn explainwhy the hydrophobic properties based on the Si/Al ratio are not applicable here.
Finally, a type III isotherm can be the result of a situation in which previously adsorbedmolecules lead to a modification of the adsorbent, which favours further adsorption. Sucheffects have been reported in studies involving anionic or cationic surfactants as adsorbates(Schwarzenbach et al. 2003). However, non-ionic products forming hydrogen bonds with thehydroxyl groups on the solid surface can also cause these modifications. Because the hydrogenbonding is weaker than the electrostatic interaction, the adsorption of the non-ionic product to
480 C. De Smedt et al./Adsorption Science & Technology Vol. 33 No. 5 2015
TABLE 12. Hygroscopic Effect of the Zeolites Based on Their WHC Percentage
% weight change % weight changeAdsorption (%) % moisture (original) (from dry to wet) (from wet to dry) % WHC
BEA-1 5.34 24.52 0.52 24BEA-2 4.58 16.58 3.37 13.21BEA-3 8.62 11.66 –2.62 14.28CHA-4 3.66 1.44 –1.04 2.48CHA-5 3.90 1.66 –1.30 2.96FAU-6 10.29 21.74 –6.21 27.95FAU-7 12.63 18.82 –6.21 28.91HEU-8 3.35 3.52 –1.47 4.99HEU-9 5.11 4.22 –2.18 6.40HEU-10 3.60 3.95 –1.58 5.53LTA-11 2.19 1.72 –0.27 1.99LTA-12 6.80 0.99 –1.22 2.21MFI-13 3.58 2.32 –1.50 3.82MFI-14 2.57 6.39 –1.75 8.14MFI-15 6.99 2.56 –2.42 4.98MFI-16 15.38 1.49 –0.44 1.93MFI-17 1.42 0.56 0.04 0.52MOR-18 6.47 2.59 –1.40 3.99MOR-19 5.81 4.22 –1.19 5.41

Removal of Pesticides from Aqueous Solutions by Adsorption on Zeolites as Solid Adsorbents 481
Figure 8. Comparison between the adsorption percentage (asterisks), the Si/Al-ratio (open bars) and the water holdingcapacity (WHC; closed bars) of the different zeolites (1-19) for the different pesticides: (a) bentazon, (b) clopyralid, (c) imidacloprid, (d) isoproturon and (e) metalaxyl -M.
0102030405060708090100
0
10
20
30
40
50
60
70
1 2 3 4 5 6 7 8 9 10 111213141516 171819
Ads
orpt
ion
perc
enta
ge (%
)
Si/A
l rat
io a
nd W
HC
(− a
nd %
)
0102030405060708090100
0
10
20
30
40
50
60
70
1 2 3 4 5 6 7 8 9 10111213141516 171819
Ads
orpt
ion
perc
enta
ge (%
)
Si/A
l rat
io a
nd W
HC
(− a
nd %
)(a) (b)
0102030405060708090100
0
10
20
30
40
50
60
70
1 2 3 4 5 6 7 8 9 10 1112131415 1617 1819
Ads
orpt
ion
perc
enta
ge (%
)
Si/A
l rat
io a
nd W
HC
(− a
nd %
)
(e)
0102030405060708090100
0
10
20
30
40
50
60
70
1 2 3 4 5 6 7 8 9 10 1112131415 1617 1819
Ads
orpt
ion
perc
enta
ge (%
)
Si/A
l rat
io a
nd W
HC
(− a
nd %
)
0102030405060708090100
0
10
20
30
40
50
60
70
1 2 3 4 5 6 7 8 9 10 1112131415 1617 1819
Ads
orpt
ion
perc
enta
ge (%
)
Si/A
l rat
io a
nd W
HC
(− a
nd %
)
(c) (d)
most solids is less than that of ionic products (Zhang and Somasundaran 2006). To examinewhether this type of isotherm is the result of a modification in the crystal structure of thezeolites, XRD patterns of the different zeolites before and after adsorption were compared.Based on the decrease or increase of the relative intensity of the strongest diffraction peak, thezeolite was found to be less crystalline. In other words, this change of intensity is associatedwith the presence of some defects in the structure (Shanjiao et al. 2007). In particular, it will beshown that different types of defects may lead either to the occurrence of transport resistanceon a crystal surface or to an enhancement of the adsorption rate due to the existence of crackson the surface. For molecules with characteristic diameters comparable with the size of the pore

482 C. De Smedt et al./Adsorption Science & Technology Vol. 33 No. 5 2015
Figure 9. Comparison between the specific surface area (open bars) and the Si/Al-ratio (asterisks) of the different zeolites(1-19).
0
10
20
30
40
50
60
70
0
100
200
300
400
500
600
700
1 2 3 4 5 6 7 8 9 10 11 12 13 14 15 16 17 18 19BE
T va
lue
and
Si/A
l rat
io (m
2 ⋅g−1
and
-)
Si/A
l rat
io (-
)
openings, a small change in the latter could easily cause an order-of-magnitude change in themass transfer rate (Kortunov et al. 2004). However, in case of these large pesticide molecules,the cracks will not be large enough to make a big difference in our results. According to theXRD patterns (Figure S2, Supplementary Information), a change in the intensities can beobserved. These little changes are plausible after the adsorption of pesticides, and thus, do notindicate a modification of the structures.
CONCLUSIONS
In this work, it was found that zeolites showed the applicability as adsorbent for treating waterscontaminated with pesticides. The adsorption of bentazon, clopyralid, imidacloprid, isoproturonand metalaxyl-m on different zeolites was evaluated in this study. The adsorption of clopyralidwas too low onto all zeolites. Subsequently, the adsorption processes of the selected pesticides andzeolites BEA and FAU were found to follow the pseudo-second-order kinetics. The FAU zeoliteswere able to adsorb the pesticides faster. The mobility of the pesticides also has an influence ofthe adsorption rate. Isoproturon and metalaxyl-m are both non-ionic pesticides, having strongeraffinity for the zeolites based on their polarity.
The equilibrium data were analyzed based on the obtained type of isotherms. In this study, threedifferent types were observed. The type I and II isotherms occurred less frequently compared withthe type III isotherms. The Freundlich model, which describes this type of isotherm, was found togive a good fit for the adsorption of the pesticides. Different assumptions could be made todescribe the meaning of type III isotherms. First, this isotherm can be the result of the presence ofvery large adsorbate molecules, which seems applicable taking into account the molecular size ofthe adsorbents. Subsequently, these isotherms can also be the result of water adsorption. In thiscase, the adsorption of pesticides, which were dissolved in water, could be the result of theadsorption of water. However, hygroscopic experiments, indicating type II isotherms for theadsorption of water, presented different results in contrast to this statement. This means that theobtained water adsorption was also the result of the higher external surface area of the BEA andFAU zeolites. Finally, adsorbed molecules can lead to modifications of the adsorbent. The XRDpatterns of the different zeolites before and after adsorption demonstrate that the observedisotherms are most likely not the result of modifications in the crystal structure of the zeolites.
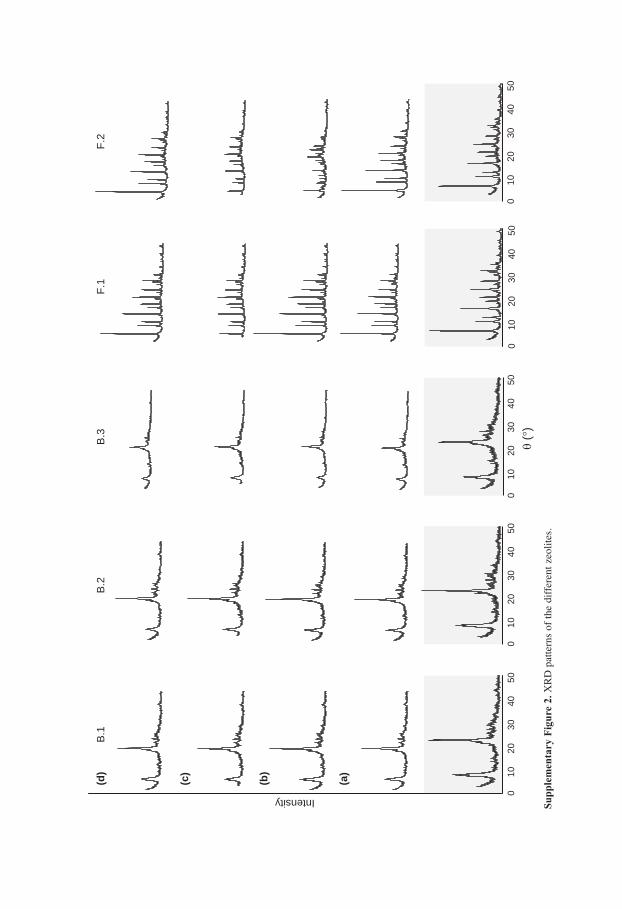
Supp
lem
enta
ry F
igur
e 2.
XR
D p
atte
rns
of th
e di
ffer
ent z
eolit
es.
F.1
F.2
010
2030
4050
010
2030
4050
010
2030
4050
010
2030
4050
θ (°
)
(a)
(b)
(c)
(d)
B.1
B.2
B.3
010
2030
4050
Intensity

ACKNOWLEDGEMENTS
The authors gratefully acknowledge the funding of this work, associated with the ECO-ZEOproject, by the European Commission under the 7th Framework Programme (Project Number:282865 www.ecozeo.eu).
REFERENCES
Ali, M.A., Brison, B. and Thomas, W.J. (2003) Appl. Catal., A. 252, 149.Baerlocher, C. and McCusker, L. (2014) Database of Zeolite Structures. Available from: http://www.
iza-structure.org/databases/ [Last Accessed: June 1, 2015]Bandos, T.J., Biggs, M.J., Gubbins, K.E., Liyama, H.T., Kaneko, K., Pikunic, J. and Thomson, K.T. (2003)
Chemistry and Physics of Carbon, Marcel Dekker, New York.Bansal, O.P. (2012) Pesticides: Evaluation of Environmental Pollution, CRC Press, Boca Raton, FL.Bansal, R.C. and Goyal, M. (2005) Activated Carbon Adsorption, CRC Press, Boca Raton, FL.Boivon, A., Cherrier, R. and Schiavon, M.A. (2005) Chemosphere. 61, 668.Bowman, R.S., Sullivan, E.J. and Li, Z. (2000) Natural Zeolites for the Third Millennium, A. De Frede,
Naples, Italy.Carberry, J.J. (2001) Chemical and Catalytic Reaction Engineering, General Publishing Company, Ontario,
Canada.Cekova, B., Kocev, D., Kolcakovska, E. and Stojanova, D. (2006) Acta Period. Technol. 37, 83.Colella, C. (2007) Studies in Surface Science and Catalysis: From Zeolites to Porous MOF Materials, The
40th Anniversary of International Zeolite Conference, Elsevier, Amsterdam, The Netherlands.Corma, A. (2003) J. Catal. 216, 298.Dawodu, F.A., Akpomie, G.K. and Ogbu, I.C. (2012) Int. J. Multidiscip. Curr. Res. 3, 9.Decagon Devices (2006) Water Activity of Dry and Dehydrated Products. Available from:
www.decagon.com [Last Accessed: June 1, 2015]Decagon Devices (2015) Vapor Sorption Analyzer (Operator’s Manual). Available from: www.aqualab.com
[Last Accessed: June 1, 2015]de Lange, R.S.A., Keizer, K. and Burggraaf, A.J. (1995) J. Membr. Sci. 104, 81.De Wilde, T., Mertens, J., Spanoghe, P., Ryckeboer, J., Jaeken, P. and Springael, D. (2008) Chemosphere. 72, 509.De Wilde, T., Spanoghe, P., Ryckeboer, J., Jaeken, P. and Springael, D. (2009) Chemosphere. 75, 100.Elaiopoulos, K. (2012) Handbook of Zeolites, Bentham Science Publishers, Oak Park, IL.First, E.L., Gounaris, C.E., Wei, J. and Floudas, C.A. (2014) Chem. Chem. Phys. 13, 17339.Flanigen, E.M. (2001) Chemistry of Zeolites and Related Porous Materials-Synthesis and Structure, Wiley,
Weinheim, Germany.Forster, W. (2004) “Foliar uptake and translocation relationships for polar xenobiotics.” Proceedings of the 7th
International Symposium on Adjuvants for Agrochemicals, Cape Town, South Africa, 8-12 November, p. 242.Frisch, M.J., Trucks, G.W., Schlegel, H.B., Scuseria, G.E., Robb, M.A., Cheeseman, J.R., Montgomery, J.A.,
Vreven, T., Kudin, K.N., Burant, J.C., Millam, J.M., Iyengar, S.S., Tomasi, J., Barone, V., Mennucci, B.,Cossi, M., Scalmani, G., Rega, N., Petersson, G.A., Nakatsuji, H., Hada, M., Ehara, M., Toyota, K., Fukuda,R., Hasegawa, J., Ishida, M., Nakajima, T., Honda, Y., Kitao, O., Nakai, H., Klene, M., Li, X., Knox, J.E.,Hratchian, H.P., Cross, J.B., Bakken, V., Adamo, C., Jaramillo, J., Gomperts, R., Stratmann, R.E., Yazyev,O., Austin, A.J., Cammi, R., Pomelli, C., Ochterski, J.W., Ayala, P.Y., Morokuma, K., Voth, G.A., Salvador,P., Dannenberg, J.J., Zakrzewski, V.G., Dapprich, S., Daniels, A.D., Strain, M.C., Farkas, O., Malick, D.K.,Rabuck, A.D., Raghavachari, K., Foresman, J.B., Ortiz, J.V., Cui, Q., Baboul, A.G., Clifford, S., Cioslowski,J., Stefanov, B.B., Liu, G., Liashenko, A., Piskorz, P., Komaromi, I., Martin, R.L. and Fox, D.J. (2009)Gaussian 09 (Revision A.02). Available from: http://www.gaussian.com/ [Last Accessed: June 1, 2015]
484 C. De Smedt et al./Adsorption Science & Technology Vol. 33 No. 5 2015

Gevao, B. and Jones, K.C. (2002) Agriculture, Hydrology and Water Quality, Cromwell Press, Trowbridge,Wiltshire, UK.
Ghaemi, A., Torab-Mostaedi, M. and Ghannadi-Maragheh, M. (2011) J. Hazard. Mater. 190, 916.Gustafson, D.I. (1989) Environ. Toxicol. Chem. 8, 339.Halasz, I., Kim, S. and Marcus, B. (2002) Mol. Phys. 100, 3123.Ho, Y.S., Porter, J.F. and McKay, G. (2002) Water, Air, Soil Pollut. 141, 1.Hsieh, C.T. and Teng, H. (2000) J. Chem. Technol. Biotechnol. 75, 1066.International Union of Pure and Applied Chemistry (IUPAC) (1985) Pure Appl. Chem. 57, 603.Jagiello, J. and Thommes, M. (2004) Carbon. 42, 1225.Juang, R.S., Wu, F.C. and Tseng, R.L. (1996) J. Chem. Eng. Data. 41, 487.Kadirvelu, K. and Namasivayam, C. (1998) Environ. Sci. Technol. 32, 1738.Kalkhoff, S.J., Kolpin, D.W., Thurman, E.M., Ferrer, I. and Barcelo, D. (1998) Environ. Sci. Technol. 32, 1738.Kobayashi, H., Yokoyama, H., Feng, B. and Fukuoka, A. (2015) Green Chem. 17, 2732.Kolpin, D.W., Barbash, J.E. and Gilliom, R.J. (1998) Environ. Sci. Technol. 32, 558.Kortunov, P., Vasenkov, S., Chmelik, C., Kärger, J., Ruthven, D. M. and Wloch, J. (2004) Chem. Mat. 16, 3552.Kühl, G.H. (1999) Catalysis and Zeolites: Fundamentals and Applications, Springer, Heidelberg, Germany.MIRA (2007) Available from: http://www.vlaanderen.be/nl/publicaties/detail/mira-be-milieurapport-
vlaanderen-2007-beleidsevaluatierapport [Last Accessed: June 8, 2015].Monkiedje, A. and Spiteller, M. (2002) Chemosphere. 49, 659.Munthali, M.W., Mohammed, A.E., Johan, E. and Matsue, N. (2014) Molecules. 19, 20468.Payra, P. and Dutta, P.K. (2003) Handbook of Zeolite Science and Technology, Marcel Dekker, New York.Pesticide Properties Database (2014) IUPAC: Global Availability of Information on Agrochemicals.
Available from: http://sitem.herts.ac.uk/aeru/iupac/ [Last Accessed: June 1, 2015]Ranck, M.J., Bowman, R.S., Weeber, J.L., Katz, L.E. and Sullivan, E.J. (2005) J. Environ. Eng. 131, 434.Rezaei, F. and Wembley, P. (2009) Chem. Eng. Sci. 64, 5182.Romero, E., Salido, A., Cifuentes, C., Fernandez, J.D. and Nogales, R. (2006) Int. J. Environ. Anal. Chem.
86, 289.Rouquerol, F., Rouquerol, J., Sing, K.S.W., Maurin, G. and Llewelly, P. (2014) Adsorption by Powder and
Porous Solid, Elsevier, Oxford, UK.Schwarzenbach, R.P., Gschwend, P.M. and Imboden, D.M. (2003) Environmental Organic Chemistry, John
Wiley & Sons, Edison, New Jersey.Shakarova, D., Ojuva, A., Bergström, L. and Akhtar, F. (2014) Materials. 7, 5507.Shanjiao, K., Yanjun, G., Tao, D., Ying, Z. and Yanying, Z. (2007) Pet. Sci. 4, 70.Storck, S., Bretinger, H. and Maier, W.F. (1998) Appl. Catal., A. 174, 137.Teng, H. and Hsieh, C.T. (1998) Ind. Eng. Chem. Res. 37, 3618.Tzia, C. and Zorpas, A. (2012) Handbook of Natural Zeolites, Bentham Science Publishers, Dubai, UAE.Valtchev, V.P., Tosheva, L. and Bozhilov, K.N. (2005) Langmuir. 21, 10724.Wagholika, S.G., Mayadevi, S., Mirajkar, S.P. and Sivasanker, S. (2004) Studies in Surface and Catalysis:
Recent Advances in the Science and Technology of Zeolites and Related Materials, Elsevier, Amsterdam,The Netherlands.
Wang, C.J. and Liu, Z.Q. (2007) Pestic. Biochem. Physiol. 87, 1.Yousef, R.I., El-Eswed, B. and Al-Muhtaseb, A.H. (2011) Chem. Eng. J. 171, 1143.Zhang, R. and Somasundaran, P. (2006) Adv. Colloid Interface Sci. 123, 213.Zhao, D., Wan, Y. and Zhou, W. (2013) Ordered Mesoporous Materials, Wiley, Weinheim, Germany.
Removal of Pesticides from Aqueous Solutions by Adsorption on Zeolites as Solid Adsorbents 485
