removal processes - who.int · table 2.2 self-purification processes that improve off-stream...
TRANSCRIPT
© 2004 World Health Organization. Water Treatment and Pathogen Control: Process Efficiency in Achieving
Safe Drinking Water. Edited by Mark W LeChevallier and Kwok-Keung Au. ISBN: 1 84339 069 8.
Published by IWA Publishing, London, UK.
2
Removal processes
This chapter considers various processes for removal of microbes from water. In particular, it discusses:
• pretreatment — broadly defined as any process to modify microbial water quality before, or at the entry to, a treatment plant;
• coagulation, flocculation and sedimentation — by which small particles interact to form larger particles and settle out by gravity;
• ion exchange — used for removal of calcium, magnesium and some radionuclides;
• granular filtration — in which water passes through a bed of granular materials after coagulation pretreatment;
• slow sand filtration — in which water is passed slowly through a sand filter by gravity, without the use of coagulation pretreatment.
6 Water treatment and pathogen control
2.1 PRETREATMENT
This section describes some of the processes that can be used in pretreatment of water (roughing filters, microstrainers, off-stream storage and bank infiltration), each of which has a particular function and water quality benefit. Applications of pretreatment include removal of algal cells, high levels of turbidity, viruses and protozoan cysts The various options for pretreatment may be compatible with a variety of treatment processes, ranging in complexity from simple disinfection to membrane filtration.
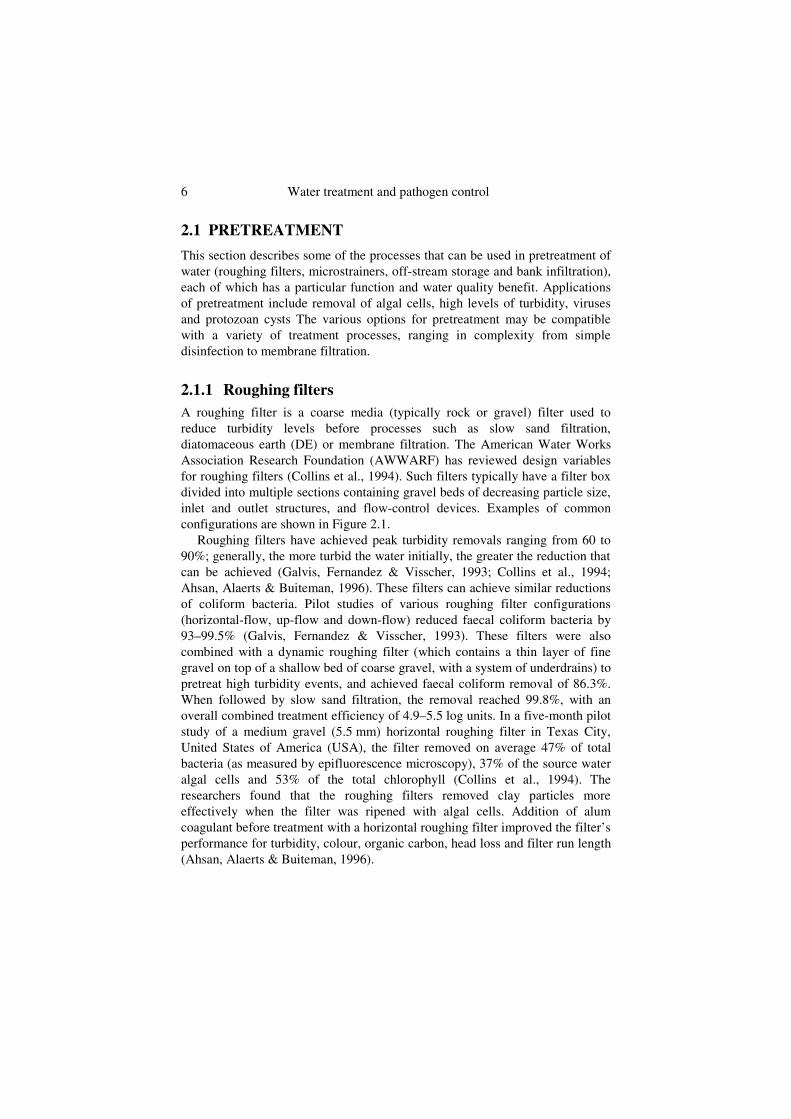
2.1.1 Roughing filters A roughing filter is a coarse media (typically rock or gravel) filter used to reduce turbidity levels before processes such as slow sand filtration, diatomaceous earth (DE) or membrane filtration. The American Water Works Association Research Foundation (AWWARF) has reviewed design variables for roughing filters (Collins et al., 1994). Such filters typically have a filter box divided into multiple sections containing gravel beds of decreasing particle size, inlet and outlet structures, and flow-control devices. Examples of common configurations are shown in Figure 2.1.
Roughing filters have achieved peak turbidity removals ranging from 60 to 90%; generally, the more turbid the water initially, the greater the reduction that can be achieved (Galvis, Fernandez & Visscher, 1993; Collins et al., 1994; Ahsan, Alaerts & Buiteman, 1996). These filters can achieve similar reductions of coliform bacteria. Pilot studies of various roughing filter configurations (horizontal-flow, up-flow and down-flow) reduced faecal coliform bacteria by 93–99.5% (Galvis, Fernandez & Visscher, 1993). These filters were also combined with a dynamic roughing filter (which contains a thin layer of fine gravel on top of a shallow bed of coarse gravel, with a system of underdrains) to pretreat high turbidity events, and achieved faecal coliform removal of 86.3%. When followed by slow sand filtration, the removal reached 99.8%, with an overall combined treatment efficiency of 4.9–5.5 log units. In a five-month pilot study of a medium gravel (5.5 mm) horizontal roughing filter in Texas City, United States of America (USA), the filter removed on average 47% of total bacteria (as measured by epifluorescence microscopy), 37% of the source water algal cells and 53% of the total chlorophyll (Collins et al., 1994). The researchers found that the roughing filters removed clay particles more effectively when the filter was ripened with algal cells. Addition of alum coagulant before treatment with a horizontal roughing filter improved the filter’s performance for turbidity, colour, organic carbon, head loss and filter run length (Ahsan, Alaerts & Buiteman, 1996).
Removal processes 7
Figure 2.1 Typical roughing filter configurations (Collins et al., 1994)
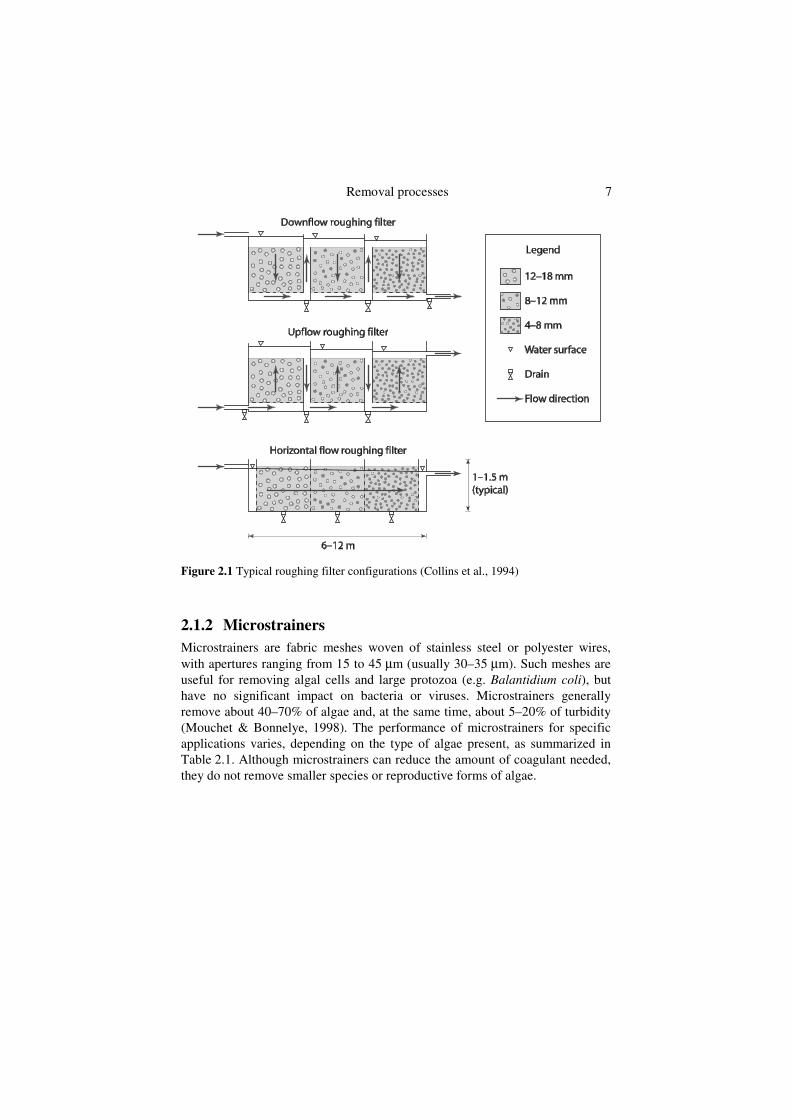
2.1.2 Microstrainers Microstrainers are fabric meshes woven of stainless steel or polyester wires, with apertures ranging from 15 to 45 µm (usually 30–35 µm). Such meshes are useful for removing algal cells and large protozoa (e.g. Balantidium coli), but have no significant impact on bacteria or viruses. Microstrainers generally remove about 40–70% of algae and, at the same time, about 5–20% of turbidity (Mouchet & Bonnelye, 1998). The performance of microstrainers for specific applications varies, depending on the type of algae present, as summarized in Table 2.1. Although microstrainers can reduce the amount of coagulant needed, they do not remove smaller species or reproductive forms of algae.
8 Water treatment and pathogen control
Table 2.1 Performance of microstrainers for various algae
Organism Type Percentage removal
Diatoms Cyclotella Unicellular 10–70 Stephanodiscus Unicellular 10–60 Melosira Filamentous 80–90 Synedra Unicellular 40–90 Asterionella Colonial 75–100 Fragilaria Filamentous 85–100
Chlorophyceae Chlorella Unicellular 10–50 Scenedesmus Cenobia (4–8 cells) 15–60 Pediastrum Cenobia (4–64 cells) 80–95
Blue-green algae Oscillatoria Filamentous 40–50 Anabaena Filamentous 50–70
Adapted from Mouchet & Bonnelye (1998)
2.1.3 Off-stream storage In this discussion, off-stream storage refers to a storage reservoir that directly or indirectly feeds a potable water intake. The effects of off-stream storage are difficult to generalize because important physical, biological and chemical processes are influenced by hydrological and limnological characteristics of the reservoir. For example, ‘round’ reservoirs and lowland impoundments influenced by strong winds can be represented as homogeneous biotypes because they are mixed effectively. On the other hand, long reservoirs whose depth increases with length are best represented as a series of interconnected individual basins (Bernhardt, 1995). The characteristics of reservoirs created by construction of a dam will differ from those of a natural or artificial lake.
Oskam (1995) summarized the self-purification processes that improve water quality in off-stream reservoirs (Table 2.2). The major factors that influence these processes are the degree of compartmentalization, the hydraulic residence time, the shape and flow through the reservoir, and the quality of the source water. Certain processes can also degrade water quality; for example, poorer quality of the impounded water can result from failure to:
• manage algal growth; • control influx of nitrogen, phosphorus or other contaminants; • limit faecal contamination from run-off of surrounding areas or roosting
birds.

Removal processes 9
Table 2.2 Self-purification processes that improve off-stream reservoir water quality
Type of process Effects
Physical Equalization of peak concentrations (e.g. chemicals, microbes) Exchange of oxygen and carbon dioxide with the atmosphere Evaporation of volatile substances (e.g. solvents) Settling of suspended solids and adsorbed substances (e.g. turbidity, heavy metals)
Biological Biodegradation of organic substances Die-off of faecal bacteria and viruses Nitrification of ammonium to nitrate Denitrification of nitrate to nitrogen Phosphorus elimination by phytoplankton uptake (in pre-reservoirs)
Chemical Oxidation of divalent iron and manganese Hydrolysis of polyphosphates and organic esters (e.g. phthalates) Photolysis of humic substances and polynuclear aromatic hydrocarbons
Adapted from Oskam (1995)
In a study by Bernhardt (1995), coliform bacteria in dammed reservoirs were reduced by 80–99% when residence times were greater than 40 days, and allochthonous bacteria were reduced by 90–99% when retention times exceeded about 100 days. Kors & Bosch (1995) reported reductions of enteroviruses (1.5 logs), Kjeldahl nitrogen (50%), total phosphorus (60%) and ammonium (70%) for a pumped, off-stream reservoir after about 100 days retention time. Stewart et al. (1997) examined storm events that washed high levels of Giardia cysts (up to 17 000 cysts/100 l) and Cryptosporidium oocysts (up to 42 000 oocysts/100 l) into receiving reservoirs. Only one of 29 reservoir effluent samples was positive, suggesting that the cysts and oocysts had become trapped in sediments that settled to the bottom of the reservoir, because unattached organisms settle slowly (Medema et al., 1998). Hawkins et al. (2000) reported complete elimination of Cryptosporidiumspikes (i.e. high concentrations) within three weeks in the 2 million megalitre Lake Burragorang reservoir that provides source water for Sydney (Australia). The authors calculated a settling rate of 5–10 metres/day and postulated that sedimentation was accelerated by oocysts clumping with other suspended particles. In a study of three reservoirs in Biesbosch (Netherlands), storage with long residence times (average 24 weeks) resulted in reductions of 2.3 logs for Giardia,1.4–1.9 logs for Cryptosporidium, 2.2 logs for Escherichia coli and 1.7 logs for faecal streptococci (Ketelaars et al., 1995; van Breemen & Waals, 1998).
The die-off kinetics for microbes can be modelled as a first-order reaction dependent on the residence time and short-circuiting (i.e. the decrease in hydraulic
10 Water treatment and pathogen control
residence time in a vessel) (Oskam, 1995). For relatively rapid removal rates (k-values > 0.05/day), the degree of compartmentalization has a positive effect on water quality. Therefore, a series of three or four smaller reservoirs would be better than one large impoundment. With estimated k-values of 0.07/day for removal of Giardia and Cryptosporidium, and 0.13/day for enteric viruses, compartmentalization in three or four reservoirs would increase the removal effect to 15–230 times that achieved by a single basin (Oskam, 1995).
For reservoirs with short retention times (and therefore limited self-purification), the raw water pumping schedule can be used to improve water quality, by avoiding periods of source water contamination. For example, in a study of the Delaware River (USA), peak levels of microbial contaminants were associated with high levels of turbidity following rainfall events (LeChevallier et al., 1998). By operating the source water pumps to avoid these peak events, levels of Giardia and Cryptosporidium 12–16 times higher than normal were avoided.
2.1.4 Bank infiltration Bank infiltration refers to the process of surface water seeping from the bank or bed of a river or lake to the production wells of a water treatment plant. During the water’s passage through the ground, its quality changes due to microbial, chemical and physical processes, and due to mixing with groundwater. The process can also be described as ‘induced infiltration,’ because the well-field pumping lowers the water table, causing surface water to flow into the aquifer under a hydraulic gradient. Bank infiltration can be accomplished through natural seepage into receiving ponds, shallow vertical or horizontal wells placed in alluvial sand and gravel deposits adjacent to surface waters, and infiltration galleries.
Bank infiltration has been widely used in European countries and is of increased interest in many other countries. Variations on the underground passage concept include soil aquifer treatment, injection of surface water for underground passage and aquifer recharge.
The advantages of bank infiltration are summarized in Table 2.3. The efficiency of the process depends on a number of factors: the quality of the surface water (turbidity, dissolved organic matter, oxygen, ammonia and nutrients), the composition and porosity of the soil, the residence time of the water in the soil and the temperature. This efficiency can vary over time, depending on the difference in level between the source water (e.g. river stage) and groundwater. This difference can influence the degree of groundwater mixing and the residence time of the infiltrated surface water.
Removal processes 11
Table 2.3 Advantages of bank infiltration
A natural pretreatment step requiring little chemical addition Reduced turbidity and particles Removal of biodegradable compounds Reduction of natural organic matter and less formation of disinfection by-products Reduction of bacteria, viruses and protozoa Equalization of concentration peaks (e.g. moderation of spills, temperature, etc.) Dilution with groundwater
Adapted from Kuhn (1999)
Concern about groundwater under the direct influence of surface water has caused some confusion about how to regard bank infiltration. Clearly, this process is under the direct influence of surface water; however, in the USA, the Surface Water Treatment Rule (USEPA, 1989a) does not consider the infiltration process as contributing to water treatment.
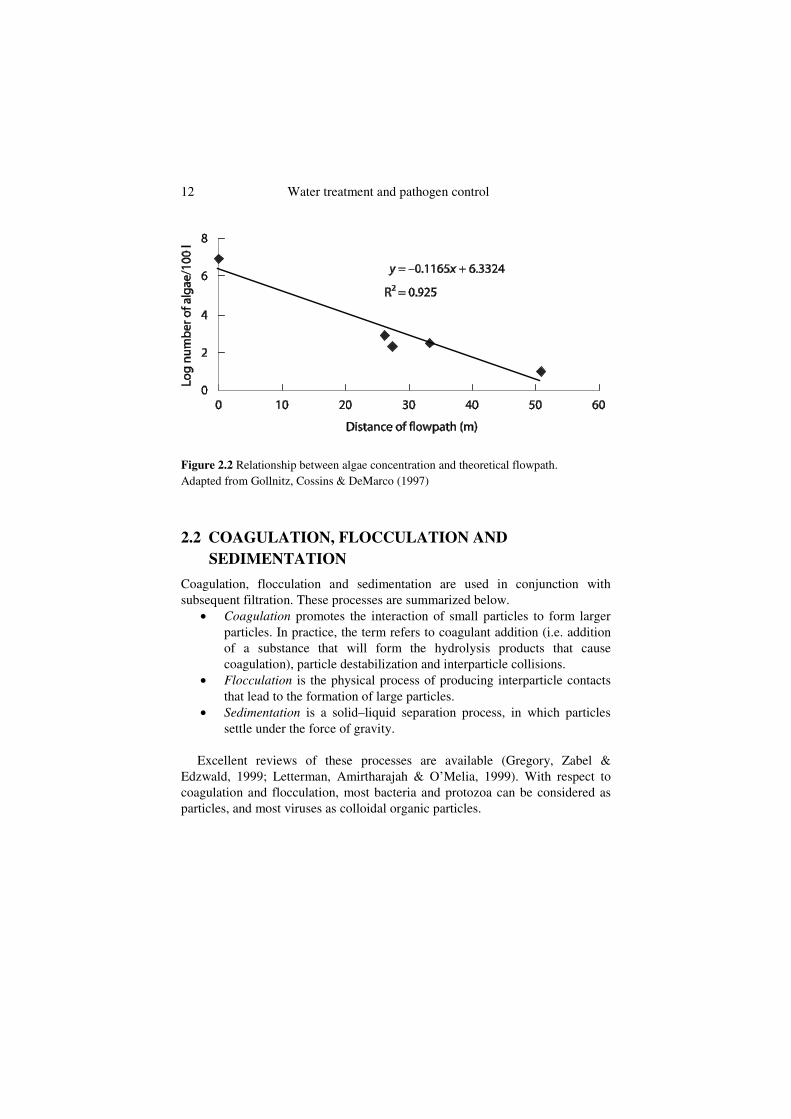
In a study of the Grand River in Ontario (Canada), removal of algae and diatoms ranged from 4.8 to 7.2 logs when the quality of the collection well was compared to the raw water (Clancy & Stendahl, 1997). No Giardia or Cryptosporidium were detected in the collector wells, although these protozoa were frequently detected in the river water. Figure 2.2 shows the relationship between the concentration of algae and the theoretical flow-path distance for wells along the Great Miami River at Cincinnati (USA), with approximately 1 log reduction for every 8.5 m (28 ft) of separation from the source water (Gollnitz, Cossins & DeMarco, 1997). Schijven and Rietveld (1997) measured the removal of male-specific coliphage, enteroviruses and reoviruses at three infiltration sites, and compared the measured values to those predicted by a virus transport model. They found a 3.1-log reduction of bacteriophage within 2 m (6.6 ft) and a 4.0-log reduction within 4 m (13.2 ft) of very fine dune sand. Phage levels were reduced by 6.2 logs through riverbank infiltration over 30 m (98 ft) of sandy soil. In all cases, enteroviruses and reoviruses were eliminated to below detection limits (> 2.6 to > 4.8 log removals). The virus transport model corresponded reasonably well with the measured results, producing calculated removals ranging from 2.5 to 15 logs.
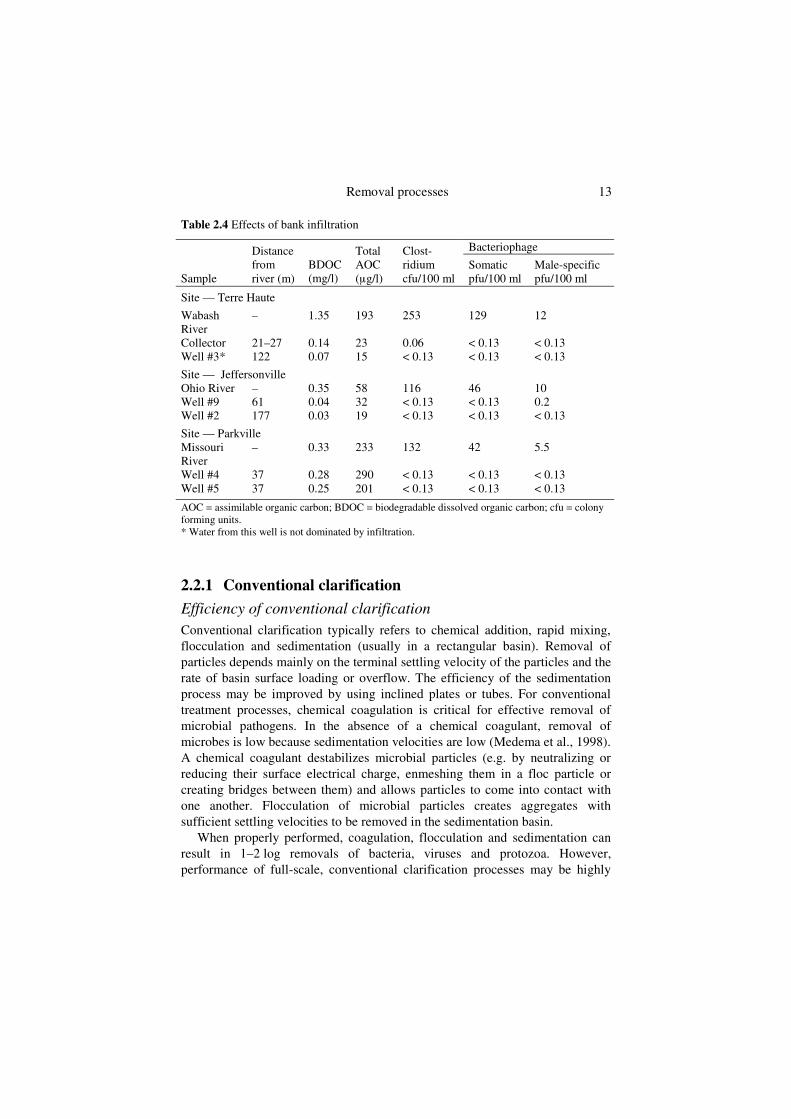
In studies being conducted by the American Water Works Service Company and the Johns Hopkins University, monitoring of three river bank infiltration systems along the Wabash, Ohio and Missouri rivers (USA) have shown complete removal of Clostridium and bacteriophage indicators (Table 2.4) and substantial reductions in biodegradable dissolved organic carbon (BDOC) and assimilable organic carbon (AOC), which can stimulate bacterial growth in distribution system pipelines (Ainsworth, 2004). These data indicate that bank infiltration can be highly effective for removal of microbial contaminants.
12 Water treatment and pathogen control
Figure 2.2 Relationship between algae concentration and theoretical flowpath. Adapted from Gollnitz, Cossins & DeMarco (1997)
2.2 COAGULATION, FLOCCULATION AND SEDIMENTATION
Coagulation, flocculation and sedimentation are used in conjunction with subsequent filtration. These processes are summarized below.
• Coagulation promotes the interaction of small particles to form larger particles. In practice, the term refers to coagulant addition (i.e. addition of a substance that will form the hydrolysis products that cause coagulation), particle destabilization and interparticle collisions.
• Flocculation is the physical process of producing interparticle contacts that lead to the formation of large particles.
• Sedimentation is a solid–liquid separation process, in which particles settle under the force of gravity.
Excellent reviews of these processes are available (Gregory, Zabel & Edzwald, 1999; Letterman, Amirtharajah & O’Melia, 1999). With respect to coagulation and flocculation, most bacteria and protozoa can be considered as particles, and most viruses as colloidal organic particles.
Removal processes 13
Table 2.4 Effects of bank infiltration
Bacteriophage
Sample
Distance from river (m)
BDOC(mg/l)
Total AOC (µg/l)
Clost-ridium cfu/100 ml
Somatic pfu/100 ml
Male-specific pfu/100 ml
Site — Terre Haute
Wabash River
– 1.35 193 253 129 12
Collector 21–27 0.14 23 0.06 < 0.13 < 0.13 Well #3* 122 0.07 15 < 0.13 < 0.13 < 0.13
Site — Jeffersonville Ohio River – 0.35 58 116 46 10 Well #9 61 0.04 32 < 0.13 < 0.13 0.2 Well #2 177 0.03 19 < 0.13 < 0.13 < 0.13
Site — Parkville Missouri River
– 0.33 233 132 42 5.5
Well #4 37 0.28 290 < 0.13 < 0.13 < 0.13 Well #5 37 0.25 201 < 0.13 < 0.13 < 0.13
AOC = assimilable organic carbon; BDOC = biodegradable dissolved organic carbon; cfu = colony forming units. * Water from this well is not dominated by infiltration.
2.2.1 Conventional clarification
Efficiency of conventional clarification Conventional clarification typically refers to chemical addition, rapid mixing, flocculation and sedimentation (usually in a rectangular basin). Removal of particles depends mainly on the terminal settling velocity of the particles and the rate of basin surface loading or overflow. The efficiency of the sedimentation process may be improved by using inclined plates or tubes. For conventional treatment processes, chemical coagulation is critical for effective removal of microbial pathogens. In the absence of a chemical coagulant, removal of microbes is low because sedimentation velocities are low (Medema et al., 1998). A chemical coagulant destabilizes microbial particles (e.g. by neutralizing or reducing their surface electrical charge, enmeshing them in a floc particle or creating bridges between them) and allows particles to come into contact with one another. Flocculation of microbial particles creates aggregates with sufficient settling velocities to be removed in the sedimentation basin.
When properly performed, coagulation, flocculation and sedimentation can result in 1–2 log removals of bacteria, viruses and protozoa. However, performance of full-scale, conventional clarification processes may be highly

14 Water treatment and pathogen control
variable, depending on the degree of optimization. For example, in a report summarizing the performance of treatment plants from various countries, average microbial removals for coagulation and sedimentation ranged from 27 to 74% for viruses, 32 to 87% for bacteria (total coliforms or faecal streptococci) and 0 to 94% for algae (Gimbel & Clasen, 1998). It is difficult to interpret full-scale data for Cryptosporidium and Giardia because these protozoa are found at very low levels, and methods for their detection have limitations (LeChevallier et al., 1991).
Factors that can result in poor clarification efficiency include variable plant flow rates, improper dose of coagulant, poor process control with little monitoring, shear of formed floc, inappropriate mixing of chemicals, poor mixing and flocculation, and inadequate sludge removal (USEPA, 1991). In addition to metallic coagulants (e.g. alum or ferric), it may be necessary to use polymeric coagulation, filter aids or both to produce low turbidity levels (< 0.1 nephelometric turbidity unit, NTU) especially for high-rate filtration (> 2.71 l/m2 s). Preoxidation with chlorine or ozone can improve particle removal by sedimentation and filtration (Yates et al., 1997; Becker, O’Melia & Croker, 1998). In some cases, treatment plants are being designed with intermediate ozonation, specifically to aid in particle removal by sedimentation and filtration (Langlais, Reckhow & Brink, 1991).
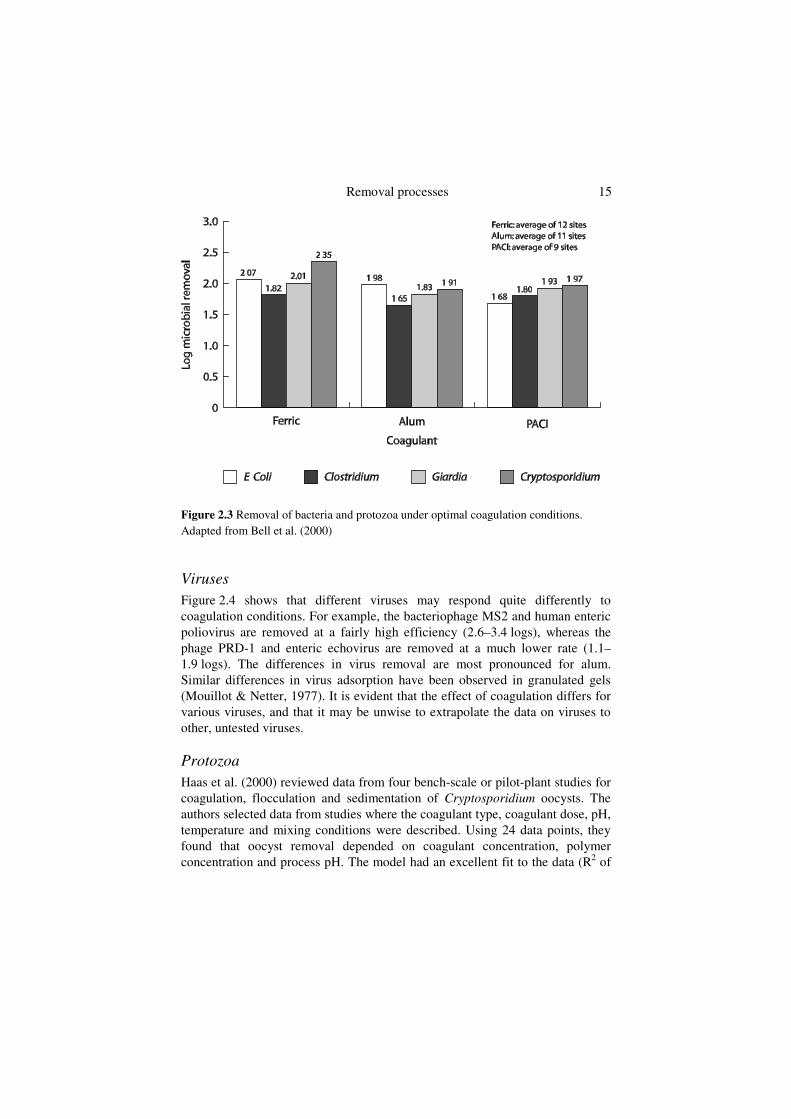
Using jar tests, Bell et al. (2000) reported removal of bacteria (E. colivegetative cells and Clostridium perfringens spores) and protozoa (Giardiacysts and Cryptosporidium oocysts) as typically of 1–2 logs (Figure 2.3). Overall, iron-based coagulants were slightly more efficient than alum (aluminum hydroxide) or polyaluminium chloride (PACl); however, site-specific water-quality conditions had a greater effect on removal efficiencies than did the type of coagulant. Coagulation conditions (i.e. dose, pH, temperature, alkalinity, turbidity and the level and type of natural organic matter) affected the efficiency of removal, with slightly better overall microbial reductions under pH conditions optimal for removal of total organic carbon (i.e. pH 5–6.5).
Removal processes 15
Figure 2.3 Removal of bacteria and protozoa under optimal coagulation conditions. Adapted from Bell et al. (2000)
VirusesFigure 2.4 shows that different viruses may respond quite differently to coagulation conditions. For example, the bacteriophage MS2 and human enteric poliovirus are removed at a fairly high efficiency (2.6–3.4 logs), whereas the phage PRD-1 and enteric echovirus are removed at a much lower rate (1.1–1.9 logs). The differences in virus removal are most pronounced for alum. Similar differences in virus adsorption have been observed in granulated gels (Mouillot & Netter, 1977). It is evident that the effect of coagulation differs for various viruses, and that it may be unwise to extrapolate the data on viruses to other, untested viruses.
ProtozoaHaas et al. (2000) reviewed data from four bench-scale or pilot-plant studies for coagulation, flocculation and sedimentation of Cryptosporidium oocysts. The authors selected data from studies where the coagulant type, coagulant dose, pH, temperature and mixing conditions were described. Using 24 data points, they found that oocyst removal depended on coagulant concentration, polymer concentration and process pH. The model had an excellent fit to the data (R2 of

16 Water treatment and pathogen control
0.94); however, the fit decreased when data from other studies were added to the model. The authors concluded that additional data are needed, especially from studies that fully describe coagulation and flocculation conditions.
An optimal coagulation dose is the most important factor for ensuring effective removal of cysts and oocysts by sedimentation and filtration (Logsdon et al., 1985; Al-Ani et al., 1986; Logsdon, 1990; Bellamy et al., 1993). Impaired flocculation was one of the factors in the 1987 outbreak of cryptosporidiosis in Carrollton, Georgia (USA) (Bellamy et al., 1993). In a study of eight water filtration plants, Hendricks et al. (1988) concluded:
… without proper chemical pretreatment Giardia cysts will pass the filtration process. Lack of chemical coagulation or improper coagulation was the single most important factor in the design or operation of those rapid rate filtration plants where Giardia cysts were found in finished water … with proper chemical coagulation, the finished water should be free of Giardia cysts, have few microscopic particles and have turbidity levels less than 0.1 NTU [nephelometric turbidity units].
Figure 2.4 Removal of viruses under optimized coagulation conditions. Adapted from Bell et al. (2000).
Removal processes 17
AlgaeCoagulation and sedimentation can be effective for removal of algae, although care must be taken to remove these organisms without disrupting the cells, as this may release liver or nerve toxins. Generally, coagulation appears not to cause the release of algal toxins, provided that oxidants are not added (Yoo et al., 1995b). Coagulation and sedimentation are not very effective at removing algal toxins; studies have shown removal levels ranging from 0 to 49%. However, addition of powdered activated carbon to the clarification process can increase removal levels to 90% or more, depending on the carbon dose, type of carbon, toxin level and organic matrix (Yoo et al., 1995b). A natural coagulant derived from shrimp shells (termed chitosan) was shown to be effective, removing more than 90% of the algae Chlorella and Scenedesmus quadricuda at neutral to alkaline pH conditions, using chitosan doses of more than 10 mg/l (Chen, Liu & Ju, 1996).
2.2.2 High-rate clarification High-rate clarification was first used in the 1930s, and it grew in popularity during the 1970s and 1980s. It involves using smaller basins and higher surface loading rates than conventional clarifiers, and is therefore referred to as high-rate clarification. Processes include floc-blanket sedimentation (also known as ‘solids-contact clarification’), ballasted-floc sedimentation, and adsorption or contact clarification.
In floc-blanket sedimentation, a fluidized blanket increases the particle concentration, thus increasing the rate of flocculation and sedimentation. Ballasted-floc systems combine coagulation with sand, clay, magnetite or carbon to increase the particle sedimentation rate. Adsorption or contact clarification involves passing coagulated water through a bed where particles attach to previously adsorbed material.
High-rate clarifiers can be as effective as or even more effective than conventional basins for removal of microbes. The choice of an appropriate blanket polymer is important for optimal operation (Gregory, Zabel & Edzwald, 1999). Bell, Bienlien & LeChevallier (1998) reported turbidity removals of 98% for a solids-contact, sludge blanket clarifier (raw water turbidity 20–50 NTU, settled water 0.6–0.75 NTU), 89% for internal slurry recirculation (raw water turbidity 4–10 NTU, settled water 0.5–0.9 NTU) and 61% for circular floc-blanket purification unit clarification (raw water turbidity 1.2–16 NTU, settled water average 0.97 NTU). Baudin & Laîné (1998) evaluated three full-scale treatment plants and found complete removal (> 2–2.8 logs) of Giardia and Cryptosporidium by pulsator clarifiers. The units produced a 1.0–2.7 log removal of turbidity. Other investigators (Hall, Pressdee & Carrington, 1994)
18 Water treatment and pathogen control
have reported similar efficiencies for floc-blanket clarifiers. A combination of preozonation and use of a solids-contact sludge blanket reportedly improved clarification of Giardia and Cryptosporidium-sized particles by about 1.5–2.5 logs (Wilczak et al., 1991). Pilot plant studies of a sand ballasted-floc system showed effective removal of turbidity and particle counts (Jeschke, 1998). In addition, microscopic particulate analysis of raw and settled water showed an average 3.9-log removal of algae, and 4.5-log removal of diatoms (Jeschke, 1998). Floc formed on magnetic particles can be rapidly removed by using magnets within the sedimentation process (Gregory, Maloney & Stockley, 1988; Bolto, 1990; Anderson et al., 1993). The magnetic particles can be collected and regenerated for reuse.
2.2.3 Dissolved air flotation In dissolved air flotation (DAF), bubbles are produced by reducing pressure in a water stream saturated with air. The rising bubbles attach to floc particles, causing the agglomerate to float to the surface, where the material is skimmed off (Gregory, Zabel & Edzwald, 1999). DAF can be particularly effective for removal of algal cells and Cryptosporidium oocysts. It is most applicable to waters with heavy algal blooms or those with low turbidity, low alkalinity and high color, which are difficult to treat by sedimentation because the floc produced has a low settling velocity.
The effectiveness of DAF for treating algal-laden, humic, coloured water is illustrated by the comments of Kiuru (1998), who indicated that the only type of treatment plants built in Finland since the mid-1960s have been DAF plants. A 1.8-log removal of the algae Aphanizomenon and Microcystis was achieved by pilot-scale DAF. Similar results (1.4–2.0 log removals) have been obtained in full-scale studies (Mouchet and Bonnelye, 1998). DAF is also effective in the removal of cell-associated algal toxins (Mouchet and Bonnelye, 1998).
Plummer, Edzwald & Kelley (1995) reported that, depending on the coagulant dose, DAF achieved 2–2.6 log removal of Cryptosporidium oocysts, whereas conventional sedimentation resulted in 0.6–0.8 log removal. The performance of DAF for oocyst removal depended on the pH, coagulant dose, flocculation time and recycle ratio of the saturated water stream. Other researchers have confirmed the effectiveness of DAF for oocyst removal, particularly when polyelectrolyte coagulant aids are added to help stabilize the floc (Hall, Pressdee & Carrington, 1994).
Removal processes 19
2.2.4 Lime softening Precipitative lime softening is a process in which the pH of the water is increased (usually through the addition of lime or soda ash) to precipitate high concentrations of calcium and magnesium. Typically, calcium can be reduced at pH 9.5–10.5, although magnesium requires pH 10.5–11.5. This distinction is important because the pH of lime softening can inactivate many microbes at the higher end (e.g. pH 10–11), but may have less impact at more moderate levels (e.g. pH 9.5). In precipitative lime softening, the calcium carbonate and magnesium hydroxide precipitates are removed in a clarifier before the water is filtered. The microbial impact of lime softening can, therefore, be a combination of inactivation by elevated pH and removal by settling.
Logsdon et al. (1994) evaluated the effects of lime softening on the removal and disinfection efficiency of Giardia, viruses and coliform bacteria. Coliform bacteria in river water (spiked with raw sewage) were inactivated by 0.1 log at pH 9.5, 1.0 log at pH 10.5 and 0.8–3.0 logs at pH 11.5 for 6 hours at 2–8°C. Bacteriophage MS2 was sensitive to lime softening conditions, demonstrating more than 4-log inactivation in the pH range of 11–11.5 within 2 hours. Hepatitis A virus was reduced by 99.8% when exposed to pH 10.5 for 6 hours. Poliovirus was the most resistant virus tested, requiring exposure to a pH level of 11 for 6 hours to achieve a 2.5-log inactivation. Reductions were less than 1 log when exposed for 6 hours to a pH of less than 11. The viability of Giardia muris cysts (measured by excystation) was not significantly affected by exposure to pH 11.5 for 6 hours. Cryptosporidium viability (measured using dye exclusion) was not affected by exposure to pH 9 for 5 hours (Robert, Campbell & Smith, 1992).
Jar tests of precipitative lime softening at pH 11.5 resulted in 4-log removal of viruses and bacteria, and 2-log removal of Giardia and Cryptosporidium, due to combined effects of removal by sedimentation and inactivation through high pH (Bell et al., 2000). Limited full-scale data suggest that 2-log removal can be achieved through sedimentation by precipitative lime softening (Logsdon et al. 1994).
2.2.5 In-line coagulation In-line coagulation can be used with high-quality source waters (e.g. those where turbidity and other contaminant levels are low). The coagulants are added directly to the raw water pipeline before direct filtration. Typically, the coagulants are added before an in-line static mixer, and it is not necessary to use a basin for sedimentation. In-line coagulation permits the particle destabilization

20 Water treatment and pathogen control
necessary for effective particle removal by filtration, but does not remove microbes by sedimentation.
2.3 ION EXCHANGE
Ion exchange is a treatment process in which a solid phase presaturant ion is exchanged for an unwanted ion in the untreated water. The process is used for water softening (removal of calcium and magnesium), removal of some radionuclides (e.g. radium and barium) and removal of various other contaminants (e.g. nitrate, arsenate, chromate, selenate and dissolved organic carbon). The effectiveness of the process depends on the background water quality, and the levels of other competing ions and total dissolved solids. Although some ion exchange systems can be effective for adsorbing viruses and bacteria (Semmens, 1977), such systems are not generally considered a microbial treatment barrier, because the organisms can be released from the resin by competing ions. Also, ion exchange resins may become colonized by bacteria, which can then contaminate treated effluents (Flemming, 1987; Parsons, 2000). Backflushing and other rinsing procedures, even regeneration, will not remove all of the attached microbes. Impregnation of the resin with silver suppresses bacterial growth initially, but eventually a silver-tolerant population develops. Disinfection of ion exchange resins using 0.01% peracetic acid (1 hour contact time) has been suggested (Flemming, 1987).
2.4 FILTRATION
Various filtration processes are used in drinking-water treatment. Filtration can act as a consistent and effective barrier for microbial pathogens. Figure 2.5 shows the most commonly used filtration processes in potable water treatment, the pore size of the filter media and the sizes of different microbial particles. These size spectra are useful for understanding removal mechanisms and efficiencies, and for developing strategies to remove microbes by different filtration processes.

Removal processes 21
DE = diatomaceous earth; MF = microfiltration; NF = nanofiltration; RO = reverse osmosis; UF = ultrafiltration.
Figure 2.5 Pore size of filter medium and size of microbial particles
2.5 GRANULAR HIGH-RATE FILTRATION
Granular media filtration is the most widely used filtration process in drinking-water treatment. A comprehensive review of granular media filtration processes is provided by Cleasby and Logsdon (1999). Under optimal conditions, a combination of coagulation, flocculation, sedimentation and granular media filtration can result in 4 logs or better removal of protozoan pathogens with chlorine-resistant cysts. This section discusses granular filtration other than slow

22 Water treatment and pathogen control
sand filtration (described in Section 2.6). Slow sand filtration is discussed separately because the low filtration rate (< 0.4 m/h) used in this process means that the design and operating criteria, and the mechanisms for removal of microbes are considerably different from those of ‘rapid-rate’ granular filtration.
2.5.1 Design of granular filtration In granular filtration, water passes through a filter consisting of a packed bed of granular materials. Microbes or microbe-associated particles are removed as they deposit on the filter medium. The removal occurs within the granular medium (depth filtration) rather than on the top layer only (cake filtration). After a period of operation, the head loss increases (i.e. the pressure increases) or the effluent quality deteriorates to an unacceptable level. The filter then has to be cleaned by backwashing, after which it performs poorly during a ‘ripening period’ before achieving a stable level of performance. Passage of microbial pathogens during the ripening period can be very high. Various strategies are used to minimize this effect, including:
• filter to waste — wasting the initial filtered water; • slow start — limiting the initial filtration rate until the filtrate quality is
acceptable;• delayed start — leaving the filter inactive for a time following
backwash, before bringing it into operation; • filter aid — adding a filter aid to the wash water supply.
Granular filters can be constructed as monomedium (e.g. silica sand), dual media (e.g. anthracite coal and sand) and trimedia (e.g. coal, sand and garnet). Granular activated carbon is used when both filtration of particles and adsorption of organic compounds are desired. Depending on raw water quality, granular filtration can be operated in three different modes:
• conventional, which includes addition of coagulants (rapid mixing), flocculation (slow mixing), sedimentation and filtration;
• direct filtration, in which the sedimentation step is omitted; • in-line filtration, in which both flocculation and sedimentation steps are
omitted.
Conventional treatment is appropriate for most source waters, whereas direct and in-line filtration are used for raw waters with a consistently good quality (low turbidity and colour).
Removal processes 23
2.5.2 Mechanism of action of granular filtration Removal of microbial pathogens by granular filtration does not rely on physical processes alone. Comparing the pore size of granular filters with the size of most types of microbe (as in Figure 2.5), it is evident that effective removal of microbes by granular filtration cannot rely on physical straining alone, at least at the initial stage of a filter run. The removal of particles by granular filtration is considered to involve two steps: transport of particles from suspension to filter medium, followed by attachment of particles to the medium (Yao, Habibian & O’Melia, 1971).
The transport step depends on the physical and hydrodynamic properties of the system. Transport mechanisms include diffusion, interception and sedimentation. Factors such as size and density of microbes, size and depth of filter medium, and filtration rate affect transport efficiency. In the case of motile microorganisms, an additional mechanism is the active movement of the cell (Hozalski & Bouwer, 1998). Attachment is determined by the surface and solution chemistry of the system (Tobiason & O’Melia, 1988). Unfavorable interactions between particles and the filter medium must be avoided so that particles can attach to the medium. Chemical coagulation is used before filtration to destabilize particles; this step is the single most important factor in determining filtration efficiency. Without proper chemical pretreatment, rapid rate filtration works as a simple strainer and is not an effective barrier for microbial pathogens.
2.5.3 Importance of chemical coagulation pretreatment The importance of chemical coagulation pretreatment for removal of microbes by granular filtration has been emphasized by numerous studies. Al-Ani et al. (1986) conducted a pilot-scale filtration study for low turbidity waters (< 1 NTU). Without chemical pretreatment, the removal by filtration averaged 69% (0.51 logs) for Giardia and 28% (0.14 logs) for turbidity. Adding alum and polymer filter aids increased the removal efficiency to more than 95% (1.30 logs) for Giardia, 99% (2 logs) for total coliform bacteria and 70% (0.52 logs) for turbidity. Other process variables such as filtration mode (direct and in-line filtrations), filter media (monomedium with sand, and dual-media with sand and anthracite) and temperature (5°C and 18°C) did not significantly affect the filtered water quality. Varying the filtration rate from 5 to about 20 m/h had little effect on removal of Giardia,total coliform bacteria and heterotrophic bacteria, but increased turbidity in the filtered water.
24 Water treatment and pathogen control
Robeck, Clarke & Dostal (1962) reported that, when alum was used as a coagulant, the removal of poliovirus type 1 by a pilot-scale dual-media filter was more than 98% (1.70 logs). Ongerth (1990) conducted pilot studies for conventional and in-line filtration. Without any chemical addition, removal of Giardia cysts averaged 75% (0.60 logs) for conventional treatment and 64% (0.44 logs) for in-line filtration. With optimal chemical pretreatment, the removal increased to 98% (1.70 logs) for conventional treatment and 93.6% (1.19 logs) for in-line filtration.
Nieminski & Ongerth (1995) evaluated the removal of Cryptosporidiumoocysts and Giardia cysts over two years at pilot and full-scale filtration plants, operated under direct filtration and conventional treatment modes. Dual-media filters with anthracite and sand were used. Giardia and Cryptosporidium were effectively removed when coagulation conditions produced filtered water of low turbidity (0.1—0.2 NTU). Under optimal coagulation conditions, the average removal of Giardia was 3.3 logs or more, and the average removal of Cryptosporidium was 2.3 logs or more in both pilot and full-scale plants, regardless of the treatment modes (direct filtration or conventional treatment). The authors also investigated correlations between the removal of cysts and surrogate parameters. A high correlation was found between removal of cysts and particles of 4–7 µm and 7–11 µm (R2 ≥ 0.79). There was a lower correlation between removal of Giardia and Cryptosporidium and removal of turbidity (R2 ≤ 0.64). Particle counting was a better indicator of cyst and oocyst removal than turbidity. Log removal of seeded cysts did not correlate with log removal of heterotrophic bacteria (R2 ≤ 0.08), suggesting that heterotrophic plate counts (HPCs) are not a good surrogate to use in evaluating cyst removal. A recent WHO publication (Bartram et al., 2003) discusses the significance of HPCs for water quality and human health.
2.5.4 Effect of filter media design Swertfeger et al. (1999) evaluated the effect of filter media design on cyst and oocyst removal. Designs included monomedium (sand with a depth of 750 mm), fine dual-media (anthracite and sand with depths of 900 mm and 300 mm, respectively) and deep dual-media (anthracite and sand with depths of 1500 mm and 300 mm, respectively). The feedwater to the pilot systems was taken from the effluent of a sedimentation unit in a full-scale water treatment plant and was in optimal coagulation condition. The authors found no statistical difference in the filtration performance for the different media. Removal of Giardia was 4.4 logs or better, with greater removal efficiency
Removal processes 25
in the summer than in the winter. Removal of Cryptosporidium was similar in summer and winter, and averaged 2.7 logs or more.
Payment et al. (2000) reported water-quality monitoring results for a full-scale conventional water treatment plant using dual-media filters, with coagulation provided by alum and activated silica. Prechlorination was applied at 1 mg/l. The results confirmed that a properly operated conventional treatment plant provided a substantial barrier to microbial pathogens. Giardia cysts were detected in only 1 of 32 filtered water samples, with a mean removal of 3.6 logs after filtration (including removal by coagulation and sedimentation). Removal of Cryptosporidium oocysts was lower than for Giardia. Oocysts were detected in 7 of 32 filtered water samples, with a mean removal of 2 logs. Clostridium perfringens was detected in 9 of 33 filtered water samples, with average removal of 4.4 logs. No human enteric virus was detected in 32 filtered water samples, with average removal of 3.1 logs (assuming that the concentration of humic enteric virus in filtered water was equal to the detection limit). Somatic coliphage were detected in 24 of 32 filtered water samples, with average removal of 3.5 logs.
2.5.5 Importance of filter backwash When solids accumulate within a filter bed, they create a resistance to flow. This resistance is measured as loss of head (pressure increase) for the filter bed. The filter is backwashed, usually with finished water, to remove the accumulated particles. The need for backwashing may be determined using various criteria — a terminal head loss, a fixed time interval, or a breakthrough of solids (measured as turbidity or particle counts). Options for disposal of the spent filter backwash water may include discharge to a sewer or a receiving stream. Because backwash water may contain disinfectants and other chemicals that may be harmful to the biological life of a stream, direct discharge to streams may be restricted. Similarly, discharge to sewers may be restricted, based on the constituents and total quantity of the backwash water.
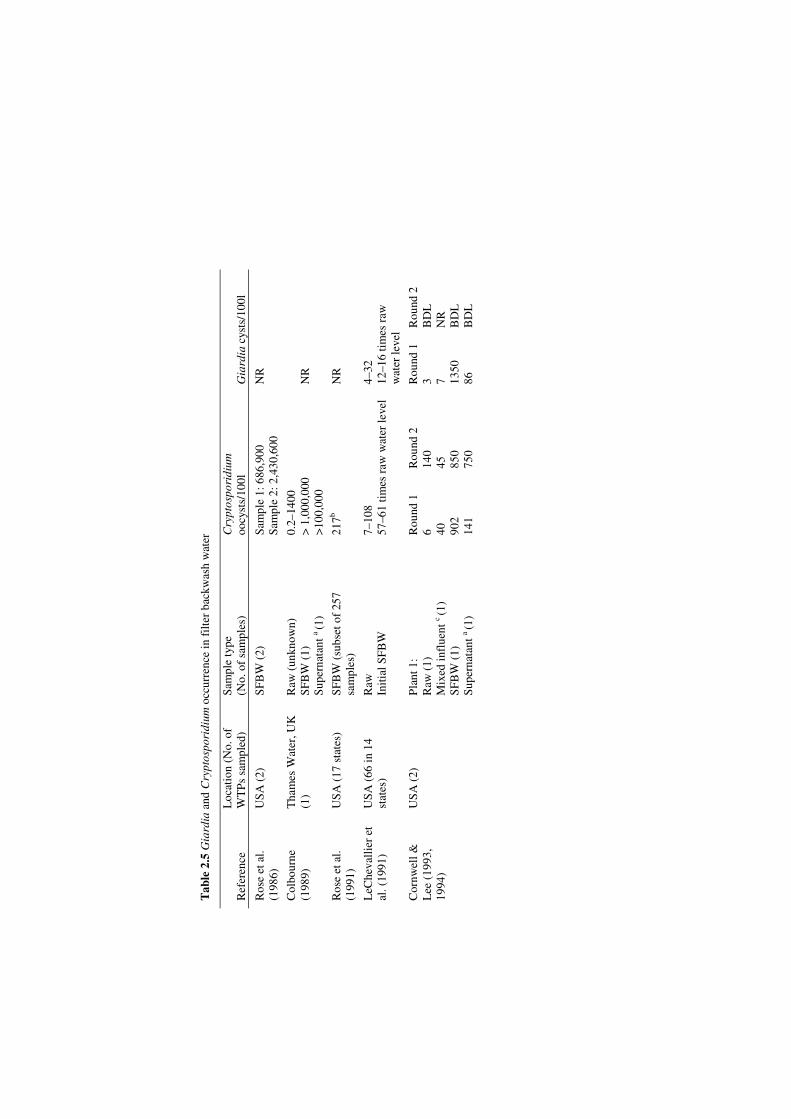
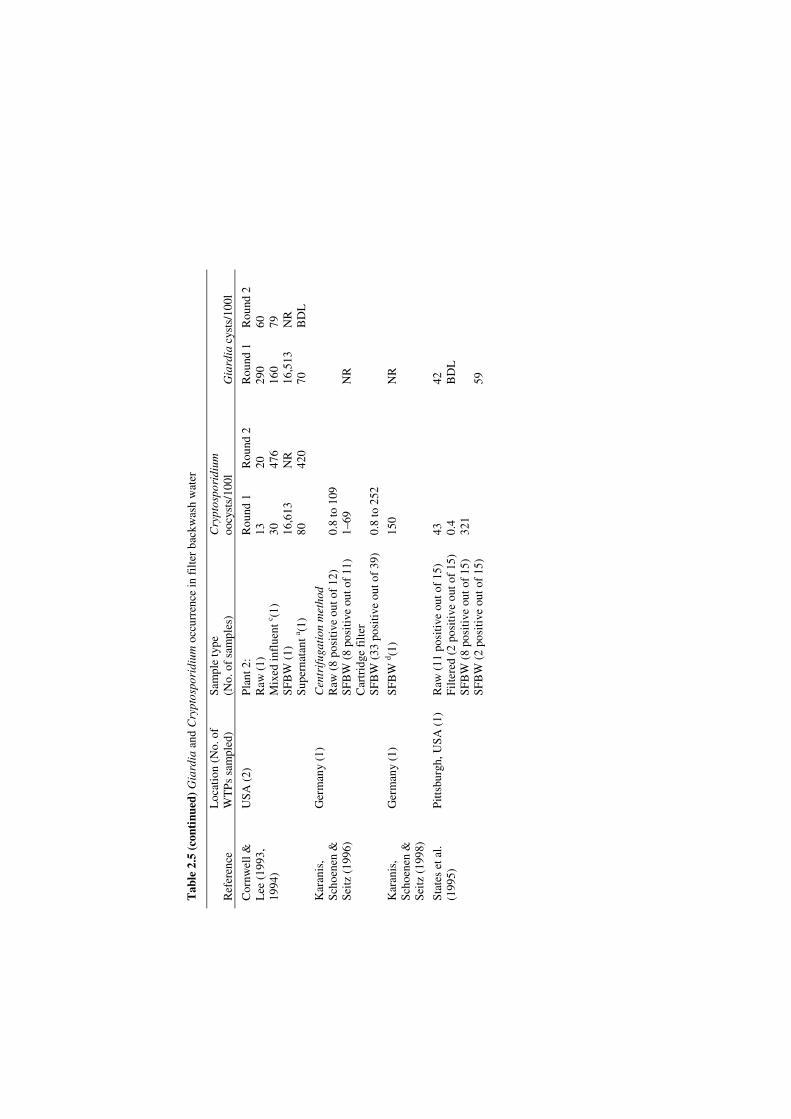
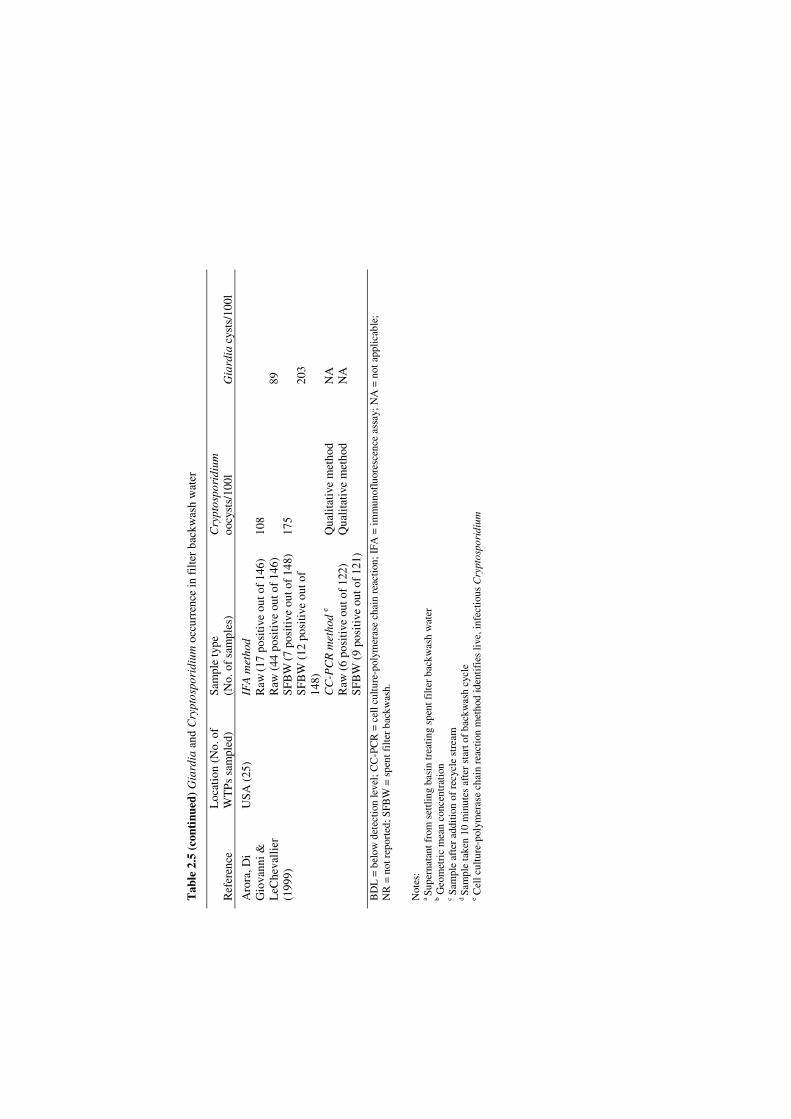
For many water treatment plants, particularly in arid or water-scarce areas with limited raw water resources, it is often necessary to reuse backwash water. When the water is recycled, accumulation of microbial and algal contaminants is a concern. For example, algal toxins may be released from stored treatment sludges when the overlying water is recycled (Drikas et al., 2001). Because of the resistance of oocysts to conventional disinfectants, Cryptosporidium has been a major concern for the handling and operation of recycled process streams. Table 2.5 summarizes data on the
26 Water treatment and pathogen control
occurrence and concentration of Giardia cysts and Cryptosporidium oocysts in filter backwash water. The level of treatment required for spent filter backwash water before recycle will vary from site to site depending on the treatment process and water-quality objectives. Equalization of the recycle flow and sedimentation of the backwash solids, aided by the addition of a polymer coagulant, is sufficient to reduce cyst concentrations to raw water levels in most cases (Cornwell & Lee, 1993; Arora, Di Giovanni & LeChevallier, 1999; McTigue et al., 2000).
2.6 SLOW SAND FILTRATION
The use of slow sand filtration to protect drinking-water consumers from microbial risk was well established more than 100 years ago. Two of the earliest successful cases were reductions in cholera in Altona (Germany) and typhoid fever in Lawrence, Massachusetts (USA) in the 1890s (Bellamy et al., 1985). Numerous disease outbreaks due to chlorine-resistant protozoan pathogens in the past two decades have increased interest in slow sand filtration because of its ability to remove parasites.
2.6.1 Design and action of slow sand filters Slow sand filtration involves passing water through a sand filter by gravity at a very low filtration rate, without the use of coagulation pretreatment. The filter typically consists of a layer of sand supported on a layer of graded gravel. Typical design criteria for slow sand filtration are given in Table 2.6. Detailed design guidelines can be found in Hendricks (1991). As water passes through the filter, microbes and other substances are removed. The removal mechanisms are not well understood, although they are believed to be a combination of biological, physical and chemical mechanisms (Weber-Shirk & Dick, 1997ab). Specific mechanisms may include biological action (e.g. ciliate protozoa acting as bacterial predators), attachment of microbes to sand media (e.g. by electrochemical forces and through bridging by microbial extracellular polymers) and physical straining.
Tab
le 2
.5G
iard
ia a
nd C
rypt
ospo
ridi
um o
ccur
renc
e in
fil
ter
back
was
h w
ater
Ref
eren
ce
Loc
atio
n (N
o. o
f W
TP
s sa
mpl
ed)
Sam
ple
type
(N
o. o
f sa
mpl
es)
Cry
ptos
pori
dium
oo
cyst
s/10
0l
Gia
rdia
cys
ts/1
00l
Ros
e et
al.
(198
6)
US
A (
2)
SF
BW
(2)
S
ampl
e 1:
686
,900
S
ampl
e 2:
2,4
30,6
00
NR
Col
bour
ne
(198
9)
Tha
mes
Wat
er, U
K
(1)
Raw
(un
know
n)
SFB
W (
1)
Sup
erna
tant
a(1
)
0.2–
1400
>
1,0
00,0
00
>10
0,00
0 N
R
Ros
e et
al.
(199
1)
US
A (
17 s
tate
s)
SF
BW
(su
bset
of
257
sam
ples
) 21
7b N
R
LeC
heva
llie
r et
al
. (19
91)
US
A (
66 in
14
stat
es)
Raw
In
itia
l SF
BW
7–
108
57–6
1 ti
mes
raw
wat
er le
vel
4–32
12
–16
tim
es r
aw
wat
er le
vel
Cor
nwel
l &
Lee
(19
93,
1994
)
USA
(2)
P
lant
1:
Raw
(1)
M
ixed
infl
uent
c(1
) SF
BW
(1)
S
uper
nata
nt a
(1)
Rou
nd 1
6 40 90
214
1
Rou
nd 2
14
045 85
075
0
Rou
nd 1
3 7 13
50
86
Rou
nd 2
B
DL
N
RB
DL
B
DL
Tab
le 2
.5 (
cont
inue
d)G
iard
ia a
nd C
rypt
ospo
ridi
um o
ccur
renc
e in
fil
ter
back
was
h w
ater
Ref
eren
ce
Loc
atio
n (N
o. o
f W
TP
s sa
mpl
ed)
Sam
ple
type
(N
o. o
f sa
mpl
es)
Cry
ptos
pori
dium
oo
cyst
s/10
0l
Gia
rdia
cys
ts/1
00l
Cor
nwel
l &
Lee
(19
93,
1994
)
USA
(2)
P
lant
2:
Raw
(1)
M
ixed
infl
uent
c (1)
SFB
W (
1)
Sup
erna
tant
a (1)
Rou
nd 1
13 30 16
,613
80
Rou
nd 2
20 47
6N
R42
0
Rou
nd 1
29
016
016
,513
70
Rou
nd 2
60 79 N
RB
DL
Kar
anis
, S
choe
nen
&
Sei
tz (
1996
)
Ger
man
y (1
) C
entr
ifug
atio
n m
etho
d R
aw (
8 po
siti
ve o
ut o
f 12
) S
FB
W (
8 po
siti
ve o
ut o
f 11
) C
artr
idge
fil
ter
SF
BW
(33
pos
itive
out
of
39)
0.8
to 1
09
1–69
0.8
to 2
52
NR
Kar
anis
, S
choe
nen
&
Sei
tz (
1998
)
Ger
man
y (1
) SF
BW
d (1)
150
NR
Sta
tes
et a
l. (1
995)
P
ittsb
urgh
, US
A (
1)
Raw
(11
pos
itiv
e ou
t of
15)
Fil
tere
d (2
pos
itiv
e ou
t of
15)
SF
BW
(8
posi
tive
out
of
15)
SF
BW
(2
posi
tive
out
of
15)
43 0.4
321
42 BD
L
59
Tab
le 2
.5 (
cont
inue
d) G
iard
ia a
nd C
rypt
ospo
ridi
um o
ccur
renc
e in
fil
ter
back
was
h w
ater
Ref
eren
ce
Loc
atio
n (N
o. o
f W
TP
s sa
mpl
ed)
Sam
ple
type
(N
o. o
f sa
mpl
es)
Cry
ptos
pori
dium
oo
cyst
s/10
0l
Gia
rdia
cys
ts/1
00l
Aro
ra, D
i G
iova
nni &
L
eChe
vall
ier
(199
9)
US
A (
25)
IFA
met
hod
Raw
(17
posi
tive
out o
f 14
6)
Raw
(44
pos
itiv
e ou
t of
146)
S
FB
W(7
pos
itiv
e ou
t of
148)
S
FB
W (
12 p
ositi
ve o
ut o
f 14
8)C
C-P
CR
met
hod
e
Raw
(6
posi
tive
out
of
122)
S
FB
W (
9 po
siti
ve o
ut o
f 12
1)
108
175
Qua
lita
tive
met
hod
Qua
lita
tive
met
hod
89 203
NA
N
A
BD
L =
bel
ow d
etec
tion
leve
l; C
C-P
CR
= c
ell c
ultu
re-p
olym
eras
e ch
ain
reac
tion
; IFA
= im
mun
oflu
ores
cenc
e as
say;
NA
= n
ot a
pplic
able
; N
R =
not
rep
orte
d; S
FBW
= s
pent
filt
er b
ackw
ash.
Not
es:
aSu
pern
atan
t fro
m s
ettli
ng b
asin
trea
ting
spen
t filt
er b
ackw
ash
wat
er
b Geo
met
ric
mea
n co
ncen
trat
ion
c Sam
ple
afte
r ad
ditio
n of
rec
ycle
str
eam
dSa
mpl
e ta
ken
10 m
inut
es a
fter
sta
rt o
f ba
ckw
ash
cycl
e e C
ell c
ultu
re-p
olym
eras
e ch
ain
reac
tion
met
hod
iden
tifi
es li
ve, i
nfec
tious
Cry
ptos
pori
dium
30 Water treatment and pathogen control
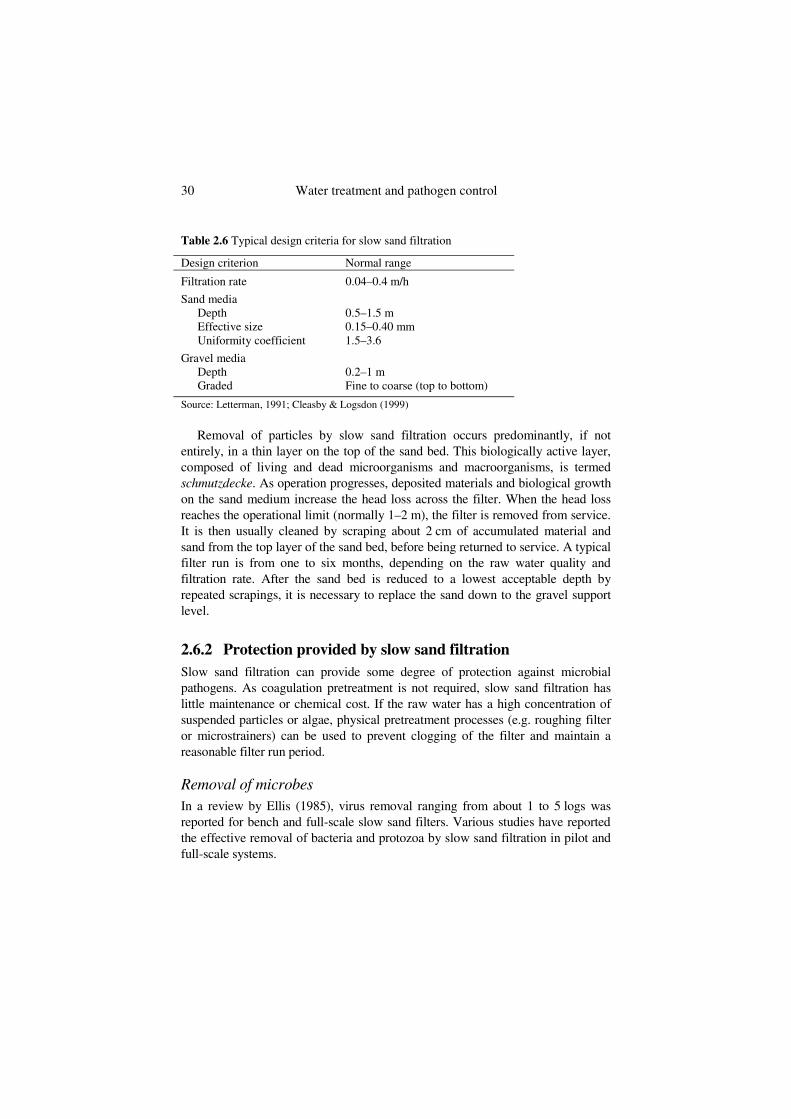
Table 2.6 Typical design criteria for slow sand filtration
Design criterion Normal range
Filtration rate 0.04–0.4 m/h
Sand media Depth 0.5–1.5 m Effective size 0.15–0.40 mm Uniformity coefficient 1.5–3.6
Gravel media Depth 0.2–1 m Graded Fine to coarse (top to bottom)
Source: Letterman, 1991; Cleasby & Logsdon (1999)
Removal of particles by slow sand filtration occurs predominantly, if not entirely, in a thin layer on the top of the sand bed. This biologically active layer, composed of living and dead microorganisms and macroorganisms, is termed schmutzdecke. As operation progresses, deposited materials and biological growth on the sand medium increase the head loss across the filter. When the head loss reaches the operational limit (normally 1–2 m), the filter is removed from service. It is then usually cleaned by scraping about 2 cm of accumulated material and sand from the top layer of the sand bed, before being returned to service. A typical filter run is from one to six months, depending on the raw water quality and filtration rate. After the sand bed is reduced to a lowest acceptable depth by repeated scrapings, it is necessary to replace the sand down to the gravel support level.
2.6.2 Protection provided by slow sand filtration Slow sand filtration can provide some degree of protection against microbial pathogens. As coagulation pretreatment is not required, slow sand filtration has little maintenance or chemical cost. If the raw water has a high concentration of suspended particles or algae, physical pretreatment processes (e.g. roughing filter or microstrainers) can be used to prevent clogging of the filter and maintain a reasonable filter run period.
Removal of microbes In a review by Ellis (1985), virus removal ranging from about 1 to 5 logs was reported for bench and full-scale slow sand filters. Various studies have reported the effective removal of bacteria and protozoa by slow sand filtration in pilot and full-scale systems.
Removal processes 31
In a pilot-scale study, a new filter removed 0.82 logs of total coliform bacteria and more than 1.7 logs of Giardia (Bellamy et al., 1985). Once a microbiological population was established within the sand bed (after two weeks), the removal of total coliforms increased to 4 logs and no Giardia was detected in the filtered water. The calculated cyst reduction was more than 2.6 logs, depending on influent cyst concentration. Similar results were found in another pilot study, where the removal of total coliform bacteria, heterotrophic bacteria and turbidity increased with the biological activity of the schmutzdecke (Bellamy, Hendricks & Logsdon, 1985).
In a full-scale study of a slow sand filter in Empire, Colorado (USA), Giardiacysts were detected in almost half of the influent samples, but not in the effluent (Seelaus, Hendricks & Janonis, 1986). In a full-scale study for three slow sand filtration plants in Idaho (USA), no samples positive for Giardia were found in the filtered water from two of the three treatment plants (Tanner & Ongerth, 1990). For the one positive sample found in one plant, 1-log removal of Giardia was achieved. In the same study, removal of total coliforms and faecal coliforms varied from 84.35 to 99.5% (0.81–2.30 logs) and from 48.1 to 70.0% (0.29–0.52 logs), respectively. Removal of heterotrophic bacteria (as measured by HPC) varied from 65.8 to 91.0% (0.47–1.05 logs). These differences in removal efficiency were influenced by raw water quality, filtration rate, media size and depth. Removal of Cryptosporidium by slow sand filtration is often more difficult than removal of Giardia. In a full-scale study in British Columbia, Fogel et al. (1993) reported that the average removal of Giardia was 93% (1.16 logs) but was only 48% (0.28 logs) for Cryptosporidium.
Removal of turbidity Although the removal of microbes by slow sand filtration can be substantial, reduction of turbidity may be site specific. In one pilot study, turbidity removal was 97.8% (1.66 logs) or more after a filter-ripening period of about two days (Cleasby, Hilmoe & Dimitracopoulos, 1984); similar to the removal of total coliform bacteria (≥ 99.4%) and chlorophyll-a (≥ 95%). Another pilot study found a 27–39% (0.14–0.22 log) removal of turbidity, whereas the reduction of Giardiawas up to 4 logs (Bellamy et al., 1985). The authors concluded that the low removal of turbidity was due to the fine clay particles present in the raw water, which penetrated the filter. In a full-scale study, turbidity removal was between 0 and 63% (0.43 logs), due to the fine particles present in the raw water and to the large fraction (4% by weight) of fines in the new sand media used in the study (Tanner & Ongerth, 1990). The fact that slow sand filtration can achieve effective removal of microbial pathogens but not necessarily decreased turbidity indicates that turbidity may not be a suitable surrogate for evaluation of the removal of pathogens by slow sand filtration.

32 Water treatment and pathogen control
2.7 PRECOAT FILTRATION
Precoat filtration was developed by the US Army during World War II as a portable unit for the removal of Entamoeba histolytica (a protozoan parasite prevalent in the Pacific war zone) from drinking-water. The process involves forcing water under pressure or by vacuum through a uniformly thin layer of filtering material precoated onto a permeable, rigid, supporting structure (referred to as a septum). Precoat materials include DE and perlite, with DE more commonly used in drinking-water treatment. As water passes through the filter media and septum, the precoat materials (filter cake) capture microbes and other particles, mainly by physical straining. Often, a “bodyfeed” solution containing the filter media slurry is added continuously to the system, to maintain the permeability of the filter cake. As the cake becomes thicker due to the captured particles, head loss increases until further filtration is impractical. The filter cake is removed from the support septum and disposed of. The filter is then cleaned and precoated with a new layer of coating materials, and a new filter cycle starts. A detailed design and operating manual for precoat filtration has been published by the American Water Works Association (AWWA, 1995).
Because the major removal mechanism is physical straining, efficiency of precoat filtration depends to a large extent on the grade (size) of the coating materials and on the size of the microbes. Other factors influencing the removal efficiency are chemical pretreatment of the filter media, filtration rate and bodyfeed rate. Chemical pretreatment of the raw water is usually not necessary; however, the raw water must be of high quality (low turbidity) to maintain a reasonable filter run time.
2.7.1 Removal of microbes Diatomite grades used for drinking-water treatment have a mean pore diameter of 7–17 µm (Figure 2.5). Precoat filtration can remove protozoan parasites such as Giardia very effectively. A pilot study showed complete removal of Giardia for both coarse and fine grades of DE over a wide range of operating conditions (Lang et al., 1986). Removal of Cryptosporidium can be significant, but because this organism is smaller than Giardia, it is more difficult to remove. Removal of Cryptosporidium oocysts by a bench-scale DE filter ranged from 3.60 to 6.68 logs, depending on the media grade and the filtration rate (Ongerth & Hutton, 1997). In a pilot-plant study, filtration with DE gave a consistently complete removal of Giardia cysts and a 3-log removal of Cryptosporidium oocysts (Schuler & Ghosh, 1990).
Removal processes 33
2.7.2 Importance of chemical pretreatment Precoat filters remove smaller microbial particles (e.g. bacteria and viruses) less effectively than they do parasites, unless the coating materials are chemically pretreated; for example, with aluminium or iron coagulants, or with cationic polymers. In the pilot study by Schuler & Ghosh (1990) mentioned above, removal of coliforms with untreated DE was about 0.36 logs, increasing to 0.82 logs with a coating of alum at 1 mg/g DE, and to 2 logs at 3 mg/g DE. This increase was probably due to the trapping of bacteria by the alum. A similar beneficial effect was observed using cationic polymers; at 3.5 mg/g DE, removal of coliforms increased to 3.3 logs. The authors concluded that this increase in removal could be due to an increased site density on the polymer-coated DE for adsorption of negatively charged coliforms. A similar improvement in removal of bacteria was reported for the pilot study conducted by Lang et al. (1986). Alum coating of DE increased removal of total coliforms from 0.16 logs to 1.40 logs, and of HPC bacteria from 0.36 logs to 2.30 logs. Removal of viruses also increased with chemical pretreatment of filter cake (Brown, Malina & Moore, 1974). The removal of bacteriophage T2 and poliovirus was about 90% for an uncoated filter, but increased to more than 98% (1.7 logs) when the filter cake was coated with ferric hydrate or polyelectrolytes.
2.8 MEMBRANE FILTRATION
In membrane filtration, a thin semipermeable film (membrane) is used as a selective barrier to remove contaminants from water. There are very few contaminants that cannot be removed by membrane processes. For the past two decades, the use of membrane filtration in drinking-water treatment (including pathogen removal) has been growing, due to increasingly stringent drinking-water regulations and decreasing costs of purchasing and operating membrane filters.
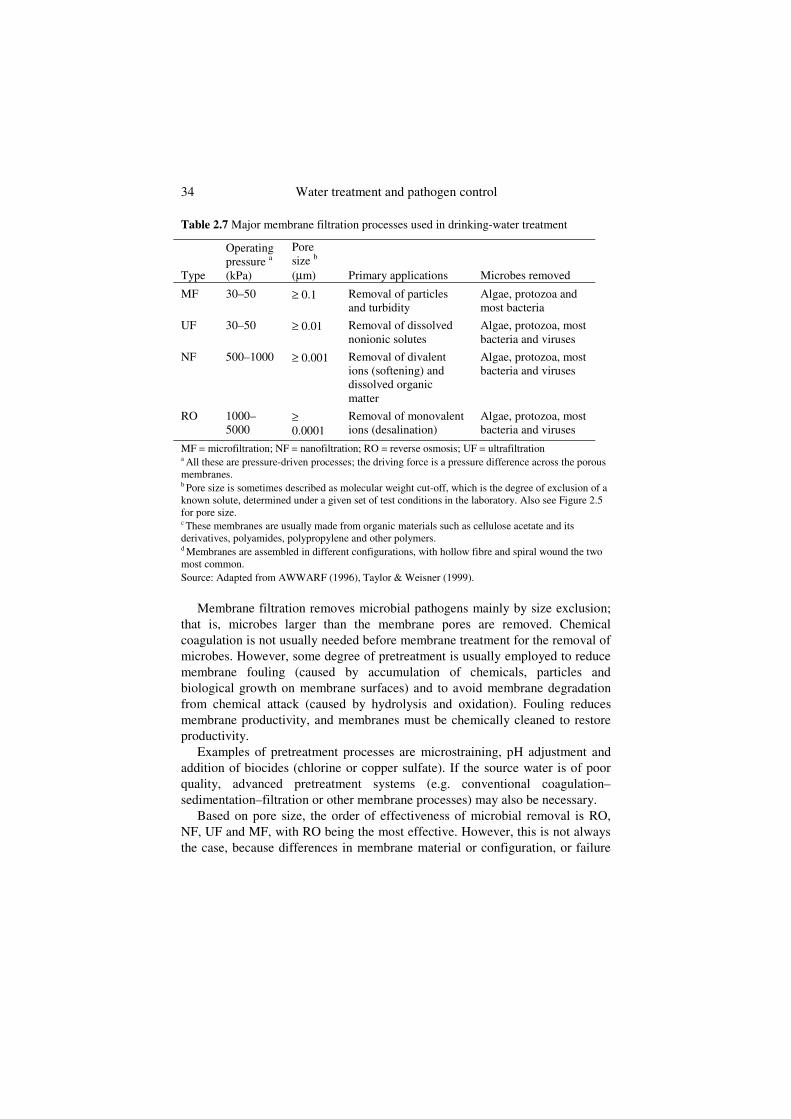
The membrane processes most commonly used to remove microbes from drinking-water are microfiltration (MF), ultrafiltration (UF), nanofiltration (NF) and reverse osmosis (RO). Detailed descriptions of the fundamentals, design and operation of these processes are available (AWWA, 1996; Taylor & Wiesner, 1999). Table 2.7 summarizes these processes, including operating pressure, pore size, primary application and the type of microorganism that can be removed. Not all of these processes are used primarily for removal of pathogens. For example, RO is used mainly for desalination and NF for softening and for removal of precursors of disinfectant by-products. Nevertheless, the ability to remove pathogens broadens the application of these types of filter when used for these other treatment objectives.
34 Water treatment and pathogen control
Table 2.7 Major membrane filtration processes used in drinking-water treatment
Type
Operating pressure a
(kPa)
Pore size b
(µm) Primary applications Microbes removed
MF 30–50 ≥ 0.1 Removal of particles and turbidity
Algae, protozoa and most bacteria
UF 30–50 ≥ 0.01 Removal of dissolved nonionic solutes
Algae, protozoa, most bacteria and viruses
NF 500–1000 ≥ 0.001 Removal of divalent ions (softening) and dissolved organic matter
Algae, protozoa, most bacteria and viruses
RO 1000–5000
≥0.0001
Removal of monovalent ions (desalination)
Algae, protozoa, most bacteria and viruses
MF = microfiltration; NF = nanofiltration; RO = reverse osmosis; UF = ultrafiltration a All these are pressure-driven processes; the driving force is a pressure difference across the porous membranes. b Pore size is sometimes described as molecular weight cut-off, which is the degree of exclusion of a known solute, determined under a given set of test conditions in the laboratory. Also see Figure 2.5 for pore size. c These membranes are usually made from organic materials such as cellulose acetate and its derivatives, polyamides, polypropylene and other polymers. d Membranes are assembled in different configurations, with hollow fibre and spiral wound the two most common. Source: Adapted from AWWARF (1996), Taylor & Weisner (1999).
Membrane filtration removes microbial pathogens mainly by size exclusion; that is, microbes larger than the membrane pores are removed. Chemical coagulation is not usually needed before membrane treatment for the removal of microbes. However, some degree of pretreatment is usually employed to reduce membrane fouling (caused by accumulation of chemicals, particles and biological growth on membrane surfaces) and to avoid membrane degradation from chemical attack (caused by hydrolysis and oxidation). Fouling reduces membrane productivity, and membranes must be chemically cleaned to restore productivity.
Examples of pretreatment processes are microstraining, pH adjustment and addition of biocides (chlorine or copper sulfate). If the source water is of poor quality, advanced pretreatment systems (e.g. conventional coagulation–sedimentation–filtration or other membrane processes) may also be necessary.
Based on pore size, the order of effectiveness of microbial removal is RO, NF, UF and MF, with RO being the most effective. However, this is not always the case, because differences in membrane material or configuration, or failure
Removal processes 35
in the membrane can affect microbial removal. Discussion of the removal efficiency of these different membrane processes follows.
2.8.1 Microfiltration MF membranes have pores of 0.1 µm or more (Table 2.7). Theoretically, MF can remove protozoa, algae and most bacteria very effectively, and this has been confirmed in a number of studies, some of which are discussed below. However, factors such as bacteria growing in the membrane systems can lead to poor removal of bacteria. Viruses, which are 0.01–0.1 µm in size, can generally pass through MF membranes, but may be removed by the membrane if they are associated with large particles.
Numerous pilot studies have directly evaluated the removal of Giardia,Cryptosporidium and other specific microbial pathogens by MF. For example, an extensive study using three MF membranes with pore sizes 0.08–0.22 µmfound that Giardia and Cryptosporidium in the filtered water were below detection levels (< 1 cyst or oocyst/l) with two of the membranes (corresponding to log removals of > 4.7 to > 7.0 for Giardia and > 4.4 to > 6.9 for Cryptosporidium) (Jacangelo, Adham & Laîné, 1995). No cysts or oocysts were detected in the effluent, indicating that the difference in removal efficiency was a function of the feeding concentration. In the case of the membrane where cysts were detected in the filtered water, the membrane seal was defective, but even so it achieved removal of 4.6 logs for Giardia and 4.2 logs for Cryptosporidium. The authors concluded that MF could act as an absolute barrier to protozoan cysts, provided that the membrane remained intact. As expected, removal of MS2 bacteriophage by these MF membranes was less than 1 log, because the phage is 0.025 µm and the pore size of the membranes is 0.08–0.22 µm.
In another pilot study, MF membranes with an average pore size of 0.2 µmresulted in significant removal of cyst-sized particles (Karimi, Vickers & Harasick, 1999). The removal of Giardia-sized (5–15 µm) particles averaged 3.3–4.4 logs. The removal of Cryptosporidium-sized (2–5 µm) particles was lower, averaging 2.3–3.5 logs. These removals were a function of the spiking particle concentration and were independent of the membrane flux used (114–170 l/m2 per hour). Algae were also effectively removed; the feed water contained 275–700 areal standard unit (asu) count of algae and 10–12.7 µg/l of chlorophyll-a, but these were reduced to below detection (< 25 asu and < 0.5 µg/l, respectively) in the filtered water. However, the HPCs from the filtered water exceeded those of the feed water, probably due to the growth of microorganisms in the pilot system.

36 Water treatment and pathogen control
A pilot study using two MF membranes with nominal sizes of 0.1 and 0.2 µmalso confirmed the complete removal of Giardia and Cryptosporidium by MF, with neither of these organisms detected in the filtered water (States et al., 1999). Hollow fibre membranes with a nominal pore size of 0.2 µm were used in a pilot-scale study using MF membranes for treating filter backwash water (Parker et al., 1999), pretreated in sedimentation tanks. The MF membranes reliably produced water with turbidity below 0.1 NTU, compared to an influent turbidity of 12.4–88 NTU. Average removal efficiency was 99.46% (2.27 logs) for particles in the size range 3–15 µm and 91.3% (1.06 logs) for heterotrophic bacteria. The MF membranes were also challenged with different microbes. Removal efficiencies were 5.3 logs for Cryptosporidium parvum, 6.4 logs for algae, more than 4.3 logs for total coliforms, 3.3 logs for heterotrophic bacteria, more than 3.5 logs for aerobic spores, 2.7 logs for total culturable virus and 3.7 logs for male-specific coliphage.
Excellent removal of turbidity, oocyst-sized particles and indicator bacteria was found in a full-scale study of a 19 000 m3/day MF plant using 0.2 µm MF membranes (Yoo et al., 1995a). Turbidity of up to 100 NTU was observed in the raw water; however, the finished water was always 0.05 NTU or less. Removal of oocyst-sized (4–10 µm) particles was greater than 3 logs. Neither total nor faecal coliforms were detected in any of the finished water samples. During a subsequent seeded challenge study, greater than 6-log removal was observed for both Giardia and Cryptosporidium at a flux rate of 0.94 gpm/m2 (AWWARF, 1999).
2.8.2 Ultrafiltration UF membranes have pores of 0.01 µm or more, small enough to remove some viruses in addition to bacteria and protozoa (Table 2.7). In the bench and pilot-scale studies discussed above, Jacangelo, Adham & Laîné (1995) found that UF, like MF, could act as an absolute barrier to protozoan cysts as long as membranes remained intact. Three UF membranes (with molecular weight cut-offs of 100 000–500 000 daltons, corresponding to pore sizes of 0.01–0.05 µm) were used in the studies. Neither Giardia nor Cryptosporidium were detected in the filtered water (corresponding to log removals of > 4.7 to > 7.0 for Giardiaand > 4.4 to > 7.0 for Cryptosporidium). Removal of viruses by UF was significantly better than removal by MF, and depended essentially on the pore size of the membranes. The membranes with the lowest molecular weight cut-offs achieved the highest removal efficiency (6 log or higher) for MS2 bacteriophage in both bench and pilot-scale studies. The authors also concluded that, although physical sieving was the main mechanism for the removal of

Removal processes 37
protozoan pathogens by UF and MF, cake layer formation and changes in the fouling of the membrane also contributed to the removal of viruses.
A pilot study to investigate the removal of particles and indicator bacteria from two surface water supplies used a UF membrane with a molecular weight cut-off of 100 000 daltons (Jacangelo et al., 1989). The membrane effectively removed particles, turbidity, total coliforms and heterotrophic bacteria, and produced filtered water with turbidity less than 0.04 NTU. Particle removal was from 2.6 logs to greater than 4.6 logs, depending on influent particle concentration. No coliforms were detected in the finished water. Influent HPCs of 4–4500 cfu/ml were reduced to < 1–5 cfu/ml in the effluent. The authors concluded that the heterotrophic bacteria in the filtered water were due primarily to the regrowth of bacteria in the membrane system.
A systematic pilot study to evaluate the use of UF to remove microbial pathogens from four different source waters used membranes with a molecular weight cut-off of 100 000 daltons (Jacangelo et al., 1991). Removal efficiencies for Giardia muris, coliforms, heterotrophic bacteria and MS2 bacteriophage were determined. Giardia muris, total coliform bacteria and MS2 bacteriophage in the filtered water were below detection (corresponding to reduction efficiencies of > 4 logs, > 7 logs and > 6.5 logs respectively). Differences in water quality or changes in operating parameters did not affect the removal capabilities of the process, but maintenance of membrane integrity was critical to assuring process efficiency. Loss of membrane integrity (fibre breakage) was associated with the detection of both Giardia muris and MS2 bacteriophage in the permeate water. Heterotrophic bacteria were found in the permeate water, but this was due to colonization of a section of the sample tap piping rather than to penetration of the bacteria through the membrane.
2.8.3 Nanofiltration and reverse osmosis The pore sizes of NF and RO membranes are smaller than those of UF membranes. However, NF and RO alone are seldom used to remove microbial pathogens because MF or UF are more cost-effective and can achieve a similar degree of microbial removal. Not surprisingly, there is far less literature on the removal of microbial pathogens by NF and RO than by MF and UF. Representative examples are discussed below.
Bench-scale study A bench-scale study evaluated virus removal by five different RO membranes (Adham et al., 1998). MS2 bacteriophage was used as the model virus, seeded at concentrations of 103–108 plaque-forming units (pfu)/ml. Virus reduction was from 2.7 logs to more than 6.5 logs. For the membrane with the highest removal
38 Water treatment and pathogen control
efficiency, no MS2 was found in filtered water (detection limit < 1 pfu/ml). The authors concluded that an RO membrane was not always an absolute barrier to viruses, and that the levels of removal achieved by each membrane varied, depending on the membrane type and manufacturer.
Pilot-scale study A pilot study to investigate the efficiency of integrated membrane systems used Bacillus subtilis endospores as a surrogate for Cryptosporidium and Giardia to challenge eight different integrated membrane systems (Owen et al., 1999). The systems included two different NF membranes with two different MF membranes as pretreatment, with and without in-line coagulation pretreatment. The systems did not completely remove spores, but gave overall cumulative removals of 8.0–11.0 logs. There was no difference in spore removal with or without in-line coagulation, but membrane configuration and membrane film significantly affected spore removal. The MF membranes, configured as hollow fibres, achieved 5.6–5.9 log removal of spores. The NF membranes, with an average pore size two orders of magnitude less than the MFs and a spiral wound configuration, achieved 2.2–4.5 logs removal.
The authors concluded that a hollow fibre configuration, which simply seals membrane fibres in a straight line, was unlikely to leak. In contrast, the spiral configurations crease membrane envelopes, and include feed stream and permeate stream spacers. The creases and spacers could compromise membrane integrity. Spore removal by the composite thin film NF membrane exceeded that of the cellulose acetate NF membrane by about 2 logs.
Full-scale studies Full-scale studies to evaluate the removal of microbial pathogens by integrated membrane systems using NF as the major treatment unit have been reported by Lovins et al. (1999) and Gullick et al. (2000). Two composite thin film NF membranes and one cellulose acetate NF membrane with molecular weight cut-offs of 100–300 daltons were used. Protozoa (Cryptosporidium oocysts and Giardia cysts), bacteria (Clostridium perfringens spores) and bacteriophage (MS2 and PRD1) were used to challenge the different NF membranes. Similar to the finding by Owen et al. (1999), the two composite thin film NF membranes were significantly more effective than the cellulose acetate NF membrane at removing microbes. Removals of about 5.5 logs were achieved with the thin film membranes, with complete removal in more than half of the tests. This compared to removals of about 2 logs with the cellulose acetate membrane, which produced complete removal in less than 10% of the tests.

Removal processes 39
The efficiency of a UF membrane with molecular weight cut-off of 100 000 daltons was also investigated in this study. The observed microbial removal performance for the UF was similar to that of the two composite thin film NF membranes, and significantly higher than that of the cellulose acetate NF membrane. The authors suggested that this was due partly to the configurations of the membrane (hollow fibre for UF and spiral wound for NF). Integrated membrane systems with different configurations were tested in the study. Pretreatment (before NF) included conventional coagulation followed by sedimentation and sand filtration, hollow fibre MF with pore size 0.2 µm and hollow fibre UF with a molecular weight cut-off of 100 00 daltons. As expected, the highest pathogen removals were achieved by integrated membrane systems with composite thin film NF and UF pretreatment, with 6.3–11.0 log removals. However, some membranes did not remove microbes completely, even at relatively low feed concentrations, indicating that integrated membrane systems are not necessarily absolute barriers to pathogens.
2.9 BAG, CARTRIDGE AND FIBROUS FILTERS
A bag filter is one that has a non-rigid fabric medium for the filter. Water flow is usually pressure-driven from the inside of the filter bag to the outside. A cartridge filter is one that has a rigid fabric medium or membrane for the filter. In this type of filter, water flow is usually pressure-driven from the outside of the filter to the inside. Bag and cartridge filters are often developed for small systems and for point-of-use filtration applications. They are also sometimes applied as a pretreatment process for membrane filtration.
Bag filters and cartridge filters remove microorganisms by physical straining. The removal efficiency thus depends primarily on the pore size of the filter medium and on the size of the microbes. A typical pore size range is from 0.2 µm to about 10 µm. The pore size of the filter medium is usually designed to be small enough to remove protozoa such as Cryptosporidium and Giardia.Submicron particles, including viruses and most bacteria, can pass through the filters. As water passes through a bag or cartridge filter, pressure drop increases to a level impractical for operation. The bag or cartridge is then replaced by a clean one.
Since the removal mechanism is physical straining, chemical pretreatment is usually not required for bag filters and cartridge filters. Straining of large compressible particles can blind the filters and reduce filter life. High turbidity and algae can also clog these filters. These processes are therefore only appropriate for high-quality waters. A prefiltration process may be employed to remove large particles.
40 Water treatment and pathogen control
In principle, microbes larger than the pore size of the medium will be captured by the filters. The nominal size of a filter medium reported by the manufacturers represents an average size — there is often a pore size distribution, meaning that some pores will be larger than the nominal size. Furthermore, some biological particles such as cysts and oocysts do not have hard shells. These microbes may deform slightly, especially under pressure, allowing them to squeeze through small pores. Li et al. (1997) studied the removal of Cryptosporidium oocysts using field-scale bag filtration. A bag filter with a single layer of polypropylene fabric, with a nominal pore size of 1 µm, removed an average of 0.42 log of Cryptosporidium. This means that 38% of seeded Cryptosporidium oocysts passed through the filter, probably for the reasons mentioned above. When the bag filter was changed to multiple layers, the log removal increased to 1.41.
Arora, Di Giovanni & LeChevallier (1999) evaluated the performance of fibrous filters to treat recycled filter backwash water. Two filters, one made of polybutylene terephthalate with a nominal sizing of 5 µm and the other made of nylon with a nominal sizing of 2 µm, were used. The recycled backwash water was pretreated in a sedimentation tank. Pilot runs with the polybutylene terephthalate filter resulted in an average removal of 3 logs for Cryptosporidium, 0.5 logs for Giardia and 1 log for Clostridium. The nylon filter achieved an average removal of 3 logs for Cryptosporidium, 1.2 logs for Giardia and 1.5 logs for Clostridium.