removing the barriers to growth: how to influence your organization's leadership through data
TRANSCRIPT

Allison Porter, Avalon ConsultingLaura Connors, National Parks Conservation Association
Amelia Koch, Chesapeake Bay Foundation
Removing the Barriers to Growth: How to Influence Your
Organization’s Leadership Through Data

2
The Challenge: Growth is needed• Whether to strengthen donor engagement and retention, or to expand new donor acquisition with added investment – the potential for growth is huge, but the required, upfront capital investment and/or buy‐in from leadership is not there. (Does this sound familiar?)
• In this presentation, we will discuss areas that require attention to overcome barriers to growth, and solutions to influence your organization’s leadership through data.

#Bridge15
Laura Connors – Acting Vice President, Membership, National Parks Conservation Association
• NPCA’s mission is to protect our national parks for future generations.• NPCA has more than 1 million members and supporters.
Amelia Koch – Director of Membership, Chesapeake Bay Foundation
• CBF is the largest independent conservation organization dedicated solely to saving the Bay. • Serving as a watchdog, we fight for effective, science‐based solutions to the pollution degrading the Chesapeake Bay and its rivers and streams.
• CBF has more than 200,000 members.
Allison Porter – President, Avalon Consulting Group
• Avalon is a full‐service direct marketing fundraising agency.• Since 1997, Avalon has helped our clients raise millions of dollars to achieve their visions for a better world—while building relationships with people who share their passion and support their important causes.
Here with you today…
3

#Bridge15
Top barriers to growth…
Executive Education
“Short‐termism”
Changing donor
landscape
4

#1: Executive Education• The need to inform and persuade the
leadership of organizations—from CEOs and CFOs, to board chairs and board committees—is significant.
• Be clear, concise, and direct in stating your case.
• Tackle the irrational “ick” factor –underlying bias against direct marketing and fundraising.
5

#2: Combat Short‐Termism• Move away from short‐term goals toward a more
strategic horizon.• Enable leaders to evaluate and understand the
long‐term value of today’s fundraising investments, and how they pay off for decades to come.
• Present and embrace new options for understanding the value of risk and opportunity.
• Use the right tools to educate about the decisions we make today and the impact in the future.
6

#3: Recognize the changing donor landscape
• Donors are changing – and so are their expectations.• We must connect with them emotionally, and
quantify impact.• Leverage the tried‐and‐true in direct marketing
fundraising and caution against chasing the shiny new toy—all the while employing testing and analytics to identify new and more effective ways to engage donors in this new environment.
7

#Bridge15
Solutions to remove barriers to growth…and influence your organization’s leadership through data.
Clear goals and objectives
Know your metrics
Consider your audience
Be clear about the story you are telling
Visualize your data
Benchmark your data
8

#Bridge15
Clear goals and objectives:
• Define clear goals (ie, net revenue, members) and educate about the reality of meeting goals.
• Report transparently and regularly on progress.• Use tools like long‐range forecasting, file
trajectory projections, etc.
9

#Bridge15
Example: Use data to identify primary goal and create understanding. Gross revenue, net revenue, and member growth may be in competition.
Goal: Net Revenue
10

#Bridge15
Example: Use long‐range forecasting to clearly show options to meet goals and the impact of current decisions on the future.
11
2010: Forecasting
year

#Bridge15
Example: Clearly show the long‐term impact of decisions. In this case, added investment has increased revenue.
12

#Bridge15
Example: Show file trajectory and changes needed to reach stability (or growth).
Current file trajectory
New joins needed to stabilize
13

#Bridge15
Know your metrics:
• Easily understood performance metrics will bring leadership along in the process.
• What are the key performance metrics that will provide evidence of success?
Retention Income per member
Return on Investment
Donor Value
14
#Bridge15
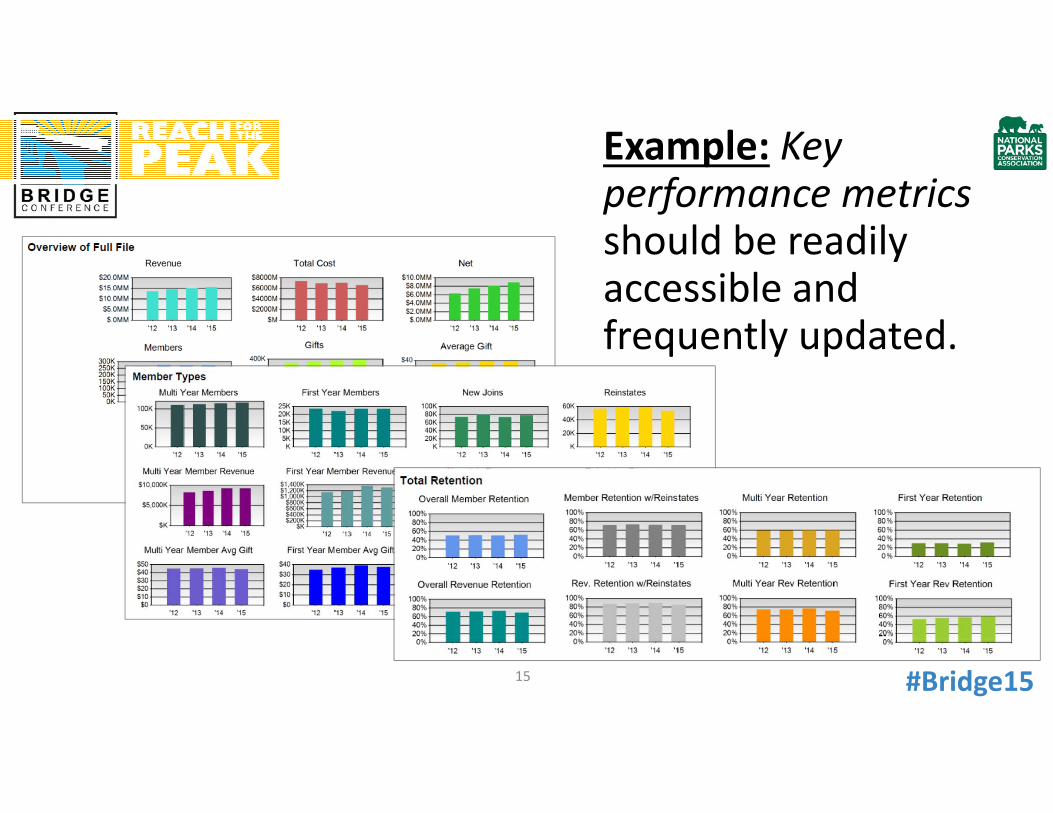
Example: Key performance metrics should be readily accessible and frequently updated.
15

#Bridge15
Consider your audience:
• Critical to a successful presentation.• Think carefully about who is in the room.• Brainstorm key questions that will arise and be
prepared to proactively answer them.
Board member? CFO? President? Senior
Staff?
16

#Bridge15
Make sure everyone is on the same page about goals. Define and
articulate as a group.
Clearly state at the start of each meeting, and recap process.
Use a consistent form of
reporting back for each meeting.
Respond to feedback to improve clarity for future
meetings.
Be clear about the story you are telling:
17

#Bridge1518

#Bridge15
Visualize your data:• Use visualized data to identify deeper underlying
trends in your member file—not readily apparent from campaign‐level reports—to get your stakeholders on board and keep them there.
• Communicate the impact of your program using effective graphics and dashboard designs.
• Simpler is often better to make key points!
19

#Bridge15
Example: Educate about common misconceptions and the need for tried and true strategies.
It’s still a direct mail world!
20

#Bridge15
Example: Show the breakeven point for acquisition visually.
$0.00
$5.00
$10.00
$15.00
$20.00
$25.00
$30.00
$35.00
$40.00
$45.00
Yr 1 Yr 2 Yr 3 Yr 4 Yr 5
cumulative donorvalue
cumulative CTA
21

#Bridge15
Example: Show the true value of a direct marketing program by demonstrating the pipeline to major giving.
22

#Bridge15
rolling year revenue total cost net members gifts average gift gifts per member
revenue per member
2012 $5,100,987 $0 $5,100,987 80,091 107,469 $47.46 1.34 $63.69
2013 $4,926,912 $2,135,401 $2,791,511 68,294 94,683 $52.04 1.39 $72.14
2014 $4,718,760 $2,246,923 $2,471,837 59,205 86,173 $54.76 1.46 $79.70
2015 $4,646,657 $1,143,593 $3,503,064 54,462 82,521 $56.31 1.52 $85.32
Example: Use clear visuals to highlight key metrics.
Instead of this:
Use this: A more visual presentation to increase understanding and decrease noise:
23

#Bridge15
Example: Use clear visuals to highlight key metrics.
rolling year overall member retention
member retention w/reinstates
first year retention
multi yr retention
2012 45.30% 60.30% 21.30% 60.90%
2013 48.00% 66.40% 17.70% 63.50%
2014 55.00% 71.50% 24.40% 63.90%
2015 59.00% 75.30% 31.70% 66.00%
24

#Bridge15
Example:Make the case for direct marketing with graphics.
25

#Bridge15
Benchmark your data:• Educate leadership on the context of your
performance in light of the industry.• Benchmarking is often a top question from
leadership, and can add perspective and defuse critical discussions about performance.
• Use available reports and network with colleagues to benchmark your data. How do you compare to others in your industry/sector?
26

#Bridge15
Comparison of Key Metrics to Target Analytics’ Index of National Fundraising Performance
Example: Compare key performance metrics against publically available benchmarking data.
27

#Bridge15
Education will take time and
multiple conversations.
Accountability is ongoing.
Report back frequently and consistently.
Repetition is your friend!
Refresh and Repeat!
The barriers to growth are significant, but surmountable with the right communication.
28

#Bridge15
Questions?
29

Allison PorterPresident
Avalon Consulting [email protected]
Laura ConnorsActing Vice President, Membership
National Parks Conservation Association
Amelia Koch Director of Membership
Chesapeake Bay [email protected]
Thank You!
30