renewable energy and climate change
TRANSCRIPT

NREL is a national laboratory of the U.S. Department of Energy, Office of Energy Efficiency and Renewable Energy, operated by the Alliance for Sustainable Energy LLC
Renewable Energy and Climate Change
Symposium in Honor of 2009 and 2010 ACS Fellows in the Industrial and Engineering Chemistry Division
Helena Chum, NREL Research Fellow
August 20, 2012
244th ACS National Meeting Philadelphia, PA

Outline
1. Industrial and Engineering Chemistry -- Cellulose and Renewable Materials, Chemicals, Fuels, and Energy --important in the past, present and future.
2. Framing renewable energy technologies and integrated efficient systems
3. Framing energy systems and climate change - Key recent global scenarios
4. Renewable energy sources and climate change – the IPCC Special Report (SRREN)
ACS National Meeting, Fall 2012

NREL, 2/2012, Golden, Colorado An Energy System Integration
Experimentation Laboratory
National Renewable Energy Lab of the U.S. DOE
Energy Efficiency and Renewable Energy Office
35 years old

Natl. Wind Technology Center
Multiple Promising PV Technologies

IEA, 2011 World Energy Outlook
2. Framing Energy Systems

Business solutions for a sustainable world The Energy Mix: Low-carbon pathways to 2050
http://energyinnovation.org/wp-content/uploads/2012/05/WBCSD-The-Energy-Mix.pdf

Higher Resolution Scenario: 2010 IEA-WEO
2030: Biofuels ~11% global transport fuels (~60% advanced) including aviation biofuels Biopower ~5% global electricity Biomass industrial heating and building double each relative to 2008

CO2 eq
Chu and Majumdar, Opportunities and challenges for a sustainable energy future, Nature , 2012, 488, 294-303. doi:10.1038/nature11475

GEA pathways see the interactive web-based GEA scenario database hosted by IIASA: www.iiasa.ac.at/web-apps/ene/geadb
GEA, 2012: Global Energy Assessment – Toward a Sustainable Future, Cambridge University Press, Cambridge UK and New York, NY, USA
and the International Institute for Applied Systems Analysis, Laxenburg, Austria.
2012 Global Energy Assessment – Toward a Sustainable Future Three Scenarios

Climate change Bell weather A statistical analysis s Shows how things really are heating up The Economist, Aug 11th 2012
Adaptation and Mitigation Needed
Based on J. Hansen et al., Perception of climate change, PNAS Early edition www.pnas.org/cgi/doi/10.1073/ pnas.1205276109

Oil and Gas Sector Impacts
CLIMATE CHANGE AND ENERGY SUPPLY AND USE : Technical Report for the U.S. Department of Energy in Support of the National Climate Assessment, 2/2012 http://www.esd.ornl.gov/eess/EnergySupplyUse.pdf

johnthescone
The IPCC Special Report on Renewable Energy Sources and Climate Change (CC) Mitigation
Summary by Helena Chum, NREL Coordinating Lead Author of Bioenergy Chapter
Based on Contributions from all Authors
1070 pages 122 Countries supplied
Authors • 122 Lead
• 132 Contributing • 35 Review Editors
350 peer reviewers ~25,000 comments
http://www.ipcc.ch/

SRREN

Coordinating Lead Authors Meeting with IPCC WGIII cochairs and TSU – Potsdam, Germany, Jan. 2011
*

RE growth has been increasing rapidly in recent years.
140 GW of new RE power plant capacity was built in 2008-2009 This equals 47% of all power plants built during that period • In 2009 RE capacity additions - Wind power 32%, 38 GW - Hydropower 3%, 31 GW - Grid-connected PV 53%, 7 GW - Geothermal power 4%, 0.4 GW -Solar hot water/heating 21%, 31 GWth • Biofuels 2009 • 3% global road transport or • 2% of total transport fuels 2009 additions - Ethanol 10%, 7 billion liters - Biodiesel 9%, 2 billion liters
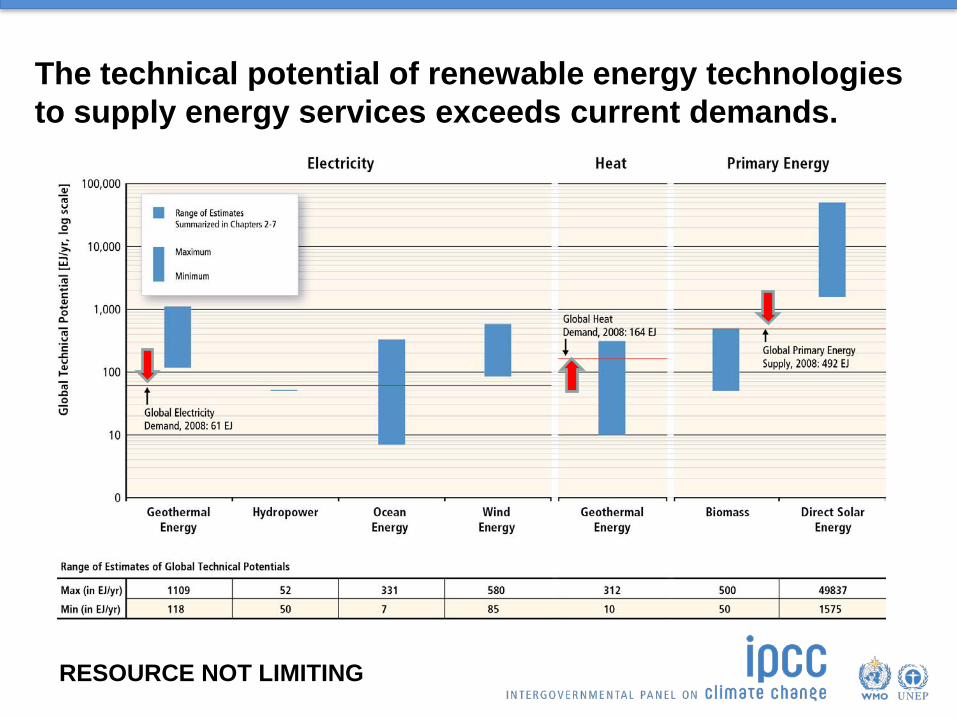
The technical potential of renewable energy technologies to supply energy services exceeds current demands.
RESOURCE NOT LIMITING

Review of literature studies for regional potentials published by 2009 (not fully comparable to the IPCC study but a visual comparison)
SRREN Figure 10.19
Widespread regional distribution from literature studies

Global RE primary energy supply from 164 long-term scenarios versus fossil and industrial CO2 emissions.
18
Source: SRREN SPM, Figure SPM.9
How much RE could be used in the future? What do current models say? Compared to baseline trajectories.

RE deployment increases in scenarios with lower greenhouse gas concentration stabilization levels.
Many renewable sources could supply low carbon footprint energy


RE costs expressed as Levelized Cost of Energy (LCOE) LCOE represents the cost of an energy generating system over its lifetime; it is calculated as the per-unit price at which energy must be generated from a specific source over its lifetime to break even. It usually includes all private costs that accrue upstream in the value chain, but does not include the down-stream cost of delivery to the final customer; the cost of integration, or external environmental or other costs. Subsidies and tax credits are also not included.

RE costs are still higher than existing energy prices, but in various settings RE is already competitive.
Binary cycle plant
Domestic pellet heating system
Palm oil biodiesel
Small scale CHP (steam turbine)

Lifecycle GHG emissions of RE technologies are, in general, considerably lower than those of fossil fuel options.

Ranges of terrestrial biomass for energy uses are broad. Complex systems with multiple uses and location resources and markets dependence
• Intensification of agricultural practices, e.g. grazing for pasture could release land in rain fed agriculture (~100 EJ) • Significant penetration of bioenergy would require substantial (~x2) global agricultural yield increases •Terrestrial resource potential assessments lack geo-hydrological modeling • Aquatic biomass potential may be substantial compared conventional terrestrial energy crops but very uncertain • Yield potential of cultivated of microalgae production can be several fold that of palm oil


Technical Advancements: For instance growth in size of typical commercial wind turbines.

RE costs have declined in the past and further declines can be expected in the future.

Biofuel feedstock and fuel costs have declined for sugarcane (and corn) and ethanol from both sources

An integrated RE-based energy plant in Lillestrøm, Norway, supplying commercial and domestic buildings

Few, if any, fundamental technical limits exist to the integration of a majority share of RE, but advancements in several areas are needed.
• Transmission and distribution infrastructure • Generation flexibility • Energy storage technologies • Demand side management • Improved forecasting and operational planning methods

Check the disappearing gray color: countries no RE-specific policy -- from top to bottom figures
Check the increase in orange to dark red: countries with RE-specific policies, targets or both from top to bottom figures
Enabling Policies Major Progress Drivers
2005
Early 2011

Conclusion (I) • High deployment rates are consistent with
increasing energy access for the world‘s poor population, improved security for energy supply and human well-being
• Renewables have exhibited technological progress which led to decreasing costs
• The costs of integration in an existing energy system are not quantified yet.
• Climate and renewable energy policies can be designed in a consistent way.

Conclusion (II): Dealing with unknown unknowns
• The existing scientific knowledge is significant and can already facilitate the decision-making process.
• The report has identified the most important known unknowns (e.g. future cost and timing).
• However, the unknown unknowns require the flexibility to learn from experience and to adapt to inconvenient and convenient experiences.
Report posted at: http://www.ipcc-wg3.de/publications/special-reports/

Analysis continues • 5th IPCC Assessment Report

Thanks • SERI/NREL Directors and mentors, staff of many areas I worked with:
Hub Hubbard, Duane Sunderman, Robert Stokes, Dan Arvizu, Dale Gardner and many others
• DOE/EERE Alison Goss Eng and many others • ACS – I&EC and Cellulose Divisions over time since 1980, ACS
Council, CEI, Nina McClellan, and many others • Hydrogen Technical Advisory Panel members, and NAS/NAC bilateral
US-China members • IPCC – SRREN colleagues and WGIII dozens • IEA Bioenergy Agreement and colleagues • University of Sao Paulo, State University of Campinas, Brazilian
government biofuels, S&T… • Professor P. Krumholz, Thesis Professor and successful industrialist in
Brazil for teching me to love the basic, applied, industrial, and global aspects of chemistry.