renewable energy futures: scenarios … of renewable energy are also described in scenarios that...
TRANSCRIPT
1
RENEWABLE ENERGY FUTURES: TARGETS, SCENARIOS, AND PATHWAYS Pre-Publication Draft (April 2007), forthcoming in Annual Review of Environment and Resources 2007 Copyright 2007 Annual Reviews Eric Martinot1, Carmen Dienst2, Liu Weiliang3, and Chai Qimin3
1 Tsinghua University, Tsinghua-BP Clean Energy Research and Education Center, Shunde Building, Beijing 100084, P.R. China; email: [email protected] 2 Wuppertal Institute, Dopersberg 19, 42103 Wuppertal, Germany; email: [email protected] 3 Tsinghua University, Institute for Nuclear and New Energy Technology, Energy Sciences Building, Beijing 100084, P.R. China; email: [email protected], [email protected] Abstract: Scenarios for the future of renewable energy through 2050 are reviewed to explore how much renewable energy is considered possible or desirable and to inform policy-making. Existing policy targets for 2010 and 2020 are also reviewed for comparison. Common indicators are shares of primary energy, electricity, heat, and transport fuels from renewables. Global, Europe-wide, and country-specific scenarios show 10% to 50% shares of primary energy from renewables by 2050. By 2020, many targets and scenarios show 20-35% share of electricity from renewables, increasing to 50-80% by 2050 under the highest scenarios. Carbon-constrained scenarios for stabilization of emissions or atmospheric concentration depict trade-offs between renewables, nuclear power, and carbon capture and storage from coal, most with high energy efficiency. Scenario outcomes differ depending on degree of future policy action, fuel prices, carbon prices, technology cost reductions, and aggregate energy demand, with resource constraints mainly for biomass and biofuels. INTRODUCTION.............................................................................................................................................2 SCENARIOS, MODELS, AND PARAMETERS .............................................................................................3 CURRENT AND FUTURE SHARES OF RENEWABLE ENERGY..............................................................6 GLOBAL SCENARIOS....................................................................................................................................8 EUROPE TARGETS AND SCENARIOS ......................................................................................................11 COUNTRY-SPECIFIC TARGETS AND SCENARIOS.................................................................................13 Country Policy Targets........................................................................................................................13 United States .......................................................................................................................................13 Japan....................................................................................................................................................14 China ...................................................................................................................................................14 Other Developing Countries ...............................................................................................................15 Country “100%” scenarios ..................................................................................................................16 MUNICIPAL TARGETS AND SCENARIOS ................................................................................................17 TECHNOLOGY PATHWAYS ........................................................................................................................17 Long-term Potentials and Growth Rates .............................................................................................18 Distributed Power Generation.............................................................................................................19 Hydrogen Combined with Renewables...............................................................................................20 Electric Vehicle Technologies .............................................................................................................20 Advanced Storage Technologies .........................................................................................................21 Nuclear Power and Carbon Capture and Storage................................................................................22 CONCLUSIONS .............................................................................................................................................22

2
INTRODUCTION Renewable energy has grown rapidly in recent years. Overall, renewables produced 16% of world primary energy in 2005. The share of world electricity was 19%, mostly from large hydropower and the rest from other renewables such as wind, biomass, solar, geothermal and small hydropower. In addition, biomass and solar contribute to hot water and heating, and biofuels provide transportation fuels. Although large hydropower is growing at modest rates of 1-2% annually, most other renewable technologies have been growing at rates of 15-60% annually since the late 1990s. It is this group of technologies that are projected to grow the fastest in the coming decades and make renewables a highly significant and potentially majority share of world energy (1-4). Attention has become more focused on the future of renewables for a variety of environmental, economic, social, and security reasons. There is a growing body of literature describing that future, including policy targets, socio-economic and technology scenarios, carbon-constrained scenarios, and future social visions. Policy targets for future shares of renewable energy are described for regions, specific countries, states/provinces or cities. Shares of renewable energy are also described in scenarios that show future energy consumption on the basis of analytical models or projections. Some scenarios project forward using assumed growth rates or future technology shares based on policy, technology, economic, or resource factors. Other scenarios project backwards from specified future conditions or constraints, such as limits to global carbon emissions, stabilization of atmospheric CO2 concentration, minimum or maximum energy consumption per capita, and sustainable land use. Scenarios can explore technologies, costs, policies, investments, emissions, time frames, social appropriateness, and proportions to fossil fuels and nuclear. Scenarios are part of the broader literature on renewable energy, which includes current technical-economic opportunities, resources, constraints and barriers of many forms, “integration” strategies, and policy experience and recommendations for the future (5-17). Many of the policy prescriptions found in this broader literature are common to policy frameworks or roadmaps that accompany renewable energy scenarios. Most studies show that geographic resources do not constrain aggregate amounts of renewables, with the possible exception of biomass and biofuels. “Renewable energy flows are very large in comparison with humankind’s use of energy. Therefore, in principle, all our energy needs, both now and into the future, can be met by energy from renewable sources” assert Johansson et al (18). Rather, cited constraints to renewables commonly include: (a) costs relative to conventional fuels; (b) intermittent and variable output relative to society’s need for constant energy flows; (c) the geography of where energy is needed versus where renewable energy is most available; and (d) an array of institutional, social, and economic barriers. This review focuses on global energy scenarios (19-36), Europe-wide energy scenarios (37-48), and scenarios for individual countries, including the United States (49-55), Japan (56-57), China (58-62), and other developing countries (63-69). Some global scenarios also give individual country cases. Europe scenarios show the largest amount of future renewables, which is no surprise as Europe currently leads the world in most metrics of renewables development, including investment, installed capacity, industry size, policy action, and use of policy targets (3-4). China targets and scenarios also project high growth and large amounts. Some of the reviewed studies focus primarily on the role of renewables, but most are not renewables-specific. Some works provide broader perspectives from which to understand the future

3
(70-72). Also relevant is literature on emissions scenarios, including the IPCC Special Report on Emissions Scenarios (73) and a greenhouse-gas emissions database with over 700 scenarios (74). The approach of this review is exploratory. It uses the scenario literature to ask the question: how much renewable energy can we expect or plan to have in the future? The scenarios presented were selected for being the most recent, prominent and comprehensive, although length and language limitations preclude many country-specific scenarios. The focus is on the results of scenarios – the lowest, moderate, and highest levels of renewables use in coming decades. By broadly examining both policy targets and scenarios together, something which is rare in the literature, targets can appear as “stepping stones” to scenario futures, and conversely scenarios can inform target-setting. SCENARIOS, MODELS, AND PARAMETERS McDowell (75) offers a typology of energy future studies, categorizing them as either descriptive or normative. Under descriptive studies, “forecasts” predict likely futures from current trends, using extrapolation and modeling; “exploratory scenarios” emphasize the drivers of possible futures, without specifying a predetermined end state; and “technical scenarios” explore technology possibilities and configurations, emphasizing feasibility and implications of different options. Under normative studies, “visions” elaborate desirable and plausible futures, emphasizing benefits; “backcasts” start with a predetermined end point—a desirable (or constrained) future—and then investigate pathways and technology configurations leading there; and “roadmaps” prescribe sequences of policies and measures. Most of the studies reviewed here are simply called “scenarios,” although they represent a balance among primarily technical scenarios, backcasts, and visions according to McDowell’s typology. Scenarios are an important tool for dealing with complexity and uncertainty about the future. They allow exploring alternative futures and can “provide insights to energy planners, influence the perceptions of the public and the energy policy community, capture current understanding of underlying physical and economic principles, or highlight key emerging social or economic trends.” note Craig et al (76). However, scenarios are not predictions. Attempts to forecast energy futures have historically underestimated the importance of surprise and uncertainties. Rather, scenarios could be seen as “if…then” queries: if policies accelerate the growth of renewables, what is the difference between situations with and without policies? If renewables costs decline, how will markets shift investment patterns? If CO2 emissions should be stabilized, what combinations of renewables and other technologies will achieve stabilization? These questions must be answered under a set of conditions, interrelationships, and/or constraints for population, economic growth, energy demand, technology changes, technology and fuel costs, environmental emissions, and changes in the structure of the economy. Modeling tools are commonly used to carry out scenario analysis, with a range of software tools available (77-79). Categories of models include techno-economic, partial and general equilibrium, simulation, optimization, and end-use accounting (78-79). The entire economy may be modeled, or just the energy system or energy demand. The IEA World Energy Model, used for the World Energy Outlook (21, 26) has been refined over more than a decade and comprises 16,000 equations defining interrelationships among energy, economy, technology, investment, resources, and environment. MARKAL is a common
4
cost-optimization tool that identifies least-cost mixes of energy technologies and fuels to meet energy demand, within specified constraints (22, 66, 68). LEAP is a common accounting tool for energy planning that tracks energy consumption, conversion, and production under a range of assumptions (62, 80). European Commission studies use Green-X, PRIMES, and POLES, among others (20, 37-39, 46). Four US studies use NEMS and variants (51-55). The Greenpeace (19) scenarios use MESAP/PlaNet and MESSAGE together. IPCC (73) uses AIM, MINICAM, MESSAGE, MARIA, ASF, and IMAGE models, and reports separately on the results of each applied to common “storylines,” with different results depending on model used. In general, the modeling approach has a significant impact on both data requirements and results (but beyond the scope of this article to explore). Beyond the models themselves, many consider scenario construction to be something of an art, requiring skill at making good simplifying representations of social and economic dynamics, not just writing energy-balance equations or characterizing technological change (81). From this perspective, scenario construction is best done collectively, drawing upon diverse perspectives, as Shell and the World Business Council for Sustainable Development have done (25, 27, 32, 35). Most scenarios use parameters that include some combination of population, GDP, energy intensity and demand, fuel costs, carbon prices, technology costs, and degree of policy action. These parameters could be considered the “drivers” for renewable energy and other energy technologies. Parameters may be based on “storylines” of socio-economic conditions, expectations about technological change, policy drivers, projected growth rates, or other considerations. Below are some parameters from the global and Europe scenarios. Population. The IEA World Energy Outlook (21) projects 8.1 billion people by 2030, with an average population growth of 1%/year through 2030, although population grows faster at 1.1% in earlier years (2004-2015) and slows down to 0.8% in later years (2015-2030). Many studies use and extend these figures to 2050. By 2050, a common projection is about 9 billion in several studies (19, 22, 25, 27). IPCC (73) scenarios give a range from 8.3 to 11.3 billion in 2050, with most scenarios projecting about 9 billion. For Europe, most recent scenarios share similar assumptions, with population constant or marginally increasing to 470 million by 2030, up from 453 million in 2000 (38). After 2030, some scenarios give a decrease to 430 million in 2050 (20, 45). GDP. The IEA World Energy Outlook (21) projects world GDP will grow an average 3.4%/year from 2004 to 2030, compared with 3.2% from 1980 to 2004. But GDP growth falls progressively, from 4% (2004-2015) to 2.9% (2015-2030). China, India, and other developing countries are expected to continue to grow faster than these averages. Per-capita GDP grows from $9,250 to $17,200 and total GDP increases 2.4-fold, from $58 to $140 trillion (2004-2030; 2005$ PPP). Many other energy scenarios use the IEA projections. Greenpeace (19) assumes a 3.4-fold increase to 2050 (2.7%/year average). IPCC (73) scenarios show world GDP increasing between 1.5-fold and 4.8-fold from 1990 to 2050. For Europe, most scenarios project continued modest growth of around 2% (20, 38). Energy demand and intensity. Energy intensity reflects both changes in the structure of the economy and improvements in energy efficiency. In the IEA ETP (22) “ACT Map” scenario, energy-efficient technologies reduce global energy consumption by 24% in 2050 compared to the reference scenario. The

5
GWEC (23) “high efficiency” scenario projects 39% lower electricity consumption in 2050 compared to a reference scenario. In the Greenpeace (19) “revolution” scenario, energy intensity decreases 3-fold due to energy efficiency, and world energy demand in 2050 is about the same as 2003 despite economic growth. The German Advisory Council (28) scenario also shows global energy intensity falling 3-fold, but still results in a doubling of energy demand by 2050. Other studies show energy intensity declines of 2-fold to 4.8-fold by 2050 (25, 73). Overall, projected world energy consumption by 2050 ranges from 560 to 1600 EJ, compared to 480 EJ in 2004. In Europe scenarios, projected energy growth is lower, with primary energy 55-90 EJ by 2030, compared to 73 EJ in 2005. Fossil fuel and carbon prices. Scenarios differ in assumptions about fossil fuel prices. IEA scenarios show oil prices remaining in the $48-62 (per barrel) range through 2030, with natural gas prices tracking due to continued oil-price indexation. In contrast, the Greenpeace (19) scenario expects oil prices to reach $95 by 2030 and $110 by 2050. EIA projects $54 in 2025, revised from $33 projected a year earlier (51). Scenarios also differ in assumptions about carbon prices, with common values $7 to $15 (per ton CO2) in 2050 and high values up to $50 (19, 22). Europe scenarios project a wide range of carbon prices under the European Emission Trading Scheme, from €5 to €20 (per ton CO2) under low or least-cost scenarios (37-38, 44), and up to €65 under another (44). Thus carbon prices have become a “wildcard” in Europe scenarios (prices were fluctuating greatly in Europe in 2005/2006). (Above prices 2004/2005 indexed.) Renewable energy technology costs. IEA studies have projected cost reductions to 2010 and 2025 (13-15). Most policy-intensive scenarios show continued cost reductions through 2050. IEA ETP (22) projects that solar PV electricity costs will decline to 6-30 cents per kWh (from 18-50 cents today); onshore wind to 3.5-20 cents (from 4-22 cents); and offshore wind to 6-18 cents (from 6.6-22 cents). Small and large hydro, biomass, and geothermal decline slightly. Others project declines of wind power to 3.5-5 cents per kWh, solar PV to 5-9 cents, and concentrating solar thermal power (CSP) to 5-8 cents (19, 23). ESTTP (41) shows solar heating costs capital costs per kW-thermal declining almost 3-fold, from €1100 to €400 (2005-2030). IEA ETP (22) shows reduced biofuels costs from the introduction of cellulose-to-ethanol technology and increased crop yields under one scenario. Some scenarios include “learning curves” in their models, which project future cost reductions based on past history and cumulative technology production over time (82). Carbon stabilization and emissions constraints. A number of scenarios set atmospheric CO2 stabilization levels of either 450 ppm (19, 28), 500 ppm (20) or 550 ppm by 2050 (25, 30). Other scenarios constrain cumulative CO2 emissions by 2050, starting from a base year, or reduce annual emissions relative to 1990 levels. For example, one China scenario constrains cumulative carbon emissions from China to 66 Gt between 1995 and 2050 (59). The Greenpeace (19) scenario constrains global annual carbon emissions to 11 Gt CO2 by 2050. A carbon constraint of 80% of 1990 emissions by 2050 appears in Dutch and German scenarios (83-84). Policy action. There is wide recognition that policies have underpinned renewable energy development over the past decades, and that the need for policies will continue well into the future. Therefore, both the degree of policy action and the description of policies are central to scenarios. Reference scenarios typically envision low levels of policy action. The IEA WEO (21) reference scenario “does not take into account possible, potential, or even likely future policy actions” and thus shows “how energy markets would
6
evolve if governments do nothing beyond what they have already committed.” In contrast, the “alternative policy” scenario “analyses the impact of a range of policies and measures that countries are considering adopting or might reasonably be expected to adopt.” Existing policy targets can serve as points of departure for higher levels of policy action and higher future targets. This is particularly true in scenarios for Europe, where considerable political attention is currently directed to policy targets. Reference scenarios tend to project less than full implementation of targets, while policy scenarios envision full implementation and more, and continued increases in targets and mandates. Scenarios envision a wide range of new and strengthened policies (8-11). Electric power policies include feed-in laws, portfolio standards, guaranteed grid access, net metering, and distributed generation policies. Biofuels policies include blending mandates and tax exemptions. Building policies include integration of solar hot water and solar PV into new construction. Economic incentives include tax credits, subsidies, and tax exemptions. Research and development policies (leading to reduced technology costs) include direct funding, technology cooperation agreements, joint ventures, and demonstration programs. Financing policies include loans and grants. Other policies include directing international development assistance to renewables, reducing subsidies for fossil fuels and nuclear power, incorporating external costs into energy prices, removing market and institutional barriers, strengthening human resources, restructuring or liberalizing energy markets, and enacting appliance, building, and vehicle efficiency standards and other efficiency measures. Some Europe scenarios also envision strengthening the European Emission Trading Scheme and carbon pricing, and enacting post-Kyoto emission reduction targets. CURRENT AND FUTURE SHARES OF RENEWABLE ENERGY Targets and scenarios tend to be summarized in terms of the share of primary energy, electricity, or transport fuels from renewables, although there are alternative indicators and portrayals found in the literature, some discussed later. However, one quickly confronts a fundamental but mostly unacknowledged problem: the term “share of primary energy from renewables” is ambiguous and causes confusion because there are actually four different ways to define the term (see Table 1). Each way is legitimate, but uses a different accounting method. In 2004, renewables provided 80 EJ of global primary energy (16.5% share) according to the “BP method,” but only 60 EJ (13% share) according to the “IEA method” if traditional biomass is included. Excluding traditional biomass, the numbers become 36 EJ (8.2% share) according to the BP method and 16 EJ (3.8% share) according to the IEA method. (There are also other accounting differences between BP and IEA statistics of world primary energy.) BP uses its method in its annual Statistical Review of World Energy (1). The BP method is also used in the REN21 Renewables Global Status Report (3-4) and in other prominent portrayals of renewables in the global energy balance, such as the 2000 World Energy Assessment (6) by the UNDP (which later changed to the IEA method for its 2004 update (5)), and has been used by analysts in the literature going back at least a decade (55, 67, 85). Most agencies and governments around the world use the IEA method. Although the IEA method appears to be much more common in the scenario literature, authors often don’t explain which method is used. This causes incompatibility across scenarios and makes reliable comparisons difficult if not impossible. It also distorts the numbers. The share of renewables for a scenario using the IEA method will become significantly higher if the BP method is applied.

7
The basic accounting problem is how to count the primary energy associated with renewable electricity. For electricity from fossil fuels, primary energy is the energy input to a power plant to generate the electricity. For electricity from nuclear, the convention has been to count the nuclear heat input (equivalent to fossil fuel primary input) to generate the electricity. Because renewables (except biomass) do not require a “power plant,” the IEA method simply counts the electricity itself as primary energy. The BP method counts the “equivalent primary energy” of fossil fuels needed to generate the electricity. The difference between the two methods is the energy loss (waste) in a power plant, which is usually about two-thirds of the energy input. The correction required is to multiply renewable electricity by the inverse of typical power plant efficiency to get equivalent primary energy; BP uses a correction factor of (1/0.38), or 2.6. A simple way to understand the issue is to compare hydro and nuclear in reported share of primary energy. In 2004, hydro and nuclear produced roughly equal amounts of electricity worldwide, 2740 TWh for nuclear and 2810 TWh for hydro (86). BP reports the share of world primary energy from nuclear as 6.1% and from hydro as 6.2%. The IEA reports the share of primary energy from nuclear as 6.5%, equivalent to BP given other accounting differences (e.g., different assumed conversion efficiencies and inclusion of traditional biomass). But the IEA reports the share from hydro as only 2.2%. This 2.2% share for hydro is cited widely (5, 87). When compared with 6.5% from nuclear, it appears that nuclear contributes three times as much useful value to the energy system as hydro, when if fact the useful value (kWh produced) of nuclear and hydro is exactly equal. Thus, the IEA method perceptually distorts the contribution of hydro to the world energy system. This is also true for wind and solar which fall into the same analytical category, but not for biomass where physical energy inputs can be counted similar to fossil fuels. Geothermal is sometimes treated like nuclear. (Note: this review reports renewables shares as given in source material without correction or notation as to whether based on IEA or BP method. A reader may discern the method used in some scenarios with a close reading, and more likely would be correct presuming the IEA method in ambiguous scenarios.) Another problem in reporting primary energy shares of renewables concerns the treatment of traditional biomass in developing countries. Worldwide, traditional biomass represents about 9% of primary energy consumption (3), yet many scenarios do not specify whether traditional biomass is included or excluded, making it difficult to judge the share and growth of other forms of renewables. Further complicating the picture is that IEA statistics do not separate traditional biomass from “modern” biomass (for large-scale power and heat, gasification, etc.), so primary energy shares of renewables reported by the IEA either include traditional biomass, or exclude all forms of biomass (called “combustible renewables and waste”) (88). Some authors have advocated future targets and scenarios for “new renewables” only, excluding traditional biomass, arguing that at least a portion of traditional biomass is not “sustainable” (because it can lead to deforestation and can also be a major cause of indoor air pollution, among other things), and therefore should not be considered “renewable” (89). (Note: this review reports renewables shares as given in source material, without any correction for traditional biomass, and mostly without notation as to whether traditional biomass is included.) Share of primary energy remains the dominant indicator for most scenarios (Table 2). Four alternative indicators are gaining increased use in studies and policy discussions:

8
1. Share of final energy. Few statistics are available for this indicator and few scenarios use it. (Scenarios often show share of final energy by end-use sector, and sometimes final biomass or solar heat use, but not renewable shares of final electricity consumption.) This indicator counts the energy value of electricity equally for all forms – fossil, nuclear, and renewables – but in statistical practice this is difficult to do. 2. Share of electricity. This indicator is common in many scenarios, and statistics are available for many countries (Table 3). In 2005, renewables provided about 19.5% of world electricity production of 17,500 TWh (1-4). Large hydro accounted for about 16.2% and other renewables about 3.3%. Some scenarios separate large hydro from “new renewables,” allowing sharper focus on future increments of “new renewables,” which are growing much faster than large hydro (66, 80). 3. Share of low-temperature heat. This indicator is rarely used in scenarios but is becoming more important as biomass, solar, and geothermal increase their contributions to heating and hot water. A surrogate is the thermal capacity installed, expressed as GWth. No statistics are available for world total, this indicator exists for a few countries. Europe’s share is about 7%. 4. Share of transport energy/fuels. This indicator is becoming more common in scenarios as biofuels production has grown rapidly in recent years and new policy targets and mandates have been enacted (Table 4). No statistics are available for world total. Europe’s share is about 1%. GLOBAL SCENARIOS Ten of the most prominent and recent global scenarios are described below. These are summarized in Tables 2-4, along with several other global scenarios reviewed (29-31, 36). 1. The International Energy Agency World Energy Outlook 2006 (21) provides an often-cited reference scenario for 2030 that gives 720 EJ world primary energy (up from 480 EJ in 2004), of which renewables are 100 EJ (14%). Electricity in 2030 is 33,800 TWh (up from 18,200 TWh in 2005), of which renewables are 7,100 TWh (21%). The “alternative policy scenario” includes additional policies to support renewables that are contemplated or expected, but not yet enacted. This scenario shows renewables achieving 16% of primary energy and 26% of electricity by 2030, with gains in biomass, wind, solar, and geothermal. 2. The International Energy Agency Energy Technology Perspectives (22) gives several scenarios that go beyond the World Energy Outlook and that differ on pace of cost reductions and technology development. The “ACT Map” scenario shows aggressive policy action, energy intensity reductions, and technology cost reductions through deployment and learning. Biofuels becomes a viable transportation fuel with increased crop yields and commercial cellulose-to-ethanol technology. Carbon capture and storage (CCS) becomes viable and nuclear power increases significantly. Three variations of “ACT Map” are a low renewables case, with slower cost reductions, a low-nuclear case, and a no-CCS case that assumes CCS remains commercially unavailable. Under “ACT Map,” the share of primary energy for renewables is 24% by 2050, compared to 11% in the reference scenario, and the share of electricity is 31%, compared to a 15% reference. A separate “TECH Plus” scenario envisions even higher technology progress for renewables, nuclear,

9
hydrogen fuel cells, and advanced biofuels, with renewables share of primary energy reaching 30% by 2050. 3. The German Advisory Council on Global Change (28) “exemplary path” scenario achieves 450 ppm CO2 atmospheric stabilization. The scenario places several additional constraints on energy beyond carbon, including restrictions on land use for biomass energy crops, limits to urban air pollution levels, avoidance of nuclear power, and achieving a minimum economic output per capita for all countries. This scenario shows 620 EJ of renewables in 2050 (up from 80 GJ total in 2004), of which 288 EJ is solar PV, 135 EJ is wind, and 100 EJ is modern biomass . Renewables reach 50% of primary energy by 2050. 4. A World Business Council on Sustainable Development (25) scenario envisions 50% of electricity from renewables by 2050. Nuclear power triples by 2050, and carbon capture and storage from coal becomes commercial after 2025, such that by 2050, half of world coal power generation uses CCS. Hydrogen becomes a fuel for vehicles after 2025, attaining a 25% share of vehicle transport fuel by 2050. Solar PV grows by an sustained annual average of 20% through 2050, spurred by distributed generation and local energy storage, to become 15% of world electricity consumption – one of the highest estimates for solar among global scenarios. Wind and geothermal grow by an annual average of 11% through 2050, to increase 160-fold, while hydropower doubles. 5. Shell produced three scenarios, with the original 1996 “sustainable development” scenario showing 50% of world primary energy from renewables by 2050 (35). That scenario was widely cited for a number of years. Following that, Shell’s “spirit of a new age” in 2001 showed a future energy system emerging by 2030 based on hydrogen and fuel cells that limits the growth of renewables (with hydrogen initially produced from fossil fuels using carbon sequestration) (32). Renewables attain a 28% share of primary energy by 2050. Complimenting that scenario was “dynamics as usual,” with a continuing dominant role for electricity, hybrid vehicles, and advanced biofuels, and renewables attaining a 33% share of primary energy. Then in 2005, “low trust globalization,” “open doors” and “flags” scenarios were envisioned, with varying fortunes of globalization, regulation, and markets, and with renewables reaching either 280 or 330 EJ by 2025 (27). 6. The Greenpeace (19) “revolution” scenario envisions the complete phase-out of nuclear power, drastically lower energy demand through energy efficiency improvements, no carbon capture and storage, and still attaining a constraint of 450 ppm CO2 atmospheric stabilization. The result is a 50% primary energy share for renewables by 2050 and aggregate energy demand in 2050 that is the same as 2003, even as population increases 1.4-fold and GDP increases 3.4-fold. Electricity share is 70% renewables, with the rest mainly natural gas. The share of electricity from coal falls to 9% by 2050, from 35% in 2003. The study assumed annual growth rates for wind power of 26% through 2010, then 20% (2010-2020), 7% (2020-2030), and then below 5%. Growth rates of solar PV are 36% through 2010, then 25% (2010-2020), 14% (2020-2030), 7% (2030-2040), and then below 5%. 7. The Global Wind Energy Council (23) “advanced” scenario envisions aggressive policies and cost reductions leading to 34% of world electricity from wind by 2050 in a “high efficiency” case where electricity consumption in 2050 is only 1.7-fold higher than 2003. (Without high efficiency, the “advanced” scenario for 2050 shows a 21% share of electricity and world electricity consumption 2.8-fold higher than 2003.) Under the “advanced” scenario, by 2020, wind power costs fall to US 3.5 to 4.5 cents/kWh at good

10
sites and installed capacity reaches 1000 GW (from 75 GW in 2006). Installed capacity exceeds 2000 GW by 2030 and 3000 GW by 2050. 8. The EC WETO (20) study developed “carbon constraint” and “hydrogen” scenarios. The “carbon constraint” scenario works backward from stabilizing atmospheric CO2 concentration at 500 ppm by 2050, using renewables, nuclear power, and carbon capture and storage. Early action is assumed in developed countries, later action in developing countries. The “hydrogen” scenario assumes a deliberately optimistic series of technology breakthroughs that increase cost-effectiveness. World primary energy reaches 920 EJ in the reference scenario and about 800 EJ in both “carbon constrained” and “hydrogen’ scenarios. The reference scenario gives 15% primary energy and 21% electricity from renewables by 2050, which increases to 18-20% primary energy and 30% electricity in the “carbon constraint” and “hydrogen” scenarios. 9. The International Institute for Applied Systems Analysis and the World Energy Council (33) developed six scenarios in the 1990s showing different levels of global economic development and energy use. Scenarios A1-A3 are high economic growth, with A3 the most sustainable case showing a shift to renewables, nuclear, and natural gas. Scenario C is high growth for developing countries, along with carbon and energy taxes that promote renewables and efficiency; C1 sees a phase-out of nuclear power, while C2 sees development of the next generation of socially-acceptable reactors, which limits renewables. Primary energy share from renewables ranges from 22% to 40% by 2050 among the six scenarios, with scenario C1 the highest. 10. The IPCC Special Report on Emissions Scenarios (7, 73) used six different models and four “storylines,” resulting in 40 scenarios. The scenarios differ in population, economic development, and energy intensities, but also differ because different models produce different results for the same conditions. The A1 storyline envisions rapid economic development equalizing rich and poor, while A2 sees less growth and slower change. Storylines B1 and B2 envision high environmental consciousness, and B2 is policy intensive, with policies and business influenced by environmental concerns and movement towards local self-reliance and community. Total primary energy ranges from 640 to 1600 EJ by 2050 and renewables range from 70 EJ to 440 EJ. Primary energy share of renewables is highest for A1T and B1 scenarios, 16-35%, with large technological change and reductions in renewables costs for the A1T scenario. In summary, by 2050, renewable energy varies from 70 EJ to 600 EJ primary energy according to the global scenarios reviewed (Figure 1). This compares with a range of total primary energy from the same scenarios of 600 to 1600 EJ. Global scenarios for share of primary energy by 2050 could be grouped into categories low (15%), medium (25-30%), and high (40-50%) (Table 2). For share of world electricity by 2050, reference scenarios show 15%, medium scenarios 30-40%, and high scenarios 50-80% (Table 3), with total generation from renewables ranging from 7,200 to 37,000 TWh (Figure 2). The few scenarios giving share of transport energy from biofuels in 2050 show a wide range, from a low of 3% to a high of 25% (Table 4). The IEA ETP (22) reference scenario is one of the lowest, with 11% primary energy share by 2050. In contrast, several global scenarios show a 50% share by 2050, including Shell’s “sustainable development,” Greenpeace’s “revolution,” the Germany Advisory Council’s “exemplary path,” WBCSD’s scenario, the European Renewable Energy Council’s “advanced international policies scenario” (by 2040), the Aitken et al (30) “10%/20%/50%” scenario (with 10% by 2010 and 20% by 2020), and the Stockholm Environment Institute and Global Scenario Group’s “great transition” (31). One of the earliest was the Johansson et al

11
(36) “renewables-intensive global energy scenario,” which envisioned, back in 1993, a 46% share by 2050. Other global scenarios fall between the IEA reference and these “50%” scenarios. CO2 emissions by 2050 in the global scenarios range from 10 to 100 Gt (per year). (In 2004, CO2 emissions were about 26 Gt from fossil fuels.) The low and reference scenarios show emissions in the range 60-100 Gt, while the “medium” scenarios show 20-30 Gt, and the “high” scenarios (19, 25) show 10-12 Gt. For the IEA ETP (22), emissions are 58 Gt for the reference scenario, 26 Gt for “ACT Map,” and 21 Gt for “TECH Plus.” IPCC (73) scenarios show a wide range of emissions, from 30 to 100 Gt, corresponding to total energy consumption from 640 to 1600 EJ, and a range of renewable energy shares from 9% to 35%. In the EC WETO “carbon constraint” scenario, emissions stabilize between 2015 and 2030 and then decrease, but by 2050 are still 25% above 1990 levels. EUROPE TARGETS AND SCENARIOS Renewable energy in Europe is closely connected to issues of climate change, security of supply, import dependency, market competitiveness, sustainability and future energy development. Directives of the European Commission have established aggressive policy targets for shares of primary energy (12%), electricity (21%), and transport fuels (5.75%) from renewables by 2010, as well as a solar hot water target (100 million m2 of collector area). All EU countries also have individual targets for share of electricity, ranging from 3.6% to 78%, that together should achieve the 21% EU target. The increases in electricity shares from 1997 are typically 5-10% for most EU countries. Several countries also have targets for share of primary energy by 2010, including the Czech Republic (5-6%), France (7%), Germany (4%), Latvia (6%), Lithuania (12%), Poland (7.5%), and Spain (12.1%). During 2005/2006, the European Commission prepared a “green paper,” “roadmap,” and “biomass action plan” on strategies to achieve these targets and go beyond them, proposing targets of 20% primary energy and 10% transport energy by 2020 (3-4, 90-95). In 2005/2006 there were a large number of new energy scenarios published for Europe, primarily for 2030, including scenarios by the Directorate-General for Energy and Transport (DG-Tren) (38-39), Directorate-General for Environment (DG-Env) (37), the European Parliament ITRE (40), the Greens/EFA group of the European Parliament (43), the European Environment Agency (44), Greenpeace (45), WWF/Wuppertal (47), and Fraunhofer Institute (46). These add to many other Europe-wide and individual country scenarios (83-84, 96-100). Europe reference scenarios expect that current trends in energy and economy will remain nearly the same, including existing barriers and grid restrictions. Climate policies, energy efficiency improvements, and technology developments are included, but policy targets may not be met and post-Kyoto measures are not taken. Primary energy grows very little, to around 80 EJ by 2030, compared to 73 EJ in 2005, due to improvements in energy intensity, even as GDP continues to increase. The share of renewables grows from around 7% in 2005 to 11-13% by 2030 according to most scenarios (38-40, 43, 46-47). Electricity share increases modestly from 14% in 2005 to 18-29% in 2030. Policy-intensive “alternative” scenarios are featured in most studies. These generally fall into categories of “high efficiency,” “high renewable energy” and “combined energy efficiency and renewable energy”

12
depending partly on the mix of policies that primarily promote efficiency, renewables, or both. DG-Tren (38-39) considers all three separately, while ITRE (40) considers two of the three and most studies only focus on the combined scenario. The high efficiency scenarios show less energy demand but also smaller shares of renewables, while the opposite is true for the high renewables scenarios. Combined scenarios have lower demand and higher renewables. Stable conditions for investments and technology development and gains in energy intensity result from full implementation of relevant EU directives and policies, along with active national policies, including targets, research and development, market incentives, training, carbon pricing, and international climate policy. These scenarios can be considered “high” alternatives for renewables with ambitious strategies and policies. Under the alternative scenarios, renewables reach a primary energy share of 20-24 % by 2020 in the FORRES (46), WWF (47), DG-Env “20%” (37), and EREC (48) scenarios. By 2030, renewables reach 17-21% under the “medium” EEA (44) and IEA (21) scenarios and 26-39 % under the “high” DG-Tren (38-39), VISION (43) and ITRE (40) scenarios. By 2050, renewables reach 50% under the Greenpeace (45) scenario. Primary energy demand decreases by 13-18 % by 2030 in most scenarios, and by 36 % by 2050 under the Greenpeace scenario. Electricity share in alternative scenarios increases from 14% in 2005 to 30-60% by 2030 in the alternative scenarios. By 2050, renewables electricity share increases to 45% under the WBCSD (25) scenario (mostly wind and solar power) and to 70% under the Greenpeace (19) scenario. (Despite the higher share, the Greenpeace scenario does not have significantly more total power generation from renewables than some of the other scenarios, because total electricity demand is lower in the Greenpeace scenario; see Figure 2.) Studies differ greatly in projected shares of biofuels. There are accounting problems that make some cross-scenario comparisons incompatible, as some studies use share of total transport-sector energy and some use share of road transport fuels. ITRE (40) and VISION (43) reference scenarios give 6-7 % of total transport-sector energy demand by 2030, and 14-26 % in the alternative scenarios. WBCSD (25) puts biofuels share at 21% in 2050. For low temperature heat production, the current share of renewables in Europe is 6-7%, about 90% of that from biomass (92). Scenarios don’t provide many specific figures for low temperature heat, but some put the share at 14-20 % by 2030. Scenarios show that renewables in the heating sector (particularly biomass and solar) are important to achieving high shares of primary energy under alternative scenarios. The European Solar Thermal Technology Platform (41) envisions that 50% of Europe’s low-temperature heating, hot water, and cooling needs could be met by renewables by 2030. One goal of the Platform is a new building standard by 2030 that would mean 100% solar heating for new buildings and 50% solar heating retrofits for existing buildings. The EC WETO (20) “hydrogen” carbon-constrained scenario for Europe is different than most other alternative scenarios. A deliberately optimistic series of technology breakthroughs increase the cost-effectiveness of hydrogen technologies and lead to significant hydrogen use in transport. Nuclear energy is used to produce hydrogen starting after 2030, and provides one third of total energy demand by 2050. Renewables produce almost half of the hydrogen by 2050, although renewables primary energy share by 2050 remains a modest 20%.
13
Radically different Europe scenarios also exist in the literature, some focused on complete phase-out of nuclear power, or conversely high levels of nuclear, some focused on CO2 stabilization (e.g., at 450 ppm) or limits to per-capita CO2 emission (e.g., 3 tons CO2/person in 2050), some with dramatically higher energy prices, some with high carbon-market prices. Renewables generally increase with decreasing nuclear under carbon-constrained scenarios and also with higher energy and carbon prices (37, 40, 44-45), CO2 emissions in Europe are 3.8 to 4.5 Gt by 2030 in reference scenarios and 2.1 to 2.6 Gt in alternative scenarios. (In 2005, EU-25 emissions were 3.8 Gt from fossil fuels.) For 2050, Greenpeace (19) gives 5.3 Gt in the reference and 1.2 Gt in the “revolution” scenario, while WWF (47) gives 4 Gt in the reference and 2.5 Gt in its policies scenario. COUNTRY-SPECIFIC TARGETS AND SCENARIOS Country Policy Targets By 2006, more than 50 countries and 32 states/provinces around the world had some type of policy target for future shares or amounts of renewable energy (3-4). Most targets are for 2010 or 2020, serving as “stepping stones” to longer-term scenarios. Targets exist at national, state/provincial, and municipal levels. Most targets are for shares of primary energy, electricity, and transport fuels (some of these are shown in Tables 2-4). Many individual countries are also enacting roadmaps or strategies in conjunction with targets, such as New Zealand and South Africa (101, 102). Some countries have opted to target specific amounts of added renewable power capacity by a future year (there is usually no accompanying figure for implied share of renewables). Prime examples in this category are Brazil (3.3 GW to be added by 2006), the Dominican Republic (0.5 GW added by 2015), India (10% of new capacity additions through 2012), and the Philippines (4.7 GW added by 2013). Other countries have policy targets for specific amounts of final energy (electricity and/or heat) from renewables. Examples are Australia (9.5 TWh/year by 2010), New Zealand (8.3 TWh/year by 2012), Norway (7 TWh/year by 2010), South Africa (10 TWh/year by 2013), and Switzerland (3.5 TWh by 2010). Like Europe, China has a comprehensive set of targets. The overall target is 16% of primary energy from renewables by 2020 (up from 7.5% in 2005). There are also targets for individual technologies by 2020, including hydro power (300 GW), wind and biomass power (30 GW each), solar PV (1.8 GW), solar hot water (300 million m2), biofuels (15 million liters/year), biogas and biomass gasification (44 million m3/year), and biomass pellets (50 million tons/year). (3-4). All technology targets reflect 3-fold to 20-fold increases from 2005 in the amount of renewable energy or capacity. United States The EIA Annual Energy Outlook (51) projects primary energy in the U.S. will increase by 1.1%/year through 2030 in the reference scenario. By 2030, renewables’ share will be 8% (10-11 EJ total), compared to 6% in 2004 (6 EJ total). In a “high economic growth” scenario, renewables remain about the same as the

14
reference scenario. Higher amounts of renewables from previous years’ projections are the result of higher expected energy prices, more policy action, technology improvements, and lower energy consumption. The 8% share is reached ten years earlier in the Interlaboratory Working Group’s “advanced” scenario (55). The EIA projected electricity generation share for 2030 remains constant at 9% (560 TWh) in the reference scenario and increases to 11% in a “high renewables” scenario (640 TWh), compared to a 9% share in 2004 (360 TWh). The “high renewables” scenario projects greater use of wind, biomass, and geothermal. Other scenarios show much higher shares. Both the Interlaboratory Working Group (55) and Clemmer et al (53) show a 20% share by 2020. Kutscher et al (49) say that 50% of electricity from renewables by 2030 is possible with lower demand from energy efficiency, but even a 40% share is possible for the EIA reference scenario. Similarly, WBCSD (25) shows renewables’ electricity share (for both U.S. and Canada) going from 17% in 2002 to 50% in 2050. Greenpeace (50) shows an 80% share by 2050, as renewables power capacity grows 8-fold from 110 GW in 2004 to 890 GW in 2050. CO2 emissions in 2050 in the Greenpeace study are 8.4 Gt in the reference scenario and 1.6 Gt in the “revolution” scenario (U.S. emissions in 2003 were 5.6 Gt CO2). The “revolution” scenario shows a dramatic reduction in per-capita CO2 emissions from 19.2 tons/person in 2003 to 3.7 tons/person by 2050. Kutscher et al (49) show about 2 Gt CO2 reduction possible by 2030 from greater renewables, plus another 2.5 Gt from efficiency, reducing CO2 emissions in 2030 to 3.6 Gt, compared to a reference scenario of 8 Gt . Japan COMPASS (56) developed a “revival” scenario which focuses on economic and environmental sustainability under continued economic growth. Total primary energy in 2030 is only 5% higher than 1990 levels, primary energy share from renewables reaches 17% (up from 3.4% in 2004), and electricity share reaches 33% (up from 10% in 2005). Beyond “revival,” a “switchover” scenario envisions a new paradigm of reduced consumption and community-orientation, coupled with local use of renewable energy. In the “switchover” scenario in 2030, total primary energy is 30% below 1990 levels, primary energy share from renewables reaches 22% and electricity share reaches 41%. This COMPASS reference scenario is almost identical to the Long-Term Energy Supply and Demand Outlook of the Ministry of Economy, Trade and Industry (MITI). For the reference scenario, primary energy increases by 20% over 1990 levels, primary energy share from renewables is 6%, and electricity share is 11%. This is similar to the IEA WEO (21) reference scenario for Japan. Two other studies also go well beyond the MITI reference scenario. WBCSD (25) envisions large-scale development of biomass, wind, and distributed solar PV, with 50% of electricity from renewables by 2050. NIES (57) gives two scenarios for Japan: “Doraemon,” which envisions technology breakthroughs and continued centralized energy production, and “Satsuki and Mei,” which emphasizes decentralization, community, and self-sufficiency. The first scenario projects mostly nuclear, hydrogen, and carbon-capture and storage, with about 25% of primary energy from renewables by 2050. The second scenario projects much greater use of renewables, almost 50% of primary energy by 2050, particularly from biomass and solar PV. China

15
The China Energy Research Institute and Lawrence Berkeley Laboratory considered three scenarios to 2020 for China, all with the same GDP growth, but differing in urbanization rates, technology development, and policies for energy supply and efficiency, among other factors (62). The “ordinary effort” scenario shows less priority on environment than implied by ongoing and expected government plans, while the “promoting sustainability” scenario fulfills expectations. A “green growth” scenario represents extra effort in energy efficiency and renewables. By 2020, energy consumption doubles to 90 EJ (from 42 EJ in 2000) under “ordinary effort,” while energy consumption only rises to 67 EJ under “green growth.” Renewables power capacity under “green growth” is 200 GW of large hydro, 30 GW of wind power, and 40 GW of small hydro power, comparable to actual policy targets enacted. The Chinese Task Force on Energy Strategies and Technologies “advanced technology” scenario relies heavily on coal gasification, which expands from 0% in 2000 to 60% of primary energy by 2050 (accompanied by a reduction in coal combustion to only 8%) (59, 61). At the same time, primary energy share of renewables increases from 7% to 18%. Because of energy intensity improvements, while the economy expands 13-fold by 2050, primary energy only increases 3.5-fold, from 42 EJ in 2000 to 135 EJ in 2050, accompanied by a 9-fold increase in renewables from 2.8 EJ to 24 EJ. Similarly, a Tsinghua University scenario shows primary energy from renewables at 28% by 2050, with economy and energy projections to 2050 updated from the Task Force scenario (58). While energy use increases 3.5-fold, primary energy share increases 4-fold, leading to a 14-fold increase in renewables by 2050. The WBCSD (25) scenario envisions 38% of electricity from renewables by 2050, with 1000 GW of wind capacity. Kroeze et al (60) show 24% share of electricity by 2020 for a reference scenario and 37% for a policy scenario. Carbon capture and storage in the IEA ETP (21) “ACT Map” scenario has a significant impact on total Chinese CO2 emissions from power generation. The carbon intensity of power generation falls from 1100 in 2003 to 800 in 2050 (gCO2/kWh) under the reference scenario, but falls to 500 with CCS under “ACT-Map.” Other Developing Countries There are very few energy studies that look at developing countries as group. One such effort was the “RECIPES” project on renewable energy markets in developing countries, sponsored by EC DG Research (63). During 2005/2006, the project collected data on 114 countries and wrote over 2000 pages of project reports. The study constructed future projections based on estimates of market potentials. The “maximum” scenario for the group of 114 countries shows a tripling of primary energy from renewables in these countries by 2020, from 7.7 EJ in 2003 to 23 EJ in 2020, with primary energy share increasing 3% to 9% (primary energy share increases to 4.5% by 2020 under the “reference” scenario). The project also studied 15 countries in detail, creating technology-by-technology scenarios to 2020 for Argentina, Brazil, Colombia, Mexico, Peru, Cameroon, Ghana, Niger, South Africa, Uganda, China, Pacific Islands, India, Indonesia, Thailand. For South Africa, the “maximum” scenario shows electricity from renewables growing from 1% in 2003 to 5% by 2020. For Brazil, renewables increase but the share declines from 74% to 65% as electricity demand doubles.

16
Country-specific studies for developing countries tend to be less accessible. An excellent study for Mexico was done by Manzeti and Martinez (64), who envision 20-30% of primary energy from renewables by 2020, under “conservation” and “sustainability” scenarios. Many country-specific studies have been developed primarily for carbon emissions purposes. For example, Van Buskirk (65) analyzed CO2 emissions for Eritrea in East Africa through 2050 under different scenarios of efficiency and renewables. By 2100, CO2 emissions grow 25-fold under the reference scenario but only 5-fold under a “very high” renewables scenario. For India, Ghosh et al (66) show “new renewables” increasing from less than 1% in 2000 to 5% of power generation by 2035 for the reference case, and to 20% for “high mitigation.” Large hydro maintains the same share in 2035 as in 2000 – about 20%. With large hydro, the total share of renewables in power generation increases from 20% in 2000 to 40% in 2035. The “high mitigation” scenario shows a cumulative 530 Mt carbon reduction from renewable electricity from 2000 to 2035. Kroeze et al (60) show an 18% share of electricity by 2020 under a reference scenario and 27% for a policy-intensive scenario that substitutes renewables for coal. A TERI renewables-intensive scenario shows less than 5% primary energy from renewables by 2030 (68). Some global studies provide regional breakdowns. The GWEC (23) scenario for 2100 GW of wind power by 2030 shows 200 GW of this in Central and South America, 50 GW in Africa, and 130 GW in South Asia. The Greenpeace (19) scenario shows renewables’ share of primary energy in Latin America increasing from 28% in 2003 to 70% by 2050, and the share in Africa increasing from 47% to 58%. The IEA WEO (21) gives scenario results individually for Brazil, China, and India. The “alternative policy” scenario shows the share of electricity from renewables, excluding large hydro, increasing in Brazil from 4% in 2003 to 8% in 2030, in India from 1% to 6%, and remaining stable at 85% in Brazil even as total electricity demand doubles by 2030. Brazil continues to rely on large hydropower, building 66 GW of new capacity by 2030, and the share of biofuels in road transport fuel doubles from 14% in 2004 to 30% by 2030 in the “alternative policy” scenario. Another multi-country study was done by the Asia-Pacific Energy Research Center for the Asia-Pacific region, a mixture of 21 developed and developing economies, with three scenarios for electricity in 2020 and 2050 (69). Under the reference scenario, policy development is slow and electricity in the APEC region increases from 7,500 TWh in 2000 to 39,000 TWh in 2050, with 6,800 TWh of renewables (17% share). The “accelerated development” scenario envisions vigorous policy development and capital investment prior to 2010, while the “delayed deployment” scenario envisions a ten-year delay, post-2010. In the “accelerated deployment” scenario, renewables grow to 50% of power generation by 2050, with 50-year average annual growth rates of 9% for biomass, 11% for solar PV, and 13% for wind. Country “100% Scenarios” A number of country-specific scenarios have envisioned a 100% share of energy from renewables, some of these dating back three decades. These include a 1980 scenario by the Union of Concerned Scientists for 100% in the US by 2050 (103), a 1978 study by a group of research institutes for 100% in France by 2050 (104), a 1977 study by Johansson and Steen for 100% in Sweden by 2015 (105), and a 1982 study by the International Institute for Applied Systems Analysis for 100% in Europe by 2100 (106). More recently, the

17
German parliament created a scenario for a 95% share in Germany by 2050 (107). A Japanese study envisions a 100% future (108). A Netherlands policy-intensive and carbon-constrained study (to 80% of 1990 levels) gives an 80% share (84). INFORSE is leading country-based “sustainable energy visions” for 100% renewables by 2050 (109). And Sorenson (110) based a low-energy zero-carbon global scenario on 100% renewables. Most “100%” scenarios give large shares to solar PV, wind, and solar thermal power and most imply large shares (i.e., 30-50%) of distributed generation. A few show very large shares of biomass, such as 60-70% shares of primary energy in the Netherlands and Sweden studies. MUNICIPAL POLICY TARGETS AND SCENARIOS Many cities are adopting future targets of 10–20 percent of electricity from renewables (Table 5). Examples are Adelaide, Australia; Cape Town, South Africa; Freiburg, Germany; and Sacramento (California), United States. Targets typically aim for some year in the 2010–2020 timeframe. Some targets are for share of total energy consumption, such as Daegu, Korea, with a target of 5% by 2012, and Tokyo, which has proposed a target of 20 percent of total energy consumption from renewables by 2020 (up from 2.7% today), to be formally adopted by 2008 as part of the city’s environmental plan. Other city targets address installed capacity, such as Oxford, UK, and Cape Town, South Africa, both targeting 10 percent of homes with solar hot water by 2010 (and solar PV as well in Oxford). Barcelona, Spain, is targeting 100,000 square meters of solar hot water by 2010. Some local governments in the UK are requiring on-site renewables for all new buildings over specific size thresholds (3-4). Urban planning that incorporates future clean-energy visions is gaining hold in many cities, often with participation from a variety of stakeholders. Göteborg, Sweden, is an example of a city creating a long-term vision, through a project called Göteborg 2050. That project is a collaborative effort between universities, the city government, and the city’s energy utility. It includes research, scenario development, strategic planning, dialogue with the public, and demonstration projects. In Japan, where renewable energy policy has been quite active at the local level, 800 local governments have laid out future urban visions over the past 10 years, with support from a national government program. These Japanese cities are creating advanced and unique visions taking into consideration their local characteristics, and incorporating renewable energy into their visions. Cities are also establishing CO2 reduction targets. For example, London announced a target to reduce carbon dioxide emissions by 20 percent by 2010, relative to 1990 levels, and by 60 percent by 2050. New York City had set a target in 2002 for 20 percent reduction by 2010 from 1995 levels; this was supplemented by a “U.S. Mayor’s Climate Protection Agreement” in 2005 targeting 7 percent reduction from 1990 levels by 2012. During 2005 and 2006, New York City was joined by more than 200 other U.S. cities, representing a combined population of 41 million people, in making the same agreement. TECHNOLOGY PATHWAYS Six themes in energy scenarios related to future technology pathways for renewables recur regularly: long-term potentials and growth rates of wind, biomass, biofuels, and solar heating; centralized vs.

18
distributed electricity supply and particularly the role of solar PV; hydrogen combined with renewables; electric vehicle technology; advanced energy storage technologies; and nuclear power and carbon capture and storage. Long-Term Potentials and Growth Rates Wind power. Many scenarios show wind power becoming a major source of electricity. GWEC (23) shows wind power becoming 29% of global power generation by 2030 (5200 TWh of wind power) and 34% by 2050 (7900 TWh). Greenpeace (19) shows about the same (7200 TWh) but with a 23% share due to higher electricity demand. IEA ETP (22) “ACT Map” shows about one-third that amount (2400 TWh), with an 8% share. (In 2005, wind power generated 124 TWh.) Europe scenarios show shares from 10% to 26% by 2030 (38-39, 43). High annual growth rates accompany these projections. GWEC gives growth rates above 20% through 2015, becoming 17% through 2020 and 10% through 2025 (and below 5% thereafter). (From 2000-2006, annual growth rates were 25-30%.) Some scenarios show wind power becoming constrained by grid-integration issues, although studies show that technical measures exist to strengthen grids and allow high shares (10, 111). Cost reductions and policies play key roles in scenarios. For Europe, the role and share of off-shore wind is also a factor, considering technology, siting, acceptance, and cost barriers. Some Europe scenarios show more than half of all wind power coming from off-shore installations by 2030. Biomass. Berndes et al (112) found widely different conclusions in the literature about the possible contribution of biomass to future global energy supply by 2050, ranging from 100 EJ to 400 EJ. (In 2004, traditional biomass was 44 EJ and “modern” biomass was 5 EJ). Fisher and Schrattenholzer (113) give a range of 375 EJ to 450 EJ. Greenpeace (19) gives up to 100 EJ. One reason for different conclusions is that two crucial parameters—land availability and energy crop yields—are subject to widely different opinions. Availability of land, as well as forest and agricultural residues, relate to the interaction of biomass energy with other land uses (e.g., food production, biodiversity, and soil and nature conservation), and synergies between different uses. Berndes et al conclude that such interactions and synergies need to be better understood and modeled in order to better analyze the prospects for biomass. One of the highest scenarios for biomass use shows 70% of primary energy from biomass in the Netherlands by 2050, mostly for heating (84). Europe scenarios for 2030 show the share of low-temperature heat from biomass ranging from 3% to 27% (43). Biofuels. The IEA (14) projects 120 billion liters/year of ethanol production by 2020, or 3% of road transport fuel, and 25 billion liters/year of biodiesel, if policies accelerate. (In 2005, ethanol was 33 billion and biodiesel 4 billion.) The IEA ETP (22) scenarios show a range of biofuels shares by 2050, from a 3% reference scenario to 13% and 25% for “ACT Map” and “TECH Plus.” WBCSD (25) projects 15% worldwide by 2050, and 25% for the US and Canada. For Europe, the EC “biomass action plan” recommended a Europe target of 10% share by 2020 (95) and a research report envisioned a 25% share by 2030 (114), while other scenarios see a marginal contribution of biofuels to primary energy (37). Scenarios also differ on the development of “advanced” or “second generation” biofuels – such as cellulose-to-ethanol, biomass-to-liquids, or biogas. These fuels are expected in many scenarios by 2020, but only with further technology development (32, 37). Enzyme cost reductions and improvements in pre-treatment are

19
milestones to commercialization (14). Regulatory limits on biofuels imports is a factor in some Europe scenarios. Solar thermal power. Most scenarios ignore this technology, or mention it but don’t make a distinction between solar thermal power and solar PV when presenting shares of “solar power.” Some scenarios do show large increases after 2020 or 2030 explicitly for solar thermal power. The Greenpeace (19) “revolution” scenario shows 10% of world electricity from solar thermal power by 2050 (2900 TWh). Several Europe scenarios show shares of solar thermal power comparable to wind power by 2030 (40, 46-47). Solar heating and cooling. There are very few policy targets or scenarios that specifically address solar heating and cooling. The IEA ETP (22) scenarios do not distinguish renewable heating (they only show heat from traditional renewables as part of the buildings sector). The ESTTP (41) “solar thermal vision” sets a goal of 50% of all low-temperature heating and cooling coming from solar in Europe by 2030, led by the “active solar building” which is 100% heated and cooled by solar thermal energy and which becomes the new building standard. That vision also includes technologies for seasonal heat storage, commercial use of solar-assisted cooling (which is not yet in widespread commercial use), solar district-heating systems serving groups of buildings, and an array of architectural innovations and practices. China’s target of 300 million m2 of solar hot water by 2020 represents a quadrupling of capacity and could lead to more than a third of China’s households with solar hot water by 2020. Distributed Power Generation Most scenarios assume that the electricity system will remain highly centralized or don’t address the issue of distributed power generation. However, most advanced scenarios for Europe and some global scenarios do envision distributed generation becoming a prominent part of power systems (19, 25, 32, 49). And a survey of European experts found a large consensus about the trend towards a more decentralized electricity supply, estimating a 30% share of decentralized power by 2020 (42). Many scenarios envision solar PV as a primary form of distributed generation from renewables, although Europe scenarios also include large shares of biomass (in combined-heat-and-power plants) and geothermal power. Thus the share of distributed generation from renewables depends on solar PV technology advances and cost reductions. Bradford (115) argues that the share from solar PV also depends on fairer cost comparisons, and that solar PV is much closer to being competitive with conventional power if compared on the basis of delivered electricity or peak power costs. Under a decentralized paradigm, renewables have an advantage because they compete with the end-user cost of power rather than centralized generation costs, avoiding transmission and distribution costs. Bradford presents a radical distributed solar PV future in three phases, based on these advantages and extrapolation of technology cost curves: (i) rapid-growth from 2005 to 2020, when installed costs (per watt) decline to $2.50 (from $7 in 2005) and solar PV capacity rises to 240 GW (from 5 GW in 2005); (ii) “displacement” from 2020 to 2040, when costs further decline to $1.60 and capacity increases to 6,900 GW; and (iii) dominance beyond 2040, when costs decline to $1 and solar PV provides 35% of global electricity. An EC research report envisions a similar trajectory, with 1000 GW of solar PV by 2030 (116).

20
Many studies offer visions and details of decentralized systems using a combination of small-scale renewables, along with microturbines, fuel cells, stirling engines and other emerging technologies, many providing both power and heat (11, 49, 72, 117-123). Also included in this category is the literature on “building-integrated PV” (BIPV) that merges energy and architecture (124-126). In a distributed future, central power grids become more limited and more users produce their own power. Distributed sources become connected through “intelligent grids” that optimize flows and make least-cost decisions. A three-stage transition to distributed generation was suggested by the IEA, according to share of total power generation (127). At first, marginal shares pose little issue other than interconnection. Later, increasing shares require utilities to monitor and control generation sources and conduct real-time optimization. Finally, a majority share means micro-grids and community energy systems dominate, with local distribution utilities becoming coordination agents rather than controllers. Hydrogen Combined with Renewables McDowell and Eames (128) review the hydrogen futures literature and conclude that “most studies see the ultimate hydrogen economy as fuelled entirely by renewables, with electricity and hydrogen as the dominant, and largely interchangeable energy carriers.” But transitionally at least, until 2030-2050, studies envision hydrogen from nuclear and fossil fuels (some with carbon sequestration). Shell’s “spirit of the coming age” (32) shows hydrogen infrastructure emerging after 2030, with natural gas as “bridge” to hydrogen from renewables after 2050. Some scenarios limit renewables-produced hydrogen because of high projected electricity demand that requires the renewable electricity (40). Others show hydrogen from renewables emerging only after power grids are strengthened to accommodate intermittent and distributed renewables (28). Many Europe and global scenarios don’t show significant hydrogen production until after 2030 (129). Scenarios show hydrogen primarily used as a transport fuel, and reflect high uncertainty or variation depending on factors like commercial viability of fuel cell technology, hydrogen distribution options, hydrogen storage media, and gaseous versus liquid fuel. The IEA ETP (22) “ACT Map” scenario shows minimal contribution from hydrogen, while “TECH Plus” envisions cost reductions in fuel cells and other technology breakthroughs making hydrogen 9% of transport energy by 2050. The EC WETO (20) “hydrogen” scenario shows 13% of world final energy from hydrogen by 2050, produced from nuclear (40%) and renewables (50%). The WBCSD (25) scenario shows widespread use of fuel-cell vehicles by 2050 and 25% of world transport energy from hydrogen (including 17% in China, 27% in the US/Canada, 32% in Europe, and 100% in Japan), with renewables-produced hydrogen in some countries. Hydrogen infrastructures could be centralized or decentralized, employing local renewable electricity and biomass for decentralized hydrogen production, or large-scale renewables like wind and solar thermal power for centralized production (130). Hoffman (131) ponders whether hydrogen is inherently a centralizing technology. In some scenarios, such as Shell’s “spirit of the coming age” (32), hydrogen supports a continued centralized energy paradigm. Others, such as Rifkin (132), envision hydrogen as a decentralizing technology that promotes community energy systems. But neither centralized nor decentralized hydrogen visions are practical or desirable, according to some, who question and even denounce the current hydrogen “fashion” (121, 133-135). They claim that visions of hydrogen combined with renewables deceptively hide an agenda – hydrogen from nuclear and fossil fuels – or that such visions force renewables into current energy paradigms rather than create new paradigms better suited to renewables.

21
Electric Vehicle Technology Beyond long-term visions of renewables-produced hydrogen for transport, most scenarios only discuss the contribution of biofuels to the transport sector. A relative “blind spot” in the literature is the direct contribution of renewable electricity for transport. There has been growing interest in hybrid gasoline-electric vehicles, including so-called “plug-in hybrids” in which the battery can be recharged from an external source such as renewable electricity. Plug-in hybrids could allow shorter trips to be made entirely on renewables, with stored gasoline used for longer trips. There has also been a resurgence of interest in electric-only vehicles, following the demise of earlier models in the 1990s. A growing number of authors envision a future with transport technology closely tied to electric power and renewable electricity rather than liquid or gaseous fuels (49, 121, 135). This future also includes potential use of electric vehicle batteries as mediums for electricity storage, for example charging a car at night and then using the power during the day or selling it for peak-power prices. Wind power is a ideal match for electric vehicle technologies, argue several authors, because vehicles can be charged with cheap off-peak wind power, and because battery charging is ideally suited to intermittent wind power. Automatic control of battery charging and discharging through the grid also fits into “smart grid” or “virtual power station” visions (19, 117-119, 122-123). The key barrier remains battery technology. Ongoing technology developments may accelerate beyond what some prognoses have suggested (5). Advanced Storage Technologies Energy storage is a key enabling technology for integration of renewables, concluded the European Commission (136). The survey of experts by EurEnDel (42) shows that many believe energy storage will be used widely by the early 2020s to support renewables. But very few energy scenarios address the storage issue specifically. An optimization model by Wuppertal (137) shows that high amounts of renewables can be integrated into electricity systems if sufficient storage/balancing options are available. A number of energy storage technologies have the potential to shape the use of renewable energy, including centralized storage to stabilize power grids containing large shares of intermittent renewables, local distributed storage, and storage on-board vehicles. Some scenarios envision advanced battery storage in homes to compliment local solar PV generation (25, 49). Presently, pumped hydro is the main commercial form of large-scale electricity storage, and some studies consider expanded use of pumped hydro in conjunction with wind turbines (10, 138). Conventional battery technologies (e.g., lead-acid, nickel-cadmium, and nickel-metal-hydride) offer inadequate performance but new technologies show promise, including lithium batteries (e.g., lithium-ion, lithium-polymer, lithium-metal-polymer, and lithium-sulfur), high-temperature batteries (e.g., sodium-sulfur and sodium-nickel-chloride), and flow batteries (e.g., vanadium-redox and zinc-bromine). Other forms of energy storage include flywheels, electric capacitors, compressed air storage, and thermal heat storage. Different storage times-scales (seconds, minutes, hours, and days) achieve different purposes: smoothing wind power output, load following, peak power dispatch and commitment, averaging of hourly and daily variations in wind and solar, and vehicle energy storage (49, 137, 139-141).

22
Nuclear Power and Carbon Capture and Storage For carbon-constrained scenarios, the degree of nuclear power and carbon capture and storage (CCS) technologies also determines how much renewables are needed to reduce carbon emissions. Europe scenarios show widely diverging futures for nuclear. Reference scenarios show some EU countries phasing out nuclear but others making new investment, depending on technology costs and policies, with electricity share from nuclear decreasing to 17-19 % by 2030 (compared to 28% in 2005) (38). Alternative scenarios show a complete nuclear phase-out in Europe, with no new plants built and electricity share falling to 4-9% in 2030 and zero in 2050 (43, 45, 47). Highest is a EC WETO (20) scenario showing 45% of European electricity from nuclear by 2050, along with CCS for half of all power plants. Many global scenarios envision nuclear retaining roughly the same electricity share as today (15%), which means increasing at the same rate of world electricity demand, while at the same time showing large increases in CCS (25, 22). The IEA ETP (22) “ACT Map” scenario, while leaving nuclear at 17% share by 2050, shows CCS for half of all coal-fired power plants worldwide. An alternative “ACT no CSS” scenario, which assumes CSS never becomes commercial available, compensates with higher levels of renewables and nuclear. Similarly, the WBCSD (2005) scenario shows a 12% share for nuclear, along with CCS for half of all coal power capacity worldwide by 2050. CCS plants start to become widespread by 2025. Some scenarios show an even higher share for nuclear, 30% more (84, 142). Highest is an EC WETO (20) scenario showing 38% electricity share for nuclear, along with CCS for two-thirds of power generation globally (compared to its reference scenario of 25% nuclear and 12% CCS). At the other extreme, some global scenarios envision the complete elimination of nuclear power by 2050 and consequently high levels of renewables (19, 28). Saddler et al (143) show that it is possible to achieve a 50% reduction in CO2 emissions by 2040 in Australia without nuclear or CCS. CONCLUSIONS Globally, low or reference scenarios show the share of primary energy from renewables in the range 10-15% by 2040-2050, medium scenarios show a 25-30% share, and high scenarios show a 40-50% share. Total energy consumption in 2050 varies significantly among the scenarios, from 600 EJ to 1600 EJ. The amount of primary energy from renewables ranges from 100 EJ to 600 EJ, or an increase of 1.2-fold to 7-fold from 80 EJ in 2004. Reference scenarios show the share of electricity from renewables about 15% by 2040-2050, medium scenarios show a 30-40% share, and high scenarios show a 50-80% share, compared to 19% in 2005. The few scenarios giving share of transport energy from biofuels in 2050 show a wide range, from 3% to 25%. For Europe, low or reference scenarios show primary energy share higher and sooner than global scenarios, at 15-20% by 2030, with policy-intensive scenarios showing a 30-40% share by 2030 and up to 50% by 2050. (These compare to 6.5% actual in 2004, a 12% target by 2010, and a 20% proposed target by 2020.) Electricity share is 20-25% in low or reference scenarios and 45-60% in policy-intensive scenarios by 2030, and up to 70% by 2050. (These compare to 14% actual in 2005 and a 12% target by 2010.) Transport fuel share is 6-7% in low or reference scenarios and 25% in policy-intensive scenarios by 2030. (These compare to an EU-wide target of 5.75% by 2010.)

23
For individual countries and states/provinces, there are many targets and scenarios for 15-25% share of primary energy and 20-35% share of electricity by 2020. Scenarios for 2050 show up to 50% share of primary energy and 50-80% share of electricity under policy-intensive or advanced scenarios. China’s target for 16% share of primary energy by 2020 (up from 7.5% in 2005) represents the largest amount of renewables for any individual country. Factors affecting scenario outcomes include aggressiveness of policy action, cost-competitiveness driven by technology development and fuel price changes, and aggregate energy demand. Other factors include carbon prices, speed of capital-stock replacement, and business strategies. Reference scenarios envision partial implementation of existing policies, continued reliance on traditional fuels, and stable to modestly increasing fuel prices. Policy-intensive or advanced scenarios envision aggressive policies and targets, significant technology cost reductions, increased social motivation, higher fuel prices, and high growth rates for renewables over decades. Many scenarios show large reductions in aggregate energy demand from energy efficiency that allow renewables to supply nearly a majority share. In many scenarios, factors affecting biofuels tend to differ from those cited above, with resource constraints, uncertainties about commercial viability of cellulose-to-ethanol and other advanced technologies, and oil prices influencing scenarios. Carbon-constrained scenarios depict trade-offs between renewables, nuclear, and carbon capture and storage, along with increases in energy efficiency. With carbon constraints added to scenarios, technology development, social acceptability of nuclear, and relative costs become overriding factors affecting renewables shares. Some scenarios manage to satisfy carbon constraints with large amounts of renewables and no nuclear or carbon capture. Hydrogen for transport is envisioned in some scenarios – produced from fossil fuels or nuclear starting around 2030 and then later from renewables – but still only accounting for modest (10-30%) shares of transport fuel by 2050. Distributed generation from renewables, especially solar PV, plays an important role in some scenarios. Three different visions for the future of power generation might be characterized as: (a) continued centralized electric power with bulk renewables feeding into grids; (b) co-existing centralized and decentralized electricity, with “smart” power grids and two-way power transfer storage devices to take advantage of peak-demand pricing and to smooth intermittent renewables; (c) radical decentralization with community energy systems predominating. The future of renewables appears promising to many. Scenarios attempt to show possible futures and implications of different choices and conditions. Cost reduction and technology development – from methodical incremental improvements to paradigm-shifting surprises – will be important, but ultimately the decisions of business managers, policy-makers, and households will determine those futures.

24
ACKNOWLEDGEMENTS Thanks to the Future Energy and Mobility Structures research group of the Wuppertal Institute (Karin Arnold, Manfred Fischedick, Vanessa Grimm, Frank Merten, Dirk Mitze and Nikolaus Supersberger) for their substantive contributions and reviews, and also to reviewers Donald Aitken, Ashok Gadgil, and Janet Sawin. A special thanks to Morgan Bazilian for review and suggestions in formulating the paper, and to the Tsinghua-BP Clean Energy Research and Education Center of Tsinghua University for its support. SUMMARY POINTS 1. Common indicators of renewable energy futures are shares of primary energy and electricity, but shares of final energy, low-temperature heating, and road transport energy are also important. 2. Global renewable energy scenarios show 10% to 50% share of primary energy by 2050, with many policy-intensive scenarios projecting 40-50%. Europe policy-intensive scenarios project 45-60% by 2030. 3. Wind and biomass power feature strongly in most advanced scenarios, but there are large differences in projections for distributed solar PV, solar thermal power, solar and biomass heating, advanced biofuels, and the role of energy storage and electric vehicle technologies. 4. The International Energy Agency’s World Energy Outlook shows the lowest shares of renewables, while European Commission and private-sector scenarios show significantly larger shares and advocacy groups and industry associations show the highest shares. 5. Carbon-constrained scenarios work backwards from atmospheric stabilization of CO2 at 450-550 ppm by 2050 and depict trade-offs between renewables, nuclear power, and carbon capture and storage. Global CO2 emissions vary from 10 to 100 Gt by 2050 across the range of scenarios reviewed. 6. Scenarios differ in treatment of renewables depending on degree of future policy action, fuel prices, carbon prices, technology cost reductions, aggregate energy demand, feasible power grid integration, and modeling approach, with resource constraints mostly significant for biomass and biofuels only. FUTURE ISSUES TO BE RESOLVED 1. The indicator “share of primary energy” suffers from multiple definitions that make comparisons across countries and studies difficult; better transparency and dual-method reporting are needed. 2. More understanding and transparency is needed to explain how different modeling approaches and assumptions affect data requirements and scenario results, including the quantitative effects of policies. 3. Scenarios should more explicitly cover the role of low-temperature heating and cooling from renewables, including solar hot water and heating, advanced biomass technologies, geothermal heat pumps, and
25
integrated “green building” architecture. 4. Scenario research should better explore the role of distributed generation and particularly distributed solar PV, and also the potential of electric vehicle technology and advanced energy storage to affect renewable futures. MINI-GLOSSARY Carbon capture and storage: removal of carbon from power plant emissions (or separation from fuel before combustion) and injection into subsurface geological formations or oceans. Carbon stabilization: leveling of atmospheric concentration of CO2 (in ppm) or CO2 equivalents by a certain year, or leveling of annual CO2 emissions. Exojoule (EJ, or 1018 Joules): measures large quantities of primary energy; million tons oil equivalent (mtoe= 0.042 EJ) is also a common unit. Final energy: energy consumed by a building, factory, or car, counting the energy value of electricity or gasoline consumed, or of coal or gas burned. Gigawatt (GW, or 109 watts): measures large amounts of electric power capacity; a typical large coal or nuclear plant is about one GW. Primary energy: energy available from coal, oil and gas before conversion to other forms; thermal heat of nuclear power; energy of biomass feedstock. Terawatt-hour (TWh): measures large quantities of electricity, equal to one billion kilowatt-hours (kWh); kWh is more common for consumption and electricity prices. Traditional biomass: unprocessed agricultural and forest products waste, fuel wood, and animal dung burned in stoves or furnaces, typically in rural areas.

26
TABLE 1 Share of world primary energy from renewables – four types of accounting (2004) a Excluding traditional biomass Including traditional biomass Hydro
(EJ) Non-hydro renewables (EJ)
World primary energy (EJ)
Renewables share of primary energy
Traditional biomass (EJ)
Renewables share of primary energy b
BP method 28.9 6.8 438 8.2% 44 16.5% IEA method 11.0 5.0 418 3.8% 44 13.0% a Calculated from 2004 data by BP, REN21, IEA (1-4, 21); see text for explanation of BP and IEA methods. b Both total world primary energy and total renewables increase by the amount of traditional biomass. TABLE 2 Share of primary energy from renewables – policy targets and scenarios a Region/ country
2004 actual b
2010 policy
targets c
2020 policy targets or scenarios d
Up to 2050 scenarios e
Scenarios
5-15% low/reference
10-15% low/reference
19-22, 32, 73, 87, 142
15-20% medium
25-30% medium
22, 29, 30, 32-33, 73, 87
World 3.8% or 8.2% or 13.0% or 16.5%
---
25% high
40-50% high
19, 25, 28-30, 31, 33, 35-36
10% reference/carbon
constrained
15-20% reference (by 2030)/ carbon constrained
20-21, 46, 47
20% target 30-40% policies (by 2030)
37-40, 43, 46-48
Europe (EU-25)
6.5%
12%
23% “revolution” 50% “revolution” 45 7% reference 8% reference 21, 52, 54-55 United
States 6% ---
20% “revolution” 50% “revolution” 19 Japan 1.2% f 3% f --- 6% (2030) reference
17%/22% (2030) 25%/50% (2050) high/community
21, 56-57
China 7.5% 10% 16% target 20-30% policies 19, 58-62 India 39% 30-35% policies 15-30% policies 21, 65 Brazil 41% 30% high 63 Mexico 10% 20-30% high 64 Thailand 1% 8% Germany 3.9% 4% 10% target 50% advanced 83 Netherlands 1.9% 80% policies 84 Poland 4.9% 7.5% 14% target 99 Spain 6.2% 12.1% a Policy targets and 2004 actual from REN21, IEA, and EC (2-4, 12, 63, 88, 93-94) plus relevant scenarios. Most targets and scenarios count (or are presumed to count) renewable electricity according to the IEA
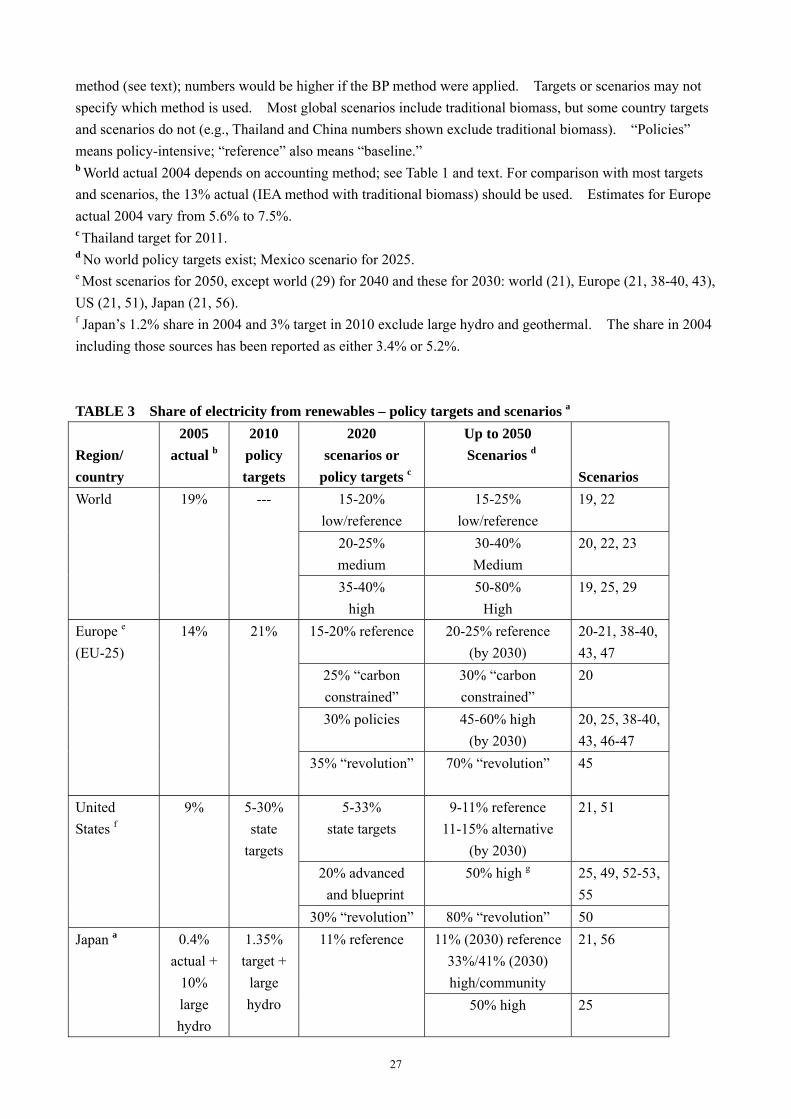
27
method (see text); numbers would be higher if the BP method were applied. Targets or scenarios may not specify which method is used. Most global scenarios include traditional biomass, but some country targets and scenarios do not (e.g., Thailand and China numbers shown exclude traditional biomass). “Policies” means policy-intensive; “reference” also means “baseline.” b World actual 2004 depends on accounting method; see Table 1 and text. For comparison with most targets and scenarios, the 13% actual (IEA method with traditional biomass) should be used. Estimates for Europe actual 2004 vary from 5.6% to 7.5%. c Thailand target for 2011. d No world policy targets exist; Mexico scenario for 2025. e Most scenarios for 2050, except world (29) for 2040 and these for 2030: world (21), Europe (21, 38-40, 43), US (21, 51), Japan (21, 56). f Japan’s 1.2% share in 2004 and 3% target in 2010 exclude large hydro and geothermal. The share in 2004 including those sources has been reported as either 3.4% or 5.2%. TABLE 3 Share of electricity from renewables – policy targets and scenarios a Region/ country
2005 actual b
2010 policy targets
2020 scenarios or
policy targets c
Up to 2050 Scenarios d
Scenarios
15-20% low/reference
15-25% low/reference
19, 22
20-25% medium
30-40% Medium
20, 22, 23
World 19% ---
35-40% high
50-80% High
19, 25, 29
15-20% reference 20-25% reference (by 2030)
20-21, 38-40, 43, 47
25% “carbon constrained”
30% “carbon constrained”
20
30% policies 45-60% high (by 2030)
20, 25, 38-40, 43, 46-47
Europe e (EU-25)
14% 21%
35% “revolution”
70% “revolution”
45
5-33% state targets
9-11% reference 11-15% alternative
(by 2030)
21, 51
20% advanced and blueprint
50% high g 25, 49, 52-53, 55
United States f
9% 5-30% state
targets
30% “revolution” 80% “revolution” 50 11% (2030) reference
33%/41% (2030) high/community
21, 56 Japan a 0.4% actual +
10% large hydro
1.35% target +
large hydro
11% reference
50% high 25

28
15-25% reference 15% reference (by 2030)
21, 60
35% policies 20-40% policies advanced/alternative
21, 25, 58-62
China 16% ---
--- 50% “revolution” 19 India h 11% 5-10%
state targets
18% reference 27% policies
12-25% reference 40% high mitigation
(by 2035)
21, 61, 66, 67
APEC region i
16% --- 17% reference 39% “accelerated”
17% reference 50% “accelerated”
67
Latin America Region
--- --- --- 33% reference 90% “revolution”
19
Brazil a 5% 22% high 63 Mexico 11% 15% high 63 South Korea 2% 7% Germany 10% 12.5% 20% target a Policy targets and 2005 actual from REN21, IEA, EC, and EIA (2-4, 12, 63, 88, 93-94) plus relevant scenarios. Most targets and scenarios include large hydro, but some may not. Scenario for Brazil and Japan’s target of 1.35% by 2010 exclude large hydro. b Europe actual is for 2004. APEC actual is for 2000. c APEC scenario is for 2025. d Most scenarios for 2050, except world (29) for 2040, and these for 2030: world (21), Europe (21, 38-40, 43), US (21, 51), Japan (21, 56). e The EC in 2006 anticipated an actual 18% share of electricity by 2010. f Policy targets are given equivalent to state-level RPS policies in most U.S. states; no national-level target exists. California in 2005 proposed 33% share by 2020, up from 20% RPS by 2017 (http://www.newrules.org viewed 1/31/07). g WBCSD (25) scenario for 2050 of 50% is for Canada and United States combined. h India has national policy targets of 10% of new capacity added 2003-2010, and 15% of total capacity by 2032, plus RPS policies in several states that serve as state targets. i APEC region includes Australia, Brunei Darussalam, Canada, Chile, China, Chinese Taipei, Hong Kong, Indonesia, Japan, Korea, Malaysia, Mexico, New Zealand, Papua New Guinea, Peru, Philippines, Russia, Singapore, Thailand, United States, and Viet Nam.
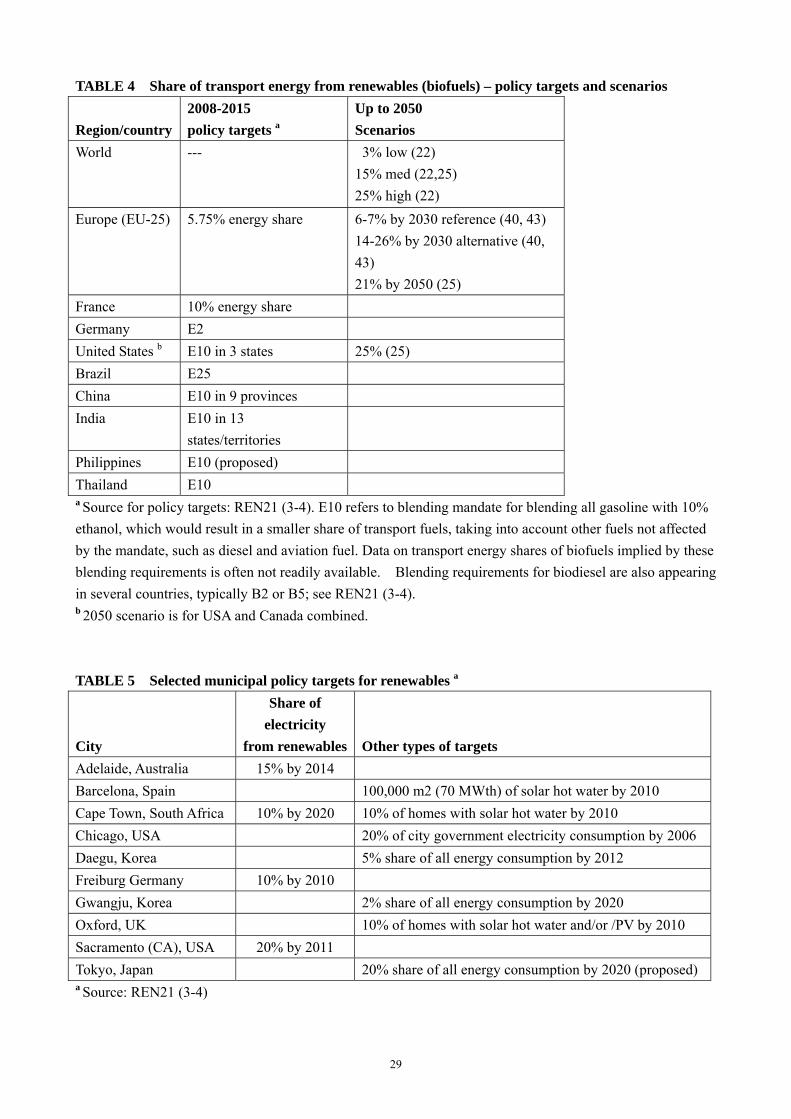
29
TABLE 4 Share of transport energy from renewables (biofuels) – policy targets and scenarios Region/country
2008-2015 policy targets a
Up to 2050 Scenarios
World --- 3% low (22) 15% med (22,25) 25% high (22)
Europe (EU-25) 5.75% energy share 6-7% by 2030 reference (40, 43) 14-26% by 2030 alternative (40, 43) 21% by 2050 (25)
France 10% energy share Germany E2 United States b E10 in 3 states 25% (25) Brazil E25 China E10 in 9 provinces India E10 in 13
states/territories
Philippines E10 (proposed) Thailand E10 a Source for policy targets: REN21 (3-4). E10 refers to blending mandate for blending all gasoline with 10% ethanol, which would result in a smaller share of transport fuels, taking into account other fuels not affected by the mandate, such as diesel and aviation fuel. Data on transport energy shares of biofuels implied by these blending requirements is often not readily available. Blending requirements for biodiesel are also appearing in several countries, typically B2 or B5; see REN21 (3-4). b 2050 scenario is for USA and Canada combined. TABLE 5 Selected municipal policy targets for renewables a City
Share of electricity
from renewables
Other types of targets
Adelaide, Australia 15% by 2014 Barcelona, Spain 100,000 m2 (70 MWth) of solar hot water by 2010 Cape Town, South Africa 10% by 2020 10% of homes with solar hot water by 2010 Chicago, USA 20% of city government electricity consumption by 2006 Daegu, Korea 5% share of all energy consumption by 2012 Freiburg Germany 10% by 2010 Gwangju, Korea 2% share of all energy consumption by 2020 Oxford, UK 10% of homes with solar hot water and/or /PV by 2010 Sacramento (CA), USA 20% by 2011 Tokyo, Japan 20% share of all energy consumption by 2020 (proposed) a Source: REN21 (3-4)

World primary energy from
renewables in 2050 (EJ)
IPCC (71) highest
Berndes et al ([110]) highest (biomass only)
Shell (32) "dynamics as usual"
IIASA/WEC (33) highest
Shell (32) "spirit of the coming age"
Johansson et al (36)
IEA ETP (22) TECH+
IPCC (71) median
EC WETO (20) carbon constrained
EC WETO (20) reference
2004 actual per IEA method
EREC (29) advanced policies (2040)
Greenpeace (19) "revolution"
IEA ETP (22) ACT-Map
Berndes et al ([110]) lowest (biomass only)
IIASA/WEC (33) lowest
IPCC (71) lowest
0
50
100
150
200
250
300
350
400
450
World electricity from
renewables in 2050 (TWh)
WBCSD (25)
EREC (29) advanced policies (2040)
Johansson et al (36)
EC WETO (20) carbon constrained
EC WETO (20) reference
IEA ETP (22) TECH+
IEA ETP (22) ACT-Map
IEA ETP (22) reference
2004 actual (1-4)
Greenpeace (19) "revolution"
Greenpeace (19) reference
5,000
0
10,000
15,000
20,000
25,000
30,000
35,000
40,000
30

31
LITERATURE CITED
1. BP. 2005/2006. Statistical Review of World Energy. London
2. Int. Energy Agency. 2006. Renewables Information 2006. Paris
3. REN21 Global Policy Network. 2005. Renewables 2005 Global Status Report. Paris. [Annotation: A synthesis of the global market, investment, and policy situation with 320 references. Eric Martinot was lead author.]
4. REN21 Global Policy Network. 2006. Renewables Global Status Report 2006 Update. Paris
5. UN Dev. Programme, UN Dept. Econ. Soc. Aff., World Energy Counc. 2004. World Energy Assessment Overview: 2004 Update. New York
6. UN Dev. Programme, UN Dept. Econ. Soc. Aff., World Energy Counc. 2000. World Energy Assessment: Energy and the Challenge of Sustainability. New York [Annotation: A comprehensive reference on global energy issues.]
7. Johansson TB, McCormick-Brennan K, Neij L, Turkenburg W. 2004. The potentials of renewable energy. Proc. Int. Conf. for Renew. Energies, Bonn, Germany. Eurosolar: Bonn
8. Beck F, Martinot E. 2004. Renewable energy policies and barriers. In Encycl. Energy. San Diego: Academic Press/Elsevier Sci.
9. Geller H. 2003. Energy Revolution: Policies for a Sustainable Future. Washington, DC: Island Press
10. Aiken DW. 2003. Transitioning to a Renewable Energy Future (White Paper). Freiburg: Int. Solar Energy Soc.
11. Sawin JL. 2004. Mainstreaming Renewable Energy in the 21st Century. Worldwatch Paper 169. Washington, DC: Worldwatch
12. Int. Energy Agency. 2007. Global renewable energy policies and measures database. http://renewables.iea.org
13. Int. Energy Agency. 2004. Renewable Energy: Market and Policy Trends in IEA Countries. Paris
14. Int. Energy Agency. 2004. Biofuels for Transport: An International Perspective. Paris
15. Int. Energy Agency. 2003. Renewables for Power Generation: Status and Prospects. Paris
16. European Renew. Energy Counc. 2004. Renewable Energy in Europe: Building Markets and Capacity. London: James and James
17. EUREC Agency. 2002. The Future for Renewable Energy: Prospects and Directions. London: James and James
32
18. Johansson T, Turkenburg W. 2004. Policies for renewable energy in the European Union and its member states: an overview. Energy Sustain. Dev. 8(1):5-24
19. Greenpeace and European Renew. Energy Counc. 2007. Energy Revolution: a Sustainable World Energy Outlook – Global Report. [Annotation: A major global scenario effort integrating regional scenarios from around the world, with separate studies for U.S. and Europe available (see Refs. 45, 50).]
20. EC. 2006. World Energy Technology Outlook – 2050. WETO – H2. Brussels.
21. Int. Energy Agency. 2006. World Energy Outlook 2006. Paris [Annotation: Widely-cited global energy scenarios, with general treatments and thematic “insights” alternating every other year.]
22. Int. Energy Agency. 2006. Energy Technology Perspectives: Scenarios and Strategies to 2050. Paris. [Annotation: A comprehensive description and analysis of energy technologies and a much greater range of scenarios than found in Ref. 22.]
23. Global Wind Energy Counc. and Greenpeace. 2006. Global Wind Energy Outlook 2006. Brussels
24. Hawksworth J. 2006. The World in 2050 – Implications of Global Growth for Carbon Emissions and Climate Change Policy. London: Price Waterhouse Coopers
25. World Business Counc. for Sustain. Dev. 2005. Pathways to 2050 Energy and Climate Change. Geneva.
26. Int. Energy Agency. 2005. World Energy Outlook 2005. Paris
27. Royal Dutch/Shell. 2005. The Shell Global Scenarios to 2025. Washington, DC: Inst. for Int. Econ.
28. German Advis. Counc. on Global Change. 2004. World in Transition: Towards Sustainable Energy Systems. London: Earthscan
29. European Renew. Energy Counc. 2004. Renewable Energy Scenario to 2040. Brussels
30. Aitken DW, Billman LL, Bull SR. 2004. The climate stabilization challenge: can renewable energy sources meet the target?” Renew. Energy World 7(6):56-69
31. Raskin P, Banuri T, Gallopin G, Gutman P, Hammond A, et al. 2002. Great Transition: The Promise and Lure of the Times Ahead. Report of the Global Scenario Group. Boston: Stockholm Environ. Inst.
32. Royal Dutch/Shell. 2001. Energy Needs, Choices and Possibilities: Scenarios to 2050. London
33. Nakićenović N, ed. 2000. Energy scenarios. See Ref. 6, pp. 333-66
34. Nakićenović N, Grübler A, McDonald A, eds. 1998. Global Energy Perspectives. Cambridge, UK: Cambridge Univ. Press
35. Royal Dutch/Shell. 1996. The Evolution of the World’s Energy Systems. London
36. Johansson TB, Kelly H, Reddy AKN, Williams RH, eds. 1993. Renewable Energy: Sources of Fuels and Electricity. Washington, DC: Island Press

33
37. EC Directorate-General for Environ. (DG Env). 2006. Economic Analysis of Reaching a 20% Share of Renewable Energy Sources in 2020. Brussels
38. EC Directorate-General for Energy and Transport (DG Tren). 2006. Trends to 2030 – Update 2005. European Energy and Transport Scenarios on Key Drivers. Brussels
39. EC Directorate-General for Energy and Transport (DG Tren). 2006. European Energy and Transport. Scenarios on energy efficiency and renewables. Brussels
40. European Parliament ITRE. 2006. Security of Energy Supply - the Potentials and Reserves of Various Energy Source, Technologies Furthering Self-Reliance and the Impact of Policy Decisions. IP/A/ITRE/ST/2005-70. DG Internal Policies of the Union. Policy Department Econ. and Scientific Policy. Brussels
41. European Solar Thermal Technology Platform. 2006. Solar Thermal Vision 2030. Brussels: ESTTP
42. EurEnDel. 2004. Technology and Social Visions for Europe’s Energy Future: a Europe-wide Delphi Study. Final report of EurEnDel project. Berlin: Inst. for Future Studies and Technology Assessment (IZT)
43. Oeko-Institut. 2006. The Vision Scenario for the European Union. Project sponsored by Greens/EFA Group in the European Parliament. Freiburg, Ger. [Annotation: Advanced scenario for the EU with highest renewables share by 2030.]
44. European Environ. Agency. 2005. Climate Change and a European Low- carbon Energy System. EEA Report No 1/2005. Copenhagen.
45. Greenpeace Int. 2005. Energy Revolution – A Sustainable Pathway to a Clean Energy Future for Europe. A European Energy Scenario for EU-25. Brussels
46. Ragwitz M, Schleich J, Huber C, Resch G, Faber T, et al. 2005. Analyses of the EU Renewable Energy Sources' Evolution up to 2020 (FORRES 2020). Karlsruhe, Ger.: Fraunhofer Inst.
47. Wuppertal Inst. 2005. Target 2020 - Policies and Measures to Reduce Greenhouse Gas Emissions in the EU. Report on behalf of WWF Europe. Wuppertal, Germany
48. European Renew. Energy Counc. 2004. Renewable Energy Target for Europe – 20% by 2020. Brussels
49. Kutscher CF, ed. 2007. Tackling Climate Change in the U.S.: Potential Carbon Emissions Reductions from Energy Efficiency and Renewable Energy by 2030. Boulder, CO: American Solar Energy Soc.
50. Greenpeace Int. and European Renew. Energy Counc. (EREC). 2007. Energy Revolution – A Blueprint for Solving Global Warming -- United States Report. Amsterdam
51. US Energy Information Administration. 2006. Annual Energy Outlook with Projections to 2030. DOE/EIA-0383(2006). Washington, DC
52. Bailie A, Bernow S, Castelli B, O'Connor P, Romm J. 2003. The Path to Carbon-Dioxide-Free Power: Switching to Clean Energy in the Utility Sector. Washington, DC: The Center for Energy and Climate

34
Solutions; Boston: Tellus Inst.
53. Clemmer S, Donovan D, Nogee A, Deyette J. 2001. Clean Energy Blueprint: A Smarter National Energy Policy for Today and the Future. Boston: Union of Concerned Scientists
54. Brown MA, Levine MD, Short W, Koomey JG. 2001. Scenarios for a clean energy future. Energy Policy 29(14):1179–96
55. Interlaboratory Working Group. 2000. Scenarios for a Clean Energy Future. NREL-TP-620-29379. Oak Ridge, Tenn.: Oak Ridge Natl. Lab.; Berkeley, Calif.: Lawrence Berkeley Natl. Lab.; Golden, Colo.: Natl. Renew. Energy Lab.
56. Citizens’ Open Model Projects for Alternative and Sustainable Scenarios (COMPASS). 2004. Towards a Sustainable Energy Society:Alternative Scenarios for the Future of Our Energy, Environment, and Economy. Tokyo: Inst. for Sustain. Energy Policies
57. Fujino J. 2004. Japan low carbon society modeling study: Results of first Japan-UK 2050 LCS workshop and further. Presentation at Quantifying Energy Scenarios of a Low Carbon Society--the Annual Energy Modeling Conf. of the UK Energy Res. Centre. December 5, Oxford, UK. Ibaraki, Japan: Natl. Inst. for Environ. Studies
58. Zhang X, He J. 2005. Strategies and policies on promoting massive renewable energy development. Proc. China Renew. Energy Dev. Strategy Workshop, Tsinghua University, Beijing. Beijing: Tsinghua Univ., Inst. for Nuclear and New Energy Technologies (INET) and Tsinghua-BP Clean Energy Center
59. Ni W, Johansson T. 2004. Energy for sustainable development in China. Energy Policy 32(10):1225-29
60. Kroeze C, Vlasblom J, Gupta J, Boudri C, Blok K. 2004. The power sector in China and India: greenhouse gas emissions reduction potential and scenarios for 1990–2020. Energy Policy 32(1):55-76
61. China Task Force on Energy Strategies and Technologies. 2003. Transforming coal for sustainability: a strategy for China. Report to the China Counc. for Int. Cooperation on Environ. and Dev. Energy Sustain. Dev. 7(4):5-14
62. China Energy Res. Inst. and Lawrence Berkeley Lab. 2003. China’s Sustainable Energy Future: Scenarios of Energy and Carbon Emissions. Berkeley, CA: LBL and Beijing: ERI
63. RECIPES. 2007. Project Summary: Renewable Energy Market Potential in Emerging and Developing Countries. Final report of RECIPES project. Also 114 country data reports and 15 in-depth country reports. Brussels: EC DG-Res.
64. Manzini F, Martínez M. 1999. Choosing an energy future: the environmental impact of end-use technologies. Energy Policy 27(7):401-14
65. Van Buskirk R. 2006. Analysis of long-range clean energy investment scenarios for Eritrea, East Africa. Energy Policy 34(14):1807–17
66. Ghosh D, Shukla PR, Garg A, Ramana PV. 2002. Renewable energy technologies for the Indian power

35
sector: mitigation potential and operational strategies. Renew. Sustain. Energy Rev. 6(6):481–512
67. Grover RB, Chandra S. 2007. Scenario for growth of electricity in India. Energy Policy. In press
68. The Energy and Res. Inst. (TERI). 2006. National Energy Map for India: Technology Vision 2030. New Delhi: TERI Press
69. Asia-Pacific Energy Res. Center (APERC). 2004. New and Renewable Energy in the APEC Region: Prospects for Electricity Generation. Tokyo
70. Smil V. 2003. Energy at the Crossroads: Global Perspectives and Uncertainties. Cambridge, Mass.: MIT Press
71. Scheer H. 2002. The Solar Economy: Renewable Energy for a Sustainable Global Future. London: Earthscan
72. Patterson W. 1999. Transforming Electricity: The Coming Generation of Change. London: Earthscan
73. Intergovernmental Panel on Climate Change. 2000. Special Report on Emissions Scenarios. Cambridge, UK: Cambridge Univ. Press
74. Natl. Inst. for Environ. Studies, Center for Global Environ. Res. 2007. Greenhouse gas emissions scenarios database. http://www-cger.nies.go.jp/scenario/index.html. Ibaraki, Japan
75. McDowall W, Eames M. 2006. Forecasts, scenarios, visions, backcasts and roadmaps to the hydrogen economy: A review of the hydrogen futures literature. Energy Policy 34(11):1236–1250 [Annotation: An excellent review of 40 studies with useful analytical frameworks for energy futures.]
76. Craig PP, Gadgil A, Koomey JG. 2002. What can history teach us? A retrospective examination of long-term energy forecasts for the United States. Annu. Rev. Energy Environ. 27:83-118
77. EC Directorate-General for Res. 2006. Energy Futures: The Role of Research and Technological Development. Brussels
78. Nakata T. 2004. Energy-economic models and the environment. Progress in Energy and Combustion Science 30(4):417–75
79. Huntington HG, Weyant JP. 2002. Modeling energy markets and climate change policy. In Encyclopedia of Energy. San Diego: Academic Press/Elsevier Sci.
80. Ghanadan R, Koomey JG. 2005. Using energy scenarios to explore alternative energy pathways in California. Energy Policy 33(9):1117–1142 [Annotation: Illustrative example of defining, describing, and analyzing scenarios.]
81. Schwartz P. 1991. The Art of the Long View. New York: Doubleday
82. IEA. 2000. Experience Curves for Energy Technology Policy. Paris
83. Fischedick M, Nitsch J. 2002. Long-term scenarios for a sustainable energy future in Germany. Study

36
conducted for the German Environ. Fac. (English version). Stuttgart: Wuppertal Inst.
84. Treffers DJ, Faaij APC, Spakman J, Seebregts A. 2005. Exploring the possibilities for setting up sustainable energy systems for the long term: two visions for the Dutch energy system in 2050. Energy Policy 33(13):1723-1743 [Annotation: Revealing and comprehensive carbon-constrained country-level scenarios.]
85. Lenssen N, Flavin C. 1996. Sustainable energy for tomorrow’s world: the case for an optimistic view of the future. Energy Policy 24(9):769-781
86. Int. Energy Agency. 2006. Key World Energy Statistics. Paris
87. Goldemberg J. 2006. The promise of clean energy. Energy Policy 34(15):2185–90
88. Int. Energy Agency. 2007. Renewables in Global Energy Supply: An IEA Fact Sheet. Paris
89. Goldemberg J, Coelho ST. 2004. Renewable energy—traditional biomass vs. modern biomass. Energy Policy 32(6):711–14
90. EC. 2007. EU-Energy Policy Data SEC(2007) 12. Brussels
91. EC. 2007. Renewable energy road map: renewable energies in the 21st century: building a more sustainable future. COM(2006) 848. Brussels
92. EC. 2007. Renewable energy road map: renewable energies in the 21st century: building a more sustainable future. Impact assessment. SEC(2006) 1719. Brussels
93. EC. 2007. Green Paper follow-up action: report on progress in renewable electricity. COM(2006) 849. Brussels
94. EC. 2006. A European Strategy for Sustainable, Competitive and Secure Energy (“Green Paper”). COM(2006) 105 final. Brussels
95. EC. 2005. Biomass action plan. COM(2005) 628 final. Brussels
96. Greenpeace Int. and European Renew. Energy Counc. (EREC). 2006. Energy Revolution – A Sustainable Pathway to a Clean Energy Future – Netherlands Report. Amsterdam
97. Hennicke P. 2004. Scenarios for a robust policy mix: the final report of the German study commission on sustainable energy supply. Energy Policy 32(15):1673-78
98. Nitsch J, ed. 2004. Ecologically Optimized Extension of Renewable Energy Utilization in Germany. Summary Report in English. Berlin: German Federal Ministry for Environ., Nature Conservation and Nuclear Safety
99. Oniszk-Popławska A, Rogulska M, Wiśniewski G. 2003. Renewable-energy developments in Poland to 2020. 2003. Applied Energy 76(1-3):101-10
100. European Environ. Agency. 2000. Cloudy crystal balls. An assessment of recent European and global

37
scenario studies and models. Environmental issues series No 17. Luxembourg: Office for Official Publications of the European Communities
101. New Zealand Ministry Econ. Dev. 2006. Powering our Future: New Zealand Energy Strategy to 2050. Wellington
102. South Africa Department of Minerals and Energy. 2003. White Paper on Renewable Energy. Pretoria/Tshwane
103. Kendall HW, Nadis SJ. 1980. Energy Strategies: Toward a Solar Future. Report of the Union of Concerned Scientists. Cambridge, Mass.: Ballinger
104. Le Groupe de Bellevue, ALTER. 1978. A study of a long-term energy future for France based on 100% renewable energies. Reprinted in The Yearbook of Renewable Energies 1995/96 (1995). London: James and James
105. Johansson TB, Steen P. 1979. Solar Sweden: an outline to a renewable energy system. Stockholm: Secretariat for Future Studies
106. Häfele W, Anderer J, McDonald A, Nakiceňoviç N. 1981. Energy in a Finite World. Cambridge, Mass.: Ballinger
107. German Bundestag. 2002. Nachhaltige Energieversorgung unter den Bedingungen der Globalisierung und Liberalisierung. Report of the Enquette Commission. Berlin
108. Lehmann H. 2003. Energy Rich Japan. Aachen: Inst. for Sustain. Solutions and Innovations (ISUSI)
109. Int. Network for Sustain. Energy (INFORSE). 2006. Global Vision 2050 – 100% Renewables. Hjortshoj, Denmark
110. Sørensen B. 1999. Low energy consumption scenarios. Presented at IPCC Expert Meeting on Mitigation and Stabilization Scenarios, Copenhagen, 2-4 June. Roskilde, Denmark: Roskilde Univ.
111. Int. Energy Agency. 2005. Variability of Wind Power and Other Renewables: Management Options and Strategies. Paris
112. Berndes G, Hoogwijk M, van den Broek R. 2003. The contribution of biomass in the future global energy supply: a review of 17 studies. Biomass and Bioenergy 25(1):1-28
113. Fischer G, Schrattenholzer L. 2001. Global bioenergy potentials through 2050. Biomass and Bioenergy 20(3):151-159
114. EC Directorate-General for Res. 2006. Biofuels in the European Union: A Vision for 2030 and Beyond. Final report of the Biofuels Res. Advis. Counc. Brussels
115. Bradford T. 2006. Solar Revolution. Cambridge, Mass.: MIT Press
116. EC Directorate-General for Res. 2006. A Vision for Photovoltaic Technology. Report by the PV Technology Res. Advis. Counc. Brussels

38
117. Dunn S. 2000. Micropower: The Next Electrical Era. Worldwatch Paper 151. Washington, DC: Worldwatch
118. Borbely A-M, Kreider JF. 2001. Distributed Generation: The Power Paradigm for the New Millennium. New York: CRC
119. Lovins AB. 2002. Small is Profitable. Snowmass, CO: Rocky Mountain Inst.
120. Patterson W. 2003/2004. Keeping the lights on. Working papers 1-3. London: Chatham House
121. Brown LR. 2006. Plan B 2.0: Rescuing a Planet Under Stress and a Civilization in Trouble. New York: W.W. Norton
122. EC Directorate-General for Res. 2006. Smart Grids: Vision and Strategy for Europe’s Electricity Networks of the Future. European Technology Platform. Brussels
123. EC Directorate-General for Res. 2006. Towards Smart Power Networks: Lessons learned from European research FP5 projects. Brussels
124. Eiffert P, Kiss GJ. 2000. Building-Integrated Photovoltaic Designs for Commercial and Institutional Structures: a Sourcebook for Architects. NREL/BK-520-25272. Golden, Colo.: Natl. Renew. Energy Lab.
125. Eiffert P. 2003. Guidelines for the Economic Evaluation of Building-Integrated Photovoltaic Power Systems. NREL/TP-550-31977. Golden, Colo.: Natl. Renew. Energy Lab.
126. Int. Energy Agency. 2002. Potential for Building Integrated Photovoltaics. PV Power Systems Prog. Report PVPS T7-4. Paris
127. Int. Energy Agency. 2002. Distributed Generation in Liberalized Electricity Markets. Paris
128. See Ref. 75, p.1245
129. Ramesohl S, Merten F. 2006. Energy system aspects of hydrogen as an alternative fuel in transport. Energy Policy 34(11):1251–59
130. Dunn S. 2001. Hydrogen Futures: Toward a Sustainable Energy System. Worldwatch Paper 157. Washington, DC: Worldwatch
131. Hoffman P. 2001. Tomorrow’s Energy: Hydrogen, Fuel Cells, and the Prospects for a Cleaner Planet. Cambridge, Mass.: MIT Press
132. Rifkin J. 2002. The Hydrogen Economy. New York: Jeremy P. Tarcher/Putnam
133. Romm, JJ. 2004. Hype About Hydrogen: Fact and Fiction and the Race to Save the Climate. Washington, DC: Island Press
134. Heinberg R. 2004. Power Down: Options and Actions for a Post-Carbon World. Gabriola Island, BC, Canada: New Soc. Publishers

39
135. Scheer H. 2007. Energy Autonomy: The Economic, Social, and Technological Case for Renewable Energy. London: Earthscan [Annotation: Politically-oriented treatment of imperatives, barriers, and possibilities, with strong critique of status-quo.]
136. EC Directorate-General for Res. and Directorate-General for Transport and Energy. 2003. Clean, Safe and Efficient Energy for Europe: Impact assessment of non-nuclear energy projects implemented under the Fourth Framework Programme. Synthesis Report. Brussels
137. Eurosolar. 2006. Proc. First Int. Renew. Energy Storage Conf.: Towards Energy Autonomy with the Storage of Renew. Energies, Science Park Gelsenkirchen, Ger. Bonn: World Counc. for Renew. Energy and Eurosolar
138. Rechsteiner R. 2006. Management of renewable energies and storage systems–the Swiss case. See Ref. 137
139. Lund PD, Paatero JV. 2006. Energy storage options for improving wind power quality. Presented at Nordic Wind Power Conf., 22-23 May, Espoo, Finland
140. Gonzalez A, Ó Gallachóir B, McKeogh E, Lynch K. 2004. Study of Electricity Storage Technologies and Their Potential to Address Wind Energy Intermittency in Ireland. Cork: Natl. Univ. Ireland, Depart.Civil Environ. Engineering
141. Greennet. 2003. Cost and Technical Opportunities for Electricity Storage Technologies. Report for the European Commission Directorate-General of Energy and Transport. Chineham, UK: IT Power
142. Turton H, Barreto L. 2006. Long-term security of energy supply and climate change. Energy Policy 34(15):2232–50
143. Saddler H, Diesendorf M, Denniss R. 2007. Clean energy scenarios for Australia. Energy Policy. In press
LINKS
Web links to most of the literature cited are available at http://www.martinot.info/futures.htm