renewable energy master plan -...
TRANSCRIPT

RENEWABLE ENERGY MASTER PLAN
FINAL DRAFT REPORT
ENERGY COMMIS SIO
N
OF NIGERIA
ECN UNDP
NOVEMBER 2005

Renewable Energy Master Plan (REMP) • Final Report • November 2005 Energy Commission of Nigeria (ECN) • United Nations Development Programme (UNDP)
2
ACKNOWLEGMENT The Renewable Energy Master Plan (REMP) Drafting Consultants wish to express our sincere gratitude to the Energy Commission of Nigeria (ECN) and the United Nations Development Programme (UNDP) for giving us the opportunity to draft the Renewable Energy Master Plan for Nigeria. We are particularly grateful to the present and former Director General of Energy Commission of Nigeria, Professors A.S. Sambo and I.H. Umar for the cooperation and assistance we had received from them during the exercise. The UNDP financial contribution to this project is enormous and we wish to acknowledge their gesture on behalf of the people and government of Nigeria. We are equally grateful to the Technical Committee for the review of REMP and all the participants who attended the National Workshop on the Review of the Master Plan for their contribution in perfecting the draft Master Plan. The professional contribution of Prof O.C. Iloeje, the former Director, Energy Planning and Analysis of the Energy Commission of Nigeria and now a Commissioner in the National Electricity Regulatory Commission (NERC); and that of Prof. Emmanuel Oladipo and Dr (Mrs) Ogo Okoro of the UNDP are highly appreciated.

Renewable Energy Master Plan (REMP) • Final Report • November 2005 Energy Commission of Nigeria (ECN) • United Nations Development Programme (UNDP)
3
LIST OF CONSULTANTS WHO DRAFTED THE REMP
S/N Name Status Affiliation
1 Mr. Ewah Eleri (Executive Director)
Lead Consultant (Hydrogen, Ocean, & Geothermal, )
ICEED, Abuja
2 **Prof. R. ’Layi Fagbenle (Professor of Mechanical Engineering)
Consultant (Solar Thermal)
University of Ibadan, Ibadan
3 *Prof. A. O. Adegbulugbe+ (Professor of Energy Management)
Consultant (Wind Energy)
CERD, Obafemi Awolowo University, Ile-Ife
4 Prof. B. Garba (Professor of Renewable Energy)
Consultant (Biomass & Biofuel)
SERC, Usmanu Danfodiyo University, Sokoto
5 Dr. O. U. Oparaku (Director)
Consultant (Solar PV)
NCERD, University of Nigeria, Nsukka
6 Dr. J. K.Okoye (Managing Director)
Consultant (Small Hydropower)
WADSCO, Abuja
7 Dr. B.G. Danshehu (Mechanical Engineer)
Consultant (Woodstoves & Briquetting)
SERC, Usmanu Danfodiyo University, Sokoto
*Now Special Adviser on Energy Matters to the President, Federal Republic of Nigeria **Currently serving as Provost, College of Engineering & Technology, Olabisi Onabanjo University, Ibogun Campus, Ogun State. +The Consultants wish to acknowledge the significant contribution of Dr J-F.K. Akinbami, Senior Research Fellow of the CERD, OAU, Ile-Ife to the work of the Wind Energy Consultant who was appointed Special Adviser on Energy Matters to the President of the Federal Republic of Nigeria midstream in the course of the Project.

Renewable Energy Master Plan (REMP) • Final Report • November 2005 Energy Commission of Nigeria (ECN) • United Nations Development Programme (UNDP)
4
TABLE OF CONTENTS
ACRONYMS 6
SECTION ONE: EXECUTIVE SUMMARY 9 Introduction 9 Renewable Energy Resources, Technologies and Markets 11 Targets 19 Planned Activities and Milestones 21 Strategies and Implementation Issues 21 Financial Implications 23 Risk Analysis 27
SECTION TWO 29
CHAPTER 1: RATIONALE FOR, VISION AND OBJECTIVES OF REMP 29 1.1 Energy situation in Nigeria 29 1.2 Development and Energy Challenges 30 1.3 Drivers for Change 32 1.4 Rationale for the Renewable Energy Master Plan 34 1.5 Nigeria’s Renewable Energy Vision 35 1.6 Objectives of the Renewable Energy Master Plan 36 1.7 Expected Outputs 37 2.1 Hydro Power 39 2.2 Solar Energy 52 2.3 Biomass Energy 76 2.4 Wind Power 99 2.5 Hydrogen, Marine, Ocean and Geothermal Energy 112
CHAPTER 3: TARGETS 121 3.1 Introduction 121 3.2 Renewable Electricity Targets 121 3.3 Renewable Non-Electricity Targets 124 3.4 Implications of the Targets 125

Renewable Energy Master Plan (REMP) • Final Report • November 2005 Energy Commission of Nigeria (ECN) • United Nations Development Programme (UNDP)
5
CHAPTER 4: PLANNED ACTIVITIES AND MILESTONES 130 4.1 Introduction 130 4.2 Framework Programme for Renewable Energy Promotion 131 4.3 National Biomass Energy Programme 135 4.4 National Solar Energy Programme 143 4.5 National Small Hydro Programme 152 4.6 National Wind Energy Programme 155 4.7 Emerging Energy Research and Development Programme 160 4.8 Programme Budget 164
CHAPTER 5: STRATEGY AND IMPLEMENTATION ISSUES 167 5.1 Policy, Legal and Regulatory Framework 167 5.2 Institutional Framework 170 5.3 Economics and Financing 172 5.4 Capacity Building 174 5.5 Public Awareness 174 5.6 Inter-Agency Collaboration (including public-private partnership) 175 5.7 Research and Development 176 5.8 Monitoring and Evaluation 177
CHAPTER 6: RISK IDENTIFICATION AND ANALYSIS 178 6.1 Policy and Political Risks 178 6.2 Market Risks 179 6.3 International Development Risks 181 6.4 Standards and Quality Control Risks 182 6.5 Research and Development Risks 183 6.6 Environmental Risks 183
ANNEX: PROJECT CONCEPT NOTES 185
ANNEX: STAKEHOLDERS CONSULTED 214
ANNEX: REFERENCES 215
ANNEX: LIST OF PARTICIPANTS AT THE NATIONAL WORKSHOP ON THE REVIEW OF THE RENEWABLE ENERGY MASTER PLAN 22-25 NOV 2005 224

Renewable Energy Master Plan (REMP) • Final Report • November 2005 Energy Commission of Nigeria (ECN) • United Nations Development Programme (UNDP)
6
AAccrroonnyymmss AC Alternating Current ADP Agricultural Development Programme ADB African Development Bank APPA African Petroleum Producers Association ARCEDEM African Regional Centre for Engineering Design and
Manufacture ASDB Asian Development Bank ASL Above Sea Level AU African Union CASHPP Capital Alliance for Small Hydro Power CDA Caribbean Development Authority CO2 Carbon dioxide DC Direct Current DTCD Department of Technical Cooperation for Development ECN Energy Commission of Nigeria ECOWAS Economic Community of West African States EIA Environmental Impact Assessment EIA Energy Information Administration (of the US Department
of Energy) EMV Expected Monetary Value FAO Food and Agricultural Organization FCT Federal Capital Territory, Abuja FEPA Federal Environmental Protection Agency FMA Federal Ministry of Agriculture FORMECU Forestry Monitoring and Evaluation Coordinating Unit GEF Global Environmental Facility GJ Giga Joule (Giga = 109) GW Gigawatt GWh Gigawatt-hour Ha Hectares HGS High growth scenario IAEA International Atomic Energy Agency IC – SHP International Centre for Small Hydro IDB Inter-American Development Bank IMF International Monetary Fund IPP Independent Power Producer ITF Inter-Tropical Front Kg Kilogramme kJ Kilojoule Km/h Kilometre/hour kW Kilowatt KWh/m2 Kilowatt hour per square meter kWh Kilowatt-hour LGS Low growth scenario

Renewable Energy Master Plan (REMP) • Final Report • November 2005 Energy Commission of Nigeria (ECN) • United Nations Development Programme (UNDP)
7
M Metre M3 Cubic Metre M3/s Cubic Meter Per Second MCM Million Cubic Meters MFO Market Facilitation Organization MJ Megajoule MOU Memorandum of Understanding MToe Million Tons of oil equivalent MW Megawatt MWh Megawatt-hour NBRRI National Building and Roads Research Institute NCERD National Centre for Energy Research and Development NEEDS National Economic Empowerment and Development
Strategy NEP National Energy Policy NEPA National Electric Power Authority NEPAD New Partnership for African Development NERC Nigerian Electricity Regulatory Commission NERDP New Energy Research and Development Programme NGO Non Governmental Organization NIMOR Nigerian Institute of Marine and Oceanographic Research NIREDA Nigerian Renewable Energy Development Agency NNPC Nigeria National Petroleum Corporation NRSE New and Renewable Sources of Energy NYSC National Youth Service Corps O & M Operation and Maintenance OPEC Organization of Petroleum Exporting Countries OTEC Ocean Thermal Energy Conversions PJ Picojoule PSP Private Sector Participation PV Photo Voltaic R&D Research and Development REMP Renewable Energy Master Plan RET Renewable Energy Technology RMRDC Raw Materials Research and Development Council RS Reference scenario SERC Sokoto Energy Research Centre SHESTCO Sheda Science & Technology Complex SHP Small Hydro Power SHS Solar Home Systems TJ Terajoule Toe Tons of oil equivalent TPES Total primary energy supply (demand) TW Trillion Watt TWh Trillion Watt Hour (Tera –1012) UEMOA Economic and Monetary Union of West Africa

Renewable Energy Master Plan (REMP) • Final Report • November 2005 Energy Commission of Nigeria (ECN) • United Nations Development Programme (UNDP)
8
UN United Nations UNCDF United Nations Capital Development Fund UNDP United Nations Development Program UNESCO United Nation Educational Scientific and Cultural
Organisation UNIDO United Nations Industrial Development Organization USA United States of America VITA Volunteers in Technical Assistance WB World Bank WEC World Energy Council

Renewable Energy Master Plan (REMP) • Final Report • November 2005 Energy Commission of Nigeria (ECN) • United Nations Development Programme (UNDP)
9
SSeeccttiioonn OOnnee:: EExxeeccuuttiivvee SSuummmmaarryy
Introduction The Renewable Energy Master Plan (REMP) articulates Nigeria’s vision and sets out a road map for increasing the role of renewable energy in achieving sustainable development. The REMP is anchored on the mounting convergence of values, principles and targets as embedded in the National Economic Empowerment and Development Strategy (NEEDS), National Energy Policy, National Policy on Integrated Rural Development, the Millennium Development Goals (MDGs) and international conventions to reduce poverty and reverse global environmental change. Towards the coming decades, Nigeria envisions a peaceful and prosperous nation driven increasingly by renewable energy. The country will exploit renewable energy in quantities and at prices that will promote the achievement of equitable and sustainable growth. In the short term, crude oil will continue to play a dominant role in the economic development of the country. However, Nigeria’s fossil-led economy is under severe pressure. In decades to come, the sun will slowly but certainly set on crude oil production. Today, large hydropower plants are increasingly threatened by a shrinking River Niger, shaking the security of electricity supplies. Human activities upstream, and possibly climate change constitute critical challenges in our nation’s strive to meet its electricity needs. A silent crisis is also unfolding, as fuel wood remains scarce – increasing the vulnerability of the poor and endangering efforts to reduce poverty. In the medium term, Nigeria envisions an energy transition from crude oil to a less carbon intensive economy increasingly powered by gas. Gas will represent a new growth pole and provide a bridge to a low carbon economy that secures increased prosperity and preserves our environment. In the next ten years, gas is expected to overtake crude oil as a source of revenue; provide a basis for reliable power supply and a cleaner environment. In the medium term, the effect of renewable energy in national energy supply should begin to be felt. In the long term, Nigeria envisions a country that will significantly be less dependent on hydrocarbons. Energy from the Sun, modern and more efficient conversion of biomass energy, small hydro plants and wind – along with conventional technologies, will provide opportunities to empower people and communities in meeting their energy and development needs. Far into the future, Nigeria will join the rest of the world in developing a hydrogen economy and in accessing the vast energy entrapped in the oceans and in the Earth’s crust. Barriers and opportunities This bold new vision is achievable as Nigeria addresses present barriers. These barriers include the reform of the policy, regulatory and institutional framework that will enable a rapid scale up of the market for renewable energy. Secondly, prices and financing

Renewable Energy Master Plan (REMP) • Final Report • November 2005 Energy Commission of Nigeria (ECN) • United Nations Development Programme (UNDP)
10
constraints will be addressed to create a level playing field, and increase incentives for renewable energy. Thirdly, poor product quality and standards must be regulated to ensure consumer confidence and sustainability of the market. Fourthly, public awareness and promotion will be critical elements of the drive to expand the market for renewable energy. Lastly, addressing gaps in key R&D areas and building human and manufacturing capacities are key issues that must also be addressed. As Nigeria tackles these barriers, renewable energy will open vast opportunities for meeting the development challenges facing the country. Reform will unleash the potentials of diversified and abundant sources of energy, including solar photovoltaic and solar thermal energy, efficient and modern applications of biomass technologies, investments in small-scale hydro plants and wind power. Secondly, creating an enabling environment will assist in lowering renewable energy prices and expanding access to energy services particularly for the poor. Finally, renewable energy reforms will help in achieving NEEDS and MDG targets by providing opportunities to reach rural areas, industries and improving energy services to the poor. Drivers for change Certain factors will drive the process towards the successful implementation of necessary reforms and the realization of targets. These drivers include: the demand for energy services by a huge proportion of the population that remain inadequately served. Secondly, the commitment and completion of far reaching power sector reforms will also create a basis to expand the role of renewables in meeting electricity targets, especially in rural power supply. Thirdly, international development in the market for renewable energy technologies and the actions of government – bilaterally and within multilateral bodies will help shape successes in delivering more energy from renewable sources. Other drivers include technological change, global and local environmental concerns as well as Nigeria’s challenges in meeting the security of future energy supplies. Several factors underscore the imperative to develop the REMP. Current management of the sector with its focus on centralized conventional energy supply has been inadequate in meeting the yearnings of Nigerians for development. Second, expanding the scope for renewable energy use will require specific actions to bring some renewables from the laboratory to the energy marketplace. Third, the decentralized nature and scale of renewable energy schemes make them available to remote and under-served communities. Fourth, the Master Plan will encourage a balanced development of all available energy resources within the framework of the power sector and energy sector-wide reforms. Fifth, certain renewable energy sources such as hydrogen, ocean and geothermal energy will play a role in several decades to come. The Master Plan provides a tool to secure Nigeria’s R&D interests in these energies of the future. Sixth, the challenge of managing local and international environmental challenges has become crucial. Renewable energy provides a vehicle to meet the twin objectives of development and environmental protection. Finally, as many players become involved in renewable energy development and implementation activities, there is need for an overall guide that will channel all activities, in a complementary manner, towards the same goals.

Renewable Energy Master Plan (REMP) • Final Report • November 2005 Energy Commission of Nigeria (ECN) • United Nations Development Programme (UNDP)
11
Key objectives The overall objective of the REMP is to articulate a national vision, targets and a road map for addressing key development challenges facing Nigeria through the accelerated development and exploitation of renewable energy. It will put in place a comprehensive framework for developing renewable energy policies, legal instruments, technologies, manpower, infrastructure and market to ensure that the visions and targets are realized. Among other things, the master plan has the following specific objectives:
• Expanding access to energy services and raising the standard of living, especially in the rural areas;
• Stimulating economic growth, employment and empowerment; • Increasing the scope and quality of rural services, including schools, health
services, water supply, information, entertainment and stemming the migration to urban areas;
• Reducing environmental degradation and health risks, particularly to vulnerable groups such as women and children;
• Improving learning, capacity-building, research and development on various renewable energy technologies in the country; and
• Providing a road map for achieving a substantial share of the national energy supply mix through renewable energy.
Renewable Energy Resources, Technologies and Markets Nigeria is endowed with significant renewable energy resources including large and small hydroelectric power resources, solar energy, biomass, wind and potentials for hydrogen utilization; and development of geothermal and ocean energy. Table 1 presents estimated renewable energy resources in Nigeria, excluding potential hydrogen, ocean and geothermal energy. Table 1: Nigeria’s Renewable Resources Energy Source Capacity
Hydropower, large scale 10,000MW Hydropower, small scale 734 MW
Fuelwood 13,071,464 hectares (forest land 1981)
Animal waste 61million tones/yr Crop Residue 83million tones/yr Solar Radiation 3.5-7.0kWh/m2-day Wind 2-4 m/s (annual average) The level of resource endowment, capacities to utilize certain technologies, government policies and the economics of the energy section are all issues that challenge the optimal

Renewable Energy Master Plan (REMP) • Final Report • November 2005 Energy Commission of Nigeria (ECN) • United Nations Development Programme (UNDP)
12
utilization of the various sources of renewable energy in the country. In many cases, costs are critical to the overall success in developing a particular resource base. Table 2 presents an overview of the initial costs of electricity generating systems while table 3 presents a comparative assessment of operation and maintenance costs. Table 2: Initial Capital Costs of Electricity Generating Systems
Technology Size (KW) Initial Capital Cost ($/KW)
Engine Generator
Gasoline 4 760 Diesel 20 500 Micro hydro 10 – 20 1,000 – 2,400
Photovoltaic (PV) 0.07 11,200
Photovoltaic (PV) 0.19 8,400
Wind Turbine 0.25 5,500
Wind Turbine 4 3,900 Wind Turbine 10 2,800
Table 3: Operation, Maintenance, and Fuel Costs for Different Technologies
Technology O & M Costs (cents/KWh)
Fuel Costs* (cents/KWh)
Engine Generator
2 20
Micro Hydro 2 0 Photovoltaic 0.5 0 Wind Turbines
1 0
* Assuming Diesel Fuel Price of 5 US$/L The following is an overview of specific renewable energy resources, technologies and markets relevant to the pursuit of Nigeria’s renewable energy vision.

Renewable Energy Master Plan (REMP) • Final Report • November 2005 Energy Commission of Nigeria (ECN) • United Nations Development Programme (UNDP)
13
Small Hydropower From NEPA’s most recent estimate, the gross hydro potential for the country is approximately 14,750 MW. Current hydropower generation is about 14% of the nation’s hydropower potential and represents some 30% of total installed grid-connected electricity generation capacity. From a 1980 survey of 12 of the old states of the federation, it was established that some 734 MW of small hydropower (SHP) could be harnessed from 277 sites. Unfortunately the database on SHP in Nigeria is limited, incomplete and substantially obsolete. No new surveys have been conducted since those undertaken in only three northern states 20 years ago, to either confirm/verify earlier data or extend the work over the uncovered states, which, incidentally, occupy the most promising south-western and southeastern regions of the country where precipitation is high and most streams and rivers are perennial. The lifetime of small hydro facilities is 20 – 30 years, compared with 8 – 10 years for diesel engine generators. Long service life is an important attraction of the small hydro system. In Nigeria, some NESCO SHP projects, which were completed between 1923 and 1964, have continued to provide virtually uninterrupted power to not only supply the Jos metropolis and meet local consumption, but have also continued to feed surplus energy into the national power grid. Although, small hydropower may require a moderately high capital cost, its low operation and maintenance (O & M) requirements coupled with long life span are its major advantage over other prospective sources of power to small and medium sized rural communities and industries. Among the limitations of SHP are its being drought-sensitive, weather- and seasonal dependence, and its site-specificity. Solar Energy Nigeria lies within a high sunshine belt and, within the country solar radiation is fairly well distributed. The annual average of total solar radiation varies from about 12.6 MJ/m2-day (3.5 kWh/ m2-day) in the coastal latitudes to about 25.2 MJ/ m2-day (7.0 kWh/ m2-day) in the far north. This gives an average annual solar energy intensity of 1934.5 kWh/m2-yr; thus, over a whole year, an average of 6,372,613 PJ/year (≈1,770 thousand TWh/year) of solar energy falls on the entire land area of Nigeria. This is about 120 thousand times the total annual average electrical energy generated by the NEPA. With a 10% conservative conversion efficiency, the available solar energy resource is about 23 times the Energy Commission of Nigeria’s (ECN) projection of total final energy demand for Nigeria in the year 2030, and just under 200 times of the demand for the year 2010 for the High Growth Scenario. For the Low-Growth Scenario, the available resource is about 12 times the year 2030 demand and just under 100 times the year 2010 demand. The solar radiation measuring stations of the Nigerian Meteorological Agency (NIMET) are mostly airport and aerodrome weather stations that were originally set up to aid civil

Renewable Energy Master Plan (REMP) • Final Report • November 2005 Energy Commission of Nigeria (ECN) • United Nations Development Programme (UNDP)
14
aircraft navigation. To obtain a good solar radiation database there is need to create more purpose-built radiation measurement stations all over the country. Solar Thermal Solar thermal technologies that are available in the international market today are efficient and highly reliable, delivering solar energy in a wide range of applications, among which are: domestic hot water and space heating in residential and commercial buildings, swimming pool heating, solar-assisted cooling, solar-assisted district heating, industrial process heat, desalination, agricultural products drying, hatcheries, chick brooders and seed germinators, solar cooking, and electric power generation. In Nigeria, the ECN, with its two renewable energy centres, has developed or adapted a variety of renewable energy technologies and capacities, including solar dryers, solar water heaters, solar cookers and solar chick brooders. Many tertiary institutions have also developed or adapted several solar thermal technologies for local use. These local developments need to get from the present largely demonstration or dissemination stage to the next stage of commercialization, with private sector driven but high profile public sector led initiatives. Most solar thermal technologies are economically competitive even in developed countries of the world where the market is fully developed and private-sector driven. The competitiveness of solar water heating for commercial and institutional water heating has been demonstrated for Nigeria in previous studies. However, the solar thermal power (STP) generation technologies are at present economically uncompetitive. A study of the electricity cost for market introduction of STP technologies has shown that competitive markets can emerge between 2010 and 2015 at about 4-6 US cents/kWh. Sustained global markets for STP is expected between 2015 and 2020, during which period the total installed capacity would have increased from the present level of just 354 MW to over 5000 MW. Solar Photovoltaic Solar photovoltaic technologies are gaining an increasing acceptance in Nigeria. However, despite improvements in local R&D efforts, the body of knowledge on these technologies and their market potentials is considerably inadequate. Launching major national initiatives on these technologies require a robust knowledge base and capacity. The three most common solar PV technologies are the crystalline, amorphous and the thin film technologies. In the crystalline technology, Silicon is the most widely used and best characterized semiconductor material. Amorphous Silicon (a-Si) is the most extensively researched thin film material with the largest manufacturing experience mainly based on low power devices (watches, calculator etc). The thin film technologies that have achieved some level of market penetration are Copper Indium Diselenide (CuInSe2 or CIS), Cadmium Telluride (CdTe), and Thin Film Silicon (a-Si) Technologies. In all, PV technologies are showing increasing promise in terms of efficiency improvements and costs. The estimated lifetime of PV modules of 25 and 30 years make them exceptionally attractive for investors. Today, all the PV modules in the Nigerian

Renewable Energy Master Plan (REMP) • Final Report • November 2005 Energy Commission of Nigeria (ECN) • United Nations Development Programme (UNDP)
15
market are imported. Solar PV systems are being extensively used for a wide range of electrical energy requirements, including; solar home systems, water pumping, refrigeration and telecommunications. These applications have positive social and economic impact on the lives of individual users, businesses and communities. Biomass Some of the methods for biomass conversion to biogas include physical, biological, pyrolysis, gasification, burning, anaerobic digestion or biodegradation processes. Nigeria’s biomass resources include wood, forage grasses and shrubs, animal waste, and other wastes from forestry, agriculture, municipal and industrial activities as well as aquatic biomass. Biomass is similar to fossil fuels as it is made up of hydrocarbons that readily burn to release heat. Its ubiquitous availability and simple conversion technologies make biomass resources the most widely used source of energy in the country. However, no clear overview exists on the size of this important resource base and the sustainability of its resource management. Efforts by government to improve the resource management of biomass energy have essentially focused on enhancing the adoption of improved wood stoves, briquetting and biogas technologies. Improved Wood Stoves and Biomass Briquettes Traditional three-stone wood stoves are the dominant heating technologies in the country. They have very low efficiency, endanger the national wood stock as well as increase the burden of wood gathering. The Sokoto Energy Research Centre (SERC) has developed improved clay stoves for an average rural family. These improved double-hole wood stoves were constructed with wire mesh and ½” flat bar reinforcement incorporated in the clay structure to take care of the twisting and stirring forces experienced in the traditional cooking. Fuelwood and time savings of 37% and 24%, respectively, have been recorded in some of the investigations carried out. The National Energy Research and Development Centre (NERDC) at the University of Nigeria, Nsukka has developed steel-based wood stoves that have proved effective, particularly for institutional uses. However, in all these R&D efforts, improved wood stoves have not gained any significant foothold in any part of the country. Several machines have been developed in Nigeria for briquettes production, including a single cylinder extrusion machine that transforms rice, millet and sawdust husk to briquettes that produce 13kg of briquettes/hour. There are, however, only two small-scale companies in Nigeria situated in Ogun and Kaduna states which produce and market sawdust briquettes. The locally produced briquette has 6 to 7 times more energy content per kg than un-briquetted biomass. In addition, the heating flame and temperature obtained in cooking process are better when compared with other renewable energy fuels. Today, most work on biomass briquetting is confined to University R&D centers. Biogas There are three biogas designs presently available. These include the fixed dome, the floating cover and the bag digester. The fixed dome consists of an airtight container normally constructed of brick, stone or concrete with the top and bottom being hemispherical. The floating cover consists of a cylindrical container constructed with

Renewable Energy Master Plan (REMP) • Final Report • November 2005 Energy Commission of Nigeria (ECN) • United Nations Development Programme (UNDP)
16
some specific height and diameter ratio and made of brick or concrete reinforced with chicken wire. The bag digester, on the other hand, comprise of a long cylinder made of either polyvinyl chloride (PVC) or similar material. The bag will usually have inlet and outlet pipes for feedstock and slurry as well as a gas outlet pipe. While biodigesters have experienced significant breakthroughs in countries similar to Nigeria, only a handful of biodigesters presently exist in Nigeria. So far, less than 20 pilot projects on biogas have been established across the country, including a UNDP pilot project in Kano State. Wind Energy Wind speeds in Nigeria range from a low 1.4 to 3.0m/s in the southern areas and 4.0 to 5.12m/s in the extreme North. Wind speeds in Nigeria are generally weak in the South except for the coastal regions and offshore locations. In Nigeria, peak wind speeds generally occur between April and August for most sites. Initial study has shown that total actual exploitable wind energy reserve at 10m height, may vary from 8 MWh/yr in Yola to 51 MWh/yr in the mountain areas of Jos Plateau and it is as high as 97 MWh/yr in Sokoto. Hence, Nigeria falls into the poor/moderate wind regime. The Nigerian Meteorological Agency (NMA) carries out routine measurements and collection of wind data for the country. These records are available in its archives. There is also a wind mapping programme initiated by the Federal Ministry of Science and Technology. This work only covers ten selected sites across the country where detailed site study is to be carried out using about one year continuous data from wind measuring equipment. Only a few wind maps for limited sites are available. Hence there is the need to develop wind maps and update existing atlas. Wind energy utilization in Nigeria is practically minimal. The hundreds of wind pumps scattered all over the country are ill maintained and some have been abandoned. Some state governments, like Jigawa and Kano, are making efforts to install new wind pumps. There is a pilot wind electricity project in existence which is the 5 kWp Sayya Gidan Gada wind electricity project at Sokoto. In addition, a 0.75 kWp wind electricity project in the center of the town is being run on an experimental basis to prove the viability of wind farming in the area. Wind energy is one of the lowest-priced renewable energy technologies available today, costing between 4-6 cents per kilowatt-hour, depending on the wind resource base and financing of the particular project. The construction time of wind energy technology is less than other energy technologies, it uses cost-free fuel, the operation and maintenance (O & M) cost is very low, and capacity addition can be in modular form, making it adaptable to increasing demand. However, several economic, policy, technical and market barriers militate against the rapid adoption of wind power in Nigeria. These barriers must be addressed if the potentials identified and the targets set for electricity from wind power are to be realized. Hydrogen, Ocean and Geothermal Energy Hydrogen, ocean and geothermal energy are important in the long-term vision of providing secure, abundant, cost effective and clean sources of energy for Nigeria. Their
Renewable Energy Master Plan (REMP) • Final Report • November 2005 Energy Commission of Nigeria (ECN) • United Nations Development Programme (UNDP)
17
impacts might not be felt in the next few decades, but these emerging energy sources will be key to meeting future energy challenges when the country is weaned of its dependence on hydrocarbons. Hydrogen Energy Hydrogen can be produced from water using various forms of energy. It can also be extracted from anything that contains hydrocarbons, including gasoline, natural gas, biomass, landfill gas, methanol, etc. The resources base is therefore limitless. Hydrogen energy technologies are maturing and are increasingly meeting energy needs particularly in industrialised countries. The US hydrogen industry alone produces about 9 million tonnes of hydrogen annually for use in chemical production, petroleum refining, metal treatment and electrical applications. As an energy carrier, this quantity of hydrogen can power about 20-30 million cars or an equivalent of 5-6 million homes. The emerging hydrogen energy technology has the following segments: production, delivery, storage, conversion and end-use technologies. High prices and low R&D capacity are still some of the most formidable obstacles for using hydrogen in Nigeria. Moreover, the availability of low-cost fossil fuels may constitute a major disincentive to innovative technologies making an inroad into the energy market. A primary benefit of hydrogen energy to Nigeria is its potential for being the energy of last resort in the future. The resource is abundant and inexhaustible. When developed, it will contribute to the nation’s energy security in a post-fossil economy. It is also clean and will assist in addressing local and global environmental challenges such as global warming. Fuel cell, for instance, has the potential for meeting remote power needs. Hydrogen as an energy form is not produced in Nigeria, and no known importation of fuel cell technologies and other hydrogen conversion technologies are known. There is therefore no existing market for hydrogen energy in Nigeria. Ocean Energy With Nigeria’s geographical location, power from the ocean ought to be part of the long-term energy vision for the country. Oceans cover more than two-thirds of the earth’s surface. They are therefore the world’s largest solar collectors. Oceans can produce thermal energy from the sun's heat, and mechanical energy from tides and waves. While the gravitational pull of the moon drives the tides, the wind powers the ocean waves. The West African coast has a poor wave energy regime of 10kW/m. Good wave energy sites in Africa include the coast of South Africa with 40-50kW/m; while the coast of the United Kingdom presents some of the world’s best potentials of about 70kW/m. The entire southern boundary of Nigeria is covered by the Atlantic Ocean. This provides a potentially significant ocean energy resource base. However, there is no known systematic energy resource assessment conducted on the country’s coastline resources. Nigeria has a good number of institutions with the capacity to carry out research and development activities on ocean energy. These institutions include the Nigerian Institute

Renewable Energy Master Plan (REMP) • Final Report • November 2005 Energy Commission of Nigeria (ECN) • United Nations Development Programme (UNDP)
18
for Oceanographic and Marine Research in Lagos and Departments of Oceanography at the universities. However, there is currently no known systematic body of R&D on ocean energy in existence in Nigeria. Tidal Energy For tidal differences to be harnessed into electricity, the difference between high and low tides must be at least five meters. Evidence shows that there are perhaps only about 40 such sites on the planet with tidal ranges of this magnitude. Tidal barrage, tidal fence and tidal turbine are the three main technologies under investigation worldwide. The technical life of a tidal scheme could be about 120 years or upward for the civil structure. The electrical generating plant may have a technical life of about 40 years. Since the tidal resource is site specific, the plant availability will necessarily vary. Technical efficiency of the plants will also vary from the technology used. Tidal energy projects require high initial capital expenditure. It has very long construction periods and low load factors, leading to long payback periods. This leads to very high overall cost and major challenges in funding a commercial tidal project. The best sites in the UK are estimated to produce power at about 20cents/kWh. Tidal energy is clean and renewable. However, Nigeria does not seem to have a significant tidal energy resource. Wave Energy Wave energy can be converted into electricity through both offshore and onshore systems. Offshore systems are situated in deep water, typically more than 40 meters. Onshore wave systems are usually built along shorelines to extract the energy in breaking waves. Worldwide, wave energy technologies are still at various stages of commercialization. In Nigeria, the wave energy regime along the Atlantic coast does not permit the efficient deployment of today’s technologies. Ocean Thermal Energy Conversion (OTEC) Ocean Thermal Energy Conversion uses the heat energy stored in the oceans to generate electricity. OTEC works best when the temperature difference between the warmer, top layer of the ocean and the colder, deep ocean water is at 20oC. These conditions exist in tropical coastal areas, roughly between the Tropic of Capricon and the Tropic of Cancer. Geothermal Energy Geothermal energy is currently meeting an increasing proportion of the world’s energy requirements. In 2004 over 9,000 megawatts of electricity were produced from some 250 geothermal power plants in 22 countries around the world. These plants provide reliable base-load power for well over 60 million people, mostly in developing countries. In Africa, Kenya, Algeria, Tunisia and Zambia have significant installed capacities. Geothermal direct use applications provide about 10,000 thermal megawatts (MW-th) of energy in about 35 countries. Two known geothermal resources exist in Nigeria, and they are: the Ikogosi Warm Springs in Ondo State and the Wikki Warm Springs in Bauchi.

Renewable Energy Master Plan (REMP) • Final Report • November 2005 Energy Commission of Nigeria (ECN) • United Nations Development Programme (UNDP)
19
Three power plant technologies are being used to convert geothermal fluids to electricity: Dry steam plants, which directly use geothermal steam to turn turbines; Flash steam plants, which pull deep, high-pressure hot water into lower-pressure tanks and use the resulting flashed steam to drive turbines; and Binary-cycle plants, which pass moderately hot geothermal water in thermal contact with a secondary fluid with a much lower boiling point than water. This causes the secondary fluid to flash to vapor, which then drives the turbines. Direct thermal applications of geothermal energy include: hot spring bathing, agriculture, aquaculture, industrial hot water uses, heating of individual and residential districts. Heat pumps have also become widely used in temperate regions. The economics of geothermal energy is highly variable depending on applications and site-specific conditions. The cost of geothermal power production vary from USc/kWh 5 -7 for plants less than 5 MW and USc/kWh 2.5–5 for large plants of more than 30 MW for high quality reservoirs. Direct capital costs vary significantly. Large plants in high quality sites can be as low as US$750/kW and as high as US$2300/kW for small plants. Geothermal energy is not likely to play a major role in Nigeria’s future energy market. However, certain future economic factors will influence the use of existing geothermal resources and the capacity to utilize future resource discoveries.
Targets Available resource base, technologies and the market situation of the various energy sources form the basis for establishing realisable targets for the growth of the renewable energy industry in the country. The Energy Commission’s High Growth Scenario projection for energy demand and NEEDS projections form the basis to compare progress on renewable energy with the overall sector growth. The projected electricity supply, from all sources (conventional and renewable) in the short (2007), medium (2015) and long term (2025) is estimated to be 7000MW, 14000MW and 29,000MW, respectively. The Master Plan sets out broad targets for electricity and non-electric sub-sectors. Table 4 presents a breakdown of targets for each of the five renewable energy sub-sectors as a proportion of projected energy demand according to the ECN High Growth Scenario. Table 4: Targets for Installed Electricity Capacity (MW) Sources 2007 2015 2025 Wind 1 20 40 Solar PV 5 75 500 Solar thermal - 1 5 Small hydro 50 600 2000 Biomass 50 400 Total 56 746 2945 ECN High Growth Scenario Projections 7000 14000 29000 Percentage share of projected energy demand 0.8 5 10

Renewable Energy Master Plan (REMP) • Final Report • November 2005 Energy Commission of Nigeria (ECN) • United Nations Development Programme (UNDP)
20
The target contributions to the electricity supply mix from RE sources (solar, wind, small hydro, biomass) are 56MW, 701 MW and 3060 MW in the short, medium and long term respectively. This represents an achievement of 0.8%, 5% and 10.5% of total electricity demand in 2007, 2015 and 2025, respectively. Expected percentage contribution of non-electricity renewable energy sources to the overall projected energy demand will actually decline in the period of the plan. These figures will decline from 41% in 2007 to 16% and 9% for 2015 and 2025 respectively. The expected decline of the contribution of biomass to the overall energy demand will account for this trend.
Table 5: Targets for Non-Electrical Renewable Energy Production
2007.0 2015.0 2025.0
All energy forms (GWh) 193789.0 202128.0 248869.0Fuelwood & charcoal, (GWh) 144,544 121,352 95,869Fuelwood & charcoal [Biomass energy]++, (% of total) 74.6 60.0 38.5Solar thermal share of total thermal energy, (%) 10.0 20.0 40.0Ren. Energy share of total thermal energy, (%) 84.6 80.0 78.5Other non-Ren. energy share of total thermal energy, (%) 15.4 20.0 21.5Ren. Energy share of total thermal energy, (GWh) 163922.9 161777.6 195416.6Solar thermal share of total thermal energy, (GWh) 19378.9 40425.6 99547.6
Note: Biomass energy has 0, 4.3 and 6 GWh in theshort, medium and long terms respectively
Distribution of Solar Thermal Share Share, (%) Share, (GWh)2007.0 2015.0 2025.0 2007.0 2015.0 2025.0
All Solar Thermal 100.0 100.0 100.0 19378.9 40425.6 99547.6Solar Water & Air Heating 75.0 70.0 60.0 14534.2 28297.9 59728.6Solar Drying & Brooding 18.0 15.0 18.0 3488.2 6063.8 17918.6Solar Desalination, solar stills, etc. 0.0 1.0 2.0 0.0 404.3 1991.0Solar Cooking 1.0 2.0 2.0 193.8 808.5 1991.0Solar refrigeration & A/C & passive architecture 2.0 4.0 5.0 387.6 1617.0 4977.4Solar pasteurization, sterilization 4.0 3.0 3.0 775.2 1212.8 2986.4Solar Thermal Electricity 0.0 5.0 10.0 0.0 2021.3 9954.8
The implication of these targets is a rapid scale up of most of the renewable energy technology applications. Some of the highlights include a combined increase in wind power generation to 1MW, 19MW and 38MW in 2007, 2015 and 2025 respectively. Small-scale hydro plants will contribute 56MW, 600MW and 2,000MW in 2007, 2015 and 2025 respectively. A significant expansion of improved woodstoves dissemination will occur with 300,000, 500,000 and 1,000,000 units in the short, medium and long-term periods respectively. An estimated 40,000, 400,000 and 4,000,000 solar home systems will be achieved within the same periods. Solar cookers will increase from 1,500 in 2007, 50,000 in 2015 and 150,000 in 2025. Solar water heaters and chick brooders are expected to experience significant increases within the period.

Renewable Energy Master Plan (REMP) • Final Report • November 2005 Energy Commission of Nigeria (ECN) • United Nations Development Programme (UNDP)
21
Planned Activities and Milestones The REMP sets out six distinct activities with concrete milestones to be reached within the plan period. These activities are organized around the following programmes: Framework Programme for Renewable Energy Promotion; Nigerian Solar Programme; Nigerian Small Hydro Programme; Nigerian Wind Programme; Nigerian Biomass Programme; and New Energy Research and Development Programme. The Framework Program for Renewable Energy Promotion addresses a range of cross-cutting issues, including policy, regulatory and institutional framework; pricing and financing issues; product standards and quality control; capacity-building, research and development as well as public awareness. It is designed to provide the enabling environment for the attainment of the targets set for each of the technology areas. The various programs reflect a twenty-year commitment to realize the targets of the Master Plan for all the renewable energy sub-sectors. The programs will address R&D, database, market as well as capacity issues in realizing the targets of the REMP.
Strategies and Implementation Issues The Federal Government is committed to addressing key implementing issues as well as developing adequate strategies to enable the realization of the vision of the Renewable Energy Master Plan. This will involve the review of policy, legal, institutional, fiscal and regulatory instruments that would attract domestic and international investment to develop renewable energy resources in the country. A primary strategy is to evolve a participatory process in identifying necessary interventions that must be put in place. This involves the mobilization of key stakeholders in realizing a sustainable future in which renewable energy plays an important role. Key among strategies to be adopted includes the ‘leveling of the playing field’ in the energy market. This will involve the removal of hidden subsidies, or at least making them more transparent and internalizing external cost. In addition, another key element of the overall framework is the adoption of a renewable portfolio standard. This is a policy that requires that firm and realistic targets and effective strategies for renewable energies be set in consultation with other stakeholders. Another element of the policy framework is the creation of innovative fiscal and market incentives to encourage the renewable energy technology supply industry. Fiscal incentives will include preferential customs duty exemption for imported renewable energy technology components, tax credits, capital incentives and opportunities for long term preferential loans. In the short-term, the Renewable Energy Master Plan proposes a moratorium on import duties for renewable energy technologies. A zero-import duty

Renewable Energy Master Plan (REMP) • Final Report • November 2005 Energy Commission of Nigeria (ECN) • United Nations Development Programme (UNDP)
22
regime will give the needed impetus to the industry. Some potential market incentives include dedicated markets, fixed price or fixed payment approach, fixed capacity or fixed quantity target approach, and of course competitive bidding for license areas or concessions, as has long been practiced in the petroleum industry, and market franchise. The REMP further recommends the establishment of a Renewable Energy Fund, to be managed by a new National Renewable Energy Agency (NREA).The funds will provide resources for incentives, micro-credit schemes, training and R&D. The Government will put in place a framework for building capacity to attract international finance for RE in Nigeria. One pressing concern in the development of renewable electricity in the country is absence of a framework for power sales from small-scale renewable energy producers to the grid. While the Electric Power Reform Law allows for increased grid-tie opportunities, there is a need to draw up Power Purchase Agreements (PPA) between market actors. Nigeria lacks a strong institutional leadership for renewable energy. A redesign of the institutional framework leading to an actor, or set of actors that will champion the development of renewable energy is required. It will encourage efficiency in the provision and use of all types of energy; raise the quality of management and training in energy provision and use; heighten public awareness of energy-related issues; encourage local institutional reforms to help meet policy goals; and reduce environmental risks. The Renewable Energy Master Plan calls for the establishment of NREA, as an interim measure – pending when a full Ministry of Renewable Energy could be put in place. Other institutional innovations include Renewable Energy Testing Centres and the establishment of professional bodies. A new institutional design will also assist in putting in place an inter-agency collaboration to enhance the synergy between the various levels of government. Human and institutional capacity building at all levels is required to achieve the scientific, engineering and technical skills and infrastructure relevant for the design, development, fabrication, installation and maintenance of RE Systems. Capacity building in four critical areas is most essential, and these include: training of manpower to install, operate and maintain RE systems; development of manufacturing capabilities; development of critical mass of scientists, engineers, economists etc for R&D; and design and effective functioning of institutional framework. Lack of information and awareness creates market distortions that results in higher risk perception for potential renewable energy projects, as well as generate uncertainties among potential users of RE. The Federal Government will put in place a framework to systematically generate public awareness of the potentials of RE. A strong and credible national research and development policy is essential for the growth of the renewable energy industry in Nigeria. Designing and ensuring the success of RETs R&D programmes will require the articulation of near-term as well as long-term goals and targets.

Renewable Energy Master Plan (REMP) • Final Report • November 2005 Energy Commission of Nigeria (ECN) • United Nations Development Programme (UNDP)
23
Financial Implications Meeting the targets of the Renewable Energy Master Plan will demand significant investments in renewable energy systems. Tables 6.1 – 6.6 present an overview of estimated costs for these investments for all activities outlined in Chapter Four of the Master Plan. All cost estimates are in 2005 Naira.

Renewable Energy Master Plan (REMP) • Final Report • November 2005 Energy Commission of Nigeria (ECN) • United Nations Development Programme (UNDP)
24
Table 6.1 Framework Programme for Renewable Energy Promotion S/No. Programmes and Activities ST (Nm) MT (Nm) LT (Nm) Total (Nm)
1 Policy, legal and regulatory framework 0 90 32 122
2 Institutional framework 0 0 0 0 3 Economics and Financing 0 70 20 90
4 Capacity Building 100 100 100 300
5 Public Awareness 10 100 100 210
6 Inter-Agency Collaboration
10 10 10 30
7 Research and Development 50 50 50 150 8 Monitoring and Evaluation 0 10 10 20
Sub-Total 170 430 322 922 Table 6.2 Biomass Energy S/NO ST ST MT LT TOTAL
1 Data Acquisition 200 100 100 400 2 Capacity Building: Manpower 1082 2246 6,978 10,306 3 Market Development and Promotion 271 315 290 876 4 Site Identification 30 90 90 210 5 Technology Assessment & Review 10 10 15 35
6 Biogas Technology/Diffussion Programme 60 120 180 360
7 Intensive Plantation of fast growing trees 100 300 600 1000
8 Capacity Building 40 50 3100 3190 Sub-Total 1,793 3,231 11,353 16,377
Table 6.3 Solar Energy S/NO Activities ST MT LT TOTAL
1 Data Acquisition 40 80 100 220 2 Capacity Building :Manpower 60 240 260 560
3 Capacity Building : Manufacturing and Production 10 100 100 210
4 Capacity Building; Support Infrastructure 100 500 800 1400
5 Market Development and Promotion 650 1100 1100 2850
6 Research and Development Framework 50 100 200 350
7 International, Regional and Inter-Agency Cooperation 10 50 100 160
8 Public Awareness 10 10 50 70
9 Policy, legal, & regulatory framework 310 345 500 1155
Sub-Total 1240 2525 3210 6975

Renewable Energy Master Plan (REMP) • Final Report • November 2005 Energy Commission of Nigeria (ECN) • United Nations Development Programme (UNDP)
25
Table 6.4 Small Hydropower S/No. Activity ST (Nm) MT (Nm) LT (Nm) TOTAL (Nm)
1 National Survey 18 0 0 18
2 Assessment of Agricultural & Industrial Demand 6 0 0 6
3 Implementation of Fiscal measures 0 0 0 0
4 Codes and Standards 5 0 0 5
5 Institutional Structure 0 200 0 200 6 Power Purchase Agreement 3 0 0 3 7 Information System 4 0 0 4
8 Public Awareness 10 0 0 10
9 Domestic, Private Sector Participation 4 0 0 4
10 Water Resource Management 4 0 0 4
11 Pilot Schemes 14 840 1,500 2,354
12 Capacity Building 30 120 120 270
13 Research and Development 36 80 100 216
14 Private Sector Participation 0 4 6 10 Sub-Total 134 1244 1,726 3,104
Table 6.5 Wind Energy S/NO Activities ST MT LT TOTAL
1 Data Acquisition 150 100 140 390
2 Data Analysis 0 0 200 200
3 Establishment of a wind test facility 500 0 100 600
4 Capacity Building: Manpower 60 100 0 160
5
Establishment of a Hybrid Demonstration Plant 200 0 0 200
6 Policy Framework 10 0 0 10
7 Capacity Addition 0 170,000 380,200 550,200
8
Capacity Building; Support Infrastructure 0 0 30,000 30,000
Sub-Total 920 170,200 410,640 581,760

Renewable Energy Master Plan (REMP) • Final Report • November 2005 Energy Commission of Nigeria (ECN) • United Nations Development Programme (UNDP)
26
Table 6.6 New Energy Research And Development Programme Table 6.6.A Hydrogen Energy
S/NO Activities ST MT LT TOTAL
1 Research and Development Centres 5 5 50 60
2 Proposal Development 2 10 50 62 3 Appropriation 0 0 30 30 4 Budget Line 0 0 0 0
5 Commencement of Research 10 25 0 35
Sub-Total 17 40 130 187 Table 6.6.B Ocean Energy
S/NO Activities ST MT LT TOTAL
1 Research and Development Centres 5 5 50 60
2 Proposal Development 2 10 50 62
3 Appropriation 0 0 30 30
4 Budget Line 0 0 0 0
5 Commencement of Research 10 25 0 35
Sub-Total 17 40 130 187 Table 6.6.C Geothermal Energy
S/NO Activities ST MT LT TOTAL
1 Research and Development Centres 5 5 50 60
2 Proposal Development 2 10 50 62
3 Appropriation 0 0 30 30
4 Budget Line 0 0 0 0
5 Commencement of Research 10 25 0 35
Sub-Total 17 40 130 187 GRAND TOTAL 4,308 177,750 427,641 609,699

Renewable Energy Master Plan (REMP) • Final Report • November 2005 Energy Commission of Nigeria (ECN) • United Nations Development Programme (UNDP)
27
Implementing the REMP will demand an estimated investment portfolio of 4 billion, 178 billion and 610 billion Naira, in the short (2005 – 2007), medium (2008 – 2015) and long term (2016 – 2025), respectively. Financing these investments will depend on the mobilization of resources from Governments at all levels, the domestic private sector and international sources. International investments will include foreign direct investments (FDI), grants and projected revenues from carbon credits.
Risk Analysis Certain risks to the realization of the objectives and targets of the REMP are prevalent. These include policy and political risks, market volatility, energy pricing, changes in financing parameters, environmental as well as risks associated with standards and quality control. As is the case with any new programme, some degree of uncertainty exists over the initial adoption of the Master Plan, and when adopted, if stakeholders will generate enough commitment to fully implement the various outlined activities. Policy inconsistency, frequent personnel changes and contending interests within government often consign government plans like the REMP to the shelf. Likewise, possible regime change tends to throw away plans with the administration that created them. Furthermore, support for the plan by the international community depends on their priorities. This has been known to suffer sudden changes in the past. As energy reforms increasingly adopt market-based instruments, risks such as macro economic instability, international demand and supply capacities of producers of renewable energy technologies as well as developments in the market for alternative fuels become salient issues. With the weakness of Nigeria’s emerging renewable energy industry, managing these risks can be daunting. In many cases, market volatility influences prices for various renewable energy systems and create a disincentive for widening their uses. However, given Nigeria’s large population and undeveloped markets, the potential demand, and hence the domestic market, is high. This will assist in mitigating market risks. The financial markets also present crucial risks. Increases in interest rates, volatility of exchange rates, poor or non-implementation of agreed financial incentives, inadequate access to credit and capital as well as instability in the ongoing financial reforms – all constitute significant risks. Added to these are the uncertainties with regards to funding support from donor agencies and the inflow of foreign direct investments. Managing these risks requires partnerships between market actors, the government and the international community. Environmental risks are also prevalent in several renewable energy projects. These might affect land use, result to resettlements or cause aesthetic damages. Environmental impact

Renewable Energy Master Plan (REMP) • Final Report • November 2005 Energy Commission of Nigeria (ECN) • United Nations Development Programme (UNDP)
28
assessments, environmental audits and strategic planning are some of the instruments that assist in managing these risks. Standards and quality control are also issues that inhibit the development of renewable energy. As relatively newer technologies, there is always a perception that these are untested technologies. Poorly developed standards and testing procedures assist in allowing market entry by sub-standard products and unprofessional people, resulting in damaging public perception of the technologies.

Renewable Energy Master Plan (REMP) • Final Report • November 2005 Energy Commission of Nigeria (ECN) • United Nations Development Programme (UNDP)
29
SSeeccttiioonn TTwwoo CChhaapptteerr 11:: RRaattiioonnaallee ffoorr,, VViissiioonn aanndd OObbjjeeccttiivveess ooff RREEMMPP 1.0 Introduction
1.1 Energy situation in Nigeria Nigeria is endowed with a rich energy resource base. Table 1.0 gives an overview of the energy resources available in the country. The country possesses the sixth largest reserves of crude oil and the ninth largest natural gas reserve in the world. Associated and non-associated natural gas reserves are in the ratio of 53.5:46.5. The Federal Government has intensified efforts to exploit tar sands. Coal is widely available in 13 of the 36 states of the Federation. In energy terms, crude oil, tar sands and natural gas are of comparable levels of reserve at 31.1%, 29.2% and 26.7% of total fossil fuels, respectively. Table 1.0 Nigeria’s Energy Reserves/Potentials Resource Reserves Reserves
Billion toe % Fossil
Crude oil 33 billion bbl 4.488 31.1
Natural gas 4502.4 billion m3 (159 trillion scf)
3.859 26.7
Coal & Lignite 2.7 billion tonnes 1.882 13.0
Tar Sands 31 billion bbl oil equiv. 4.216 29.2 Sub-Total (Fossil Fuels) 14.445 100.0 Hydropower, large scale 10,000MW
Hydropower, small scale 734 MW Provisional
Fuelwood 13,071,464 has (forest land 1981)
Estimate
Animal waste 61million tones/yr “ “
Crop Residue 83million tones/yr “ “
Solar Radiation 3.5-7.0kWh/m2-day Wind 2-4 m/s (annual average)
The Rivers Benue and Niger provide Nigeria with a formidable potential for hydropower. Currently only about 20% of this potential is tapped. Small hydro development around the country’s seven river basins is minimal. Woodlands occupy 15.4% of the total land and marine mass of the country. This vegetative cover is being denuded due to the incursion of agriculture, energy use and other natural and man-made factors. The average

Renewable Energy Master Plan (REMP) • Final Report • November 2005 Energy Commission of Nigeria (ECN) • United Nations Development Programme (UNDP)
30
solar radiation in Nigeria is about 5.5kWh/m2-day. The wind regime is moderate with the best conditions along the coast and in the mountainous areas of the North. The demand for energy in Nigeria has previously been dominated by fuelwood. Today, its share of the total demand is 37%. Households consume about 95% of fuelwood. The share of natural gas has risen to 34%, and is set to rise even further with growth in gas-based power production. Hydropower comes third at about 24%, while other non-gas petroleum products represent 5%. Despite significant coal deposits, the consumption of coal is almost insignificant. The energy supply infrastructure has remained inadequate in meeting the growing demand of the economy. With the exception of urban supplies that are catered for by commercial dealers, fuelwood is freely collected by rural dwellers. There is a significant mismatch between the rate of consumption for wood and the rate of reforestation. To meet the demand for petroleum products, the country has four refineries with a nominal capacity of 445,000 barrels per day. Presently, average capacity is less than half of the total installed capacity. Much of the country’s current consumption is imported. Natural gas is used for power production, LPG for heating and exports as liquefied natural gas. The West African Gas Pipeline opens an additional opportunity for gas exports. Presently the nominal electricity generating capacity is less than 6,000MW. Actual output represents about half of the installed capacity. Government plans to boost power production through new gas plants and Independent Power Producers (IPPs)
1.2 Development and Energy Challenges Nigeria is facing formidable economic, social and human development challenges (see Table 1.1). Of all the challenges confronting the country, none is as critical and daunting as the deepening level of poverty. Incidence of poverty increased from 28.1 percent in 1980 to 65.6 percent in 1996. While 18.26 million Nigerians were poor in 1980, the population living in poverty in 1996 swelled to 76.1 million. The NEEDS estimates that about 70 percent of the population is currently living under poverty. Given an estimated current population of about 130 million, the number of poor Nigerians is over 93 million. The UNDP Human Development Report paints even a bleaker picture with the assessment that nine in ten Nigerians live on less than two dollars/day – nearly 120 million people. With 2002 GDP of about $45 billion and per capita income of only about $290, Nigeria is one of the poorest countries in the world. Despite huge incomes from crude oil exports,

Renewable Energy Master Plan (REMP) • Final Report • November 2005 Energy Commission of Nigeria (ECN) • United Nations Development Programme (UNDP)
31
Table 1.1: Nigeria Development Profile the standard of living has progressively fallen in the past twenty years. External debts represent about 70 percent of GDP; while domestic debts owed contractors, pensioners and local banks continue to put pressure on government finances. Since the 1980s the economy has not grown at rates that increase productivity, generate jobs and reduce poverty. Economic decline in Nigeria has been driven by several forces, among which include, poor economic management, macroeconomic volatility,
unattractive investment climate, poor infrastructure, weak private sector, high cost of funds and a debilitating level of access to energy services. The relationship between energy and economic development represents a tremendous paradox in Nigeria. Large incomes from oil and abundance of energy resources – including, oil, gas, coal, hydro, biomass and solar radiation, have not necessarily led to growth and development. Indeed, domestic production of energy has remained nearly static over the years of phenomenal export of oil and gas; and in some years, it has actually decreased from erstwhile levels. The GDP (without the exported oil component) has commensurably remained static or decreased over the same years of oil and gas export growths. Most manufacturers have had to resort to self-generated electricity to keep from going under. There is now, however, a growing consensus that renewable energy resources could play an increasing role in meeting the development challenges facing Nigeria today. These challenges include accelerating economic growth, reducing poverty, promoting human development and addressing environmental concerns. The Federal Government is committed to reaching the MDG targets of reducing by half the number of people living under extreme poverty by the year 2015. This commitment is strongly embedded in the NEEDS. Access to cost-effective and sustainable energy services is critical to re-launching the Nigerian economy and meeting MDG and NEEDS targets. However, barely 40 percent of all Nigerians have access to electricity services. This leaves about one hundred million Nigerians literarily in the dark, while generation shortages and poor transmission and distribution infrastructure consigns the industrial and services sectors to under-performance. The power sector is so inadequate that it constitutes a major roadblock to economic progress and social well-being. The economy suffers from petroleum product supply constraints as well as poor gas infrastructure and utilization. Beyond the formal sector, denudation of forest resources and wood scarcity remain a crisis unfolding in slow motion. Biomass energy accounts for 37% of the aggregate national energy demand, and
Population 133 million GDP (2002) $45 billion GDP (1980) $93 billion GDP per capita (2002) $290 GDP per capita (1980) $890
(1980) Life expectancy at birth 47 years Under-5 mortality per 1000 births 153 Under-5 malnutrition 36% Adult illiteracy rate 36% Population below $1/day 70% Population below $2/day 91%

Renewable Energy Master Plan (REMP) • Final Report • November 2005 Energy Commission of Nigeria (ECN) • United Nations Development Programme (UNDP)
32
ninety-five percent of rural energy use.i The diminishing stock of fuelwood will compound the problem of poverty reduction and challenge efforts to empower women, children and fuelwood merchants. In many ways therefore, the energy sector in Nigeria is ripe for reforms. Among the key elements of the Federal Government’s energy policy reform is the accelerated promotion of renewable energy resources and technologies. The National Energy Policy (NEP) sets the framework for the development of the nation’s renewable energy resources. Among other things, the policy seeks to ensure the development of the nation’s energy resources for the achievement of national energy security and an efficient delivery system with optimal energy resource mix. It further aims at guaranteeing adequate, reliable and sustainable supply of energy at appropriate costs and in an environmentally friendly manner. The NEP moreover, seeks to ensure a comprehensive, integrated and well-informed energy sector plans and programmes for effective development. The policy articulates in details, the Federal Government’s aims, objectives and strategies on all renewable energy resources.
1.3 Drivers for Change Building a post-fossil economy is possible. Despite the obstacles to growth for renewable energy – high prices, unsupportive policies, poorly regulated product quality, weak supply chain and inadequate public awareness – Nigeria’s vision of an economy increasingly driven by renewable energy is achievable in the next two decades. Several factors will drive this transformation. Abundant renewable resources. The Nigerian renewable energy resource base is enormous. The country lies within the sunshine belt – creating opportunities for everybody everywhere to meet their energy needs. Annual average daily solar radiation varies from about 3.5 kWh/m2/day in the South to 7 kWh/m2/day in the northern arid region. Annual average sunshine hours vary from 4 to 9 hours/day, while the 10m height annual average wind speed varies from 2- 4 m/s – all with the same increasing trend from the South to the North. There are seven river basins in the country, namely Sokoto River, Niger, Hadejia-Jama’re, Chad, Upper Benue, Lower Benue and Cross River. Each of these has small-scale hydropower potentials estimated to be about 734.2 MW. There are of course the major rivers, namely, the Niger, Benue and Cross Rivers which have large scale hydropower potentials estimated at over 10,000MW. FORMECU estimates of forest and wood land area is approximately 13 million ha., while the production of animal wastes and crop residue have been estimated at 61 and 83 million tons/year, respectively. As hydrogen and ocean energy technologies mature, the renewable energy opportunities will expand. Energy Demand. In twenty years, Nigeria’s population will almost double. Aggregate energy demand will more than triple. The rapidly growing demand for energy will create opportunities for renewable energy. Conventional energy sources alone will not meet the challenges of an increasing population at affordable costs and in a flexible manner. Expanding economic opportunities to rural areas will particularly demand an aggressive deployment of renewable energy options. Increasing demand for rural water supply,

Renewable Energy Master Plan (REMP) • Final Report • November 2005 Energy Commission of Nigeria (ECN) • United Nations Development Programme (UNDP)
33
lighting, health services and the needs of micro enterprises are already driving the market for PVs. This trend will continue to drive small hydro and wind power plants, while dwindling fuelwood reserves will drive improved utilization of biomass, and demand for alternatives to fuelwood. Power sector reforms. NEPA’s unbundling generation, transmission and distribution components will eliminate the present monopoly and enable the emergence of IPPs. The development of a competitive wholesale power market; self-generation by end-users, privatization and commercialization as well as competitive retail power markets will all provide greater incentives for the development of renewable energy. As grid extension may not expand rapidly to rural areas under market forces, renewable alternatives for off-grid power supply provide alternative solutions. Presently, likely renewable candidates for power generation will be small hydropower, solar PVs and cogeneration technologies, with wind and biomass providing additional opportunities. The proposed Rural Electrification Agency and the Rural Electrification Fund have clear mandates to provide technical and financial support to renewable energy projects. International development. The initial impetus for intensive development and increased dissemination of renewable energy worldwide was the oil shock of the 1970s. This led to accelerated spending on RE research and development. Innovations that followed have resulted in dramatic price reductions for PVs and wind power, while small hydro and biomass have witnessed significant positive technological and price changes. Beyond the security of energy supplies, concerns over global warming have driven an unprecedented attention to renewable energy development. Donor support has been important in accelerating policy reforms, planning and programming on renewable energy in Nigeria. The convergence of international interest, technology and investment finance will continue to propel the sector. Presently, international instruments such as the Clean Development Mechanism (CDM) and Global Environmental Facility (GEF) as well as several bilateral initiatives provide technical and financial support to the sector. However, not all international developments will be supportive of a rapid scale up of renewable energy systems. The capacity of major producers of renewable energy systems to meet a stretched world demand is in doubt. For instance, the imbalance between current demand and supply of solar photovoltaic modules are already slowing down price reduction targets for these particular technologies. Technological change and prices. Cost reduction through technological innovation has driven the renewable energy market worldwide. According to the International Energy Agency (2003), high cost reduction is expected from technologies that are expensive and are recent in development. For instance, solar technologies are expected to reduce their costs by some 30-50% in the next two decades as a result of learning and market growth. Medium cost reduction potential is expected among technologies that have both low to medium cost range and are relatively recent in development. Wind is expected to reduce its cost by some 25% in the next two decades on this basis, and geothermal by some 10 –25% in the same period. Small cost reduction potential is likely among mature technologies, for instance, small hydropower and biomass. Only about 5-10% reduction in cost is expected in the next two decades for these more mature technologies.

Renewable Energy Master Plan (REMP) • Final Report • November 2005 Energy Commission of Nigeria (ECN) • United Nations Development Programme (UNDP)
34
Environment. A convergence of environmental challenges will continue to focus public spending on renewable energy. First and foremost is desertification in Northern Nigeria as well as hydro-geological changes in the region. The loss of biomass cover will expand the scope for improved efficiency in biomass conversion; while the lowering of the water table in the North will continue to make PVs, wind and perhaps small hydro relevant choices in water supply. Global warming and activities to mitigate the greenhouse effect are already directing public funding towards renewable energy initiatives. Energy security. While the security of energy supplies is at the center of policies in several developed and emerging economies of the world, Nigeria is currently richly endowed with energy resources, particularly petroleum. In a few decades, the availability of fossil fuel will however become an issue. Declining reserve-to- production ratio is already affecting North Sea petroleum producers. Weaning the country of its dependence on petroleum will require adjustment in policies that enables the mainstreaming of RE in energy policymaking. Securing the energy foundations of future development will require going beyond today’s mature technologies. In the long-term, energy security for future generations will underscore national attention to ocean, geothermal energy, and particularly hydrogen energy. Meeting NEEDS and MDG targets. The new economic development programme sets several targets for overall growth of the economy as well as improvements in the social sectors, including education, health services, water supply and employment. It outlines key sectoral targets and strategies for meeting them. Renewable energy resources, technologies and emerging energy markets create new opportunities for developing growth poles in the economy, expanding access to social services and reducing poverty. While energy alone does not guarantee progress in meeting MDGs, the diffusion of non-conventional energy is supportive of efforts to fast-track poverty reduction, decline in the burden of diseases, provision of safe water supply and sanitation, school enrolment, quality education and gender equality.
1.4 Rationale for the Renewable Energy Master Plan There are several compelling reasons to embark on the REMP. First and foremost, Nigeria’s petroleum age will likely expire in a few decades. There is a need for a post-fossil national energy vision. While increased exploitation of gas provides a bridge to a low carbon energy future, renewables loom large in the long-term energy vision for the country. Since renewable energy technologies and markets are at various stages of maturity, actions are needed today in preparing tomorrow’s Nigerians to meet their own energy needs. The REMP provides a roadmap to meeting Nigeria’s renewable energy vision. Second, despite remarkable progress made in the development of several renewable energy technologies, most of them are still at a junction between scientific research and the energy marketplace. What is needed is a properly coordinated policy and implementation framework that supports an accelerated market development for these

Renewable Energy Master Plan (REMP) • Final Report • November 2005 Energy Commission of Nigeria (ECN) • United Nations Development Programme (UNDP)
35
technologies. Creating a level playing field will support such ready-for-the-market technologies such as solar PV, solar thermal, small hydro, wind, cogeneration, biomass briquetting and improved woodstoves. Third, two-thirds of the population of Nigeria resides in rural area. Integrated rural development will require increased access to energy services. Centralized energy forms, primarily grid electricity may either be too costly or may take a long time to reach most rural areas, especially as the sub-sector becomes market-driven. Decentralized renewable energy sources and technologies often will provide modern, convenient and cost-effective alternatives to centralized sources. Fourth, the restructuring of the electricity supply industry will among other things lead to a competitive wholesale power markets, increased self-generation by end-users, accelerated privatization and commercialization, unbundling of generation, transmission and distribution and a competitive retail power market. These reforms have profound impacts on the development of renewable energy in the country. More competition may lead to the reduction of subsidies and eventually costs, increase access to information and reduce transaction costs. The setting up of the Rural Electrification Agency and the Rural Electrification Fund provide important opportunities to focus on and finance renewable energy. Fifth, for specific technological and market conditions, some renewable energy resources, including wave, tide, geothermal, hydrogen and liquid biomass require special attention. It is therefore in the national interest to plan research and development activities that keeps Nigeria at an advantage in the development of these technologies. Sixth, renewable energy is benign to the environment. Reducing indoor air pollution, promoting urban air quality and the global climate are issues that are high on the national development agenda. A master plan that promotes renewable energy use is supportive of a cleaner and sustainable development. Finally, as many players become involved in renewable energy development and implementation activities, there is need for overall guide that will ensure that all the activities are complimentarily integrated and channeled towards the same national goals.
1.5 Nigeria’s Renewable Energy Vision The National Economic Empowerment and Development Strategy (NEEDS) sets out a bold new vision to return Nigeria to the path of growth, stability and sustainable development. The Renewable Energy Master Plan (REMP)’s vision is based on the core values, principles and targets of the NEEDS. It is further anchored on the commitment of Nigeria to achieve the Millennium Development Goals (MDGs). The vision is inspired by the objectives and strategies of the National Energy Policy (NEP) on renewable energy. It takes full recognition of various national initiatives including the Power Sector Reform Act, the Rural Electrification Strategy and the Integrated Rural Development Policy. It is further inspired by the 2004 international commitment of world leaders in Bonn to

Renewable Energy Master Plan (REMP) • Final Report • November 2005 Energy Commission of Nigeria (ECN) • United Nations Development Programme (UNDP)
36
accelerate the utilization of renewable energy, and the opportunities to build a sustainable future for Nigeria and the world. Towards the coming decades, Nigeria envisions a peaceful and prosperous nation driven increasingly by renewable energy. By the middle of the century, sustainable and affordable energy will provide half of the country’s energy demand. Fossil fuels, especially crude oil, have transformed modern Nigeria. Crude oil has created opportunities for prosperity by injecting over 300 billion USD to the economy. Crude oil, natural gas, large hydro and previously coal provided the foundation for building the current energy economy. Meanwhile, woody biomass has remained the cornerstone of rural energy supply. However, this fossil-led energy economy is under severe threat.
An exact prediction of the end of history for petroleum is not yet possible. Crude oil reserves will however slowly but certainly run out in decades to come. Low seasonal water levels are already putting large-scale hydroelectric plants under pressure. The River Niger has shrunk to only a fraction of its normal size. Human activities, including climate change will in the near future exert even more pressure on hydro resources. Strikingly, the energy of last resort for the poor – biomass, is fast being depleted. An increasingly encroaching Sahara Desert, expanding agricultural activities, logging and the daily scramble for wood in villages are pointers to a silent crisis. In many ways, the energy foundation of modern Nigeria is flagging. In the coming years, crude oil will continue to fuel the
development of the country. However, in the medium term, Nigeria envisions an energy transition from crude oil to a less carbon intensive economy powered by gas. Gas will provide a bridge to a future that is more secure, prosperous and sustainable. Within the next ten years, gas will overtake crude oil as a source of revenue; provide a basis for reliable power supply and a cleaner environment. More so, effective management of gas resources will assist Nigeria in meeting the MDGs in 2015. By 2025, gas will increasingly provide a bridge to a renewable energy driven economy. The transition to a post-fossil economy will not be complete over the two decades of the REMP. However, renewable energy will increasingly offer alternative solutions to key development challenges facing Nigeria.
1.6 Objectives of the Renewable Energy Master Plan The overall objective of the REMP is to articulate a national vision, targets and a road map for addressing key development challenges facing Nigeria through the accelerated development and exploitation of renewable energy. It will put in place a comprehensive framework for developing renewable energy policies, legal instruments, technologies,
“Nigeria envisions a peaceful and prosperous
nation driven increasingly by
renewable energy. By the middle of the
century, sustainable and affordable renewable
energy will provide half of the country’s total
energy demand”.

Renewable Energy Master Plan (REMP) • Final Report • November 2005 Energy Commission of Nigeria (ECN) • United Nations Development Programme (UNDP)
37
manpower, infrastructure and market to ensure that the visions and targets are realized. Among other things, the master plan has the following specific objectives:
• Expanding access to energy services and reducing poverty, especially in the rural areas;
• Stimulating economic growth, employment and empowerment; • Increasing the scope and quality of rural services, including, schools, health
services, water supply, information, entertainment and stemming the migration to urban areas;
• Reducing environmental degradation and health risks, particularly to vulnerable groups such as women and children;
• Improving learning, capacity-building, research and development on various renewable energy technologies in the country; and
• Providing a road map for achieving a substantial share of the national energy supply mix through renewable energy, thereby facilitating the achievement of an optimal energy mix.
1.7 Expected Outputs The master plan sets clear and verifiable national targets in the short, medium and long term. Short-term targets are to be achieved by the year 2007 when the term of the present administration will end. Medium-term targets will be achieved by the year 2015 coinciding with the target year of the MDGs. Long-term targets are set for 2025, – two decades after the launching of the REMP. By 2007, the REMP envisages an aggregate electricity demand of about 7000MW with new renewable energy (excluding large scale hydro) playing a marginal role. In 2015, the country will likely achieve a doubling of electricity demand to about 14000MW of which new renewables will constitute about 5% (701MW). In 2025, aggregate electricity demand will increase to 29000MW with new renewable energy making up 10% of the total energy demand of the country. Small hydro plants will represent over 66% of the entire new renewable energy contribution; solar PV 17%, biomass 14%, wind 1.3% and solar thermal 0.7%. Expected contribution of non-electricity renewable energy sources to the overall projected energy demand will actually decline in the period of the plan. These figures will decline from 41% in 2007 to 16% and 9% for 2015 and 2025 respectively. The expected decline of the contribution of fuelwood to the overall energy demand will account for this trend. The implication of these targets is a rapid scale up of most of the renewable energy technology applications. Some of the highlights include a combined increase in wind power generation to 1MW, 19MW and 38MW in 2007, 2015 and 2025 respectively. Small-scale hydro plants will contribute 56MW, 600MW and 2,000MW in 2007, 2015 and 2025 respectively. A significant expansion of improved woodstoves dissemination will occur with 300,000, 500,000 and 1,000,000 in the short, medium and long-term

Renewable Energy Master Plan (REMP) • Final Report • November 2005 Energy Commission of Nigeria (ECN) • United Nations Development Programme (UNDP)
38
periods respectively. An estimated 40,000, 400,000 and 4,000,000 solar home systems will be achieved within the same periods. Solar cookers will increase to 1,500 in 2007, 50,000 in 2015 and 150,000 in 2025. To reach the set targets, REMP outlines concrete activities and milestones, reviews key make or break implementation issues and identifies risks and how they can be managed. The REMP has developed a number of concept notes for potential projects. These concept notes are found in the annex.

Renewable Energy Master Plan (REMP) • Final Report • November 2005 Energy Commission of Nigeria (ECN) • United Nations Development Programme (UNDP)
39
Chapter 2: Renewable Energy Resources, Technologies and Markets 2.0 Introduction This chapter first considers the renewable energy resource potentials in Nigeria, the status of the database including its adequacy and gaps. The technical and technological assessment section follows with an overview of the various technologies in each renewable energy sub-sector. Finally, the chapter surveys the market situation providing comparative international experience as appropriate. A detailed analysis of present demand and supply situation is then made for each sub-sector followed by a consideration of the key drivers for each renewable energy sub-sector. Finally, the gaps and barriers to the development of each renewable energy technology market are outlined and analyzed. The order of consideration of the sub-sectors is as follows: Hydro Power, Solar Energy, Biomass Energy, Wind Energy, and Hydrogen, Marine, Ocean and Geothermal Energy.
2.1 Hydro Power Hydropower is derived from the potential energy available from water due to the height difference between its storage level and the tailwater to which it is discharged. Power is generated by mechanical conversion of the energy into electricity through a turbine, at a usually high efficiency rate. Depending on the volume of water discharged and height of fall (or head), hydropower can be large or small. Although there may not be any international consensus on the definition of small hydropower, an upper limit of 30 MW has been considered. Thus, 30 MW has been adopted as the maximum rating under this dispensation. Small hydro can further be sub-divided into mini hydro (<1MW) and micro hydro (<100KW). Thus both mini and micro hydro schemes are subunits of the SHP classification. 2.1.1 Hydro Resource Situation Globally, hydropower is a very significant contributor to energy systems. Nigeria is endowed with abundant water resources. Annual rainfall decreases from a high of 3400mm depth in the south central shores of the Niger Delta to 500mm over the northern boundaries of the country, with a perched increase to 1400mm over central Jos Plateau region. Similarly, the eastern ranges of Adamawa and Cameroon boundaries experience elevated precipitation as high as 2,000mm relative to contiguous low areas of the country. Rainfall duration is longest in the South and decreases progressively northwards. In the southern areas, precipitation lasts over 8 months of the year, whereas at the extreme north annual rainfall duration can be less than 3 months. From the isohyetal and river system map shown in Fig. 2.1.1 it is clear that the country is blessed with a huge hydropower potential. The most attractive areas would be the southern, Plateau and Southeastern regions of the country, where rainfall is highest and of long duration and local topography provides appropriate drops and necessary hydraulic heads. It is also evident that the run-of-the-river SHP is unlikely to operate year round, except in the South and South-eastern areas where river and stream flows are perennial. In the

Renewable Energy Master Plan (REMP) • Final Report • November 2005 Energy Commission of Nigeria (ECN) • United Nations Development Programme (UNDP)
40
northern and Jos Plateau regions where stream flows are substantially ephemeral, the SHP would require flow regulation via storages and reservoirs. All the same, small hydropower can essentially be developed in virtually all parts of the country.

Renewable Energy Master Plan (REMP) • Final Report • November 2005 Energy Commission of Nigeria (ECN) • United Nations Development Programme (UNDP)
41
Fig. 2.1.1: Nigeria’s Isohyetal Map

Renewable Energy Master Plan (REMP) • Final Report • November 2005 Energy Commission of Nigeria (ECN) • United Nations Development Programme (UNDP)
42
2.1.1.1 Estimated Resource Base From NEPA’s most recent estimate, the country’s outstanding total exploitable hydro potential, listed in Table 2.1.1 currently stands at 12,220 MW. Added to the 1930 MW (Kainji, Jebba and Shiroro), already developed, the gross hydro potential for the country would be approximately 14,750 MW. Current hydropower generation is about 14% of the nation’s hydropower potential and represents some 30% of total installed grid-connected electricity generation capacity of the country. Table 2.1.1: NEPA Estimate of Current Exploitable Hydro Power Sites in Nigeria
Location River Installed Potential Capacity MW
Donka Niger 225 Zungeru II Kaduna 450 Zungeru I Kaduna 500 Zurubu Kaduna 20 Gwaram Jamaare 30 Izom Gurara 10 Gudi Mada 40 Kafanchan Kongum 5 Kurra II Sanga 25 Kurra I Sanga 15 Richa II Daffo 25 Richa I Mosari 35 Mistakuku Kurra 20 Korubo Gongola 35 Kiri Gongola 40 Yola Benue 360 Karamti Kam 115 Beli Taraba 240 Garin Dali Taraba 135 Sarkin Danko Suntai 45 Gembu Dongu 130 Kasimbila Katsina Ala 30 Katsina Ala Katsina Ala 260 Makurdi Benue 1,060 Lokoja Niger 1,950 Onitsha Niger 1,050 Ifon Osse 30 Ikom Cross 730 Afokpo Cross 180 Atan Cross 180 Gurara Gurara 300 Mambilla Danga 3,960 Total 12,220
From a 1980 survey of 12 of the old States of the Federation, namely; Sokoto, Katsina, Niger, Kaduna, Kwara, Kano, Borno, Bauchi, Gongola, Plateau, Benue and Cross River, it was established (Table 2.1.2), that some 734 MW of SHP can be harnessed from 277

Renewable Energy Master Plan (REMP) • Final Report • November 2005 Energy Commission of Nigeria (ECN) • United Nations Development Programme (UNDP)
43
sites. The potential would of course increase when the rest of the country is surveyed. It is presently estimated by the Inter-Ministerial Committee on Available Energy Resources (2004) that the total SHP potential could reach 3,500 MW, representing 23% of the country’s total hydropower potential. Table 2.1.2: Small Hydro Potential in Surveyed States of Nigeria
S/No State (pre 1980)
River Basin Total Sites
Total Capacity (MW)
1 Sokoto Sokoto-Rima 22 30.6 2 Katsina Sokoto-Rima 11 8 3 Niger Niger 30 117.6 4 Kaduna Niger 19 59.2 5 Kwara Niger 12 38.8 6 Kano Hadeija-Jamaare 28 46.2 7 Borno Chad 28 20.8 8 Bauchi Upper Benue 20 42.6 9 Gongola Upper Benue 38 162.7 10 Plateau Lower Benue 32 110.4 11 Benue Lower Benue 19 69.2 12 Rivers Cross River 18 258.1 Total 277 734.2
Listed in Table 2.1.3 are the small hydro schemes under operation in the country. As indicated, the projects are developed only in three states of the federation, namely; Plateau, Sokoto and Kano. Of the total 30 MW installed capacity, 21 MW (or 70%) is generated from 6 sites in Plateau State by the Nigerian Electricity Supply Corporation Ltd. (NESCO). Table 2.1.3: Existing Small Hydro Schemes in Nigeria
S/No River State Installed Capacity (MW)
Bagel I Plateau 1 1 Bagel II Plateau 2
2 Ouree Plateau 2 3 Kurra Plateau 8
Lere I Plateau 4 4 Lere II Plateau 4
5 Bakalori Sokoto 3 6 Tiga Kano 6 Total 30

Renewable Energy Master Plan (REMP) • Final Report • November 2005 Energy Commission of Nigeria (ECN) • United Nations Development Programme (UNDP)
44
Table 2.1.4: NESCO Small Hydro Projects in Plateau State
PROJECTS S/No Items Kwali Ankwil I Ankwil II Kurra Jekko I Jekko II
1 River Ouree Tenti Tenti Tenti Sanga Sanga Reservoir Area (sq km) 0.14 5.1 0.23 4.8 0.4 0.02 Capacity (MCM) x 106
0.63 31 1.16 17 1.4 1.4
2
Discharging (m3/sec)
271 228 343 571 685 685
Table 2.1.4 Cont’d. Kwali Ankwil I Ankwil II Kurra Jekko I Jekko II
Dam Height (m) 9 27 9 19 9.75 6 Crest Length (m)
274 708 203 1,067 128 23
Volume (MCM)
90,500 521,240 46,578 348,654 6,000 700
Altitude (ASL)
1,068 1,274 1,274 1,172 870 674
Type Earthfill Earthfill Earthfill Earthfill Concrete Concrete
3
Spillway Ogee Underflow Underflow Broad Crested Weir
Ogee Ogee
Power Plant 4 Output (MW)
2 1 2 8 4 4
5 Yr of Completion
1923 1964 1963 1929 1937 1950
Source: Nigerian Electricity Supply Corporation Ltd (NESCO), Jos As indicated in Table 2.1.4, NESCO projects were completed between 1923 and 1964 and have continued to provide virtually uninterrupted power to not only supply the Jos metropolis and meet local consumption, but also feed into the national grid. NESCO operations are a clear example of a very successful independent power production (IPP) that should be replicated in other parts of the country. 2.1.1.2 Status of Database As noted in Section 2.1.1.1, the database on Small Hydro in Nigeria is quite limited, incomplete and substantially obsolete. Only 12 sites were surveyed some 20 years ago and to date no new surveys have been conducted to either confirm/verify earlier data or extend the work over the uncovered States, which, incidentally, occupy the most promising south-western and southeastern regions of the country where precipitation is high and most streams and rivers are perennial.

Renewable Energy Master Plan (REMP) • Final Report • November 2005 Energy Commission of Nigeria (ECN) • United Nations Development Programme (UNDP)
45
Every effort should be made to complete the survey over the entire country developing new data and verifying existing information. Data can be assembled through the River Basin Development Authorities, State and Local Governments, NEPA, State Rural Electrification Boards and relevant NGO’s under the responsibility of the Energy Commission of Nigeria (ECN). Data thus generated should be organized in appropriate reports and stored in other suitable formats for easy retrieval and application. For each potential small hydro site, data to be assembled should cover, among other items: rainfall depths and duration; river and stream systems including flow rates and duration; seasonal and long-term variation of flows; local topographical features; suitability of site for reservoir development; geology; demographic characteristics; community trades and employment; land use; status of power supply in the area; developable small hydro capacities; cost of schemes; project feasibility and requirements for hydro system implementation. 2.1.2 Technical Assessment 2.1.2.1 Overview of Technology A relatively simple technology, SHP depends on the availability of water flow or discharge and a drop in level over the river course. For the run-of-the-river scheme, where there is no impoundment, computation of the hydropower only requires a determination of the magnitude of the discharge and the head or vertical distance of the waterfall. The flow can be measured by the bucket method, which simply determines the time taken to fill a bucket of a known volume. Discharge can also be determined by the velocity method, where a weighted float is timed over a longitudinal flow path, and stream depths are measured across the flow section to determine the cross-sectional area. Where the topography permits the hydro yield is firmed up by the construction of a small dam which creates a reservoir. The storage provides additional head and flow regulation, thereby increasing power output and extending power generation over low-flow periods. Other components of the small hydro include the penstock, a turbine which transforms the energy of flowing water into roatational energy, an alternator which converts roatational energy into electricity, a regulator which controls the generators, and wiring which delivers the electricity to the end users. In many systems, an inverter is incorporated to convert the resulting low-voltage direct current (DC) into 220 or 240 volts alternating current (AC) compatible with existing national power systems. Sometimes excess power is stored in batteries for use during periods of low flow or water scarcity. While the bulk of small-hydro requirement and accessories are import-based during early stages of development, it is believed that with appropriate government incentives and support, virtually all basic components of the systems can be manufactured locally. This would also facilitate system maintenance and repairs. To date, small hydro technology is still at its infancy in Nigeria. As shown in Table 2.1.3, the schemes are operated in only three of the 36 States of the Federation, and only

Renewable Energy Master Plan (REMP) • Final Report • November 2005 Energy Commission of Nigeria (ECN) • United Nations Development Programme (UNDP)
46
the NESCO complex in Plateau State, whose first unit went on stream some 80 yrs ago, has developed some form of local technology in its facility operation and maintenance. 2.1.2.2 Technical Characteristics Power output from the small hydro plant is dependent on the characteristics of its key components namely: the penstock, turbine, generator, regulator, inverter and cabling. Penstock piping should be selected to reduce flow friction and hydraulic losses by using smooth piping materials and limiting the number of joints, bends and transitions. Turbines are preferred over waterwheels, because they are more compact, have fewer gears and require less material for construction. As listed in Table 2.1.5, several types of turbines are available for the small hydro. The impulse turbines, which have the least complex design and rely on flow velocity to move the wheel or runner, are the most commonly used for the high head SHP systems. The most common types of impulse turbines are the Pelton and Turgo wheels. Table 2.1.5: Types of Turbines and Parameters for Small Hydro Schemes
Type Head, n Discharge, m/s
Speed, rpm Rating, kW
Cross flow 7.5 – 100 0.15 – 5.0 100 – 1000 50 – 1000 Bulb (package)
5 – 18 4 – 25 187 – 500 150 – 4500
S-Type (Tubular)
3 – 18 1.5 – 40 120 – 750 50 – 5000
Vertical Tubular
5 – 18 2 – 20 300 – 750 300 – 750
Horizontal Francis
20 – 300 0.6 – 17 300 – 1000 500 – 5000
Impulse 75 – 400 0.3 – 3 120 – 000 100 – 5000 Source: National Energy Plan Vision 2010 for Small Hydropower Technology (March, 2004) With the Pelton wheel, water is funneled into a pressurized pipeline via a jet existing from a nozzle and striking double buckets attached to the wheel. The resulting impact creates a force that rotates the wheel at a high efficiency rate of 70 to 90 percent. The system is particularly suited for low-flow high-head conditions. The Turgo impulse wheel is an upgrade of the Pelton. Using the same spray concept, the Turgo jet is about half the size of the Pelton but its spray hits three buckets simultaneously. Thus, the Turgo wheel is less bulky and moves almost twice as fast the Pelton version. It also needs few or no gears and generally operates trouble free under low-flow conditions, requiring medium or high head. The Turgo wheel therefore achieves even higher efficiency than the Pelton wheel. In reverse action, conventional pumps, which are mass produced and relatively less expensive, can operate as turbines. Reasonable pump performance, however, requires generally constant head and flow, not usually achievable under the small hydro concept. Pumps are also less efficient and more prone to damage than turbines.

Renewable Energy Master Plan (REMP) • Final Report • November 2005 Energy Commission of Nigeria (ECN) • United Nations Development Programme (UNDP)
47
The generator, regulator and inverter are generally standard equipment with fixed but lower than turbine efficiencies. Thus, whereas the turbine efficiency can be as high as 90 percent, overall efficiency of the small hydro composite unit is in the range of 53 percent. Achievement of this level of efficiency requires regular and proper system maintenance. Since the hydro plant has only few moving parts and operates at ambient temperatures, its life span can be quite long. While thermal power plants require very large operation and maintenance costs and must be replaced every 5 to 7 yrs, the hydropower system can operate for as long as 20 yrs under generally inexpensive operation and maintenance requirements before there is need for major rehabilitation. As shown in Fig. 2.1.2, the lifetime of the small hydro facilities is 20 – 30 years, compared with 8 – 10 years for diesel engine generators. Long service life is therefore another important attraction of the small hydro system.
Fig. 2.1.2 Lifetimes of off-grid Renewable Energy Technologies Table 2.1.6: Lifetimes of Off-Grid Renewable Energy Technologies
Technology Lifetime (Years) Engine Generator 8 – 10 (diesel) Micro Hydro 20 – 30 Photovoltaic 20 – 30 Wind Turbines 15 – 25 Batteries 3 – 5
Parts of SHP plants are readily available in the economy. Other than the turbine which may be import based, other components of the system can be purchased virtually

Renewable Energy Master Plan (REMP) • Final Report • November 2005 Energy Commission of Nigeria (ECN) • United Nations Development Programme (UNDP)
48
anywhere in the general market. Development and support of the small hydro can thus be easily achieved within the Nigerian economy. 2.1.2.3 Economic Competitiveness Although, the small hydro may require a moderately high capital cost (Fig. 2.1.3), its low operation and maintenance (O & M) requirements (Fig. 2.1.4) coupled with long life spans are its major advantage over other prospective sources of power to small and medium sized local communities and settlements. The petrol/diesel gensets which may be installed at a relatively moderate cost, are prone to such serious limitations as unreliability of fuel supply, frequent breakdown, high O & M requirements, short service lives, noisy operation and environmental pollution.
Fig. 2.1.3 Initial capital costs of electricity generating systems Table 2.1.7: Initial Capital Costs of Electricity Generating Systems
Technology Size (KW) Initial Capital Cost ($/KW)
Engine Generator Gasoline 4 760 Diesel 20 500 Micro hydro 10 – 20 1,000 – 2,400 Photovoltaic (PV) 0.07 11,200 Photovoltaic (PV) 0.19 8,400 Wind Turbine 0.25 5,500 Wind Turbine 4 3,900 Wind Turbine 10 2,800
Costs are as of 1990 Source: National Energy Plan Vision 2010 Small Hydropower Technology (March, 2004)

Renewable Energy Master Plan (REMP) • Final Report • November 2005 Energy Commission of Nigeria (ECN) • United Nations Development Programme (UNDP)
49
Fig. 2.1.4 Operating & Maintenance (O & M) and Fuel Costs for different technologies Source: National Energy Plan Vision 2010 Small Hydropower Technology (March, 2004) Table 2.1.8: Operating, Maintenance, and Fuel Costs for Different Technologies
Technology O & M Costs (cents/KWh)
Fuel Costs* (cents/KWh)
Engine Generator 2 20 Micro Hydro 2 0 Photovoltaic 0.5 0 Wind Turbines 1 0
* Assuming Diesel Fuel Price of 5 US$/L The economic value of small hydro schemes would be further enhanced when more units come on stream, local service areas are established and system components are predominantly locally sourced. Training facilities would need to be set up in different States, particularly in areas of high SHP potential and/or development. Prospective operators and managers can also be trained in higher institutions throughout the Country. Economic competitiveness of the SHP would increase with more use and improvements. 2.1.2.4 Benefits and Limitations Several benefits are derived from the small hydro development, among which are: (i) provision of a basic tool for rural development; (ii) very low operation and maintenance costs; (iv) no fuel costs; (v) kick-starting and support for cottage industries; (vi) access to remote and often neglected communities; (vii) competitive economic and supply advantage over other power systems; (viii) environmentally friendly and emission free power generation (Table 2.1.6); (ix) poverty alleviation; (x) general upliftment of the social structure of the Community; (xi) provision of rural employment; (xii) economic empowerment of the community; (xiii) reduction of rural-urban migration and (xiv) opportunity to tap substantial unutilized energy resources of the country.

Renewable Energy Master Plan (REMP) • Final Report • November 2005 Energy Commission of Nigeria (ECN) • United Nations Development Programme (UNDP)
50
Table 2.1.6: Comparison of Environmental Effects of Power Generating Plants
Types of Plant
Multipurpose Emissions Radioactive Radiation
Social Impact
Earthquake Prone
Hydro* Yes No No Yes Yes Small Hydro
Yes No No Yes No
Fossil Fuel
- Yes No Less
Nuclear - Yes Yes No No Wind* - No No Yes No Solar* - Yes No Yes No No
* Require vast areas away from large cities in spcarsely populated regions In Nigeria. μ Source: National Energy Plan Vision 2010 Small Hydropower Technology (March, 2004) Despite its obvious benefits, the small hydro has its limitations. Power can usually be generated only during the rainy season when sufficient flow would be available. Even where a reservoir is integrated as a component of the scheme, it is still unlikely that power is produced over an appreciable period of the dry season or drought. Small hydro plants are usually sited in remote, sometimes rugged and virtually inaccessible locations from where it is difficult at times to bring the power to populated areas and load centres. Other SHP limitations include: Long project development periods and high in-situ investment costs; administrative bottlenecks relating to organization, awarding the contract and construction of projects involving complex coordination of tendering, construction and supervision; water right problems where water is diverted from areas with prior rights; the absence of technical standards, which leads to utilization of substandard equipment, resulting in low efficiency and poor system reliability; insufficient financial resources for necessary O & M for sustained operation of SHP, the bulk of which is produced for consumptive residential use; there are no real models for companies to finance and operate SHP on a private development basis; financial institutions may be reluctant to finance non-traditional (power) projects; and land acquisition could lead to social and cultural controversies. 2.1.3 Market Situation 2.1.3.1 Present Demand and Supply Situation From a projection of overall energy demand for the Country, Electricity demand for households and industry, the principal consumers of the SHP, are projected to grow at annual rates between 8% and 9% under the high growth scenario and between 3% and 5% for a low growth pattern. It is projected that the demand for SHP will grow at a faster pace and could reach an annual rate of 10%. Based on Yr 2000 Nigerian population of some 110 million and per capita power requirement of about 30 W, the 2000 Yr demand for the Small hydropower is estimated
μ

Renewable Energy Master Plan (REMP) • Final Report • November 2005 Energy Commission of Nigeria (ECN) • United Nations Development Programme (UNDP)
51
to be 190 MW. Corresponding future demands, as set out in Fig. 2.1.5, are projected to reach approximately 490 MW in Yr 2010, 1280 MW in 2020 and 3315 MW by 2030.
Fig. 2.1.5. Projected Nigerian Small Hydro Power Demand Sufficient SHP Potential exists to meet the national demand over the next 30 years. There is a need for Government to be fully committed to developing these sites. Overall national power requirements indicate substantial deficiency in supply relative to demand. In Yr 2000, for example, only 30 MW of the 190 MW demand was generated leaving a supply shortfall of 160 MW or some 84 percent. Without additional developments, the supply gap would increase further over time and could exceed 90 percent in the next 20 years. At the estimated demand of 3315 MW, the Yr 2030 requirement just about matches the estimated national potential of 3500 MW. It means therefore that full realization of the nation’s small hydro potential will be achieved in 30 years if available sites are developed in line with the projected growth in national demand. 2.1.3.2Key Drivers for the SHP Market Population growth creates the demand and market for small hydropower development. Population pressure leads to demographic changes which result in settlement over remote areas usually near sources of water. These settlers provide the demand and market for the SHP. Such Government-sponsored programs as rural electrification, water resources development, cottage industries, rural enterprises, agriculture, poverty alleviation

Renewable Energy Master Plan (REMP) • Final Report • November 2005 Energy Commission of Nigeria (ECN) • United Nations Development Programme (UNDP)
52
programs and health care services constitute important activities that can draw from the Small hydro scheme. Diversification of community trades and services would also provide ready markets. The high cost of fuel, O & M and related expenses associated with diesel based generator sets together with the unreliability of fuel supply promote a justification for the SHP option. So does the remoteness of the rural areas as well as the absence of national power grid. Improved community awareness through individual and general public education including interaction with other communities is also an important driver for the SHP market. 2.1.3.3 Gaps and Barriers to Small-Hydro Market Development As noted in Nigeria’s Vision 2010 National Energy Plan, the following barriers face implementation and marketing of renewable energy, including small hydro: implementation requires significant initial investment with generally low rate of return while there is very limited level of consumer awareness on the benefits and opportunities of SHP development. The economic and social system of energy services is based on centralized development around conventional sources of energy, specifically electricity generation, thus making a level playing field impossible. Financial, legal, regulatory and organizational barriers need to be overcome in order to implement the projects and develop new energy markets. There is an absence of a framework for power purchase agreement between owners of small hydro plants, the grid and other users. There has also been a lack of assessment of the market potential and the structure necessary to harness the SHP potential.
2.2 Solar Energy The solar energy resource situation in Nigeria including the estimated potential and available amount of the resource, are considered in this section. The status of the database is discussed, indicating its degree of adequacy and an identification of the gaps. 2.2.1 Resource Situation The Solar Thermal Energy Resource of Nigeria is the totality of the solar radiation falling on its 923,768 km2 land area. This total solar radiation includes the direct radiation as felt on clear sunny days, diffuse radiation scattered by clouds and atmospheric gases and vapors and felt on cloudy days even when the sun is not visible. For some applications, the albedo or solar radiation reflected by the ground and surroundings of the location or solar device of interest may be included in the total solar radiation. Application of solar radiation in most solar thermal technologies is based on the totality of the shortwave, visible spectrum, and long-wave radiation within the wavelength range of 0.1 to 100 micron-meter. A few specialized technologies however do discriminate within certain wavelength bands such as the ultra-violet or the near infrared ranges. Undoubtedly, the largest solar radiation and other climatological database available in Nigeria reside with the Nigerian Meteorological Agency (NIMET) obtained from their weather stations located widely throughout the country. The data from the various

Renewable Energy Master Plan (REMP) • Final Report • November 2005 Energy Commission of Nigeria (ECN) • United Nations Development Programme (UNDP)
53
stations are collated centrally at the headquarters in Oshodi, Lagos, where climatological data upwards of30 years are available. Many of the stations are airport or aerodrome weather stations. Another source of localized solar radiation data is the International Institute of Tropical Agriculture, lITA, Ibadan, Oyo State, which has agro-climatological stations at its headquarters and at its agricultural substations or outstations. Very good solar and other climatic database upwards of20 years can be readily found at lITA. The National Building and Roads Research Institute (NBRRI) in Lagos and the National Energy Research Centres at the University of Nigeria, Nsukka, the Obafemi Awolowo University, Ile-Ife and Usmanu Danfodiyo University, Sokoto, also provide a valuable source of solar radiation and other climatic information. Less consistently collected are data from some tertiary institutions nationwide, where individual energy researchers work on various energy projects. The annotated references listed in the bibliography contain selected relevant work from some of these institutions. Some international and multinational companies similarly have climatological stations where solar and other climatic data have been collected for decades. 2.2.1.1 Estimated Resource Base The National Energy Policy Document states that "Nigeria lies within a high sunshine belt and, within the country, solar radiation is fairly well distributed. The annual average of total solar radiation is varies from about 12.6 MJ/m2-day (3.5 kWh/ m2-day) in the coastal latitudes to about 25.2 MJ/ m2-day (7.0 kWh/ m2-day) in the far north." Assuming an arithmetic average of 18.9 MJ/ m2-day (5.3 kWh/ m2-day), Nigeria therefore has an estimated 17,459,215.2 million MJ/day (17.439 TJ/day) of solar energy falling on its 923,768 km2 land area. The above arithmetic average may be interpreted as the application of each of the above radiation values to approximately half the area of the country, thus giving a total of (12.6 + 25.2) x (923,768/2) which gives the same value as before. Annually, the above average solar intensity is 6898.5 MJ/m2-year or 1934.5 kWh/m2-year, a value that can be used to calculate the available solar energy. Thus, over a whole year, an average of 6,372,613 PJ/year (≈1,770 thousand TWh/year) of solar energy falls on the entire land area of Nigeria. This is about 120 thousand times the total electrical energy generated by the National Electric Power Authority for the whole country for the year 2002. This then is an estimated potential solar thermal energy resource base. Part of this resource falls on agricultural and forest lands and of course is useful for photosynthesis processes; others fall on developed areas most of which could be harnessed for power generation through roof- and building-integrated solar conversion devices (solar water heaters, solar photovoltaic -PV- claddings, etc.); others fall on roads and waterways some of which are useful or useable, e.g. for drying agricultural products by rural dwellers. Thus, this total resource is largely useable or harness-able. Alternatively, the solar resource could be considered from the standpoint of the area required to generate the total national energy consumption through this solar energy. Thus, the NEPA total electricity generation of 14.68 TWh in the year 2000 could have been provided by the average solar energy intensity of 1934.5 kWh/m2-yr (6898.5 MJ/m2-yr) falling on an area of 7.66 km2 if a 100% efficient conversion device were

Renewable Energy Master Plan (REMP) • Final Report • November 2005 Energy Commission of Nigeria (ECN) • United Nations Development Programme (UNDP)
54
used, or an area of less than 1 km2 if a conversion device having an efficiency of only 10% were used. The total final energy demand for the high growth scenario in Nigeria is estimated by the Energy Commission of Nigeria, ECN to be 131.13 mtoe (million tonnes of oil equivalent, ≈ 5507 PJ or 1530 TWh) by 2030 and 55.74 mtoe (≈ 2341 PJ or 650 TWh) in 2010. This ECN projection of Nigeria’s total final energy demand for 2010 and 2030 can be provided by the average annual solar energy intensity falling on 339 km2 and 798 km2 of Nigeria’s total land area respectively. How much of the total solar resource of 6,372,613 PJ/year is actually available depends on what fraction of the nation’s land area could be dedicated to energy production among other competing needs such as agriculture, river and road networks, etc. Dwellings have been deliberately left out of this analysis since both roofs and walls could easily be used for energy production as earlier discussed. Two scenarios are considered: worst case of only 10% and a conservative best case of 20% of the land area of Nigeria dedicated to energy production by using solar energy. These percentages derive from the biomass resource assessment chapter in this report, where 28.5% of the total land area of Nigeria is composed of forest, woodland, developed and other land besides agricultural land and water bodies. Further, we assume solar energy conversion devices with a very conservative overall thermal efficiency of 10%. The available solar energy resource estimate therefore becomes 17,702 TWh/yr (63,726 PJ/yr) and 35,403 TWh/yr (127,452 PJ/yr) respectively for the two scenarios. This available resource is about 23 times the ECN projection of total final energy demand for Nigeria in the year 2030 and just under 200 times of the demand for the year 2010 for the best case scenario. For the worst case scenario, the available source is about 12 times the year 2030 demand and just under 100 times the year 2010 demand. 2.2.1.1a Status of Database, including adequacy and gaps The solar radiation measuring stations of the Nigerian Meteorological Agency earlier discussed are mostly airport and aerodrome weather stations which were originally set up to aid civil aircraft navigation. Thus, the stations themselves cover only about thirty localities. To obtain a good solar radiation database there is need to set a lot more radiation measurement stations all over the country, particularly in the northern areas where the radiation belt is very high. Radiation studies done have relied on the data from the meteorological stations to develop equations applicable to either zones of the country or to the whole country which are useful for solar equipment manufacturers and designers. Such studies need to be validated with much more data evenly spread all over the country. Most of the solar radiation data taken at the meteorological stations are for the total or global solar radiation. A programme on gathering data on other components of solar radiation such as diffuse radiation, normal radiation, and spectral radiation also needs to be instituted as such data find use in equipment design. Furthermore, although the

Renewable Energy Master Plan (REMP) • Final Report • November 2005 Energy Commission of Nigeria (ECN) • United Nations Development Programme (UNDP)
55
meteorological stations were in isolated aerodromes far from development at the time they were built over four decades ago, almost all the stations are now in built up areas with high probability of shading effects on the instruments. There is a need for new, purpose-built stations designed to fill knowledge gaps in a solar radiation mapping programme for the country. The solar radiation measuring instruments used at the stations are generally the old, first generation Gun- Bellanni instruments which have long been overtaken by generations of technological changes. Standard pyranometers and pyhreliometers need to replace the old instrumentation. Calibration and standardization issues also need to be high on the Department's priorities. The effect of the Information and Communication Technology era needs to be felt in the instrumentation of the Department's weather stations. Stations should be equipped with telemetry and remote sensing dataloggers equipped with electronic chips which can produce both instantaneous and integrated solar radiation data at each station and transmit same to the base station at the Meteorological Agency headquarters. There are, however, encouraging developments in the Meteorological Department that are taking cognizance of some of the above issues and gaps, although quite more substantial financial resources would be required to effect a comprehensive instrumentation update or replacement. 2.2.1.2 Technical Assessment of Solar Energy Technologies The two broad classifications of Solar Energy Technologies are Solar Thermal Energy technologies and Solar Photovoltaic (PV) technologies. Each of these two broad classifications contains many sub-classifications of technologies which will be technically assessed in this section. 2.2.1.2a Overview of Solar Thermal Technologies Following the broad overview presented below, solar thermal technologies are considered in greater detail under the following three broad categories as Table 2.2.1 shows: (i) proven, mature and commercial stage, (ii) proven, mature but largely demonstration-stage, and (iii) proven but immature development-stage. For each of these categories, the technical characteristics, economic competitiveness, and the benefits and limitations of each technology are examined. Table 2.2.1 Classification of Solar Thermal Technologies by stage of development Proven, mature & Proven, mature but Proven but largely Commercial largely Demonstration Developmental Solar water and air heating Solar stills Solar furnace & very high temp. heating Swimming pool solar heating Solar desalination Photovoltaic/Thermal (PV/T) Heat pump solar heating Solar drying Solar ejector cooling Solar cooking Solar brooding Solar ponds

Renewable Energy Master Plan (REMP) • Final Report • November 2005 Energy Commission of Nigeria (ECN) • United Nations Development Programme (UNDP)
56
Incubation, etc. Solar passive architecture Solar pasteurization & Sterilization Solar refrigeration & cooling - AB & AD Solar desiccant cooling
Solar Thermal Electricity
PT; PD; CR-PT Legend: AB - absorption systems; AD - adsorption systems; PT - parabolic trough systems; PD - parabolic dish systems; CR-PT - central receiver power tower systems; PV/T - photovoltaic-thermal composite systems Solar thermal technologies available in the international market today are efficient and highly reliable, delivering solar energy in a wide range of applications, among which are: domestic hot water and space heating in residential and commercial buildings, swimming pool heating, solar-assisted cooling, solar-assisted district heating, industrial process heat, desalination, agricultural products drying, hatcheries, chick brooders and seed germinators, solar cooking, and electric power generation. In Nigeria, the Energy Commission of Nigeria, with its two renewable energy centres, namely, the National Center for Energy Research and Development, NCERD, at the University of Nigeria, Nsukka and the Sokoto Energy Research Center, SERC, at Usmanu Danfodiyo University, Sokoto, has developed or adapted a variety of renewable energy technologies and capacities, including solar dyers, solar water heaters, solar cookers and solar chick brooders. Many tertiary institutions have also developed or adapted several solar thermal technologies for local use. These local developments need to get from the present largely demonstration or dissemination stage to the next stage of commercialization, with private sector driven but high profile public sector led initiatives. I. Proven, mature and commercial-stage solar thermal technologies (ia) Solar Water Heater (Collector) technology (SWHs) There are basically two major types of commercial solar water collectors: the Flat Plate Collectors (FPCs) and the Evacuated Tube Collectors (ETCs), shown in Appendix A-1.2. The FPCs consist of an insulated outer metallic box covered on the top with one or two glass sheets. Inside there are blackened metallic absorber sheets (selectively coated for maximum absorption of solar radiation transmitted through the glass covers) with built in channels or riser tubes to carry water to the headers. The ETC is made of double layer borosilicate glass tubes evacuated to provide insulation, much like the thermos flask glass. The outer wall of the inner glass tube is again coated with a selective absorber paint material. This helps to maximize absorption of solar radiation and its transfer to the fluid flowing inside the inner glass tube. ETCs can attain considerably higher temperatures (> 100°C) than FPCs which generally operate below 80°C. Both FPCs and ETPCs are very mature, reliable technologies.

Renewable Energy Master Plan (REMP) • Final Report • November 2005 Energy Commission of Nigeria (ECN) • United Nations Development Programme (UNDP)
57
Solar water heating has been a proven, mature and reliable technology for about two decades (five decades in Japan!). It has been able to reduce a significant portion of the conventional energy being used for heating water in homes, commercial and institutional establishments as well as in industrial applications. An IEA study estimated that over 100 million m2 of collector area has so far been installed worldwide for heating water, and about a tenth of this is in the EU countries. Solar water heater capacities of 100-300 litres producing hot water at 60-80°C are suitable for domestic purposes while larger systems find ready application in hotels, hospitals, restaurants, dairies, and industries worldwide. The benefits to the user include either total elimination of, or substantial reduction in, grid electricity for heating water in geysers; to the utility and the economy, positive contribution to peak shaving of electrical capacity and avoided or delayed utility generation cost; and to the society, a better cleaner environment from the adoption and cumulative use of solar water heaters, avoidance of millions of tonnes of CO2. For example, according to Renewable Energy World journal, the annual collector yield of all solar water collectors installed by the end of 2001 in 26 countries studied is 41,795 GWh (150,463 TJ), corresponding to an oil equivalent of 6.7 billion litres, and an annual avoidance of 18.2 million tonnes of CO2. Further, establishment of a local solar water industry creates a significant number of local jobs with the proper enabling and regulatory environment in place, particularly if the industry is based on intermediate technology rather than high technology concepts. Commercial solar water collectors have an average of 15 to 25 years lifetime. The efficiency of the commercial solar collectors is generally over 60% at average solar radiation for the FPC and over 70% for the ETC. The average cost per m2 of FPC glass surface area is US$300 - 800, while ETCs could cost as much as 3 to 4 times higher. Data from India indicate payback periods of 2-3 years when electricity is replaced, 4-5 years when furnace oil is replaced, and 6-7 years when coal is replaced. For warm climates, the thermosyphon circulation systems which do not require pumps are the most common packaged commercial solar domestic FPC product configuration. They are comparatively low-cost and more affordable than forced flow types or evacuated tube types. Solar water heaters developed in Nigeria by the NCERD, Nsukka and at the SERC, Sokoto are mounted on stands as opposed to the typical roof-mounted solar water heaters available on the international market. The SERC, Sokoto has also designed, built and installed a 1000-litre capacity solar water heating system at the Usmanu Danfodiyo University Teaching Hospital in Sokoto. Installed in 1998, the system is still operational and supplies the hot water needs of the maternity ward of the hospital. Local capacity exists for the manufacture of solar water collectors on a commercial basis, and the market exists initially in the following sectors: institutional (hospitals, hostels, etc.), commercial (hotels, restaurants, etc.), industrial (bottling plants, dairies, juice extraction factories, malt preparation, etc.). There is limited opportunity for solar water heaters in the Nigerian domestic sector in the high elevation areas of Plateau and Mambilla which experience near-temperate climates during the harmattan season.

Renewable Energy Master Plan (REMP) • Final Report • November 2005 Energy Commission of Nigeria (ECN) • United Nations Development Programme (UNDP)
58
(iib) Swimming pool heating and (c) heat pump solar water heating applications: Swimming pool applications are similar to the domestic SWHs and differ only in the piping (and storage tank, if used at all) requirements. Solar-boosted heat pump water heaters with direct solar heating of the heat pump evaporator have also been developed and are available on the market, and they have domestic, commercial and industrial applications. The large hotels and the upper strata of society constitute the potential market for this technology, and it is a substantial and growing market in Nigeria. (iiid) Solar Cookers Solar cooking technology is also a mature, proven simple technology. It has received varying degrees of acceptance worldwide, particularly in many tropical developing countries of Africa, Asia and South and Central America, and among strong environmental promoters in the developed countries of Europe and North America. The main types are: (i) the box-type, (ii) the parabolic deep-focus concentrator (SK14) type, (iii) the flat-plate oil working fluid type suitable for domestic indoor cooking, and (iv) the Scheffler type for commercial/industrial cooking applications. Solar cookers in India have been found to generate savings of about 900kg/year on fuelwood per household; and a reduction in CO2 emissions of about 1,000 kg/year. The approximate manufacturing cost of the fabricated "Sunstove" box solar cooker is about US$10-20 and could be a good employment generating cottage industry. The "SK-14" parabolic concentrator collector costs approximately 465,00 DMUS200. Box-type and the concentrator type solar cookers have been developed by the SERC, Sokoto. Several higher institutions in Nigeria have similar research and development stage solar cookers. As with solar water heaters, it is the “commercialization barrier” that needs to be overcome in Nigeria through the active involvement of all stakeholders but with private sector driven initiatives. There are social and institutional barriers to overcome in introduction of the technology in Nigeria, such as changing habits and social cooking mores to accommodate solar cooking. Environmental benefits of adopting solar cooking technology include reduced rate of depletion of forest cover and hence desert encroachment. (ive) Solar Passive (Low Energy) Architecture There are many projects in temperate climates that are specifically executed as passive solar design demonstration projects. Notable among these are the Milton Keynes projects of the late 1980s in the United Kingdom, where it was found that the overall space heating load could be reduced to 1500 kWh/yr for a fairly standard three bedroom house, yielding a total gas bill of around US10£6/year. For the tropical climates, passive solar design is aimed at reducing the influx of solar radiation into the building living and working area but rather capturing it on the its outer fabric and using it positively to reduce the cooling energy requirement of the building itself. Coupled with unpleasantly high temperatures, many tropical climates also have very high humidity. Solar energy captured on the outer fabric of the building could similarly be used to reduce the indoor humidity to comfortable levels through solar cooling and desiccant technologies. This dual goal should be the role of solar passive

Renewable Energy Master Plan (REMP) • Final Report • November 2005 Energy Commission of Nigeria (ECN) • United Nations Development Programme (UNDP)
59
design for tropical climates such as we have in Nigeria. The involvement of the building -related professional bodies, the Standards Organization of Nigeria, SON, and the Nigerian Building and Roads Research Institute, NBRRI, and regulatory acts will be necessary to introduce passive solar design concepts in the building industry through high visibility demonstration projects. II. Proven, mature but still largely demonstration-stage technologies (ia) Solar Stills The first conventional solar still is acknowledged to have been designed by Carolos Wilson, a Swedish engineer in 1872, in northern Chile and it is reported to have operated for about 40 years. Other types of stills are the multi-wick solar still and the single and double slope multi-wick fibre re-inforced plastic (FRP) solar stills. The inverted absorber solar still was developed to suppress the convective thermal losses of the conventional still, thereby maximally utilizing the solar radiation. In this type of still, the solar radiation is absorbed at the bottom of the solar still. An inverted absorber asymmetric line-axis compound parabolic concentrator (CPC) solar still with concentration ratio between 1.5 and 2 has vast improved performance over the previous solar stills. The condensing surface is cooled with air from a blower to greatly improve the yield. Although solar still technology is mature, it is hardly commercial in the sense of packaged units that are available for solar water heaters. It is still largely a made to order technology or designed to suit specific needs. In the tropical climates, economic factors make it unaffordable to devote scarce resources to solar stills to provide potable water, especially when they may have to trek several kilometres to fetch the water in the first place. Where wells are sunk, the water table is usually sufficient to provide safe potable water in most tropical communities. Hence the need for this technology is not greatly felt except in areas with brackish water or high salinity creeks and deltas such as we do have in the riverine areas of Nigeria. The SERC as well as many tertiary institutions in the country have had many demonstration solar stills for over two decades, but as already noted, it is progress to the commercialization stage that is now urgently required. (iib) Solar Desalination Industrial-size solar desalination demonstration plants have been built at La Paz, Mexico in 1979 and at Aqaba, Jordan in 1977. The Mexico plant is a multi-stage flash desalination plant in which the thermal energy required at a temperature of 90 - 120°C is provided by two collector fields. The collector field comprises 530m2 of selectively coated heat pipe collectors and 160 m2 of concentrating collectors. A vacuum of about 60 mbar is attained in the last stage requiring a 40 m3/h, 40 mbar vacuum pump to extract the non-condensable gases. The Jordan desalination plant is rather like the conventional solar still except that heat pipes collectors are used to trap the solar energy and the heat is fed to a separate brine basin to evaporate the sea water. The yield of the one- and two-stage operation is respectively 80-90 litres/day and 120-140 litres/day from 200-300 litres/day sea (brackish) water feed. Laboratory-scale and smaller solar desalination demonstration plants similar to the solar stills described in the previous section have been available in our national research

Renewable Energy Master Plan (REMP) • Final Report • November 2005 Energy Commission of Nigeria (ECN) • United Nations Development Programme (UNDP)
60
centers as well as in our tertiary institutions for decades. The enabling environment and the push to get them to the commercialization stage is what is now required. (iiic) Solar Dryers for agricultural products and timber drying/seasoning kilns Like solar stills, there are no packaged commercial solar dryers although the technology is proven, mature and generally reliable. Unlike the case of solar stills, there is a great need and market for solar dryers in agriculture all over the world. Small cabinet solar dryers have been well-researched and proven dryer for fruits, vegetables, herbs, tomatoes, peppers, etc. The large scale applications however appears to be where the agricultural and industrial market lies. Such large-scale dryers are in-situ dryers. The market however will be larger if these large-scale dryers are built to be easily towed from one location to another as communities or storage barns demand. Demonstration stage dryers of the NCERD, Nsukka have been in operation sincewas commissioned in 1991. There is a need to get through to the diffusion and large-scale dissemination stage towards the commercialization stage of such agricultural dryers. (ivd) Solar Brooders, Incubators, and Seed-Germinators. The NCERD at Nsukka has also developed the solar chick brooders. Other researchers have also developed solar incubators and solar energy operated seed germinators. (e) Solar liquid and solid absorption and adsorption refrigeration Absorption refrigeration has been commercially available for over three decades, and it is well known for its advantage of requiring very little pump power as opposed to the large power requirement of compression refrigeration systems. The thermal energy required in the standard absorption refrigeration cycle is usually provided by steam generated from a boiler. Incorporation of a solar collector into the absorption plant to produce the required thermal energy removes the need for a fossil fuelled boiler. For air conditioning applications, absorption chillers using water-lithium(H2O-LiBr2) bromide as the sorption pair are often employed, with water as the refrigerant and LiBr2 as the sorbent. In a single-effect machine, thermal energy at 80°C - 100°C is required to drive the refrigerant into the vapour phase from the refrigerant-sorbent liquid solution in the generator in equal mass to that evaporated in the evaporator. The coefficient of performance (COP) of about 0.7 is achieved, where the COP is the ratio of cooling effect produced to the thermal energy required to produce it. Higher COPs in the range of 1.1 to 1.2 are achievable with double effect machines; however driving temperatures of 140 °C-160°C are typically required in such chillers which are of capacities greater than 100 k W. The NCERD at Nsukka is internationally recognized for the quality research and development work it has carried out on solar absorption refrigeration. This seminal work needs to progress to the demonstration stage. Machines using solid adsorption materials are also available. Systems available on the international market use water as a refrigerant and silica gel as a sorbent and basically consist of two sorbent compartments, the evaporator and the condenser. At present, only two Japanese manufacturers produce solid adsorption chillers. Under typical operating conditions, with about 80°C driving temperatures, the solid adsorption systems achieve a COP of about 0.6.

Renewable Energy Master Plan (REMP) • Final Report • November 2005 Energy Commission of Nigeria (ECN) • United Nations Development Programme (UNDP)
61
The coupling of solar thermal collectors and thermally driven chillers requires sophisticated controls, since both components exhibit an inverse relation to operation temperature. For refrigeration systems, common liquid abdsorption pair in commercial systems is ammonia-water, (NH3 - H2O), where NH3 is the refrigerant and H2O is the sorbent. A common solid adsorption pair in refrigeration is activated carbon-methanol. (vf) Desiccant cooling systems Desiccant cooling systems employ a combination of evaporative cooling with air dehumidification by a desiccant or hygroscopic material that is capable of absorbing moisture from the air. Again, either liquid or solid materials can be used as a desiccant. The standard cycle most commonly used today utilizes rotating desiccant wheels, equipped with either silica gel or lithium chloride as the sorption material. Liquid sorption desiccant systems are now close to market introduction, with advantages of higher air dehumidification at the same driving temperature and the possibility of high levels of energy storage by means of concentrated hygroscopic solutions. (vig) Solar furnace for high temperature metallurgical or foundry processes Very high temperature solar ovens are based on the compound parabolic collector (CPC) principle with the addition of a sun tracking mechanism. Temperatures exceeding 1200°C have been attained by several solar ovens in demonstration projects. The CPC itself continues to be developed to attain higher efficiencies and concentration ratios. Some student solar furnace projects which have recorded temperatures close to 800°C exist in some Nigerian tertiary institutions. (viih) Solar Thermal Plants (STP) for Power and Process Heat Solar thermal technology using concentrating systems has been used to generate solar electricity or process heat. The three main concentrating systems are the dish, tower and parabolic trough. They are applicable for both central and distributed electricity generation, and possess the highest potential for competing with conventional power plants after wind power plants. All concentrating systems possess four key elements: concentrator, receiver, transport-storage unit, and power conversion unit. The power conversion unit has successfully employed Rankine, Brayton, Combined or Stirling cycles. In spite of this, the high investments costs and the high cost of electricity generated by these technologies continue to be barriers to their widespread replication. The 354 MW solar electric generating systems (SEGS) parabolic trough power plants have been connected to the Southern California grid since the mid-1980s and parabolic troughs represent the most mature STP technology of the three systems. (vii ai) The parabolic trough system or solar farm Over 100 plant years of accumulated operating experience from nine STPs of the parabolic trough type, ranging in size from 14 to 80 MW, have been feeding over 9 billion kWh of electricity into the Southern California grid, generating over US$ l billion.

Renewable Energy Master Plan (REMP) • Final Report • November 2005 Energy Commission of Nigeria (ECN) • United Nations Development Programme (UNDP)
62
It is generally agreed in industry circles that the parabolic trough system is ready for more widespread replication which will then lead to further innovation and cost reduction. This system consists of long parallel rows of identical concentrator modules, typically using trough-shaped glass mirrors. The trough concentrates the direct solar radiation onto an absorber pipe located along its focal axis as it tracks the sun from east to west. The heat transfer medium, typically oil, at temperatures up to 400°C, is circulated through the pipes. The hot oil then converts water to steam through a heat exchanger, to drive a steam turbine in a typical Rankine cycle conversion system. (vii bii) The solar central receiver or power tower In this system, the solar central receiver or power tower is surrounded by a large array of dual-axis tracking mirrors (heliostats), reflecting direct solar radiation onto a fixed receiver located at the top of the tower. Within the receiver, a fluid - water, liquid metal, and molten salt have been used - transfers the absorbed solar heat to the power conversion system where it is used to produce steam in a steam generator. Advanced high-temperature power tower concepts are cmrent1y being investigated, in which air is heated above 1000°C in order to feed it into the conventional gas turbine of modem combined cycles. Power tower plants have had more than 15 years of experiments worldwide in which they have proved to be technically feasible in projects using different heat transfer media - steam, air, sodium, and molten salts in the thermal cycle and with different heliostat designs. Unlike the trough system, the power tower system has not been used commercially as yet. Multinational companies like Boeing and Bechtel have however expressed an interest in commercializing second-generation power tower technology and have recently constructed and operated demonstration power tower plants. At Barstow, California, a 10 MW pilot plant (Solar One) operated with steam from 1982 to 1988. The complete plant was then modified in 1996 and recently started operation as Solar Two, using molten salt as the fluid heat transfer and storage medium. Solar Two had a few thousand hours of experience before shutting down in April 1999 after having delivered power to the electricity grid on a regular basis. Convinced of the environmental promises and the economic aspects of STP technologies, the World Bank's Global Environmental Facility (GEF) in year 2000 approved grants for the first solar thermal projects in Egypt, India, Mexico and Morocco of approximately US$200 million in total. GEF study had earlier predicted electricity generating costs for large solar parabolic trough power plants as well as for large central receiver power tower plants below 6 US cents/kWh after the year 2010. As of 2000, there were twelve international solar thermal power plant project developments worldwide, with two in Africa in Egypt (35 MWe solar capacity) and Morocco (30-50 MWe solar capacity). (vii c(iii) Solar SunDish Technology of STM Corporation, Ann Arbor, Michigan, USA. The parabolic dish solar power plant technology consists of a number of parabolic dishes which focus the solar radiation onto the STM engine to heat and expand an enclosed amount of gas (hydrogen). The engine operates on the Stirling cycle thermodynamics

Renewable Energy Master Plan (REMP) • Final Report • November 2005 Energy Commission of Nigeria (ECN) • United Nations Development Programme (UNDP)
63
principle. It is claimed by the manufacturer (STM) to be well suited to supply peaking power to a grid, it is capable of running at night on any common fuel natural gas, landfill gas, propane, diesel, fuel oil, and gasoline); it generates electricity at about 3.2 cents/kWh (year 2000); and total system cost is approximately 5.4 cents/kWh (year 2000 advert assuming 15-year depreciation). III. Proven, immature or development-stage solar thermal technologies Three promising technologies, among several others, to be considered in this section are the Hybrid Photovoltaic/Thermal (PV/T) Systems, the Solar Ejector Cooling Systems, and the Solar Pond. (ia) Photovoltaic/Thermal (PV/T) Systems While solar thermal collectors are designed to generate thermal energy, solar photovoltaic (PV) cells produce electricity directly from solar energy. However, during the photovoltaic energy conversion process, thermal energy is also generated which goes to increase the PV cell temperature. Unfortunately, the efficiency of conversion of solar to electric energy in the cell drops as the cell temperature increases. The traditional method is to try to dissipate this heat to the surrounding air in a PV cell installation by mounting the PV cell with an air gap between the module and the building surface. The hybrid PV/T approach however is to harness this heat, rather than just dissipating it, and to combine it with the electricity generated as a composite useful output. Hybrid PV/T is a new but promising technology for the simultaneous production of thermal and electrical energy from a solar PV cell. Among several experimental and demonstration PV/T projects worldwide is the hybrid PV/T system developed in Kandenko, Japan for use on a domestic building in 1994. The 3.3 kW (electric) and 24 kW (thermal) PV was made from polycrystalline silicon wafers, and overall efficiencies of 70% have been recorded. (iib) Solar Ejector Cooling Systems (SECS) A solar ejector cooling system consists of a typical ejector cooling system (ECS) with a solar collector incorporated to provide the required heat energy. The refrigerant R-141 b has been found to be the best for ECS and has appeal in refrigeration systems because of its low power requirements and modest efficiencies. (iiic) Solar Ponds Salt-gradient solar ponds are ponds containing layers of salt solutions of differing densities arranged so that the lower layers are the heavier layers thus arresting convection tendencies. The bottom of the pond has a selective black absorber material lining which makes the heavier layers at the bottom to store more of the solar radiation transmitted through the upper lighter layers, thereby creating a temperature gradient in the same direction with the density gradient. This thermal energy gradient can be used to drive an organic fluid in a Rankine cycle to produce electrical power. Solar ponds have been have been investigated by local researchers while demonstration solar ponds exist in Israel.

Renewable Energy Master Plan (REMP) • Final Report • November 2005 Energy Commission of Nigeria (ECN) • United Nations Development Programme (UNDP)
64
2.2.1.3 Economic competitiveness of solar thermal technologies Most of the solar thermal technologies are economically competitive even in developed countries of the world where the market is fully developed and private-sector driven. The competitiveness of solar water heating for commercial and institutional water heating has been demonstrated for Nigeria in previous studies. However, the solar thermal power (STP) generation technologies are at present economically uncompetitive. The market success of STP plants has been found to depend heavily on the choices made between environmental protection and the lowest possible electricity cost. The final outcome will undoubtedly depend on both energy policy decisions and international support for responsible environmental actions in a climate of scarce resources. A study of the electricity cost for market introduction of STP technologies with initial subsidies has shown that competitive markets are achievable as from 2010 at about 4-6 US¢/kWh for intermediate load power. Sustained global markets for STP is expected between 2015 and 2020, during which period the total installed capacity would have increased from the present level of just 354 MW to over 5000 MW. A Greenpeace-European Solar Thermal Power Industry Association (ESTIA) study has projected 21,540 MW installed solar thermal power capacity by 2020 with a total investment of about US$42 billion. 2.2.1.4 Benefits and limitations of solar thermal energy Solar thermal energy is all benefits as far as environmental pollution is concerned. Its limitations include lack of enabling environment for the various solar thermal technologies to become competitive with the fossil energy technologies which have long enjoyed entrenched subsidies and huge technology and market investments. The initial cost of some solar thermal technologies such as solar water collectors is unaffordable to large segments of the many developing economies without public sector intervention. 2.2.2 Solar Photovoltaic (PV) TechnologiesOverview of Solar PV Technologies A Photovoltaic system consists basically of the module which converts the solar energy to direct current (DC) electricity, the battery which stores the DC electricity for use when the solar radiation is either poor or non-existent, the charge controller which regulates the charging and discharging of the battery to preserve its life, the inverter which converts the DC from the modules or battery into alternating current (AC), wires, switches, relays mounting structures etc. The following PV cell/module technologies have been commercialized: Crystalline Silicon Technologies; Thin-film Technologies and Amorphous Silicon Technologies 2.2.2.1 Overview of Solar PV Technologies (a) Crystalline Silicon technologies Silicon is the most widely used and best characterized semiconductor material. Silicon technologies have, since the beginning of the industrial activities in the PV field, been the leading technologies. In 2003, the worldwide production of cells and modules from crystalline silicon was estimated at 667MW out of which mono-crystalline silicon accounted for 200MWp, polycrystalline silicon 460MWp, and ribbon silicon 7MWp. Crystalline silicon technologies accounted for 89.6% of the total crystalline cell

Renewable Energy Master Plan (REMP) • Final Report • November 2005 Energy Commission of Nigeria (ECN) • United Nations Development Programme (UNDP)
65
production of 734 MWp. There have been strong improvements in crystalline silicon technologies over the last decade, in terms of cell efficiencies, material and wafer quality, module performance and reliability, factors which have contributed to an increase of 20%/year of PV module shipments. (b) Thin film Technologies Thin film technology, as defined, means the large area (2m2) deposition of thin film conductors (TC) and thin film semiconductor (TSC) on a substrate using a patterning technique to achieve an integrated device structure. Usually, the thickness is a few micrometers up to about 20 micrometers. The process sequence for manufacture of thin film solar modules involves four steps namely, the deposition and patterning of the first electrode, the deposition and patterning of the absorber layer, the deposition and pattering of the second electrode and finally the encapsulation of the module. The 2003 worldwide production of thin film cells and modules was about 96MWp, a contribution of 13% to the total volume in the year. For thin film technologies, the differences from one technology to another lie in the steps involved in the deposition of the absorber layer. PV companies involved in module manufacture with C-Si as their major product are already engaged in research and development of cells and modules based on thin materials. The leading companies are Siemens, Solarex and BP Solar which is working on CIS, a-Si and CdTe based materials respectively. Other materials include CdS and CdZnS which, though having the potential for yielding low-cost cells of less than $ 1 per peak watt, are disadvantaged by their low relative efficiencies (4%-6%) and uncertain lifetimes. The low relative efficiency requires the use of larger array areas, increase area related costs such as mountings. The thin film technologies that have achieved some level of market penetration are as follows: (i) Copper Indium Diselenide (CuInSe2 or CIS) Technologies This is a compound semiconductor technology that is receiving attention as a prime candidate for PV power generation in view of its promising efficiency and stability of performance. CIS has a very high optical absorption so that very thin layers will absorb sunlight effectively. Its band gap of 1eV is rather low and it is usual to replace indium with an alloy of indium and gallium to increase the energy gap and hence the open circuit voltage. Because of known weaknesses arising from manufacturing issues such as area uniformity, yield and adhesion problems coupled with the capital intensive nature of the technology amongst others, steps are being taken in following areas: Improvement of adhesion at the MoO/CIS interface; Replacement of CdS transparent layer by Cd-free buffer layer such as ZnO, ZnSe, for reason of environmental considerations; Sourcing of less hazardous Se vapour source to replace H2Se gas; Achievement of large-area
Renewable Energy Master Plan (REMP) • Final Report • November 2005 Energy Commission of Nigeria (ECN) • United Nations Development Programme (UNDP)
66
stoichiometric CIS films; Elimination of the wet process in the device fabrication; Development of manufacturing process which will give compositional uniformity and high yields. (ii) Cadmium Telluride (CdTe) Technologies Cadmium Telluride has basic properties that make it a very promising candidate for use in thin film solar cells for electrical power generation. Its energy gap of 1.45eV is well adapted to the solar light spectrum, and leads to very high light absorption favourable for thin film solar cells. The compound can be prepared easily in high purity, as the elements Cd and Te can be easily purified. Above 500oC, the constituting elements have a significantly high vapour pressure than the compound, leaving the compound as stable phase. (iii) Thin Film Si Technologies In the past few years, there has been growing interest in combining the approach of interconnected thin film devices on a low cost substrate with a thin layer (<20 µm) of crystalline silicon as the absorber. The inherent stability of C-Si, its potentially high efficiency and advanced materials technology have motivated this interest. In comparison with the breakthroughs in PV cell and module technologies and Balance of System (BOS) components at the laboratory and production scale in developing Countries such as USA, Japan, Germany and United Kingdom, very little work has been done in Nigeria. Some efforts have been made locally to produce cells in the laboratory while most other work have been in the area of thin film deposition by solution growth and their characterization using optical and electrical techniques. A National Committee was set up in 1998 by the Energy Commission of Nigeria to ascertain the level of PV industry activity in Nigeria with a view to establishing the manufacturing capabilities for PV modules and Balance of Systems Components (BOS). Till date, apart from local manufacture of storage batteries and wires and the assembly of refrigerators, all other PV system BOS components are imported. (c) Amorphous Silicon (a-Si) Technologies This is the most extensively researched thin film material with the largest manufacturing experience mainly based on low power devices (watches, calculator etc). A lot of investment was put into this technology in the 1980s, yielding remarkable R & D results in the understanding of material properties and in manufacturing. With the large prior investments, there are known paths to scale up manufacturing success already achieved. Apart from the major low-power applications of a-Si materials, such as in watches and calculators, the modules have started showing remarkable acceptance for building integrated applications in view of their characteristics, these include their size, weight/strength, visual aesthetics, compatibility with conventional construction assemblies, partial visible light transmissivity and excellent heat shading properties. Application in buildings include skylights, curtain walls and roofing.

Renewable Energy Master Plan (REMP) • Final Report • November 2005 Energy Commission of Nigeria (ECN) • United Nations Development Programme (UNDP)
67
2.2.2.2 Technical Assessment of solar PV technologiesCharacteristics There have been strong improvements in crystalline silicon technologies over the last decade in terms of cell efficiencies, material and wafer quality, module performance and reliability. The energy conversion efficiency – the ratio of electrical power out to solar power in – is quite in a modest range for most commercial modules. Second generation thin films based on amorphous silicon, copper indium diselenide have shown some improvement, with present efficiencies in the 6%-10% range. Whilst the efficiency values have risen in the laboratory, the average efficiency for single crystal silicon cells in production have advanced much more slowly. A simple arithmetic average of the efficiency for commercial modules available today shows the singly crystal silicon modules to be only slightly ahead of the polycrystalline silicon module, (12.8 as opposed to 12.6%). PV modules based on crystalline Si technology claimed 89% of PV market production in 2003. Copper-indium-diselenide has a very high optical absorption, promising efficiency and performance stability. PV module lifetimes are estimated to lie between 25 and 30 years. 2.2.2.3 Economic competitiveness of solar PV technologies PV systems have been shown in a study to be cost effective in the low power range up to loads effective to 300W on a life-cycle-cost basis when compared with diesel or gasoline generators for use in remote locations and requiring national grid extension over a distance of 1.8 kilometers. With the present effort being made to reduce cost through savings in production cost of modules and BOS components, PV systems will become even more cost-competitive in future at higher loads. This is more so, when consideration is given to the present deregulation in the oil industry and the removal of subsidy on petroleum products. In an ECN survey of business activities in Nigeria, covering existing industrial activities and the state of application of PV technologies, forty four (44) active companies and research centres were involved in the importation and installation of PV system. On the sources of supply of PV components, USA contributed 49% while German and British makes contributed 13.7% and 12.5% respectively. Holland, India, Denmark and France contributed 5.7%, 4.6%, 3.4% and 2.3% respectively. Eight other Countries, including Nigeria, contributed about 1% each. The 1.1% contribution by Nigeria were in battery production by Exide Batteries Nigeria Ltd, and Solar-PV refrigerators produced by Solar Electric System of Jos. The battery produced by Exide is shallow-cycle type and not the deep-cycle type of battery recommended for solar PV applications. The PV components which are marketed in the Country include modules, batteries, inverters, converters, charge controllers, bulbs/tubes, refrigerators, lighting systems, solar lantern, solar pumps and junction boxes. 2.2.2.4 Applications, Benefits and Limitations Major considerations for the use of crystalline silicon for PV include the availability of the material, its chemical stability and the improvements in the material due to advances

Renewable Energy Master Plan (REMP) • Final Report • November 2005 Energy Commission of Nigeria (ECN) • United Nations Development Programme (UNDP)
68
in the micro electronics industry. The present scenario puts C-Si in a comfortable position of being at the forefront PV power production in many years to come. The major limitation of crystalline silicon is the high capital cost in growing the crystalline ingots and the wafer saving technologies which are wasteful of material. Amorphous Silicon technology has the potential for module production at very low cost $1/Wp because of its lower production cost but its major weaknesses include the low efficiencies and light-driven degradation due to the well-known Stabler Wronski effect. Technologies based on thin films possess the potential for reduction in the cost of PV modules. Photovoltaic systems have proved to be technically feasible for meeting the electrical energy requirements for a wide range of applications, in rural electrification; street lighting, water pumping; refrigeration; telecommunications and Solar Home Systems. These applications have positive social and economic impact on the lives of individual users, communities and the nation. The impacts they are currently making and will continue to make towards national development and poverty alleviation cannot be overemphasized. Photovoltaic systems are environmental benigin. They do not emit poisonous gases or pollutants into the atmosphere and pose little or no threats to climate change and environmental degradation, as is the case with conventional electricity generation with fossil fuel and nuclear technologies. They are free from mechanical noise as they normally have no moving parts. However, some limitations exist to the widespread dissemination of PV technologies. The present high initial cost of modules and systems discourages investment in the technology because energy users are usually interested in the initial cost and not in the life-cycle-cost of the energy option they chose. Solar radiation varies with time of day and seasons, thus storage is required in most PV applications. There is a lack of awareness on the viability and applications of PV systems. Government has for many years not shown enough political will to support the incorporation of PV technologies to assume a reasonable share of the energy mix of the Country. Furthermore, there is inertia on the part of government and industry to move from well-known technologies to a relatively new one. Trained manpower base in solar PV is scarce and needs to be considerably increased. There is lack of commercial activity and financing options in the solar PV field. The lack of political stability weakens the enthusiasm of local and foreign investors in PV. 2.2.3 Market Situation for Solar Energy Technologies This section will consider the situational analysis of the market for both solar thermal energy technologies and solar PV technologies in Nigeria. 2.2.3a.1 Market situation for solar thermal energy technologies Thermal energy is used daily in most sectors of the economy: in the domestic/residential sector for cooking, heating bath water, and washing; in the commercial/institutional sectors for cooking, heating bath water, and washing in cafeterias, hotels, schools, hospitals, clinics, government buildings, etc.; in the agricultural sector for drying agricultural crops and grains, spices, fish, etc; in the industrial sector for heat energy in

Renewable Energy Master Plan (REMP) • Final Report • November 2005 Energy Commission of Nigeria (ECN) • United Nations Development Programme (UNDP)
69
industrial processes, e.g. in the following industries: tobacco, textiles, vegetable oils, beverages, pharmaceuticals, leather, cement, breweries, etc. 2.2.3a.2 Present thermal energy demand and supply situation There is very little public awareness of the tremendous solar thermal energy resource available for utilization in many sectors of the economy: domestic/residential, commercial, industrial, government/institutional, and agriculture. Consequently, there is a corresponding lack of demand for, and supply of, solar thermal technologies in the large thermal energy market. Solar thermal energy market share in the overall thermal energy market is therefore nil in all areas/segments of the market. The market is yet to be created from the present largely demonstration stage of solar thermal technologies in the country. Solar thermal energy can easily play a significant role within the national thermal energy equation. Table 2.2.11 below gives a sectoral thermal energy demand, in PJ, based on several sources. The projection in Table 1 is based largely on the work of Ibitoye et al. (1998) which is derived from the computer simulation model MADE-II (Model for Analysis of Demand for Energy) and the MARKAL (Market Allocation) model, a large-scale linear optimization model. The estimates under Agriculture/Rural Development were based on information from several sources among which are the Biomass chapter of this report and ECN study reports. The thermal energy demand totals for the target years 2007, 2015 and 20925 are 392 PJ, 605 PJ and 810 PJ respectively, as Tables 2.2.2 and 2.2.32 shows. In the business as usual scenario, these will be met mainly by fossil fuels including electricity from fossil fuels and biomass (fuelwood mainly). Table 2.2.2. Sectoral thermal energy demand estimate, in PJ.

Renewable Energy Master Plan (REMP) • Final Report • November 2005 Energy Commission of Nigeria (ECN) • United Nations Development Programme (UNDP)
70
Sector 1990 2007* 2010 2015* 2025* 2030Domestic/Residential 120.4 220.9 384.5 Cooking 71.7 121.5 190.9 Non-substitutable electricity, (NSE) 8.6 20.5 45.6 Thermal component of NSE, 20% 1.72 4.1 9.12 Thermal Sub-total, Domestic 73.42 117.773 125.6 144.21 181.42 200.02
Commercial 16 50.6 160.9 Cooking 0.6 1 1.9 NSE 12.3 39.4 126.6 Thermal component of NSE, 20% 2.46 7.88 25.32 Thermal Sub-total, Commercial 3.06 7.134 8.88 13.465 22.635 27.22
Agricultural/Rural Development 5.51 9 16 Drying 2 4 6 Dairy, pasteurization, etc. 0.1 1.5 4 Chick brooding, egg incubation 0.01 0.5 2 Thermal Sub-total, Agriculture/R.D. 2.11 4.833 6 7.5 10.5 12
Government/Instituional/Hospitals, hotels,clinics, schools, health centres, etc. Cooking, water heating, etc. 90 150 300 Distillation, sterilization, desalination 2 10 20 NSE 8 40 80 Thermal Sub-total, Govt./Instituional 100 170 200 250 350 400
Industrial 86 215.9 372.9 Process heat 59.6 156 252.1 NSE 2.1 6.7 21.3 Thermal Sub-total, Industrial 61.7 92 162.7 190.38 245.73 273.4
THERMAL ENERGY GRAND TOTAL 240.29 391.74 503.18 605.55 810.28 912.64
Thermal Energy Grand Total in TWh 66.747 108.817 139.77 168.21 225.08 253.51Thermal Energy Grand Total in GWh 66747 108817 139772 168207 225076 253511
Total Thermal Energy Demand in GWh by ECN 193789 202128 248869
* Target years The ECN has made projections of the total final energy demand in Nigeria by sectors till the year 2030, for each of the three scenarios: the Reference Scenarios (RS), the High Growth Scenario (HGS), and the Low Growth Scenario (LGS). Table 2.2.4 gives the thermal energy demand as a percentage of the ECN total final energy demand for each of the three scenarios, from which it is seen that the thermal energy demand is about 20% of the total final energy demand regardless of the scenario within the plan horizon.

Renewable Energy Master Plan (REMP) • Final Report • November 2005 Energy Commission of Nigeria (ECN) • United Nations Development Programme (UNDP)
71
Table 2.2.33 Total Thermal Energy Demand as a percentage of Total Final Energy
Demandby scenario, in PJ.
2000 2007* 2010 2015* 2020 2025* 2030Total thermal energy demand, PJ 329.38 391.74 503.18 605.55 707.91 810.28 912.64
Total final energydemand by scenario, in PJ High Growth 1517 2093.8 2341 3183 4025 4766 5507 Reference 1517 2039.9 2264 2975 3686 4124 4562 Low Growth 1517 2001.4 2209 2832.5 3456 3754.5 4053
* Target years Table 2.2.4 Total Thermal Energy Demand as percentage of Total Final Energy Demand
2000 2007* 2010 2015* 2020 2025* 2030
Total thermal energyas % of Total finaldemand by scenario High Growth 21.71 21.56 21.49 19.54 17.59 17.08 16.57 Reference 21.71 22.07 22.23 20.72 19.21 19.61 20.01 Low Growth 21.71 22.46 22.78 21.63 20.48 21.50 22.52 * Target years A significant proportion of this thermal demand projection could be met by solar thermal energy, thus reducing the fossil fuel required with consequent environmental, ecological, social and health benefits. Quantification of the environmental benefit appears in later tables. An estimate of how much of the thermal energy in each sector that could be met by solar thermal collectors appears in Table 2.2.5. It is seen that solar thermal energy could contribute as much as about 7% and 9% of the HGS and the LGS total final energy demand respectively within the target period. Table 2.2.5 Thermal energy demand that could be met by solar thermal systems, PJ

Renewable Energy Master Plan (REMP) • Final Report • November 2005 Energy Commission of Nigeria (ECN) • United Nations Development Programme (UNDP)
72
Sector 1990 2007* 2010 2015* 2025* 2030Domestic 36 56 60 69 86 95Commercial 0.8 2 2.2 3.4 5.7 6.8Agriculture 1.6 4.1 4.5 6 7.5 9Govt./Instituion/Hotel/Clinics/Schools/etc. 50 92.5 100 133 167 200Industry 12 29.5 32.5 40 47 55Total, PJ 100.4 184.1 199.2 251.4 313.2 365.8Total, TWh 27.89 51.14 55.33 69.83 87.00 101.61* Target years Thermal energy is required in the domestic sector for boiling water for bathing and cooking as well as for cooking food. Most homes, particularly rural homes meet this requirement from biomass and paraffin cookers, while the upper middle to the upper class use LPG and electric cookers and geysers. In the commercial sector, thermal energy is similarly used for boiling water and cooking; in the informal commercial sector, biomass is the main cooking and water boiling fuel while in the formal commercial sector, both LPG and electricity are the main fuels used to meet the thermal energy needs. In the conglomerate of sectors termed Govt./Institutions/Hospitals/Hotels/Clinics/Schools/etc., the thermal energy requirement is met by all the main types of fuel, namely, electricity, biomass, paraffin, and LPG. In the industrial sector, the thermal energy requirement is met mainly by boilers and heaters using heavy fuel oil, diesel oil, or natural gas. 2.2.3a.3 Key drivers for solar thermal energy technology market Solar energy can be successfully applied for heating purposes at all latitudes. Some of the strongest markets for solar thermal energy in the world are in Europe (Germany and Austria) where the average solar radiation received annually is less than that received in most sunny tropical regions. Indeed, even in Europe, Germany and Austria receive considerably less sunshine than southern European countries such as Spain, Italy and Greece and Mediterranean Cyprus and Malta, yet the market in these countries lag far behind those of Germany and Austria. The lessons learned from the successful thermal energy stories of Germany, Barcelona, Spain, India and Botswana in Southern Africa provide an insight into the important key drivers for the solar market from the decades of these national experiences as follows. Policy formulation, particularly regulations that make installation of solar thermal systems mandatory in some sectors are important. Market competitiveness of solar thermal technologies need to be improved through stable and well-designed financial market incentives and financing mechanisms for investors and users by the Government. Such incentives include capital subsidies which are investment assistance in the form of grants and allowances, operational cost grants; preferential loans and guarantees, and tax privileges. Duties, VAT, levies, etc. on solar thermal energy systems should be removed, until the market forces can take control. Similarly subsidies, both direct and indirect, for non-renewable energy technologies and competing fossil-energy equipment and systems need to be removed.

Renewable Energy Master Plan (REMP) • Final Report • November 2005 Energy Commission of Nigeria (ECN) • United Nations Development Programme (UNDP)
73
Regulatory, administrative, and institutional conditions which make private sector investment difficult would need to be relaxed or scrapped. Conscious effort must be made to Improve information dissemination strategies to stakeholders in order to win wide public acceptance for solar thermal technologies. Education and training and international cooperation strategies must be strengthened. General awareness of solar thermal, especially among the relevant decision-makers, the political class and bodies, and awareness of energy savings and environmental issues must be increased. There should be organized public campaigns promoting solar thermal technology by the government with the involvement of the private sector and NGOs. Highly visible demonstration projects, with public authorities serving as a model will increase public confidence in the new technologies. A high level of trust would be achieved through quality products, recognized labels and availability of standard products and systems and development reputable local manufacturers and suppliers and availability of specifically skilled installers. There must be unqualified support for research, development, demonstration, dissemination and diffusion of solar thermal energy technologies. 2.2.3a.4 Gaps and barriers to solar thermal technology market development Flaws in the ways markets operate, such as entrenched subsidized energy prices of fossil fuels, energy prices that do not internalize the full social, health and environmental costs, and poorly informed consumers. These barriers also relate to human behaviour, among which are the low priority given to saving energy by many consumers, both domestic and business corporate consumers, and the tendency of consumers to purchase products based on least initial cost rather than the least life-cycle cost. Further barriers relate to public policies and institutions, and include the lack of attractive financing for renewable energy measures, and regulations that directly or unwittingly discourage renewable energy uptake. Specific barriers include: Lack of competitiveness as a result of high upfront costs and relatively long payback periods; High investment costs (due to low energy density) and frequently excessive profit anticipation of investors make financing of renewable technologies difficult; Lack of financing sources and/or of access to appropriate financing mechanisms; High discount rates which disadvantage projects with high capital costs but low running costs, such as solar thermal and other renewable energy technologies; Higher transaction costs (information, procurement, installation works, etc.) than conventional thermal energy systems, e.g. an electric geyser vs. solar water heater. Further, solar thermal energy is not yet perceived as an option, not to talk of standard option, thus decision makers must be informed and especially motivated. Need for solar thermal bodies and institutions – NGOs, Associations, Institutes, etc. to be formed to influence and educate decision makers, professional bodies and industry. Other barriers are the lack of availability of motivated and specially-skilled installers and technicians; Little or no awareness of solar thermal, especially among decision-makers and the public at large; also low awareness of its energy savings and associated environmental benefits; and lack of Codes of Practice, Standards, Testing and
Renewable Energy Master Plan (REMP) • Final Report • November 2005 Energy Commission of Nigeria (ECN) • United Nations Development Programme (UNDP)
74
Certification bodies and quality labels and infiltration of substandard equipment, service, and products, thereby eroding investor and customer confidence in solar thermal energy technologies. These barriers can be overcome only through well-designed and effectively implemented public policies, programmes and projects. 2.2.3b.1 The Global Market Situation for Solar PV Growth rates of 30% or more have become the established trend in the global photovoltaics market. World PV cell and module production reached its highest level in 2003 at 744.08 MW. This represented a 32.4% increase (182MW growth in annual output) over the 2002 figure of 561.77 MW. In both Japan and Europe, production grew by over 40%. Japanese PV cell and module output increased by 45% to 363.91 MW and there was a 43% increase in European production to 193.35 MW. However, there was for the first time a decrease in production in the US, which dropped by 14.6% to 103.02 MW, largely due to the collapse of one of the companies, Astropower. Production in the rest of the world more than doubled during 2003, increasing by 52.4% to reach 83.8 MW. The trend in world PV production from 1995 to 2003 shows that the bulk of the production is concentrated in the hands of the key players. During 2003, the top ten manufacturers accounted for 85% (634.42 MW) of total production. Japanese companies maintained first and third positions. Shell solar came second followed by BP solar. Sanyo’s production of its high-efficiency amorphous silicon/crystal silicon heterojunction continues to remain among the top ten, taking eight place. India, China, Taiwan, Brazil, Australia, Hong Kong, and Malaysia are among the leading producers outside Japan, European Union Countries and the US. Together, these countries contributed 83.80MW of the total module production in 2003. On the demand side, grid-connected installations have continued to dominate mainly in the key markets of Japan, Germany and the US State of California. This grid-connected residential/commercial sector is estimated to have grown from 270 MW in 2002 to 365 MW in 2003 or 49% of the total world module production in the year. The Japanese, German, United States and European markets for grid-connected systems increased by 200 MW, 120 MW, 38 MW and about 30 MW respectively. APPENDIX 4.3 shows the demand scenario of world PV market by application area between 1993 and 2003. It is to be noted that the available literature did not specify the global supply and demand pattern for other PV system components - batteries, charge controller etc. 2.2.3b.2 Present local demand and supply situation From available records, the first PV system in Nigeria was installed in the early 1980’s but unfortunately till date, no facilities have been set up for the local production of PV cells and modules. Presently, Nigeria has only acquired the capability for manufacture of non-solar-grade batteries for PV applications and the assembly of Solar-PV refrigerators. (i) Supply situation All the PV modules used in the Country are imported. A survey, of business activities in solar PV in Nigeria was conducted by the ECN in 1999. In that survey, the list of number of manufacturers of PV components and systems marketed in Nigeria, as well as the

Renewable Energy Master Plan (REMP) • Final Report • November 2005 Energy Commission of Nigeria (ECN) • United Nations Development Programme (UNDP)
75
number of countries involved was compiled. By 1999, a total of 44 companies and research Centres were active in the importation and/or installation of PV systems. The distribution of the companies is given below in Table 2.2.6. Table 2.2.6. ECN 1999 Survey results of solar PV businesses in Nigeria City Lagos Kad. Kano Jos Bauchi Maid. P H Nsuk. Sok. TotalNo. Comp.
30 6 2 1 1 1 1 1 1 44
Kad.; Kaduna; Maiduguri; P.H. – Port Harcourt; Nsuk. – Nsukka; Sok. - Sokoto Each of the companies was involved in PV business in any or more than one of these activities viz.:- consultants, vendors, contractors or distributors. Importation of Solar-PV Components From the 1999 survey, the total capacities of PV system components imported between 1993 and 1998 was 264 kWp. Fourteen companies were involved in the importation of modules, twelve in the importation of inverters and two or three imported converters, solar refrigerators, solar lanterns and lighting systems. It is recorded that all the imports were made by 14 out of 22 companies involved in PV business at the time. Prior to 1995, the imports were made by only 4 companies. While all the 14 companies imported PV modules, and twelve of them imported inverters as well, only two or three companies imported converters, solar refrigerators, solar lanterns and lighting systems. The import of solar pumps was dominated by two companies and only one company reported the import of junction boxes. The import situation at the moment in terms of companies involved, may have changed from what was earlier recorded in 1999. It is possible that some companies (e.g. Siemens) may have stopped business in Nigeria, while some new companies have sprung up. It will require a fresh survey to determine the current level of importation of PV components in the Country and the companies involved in the importation. (ii) Demand situation The demand situation can be assessed by the number of installations carried out within a specified period of time. APPENDIX 4.6 shows the cumulative installed capacities of the three major components in a PV system from 1990 to the middle of 1999. The total module installation for 1999 is estimated to be 264 KWp. Assuming a growth rate of 24% (twice the recorded value of 12% at mid-year) an average growth rate of PV module installation of 46% is established. Using this growth rate, the PV module installation in 2004 is estimated to be 1.74 MWp. The demand for 2005 is estimated to be 800KWp. An exact figure, however, can only be obtained from an up to date survey of the installation carried out by PV companies and research Centre.

Renewable Energy Master Plan (REMP) • Final Report • November 2005 Energy Commission of Nigeria (ECN) • United Nations Development Programme (UNDP)
76
2.2.3b.3 Key drivers for solar PV technology market The major drivers for the PV market in Nigeria include unreliability of grid power supply as the private sector use solar energy as back up; governmental sponsored remote power supply as well as international agencies, NGOs and individuals. Other drivers are: the unreliability of grid power supply which has created a market for solar energy as back-up for communication companies such as NITEL and several banks. This segment of the market has grown partly through the activities of PV entrepreneurs. Government sponsorship of remote power supply is another driver. The governments, especially the Federal and State governments, have particularly through their ministries of agriculture, water resources, health, education, power & steel, disseminated several PV systems for irrigation water pumping, water pumping for domestic use, vaccine refrigeration particularly for the expanded programme on immunization, village electrification. Some parastatals of Government e.g the Energy Commission of Nigeria, (ECN) the Agricultural development programme (ADP), the Rural Electrification Boards (REBs), Arid Zone Development Authorities (AZDAs).
Promotion of the dissemination of PV systems in the country by International Organisations, in collaboration with the governments of Nigeria is another driver. Some examples include: contributions to the Alternative Energy Fund of Jigawa State by the United States DOE and the WHO assisted National Programme on Immunisation (NPI). This programme use solar-PV-powered vaccine refrigerators. Individual promotion by some individuals who can afford it have installed solar PV systems either for remote power supply or as back-ups for poor grid services is another key driver for solar PV market. 2.2.3b.4 Gaps and barriers to solar PV technology market development The gaps and barriers to market penetration of photovoltaics include: High cost of PV system components; high import duties; psychological inertia; low public awareness; inadequate commercial activities and financial options; lack of regulatory standards; inadequate local technical expertise; political instability and security issues. Other gaps and barriers include lack of local manufacture of PV components, low level of government patronage, low sensitivity to environmental protection, port delays, no tax rebates and the cost-effective power limitation inability of PV systems to carry air conditioners. (at prices affordable to those who want to use them)
2.3 Biomass Energy The biomass resources of Nigeria consist of wood, forage grasses and shrubs, animal wastes arising from forestry, agricultural, municipal and industrial activities as well as acquatic biomass. The primary way to utilize biomass is through direct combustion.

Renewable Energy Master Plan (REMP) • Final Report • November 2005 Energy Commission of Nigeria (ECN) • United Nations Development Programme (UNDP)
77
Biomass is similar to fossil fuels as it is also made up of hydrocarbons that can burn to release heat. This vegetative cover is being denuded due to the incursion of agriculture, energy use and other natural and man-made factors. 2.3.1 Resource situation Previously, biomass dominated Nigeria’s energy landscape. It remains a leading source of energy for Nigeria contributing 37% of total energy demand, and the energy of choice for the vast majority of rural dwellers and the urban poor. However, the resource base is under pressure from both human activities and natural factors, such as drought. 2.3.1.1 Estimated resource base The biomass energy resources of the nation have been estimated to be 144 million tonnes/year. Nigeria is presently consuming about 43.4 x 10⁹ Kg of fuelwood annually. The average daily consumption is about 0.5 to 1.0 kg of dry fuel wood per person. The rate of consumption hardly matches the rate of reforestation. The total area of Nigeria is distributed among the various uses as shown in Table 2.3.1 below, where it is seen that Nigeria’s total area is 92.4 million hectares out of which 79.4 million and 13.0 million hectares are occupied by land and water bodies respectively. Agricultural land occupies 71.9 million hectares, which are further demarcated as shown in Table 2.3.1 below. The foregoing shows that there is a huge potential for production of agricultural biomass in Nigeria. 94% and 68% of Nigerian households are engaged in crop farming and livestock farming respectively. Table 2.3.2 further underscores Nigeria’s potential for the production of manure, which is a key component of agricultural biomass. Table 2.3.1: Nigeria’s Size and Land use Parameters
Nigeria Quantity (Million ha) Percentage (%) A. SIZE Total Area 92.4 100 Land area 79.4 85.9 Water bodies (rivers, lakes etc)
13 14.1
B. LAND USE Agricultural land 71.9 77.8 Arable cropland 28.2 30.5 Permanent cropland 2.5 2.7 Pasture land 28.3 30.6 Forest and woodland 10.9 11.6 Fadama 2 2.2 Other land 7.5 8.1
Source: Federal Ministry of Agriculture

Renewable Energy Master Plan (REMP) • Final Report • November 2005 Energy Commission of Nigeria (ECN) • United Nations Development Programme (UNDP)
78
Fig. 2.3.1 Nigeria’s livestock population. Source: Federal Ministry of Agriculture. Table 2.3.2: Nigeria’s Livestock Population (in millions) Livestock 1995 1996 2001 Cattle 17.6 18.1 21 Sheep 32.4 33.2 38.5 Goat 51.5 53.8 62.4 Pig 6.7 8.3 9.6 Poultry 96.1 97.3 112.9
Federal Ministry of Agriculture reported Nigeria’s livestock population as shown in Table 2.3.2 above. The figures for 2001 were calculated based on an annual grown rate in Nigeria’s livestock population of 3.2%. Considering cattle for instance, reported values of daily manure production range from 10kg to 60kg per animal. This indicates that Nigeria’s 2001 cattle population of 21 million should be expected to produce from 210 million kg to 1,260 million kilogramme (i.e. 0.21 to 1.26 million tones) of manure daily. These values result in an annual manure production from cattle alone ranging from 76.7 to 450 million tones of for Nigeria. Table 2.3.2: Calculated manure production of Nigeria’s livestock S/No
England Nigeria Manure
Produced Livestock Population
(millions) Manure produced (million tones)
FMA (1997) population (million)
Manure produced (calculated figures) (million tones)
Population based on FMA (1997) figures (millions)
2001 (Calculated figures) (million tones)
1 Cattle 85 80 18.1 170.4 21 197.6 2 Sheep 28 11 33.2 13 38.5 15.1 3 Goat 53.8 21.1 62.4 24.5

Renewable Energy Master Plan (REMP) • Final Report • November 2005 Energy Commission of Nigeria (ECN) • United Nations Development Programme (UNDP)
79
4 Pig 69 11 8.3 13.2 9.6 15.3 5 Poultry 104 30 97.3 28.1 112.9 32.6 Total 132 245.9 285.1
From the foregoing it is seen that Nigeria’s livestock manure aggregated production of 285.1 million tones shown in Table 2.3.2 is potentially able to produce far more than 3 billion cubic meters of biogas yearly, and this is more than 1.25 million tones of fuel oil per annum. From Fig. 2.3.2, it can be seen that in 1996 Nigeria recorded an aggregate crop production of about 93.3 million tones for the major crops. This quantity refers to the harvested useful parts of the plants. The discarded parts consisting of roots, leaves, stalks, straws, chaff and other parts of plant shoot (otherwise called crop biomass) would be far in excess of the figures shown in Fig. 2.3.2. From all the above, it is seen that Nigeria’s annual production of agricultural biomass is enormous.

Renewable Energy Master Plan (REMP) • Final Report • November 2005 Energy Commission of Nigeria (ECN) • United Nations Development Programme (UNDP)
80
Fig. 2.3.2 Nigeria’s production of major crops (in million tones)

Renewable Energy Master Plan (REMP) • Final Report • November 2005 Energy Commission of Nigeria (ECN) • United Nations Development Programme (UNDP)
81
Table 2.3.4: Nigeria’s Production of Major Crops (Million Tones) S/N Crop 1995 1996 1 Cereal
grains 22.9 21.7
2 Tubers 56.7 57.4 3 Pulses 2 2.2 4 Plantain 1.6 1.7 5 Vegetables 2.6 3.5 6 Industrial
crops 3.7 6.8
Total 89.5 93.3 Source Federal Ministry of Agriculture M
Table 2.3.5: Estimated Nigeria’s Wood Requirements (in ‘000 m3)
1993 2000 2010
Fuelwood 103,474 109,966 111,102
Utility Wood 2,514 2,874 3,441
Sawlogs 6,182 8,398 12,864
Veneer logs 618 857 1,359

Renewable Energy Master Plan (REMP) • Final Report • November 2005 Energy Commission of Nigeria (ECN) • United Nations Development Programme (UNDP)
82
Particleboard 69 111 230
Pulpwood 640 540 958
TOTAL 113,497 122,746 129,954
Fig. 2.3.3 Nigeria’s estimated wood requirements. Source: Formecu. Source: FORMECU) The country’s estimate of wood resources available has been provided by FORMECU. The supply possibility of fuelwood was estimated at 78.9 million m3 for 1994. The estimated Nigeria’s wood requirement is presented in Fig. 2.3.3. While the summary of Forest plantation Resource in Nigeria is presented in Table 2.3.6. Fuelwood production takes place in all parts of Nigeria. Although the available fuelwood volume is much higher in the high forest zone, intensity of fuelwood extraction appears much greater in the northern states. Other possible biomass resource base includes aquatic plants such as water hyacinth and municipal wastes – both of which constitute major environmental problems. These present opportunities for meeting energy needs sustainably. 2.3.1.2 Technical Assessment of Biomass Energy Technologies The assessment in this section comprises, biogas, bio-fuels, woodstoves and biomass briquetting technologies. 2.3.1.2a Overview of Biogas and Bio-fuels Technologies The techniques used for the conversion of organic biomass materials to solid, liquid and gaseous fuels have been in existence for many years in both the developed and developing countries. I. Biogas Technology Biogas is a mixture of 60 to 70% methane (CH4), 23 to 38% carbon dioxide (CO2), about 2% hydrogen (H2) and traces of hydrogen sulfide (H2S). It is produced by the anaerobic (i.e. in the absence of oxygen) digestion (fermentation) of organic materials and its lower heating value is approximately 6 kWh/m3. Biogas can be used in the household for heating, cooking and lighting; in the community farm; for agricultural and industrial production. In Nigeria work on biogas started after the Federal Government established the two Renewable Energy Centres at Sokoto and Nsukka in 1982. These two Centres along with many tertiary institutions have been involved in biogas research activities. So far, less than 20 pilot projects on biogas are in existence in the country. The Sokoto Energy Research Centre (SERC) had constructed more than twentyen (210) biogas plants ranging

Renewable Energy Master Plan (REMP) • Final Report • November 2005 Energy Commission of Nigeria (ECN) • United Nations Development Programme (UNDP)
83
from 10-20 m3 capacity across the country using different substrates such as cow dung, human excreta, piggery waste etc. with a failure success rate of not less than 820%. Similarly the National Centre for Energy Research and Development Nsukka (NCERD) had constructed some field biogas digesters that are all operational. The UNDP had successfully introduced to Yobe, Jigawa and Kano States the floating drum and plastic balloon and tube types of biogas digesters under the Africa 2000 low technology biogas system. In Kano State, a family of 40 at Kwachiri community has now dependeds on the UNDP biogas project (using cow dung) since 2003 for their daily cooking needs. Similarly the UNDP introduced biogas technology at some market abattoirs in some Northern States. 2.3.1.2b Technical Characteristics There are three designs for biogas digesters so far. These are: I. The Fixed Dome - Consists of an airtight container constructed of brick, stone or concrete, the top and bottom being hemispherical. and the walls straing. Sealing is achieved by building up several layers of mortar on the digesters inner surface. The digester is fed on a semi-continuous basis (usually about one per day) and the gas produced rises to be stored under the upper dome. Typical feedstock for these digesters is animal manure, human excreta and agricultural waste. Gas production from the digester is commonly in the order of 0.1-0.2 volumes of gas to volume of feedstock per day, retention time in the digester being 60 days at 25oC. II. The Floating Cover – The design of this digester was first developed by Indian’s Khadi and Village Industries Commission (IKVIC) and consists of a cylindrical container, the height to diameter ratio being in the order of 2.5-4.1:1, constructed of brick or concrete reinforced with chicken wire. Digester construction strength is not as critical as with the fixed dome type since the only pressure on the walls is the fermenting material, the gas produced floats upwards as the pressure increases. The cover is usually constructed of mild steel. Cost, corrosion and maintenance of the cover have been the main problem of this design. Typical feedstock is cattle manure, which is fed semi-continuously into the digester, displacing an equal volume of slurry, which is drawn out through an outlet pipe. Typical retention time for the feedstock is about 30 days in warm climates and up to 50 days in colder regions. Using cattle manure with 9% solids, gas yields of 0.2-0.3 volumes of gas per volume of feedstock per day have been regularly achieved. The pressure of the gas available depends on the weight of the gasholder per unit area. III. The Bag Digester – This type of digester comprises of a long cylinder either polyvinyl chloride (PVC) or a material known as red mud, plastic-developed in 1974 from the residues of bauxite smelted in aluminum production plants. Incorporated in the bag are inlet and outlet pipes for the feedstock and slurry and a gas outlet pipe. Gas produced is stored in the bag under a flexible membrane. A complete 50m3 – volume digester weighs just 270kg and is easily installed in a shallow trench. Feedstock is fed into the bag semi-continuously with the feed displacing an equal amount of slurry

Renewable Energy Master Plan (REMP) • Final Report • November 2005 Energy Commission of Nigeria (ECN) • United Nations Development Programme (UNDP)
84
removed from the outlet. Typical retention times vary depending on the substrate used from 60 days at 15-20oC to 20 days at 30-35oC. Since the digester has extremely thin walls. It can be solar-heated by direct exposure to the sun. Gas produced from the bags has been found to vary from 0.23-0.61 volume of gas to volume of feedstock per day depending on local conditions and feedstock available. However, this digester is not commonly used. 2.3.1.3 Benefits and Limitations Biogas has the following benefits:
The production of energy resources that can be stored and used more efficiently; The production of a stabilized residue (the sludge) that retains the fertilizer value
of the original material; The saving of the amount of energy required to produce and equivalent amount of
nitrogen-containing fertilizer by synthetic process Potential for partial sterilization of waste during fermentation, with the
consequent reduction of the public health hazard of faecal pathogens; and Reduction, due to the fermentation process, of the transfer of fungal and other
plant pathogens from one year’s crop residue to next years crop. Biogas technology has not made much impact in Nigeria for the following reasons:
Public awareness on biogas is inadequate; Availability of local technical expertise in building biogas plants in the country is
limited; Biogas construction is relatively costly; and There is low sensitivity to environmental protection in the country
2.3.2 Woodstoves and Biomass Briquetting Technologies The traditional methods of cooking which have been used for centuries with little modifications, involve burning of wood and other crop residues in an open fire, sometimes enclosed by metallic, clay or bricks to act as wind shield. In most cases, three stones are placed around the fire to act as supports for the cooking pots. This method of cooking is very inefficient and a sources of health hazard to the users. The performance of this traditional method is only 5-10%. The fire wood consumption and the energy cooking requirements would thus be relatively high. Certain critical factors drove international activities on developing fuel-efficient wood stoves throughout the developing world. A primary factor is the “wood fuel crisis” of the early 1980 due to drought in many parts of the world. Increasing attention to population issues and pressure on land resources partly propelled this trend. Addressing the energy situation of the poor in an integrated approach particularly affected this development. Availability of energy, reducing costs and drudgery of women and children as well as indoor air pollution and family health were critical issues.

Renewable Energy Master Plan (REMP) • Final Report • November 2005 Energy Commission of Nigeria (ECN) • United Nations Development Programme (UNDP)
85
Table 2.3.3 Improved Wood stoves in Kenya, China and India
Improved stoves Efficiency (%) Cost ($US) Dissemination Jiko Kenya 25-40 $2 to $5 1 million plus Maendeleo 15-35 0$.80 to $1.20 100,000 Chinese brick and mortar 20-40 $8 to $9 125 million
Indian mud & clay chulha
10Oct-40 $8 to $10 8 million
Today, many African countries have made significant progress in developing and disseminating improved wood stoves. Kenya has disseminated over one million improved stoves. Globally, India, China and Kenya are world leaders in the development and use of this technology, and Table 2.3.3 indicates parameters for improved woodstoves from these countries. 2.3.2.1 Technical Characteristics of Improved Woodstoves At present, apart from the few institutions of higher learning which are involved in research and development of efficient woodstoves, the major activities comprising research and optimization, manpower training and dissemination of these stoves remained under the two centers of renewable energy namely Sokoto Energy Research Center and National Center for Energy and Development Nsukka. To date, a number of international and local wood stoves were developed and characterized based on all possible considerations, such as raw materials, cost, as well as other social factors with the following ready for adaptation and commercialization. I. Single-Hole Metallic WoodStove. Two versions were developed at Sokoto Energy Centre and Energy Research and Development Centre at Nsukka respectively. They were constructed from galvanized medium- and high-grade sheet metal with provision of intake air and firewood at the inlet of the stoves. These stoves have efficiency of over 17% versus less than 10% for the traditional metallic tripod stove (See Annex 1.) II. Single-Hole Clay WoodStove. In a similar way a stove was constructed from clay which was prepared with binding materials such as grog, millet/rice husk and allowed to dried. The stove was later fired to make it water and fire resistant. Three types of improved wood stove depending on the family sizes and dishes to be cooked, were designed and developed with three principal features: (i) a close heath (fire box), where combustion of the wood takes place thus protecting the fire from the effects of the wind to reduce heat lost mostly by convection and radiation; (ii) multi-pot design, capable of carrying out more than one pot at a time permitting heat recovery from hot gases that otherwise have gone to waste; (iii) a chimney to provide the necessary draft for bring in air for combustion and removing smoke from the kitchen environment, thereby making it convenient to users. Other woodstoves developed locally are as follows:

Renewable Energy Master Plan (REMP) • Final Report • November 2005 Energy Commission of Nigeria (ECN) • United Nations Development Programme (UNDP)
86
III. Double-hole woodstove. The design was obtained after modifying a similar type of wood stove fabricated and tested in Nepal. A chimney was integrated in this design as shown in Annex1. This type of stove is mainly for the medium size families of 6 to 10 sizes, with efficiency of over 42% as against the most commonly used traditional stoves. IV. Large size four-hole woodstove. The design was obtained from a similar one fabricated in Ghana after certain modifications. Here also the chimney was integrated in the stove. Such wood stove has been considered for large family size above 10, and recorded efficiency of 45% above the commonly used traditional stoves. V. Community based improved woodstoves. These were also developed from a similar one fabricated in China after some modifications. This was made of two pot-holes, designed to accommodate large cooking pots of 40 to 60 people at a time. The stove was constructed from heavy channel of angle iron and high gauge iron sheet and cased by burnt bricks to reduce convective and radiation heat losses. A rectangular Chimney of bricks was also incorporated in the stove. The stove recorded an average of 45% efficiency as against the conventional stove. These stoves have been introduced into many Nigerian Prison homes, such as at Zaria, Birnin Kebbi, Sokoto, Gusau and Kuje (Abuja) Prison homes. The performance of these stoves were evaluated after two years and found to have over 40% firewood saving, 22% time saving as against the existing open heartht stoves and less hazardous due to the provision of the chimney in the stoves. 2.3.2.2 Economic Competitiveness of Woodstoves The traditional three-stone stove is cheap and simple to make compared to the improved clay or metal woodstove. However, on the basis of life cycle cost, efficient utilization of fuel wood and other environmental advantages, the improved versions far outweigh the traditional stoves. Improved woodstoves (with provision of chimney) cost between N550.00 and N900.00 for single-hole clay and metallic and double-hole clay respectively (approx 3 to 4 times as much as traditional improved tripod metallic stove). However, because of the local training received by the local potters and artisans on the design, construction and maintenance of these stoves, the increased production of these stoves has brought down the cost to about 70% now. The combined experiences of our national energy survey, village demonstration project and laboratory investigations proved an average fuelwood saving of 30% and 38% for the single and double hole stove respectively. Based on the average family size of 7, the consumption of fuel wood per family is about N40.00 per day, yielding a total yearly saving of N6120.00 and N7752.00 for the single and double hole stove respectively. Each stove thus pays for itself within about 2 months. Equally, an average saving of 35% was realized for the average consumption of fuel wood of N1000.00 daily from the Nigerian prisons, amounting to N126,000 annually.

Renewable Energy Master Plan (REMP) • Final Report • November 2005 Energy Commission of Nigeria (ECN) • United Nations Development Programme (UNDP)
87
2.3.2.3 Benefits and Limitations on Woodstoves The result so far obtained from these improved wood stoves project (based on laboratory and field experience) has revealed the following results: (i) Reduction of fuelwood consumption by about 40% over the existing traditional methods corresponding to cost saving of about eight thousand naira annually (N8, 000.00) yearly; (ii) Time saving by about 32%; (iii) Reduction in fuelwood consumption of 30-38% corresponding to cost saving of N6,000-N7,500 yearly for the single and double hole stove respectively and average time saving of 30%; and (iv) Guided exit of smoke by the chimney and proper damper setting to serve as a mechanism for the control of fire intensity. Equally, the technology involved in the fabrication of these improved woodstoves is simple and rural people can easily fabricate them. These stoves can be fabricated by local potters and artisans using available local raw materials. The limitations of the technology include insufficient public awareness, problem of fuelwood alternatives to rural Nigerians, and cost free nature of both the traditional three-stone stove and the firewood for the rural people. 2.3.2.4 Overview of the technology of Biomass Briquetting Biomass in the form of fuel wood, charcoal, corn-stalks and crops residues, dried solid animal waste, sawdust, millet/rice husk, kernel shells and other crop processing wastes constitute virtually 100% of the traditional cooking and heating fuel in the West African sub-region. The major raw materials resources of biomass for briquettes production are: (i) Wood Waste - this is a waste arising from human operation of wood extracting from forest woodland and plantations and converting it to planks and other “stock”; (ii) Agricultural Waste - these wastes obtainable as a by-product of agricultural activities either during harvesting or processing of the produce such as leaves, baggage, stalks, straws, grain, husk, shells, stalks, etc.; (iii) Binders - should have a high heat value as the briquette, relatively high bonding strength, low cost with no offensive odour emission and minimal need for drying. These binders fall into three categories:
(a) Inorganic Materials: In organic materials and fibers, such as cement and silicate of soda are appropriate for wood fuels but they are poor as they give more ash, reduce the heat value and fall apart while burning.
(b) Organic Materials: organic materials such as starch, tar pitch, resin, glue and gum Arabic usually increase the heat value and create no extra ash. Other materials like fibrous materials may serve as binding agents. The cheapest is hydrated wood fiber and pulped wood waste. Generally, some binders permit the materials to be briquetted while others coat the surfaces.
(c) Starch Binders: such as cassava, corn and others are smokeless but not moisture resistant, and they are normally used in the proportion of 4% (dry basis). Tar, pitch, asphalt and sugar cane molasses are moisture resistant but not smokeless. 2.3.2.5 Technical Characteristics of Biomass Briquetting Developing countries like India and China are shaping cowdung manually to produce dung cake while in Nigeria, particularly in Northern part of the country, cow dung cakes

Renewable Energy Master Plan (REMP) • Final Report • November 2005 Energy Commission of Nigeria (ECN) • United Nations Development Programme (UNDP)
88
have been used for cooking and heating for over decades. Much effort have been devoted to making a simple machine for the production of briquettes. A steel pipe provides a good briquetting mold under pressure. Commercial briquetting machines are available which can produce briquettes of varying diameters and lengths and with production capacities as high as 2000 kg/hr. Both hand-operated and motor-driven briquetting machines are similarly available commercially. The press could be plunger or screw type while the die could be of any desired shape, though the cylindrical shape is common. In Nigeria, several machines developed for briquettes production includes a single cylinder extrusion machine that transforms rice, millet husk and sawdust to briquettes. This machine produced 13kg of briquettes/hour at Sokoto Energy Research Centre, Usmanu Danfodio University, Sokoto, Nigeria. Another machine, Sawdust briquetting Machine (Screw Press), was developed at Obafemi Awolowo University, Ile-Ife. The Machine has press barrel screw shaft, bearing assembly, nozzle or die and 4kw electric motor. It is capable of producing 10kg/hr of sawdust, rice husk and groundnut shells briquettes with 17.8MJ caloric value and 67.94% burning efficiency. Additionally, a simple tabletop close – end die piston process fitted with both a pressure and dial gauge has been used to produce briquette using Rattan furniture waste at the University of Ibadan, Nigeria. The latest development is the briquetting machine developed by the Center for Industrial Studies (CIS) of the Abubakar Tafawa Balewa University (ATBU) Bauchi in collaboration with the Raw Material Research and Development Council (RMRDC), Abuja. This machine has four pistons and cylinders, a hopper with four feed holes table, cover and locking device and a crank arrangement as the major operating parts. This machine, using sawdust and agricultural wastes with suitable binding material, was able to produce 40kg/hr of briquettes based on four compaction and ejection cylinders. However, only two small-scale companies exist in Nigeria, one in Ogun and Kaduna states which produce and market sawdust briquettes as all other development regarding this technology is mostly limited to Research Institutes, Universities and other tertiary institutions in Nigeria. 2.3.2.6 Economic Competitiveness of Biomass Briquetting Besides the normal domestic cooking, briquettes are used for rural industries, such as small-scale foundries, bricks, kilns and bakeries. However, because of the unpopularity and lack of technological awareness of briquettes production and machinery, there exists only a couple of industries (in Kaduna and Ogun States) involved in the production and marketing of briquettes in Nigeria. Except the few mentioned research and development activities going on in our tertiary institutions. Based on these reasons, the extent of utilization of this technology is negligible and cannot be quantitatively defined as of now. Briquette Industries Ltd at Ota Ogun State is involved in briquetting of sawdust as alternative to cooking fuel, while that in Kaduna, has not started production. But based on currents heating value of the locally produced briquette it has 6 to 7 times more energy content per kg than the loose biomass not briquetted. Equally the heating flame and temperature obtained in cooking process are better when compare with other renewable energy fuels. The briquettes with about 16.6 MJ calorific value and about 70% burning

Renewable Energy Master Plan (REMP) • Final Report • November 2005 Energy Commission of Nigeria (ECN) • United Nations Development Programme (UNDP)
89
efficiency in comparison with other solid cooking fuels proved to be cost effective based various cooking performances conducted. 2.3.2.7 Benefits and Limitations on Biomass Briquetting Technology, which focuses on the conservation of energy and maximum utilization of raw materials, is becoming the most relevant and should continue to receive due attention. The densified fuels produced from wood residues and other agricultural waste products are appealing because the fuel is dry and uniform in size, thus easier to store and ship. The uniformity and increased heating value per unit volume also provides better combustion control and overall combustion efficiency. Benefits of briquettes include:
• Reduced biomass bulk through densification of the materials, with resulting in
easier and cheaper transportation. • Increase of the energy content per unit volume of materials by reducing the
moisture content during the compaction processes. • Product homogeneity obtained (same density particle size and moisture content)
from highly heterogeneous group of raw materials. • Uniform quality of energy per unit feed stock generally assured. • Highly cohesive fuel product from particular materials that were otherwise
difficult to process. • Increased resistance to breakdown of particles in shipping handling and storage.
2.3.3 Market Situation for Biomass Technologies This section will consider the situational analysis of the market for the biomass technologies, specifically fuelwood biomass. 2.3.3a.1 Present Demand and Supply Situation for Biomass Technologies Biomass fuels are overwhelmingly the most important energy for rural households, agricultural production and rural industries. Charcoal has traditionally been the main cooking fuel in some towns and cities, and is still widely used. Charcoal is likely to continue to be an important fuel among low-income urban households, but demand has been stable in recent years and much of the future growth of urban household energy needs will be met by conventional fuels, and in particular electricity and petroleum products unless biomass resources are developed and used more efficiently. Fuel wood is gathered freely by rural households, from their immediate environment. This includes both trees outside forests, and around homestead, and wood obtained from forest areas where such areas are accessible to rural community. In the urban areas, fuel wood is supplied from the rural areas and usually sold at affordable prices. Figures 2.3.4 and 2.3.5 show the growth pattern in fuel wood consumption and per capita fuelwood requirements, respectively.

Renewable Energy Master Plan (REMP) • Final Report • November 2005 Energy Commission of Nigeria (ECN) • United Nations Development Programme (UNDP)
90
Fig. 2.3.4 Fuelwood consumption in Nigeria in thousand cubic meters. Table 2.3.9: Fuelwood, past, present and projected consumption ‘000M3
Ear Total Consumption ‘0003 Tonnes of Oil Equivalent ‘000 (toe)
1995 78,734:98 18,746:42 1998 81,606:68 19,430:16 2000 83,521:14 19,885:99 2005 85,829:61 20,435:62 2010 88,138:07 20,985:25
Source: FORMECU

Renewable Energy Master Plan (REMP) • Final Report • November 2005 Energy Commission of Nigeria (ECN) • United Nations Development Programme (UNDP)
91
Table 2.3.10: Fuelwood, past, present and projected per capita consumption
Year Fuel Consumption M3
Kg of Oil Equivalent (KOE)
1995 0.79 188 1998 0.73 173 2000 0.7 167 2005 0.63 149 2010 0.56 134
Fig. 2.3.5 Per capita fuelwood consumption in Nigeria, in cubic meters per capita Source: FORMECU
Current pressures upon biomass resources and rates of deforestation can be expected to intensify as increasing demand comes into conflict with decreasing supply. The future of biomass fuel consumption in Nigeria must raise cause for concern. Despite the increased penetration of commercial fuels, it can be expected that demand for biomass fuels will be sustained and, in all probability, will increase in the short-to-medium-term. There is at present no viable substitute for the bulk of biomass fuel consumption, which occurs in the rural household sector, and it is difficult to identify where a viable alternative would come from. Projections of future demand support these contentions, and also call into question the ability of country’s woody biomass resources to sustain the expected level of demand. As shown in Table 2.3.4, fuel wood demand is expected to outstrip supply, during the period 1995-2010. Table 2.3.4: Summary of demand, supply and balance (gap) fuelwood 1995-2010 (‘000 M3). Year ProjectedForecast
Requirement ProjectedForecast Supply
Balance
1995 78,734:98 76,207:72 -2,527:27 1998 81,606:68 73,147:58 -8,459:10 2000 83,521:14 71,107:49 -12,413:60 2005 85,829:61 67,117:19 -18,712:40 2010 88,138:07 63,126:88 -25,011:10 Source: FORMECU

Renewable Energy Master Plan (REMP) • Final Report • November 2005 Energy Commission of Nigeria (ECN) • United Nations Development Programme (UNDP)
92
In 1995 a deficit of 2.53 million m3 of fuelwood was forecasted. This was expected to rise to 12:4 million m3, 18.71 million m3 and 25 million m3 in years 2000, 2005 and 2010 respectively. 2.3.3a.2 Key Drivers for the Biogas and Biomass Technology Market To ensure that energy demand is met in the most cost-effective way, the market will be required to function effectively. This will depend upon:
• Market Liberalization. Ensuring a high degree of market liberalization, albeit within government regulatory frameworks.
• Safety. Improved safety, capacity and efficiency of energy transport facilities. • Technology. Commitment to R&D and the management of technology and
technology transfer to improve energy choice and to protect the environment. • International Co-operation. Co-operation is required at the International level on
developing technology and infrastructure, exchanging information and encouraging free markets and access to energy resources.
• Environment. Environmental considerations are of equal importance in energy market development. It is necessary to work towards sustainable energy use by incorporating environmental considerations in economic decision making, while continuing to rely on market forces subject to suitable environmental standards.
• Security of Supply. The best strategy is to increase energy choice, adaptability to change and international co-operation. Energy security is best achieved and maintained through initiatives that increase energy choices and promote adaptability to change, rather than through subsidizing domestic resource.
• Energy Efficiency. Enhancing economic efficiency of energy use is vital to achieve the best utilization of biomass resources and to protect the environment, and should be given a high priority. Energy efficiency should be improved by strategies involving regulation, persuasion, and enhanced R&D for new and more efficient technologies.
2.3.3a.3 Gaps and Barriers to Market Development to biogas and biomass energy resources The following are some of the gaps and barriers to market development of biogas and biomass energy resources: (i) Uneven Distribution of Biomass Resource. Biomass resources are distributed particularly unevenly. Uneven distribution of resources also increases transportation costs, which can amount to 25% or more of the cost of fuelwood for instance; (ii) Low Conventional Energy Prices. Low conventional energy prices hold back the development of alternative supplies even if they benefit most energy users in the shorter term. This report does not advocate high-energy prices per se, but prices, which cover all costs. This would imply some increase in prices, which would help extend available resources, and encourage the bringing on of alternative sources and substitutes. Higher energy prices may eventually create the conditions whereby cheaper services can be delivered; (iii) Political. Local confilicts and trade disputes may interrupt supply of the resource; (iv) Financial. The inability of government and companies to finance energy supply from

Renewable Energy Master Plan (REMP) • Final Report • November 2005 Energy Commission of Nigeria (ECN) • United Nations Development Programme (UNDP)
93
biomass resources due to other investments competing for funds such as health, education, housing, roads etc. (v) Institutional. In recent decades many forms of energy supply have effectively been monopolies, usually created at the behest of and protected by the country, and either wholly or partly distanced from the market disciplines of competition. Failure of some monopolies to achieve acceptable levels of efficiency, customer responsiveness and financial returns has led to recent steps being taken by the government towards privatization and the opening up of energy markets; (vi) Technical. The inability to absorb and utilize the necessary technology and commercial skills; to mobilize energy resources and to convey them to the point of need. This links to the importance of effective management of resources; (vii) Time. Time is required to change perceptions, policies, institutions, infrastructures and technology. Time is a significant resource in marshalling in present context, in the absence of emergency conditions and policies; long lead-times are required for the introduction and diffusion of biomass technologies; and (viii) Environment. There is the need to control the adverse impact of biomass energy provision and use on the environment. Nigeria is vulnerable and heavily dependent on traditional energy supplies especially fuelwood, which are dwindling as population is rising. 2.3.3b.1 Market Situation for Biomass Woodstoves and Briquetting Technologies 2.3.3b5B.21 Present demand and supply: The widespread rural diffusion of fuel-efficient cooking stoves has been viewed in the international arena as a promising way to reduce overall fuel wood demand, since an average of over 75 percent of cooking energy is derived from biomass energy is used for cooking. There is also is the direct concern that decreased stocks of fuel wood could lead to a wide spread rural energy shortage and, increaseding reliance on crop wastes and dung to supply household energy. In Nigeria the increasing price of commercial fuels, (Kerosene, coal, etc.) over the past 10 years explains the persistent use of fuel wood for cooking not only among the rural but even the urban poor. The design changes, marketing as well as training programme on production, use and maintenance of improved woodstove was left in the hand of research centers through the Energy Commission, institutions of higher learning and private organizations without a central co-ordinating body to asses their degree of demand and supply. Lack of data base on both the demand and supply of these technologies continues to be a great barrier to market development. The two energy research centres at Sokoto and Nsukka do sell these improved wood stoves to individual on limited numbers basis, while production and marketing of these stoves are left to individual craft people and potters. Thus it is difficultimpossible to quantify the level of demand and supply of these stoves in Nigeria. Equally, the technology of biomass briquette to date is not established as such, quantification of demand and supply has remained difficult and elusive. 2.3.3b.3 Key Drivers for The Market
Renewable Energy Master Plan (REMP) • Final Report • November 2005 Energy Commission of Nigeria (ECN) • United Nations Development Programme (UNDP)
94
The key drivers for the development of the market for improved wood stoves and biomass briquettes in Nigeria are as follows: (i) Availability of Resource and Technology. Both the improved wood burning stove and biomass resources for briquette production are available in sufficient quantities. However, the level of technology necessary to give the desired appeal and satisfaction remains an important parameter for market development. Nevertheless, the technology involved in the fabrication of these products is so simple that the rural people can easily fabricate them. (ii) Socio-Economic Behaviour: The technology requirements for the production and marketing with little modification of improved wood burning stoves is quite in line with the existing culture and practice of our local potters and artisans. The manual briquettes production has been practiced in our villages for decades. These factors, which exist as inbuilt behaviors, will accelerate the social acceptance of the two technologies thereby driving the market to full development potential. Generally the products will present a new symbol status to both urban and rural areas. (iii) Suitability and Efficiency. The ability of improved wood stoves to handle the cooking of a number of dishes simultaneously makes them suitable to many Nigerians. Furthermore, chimneys integrated wood stoves provide better healthy conditions to the people involved in cooking. The much higher efficiency of of the improved stoves increases the chances of faster market penetration. The superior handling and transportation characteristics of briquettes over the loose biomass favours market adoption and penetration. The increase energy content up to 6 times per unit volume of material provides better efficiency of the briquettes. (iv) Economic Consideration. The established facts on the reduction of fuel wood by 40% over the existing practice, through the use of efficient wood stoves remains one of the most important factors to be considered for the product in the market. This reduction amounts to reasonable savings over short, medium and long terms.
2.3.3b.4 Gaps and Barriers to Market Development: The gaps and barriers to market development of wood stoves and biomass briquettes are:
• Technological Constraints. This includes the limits of scientific knowledge, unsolved engineering problems, the availability of materials, well equipped laboratories and workshops, and ignorance of advanced production techniques.
• Industrial Constraints. These technologies are regarded as low level as such industry has not been too eager to embrace them. Thus, they have been left largely in the hands of craft people to develop.
• Infrastructural Constraints. This is a general term for the entire energy service, production and delivery system. In the area of biomass energy systems, the nation’s industrial capacity especially in the sector of renewable energy development is weak.
• Education. The level of public and political awareness of the potentials and benefits of improved wood stoves and biomass briquette in the country is very low both economically and environmentally.

Renewable Energy Master Plan (REMP) • Final Report • November 2005 Energy Commission of Nigeria (ECN) • United Nations Development Programme (UNDP)
95
• Insufficient-Funding. Inadequate financial and institutional infrastructure is a serious barrier to the rapid uptake and development of renewable energy technologies in Nigeria, particularly for the improved wood burning stoves and biomass briquetting market development.
• Implementation of the National Energy Policy. Though the existing National Energy Policy pays some attention to RETs, adequate implementation has not occurred. Other key barriers include the low prices of other conventional fuels.
2.3.4 Cogeneration and Other Biomass Technologies Cogeneration (Combined Heat and Power or CHP generation) is a fully mature, proven, competitive and environmentally benign technology. Such claims arise from its relatively much higher efficiency and its ability to use wastes effectively, whether such wastes be biomass and biomass wastes, municipal or industrial wastes. It is applicable as a distributed power generation source in applications that require both heat energy and electrical power. Cogeneration is the simultaneous production of electrical power and heat energy in applications where both are used preferably on the generation site, or excess of either is sold to a third party such as the utility grid (for excess electricity) or a district heating or cooling systems (for excess heat energy). In conventional power plants on the other hand, up to 70% of the thermal energy used for production of electricity is lost in cooling towers or in condensers cooled by river, lake or sea water. In general, application of cogeneration is based on the heat energy demand of the system, be it in a building, factory, town or city served by district heat or cooling. Table 2.3.5 below shows the great thermal efficiency and carbon emissions reduction advantages of CHP compared to conventional power plant technologies. It is clear from the table that CHP is a carbon-reducing technology. Indeed it has been identified as a significant measure that can be used to meet the Kyoto Protocol CO2 targets of several EU countries. Table 2.3.5. Efficiency and carbon emissions of thermal power plant technologies
CO2 emissions,
Item Power plant technology Plant efficiency range, %
g/kWh 1 Large central thermal power plants 25 – 40 500 -1000
2 Combined cycle (gas and steam turbine) thermal plants
45 – 55
3 Cogeneration 55 – 80 200 – 300
The prime mover in a cogeneration system will either be a gas turbine, a steam turbine (or a combination of these in what is known as Combined Cycle Gas Turbine, CCGT) or a reciprocating internal combustion engine, usually a stationary diesel engine. The prime mover drives an electrical generator and the heat from the prime mover can be used with a steam turbine and/or heat exchangers to produce the needed steam or hot water in the most cost-effective way.

Renewable Energy Master Plan (REMP) • Final Report • November 2005 Energy Commission of Nigeria (ECN) • United Nations Development Programme (UNDP)
96
Cogeneration systems on the market range from as low as about 1 kWe (Stirling-engine-based systems for domestic applications) to unit sizes up to hundreds of MWe (for gas turbine-based industrial applications). Obviously, the choice of prime mover strongly influences the heat quality and the heat-to-power ratios achievable by a cogen system. The turbine exhaust gases temperature (TET) in a simple gas turbine for example is around 500oC, from which it is possible to raise high-pressure steam for on-site use. On the other hand, the heat recovered from a reciprocating engine is a lower grade heat at a temperature of about 120oC, which can be used to produce only hot water at 70 – 85oC, depending on the effectiveness of the heat exchanger used. To maximize savings, the system will be designed to cover on-site heat demand, with the electricity as the by-product. Typical heat-to-power ratios for low-temperature heat demand (in residential and district heating/cooling applications) will be about 3:2, while a ratio of 1:1 is typical for high-temperature heat demand in industrial applications. Provided the installation is based on the heat demand, a surplus of electricity will usually be produced. The surplus electricity can be sold to the electricity utility or to another consumer (an operation known as wheeling in the industry). This technology therefore highlights the importance of the electricity sector reform and regulation and the relevance of the energy-market liberalization process. If, however, the installation is based on on-site electrical power demand rather than on the site heat demand, then top-up boilers will usually be required to meet the shortfall in heat demand with consequent reduction in the overall plant thermal efficiency. Traditionally, the majority of potential investors in cogeneration systems are industrial, commercial and public organizations whose main activity is not the production of energy, and for whom cogeneration represents a significant investment (at about $1500/kW) in a non-core part of their business. Thus, to obtain the best return on such investment, the cogeneration plant is required to run for as many hours as possible in order to recover as much process heat as possible. Hence, correct system sizing and choice of prime mover become critical in cogeneration technology application. In such traditional applications, the prime mover will generally be fuelled by natural gas or a petroleum-derived fuel such as diesel or aviation kerosene. Such fuels do not give any additional environmental advantage to the technology, by way of carbon savings. However, when the prime mover is fuelled by biomass, biomass-derived fuel or biomass wastes, then potentially greater advantages emerge, particularly for applications in developing countries such as Nigeria where biomass is a ready natural resource. CHP works with all fuels, including renewables; sewage and landfill gas; sawdust, wood shavings and woodchips, straw, sugarcane barbojo and other biomass; domestic, commercial, municipal and industrial wastes, etc. It works with new technologies such as fuel cells, micro-turbines, etc. There are several other modern and more efficient cycles than the simple gas turbine cycle motive power where this is the choice of the CHP motive power source. Among these are the Biomass Integrated Gasification/Gas Turbine (BIG/GT) system; the

Renewable Energy Master Plan (REMP) • Final Report • November 2005 Energy Commission of Nigeria (ECN) • United Nations Development Programme (UNDP)
97
Biomass Integrated Gasification/Steam Injected Gas Turbine (BIG/STIG); the Biomass Integrated Gasification/Intercooled Steam Injected Gas Turbine (BIG/ISTIG) 2.3.5 Other Biomass Technologies 2.3.5.1 Energy Crops. One of the most interesting recent developments in biomass energy is the cultivation of crops and trees for the sole purpose of generating energy either by direct combustion in biomass boilers or for the intermediate production of bio-fuels. Short rotation coppices (SRC) are now common in many parts of the world, particularly in Europe and the Americas, where fast growing species of crops and trees such as eucalyptus, oilseeds such as sunflower, soybean and rapeseed (bio-diesel production from fatty acid methyl esters, FAME), and corn and wheat (for ethanol or ethyl tertiary butyl ether, ETBE) are cultivated solely for energy purposes. Brazil pioneered the energy crops (sugarcane) for bio-fuel production field with its ethanol vehicle engine fuel programme of about two decades ago. Ethanol can be used to increase the octane rating of gasoline in blends with gasoline, and Brazil has now developed a 100% ethanol engine for its vehicles. Cellulosic materials, including grasses, trees, etc. can be converted to alcohol as well as directly into gases such as hydrogen, which can be used directly in some engines or for synthesis gas and liquids such as dimethyl ether (DME) and even synthetic gasoline and diesel. Nigeria can also pioneer cassava, sorghum, etc. as energy crops. The Philippines dendrothermal programme is conceived to generate 200 MW from power plants fuelled with wood from cultivated fast growing trees in a 7000-hectare tree farm by the year 2000. Many countries in the EU have similar energy crops programmes. 2.3.5.2 Energy from agricultural/industrial organic waste. Another interesting development is the on-site generation of energy (as heat and/or electricity) by agricultural and industrial enterprises using process organic wastes such as bagasse and babojo by sugarcane industries, wood shavings, saw dust, and wood chips by sawmills and wood processing plants, groundnut shells, palm kernels shells, etc. by oil mills. These enterprises are often able to generate energy in excess of their demands and the excess is usually available for sale to the utility or other nearby establishments. The groundnut oil industry in the Gambia is able to generate all the 4.5 MW electricity it requires for its screw presses with boilers fuelled by groundnut shells. Other on-site energy generation plants from process wastes are: the sugarcane industry in Mauritius which generates all its electrical and heat energy needs from boilers fuelled with bagasse; the rice industry in Malaysia in which rice husk from the rice mills is used to generate the electricity required in the milling and the drying plant at a unit cost of about US $0.03 per kWh. Methanol represents a unique fuel combining the portability of liquid petroleum, the clean, even burning characteristics of natural gas. It is generally believed that methanol has higher potential than ethanol as fuel for transport. In Japan, studies on the utilization of methanol in engines have shown that a mixture of 95% methanol and 5% diesel oil can be used as fuel for diesel engines. In Canada, Studies on large-scale production of methanol from biomass have shown that by 2025 up to 42% of transport fuel could be provided by such mean.

Renewable Energy Master Plan (REMP) • Final Report • November 2005 Energy Commission of Nigeria (ECN) • United Nations Development Programme (UNDP)
98
At present, the work on methanol production from wood has passed the demonstration stage. The leaders in this field are: EEC, Sweden, Canada, the U.S. and Brazil. The development work in Sweden has shown that the production cost of methanol from wood is only about 20% higher than that produced from natural gas. Methanol is a fairly volatile liquid which, for direct combustion, can compete with gasoline, low sulfur fuel oil, solvent refined coal, etc. Methanol will also compete with fuels from other local sources. Its potential as automobile fuel has long been recognized. In Canada, studies on large-scale production of methanol from biomass have shown that by 2025 up to 42% of transport fuel could be provided by such means. At present, the work on methanol production from wood in Canada has reached the demonstration stage with the typical plant capacities of 10,000-50,000 kgtons of wood per day. The leaders in this field are Brazil, Sweden, Canada and the U.S. With regards to the economic of methanol production, the development work in Sweden has shown that the production cost of methanol from wood is only about 20% higher than that produced from natural gas. 2.3.6 Biomass Thermal Energy Conversion The three routes for biomass thermal energy conversion are direct combustion, pyrolysis and gasification. 2.3.6.1 Direct combustion for the generation of heat and power is the most well established technology. There are three types of combustor: fixed bed combustor, fluidized bed combustor and suspension furnace combustor. These combustors, which are commercially available, have been used for the production of heat, steam and electricity. Practically, all types of crop residues can be burned using these combustors to obtain heat energy. For small scale power generation, interest in steam engine has been renewed because it can be operated on almost all types of biomass and has long working life. Steam engines have been installed for field trials in several countries in South America and their feasibilities are being examined. 2.3.6.2 Pyrolysis is an extremely flexible process that can be applied efficiently to almost any organic solid. Pyrolysis is the scientific term for the transformation of organic material into other forms by heating it in the absence of oxygen. The main pyrolysis reaction is the thermal decomposition of ligno-cellulosic material to produce char, oil and gas. Pyrolysis is an extremely flexible process, which can be applied efficiently to almost any organic solid. The quality and quantity of oil, gas and char produced depend on the type of reactor and feedstock properties, reaction conditions and other factors. Energy conversion of up to 80% is impossible. However, in spite of all the research and development activity on pyrolysis, there are relatively few commercial processes designed to produce significant amounts of oil and gas from biomass. 2.3.6.3 Oxygen gasification in Gasifiers to produce medium but gas or synthesis gas is the first and most important step in the production of methanol, which is very promising as transport fuel. Although the production of synthesis gas from wood is a very old

Renewable Energy Master Plan (REMP) • Final Report • November 2005 Energy Commission of Nigeria (ECN) • United Nations Development Programme (UNDP)
99
technology, more research and development is still needed, because it is very difficult to produce a clean synthesis gas efficiently and economically. At present work on methanol production from biomass has reached demonstration stage with typical plant capacities of 10-50 tons per day. The technology of gasifying crop residues for power generation is still in research and development stage, particularly for small-scale power generation. At present, more gasifiers are being used in process heating compared to power generation. One alternative in the efforts to utilize available biomass resources, including waste, more effectively is the transformation of these residues into marketable fuel forms. These fuel forms are synthetic gasoline or other liquid petroleum products, synthetic natural gas, and synthetic liquid fuels such as methanol. The choice of the processed form among these alternatives depends on market, overall costs, including the cost of emission control, and the ease with which this fuel form fits into the existing network of supply and distribution.
The gasification of biomass with oxygen to form a gas which is known as synthesis gas is the first and the most important step in the effort to produce methanol from biomass. Methanol represents a unique fuel combining the portability of liquid petroleum, the clean, even burning characteristics of natural gas. It is generally believed that methanol has higher potential than ethanol as fuel for transport. In Japan, studies on the utilization of methanol in engines have shown that a mixture of 95% methanol and 5% diesel oil can be used as fuel for diesel engines. In Canada, Studies on large-scale production of methanol from biomass have shown that by 2025 up to 42% of transport fuel could be provided by such mean. At present, the work on methanol production from wood has reached the demonstration stage with the typical plant capacities of 10-50 tonnes of wood per day. The leaders in this field are: EEC, Sweden, Canada, the U.S. and Brazil. The development work in Sweden has shown that the production cost of methanol from wood is only about 20% higher than that produced from natural gas. Methanol is a fairly volatile liquid which, for direct combustion, can compete with gasoline, low sulfur fuel oil, solvent refined coal, etc. Methanol will also compete with fuels from other local sources. Its potential as automobile fuel has long been recognized.
2.4 Wind Power This section considers the wind energy resources, technology assessment, and market situation of wind technology. 2.4.1 Resource Situation Nigeria is subject to the seasonal rain-bearing south-westerlies, which blow strongly from April to October and to the dry and dusty north-east trade winds which blow strongly from November to March every year. Most areas sometimes experience some periods of doldrums in between these periods. Wind energy reserves are measured in terms of wind speeds at 10m above the ground level.

Renewable Energy Master Plan (REMP) • Final Report • November 2005 Energy Commission of Nigeria (ECN) • United Nations Development Programme (UNDP)
100
In Nigeria, wind energy reserves at 10m height shows that some sites have wind regime between 1.0 to 5.1 m/s. The wind regimes in Nigeria are classified into following four regimes > 4.0 m/s; 3.1 – 4.0 m/s; 2.1 – 3.0 m/s; and 1.0 – 2.0 m/s. Hence, Nigeria falls into the poor/moderate wind regime. It is also observed that the wind speeds in the country are generally weak in the South except for the coastal regions and offshore, which are windy. In the coastal areas and in the large areas offshore from Lagos State through Ondo, Delta, Rivers and Bayelsa States to Akwa Ibom State, potentials exist for harvesting strong wind energy throughout the year. Except for maritime activities and fishing, there is hardly any obstacle to wind farm development for near-shore wind energy farms. Inland, the wind is strongest in the hilly regions of the North. The mountainous terrains, especially in the middle belt and the northern fringes of the country, where prime wind conditions may exist are to a large extent sparsely populated, and extensive areas for wind energy development exist in these locations. 2.4.1.1 Estimated Resource Base Due to the varying topography and roughness of the country, large differences may exist within the same locality. Hence within a few kilometres, the wind speed may vary. The values range from a low 1.4 to 3.0m/s in the Southern areas and 4.0 to 5.12m/s in the extreme North. Peak wind speeds generally occur between April and August for most sites. Initial study has shown that total actual exploitable wind energy reserve at 10m height, may vary from 8 MWh/yr in Yola to 51 MWh/yr in the mountain areas of Jos Plateau and it is as high as 97 MWh/yr in Sokoto. 2.4.1.1a Status of database, including adequacy and gaps In this section, the status of the data that are available at the international, national, and site specific levels together with the gaps in available data are discussed. 2.4.1.1b Types of Data Wind resource is usually expressed in wind speed (m/s) from which energy units can be obtained. There are usually two levels of data needed for national wind energy development. At the top level is the Meso-scale (National level) data. This type of data is useful for policy and it is usually the first call for developers of wind energy projects. The other is the site specific local level where one obtains more detailed data based on measurements. 2.4.1.1c Wind Farm Energy Data When a particular site appears promising for wind farm development, detailed site-specific measurements are carried out through the erection of a meteorology mast, about 30 to 50m in height depending on the terrain, for measuring wind speed and wind direction at different heights. Typical hub heights for wind turbines are now 60m and it is projected to reach about 100m by year 2030 Actual measurements are needed because the power output of a wind farm is sensitive to wind speed, being proportional to the cube of the wind speed. Thus, doubling of the average wind speed leads to an increase of the power in the wind by a factor of eight. Therefore wind speed can determine the viability or otherwise of a wind farm project.

Renewable Energy Master Plan (REMP) • Final Report • November 2005 Energy Commission of Nigeria (ECN) • United Nations Development Programme (UNDP)
101
Detailed and reliable information about variation in wind speeds and direction over the year is therefore vital for any prospective wind power development. Apart from the wind speed, the wind speed frequency distribution, commonly described by a Weibull distribution is also important 2.4.1.1d Available National Level Data The Nigerian Meteorological Agency (NMA), which is the national authority, carries out routine measurements and collection of wind data for the country. The records are for the 42 Synoptic stations mainly based at the airports and urban centres. These records available in its archives (published and unpublished) give the 3-hourly records of wind, the wind speed, the prevailing wind directions, the annual mean of the percentage wind frequencies in different directions and for various speed ranges and the number of days for which the wind force is greater than No. 4 on the Beaufort scale. The International Institute for Tropical Agriculture (IITA), Ibadan, also has wind data for about four of its stations. IITA only collects wind speed at a height of 2m. Some of the wind instruments at IITA are the Casela and Met014A cup anemometers. The wind instruments installed in each of the stations of the NMA differ. About 75% of the stations use cup generator anemometers while the remaining stations use the dine pressure tube anemometers. About 90% of the stations have ordinary wind vanes installed alongside the anemometers. The anemometers are installed at different heights due to the presence of tall buildings or trees, but most are installed at 6ft (about 2m) height. Hence, their data need to be harmonized for uniformity for it to be useful for the power sector. Most of the equipment used by the Nigerian Meteorological Agency and IITA are calibrated to WMO standard. There is a WMO Centre for Sub-Saharan Africa in Nigeria. The data collected at the observing stations are sent to the Data-Returns office at Oshodi, Lagos, which serves as the Data Bank for all meteorological data supervised and collected by the NMA. The data are archived both in their original manuscript form and/or in computer storage devices. The NMA computer centre is equipped with Database Management subsystems for climate computing developed by NMA. Computerization started around 1974 and has about 40 years of computerized wind data. 2.4.1.1e Wind Atlas Wind maps/atlases are contour values of wind speed at a specified height for a given geographical area. They represent a first port of call for any wind energy developer, providing an indication of a best estimate of wind resources across a large area. They provide information on areas that merit further investigation when planning a wind farm. Ideally, wind atlas should be generated through on-site measurement using anemometer. For a large area like a country this is quite expensive and time consuming and impractical. Hence, wind atlases are generally generated by computer models which have been calibrated with wind speed data at local meteorological stations. The models employ parameters such as topography, elevation and ground surface cover.

Renewable Energy Master Plan (REMP) • Final Report • November 2005 Energy Commission of Nigeria (ECN) • United Nations Development Programme (UNDP)
102
The World Meteorological Organization (WMO) in 1981 developed a worldwide wind resource map, showing the mean wind speed and mean wind power density of different regions for guidance. This wind resource map described in the Technical Note 175 by WMO is based on the analysis of wind measurements taken by meteorological institutes. Scanty information exists on Nigeria in this document. In order to produce a wind atlas for Nigeria, there is need for data from more than 350 stations - onshore or coastline (China has more than 900 meteorological stations). 2.4.1.1f Available Site Specific Level Data A major feasibility study on windmill was undertaken in Nigeria by the UNDP in 1984. This study on the potential for windmill application to various activities concluded that good potential exists in the semi-arid and temperate areas of the North, the middle belt and the shores of Lake Chad for such activities as small scale irrigation, domestic water pumping, livestock water supply and electric power generation. This was a desktop study. In 2003, the Federal Ministry of Science and Technology engaged a firm of consultants – Lahmeyer International (LI) – for its wind energy mapping programme. This work only covers ten (10) selected sites across the country where detailed site study are to be carried out using about one year (12-month period) continuous data from wind measuring equipment.. Lahmeyer International is also to collect historical wind data, erect wind measurement masts and install wind measurement equipment on the masts for data collection, and produce the zero level wind maps that indicate potential sites. The long-term wind energy potentials of these sites can then be quantified. 2.4.1.1g Gaps in Available Data There are no national or local “wind atlases” that have been produced for Nigeria. Only a few wind maps for limited sites are available. Hence there is the need to develop wind maps and atlases for the country that will provide information about the quantity, distribution, quality and utilization possibilities to determine the commercial feasibility of wind energy generation and decision making on investments. 2.4.1.2 Technical Assessment of Wind Power Technologies In this section, an overview of the technology used to harness wind for energy use, the technical characteristics, economic competitiveness and benefits and limitations of the technology are presented. 2.4.1.2a Overview of Wind Power Technologies A large amount of power is contained in the movement of air in form of wind. Harnessing of wind as a source of energy has a long history starting from the time the Persians built the first known windmills as early as 250 B.C. Much later, wind energy was widely used as a source of power before the industrial revolution. However, the interest in wind technology nose-dived from the industrial revolution period when it was displaced by the more reliable and cheap fossil fuel. In the 1970s there was a renewed interest in wind energy technology because of the increases in oil prices which affected

Renewable Energy Master Plan (REMP) • Final Report • November 2005 Energy Commission of Nigeria (ECN) • United Nations Development Programme (UNDP)
103
the economies of the industrialized countries. In the last two decades, these interests, reinforced by the need for cleaner energy technologies, have resulted in enormous progress on the development of wind turbine for electricity generation. (ia) Categorization and Applications of Wind Technology Applications of wind turbines may be categorized as indicated in Table 2.4.1 below, which also shows the unit size of wind turbines that are typically applied in the different categories. Following a decision on extending the electricity production capacity by one or more wind farms, one has to decide where to place the wind farms (siting), the size of the wind farms (sizing) and the optimum layout of the wind farms. The size of a wind farm is often determined with respect to a number of constraints, such as: planning legislation; local and national development plans and policies; land availability, access and transport infrastructure; power system – present and future situation; wind turbine size; financing; electricity market; and environmental impacts. Table 2.4.1 Categorization of Wind Power Systems
Installed Power Categorization Wind Turbine Capacity RangeSize
<1kW Micro systems <1kW 1-100kW Wind home systems and
hybrid systems 1-50kW
100kW-10MW Isolated power systems and decentralized generation
100kW-1MW
>10MW Wind Power Plants – wind farms on-land
>500kW
>100MW Wind Power Plants – wind farms offshore
>2000kW
Economic and financial optimum choice of wind farm size for society and investors at given conditions may vary for different sites, hence, sizing and siting are integrated activities. Further, sizing involves aspects that may not easily be quantified monetarily. Wind farm site selection most often entails a comparison of selected candidate sites with respect to issues such as: the possibility to obtain planning authorization and approvals; successful outcome of local hearings; potential wind energy production; environmental costs and benefits; sustainability, uncertainties and risks; availability of land and infrastructure; investments and investors; design safety, reliability and lifetime; wind farm and power system operation and maintenance, economic and financial viability. (iib) Trend in Technology Although there has always been a wide variety of designs on the margins of commercial technology, in the early days the Danish, three-bladed, single fixed speed, stall regulated turbine dominated the market at rated power levels of generally less than 200kW. Blades were almost invariably manufactured from glass-polyester resin. In 2003 the focus of attention was on technology around and above 1.5MW rating, and commercial turbines now exist with rotor diameters in excess of 100m. Designs with variable pitch and variable speed predominate while direct drive generators are becoming

Renewable Energy Master Plan (REMP) • Final Report • November 2005 Energy Commission of Nigeria (ECN) • United Nations Development Programme (UNDP)
104
more prevalent. Epoxy-based resin systems predominate in blade manufacture and carbon fibre reinforcement is increasingly used in big blades. Variable speed may offer a little more energy capture but this is largely offset by the added cost. The design changes have largely been driven by market demands – better acoustic noise reduction and output power quality, reduced gearbox problems etc. Since the initial commercialization of wind energy in the early 1980s, there have, of course, been huge cost reductions and this is a direct consequence of the dramatic growth in the market. Thus, modern wind turbines are more sophisticated and adaptable than their predecessors on account of technology development and are also much cheaper (discounting inflationary factors) on account of market expansion. 2.4.1.2b4.2 Status of Wind Energy Technology Worldwide The status of wind energy technology in some countries in the world that are in the forefront in the use of wind energy resources and the state of the technology in the country are discussed in what follows. (ia) Global Wind Energy Utilization World wind energy capacity has been doubling every three years during the last decade and growth rates in the last few years have been even faster. It is doubtful whether any other energy technology is growing, or has grown at such a rate. The attraction of wind as a source of electricity which produces minimal quantities of greenhouse gases has led to ambitious targets for wind energy in many parts of the world. More recently, there have been several developments of offshore wind installations and many more are planned. Although offshore wind generated electricity is generally more expensive than onshore, the resource is very large and there are few environmental impacts. While wind energy is well developed in the industrialized world, it has attractions in the developing world as it can be installed quickly in areas where electricity is urgently needed. At the end of 2003 there were more than 68,000 wind turbines installed world wide corresponding to about 40,300 MW accumulated capacity distributed as follows: Americas 6,905MW (USA 6,361 MW) Europe 29,301 MW (Germany, Denmark and Spain 24, 108 MW) Asia 3,790 MW (India 2,125 MW) Africa 211 MW Rest of the World 95 MW Thus more than 80% of the total global capacity was implemented in only five (5) countries: Germany, Spain, USA, Denmark and India. The largest manufacturing capacity is in Denmark, Germany and Spain. The technological development in wind energy has been extraordinary since 1980, increasing the size of the largest commercially available wind turbines from 50kW to about 4.5MW (with prototypes up to 6 MW or larger planned). (iib) Nigeria Wind Energy Utilization

Renewable Energy Master Plan (REMP) • Final Report • November 2005 Energy Commission of Nigeria (ECN) • United Nations Development Programme (UNDP)
105
Wind energy utilization in Nigeria is practically minimalrelatively insignificant. The Tractor & Equipment (T & E) Division of UAC started manufacturing the UNAPOWER wind pumps in Nigeria. Test units were installed in Goronyo, Sokoto State and the UAC Agro Farms in Kedanda, Kaduna State. The project was initially successful and attracted the attention of Katsina State Government who ordered 62 units in 1989. The high cost of each unit (over US$6,000 in 1990) coupled with difficulties encountered in maintenance limited their widespread use. The hundreds of wind pumps scattered all over the country are ill maintained and some have been abandoned. Some state governments, like Jigawa and Kano, are making efforts to install new wind pumps. There are two pilot wind electricity projects in existence. The 5 kWp Sayya Gidan Gada wind electricity project at Sokoto, and a 0.75 kWp wind electricity project in the center of the townnear Danjawa village is being run on an experimental basis to prove the viability of wind farm in the area. The Report of the Technical Committee on Quantification of Energy Resources states that as far back as the 1960s, more than 100 wind pumps had been installed in Kano, Jigawa, Sokoto, Yobe, Katsina, Lagos (Badagry) and Plateau (Jos) States to supply water for both human consumption and livestock (European Commission, 2001). 2.4.1.2c Technical Characteristics of Wind Turbine The main components of a wind electric generator are the tower, nacelle, rotor, gearbox, generator, braking system, yaw system, controllers and sensors. The life of a wind electric generator is taken as 20 years. When considering the installation of a wind farm, the single most important parameter is the wind speed. As the power output is proportional to the wind speed raised to the third power, a doubling of the average wind speed leads to an increase of the power in the wind by a factor of eight (8), so even small changes in wind speed can produce large changes in the power production. (ia) The Typical Wind Turbine Wind turbines transform kinetic energy in the wind to electricity. Almost all commercial wind turbines are ‘horizontal axis’ machines with rotors using 2 or 3 airfoil blades, although a few “vertical axis” machines and “Savonius rotor” wind turbines exist. The rotor blades are fixed to a hub attached to a main shaft, which turns a generator normally with transmission through a gearbox. Shaft, generator, gearbox, bearings, mechanical brakes and the associated equipment are located inside the nacelle on top of the tower. The nacelle also supports and transfers structural loads to the tower, together with which it houses all automatic controls and electric power equipment. The wind turbine automatically yaws the nacelle to the direction facing the wind for optimal energy production. The turbines are stopped at very high wind speeds (typically 25 m/s) to protect them from damage. Rotors may operate at constant or variable speed depending on the design. Modern MW-size machines are all variable speed concepts. Typical rotor speeds at rated power range from 15 revolutions per minute and up – a factor, which influences the visual impact. The larger the rotor the lower the rotational speed in order to keep the blade tip speed in the optimal range – 60-80 m/s. Power output is

Renewable Energy Master Plan (REMP) • Final Report • November 2005 Energy Commission of Nigeria (ECN) • United Nations Development Programme (UNDP)
106
automatically regulated as wind speed changes to limit loads and to optimize power production. The present “state of the art” large wind turbines have power control by active stall or pitch control (in both cases pitching blades) combined with some degree of variable speed rotor, and a two-speed asynchronous generator or a gearless transmission to a multiple synchronous generator and power electronics. Wind turbines range in capacity (or size) from a few kilowatts to several megawatts. The crucial parameter is the rotor diameter – the longer the blades, the larger the area swept by the rotor and thus the volume of air hitting the rotor plane. At the same time, the higher towers of large wind turbines bring rotors higher above the ground where the energy density in the wind is higher. Larger wind turbines have proved to be more cost-effectiveicient due to improvements in design and economies of scale, as well as with a higher energy production per swept m2, due to the higher towers and better aerodynamic design. Regulation of the output power is obtained through stall and pitch control. (iib) Wind Speeds Initially, most wind turbines operated at fixed speed when producing power. In a start-up sequence the rotor may be parked (held stopped) and on release of the brakes would be accelerated by the wind until the required fixed speed was reached. Subsequently, variable speed operation was introduced. This allowed the rotor speed and wind speed to match so the rotor could maintain the best flow geometry for maximum efficiency. An important difference between this kind of variable speed operation and conventional fixed speed operation is that moderate speed variations are still permitted. (iiic) Rotor Size The square of the diameter of a wind turbine rotor size determines how much energy it can produce. In recent years the trend is for bigger diameters corresponding to higher power rating of wind turbine. For example there is a remarkable increase from 65m to 69m to almost 74m in average diameter of a 1.5MW turbine for the years 1997, 2000 and 2003 respectively. Figures 3.4 and 3.5 (Annex III) show Both the rotor diameter and the tower heights of the growth in size present-dayof commercial wind turbine designs have grown remarkably – rotor diameter and tower height respectivelyover the past decade. 2.4.1.3 Economic Competitiveness There are many factors affecting the cost of wind generation. These include investment/capital cost, operation and maintenance (O & M) cost, government policy, management capacity and skill, size and capacity factor of the turbine, and site of the project. The major components of the cost of a wind energy project are investment, energy generation and operation and maintenance costs. (ia) Investment Cost The capital cost of a wind energy project is dominated by the cost of wind turbine. This alone takes about 75% of the total cost of a wind energy project. However, over the last

Renewable Energy Master Plan (REMP) • Final Report • November 2005 Energy Commission of Nigeria (ECN) • United Nations Development Programme (UNDP)
107
12 years, there has been a reduction in cost by approximately 30%. The cost of a wind energy project is dependent on the size of the turbine. The smaller sizes are more expensive than the larger sizes on a per kW installed capacity basis. Also, capacity factor drives up the relative capital cost. For instance, if there are two wind turbines of the same size but with different capacity factors say 30% and 60%, the relative capital cost of the one with the lower capacity factor will be higher than the one with the higher capacity factor. Table 2.4.2 gives an overview of investment cost for small and large wind turbine sizes for some countries and regions of the world. (iib) Energy Cost Cost of energy generated is dependent on both turbine size and project site. Generation cost per unit energy is higher for small turbines than for large turbines. At good sites where the wind speed is higher and less intermittent, the cost of energy generation is lower than for bad sites. Table 2.4.2 gives the figures for some regions of the world. countries. (iiic) Operation and Maintenance (O&M) Cost Wind energy projects generally have very low O & M cost. For instance, O & M cost for the first two years in Germany is about 2-3% of total investment cost. It is decreasing for newer and larger wind turbines. Table 2.4.2 Cost Comparison of Wind Energy Project Cost Components Country Investment Cost
$/kW Generating Cost $/kWh
Operation & Maintenance Cost $/kWh
China 1,000 0.067 - 10.054-0.066 Europe 1,188-1,518 20.079-0.106 0.0158-0.0198
USA 3,500 0.5-0.6 - Note: For Europe, investment cost lower figure is for large turbine while the higher figure is for small turbine. The investment cost for USA is for small turbine. 1 cost range for good sites, 2 cost range for bad sites Sources: Liu & Zhang, 2002; Brennand, 2001; EWEA, 2002; Wind Force 12, 2004 (ivd) Cost Comparison of Wind Energy Technology and Other Energy Technologies Fig. 2.4.1 gives a cost comparison of both investment and generating costs between wind energy technology and other energy technologies in China. This table reveals that these costs for the wind energy technology are becoming competitive even with long standing conventional energy technologies. However, it should be noted that for the Nigeria case, all the costs of wind energy technology will be higher than for the countries discussed in today’s market.

Renewable Energy Master Plan (REMP) • Final Report • November 2005 Energy Commission of Nigeria (ECN) • United Nations Development Programme (UNDP)
108
Fig. 2.4.1 Cost Comparison between Wind Energy and other Energy Technologies in China. Source: Brennand, 2002. Table 2.4.3 Cost Comparison between Wind Energy and Other Energy Technologies in China Energy Technology
Investment Cost $/Kw
Delivered Cost $/kWh
Coal 600 0.04 Hydro 900 0.05 Wind 1,300 0.075
Source: Brennand, 2002 2.4.1.4 Benefits and Limitations Wind energy is one of the lowest-priced renewable energy technologies available today, costing between 4-6 cents per kilowatt-hour depending upon the wind resource and project financing of the particular project. The construction time of wind energy technology is less than other energy technologies, it uses cost-free fuel, the operation and maintenance (O & M) cost is very low, and capacity addition can be in modular form, making it adaptable to increasing demand. It enhances diversification of energy carriers for the production of heat, fuel and electricity and also helps in saving fossil fuels for other applications and the future generations. Wind energy is fueled by the wind thereby making it a clean fuel source, non-polluting, and making no demands upon the environment beyond the comparatively modest use of land area. In addition, wind turbines do not produce greenhouse gases which cause acid rain and climate change. Wind power must compete with conventional electricity generation sources on a cost basis. Depending on how energetic a wind site is, the wind farm may or may not be cost competitive. Even though the cost of wind power has decreased dramatically in the past 10 years, the technology requires a higher initial investment cost than fossil-fueled generators. A major challenge to using wind for electricity generation is that wind is intermittent and not be available when electricity is needed. Furthermore, wind energy cannot be stored unless batteries are used, and not all winds can be harnessed to meet the timing of electricity demands. Wind resource development may compete with other uses for the land and those alternative uses may be more highly valued than electricity generation. Although wind power plants have relatively little impact on the environment compared to other conventional power plants, there is some concern over the noise produced by the rotor blades, aesthetic (visual) impacts and sometimes, birds have been

Renewable Energy Master Plan (REMP) • Final Report • November 2005 Energy Commission of Nigeria (ECN) • United Nations Development Programme (UNDP)
109
killed by flying into the rotors. However, most of these problems have been resolved or greatly reduced through technological development or by properly siting wind plants. 2.4.3 Market Situation of Wind Power Technologies The main driver for wind power has been the need to reduce greenhouse gases emission especially carbon dioxide. More recently however, other concerns such as energy supply security have also become an important socioeconomic issue in Europe and USA. The main energy strategy of these countries is to diversify the energy supply base away from imported fossil fuels so as to minimize the impact of any disruptions. Energy supply gaps in India have also been a major market driving force for wind energy in that country. 2.4.3.1 Present demand and supply situation (ia) Worldwide Wind Energy Capacity Wind power capacity has expanded around the world over the past 5 years at a very high rate of about 30%. By 2003, the cumulative installed wind energy electricity was 40,300 MW. Five countries, Germany, USA, Spain, Denmark and India are the main players. They represent over 75% of world capacity. In terms of capacity addition Germany, USA, and Spain accounts for over 50% of the increase in year 2003. See Table 2. 4.4. Table 2.4.2 Worldwide Total Installed and New Capacity of Wind Power in 2003
Countries New Capacity in 2003 MW
Total Capacity end of 2003 (MW)
Germany 2,674 14,612 Spain 1,377 6,420 United States of America
1,687 6,361
Denmark 218 3,076 India 423 2,125 Netherlands 233 938 Italy 116 922 Japan 275 761 United Kingdom 195 759 China -- 571 Others 861 3,756 World Total 8,344 40,301
(iib) Potential Market for Wind Energy in Nigeria There is no established supplier of wind turbines in Nigeria in recent times. About 20 years ago, UAC imported some wind turbines that were sold to states in the North. Given the above, there is no established significant market for wind energy in Nigeria. However there are potential markets described below which can be developed if wind energy is to play any significant role in the nation’s energy supply mix. (iiic) Stand Alone Water Pumping for Agriculture Agricultural activities need supply of water. A wind electric pumping system is ideally suited for irrigation and other water pumping activities required in farm settlements that

Renewable Energy Master Plan (REMP) • Final Report • November 2005 Energy Commission of Nigeria (ECN) • United Nations Development Programme (UNDP)
110
are not connected to the national grid. A wind turbines rating of below 10KW is adequate for water pumping for the small agriculture settlements. This application is especially suitable for the Northern parts of the country. (ivd) Non-grid Hybrid System for Rural Electrification In many rural areas in Nigeria where there is no access to the national grid orand the grid is remote, wind energy could provides a cost effective option for rural electrification. Since the wind energy is intermittent, they can be augmented with either a PV system or diesel generator set. Access to electricity in the rural area of Nigeria has been put to about 20%; hence this hybrid system could be hugely patronized in the country. Depending on the size of village, a wind turbine size of 100KW to 750 KW can be installed. (ve) Wind Farms The cost of large scale wind farm has been steadily declining throughout the last decade. Hence given a favourable wind regime, wind power can be competitive with conventional sources of power production. While 1 to 2.5 MW turbines are increasingly common, 3 to 5 MW turbines are being developed, and may become common in the future. Wind farms in excess of 200 MW range are now common in Europe, USA and India. Wind farms may be grid-connected or may form the backbone of a mini grid for remote areas far away from the main grid. 2.4.3.25.2 Barriers to Wind Power Technology Market Development There are several economic, policies, technical and market barriers that will militate against the rapid adoption of wind power in Nigeria. These barriers must be addressed if the potentials identified earlier and the targets set for the electricity from wind power are to be realized. The barriers are identified below. (i) Economic Barriers The capital cost of wind turbine energy is still currently above the cost of fossil fuel based base-load electric plant. One factor contributing to this is the lower capacity factor of wind power plants i.e. around 24% compared to over 70% for fossil fuel base-load plants. The lower capacity factor means that to produce a given amount of electricity, it is necessary to install 2-2.5 times more capacity than with fossil fuel plant. This tends to make wind energy more expensive in the initial phase of the life cycle, constituting a barrier to investment and economic decisions on wind energy development. This barrier is likely to be removed in the future because the capital cost of wind power is expected to decrease in the future. A 2002 EWEA major study predicts that the capital cost of wind power will likely decrease by 30% over the next 15 years. If the cost of environmental damage by fossil fuel electricity is accounted for, it is likely that the capital cost of wind power will become more competitive than it is now. (ii) Low Electricity Tariff

Renewable Energy Master Plan (REMP) • Final Report • November 2005 Energy Commission of Nigeria (ECN) • United Nations Development Programme (UNDP)
111
The average electricity tariff in Nigeria is about N6:75 per kWh (approximately 5 cents per kWh). It is estimated that the generating cost of electricity from wind power in Nigeria is between 8-10 cents per kW-h where that of China is about 6.7 cents per kWh. Table 2.4.5Fig. 2.4.2 presents electricity tariff in Nigeria which is below the prevailing cost of electricity from wind power, thus discouraging potential wind power investors.
Table 2.4.5 Electricity Tariffs in Nigeria Category Amount (N/kW-hr) Residential with single phase meter
4
Residential with 3-phase meter 6.5 Commercial houses with single-phase meter
8
Commercial with 3-phase meter 8.5 Average 6.75
Exchange rate used: $1 = N135:00; Source: NEPA
Nigeria's Electricity Tariffs, N/kWh. Source : NEPA.
4
6.5
8
6.75
Residential, 1-phasemeterResidential, 3-phasemeterCommercial, 1-phasemeterCommercial, 3-phasemeter
Fig. 2.4.2 Nigeria’s electricity tariffs. Source: NEPA (iii) Policy and Institutional Framework Although the national energy policy recognizes the potentials for wind power, there are no specific policies or incentives for promoting wind energy. Key policy on power purchase agreement that will ensure that wind power developers will be able to sell electricity to the national grid is not yet in place. The 2005 Electricity Sector Power Reform Act reforms is yet to become effective structurally. The coordination between Energy Commission, Ministry of Science and Technology, Ministry of Power and Steel and other Agencies responsible for rural development is weak as it relates to implementing an integrated strategy for renewable energy in general and wind power in particular. None of the two Energy Centres with responsibility for renewable energy research and development has an appreciable wind Research and Development (R & D) programme due to inadequate funding. There is therefore lack of capacity and experience in the country on wind power development. (iv) Lack of Manufacturing Capability The lack of such capability in Nigeria as at now will therefore slow down the rapid introduction of wind power into the electricity supply mix. In addition to the lack of

Renewable Energy Master Plan (REMP) • Final Report • November 2005 Energy Commission of Nigeria (ECN) • United Nations Development Programme (UNDP)
112
manufacturing capability, lack of technical capacity for maintenance of wind turbines is a major barrier to the development of wind power. (v) Lack of Data on Wind Resource Availability and Technology Reliable site specific data on wind resources are needed by investors to make investment decisions on wind power. Presently, such data are not readily available in the country. There are only about ten sites where detailed data are currently being collected. This is a big barrier to the development of wind farms. In addition, there is dearth of information and data on wind technology, i.e. performance, efficiency, etc, creating impressions that wind energy is yet to be mature. (vi) Lack of Awareness about Potentials of Renewable Energy Wide understanding of decision makers both in the public and private sector especially in the financial sector is rather low. This lack of information and awareness creates a market distortion which results in higher risk perception for potential wind projects. The general perception is that wind power is not yet a mature technology, hence it is only suited for niche market and even then it will require heavy subsidy to make it viable. (vii) Integration with National Grid The electricity produced from wind power is intermittent and variable depending on the weather. This poses some technical challenges of reliability when integrating wind power into the national transmission grid. Another barrier is related to the siting of wind turbines which has to be located in areas with good wind resources. More often than not the areas with best wind resources are often far away from load centres (usually urban settlements) where the electricity is needed and served by the national grid. Hence there may be a need for expensive grid extension or the creation of mini grids to transmit and distribute electricity produced from wind energy.
2.5 Hydrogen, Marine, Ocean and Geothermal Energy Hydrogen, marine, ocean and geothermal energy are important in the long-term vision of providing secure, abundant, cost effective and clean sources of energy for Nigeria. Their impacts might not be felt in the next decades to come, but these emerging energy sources will be key to meeting future challenges when the country is weaned of its dependence on hydrocarbons.The National Energy Policy (NEP) seeks to maintain an interest on technological developments on hydrogen, ocean and geothermal energy. The objective is to build research and development capacity to enable Nigeria incorporate these resources into the national energy mix when their costs become competitive. 2.5.1 Hydrogen Energy Resource Situation Hydrogen provides a solution to the energy needs of Nigerians at a future point when our finite fossil fuels will no longer be available. However, the complete transition to a hydrogen economy will take several decades. There is presently a lack of know-how to deliver clean, affordable, safe and convenient energy for transportation, electricity or stationary uses from hydrogen. To ensure the security of energy supplies in a post-fossil

Renewable Energy Master Plan (REMP) • Final Report • November 2005 Energy Commission of Nigeria (ECN) • United Nations Development Programme (UNDP)
113
economy, the process of Nigeria’s transition to a hydrogen economy must be planned and should start immediately. A clear national vision and road map for hydrogen research and development will help ensure the energy security of future Nigerians. 2.5.1.1 Estimated Hydrogen Energy Resource Base Hydrogen can be produced from water using various forms of energy. It can also be extracted from anything that contains hydrocarbons, including gasoline, natural gas, biomass, landfill gas, methanol, etc. The resources base is therefore limitless. 2.5.1.1a Status of Hydrogen Energy Database Information on hydrogen conversion is available worldwide, especially through the Internet. The United States Department of Energy National Renewable Energy Laboratory (NREL) is a world leader in promoting hydrogen energy research. There is no consistent body of research and development activities on hydrogen energy in Nigeria. 2.5.1.2 Technical Assessment of Hydrogen Energy Technologies Hydrogen energy technologies are maturing and are increasingly meeting energy needs particularly in industrialised countries. The US hydrogen industry alone produces about 9 million tonnes of hydrogen annually for use in chemicals production, petroleum refining, metal treatment and electrical applications. As an energy carrier, this quantity of hydrogen can power about 20-30 million cars or an equivalent of 5-6 million homes. 2.5.1.2a Overview of Hydrogen Energy Technologies The emerging hydrogen energy technology has the following segments shown in Fig. 2.5.1 : production, delivery/, storage, conversion and end-use technologies.
PRODUCTION
DELIVERY
STORAGE
CONVERSION APPLICATION
Figure 2.5.1: The Hydrogen Energy System Hydrogen production from fossil fuels, biomass or water involves thermal, electrolytic or photolytic processes. The distribution of hydrogen from production and storage sites

Renewable Energy Master Plan (REMP) • Final Report • November 2005 Energy Commission of Nigeria (ECN) • United Nations Development Programme (UNDP)
114
involves pipelines, trucks, barges and fuelling stations. Storing hydrogen for delivery and conversion requires tanks for both gases and liquids at ambient and high pressures. Electricity or and/or thermal energy can be produced using combustion turbines, reciprocating engines and fuel cells. End-use energy applications entail the use of hydrogen for portable power in such applications such as mobile phones and computers; or transportation applications such as fuel cell vehicles, fuel additives, internal combustion engines, and in propulsion systems in space shuttles. Other application systems include the use of hydrogen in stationary energy generation systems, including combined heat and power applications. 2.5.1.2c Technical Characteristics of Hydrogen Energy Technologies The various segments of the hydrogen technology are under development. Efficiency levels are continuously improved and vary between technologies. For instance, fuel cell technologies are increasingly maturing – offering clean, compact and modular energy generation devices that have potentials to revolutionize the production of electricity and thermal energy. Its flexibility, grid independence operation and on-site energy production could be ideal for rural areas with improved economic competitiveness of the technology. 2.5.1.3 Economic Competitiveness of Hydrogen Energy Technologies Current fuel cell cogeneration power plant in the US costs about US$3000/kW. This has to be reduced considerably for the technology to compete with alternatives. To exacerbate the effect of the high costs of hydrogen energy, the prices of competing fossil fuels are relatively low. In Nigeria, the availability of low-cost fossil fuels is a major disincentive to innovative technologies making an impact in the energy market. 2.5.1.4 Benefits and Limitations of Hydrogen Energy Technologies A primary benefit of hydrogen energy to Nigeria is its potential for being the energy of last resort in the future. The resource is abundant and inexhaustible. When developed, it will contribute to the nation’s energy security in a post-fossil economy. It is also clean and will assist in addressing local and global environmental challenges such as global warming. Fuel cell, for instance, has the potential for meeting remote power needs. However, high prices and low level of R&D activities in Nigeria will constitute a formidable barrier to expanded use of hydrogen energy in the country. 2.5.1.5 Market Situation of Hydrogen Energy Technologies The hydrogen economy is beginning to emerge in many industrialised economies. However in Nigeria the market is yet to develop. Current reforms in the overall energy market in Nigeria will help shape the possibilities of meeting the future challenges of an economy driven by hydrogen energy. 2.5.1.6 Key drivers for Hydrogen Energy Technology Market Some drivers supporting the development of hydrogen energy in Nigeria will include growth in energy demand resulting from increasing economic and population growth; accelerated depletion of fossil fuels and increased energy insecurity; commercial
Renewable Energy Master Plan (REMP) • Final Report • November 2005 Energy Commission of Nigeria (ECN) • United Nations Development Programme (UNDP)
115
availability of hydrogen energy technologies; and environmental considerations, especially climate change. Other drivers that can inhibit hydrogen energy development are: public perception of the safety of hydrogen energy; low cost of fossil alternatives; and poor research and development capacity. 2.5.2 Marine Ocean Energy The idea of producing useful energy from the world’s oceans has existed over several centuries. However, it was not until the oil shock of the early 1970s that serious investments in R&D by several, mostly European countries intensified. As a result of the commitment of these countries to improving ocean energy systems, many of the technologies are closer to commercial viability than ever before. With Nigeria’s geographical location, power from the ocean ought to be part of the long-term vision for a secure, cost effective and clean energy future. 2.5.2.1 MarineOcean Energy Resource Situation Oceans and seas cover more than two-thirds of the earth’s surface. They are therefore the world’s largest solar collectors. Oceans can produce thermal energy from the sun's heat, and mechanical energy from tides and waves. While the gravitational pull of the moon drives the tides, the wind powers the ocean waves. 2.5.2.2 Estimated MarineOcean Energy Resource Base Nigeria has an Atlantic Ocean coastline stretching over a distance of about 800 km – from Badagry to Bakassi. Tides in the coastal areas have a height range of 100 – 300 cm and an incursion length of 30 – 40 km on the average. Globally, good tidal energy sites have an average height of about 5 meters. The best tidal and wave energy sites are concentrated off the western coast of Europe and spots in Asia. According to the World Energy Council, the world has an estimated 2 TW wave energy potential and an annual potential contribution of about 2000TWh to the electricity market. As Fig. 2.5.2 indicates, the West African coast has a poor wave energy regime of 10kW/m. Good wave energy sites in Africa include the coast of South Africa with 40-50kW/m; while the coast of the United Kingdom presents some of the world’s best potentials of about 70kW/m.

Renewable Energy Master Plan (REMP) • Final Report • November 2005 Energy Commission of Nigeria (ECN) • United Nations Development Programme (UNDP)
116
Figure 2.5.2: Global wave power distribution in kW/m of crest length Source: World Energy Council. www.worldenergy.org/wec-geis/publications/reports/ser/wave 2.5.2.3. Status of Ocean Energy Database, including adequacy and gaps Nigeria has a good number of institutions with the capacity to carry out research and development activities on ocean energy. These institutions include the Nigerian Institute for Oceanographic and Marine Research in Lagos and other Departments of Oceanography at the universities. However, there is currently no known systematic body of research and development activity in existence in Nigeria. 2.5.3 Technical Assessment of Ocean Energy Technologies There is a sustained interest in tidal and wave energy across Europe, the US and Asia. The following is a brief overview of the status on tidal and wave technologies. 2.5.3.1 Overview of Tidal Energy Technologies For tidal differences to be harnessed into electricity, the difference between high and low tides must be at least five meters. Evidence shows that there are perhaps only about 40 such sites on the planet with tidal ranges of this magnitude. The following are the common tidal energy technologies: (i) Tidal barrage requires a dam, or barrage, across a bay or estuary. Gates and turbines are installed along the dam. When the tide produces a sufficient difference in the level of the water on opposite sides of the dam, the gates are opened, water flows through the turbines, and the turbines turn on electric generator to produce electricity. (ii) Tidal fence. These are fences that look like giant turnstiles. They can reach across channels between islands or across straits between the mainland and island. The turnstiles spin via tidal currents typical of coastal waters and can generate as much energy as winds of much higher velocity.

Renewable Energy Master Plan (REMP) • Final Report • November 2005 Energy Commission of Nigeria (ECN) • United Nations Development Programme (UNDP)
117
(iii) Tidal turbine. Tidal turbines normally look like wind turbines. They are arrayed underwater in rows, as in some wind farms. The turbines function best where coastal current run at between 3.6 and 4.9 knots (approx. 6.5 and 9 km/h). In currents of that speed, a 15meter diameter tidal turbine can generate as much energy as a 60-meter diameter wind turbine. Ideal locations for tidal turbine farms are close to shore in water depths of 20 – 30 meters. 2.5.3.2 Technical characteristics The technical life of a tidal scheme could be about 120 years or upward for the civil structure. The electrical generating plant may have a technical life of about 40 years. Since the tidal resource is site specific, the plant availability will necessarily vary. Technical efficiency of the plants will also vary from the technology used. 2.5.3.3 Economic competitiveness Tidal energy projects require high initial capital expenditure. They have very long construction periods and low load factors, leading to long payback periods. This leads to very high overall cost and major challenges in funding a commercial tidal project. 2.5.3.4 Benefits and Limitations of Tidal Energy Technologies Tidal energy is clean and renewable. However, Nigeria does not seem to have a significant tidal energy resource. Where the resource base is adequate, tidal energy technologies have not fully matured and the cost of construction are very high. Engaging in tidal research and development will keep Nigeria abreast of the international scientific and technological development in this area – both for future energy needs and in the development of science and technology. 2.5.3.5 Overview of Ocean Wave Energy Technologies Wave energy can be converted into electricity through both offshore and onshore systems. Offshore systems are situated in deep water, typically more than 40 meters. Sophisticated bobbing mechanisms use the motion of the waves to power a pump that creates electricity. Some other offshore devices use hoses connected to floats that ride waves. The rise and fall of the float stretches and relaxes the hose, which pressurizes the water, which in turn, rotates a turbine. A third offshore possibility is through specially built seagoing vessels. These floating platforms create electricity by funneling waves through internal turbines. Onshore wave systems are usually built along shorelines to extract the energy in breaking waves. There are three known varieties of these onshore technologies: the oscillating water column, the Tapchan, and the pendular device. Of the three technologies, only the oscillating model has had some significant success in utilization. 2.5.3.6 Ocean Thermal Energy Conversions (OTEC) uses the heat energy stored in the oceans to generate electricity. OTEC works best when the temperature difference between the warmer, top layer of the ocean and the colder, deep ocean water is about 20oC. These conditions exist in tropical coastal areas, roughly between the Tropic of Capricorn and the Tropic of Cancer. OTEC uses the temperature difference between the warm upper and the cooler lower layers of ocean water to generate electricity. There are

Renewable Energy Master Plan (REMP) • Final Report • November 2005 Energy Commission of Nigeria (ECN) • United Nations Development Programme (UNDP)
118
three known types of the OTEC technologies: closed-cycle, open-cycle and the hybrid types. Closed-cycle types use fluid with low-boiling point organic fluids in the turbine cycle together with a heat exchanger; open-cycle OTEC uses the top and lower layer waters directly in an open-cycle configuration. OTEC uses the tropical oceans’ warm surface water to make electricityT; while the hybrid systems combine the features of both. Some theoretical possibility of harnessing ocean energy off Nigeria’s coast exists. However, several technological and market constraints would need to be overcome. 2.5.3.7 Technical characteristics of ocean wave energy Producing power from waves is technologically challenging. Some of the difficulties include irregularity in wave amplitude, phase and direction. It is therefore difficult to determine the maximum efficiency over time. Secondly, the structural loading in periods of extreme weather conditions such as hurricanes may be as high as 100 times the average loading. Thirdly, the coupling of the irregular slow motion of a wave to electrical generators requires typically more than 500 times greater frequency. Balancing the requirements of having a reliable device on the one hand and an economically viable system on the other hand makes wave power design very complex and challenging. 2.5.3.8 Economic competitiveness Worldwide, wave energy technologies are still at various stages of commercialization. Nigeria’s low wave energy regime along the Atlantic coast does not permit the efficient deployment of today’s wave energy technologies. 2.5.3.9 Benefits and limitations Wave energy is clean and renewable. The development of this resource worldwide will help secure an energy future that is less polluting. However, the wave resource situation precludes a significant investment in Nigeria in the foreseeable future. 2.5.3.10 Market situation of ocean energy technologies The economics of wave energy technologies presents a key challenge. Even though the operating costs of these technologies are low, they are very expensive to build. With long payback periods, these projects are both difficult to finance and the cost per kilowatt-hour of power produced is presently not competitive. 2.5.3.11 Key drivers for the ocean energy technology market The development of ocean energy worldwide will likely be driven by cost reduction, responses to climate change, the compatibility of electricity demand variability and wave patterns as well as the development of niche markets in offshore oil and gas production. Ecological impacts on marine life and aesthetic effects are factors that may also count in considering tidal power. 2.5.4 Geothermal Energy

Renewable Energy Master Plan (REMP) • Final Report • November 2005 Energy Commission of Nigeria (ECN) • United Nations Development Programme (UNDP)
119
Geothermal energy comes from heat that originates from the Earth. It has two sources: initial heat produced from the formation of the Earth and heat produced from radioactive decay of various isotopes. 2.5.4.1 Geothermal Energy Resource Situation In 2004 over 9,000 megawatts of electricity were produced from some 250 geothermal power plants in 22 countries around the world. These plants provide reliable base-load power for well over 60 million people, mostly in developing countries. African countries with geothermal energy potential are those that are traversed by the East African Rift Valley. These countries include Djibouti, Eritrea, Ethiopia, Kenya, Tanzania and Uganda. Two known geothermal resources exist in Nigeria, and they are: the Ikogosi Warm Springs in Ondo State and the Wikki Warm Springs in Bauchi. 2.5.4.2 Estimated Geothermal Energy Resource Base The resource potentials for geothermal energy entrapped in the Earth crust are almost limitless. Beyond the two known geothermal resource areas in Nigeria, high geothermal gradient trends have been identified in the Lagos sub-basin, the Okitipupa ridge, the Auchi-Agbede within the Benin flank/hinge line as well as the Abakaliki anticlinorium. 2.5.4.3 Status of Geothermal Energy Database, including Adequacy and Gaps There is no consistently developed and maintained database on geothermal energy in Nigeria. This is without prejudice to possible research within departments of geology and petroleum geology in the universities. 2.5.4.4 Technical Assessment of Geothermal Energy Technologies The following reviews the status of geothermal technology, its key characteristics and competitiveness. 2.5.4.5 Overview of Geothermal Energy Technologies A geothermal system consists of three main elements: a heat source, a reservoir and a fluid – the last being the carrier for transferring heat from the source to the power plant. Three power plant technologies are being used to convert geothermal fluids to electricity:
Dry steam plants directly use geothermal steam to drive turbines; Flash steam plants, pull deep, high-pressure hot water into lower-pressure tanks
and use the resulting flashed steam to drive turbines; and Binary-cycle plants that pass moderately hot geothermal water by a secondary
fluid with a much lower boiling point than water. This causes the secondary fluid to flash to vapor, which then drives the turbines.
Direct thermal applications of geothermal energy include: hot spring bathing, agriculture, aquaculture, industrial hot water uses, heating of individual and residential districts. Heat pumps have also become widely used in temperate regions.
2.5.4.6 Technical Characteristics of Geothermal Energy Technologies

Renewable Energy Master Plan (REMP) • Final Report • November 2005 Energy Commission of Nigeria (ECN) • United Nations Development Programme (UNDP)
120
Geothermal power plants tend to be in the 20 MW to 60 MW range and the capacity of a single geothermal well usually ranges from 4 MW to 10 MW. Typical minimum spacing of 200m to 300m is established to avoid interference. Geothermal power plants have an average availability of about 90% compared to 75% for coal. The The Olkaria I Geothermal Power Station in Kenya has been in operation in over 20 years and has consistently maintained an availability factor of about 98%. 2.5.4.7 Economic Competitiveness of Geothermal Energy Technologies The economics of geothermal energy is highly variable depending on applications and site-specific conditions. The costs of steam or hot water for direct applications will depend on geothermal steam/hot water temperature and the distance from the well to the point of use. The cost of geothermal power production vary from US¢/kWh 5 -7 for plants less than 5 MW and US¢/kWh 2.5 – 5 for large plants of more than 30 MW for high quality reservoirs. Direct capital costs also vary significantly. Large plants in high quality sites can be as low as US$750/kW and as high as US$2300/kW for small plants. 2.5.4.8 Benefits and Limitations of Geothermal Energy Technologies Where the resource exists, geothermal energy is a secure energy source. It is available 24 hours a day all the year round. Geothermal plants have high availability factors. Geothermal energy is also environmentally benign and releases minimal emissions. While the running costs of geothermal plants are low, initial costs of well drilling, pipeline construction, resource analysis of drilling information, design of plant and power plant construction is high. Steam or hot fluid cannot be transported efficiently over long distances. Therefore, the choice of the location of power plants is restricted to where reservoirs exist. 2.5.4.9 Market Situation of Geothermal Energy Technologies Geothermal energy is nonexistent in the Nigerian energy market. This situation can change in the event of major discoveries of commercial geothermal reservoirs as well as major changes in the market for other energy sources. 2.5.4.10 Key drivers for Geothermal Energy Technology Market Geothermal reservoirs of commercial proportions have not been discoveredyet to be fully investigated in Nigeria. A market for geothermal energy may emerge only when the existence of a significant resource based can be established.

Renewable Energy Master Plan (REMP) • Final Report • November 2005 Energy Commission of Nigeria (ECN) • United Nations Development Programme (UNDP)
121
CChhaapptteerr 33:: TTaarrggeettss
3.1 Introduction Targets are critical tools in achieving the visions of the REMP. Cumulative targets are established for the following periods: Short-term : Year 2005 to 2007. From the base year in 2005, short-term targets are set to reach initial milestones in the establishment of a framework for delivering on the vision of the REMP. The outcomes of the short-term targets will coincide with broader milestones established by the NEEDS on the expiration of the term of the present Federal Government in 2007. Medium-term:Year 2008 to 2015. Medium-term targets coincide with the Millennium Development Goals target year 2015. This will enable the REMP to measure the contribution of renewable energy to the MDGs and the medium term projections of Nigeria’s overall energy sector projections. Long-term: Year 2016 to 2025. Long-term targets provide a twenty-year framework to measure progress on reaching the vision of the REMP. It provides Nigeria with tools to address renewable energy and development issues a decade after the MDGs, and will measure progress on renewable energy development as a proportion of projected national energy sector growth. In measuring the above, the REMP disaggregates electricity targets from non-electricity targets, and provides an assessment of the implications of the targets. Projects are bases on the High Growth Scenario developed by the ECN. This scenario largely corresponds with NEEDS targets and present developments, particularly in the electricity sector.
3.2 Renewable Electricity Targets The REMP renewable energy targets outline the expected contribution of renewable energy sources to electricity production in the country. The estimates are based on cumulative capacities expressed in MW. Electricity Demand Projections for Nigeria The ECN has carried out an energy demand scenario analysis projecting electricity demand for three scenarios: reference, low growth and high growth up till year 2030 as shown in Table 3.2.1. Table 3.2.1 Estimates of Annual Peak Electricity Demand (MW)
Scenario 2000 2005 2010 2015 2020 2025 2030 High Growth
4558 6661 9629 13915 20060 28924 41755
Reference 4558 6077 8097 10732 14199 18820 24979 Low Growth 4558 5973 7735 10008 12297 15701 19599

Renewable Energy Master Plan (REMP) • Final Report • November 2005 Energy Commission of Nigeria (ECN) • United Nations Development Programme (UNDP)
122
The targets for electricity generation from the five renewable energy sub-sectors in the short, medium and long terms are shown in Table 3.2.2 together with the ECN total electricity demand projections under the High Growth Scenario. Table 3.2.2: Targets For Electricity Generation(MW) Sources 2007 2015 2025 Wind 1 20 40 Solar PV 5 120 500 Solar thermal - 1 5 Small hydro 50 600 2000
Biomass - 100
800 Total 56 841 3345 ECN High Growth Scenario Projections 7000 14000 29000 Percentage share of projected energy demand 0.8 6 11.53
The Federal Ministry of Power and Steel (FMPS) projects that RE (excluding large hydro plants) should contribute about 10% of the national electricity production in the long-term. The electricity generation targets from RE sources in Table 3.2.2 however fall short of the 10% share of FMPS projections for the short and medium term. It is realistic to expect that the policy and financial mechanisms that would be set up to promote RE will not have been strong enough to achieve the 10% target by 2015. By 2007 and 2015, the contribution of the RE targets to the national electricity supply mix will therefore be only 0.8% and 6% respectively. The 10% target will be achieved by the year 2025. 3.2.1. Short Term Targets – Year 2007 The 56 MW RE target for year 2007 as shown in Table 3.2.3 consists of the following: Table 3.2.3 Short Term Target(2007) Sources Target Demand
(MW) Detailed Description of the Target
Wind 1 Wind farm demonstration project Solar PV 5 Solar PV electricity projects,
composed of grid-connected and mini-grid systems as well as grid-connectible SHS and stand-alone SHS.
Small Hydro 50 There is already an existing small hydro capacity of over 30MW. New planned capacities include, Oyan, Obudu, Evboro, etc.

Renewable Energy Master Plan (REMP) • Final Report • November 2005 Energy Commission of Nigeria (ECN) • United Nations Development Programme (UNDP)
123
3.2.2. Medium Term Targets(2015) The 746 MW RE target for year 2015 as shown in Table 3.2.4 consists of the following: Table 3.2.4 Medium Term Target Sources Target Demand Detailed Description of Target
Wind 20 More and larger wind farm demonstration and commenced projects.
Solar PV 120 Larger PV electricity projects, composed of grid-connected and mini-grid systems as well as grid-connectible SHS and stand-alone SHS
Solar thermal
1 Programme with a 1 MW demonstration plant using one of the three proved STP technologies
Small hydro 600 Commercial development of small hydro sites in all parts of the country
Biomass 100 Biomass cogeneration/biogas/biofuels electricity generation projects of a total of 100 MW all over the nation.

Renewable Energy Master Plan (REMP) • Final Report • November 2005 Energy Commission of Nigeria (ECN) • United Nations Development Programme (UNDP)
124
3.2.3. Long Term Targets( 2025) The 2945 MW RE target for year 2025 as shown in Table 3.2.5 consists of the following: Table 3.2.5. Long Term Target Sources Target
Demand Detailed Description of Target
Wind 40 Commercially-driven and much larger wind farm projects.
Solar PV 500 Larger PV electricity projects, composed of grid-connected and mini-grid systems as well as grid-connectible SHS and stand-alone SHS
Solar thermal
5 National solar thermal electricity programme using one of the three proved STP technologies
Small hydro 2000 Commercial development of small hydro sites in all parts of the country
Biomass 800 Biomass/biogas/biofuels electricity generation projects of a total of 5 MW spread all over the nation.
3.3 Renewable Non-Electricity Targets The targets for non-electrical energy production from solar thermal, biomass and biogas are shown in Table 3.3.1. The projections for total RE production in 2007, 2015 and 2025 are 361.46, 746.24 and 1096.04 TWh respectively. This constitutes 41%, 16% and 9% respectively of the ECN Final Energy Demand Projection (less the electricity component)

Renewable Energy Master Plan (REMP) • Final Report • November 2005 Energy Commission of Nigeria (ECN) • United Nations Development Programme (UNDP)
125
Table 3.3.1: Targets For Non-Electrical Energy Production
Thermal energy analysis2007.0 2015.0 2025.0
All energy forms (GWh) 193789.0 202128.0 248869.0Fuelwood & charcoal, (GWh) 144,544 121,352 95,869Fuelwood & charcoal [Biomass energy]++, (% of total) 74.6 60.0 38.5Solar thermal share of total thermal energy, (%) 10.0 20.0 40.0Ren. Energy share of total thermal energy, (%) 84.6 80.0 78.5Other non-Ren. energy share of total thermal energy, (%) 15.4 20.0 21.5Ren. Energy share of total thermal energy, (GWh) 163922.9 161777.6 195416.6Solar thermal share of total thermal energy, (GWh) 19378.9 40425.6 99547.6
Note: Biomass energy has 0, 4.3 and 6 GWh in theshort, medium and long terms respectively
Distribution of Solar Thermal Share Share, (%) Share, (GWh)2007.0 2015.0 2025.0 2007.0 2015.0 2025.0
All Solar Thermal 100.0 100.0 100.0 19378.9 40425.6 99547.6Solar Water & Air Heating 75.0 70.0 60.0 14534.2 28297.9 59728.6Solar Drying & Brooding 18.0 15.0 18.0 3488.2 6063.8 17918.6Solar Desalination, solar stills, etc. 0.0 1.0 2.0 0.0 404.3 1991.0Solar Cooking 1.0 2.0 2.0 193.8 808.5 1991.0Solar refrigeration & A/C & passive architecture 2.0 4.0 5.0 387.6 1617.0 4977.4Solar pasteurization, sterilization 4.0 3.0 3.0 775.2 1212.8 2986.4Solar Thermal Electricity 0.0 5.0 10.0 0.0 2021.3 9954.8
The increasing share of solar thermal applications over the three periods will essentially be accounted for by solar water/air heating, solar drying, solar cooking, chick brooding, solar desalination, solar pasteurization, sterilization, passive architecture, solar thermal electricity, etc. However, the remarkable decline in the contribution of non-electricity sub-sectors over the plan period will largely be as a result of the anticipated reduction in the role of fuel wood in the national energy landscape.
3.4 Implications of the Targets The implications of the targets are that several units of various systems are required as indicated in Table 3.4.1.

Renewable Energy Master Plan (REMP) • Final Report • November 2005 Energy Commission of Nigeria (ECN) • United Nations Development Programme (UNDP)
126
Table 3.4.1: Implications of The Targets 2007 2015 2025RENEWABLE ENERGY SUB-SECTOR WIND STAND-ALONE MILLING/WATER PUMPING FOR AGRICULTURE 0 8 16 NON-GRID HYBRID FOR RURAL ELECTRIFICATION(1MW) 1 10 20 GRID-CONNECTED WIND FARMS(5MW) 0 1 2 SMALL HYDRO 4 120 200 BIOMASS IMPROVED BIOMASS STOVES 1,000,000 2,000,000 3,000,000 BIOGAS DIGESTERS --- 6000 8000 BIOMASS PLANTS --- 40 80 BRIQUETTING PLANTS 30 80 200 SOLAR PV SHS 40,000 400,000 4,000,000 WATER PUMPING 2,500 37,500 250,000 COMMUNITY SERVICES 50 1500 10,000 STREET & TRAFFIC LIGHTING 10,000 100,000 500,000 LARGE-SCALE PV PLANTS ---- 30 50 SOLAR THERMAL SOLAR COLLECTORS 4000 57,100 146,600 SOLAR COOKERS 1,678 51,024 152796 SOLAR DRYERS, CHICK BROODERS, ETC (5KW CAPACITY) 130 1700 6000 SOLAR DESALINATION, STILLS, ETC(2KW CAPACITY) 0 300 1600 SOLAR REFRIGERATION & A/C(MW) 0.075 2 8.5 PASSIVE ARCHITECHTURE (NO. OF DEMO. PROJECTS) 10 100 1000 SOLAR PASTEURISATION, STERILISATION(0.5KW CAPACITY) 300 3500 10,000 SOLAR THERMAL ELECTRICITY(MW) 0 3 16.5 GEOTHERMAL, OCEAN, TIDAL 0 0 0
3.4.1. Solar Energy Solar PV The number and capacities of PV systems to be installed in the short (2007), medium (2015) and long (2025) term are shown in Tables 3.4.2, 3.4.3 and 3.4.4 respectively.

Renewable Energy Master Plan (REMP) • Final Report • November 2005 Energy Commission of Nigeria (ECN) • United Nations Development Programme (UNDP)
127
Table 3.4.2: Solar PV Installations for Short Term(2007) APPLICATION CAPACITY PER UNIT NUMBER
REQUIRED Solar Home Systems 50W 40,000
Water Pumping 400W 2500
Community Services 10kW 100
Street and Traffic Lighting 100W 10,000
Large Scale PV Plants --- ---
Table 3.4.3 : Solar PV Installations for Medium Term(2015) APPLICATION CAPACITY PER UNIT NUMBER
REQUIRED Solar Home Systems 50 400,000
Water Pumping 400W 37,500
Community Services 10kW 1500
Street and Traffic Lighting 100W 100,000
Large Scale PV Plants 500kW 30
Table 3.4.4 : Solar PV Installations for Long Term(2025) APPLICATION CAPACITY PER UNIT NUMBER
REQUIRED Solar Home Systems 50W 4,000,000
Water Pumping 400W 250,000
Community Services 10KW 10,000
Street and Traffic Lighting 100W 500,000
Large Scale PV Plants 1MW 50

Renewable Energy Master Plan (REMP) • Final Report • November 2005 Energy Commission of Nigeria (ECN) • United Nations Development Programme (UNDP)
128
(ii) Solar Thermal The number and capacities of solar thermal systems to be installed by 2007, 2015 and 2025 are shown in Tables 3.4.5, 3.4.6 and 3.4.7 respectively. Table 3.4.5: Solar Thermal Systems Installations for short Term(2007) APPLICATION CAPACITY PER
UNIT NUMBER REQUIRED
Solar Collectors 2 sq metres 1000
Solar Cookers 1220kj per cooker 1678
Solar dryers, chick brooders etc
5kW 130
Solar desalination, solar stills
2kW 0
Solar refrigeration & A/C. MW 0.075
Solar passive architecture -- 10
Solar pasteurization, sterilization
0.5kW 300
Solar thermal electricity MW 0
Table 3.4.6: Solar Thermal Systems Installations for short Term(2015) APPLICATION CAPACITY PER UNIT NUMBER
REQUIRED Solar Collectors 57,100 57,100 Solar Cookers 1220 kj per cooker 51,024 Solar dryers, chick brooders etc 5kW 1700 Solar desalination, solar stills 2kW 300 Solar refrigeration & A/C. MW 2 Solar passive architecture - 100 Solar pasteurization, sterilization
0.5KW 3500
Solar thermal electricity MW 0

Renewable Energy Master Plan (REMP) • Final Report • November 2005 Energy Commission of Nigeria (ECN) • United Nations Development Programme (UNDP)
129
Table 3.4.7: Solar Thermal Systems Installations for Long Term(2025) APPLICATION CAPACITY PER UNIT NUMBER
REQUIRED Solar Collectors 2 sq. meters 1,146,600 Solar Cookers 1220kJ per cooker 152,796 Solar dryers, chick brooders etc
5kW 6000
Solar desalination, solar stills 2kW 1600 Solar refrigeration & A/C. MW 8.5 Solar passive architecture -- 1000 Solar pasteurization, sterilization
0.5kW 10,000
Solar thermal electricity MW 0 3.5 : Biomass and Biogas Table 3.5.1 shows the number of biogas digesters, biogas plants, biomass briquettes proposed to be installed in the short, medium and long term. Table 3.5.1: Biomass and biogas systems installation in the short, medium and long term Source 2007 2015 2025 Number to be
Installed Number to be Installed
Number to be Installed
Biogas digesters 0 6000 8000 Biogas plants 0 40 80 Biomass briquettes 30 50 80 Biomass Stoves 300,000 500,000 1,000,000 3.6. Small Hydropower and wind Table 3.6.1 shows the number of small hydropower and wind systems proposed to be installed in the short, medium and long term. Table 3.6.1: Small Hydropower and wind systems installations in the short, medium aanndd lloonngg tteerrmm.. SSoouurrccee 22000077 22001155 22002255 SSmmaallll hhyyddrrooppoowweerr 2200 660000 22000000 WWiinndd 11 2211 4400

Renewable Energy Master Plan (REMP) • Final Report • November 2005 Energy Commission of Nigeria (ECN) • United Nations Development Programme (UNDP)
130
CChhaapptteerr 44:: PPllaannnneedd AAccttiivviittiieess aanndd MMiilleessttoonneess
4.1 Introduction To ensure that the REMP targets outlined in chapter 3 are achieved, concrete activities and milestones have been identified in the short, medium and long term. These activities and milestones are organised under specific sub-sectoral programmes. To address areas of overlap, a Framework Programme for Renewable Energy Promotion that harmonizes cross-cutting issues is planned. None of the proposed programmes are in themselves exhaustive and mutually exclusive. They are therefore dynamic and adaptable to changes within the overall policy, technology and market environments evolving over the two decades of the Master Plan. The Framework Programme will ensure that activities within the various sub-sectoral programmes are mutually supportive. The Master Plan establishes the following programmes:
Framework Programme on Renewable Energy Promotion National Biomass Energy Programme National Solar Energy Programme National Small Hydro Energy Programme National Wind Energy Programme Emerging Energy Research and Development Programme
All the cost estimates are in 2005 Naira.

4.2 Framework Programme for Renewable Energy Promotion Goals and Objectives 1. Policy, Legal and Regulatory Framework
(i) Approval of the Renewable Energy Master Plan (REMP)
(ii) Approval of the Rural Electrification Strategy
(iii) Establishment of Renewable Energy Portfolio Standards (REPS)
(iv) Development of Power Purchase Agreement with Electricity Distribution Companies
(v)Expansion of RE into non-energy sectors
(vi) Review of the Renewable Energy Master Plan
(vii) Enforcement of existing legislation on town planning
(viii) Incorporation of alternative energy sites in town planning arrangements
(ix) Encouragement of incorporation of RE in building development
2. Institutional Framework
(i) Establishment of Renewable Energy Professional & Industry Associations (ii) Establishment of National RE Development Agency (NREDA) - Long Term (iii)Technology Production and Testing Centres – Short Term
(iv) Establishment of more meteorological stations
3. Economics and Financing
(i) Suspension of Import Duties
(ii) Mobilisation of donor finance for projects
(iii) Extension of Micro Financing
4. Capacity Building
(i) Training and re-training activities across several renewable energy sectors (ii) Private sector participation (iii) Incorporation of RE studies into schools curricula
(iv) Encourage reliable data collection from satellite
5. Public Awareness
(i) Workshops, open days, talk-shops, seminars and conferences on the REMP
(ii) Creation of Website for the Framework Programme

Renewable Energy Master Plan (REMP) • Final Report • November 2005 Energy Commission of Nigeria (ECN) • United Nations Development Programme (UNDP)
132
(iii) Mass media coverage of pilot projects (iv) Establishment of RE Demonstration Centres in villages
6. Inter-Agency/Governmental Collaboration (i) Annual forums on Renewable Energy Development in Nigeria (ii) Encouraging technical co-operation among government agencies
7. Research and Development (i) Budgetary and donor funding RE R&D (ii) Establishment of RE R & D Fund
(iii) Commercialisation of R&D outputs
8. Monitoring and Evaluation
(i) Establishment of National Steering Committee on REMP (ii) Establishment of National RE R & D data bank by (i) above
(iii) Production of Annual Reports of RE in Nigeria by (i) above

Renewable Energy Master Plan (REMP) • Final Report • November 2005 Energy Commission of Nigeria (ECN) • United Nations Development Programme (UNDP)
133
Table 4.2.A FRAMEWORK PROGRAMME ON RENEWABLE ENERGY PROMOTION
Short Term (2006 - 2007) Medium Term (2008 - 2015) Long Term (2016 - 2025)
Activity Area Project Description of Activities Year
Est. Cost Nm
Activity Area Project Description of
Activities Year Est. Cost Nm
Activity Area Project
Description of
Activities Year
Est. Cost Nm
Participating Agencies
Policy, legal and regulatory framework
Preparation of Federal Executive Council Memo seeking approval for the REMP
Federal Executive Council Approval of the REMP
2006 Policy, legal and regulatory framework
Consultancy and workshop on Nigeria's RE Portfolio Standards
Establishment of Renewable Energy Portfolio Standards (REPS)
2008 10 Policy, legal and regulatory framework
Review of existing Portfolio Standards
Review of Portfolio Standards
2016 2 Federal, state agencies, private sector, academia and NGOs
Federal Executive Council Approval of the Rural Electrification Strategy
2006 Development of Power Purchase between RE producers and Electricity Distribution Companies
2008 - 2009
Review of the Renewable Energy Master Plan
2025 30 Federal, state agencies, private sector, academia and NGOs
Full implementation of the Power Sector Reform Act
2005 -2007
Mainstreaming RE in integrated rural development
Expanded integration of RE into non-energy sectors (Rural health, education, water supply and communication
2008 - 2025
50 Federal, state agencies, private sector, academia and NGOs
REMP review Review of the Renewable Energy Master Plan
2015 30 Federal, state agencies, private sector, academia and NGOs
Institutional framework
Establishment of renewable energy professional & industry associations
2006 - 2007
Institutional framework
Establishment of National Renewable Energy Agency (NREA)
2010
Establishment of Technology Testing Centres
2008
Sub-Total 90 32 122

Renewable Energy Master Plan (REMP) • Final Report • November 2005 Energy Commission of Nigeria (ECN) • United Nations Development Programme (UNDP)
134
Table 4.2.B FRAMEWORK ON RENEWABLE ENERGY PROMOTION (CONTD)
Short Term (2006 - 2007) Medium Term (2008 - 2015) Long Term (2016 - 2025)
Activity Area Project Description of
Activities Year Est. Cost Nm
Activity Area Project Description of Activities Year
Est. Cost Nm
Activity Area Project Description of
Activities Year Est. Cost Nm
Participating Agencies
Economics and Financing
Suspension of Import Duties
2007
Economics and Financing Institution-
building of REF
Establishment of Renewable Energy Fund 2010 50
Economics and Financing
Evaluation Consultancy for Import Duty Suspension
Evaluation of the Suspension of RE
import duties 2016 10
Federal, state agencies, private sector, academia and NGOs
Mobilisation of donor finance for
projects (see project concept notes annexed)
2006 - 2025
Development of framework for MFS
Introduction of Micro Finance Schemes for RE
2008 20 Review of Micro Finance Scheme
Expansion of Micro Finance Schemes for RE
2016 - 2025
10 Federal, state agencies, private sector, academia and NGOs
Introduction of capital subsidies through the Rural Electrification Fund
2006 Federal Institutions
Capacity Building
Training Facility for RE
Coordinating of training activities across several renewable energy sectors
2006 - 2025
100 Capacity Building
Training Facility for RE
Coordinating of training activities across several renewable energy sectors
2005 - 2025
100 Capacity Building
Market Entry capacity building for RE
Enhanced private sector led investments in RE systems
2008 - 2025
100 Federal, state agencies, private sector, academia and NGOs
Public Awareness
REMP National Workshop
Workshop on the REMP
2005 10 Public Awareness
Web and media
information project
Websites, print, electronic media and conferencing
2005 - 2025
100 Public Awareness
Web and media
information project
Websites, print, electronic media and conferencing
2005 - 2025
100 Federal, state agencies, private sector, academia and NGOs
Inter-Agency Collaboration
Workshop Convening annual forums on Renewable Energy Development in Nigeria
2007 - 2025
10 Inter-Agency Collaboration
Workshop
Convening annual forums on Renewable Energy Development in Nigeria
2007 - 2025
10 Inter-Agency Collaboration
Workshop Convening annual forums on Renewable Energy Development in Nigeria
2007 - 2025
10 Federal, state agencies, private sector, academia and NGOs
Research and Development
RE technology and market R&D
Increased budgetary and donor funding RE R&D
2006 - 2025
50 Research and Development
RE technology and market R&D
Collaborative research between industry and academia
2008 - 2025
50 Research and Development
RE technology and market R&D
Commercialisation of R&D outputs
2015 - 2025
50 Federal, state agencies, private sector, academia and NGOs
Monitoring and Evaluation
Establishment of National Steering Committee on the REMP and the production of Annual Reports on RE in Nigeria
2005 Monitoring and Evaluation
Monitoring and evaluation project
Annual Reports of RE in Nigeria
2006 - 2025
10 Monitoring and Evaluation
Monitoring and evaluation project
Annual Reports of RE in Nigeria
2006 - 2025
10 Federal Institutions
Sub-Total 170 340 290 800
Grand Total 170 430 322 922

Renewable Energy Master Plan (REMP) • Final Report • November 2005 Energy Commission of Nigeria (ECN) • United Nations Development Programme (UNDP)
135
4.3 National Biomass Energy Programme
Goals and Objectives (i) Know our Biomass Resources Potential
(ii) Achieve competence in and domesticate six biomass technologies:
- improved woodstoves
- biodigester/biogas - gasification of biomass
- liquifaction of biomass
- briquetting of fine particle biomass - fast growing trees
(iii) Data Acquisition Projects
- Conduct Survey of Biomass energy resources and categories by state, type/source, utilization pattern, thermal & electrical energy derivable there
From; energy conversion, technologies.
(iv) R & D Projects
- develop, through testing and literature survey, design parameters for a comprehensive list of feedstock.
- establish lab facilities for study of gasification of ligno-cellulosic materials.
- establish lab & research programmes on liquefaction of biomass & pilot energy farms
- acquire competence in biomass briquetting through design & production of briquetting machines by 2 No. principles.
- establish pilot fast growing energy crops/trees.
(v) Market Dev/Promotion Projects
(a) produce market ready models of improved woodstoves
(b) conduct pilot projects on dissemination/market testing of improved woodstove designs.
(c) conduct public awareness projects, through media on improved woodstoves
(d-f) a, b, c, for biodigester/biogas
(g) establish two plants on liquefaction of biomass
(h) establish 6 pilot plants on liquefaction of biomass
(i) establish 3 pilot plants on briquetting of biomass
(vi) Increasing Energy Access
- achieve the establishment/installation of specified numbers/capacities of equipment or systems for each biomass technology in order to

Renewable Energy Master Plan (REMP) • Final Report • November 2005 Energy Commission of Nigeria (ECN) • United Nations Development Programme (UNDP)
136
to meet given targets:
- short term targets
- medium term targets
- long term targets
(vii) Capacity Building
(a) Human Capacity
- Direct training workshops/short courses on improved woodstoves, biodigesters, biomass gasifyers, biomass liquification, biomass
briquetting and establishment of energy farms/fast growing tree farms.
- Train the trainers workshops on above technologies and on their dissemination.
- Advanced training overseas on the above technologies and on their dissemination.
- Development & implementation of curricula on the technologies for primary, secondary and tertiary levels (under renewable energy
curricula development).
(b) Manufacturing Capacity
- Publicize incentives developed for private sector investments in the manufacture of improved woodstoves, biodigesters, biomass
briquetting bioliquids production, gasification of biomass
- Over the plan period, establish x1, x2, x3 ………….. xn factories on above technologies through private, public or joint private/public
investments.
(c) Support Infrastructure
- Equip R & D Centers and 6 selected Universities for training in Biomass/biogas
- Establish technical standards for biomass/biogas products in collaboration with SON
- Establish testing and certification centers for biomass/biogas equipment.

Renewable Energy Master Plan (REMP) • Final Report • November 2005 Energy Commission of Nigeria (ECN) • United Nations Development Programme (UNDP)
137
Table 4.3.A NATIONAL BIOMASS ENERGY PROGRAMME Short Term (2006 - 2007) Medium Term (2008 - 2015) Long Term (2016 - 2025)
Activity Area Project Description of
Activities Year Est. Cost Nm
Activity Area Project Description of
Activities Year Est. Cost Nm
Activity Area Project Description of
Activities Year Est. Cost Nm
Participating Agencies
Data Acquisition
Survey of Biomass energy resources
Obtain comprehensive data on biomass energy resources by State, type, utilization, potential & uses
2006 -2007
200 Data Acquisition
Management of Biomass Database
Review and updating of available data on biomass resources
2008 -2015
100 Data Acquisition
Management of Biomass Database
Review and updating of available data on biomass resources
2016 - 2025
100 ECN, FMARD
Capacity Building
Training and retraining Workshops on improved woodstoves & biodigesters
Training and retraining of professionals, operators, craftsmen and rural persons on improved woodstoves & biodigesters
2006 – 2007
60 Capacity Building
Training and retraining Workshops on biomass technologies
Training and retraining of professionals, operators, craftsmen and rural persons on improved woodstoves & biodigesters
2008 -2015
100 Capacity Building
Training and retraining Workshops on Biomass Technologies
Training and retraining of professionals, operators and craftsmen on the design, operation and maintenance of various biomass technologies
2016 - 2015
80 ECN, NCERD, SERC, NAPEP, FMAARD, NGO's State Govts, Donors.
Capacity Building
Advanced Training on Biodigesters
Advanced training (Overseas and local) on technologies and dissemination of strategies for biodigesters
2006 -2007
120 Capacity Building
Advanced Training on Biomass Technologies
Short courses and postgraduate programs overseas on the various biomass technologies
2008 -2015
150 Capacity Building
Advanced Training on Biomass Technologies
Continuation of medium term activities
2016 -2025
150 ECN, NREA, NCERD, SERC, Tertiary Institutions, others.
Capacity Building
Development of Curricula on biomass energy technologies
Curricula development for primary, secondary and tertiary institutions on biomass technologies
2007 40 Capacity Building
Train the Trainers Workshops on Biomass Technologies
Training of teachers, lecturers, selected local govt. and rural development personnel on the various biomass technologies
2008 - 2015
40 Capacity Building
Train the Trainers Workshops on biomass technologies
Continuation of medium term activities
2016 -2025
40 ECN, NCERD, SERC, NREA, Educ. Institutions, States, LGAs, FMAARD, NUC,NBTE, NCCE, others.
Capacity Building
Implementation of Curricula on Biomass Technologies
Introduction of curricula on biomass energy technologies in educational institutions
2007 50 Capacity Building
Continuation of short term projects
Training of lecturers, students, selected local govt. and rural development personnel on the various biomass technologies
2008 - 2015
50 Capacity Building
Develop-ment of Curricula on biomass energy technologies
Continuation of medium term activities
2016 - 2025
50 Others.
Capacity Building
Establishment of biomass briquetting plants
3 Nos. of briquetting plants for fine particle biomass are to be established
2006 - 2007
90 Capacity Building
Continuation of short term projects
12 Nos briquetting plants for particle biomass to be established
2008 - 2010
220 Capacity Building
Continuation of Briquetting project from the medium term
36 Nos of briquetting plants for fine particle biomass are to be established
2016 -2025
600 ECN, Fed., State, Private Investors.
Sub-Total 560 660 1020 2240

Renewable Energy Master Plan (REMP) • Final Report • November 2005 Energy Commission of Nigeria (ECN) • United Nations Development Programme (UNDP)
138
Table 4.3.B NATIONAL BIOMASS ENERGY PROGRAMME (CONTD) Short Term (2006 - 2007) Medium Term (2008 - 2015) Long Term (2016 - 2025)
Activity Area Project Description of
Activities Year Est. Cost Nm
Activity Area Project Description of
Activities Year Est. Cost Nm
Activity Area Project Description of
Activities Year Est. Cost Nm
Participating Agencies
Capacity building
Establishment of fuelwood lots
Establish fast growing fuelwood farms
2007 120 Capacity Building
Continuation of short term projects
Expansion of fast growing fuelwood farms
2008 –
2015
360 Capacity building
Continuation of medium term projects
Expansion of fast growing fuelwood farms 2016 -
2025 360
Federal, state, private sector, cooperatives, communities, NGOs, LGAs.
Establishment of Improved woodstove workshops
3Nos. of small and medium scale manufacturers of improved woodstoves are to be established
2007 42 Capacity Building
Continuation of short term projects
12Nos. of small and medium scale manufacturers of improved woodstoves are to be established
2008 –
2015
126 Capacity Building
Continuation of medium term projects
36Nos of small and medium scale manufacturers of improved woodstoves are to be established (Continuation from previous term)
2016 –
2025
378 ECN, Artisans, Private Investors.
Capacity building
Manufacture of biodigesters
3Nos biodigester production plants are to be established (Continuation from previous term)
2006 – 2007
120 Capacity Building
Manufacture of biodigesters
6Nos biodigester production plants are to be established (Continuation from previous term)
2008 –
2015
240 Capacity Building
Continuation of medium term projects
36Nos biodigester production plants are to be established (Continuation from previous term)
2016 –
2025
1,300 NGOs, Private Investors, ECN, States,Fed., .
Capacity building
Establishment of bio-liquid fuel plants
1,000m3/day capacity bio-liquid fuel plants are to be established
2007 360 Capacity Building
Establishment of bio-liquid fuel plants
1,000m3/day capacity bio-liquid fuel plants are to be established
2008 - 2015
800 Capacity Building
Continuation of medium term projects
10,000m3/day capacity of bio-liquid fuel plants are to be established
2016 –
2025
3,800
Capacity building
Establishment of energy farms
Establishment fast growing energy farms
2007 80 Capacity Building
Establishment of energy farms
Expansion of fast growing energy farms for bio-liquid fuel production
2008 - 2015
160 Capacity Building
Continuation of medium term projects
Expansion of fast growing energy farms for bio-liquid fuel production
2016 –
2025
220 Private Investors
Market development and Promotion
Production of market ready models of improved woodstoves
Value engineering, market research and re-design of improved woodstoves to meet market expectations and quality standards
2006 – 2007
45 Market development and Promotion
Continuation of short term projects
Value engineering, market research and re-design of improved woodstoves to meet market expectations and quality standards
2008 - 2015
45 Market development and Promotion
Continuation of medium term projects
Value engineering, market research and re-design of improved woodstoves to meet market expectations and quality standards
2016 - 2025
60 Private Investors
Pilot projects on improved woodstoves
Conduct pilot projects for dissemination of improved woodstoves in rural areas
2006 – 2007
50 Continuation of short term projects
Continuation of short term activities
2008 –
2015
60 Continuation of medium term projects
Conduct pilot projects for dissemination of improved woodstoves in rural areas
2016 - 2025
20 ECN, Private Investors.
Sub-Total 817 1791 6138 8746

Renewable Energy Master Plan (REMP) • Final Report • November 2005 Energy Commission of Nigeria (ECN) • United Nations Development Programme (UNDP)
139
Table 4.3.C NATIONAL BIOMASS ENERGY PROGRAMME (CONTD) Short Term (2006 - 2007) Medium Term (2008 - 2015) Long Term (2016 - 2025)
Activity Area Project Description of
Activities Year Est. Cost Nm
Activity Area Project Description of
Activities Year Est. Cost Nm
Activity Area Project Description of
Activities Year Est. Cost Nm
Participating Agencies
Public awareness campaign on improved woodstoves
Promotion of improved woodstoves through the media & village meetings.
2006 – 2007
56 Public aware-ness campaign on improved wood-stoves
Continuation of short term activities
2008 –
2015
60 Continuation of medium term projects
Promotion of improved woodstoves through the media & village meetings.
2016 -
2025
60 ECN
Production of market ready models of biodigesters
Value engineering and re-design of biodigesters for greater marketability
2006 – 2007
60 Production of market ready models of biodigesters
Continuation of short term activities
2008 –
2015
30 Continuation of medium term projects
Value engineering and re-design of biodigesters for greater marketability
2016 - 2025
30 ECN
Market development and Promotion
Pilot projects on biodigesters
Establish pilot projects to demonstrate biodigesters
2006 – 2007
60
Market development & Promotion
Pilot projects on biodigesters
Continuation of short term activities
2008 –
2015
120
Market development and Promotion
Continuation of medium term projects
Establish pilot projects to demonstrate biodigesters
2016 -
2025
120 ECN
Sites Identification
Identify all potential project sites in the Country and available biomass resources in each area.
2005 – 2006
30 Sites Identification
Continuation of short term activities
2008 - 2015
90 Sites Identification
Continuation of medium term projects
Identify all potential project sites in the Country and available biomass resources in each area.
2016 -
2025
90 ECN
Technology Assessment and Reviews
Assess and review necessary levels of utilization of biomass energy resources in the country in order to promote the utilization of biomass resources. Developed countries should be approached to promote the transfer of energy technology and training to lift the nation to higher standards of living to benefit the entire nation.
2006 –2007
10 Technology Assessment and Reviews
Continuation of short term activities
2008 - 2015
10 Technology Assessment and Reviews
Continuation of medium term projects
Assess and review necessary levels of utilization of biomass energy resources in the country in order to promote the utilization of biomass resources. Developed countries should be approached to promote the transfer of energy technology and training to lift the nation to higher standards of living to benefit the entire nation.
2016 -
2025
15
Sub-Total 216 310 315 841

Renewable Energy Master Plan (REMP) • Final Report • November 2005 Energy Commission of Nigeria (ECN) • United Nations Development Programme (UNDP)
140
Table 4.3.D NATIONAL BIOMASS ENERGY PROGRAMME (CONTD) Short Term (2006 - 2007) Medium Term (2008 - 2015) Long Term (2016 - 2025)
Activity Area Project Description of
Activities Year Est. Cost Nm
Activity Area Project Description
of Activities Year Est. Cost Nm
Activity Area Project Description of
Activities Year Est. Cost Nm
Participating Agencies
Biogas Technology/ Diffusion Programme
6 Biogas demonstration project
To make biogas technology popular among Nigerians, there is the need for all three tiers of government to embark upon distribution of biogas plants to a greater extent in order to promote its utilization especially in the rural areas.
2006 –
2007
60 Biogas Technology/ Diffusion Project
12 Biogas demonstration project
Continuation of short term activities
2008-2015
120 Biogas Technology/Diffusion Project
18 Biogas demonstration project
Continuation of medium term activities
2016 -
2025
180 Federal agencies and academic institutions
Sub-Total 60 120 180 360

Renewable Energy Master Plan (REMP) • Final Report • November 2005 Energy Commission of Nigeria (ECN) • United Nations Development Programme (UNDP)
141
Table 4.3.E NATIONAL BIOMASS ENERGY PROGRAMME (CONTD) Short Term (2006 - 2007) Medium Term (2008 - 2015) Long Term (2016 - 2025)
Activity Area Project Description of
Activities Year Est. Cost Nm
Activity Area Project Description of
Activities Year Est. Cost Nm
Activity Area Project Description
of Activities Year Est. Cost Nm
Participating Agencies
Intensive Plantation of fast Growing Trees
Energy Plants Project
Although there have been several tree planting projects in different parts of the Country, the aims have mostly not been geared towards fuel wood production, but for such purposes as afforestation for timber and pulp. Thus, the species and varieties of trees chosen by foresters almost never considered their potentials for fuel wood production. Fuel wood planting can use species with crooked trunks or wood that warps or splits at it dries because these features are not as detrimental to fuel wood as to timber or pulp production. Trees most likely to be useful for fuel wood plantations are those termed “pioneers”, which in nature are the first to colonized deforested areas. These species withstand degraded solids as well as exposure to wind and drought. Many are rapid growing.
2007 100 Establish-ment of Wood Farm Lands
Energy Plants Project
Woodlands, forest and on-farm trees are currently the major sources of fuel wood in many countries. For production of fuel wood for local consumption, village forestry or community woodlots should be the ideal. However, there is need to establish woodlands across the country to serve as the sources of raw materials for the future biomass energy industries. Government should establish about 100,000 hectares of woodland by the year 2015.
2008 - 2015
300 Capacity Building
Establishment of fuelwood lots
200 ha of fast growing fuelwood lots are to be established (Continuation from previous term)
2016 - 2025
600 Fed., State, LGAs, Private Investors, Co-operatives.
Capacity Building
Training programmes in Biogas, biofuels, briquetting and woodstoves
Design and implementation of specific training programmes for a broad range of biomass technologies. �
2007 40 Capacity Building
Continuation of short term projects
Design and implementation of specific training programmes for a broad range of biomass technologies.
2008 - 2015
50
Capacity Building
Continuation of medium term activities
2016 –
2025
100 Fed., State, LGAs, Private Investors, Co-operatives.
Sub-Total �
140
350
700
1190

Renewable Energy Master Plan (REMP) • Final Report • November 2005 Energy Commission of Nigeria (ECN) • United Nations Development Programme (UNDP)
142
Table 4.3.F NATIONAL BIOMASS ENERGY PROGRAMME (CONTD) Short Term (2006 - 2007) Medium Term (2008 - 2015) Long Term (2016 - 2025)
Activity Area Project Description of Activities Year
Est. Cost Nm
Activity Area Project Description of
Activities Year Est. Cost Nm
Activity Area Project Description of
Activities Year Est. Cost Nm
Participating Agencies
Establishment of Biomass Co-generation Plants
Government should encourage through incentives the establishment of decentralized biomass power plants for use in the industries. The initial phase of development would involve a number of power plants that can generate as much as 2,500MW of electricity by the year 2025.
2016 –
2025
3000 Federal and state governments in partnership with the private sector
Sub-Total 0 0 3000 3000
Grand Total 1793 3231 11353 16377

4.4 National Solar Energy Programme Goals and Objectives A. Solar Thermal Energy (i) Awareness creation and Public Education - Develop awareness and public enlightenment programmes for the print and electronic media. - Develop awareness creation programmes on Solar Thermal Energy for primary and secondary schools. - Develop awareness creation programmes for National and State Assemblies. - Workshops for media executives, journalists and reporters. - Workshop for local government officials, state government officials, school principals and teachers, women and female youth groups. (ii) Improvement of Regulatory, Administrative and Institutional Conditions - Development modalities for the establishment of Nigerian Renewable Energy Development Agency (NIREDA) and Ministry of Energy (MOE) - Realise the establishment of NIREDA and MOE. - Optimize use of the only established NIREDA and MOE. - Draft legistation and Acts on Solar Thermal marked incentives through appropriate government departments and agencies. - Draft legistation for a fossil fuel levy Act to finance Solar Thermal Energy. - Set up Local and regional renewable energy management agencies to promote Solar Thermal Energy at the Local Govt. and State levels. - Obtain National Assembly accent to the levy Act to finance Solar Thermal Energy. (iii) Improvement of Market Competitiveness - Design tariff structure for Solar Thermal electricity. - Obtain necessary approvals for tariff structures - Effectively use the approved tariff structure for Solar Thermal electricity to leverage renewable energy into the energy mix. - Mobilize for removal of taxes, VAT, excises, etc on Solar Thermal Energy. - Develop modalities for institution preferential loans and guarantees, capital subsidies and tax previlages (iv) Development of Standards, Codes of Practice and Specifications - Develop Codes of Practice as a basic reference document for use in all solar thermal crata heaters/collectors installation, solar dryers for agricultural and industrial installations. (v) Research and Development Framework - Develop research portfolios in Solar Thermal Energy in solar collector materials like absorber materials, insulators and glazing solar heat storage materials and heat excharger systems. (vi) Capacity Building - Education, training and retraining required at all levels for artisians, craftsman, technician technologist, engineers, architects, builders, installers,

Renewable Energy Master Plan (REMP) • Final Report • November 2005 Energy Commission of Nigeria (ECN) • United Nations Development Programme (UNDP)
144
Contractors, Suppliers and Government officials. - Training for bankers, financiers, managers, NGO's state and local government officials. - Empower and utilize identified institutions and training facilities that would partner with ECN the education and training requirements. - Develop education and training materials for solar water heaters/collectors system. (vii) - Information and Experience exchange and local, regional and international cooperation. - Develop Networking and information experience exchange strategies with local, state, national, regional and international institutions and organisations. - Improve on the networking and experience exchange strategies. (viii) Pilot Projects Development - Develop 10 pilot Projects and four National Solar Thermal Programmes listed in the Solar Thermal Energy Consultant's project. - Implement the 10 pilot projects and 4 National Solar Thermal Programmes. (ix) Development of Testing and Certification Centres and Procedures - Develop testing and certification procedures to aid in standards enforcement and sanctions by drawing up of selection criteria. - Utilize the testing and certification centres and procedures developed. - Undertake external review, assessment and evaluation of the testing and certification process and procedures.
B. Solar PV Energy (i) Local Production and Capacity Building - Determine exact locations, acquire land and set up PV plants. - ECN and FMP&S to workout logistics for setting up two PV plants to produce modules based on this film and heterojunction technologies. - Infrastructural and development of the factory site building. - Partnership with foreign companies. - Local production of balance of system components like 1 kw - 10 kW capacities controller (60A). - Development of utility - tied inverters and other BOS components. - Recruitment and training of Nigeria Engineers, Physicists, Chemists, Technologists, Technicians and other categories of worker in the (ii) Research Development and Training - Establish very strong linkage between the two renewable energy research centers and some PV research centres in Europe, America, India, China, Brazil, etc. - Training of Engineers, Technicians and other workers to be carried out locally. - Research and development activities continue to ensure locally researched cells and modules have compatible efficiencies. - Exchange visits between our centres and some overseas centres to determine state if the art equipment to be acquired. - Acquisition of research equipment.

Renewable Energy Master Plan (REMP) • Final Report • November 2005 Energy Commission of Nigeria (ECN) • United Nations Development Programme (UNDP)
145
- Sourcing of fund to install mini module production plants. - Raw materials Research and Development Council (RMRDC) to initiate research on local raw materials to support the PV products industry - Collaboration of research efforts between renewable energy research centres and engineering and physical science facilities in our universities. - Organise training workshops, seminars and conferences at state, zonal and national levels for manpower development. plant. (iii) Dissemination of Systems - Establish and support at least one PV vendor in each state of the federation. - Arrange finances to support rural people to acquire solar home systems and ensure private sector participation. - Installation of PV power in schools, health centres, households, etc between 2006 and 2007. - ECN and FMP&S plan to distribute 50MW among various sectors of the economy. - PV integration on the roof of new government, public and private sector owned buildings. - ECN and FMP&S to demarcate various sectors of the PV market to ensure that on additional 500MW is added by the year 2025. (iv) Policy Formulation and Finance - Enact government policies and financing mechanisms to encourage the installation of PV systems. (v) Establishment of Standards - Installation standards and codes of practice are to be setup. - Establishment of a Renewable Energy Development Agency in the Country.

146
Table 4.4.A RENEWABLE ENERGY MASTERPLAN PROJECTS AND ACTIVITIES IN SOLAR ENERGY
Short Term Medium Term Long Term Activity Area
Project Description of Activities
Year Est. Cost Nm
Project Description of Activities
Year Est. Cost Nm
Project Description of Activities
Data Acquisition
National solar radiation database and mapping
Obtain comprehensive data on solar radiation resource and map database
2006/07 40 National solar radiation database and mapping
Solar radiation resource database Mapping continued
2008/15 80 National solar radiation database and mapping
Solar radiation resource database Mapping continued
Capacity Building (Manpower)
Partner training institutions & agencies identification
Identify ECN partner institutions & to develop education & training materials for solar thermal and solar PV technologies. Training target for financiers, NGOs, Bankers, Managers, Public officials, Students, etc.
2006 20 Training Short Courses & Workshops on solar Thermal and solar PV technologies
Training of professionals, operators, craftsmen and others on the design, production, operation and maintenance of solar Thermal & solar PV technologies
2008/15 80 Training Short Courses & Workshops on solar Thermal and solar PV technologies
Training of craftsmen, artisans, women, primary and secondary students and teachers, public officers at local govt. state and national levels, the presidency, judiciary, legislature
Sub-Total 60 160
Table 4.4.B NATIONAL SOLAR ENERGY PROGRAMME (CONTD)
Short Term Medium Term Long Term Activity Area
Project Description of Activities
Year Est. Cost Nm
Project Description of Activities
Year Est. Cost Nm
Project
Capacity Building (Manpower)
Training workshop on solar Thermal and Solar PV technologies
Conduct training workshops with solar Thermal and Solar PV technologies for financiers, NGO’s, Bankers, Public Officers, Students, Journalists etc.
2006/07 20 Training workshop on solar Thermal and Solar PV technologies
Training of Teachers , Lecturers, Selected local govt. and Rural development personnel on Solar Thermal and Solar PV technologies
2008/15 80 Training workshop on solar Thermal and Solar PV technologies

147
Advanced Training on Solar Thermal and Solar PV technologies
Conduct advanced training on Solar thermal and Solar PV technologies for SMME’s and Solar Energy Industry
2006/07 10 Advanced Training on Solar Thermal and Solar PV technologies
Conduct short courses and post graduate programme on Solar Thermal and Solar PV technologies
2008/15 50 Advanced Training on Solar Thermal and Solar PV technologies
Curricula development on solar Thermal & solar PV technologies
Develop Curricula for Primary, Secondary and Tertiary institutions on solar Thermal & solar PV technologies
2006/07 10 Curricula implementation at the primary, secondary and tertiary institutions
Implement the curricula developed at the various institutional levels
2008/15 30 Curricula implementation at the primary, secondary and tertiary institutions
Sub-Total 40 160
Table 4.4.C NATIONAL SOLAR ENERGY PROGRAMME (CONTD)
Short Term Medium Term Long Term Activity Area
Project Description of Activities
Year Est. Cost Nm
Project Description of Activities
Year Est. Cost Nm
Project Deof
Capacity Building contd. (Manufacturing and Production)
Establishment of Solar Thermal and Solar PV plants
Development of Business plans for the establishment of two thermal water heater and one solar PV plant
2006/07 10 Establishment of Solar Thermal and Solar PV plants
Involvement of Private Sector partners in the development of two solar water heater and one solar PV plants projects
2008/15 100 Establishment of two solar thermal water heater (one flat plate type and one evacuated tube type) and one solar PV plant (crystalline Si)
TwtheheanPVto estwisecparhavmasha
Capacity Building (support infrastructure)
Provision of teaching and R&D facilities in solar thermal and solar PV technologies
Equipping the National Energy Centres and other Universities with energy R&D capability
2006/07 100 Provision of teaching and R&D facilities in solar thermal and solar PV technologies
Equipping the National Energy Centres and other Universities with energy R&D capability
2008/15 500 Provision of teaching and R&D facilities in solar thermal and solar PV technologies
Coof MeTeact
Sub-Total 110 600

148
Table 4.4.D NATIONAL SOLAR ENERGY PROGRAMME (CONTD) Short Term Medium Term Long Term Activity
Area
Project Description of Activities
Year Est. Cost Nm
Project Description of Activities
Year Est. Cost Nm
Project
Market Development and Promotion
Pilot Projects on solar thermal technologies
Pilot Projects on solar water heaters: solar dryers, solar cookers and solar absorption and adsorption refrigeration
2006/07 100 Pilot Projects on solar thermal technologies
Continuation of short term pilot projects and development of pilot projects on solar thermal electricity
2008/15 500 Commercialization of pilot projects on solar thermal technologies
Pilot Projects on solar PV technologies
Pilot Projects on Solar PV in the residential, commercial, industrial sectors
2006/07 500 Pilot Projects on solar thermal technologies
Continuation of Short term activities
2008/15 500 Commercialization of pilot projects on solar PV
Public awareness campaigns on improved woodstoves
Promotion of improved woodstoves through the media, village meetings etc.
Continuation of short term projects
Continuation of short term activities
2008/15
Public awareness campaign on solar thermal and solar PV technologies
Promotion of solar thermal and solar PV technologies through the media, village meetings etc
2006/7 50 Public awareness campaign on solar thermal and solar PV technologies
Continuation of short term activities
2008/15 100 Public awareness campaign on solar thermal and solar PV technologies
Sub-Total 650 1100

149
Table 4.4.E NATIONAL SOLAR ENERGY PROGRAMME (CONTD) Short Term Medium Term Long Term Activity
Area
Project Description of Activities
Year Est. Cost Nm
Project Description of Activities
Year Est. Cost Nm
Project
Policy, Legal and regulatory framework
Development of Codes of Practice, Standards & Specifications for solar thermal & solar PV technologies
Develop Codes of Practice,
Standards & Specifications for solar thermal &
solar PV technologies
2006/07 50 Development of Codes of
Practice, Standards &
Specifications for solar
thermal & solar PV
technologies
Continuation of the development of codes, standards & specifications
2008/15 80 Development of Codes of Practice, Standards & Specifications for solar thermal & solar PV technologies
Research & Development Framework
R & D in solar thermal & solar PV technologies
Develop research portfolios in solar thermal energy &
solar PV
2006/07 50 R & D in solar thermal & solar PV
technologies
Implement the R & D portfolios
developed in the Short
Term
2008/15 100 R & D in solar thermal & solar PV
technologies
International, Regional &
Inter-Agency Cooperation
Networking Encourage Development of
network of researchers, industry & commerce
involved in solar thermal & solar PV technologies
2006/07 10 Networking Continue the Short Term networking activities
2008/15 50 Networking
Sub-Total 110 230

150
Table 4.4.F NATIONAL SOLAR ENERGY PROGRAMME (CONTD) Short Term Medium Term Long Term Activity
Area
Project Description of Activities
Year Est. Cost Nm
Project Description of Activities
Year Est. Cost Nm
Project
Policy, legal, &
regulatory framework
National RE Production and Testing Center
Establish 6 zonal Testing &
Certification centres for solar thermal &
solar PV technologies
2006/07 100 Development of Testing & Certification
centres & Procedures
Continue the establishment
of the 6 Testing &
Certification Centres for
solar thermal & solar PV
technologies
2008/15 100 Development of Testing & Certification centres & Procedures
Public Awareness
Publicity Develop awareness creation & public
enlightenment programmes on solar thermal & solar PV technologies for the print & electronic media; primary & secondary schools; National, State &
Local Govt. Assemblies; State &
Fed. Ministry Officials; Youth &
Women Groups; etc.
2005/06 10 Publicity Continue the Short Term Activities
2008/15 10 Publicity
Sub-Total 110 110

151
Table 4.4.G NATIONAL SOLAR ENERGY PROGRAMME (CONTD) Short Term Medium Term Long Term Activity
Area
Project Description of Activities
Year Est. Cost Nm
Project Description of Activities
Year Est. Cost Nm
Project DA
Policy, legal, &
regulatory framework
Legislation drafting
Draft legislation for a Solar Water Heating
Obligation in the residential,
commercial & institutional sectors
2005/06 10 Legislation drafting
Draft legislation
for a Renewable Electricity Obligation
for electricity
producers & vendors
2008/15 15 Legislation drafting E
O
teas
Policy, legal &
regulatory framework
Tariff design
Design tariff structure for solar
thermal and solar PV electricity
2006/07 50 Tariff design Continue tariff design
from the Short Term
2008/15 50 Tariff design E
ta
Policy, legal, &
regulatory framework
Legislation drafting
Draft legislation for a Fossil Fuel Levy Act
to finance solar thermal & solar PV technologies market
development
2006/07 50 Legislation drafting
Complete drafting &
ensure passage of the Fossil Fuel Levy
Act for solar thermal & solar PV
technologies
2008/15 50 Legislation drafting n
Sub-Total 110 115
Table 4.4.H NATIONAL SOLAR ENERGY PROGRAMME (CONTD)
Short Term Medium Term Long Term Activity Area
Project Description of Activities
Year Est. Cost Nm
Project Description of Activities
Year Est. Cost Nm
Project DA
Policy, legal, &
regulatory framework
Legislation drafting
Draft legislations and Acts on solar thermal
& solar PV market incentives through
relevant govt. depts. & agencies
2006/07 50 Legislation drafting
Complete drafting &
ensure passage of the various legislations
& Acts through the appropriate
legal structures
2008/15 50 Legislation drafting n
le
Sub-Total 50 50
Grand Total
1240 2525

152
4.5 National Small Hydro Programme GOALS AND OBJECTIVES
(i) Conduct a National Survey for establishment of National Small Hydro Programme (SHP) (ii) Assessment of Agricultural and Industrial Demand - Audit of domestic and industrial sectors to identify and quantity the structure of energy supply, demand utilization patterns, and efficiencies and substitution potentials for both small and large use enterprises. (iii) Implementation of fiscal measures - Ensure implementation of fiscal measures necessary for the achievement of set objectives of the plan. - Establish linkage between SHP development and expanded access to rural electrification. (iv) Establishment of Codes and Standards - Develop Codes, Standards, regulations and guidelines on SHP development, energy conservation and use of energy efficient methods, equipment, machinery and technologies in agriculture, industry, building design and construction. (v) Development of Institutional Control mechanisms - Establish appropriate institutional arrangements and incentives for SHP development - Establish basic engineering infrastructure for the production of hydro power plants, equipment and accessories. (vi) Tariff Development - Develop and implement appropriate tariff and pricing structures. (vii) Establishment of Information System
- Organise a National SHP information system to promote and ensure consistent gathering and processing of SHP data.
(viii) Conduct Workshops and Lectures - Establish a strategy for public awareness, education and participation in realization of the goals of the Master Plan. (ix) Development of Water Management Plan - Review and Improve agreements, monitoring and regulating the use of water in International Rivers flowing through the Country. (x) SHP Construction - Construct at least one SHP plant in each of the six geopolitical zones of the Country. - Widespread construction of SHP. (xi) Capacity Building - Training of personnel on technical and financial aspects; - Training to ensure adequate supply of manpower. (xii) Research and Development (R & D) - Design mechanism for certification, equipment standardization, renovation, improvement of equipment efficiency. (xiii) Private Sector Participation - Invite and interact with the Private Sector through program. - Full Private Sector Participation.

153
Table 4.5.A NATIONAL SMALL HYDRO PROGRAMME
Short Term (2006 - 2007) Medium Term (2008 - 2015)
Activity Area Project Description of
Activities Year Est. Cost Nm
Activity Area Project Description of Activities Year
Est. Cost Nm
Activity Area
National Survey
Establishment of National Small Hydro Potential
Complete National Survey for identification & inventory of potential SHP sites throughout the Federation. Development of a plan & schedule for SHP implementation.
2006 -2007
18 Domestic Private Sector Participation
Contacts Enhanced domestic participation in SHP operations.
2008 -
2010
Assessment of Agricultural & Industrial Demand
Establishment of Agric + Industrial Demand
Audit of the domestic agricultural and industrial sectors to identify & quantify the structure of energy supply, demand, utilization patterns, efficiencies & substitution potentials, for both small & large use enterprises.
2006 6 Evaluation - Evaluation and review of short term activities.
2008 -
2010
Implementation of fiscal measures
- Ensuring implementation of fiscal measures necessary for the achievement of set objectives of the plan
2007 Rural electrification
Interactions with REB's
Establish linkage between SHP development and expanded access to rural electrification.
2008 -
2010
Codes and Standards
Establishment of Codes and Standards
Development of codes, standards, regulations and guidelines on SHP development, energy.
2006 5
Sub-Total 29 0

154
Table 4.5.B NATIONAL SMALL HYDRO PROGRAMME (CONTD)
Short Term (2006 - 2007) Medium Term (2008 - 2015) Lo
Activity Area Project Description of
Activities Year Est. Cost Nm
Activity Area Project Description of
Activities Year Est. Cost Nm
Activity Area Pr
Institutional Structure
Development of Institutional Control Mechanism
Establishment of appropriate institutional arrangements and incentives for SHP development and for the promotion and monitoring of the implementation of the approved energy master plan and compliance with the guidelines and regulations.
2006 Local Production
Domestic production of SHP parts.
Establishment of basic engineering infrastructure for the production of hydropower plants equipment and accessories.
2008 200
Power Purchase Agreements
Tariff Development
Development and Implementation of appropriate tariff and pricing structures.
2006 3
Information System
Establishment of National SHP Information System
Organise a national SHP information system to promote and ensure consistent gathering and processing of SHP data including development pattern and progress as well as other relevant socio-economic parameters.
2006 4
Public Aware-ness
Workshops and Lectures
Establishment of a strategy for public awareness, education and participation in the realization of the goals and objectives of the Master Plan.
2005 - 2007
10
Domestic Private Sector Participation
- Provide financing to support increased patronage of indigenous entrepreneurs involved in planning, design and construction of hydropower plants.
2006 - 2007
4
Sub-Total 21 200
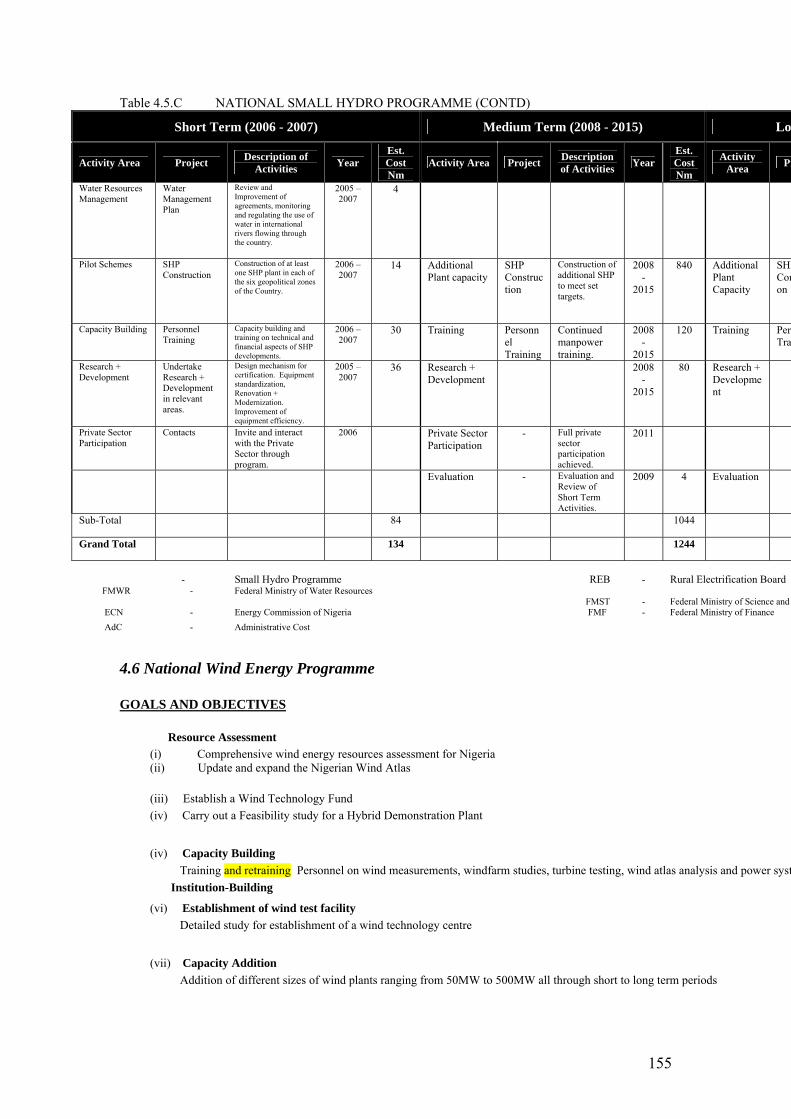
155
Table 4.5.C NATIONAL SMALL HYDRO PROGRAMME (CONTD)
Short Term (2006 - 2007) Medium Term (2008 - 2015) Lo
Activity Area Project Description of Activities Year
Est. Cost Nm
Activity Area Project Description of Activities Year
Est. Cost Nm
Activity Area Pr
Water Resources Management
Water Management Plan
Review and Improvement of agreements, monitoring and regulating the use of water in international rivers flowing through the country.
2005 – 2007
4
Pilot Schemes SHP Construction
Construction of at least one SHP plant in each of the six geopolitical zones of the Country.
2006 – 2007
14 Additional Plant capacity
SHP Construction
Construction of additional SHP to meet set targets.
2008 -
2015
840 Additional Plant Capacity
SHPConon
Capacity Building Personnel Training
Capacity building and training on technical and financial aspects of SHP developments.
2006 – 2007
30 Training Personnel Training
Continued manpower training.
2008 -
2015
120 Training PersTra
Research + Development
Undertake Research + Development in relevant areas.
Design mechanism for certification. Equipment standardization, Renovation + Modernization. Improvement of equipment efficiency.
2005 – 2007
36 Research + Development
2008 -
2015
80 Research + Development
Private Sector Participation
Contacts Invite and interact with the Private Sector through program.
2006 Private Sector Participation
- Full private sector participation achieved.
2011
Evaluation - Evaluation and Review of Short Term Activities.
2009 4 Evaluation
Sub-Total 84 1044
Grand Total 134 1244
-
Small Hydro Programme
REB
-
Rural Electrification Board
FMWR - Federal Ministry of Water Resources FMST
-
Federal Ministry of Science and
ECN - Energy Commission of Nigeria FMF - Federal Ministry of Finance AdC - Administrative Cost
4.6 National Wind Energy Programme GOALS AND OBJECTIVES
Resource Assessment (i) Comprehensive wind energy resources assessment for Nigeria
(ii) Update and expand the Nigerian Wind Atlas (iii) Establish a Wind Technology Fund (iv) Carry out a Feasibility study for a Hybrid Demonstration Plant
(iv) Capacity Building Training and retraining Personnel on wind measurements, windfarm studies, turbine testing, wind atlas analysis and power syst Institution-Building
(vi) Establishment of wind test facility Detailed study for establishment of a wind technology centre
(vii) Capacity Addition Addition of different sizes of wind plants ranging from 50MW to 500MW all through short to long term periods

156
Table 4.6.A NATIONAL WIND ENERGY PROGRAMME
Short Term Medium Term
Long Term
Activity Area
Project
Description of Activities
Year
Est. Cost Nm
Project
Description of Activities
Year
Est. Cost Nm
Project
Data Analysis
Analysis of data from existing meteorological stations and the newly acquired data from the 36 potential sites
Production of a preliminary/coarse wind resource map.
New metrologistations
Sub-Total 150

157
Table 4.6.B NATIONAL WIND ENERGY PROGRAMME (CONTD)
Short Term Medium Term Long Term Activity Area
Project Description of Activities
Year Est. Cost Nm
Project Description of Activities
Year Est. Cost Nm
Project Descriptioof Activiti
Establishment of a wind test facility
Wind Technology Centre
Detailed study for the establishment of a Wind Technology Centre
2006/07 500 Continuation of short term project
Establishment of a wind test facility
2008/09 Continuation of short term project
Establishmof a wind tfacility
Capacity Building (Manpower Development)
Training Workshop on wind energy technology
Training of scientists, engineers and technologists on wind measurements, wind farm studies, and wind farm design
2006/07 60 Short term projects continued
Training of scientists, engineers and technologists on Turbine Testing
2008/09 100 Training oscientists, engineers technologion wind AAnalysis
Sub-Total 560 100
Table 4.6.C NATIONAL WIND ENERGY PROGRAMME (CONTD)
Short Term Medium Term Long Term Activity Area
Project Description of Activities
Year Est. Cost Nm
Project Description of Activities
Year Est. Cost Nm
Project Descripof Activiti
Establishment of a Hybrid demonstration plant
Hybrid Demonstration Plant
Carry out a feasibility study for a Hybrid Demonstration plant
2006/07 200 Hybrid Demonstration Plant
Carry out a feasibility study for a Hybrid Demonstration plant
2008/15 200
Establishment of 1MW Hybrid demonstration plant
Policy Framework
Establishment of a policy framework
Formulation of a legal/legislative framework
2006/07 10 Continuation of short term project
Establishment of a Wind Technology Fund
2008/09
Sub-Total 210

158
Table 4.6.D NATIONAL WIND POGRAMME (CONTD)
Short Term Medium Term Long Term Activity Area
Project Description of Activities
Year Est. Cost Nm
Project Description of Activities
Year Est. Cost Nm
Project Descriptionof Activities
Capacity Addition
Installation and Commissioning of Wind Power Plant
50MW capacity addition
2008 10,000 Continuation of medium term projects
250MW capacity addition
50MW capacity addition
2009 10,000
50MW capacity addition
2010 10,000 250MW capacity addition
100MW capacity addition
2011 20,000 250MW capacity addition
150MW capacity addition
2012 30,000 250MW capacity addition
Sub-Total
80,000

159
Table 4.6.E NATIONAL WIND ENERGY PROGRAMME (CONTD)
Short Term Medium Term Long Term Activity Area
Project Description of Activities
Year Est. Cost Nm
Project Description of Activities
Year Est. Cost Nm
Project Description of Activities
Capacity Addition 150MW capacity addition
2013 30,000 Continuation of medium term projects
Building of new wind power plan
150MW capacity addition
2014 30,000 500MW capacityaddition
150MW capacity addition
2015 30,000 400MW capacityaddition
Capacity Building (support infrastructure)
Manufacturing of wind plant equipment
Local manufacturing owind turbines another equipmentfor wind energy deployment in thcountry and possible export market in the weAfrica sub regionand subsequentlyother regions in Africa.
Sub-Total 0 90,000
GRAND TOTAL 920 170,100

160
4.7 Emerging Energy Research and Development Programme GOALS AND OBJECTIVES
A. Hydrogen Energy
(i) Identification of appropriate Research and Development centers
(ii) Development of proposal for Hydrogen Research and Development by identified research centres and Energy Commission
Of Nigeria
(iii) Inclusion of National Energy Research and Development Programme (NERDP) in 2007 Appropriation Bill
(iv) Convene a National Hydrogen Conference
(v) Involvement of Public-Private Partnership in Research and Development
(vi) Convene an International Hydrogen Conference
B. Ocean Energy
(i) Identification of appropriate Research and Development Centres
(ii) Development of Proposals for Ocean Energy Research and Development centres and Energy Commission of Nigeria
(iii) Inclusion of National Energy Research and Development Programme (NERDP) in 2007 Appropriation Bill
(iv) Commencement of Ocean Energy Research and Development
(v) Convene first National Ocean Energy Conference
(vi) Convene second National Ocean Energy Conference
(vii) Achievement of a locally developed Ocean Energy Technology Prototype
C. Geothermal Energy
(i) Identification of appropriation Research and Development Centres
(ii) Development of Proposals for Geo thermal Energy Research and Development Centres and Energy Commission of Nigeria
(iii) Inclusion of National Energy Research and Development Programme (NERDP) in 2007 Appropriation Bill
(iv) Commencement of Geothermal Energy Research and Development
(v) Convene first National Geothermal Energy Conference
(vi) Convene second National Geothermal Energy Conference
(vii) Nationwide Geothermal exploration

161
Table 4.7.A EMERGING ENERGY RESEARCH AND DEVELOPMENT PROGRAMME HYDROGEN ENERGY
Short Term (2006 - 2007) Medium Term (2008 - 2015) Long Te
Activity Area Project Description of
Activities Year Est. Cost Nm
Activity Area Project Description
of Activities Year Est. Cost Nm
Activity Area Project
R&D Centres Hydrogen Energy R&D Project
Identification of appropriate R&D centres
2006 5 Capacity-building with identified centres
Hydrogen Energy R&D Project
Training and workshop
2009 5 International cooperation on hydrogen R&D
Establishmet of internationajoint-researon hydrogeenergy application
Proposal development
Hydrogen Energy R&D Project
Development of proposal for Hydrogen R&D by identified research centre(s) and Energy Commission of Nigeria
2006 2 Research and documentation
Hydrogen Energy R&D Project
Project seeks to review the status of knowledge on hydrogen energy worldwide
2009 -
2010
10 Hydrogen energy R&D
Developmeof market applicationfor hydrogeenergy in Nigeria
Appropriation
Hydrogen Energy R&D Project
Inclusion of NERDP in 2007 Appropriation Bill
2006 Hydrogen Energy R&D Project
Niche for marked utilisation of hydrogen in Nigeria
Market developmenfor hydrogeenergy
Budget line Hydrogen Energy R&D Project
Budget line for NERDP R&D
2007 Hydrogen Energy R&D Project
Commencement of research
Hydrogen Energy R&D Project
Commencement of Hydrogen R&D research
2007 10 National Hydrogen Conference
Hydrogen Energy R&D Project
Convene a National Hydrogen Conference
2012 5
Public-private partnership in R&D
Hydrogen Energy R&D Project
Ensuring that Public-private partnership in R&D is achieved
2015 10
International Hydrogen Conference
Hydrogen Energy R&D Project
Convene an International Hydrogen Conference
2015 10
Sub-total 17 40

162
Table 4.7.B EMERGING RESEARCH AND DEVELOPMENT PROGRAMME
OCEAN ENERGY Short Term (2006 - 2007) Medium Term (2008 - 2015) Long Te
Activity Area Project Description of Activities Year
Est. Cost Nm
Activity Area Project Description of Activities Year
Est. Cost Nm
Activity Area Project
R&D Centres Ocean Energy R&D Project
Identification of appropriate R&D centres
2006 5 Capacity-building with identified centres
Ocean Energy R&D Project
Training and workshop
2009 5 International cooperation on Ocean R&D
Establishment of international joint-research on Ocean energy applications
Proposal development
Ocean Energy R&D Project
Development of proposal for Ocean R&D by identified research centre(s) and Energy Commission of Nigeria
2006 2 Research and documentation
Ocean Energy R&D Project
Project seeks to review the status of knowledge on Ocean energy worldwide
2009 -
2010
10 Ocean energy R&D
Developmenof market applications for Ocean energy in Nigeria
Appropriation Ocean Energy R&D Project
Inclusion of NERDP in 2007 Appropriation Bill
2006 Ocean Energy R&D Project
Niche for marked utilisation of Ocean in Nigeria
Market development for Ocean energy
Budget line Ocean Energy R&D Project
Budget line for NERDP R&D
2007 Ocean Energy R&D Project
Commencement of research
Ocean Energy R&D Project
Commencement of Ocean R&D research
2007 10 National Ocean Conference
Ocean Energy R&D Project
Convene a National Ocean Conference
2012 5
Public-private partnership in R&D
Ocean Energy R&D Project
Ensuring that Public-private partnership in R&D is achieved
2015 10
International Ocean Conference
Ocean Energy R&D Project
Convene an International Ocean Conference
2015 10
Sub-Total 17 40

163
Table 4.7.C EMERGING RESEARCH AND DEVELOPMENT PROGRAMME
GEOTHERMAL ENERGY Short Term (2006 - 2007) Medium Term (2008 - 2015) Long T
Activity Area Project Description of Activities Year
Est. Cost Nm
Activity Area Project Description
of Activities Year Est. Cost Nm
Activity Area Proje
R&D Centres Geothermal Energy R&D Project
Identification of appropriate R&D centres
2006 5 Capacity-building with identified centres
Geothermal Energy R&D Project
Training and workshop
2009 5 International cooperation on Geothermal R&D
Establishmof internatjoint-reseaon Geotheenergy applicatio
Proposal development
Geothermal Energy R&D Project
Development of proposal for Geothermal R&D by identified research centre(s) and Energy Commission of Nigeria
2006 2 Research and documentation
Geothermal Energy R&D Project
Project seeks to review the status of knowledge on Geothermal energy worldwide
2009 -2010
10 Geothermal energy R&D
Developmof market applicatiofor Geotheenergy in Nigeria
Appropriation Geothermal Energy R&D Project
Inclusion of NERDP in 2007 Appropriation Bill
2006 Geothermal Energy R&D Project
Niche for marked utilisation of Geothermal in Nigeria
Market developmfor Geotheenergy
Budget line Geothermal Energy R&D Project
Budget line for NERDP R&D
2007 Geothermal Energy R&D Project
Commencement of research
Geothermal Energy R&D Project
Commencement of Geothermal R&D research
2007 10 National Geothermal Conference
Geothermal Energy R&D Project
Convene a National Geothermal Conference
2012 5
Public-private partnership in R&D
Geothermal Energy R&D Project
Ensuring that Public-private partnership in R&D is achieved
2015 10
International Geothermal Conference
Geothermal Energy R&D Project
Convene an International Geothermal Conference
2015 10
Sub-Total 17 40
Grand Total 51 120

164
A breakdown of the total required investment for all the programmes outlined in the Master Plan follows.
4.8 Programme Budget Meeting the targets of the Renewable Energy Master Plan will demand significant investments in renewable energy systems. Table 1.6 presents an overview of estimated costs for these investments for all activities outlined in chapter four of the Master Plan. Table 4.8: Projected Investment Summary
S/No. Programmes and Activities ST
(Nm) MT
(Nm) LT
(Nm) Total (Nm)
FRAMEWORK PROGRAMME FOR RENEWABLE ENERGY PROMOTION Activity
1 Policy, legal and regulatory framework 0 90 32 122 2 Institutional framework 0 0 0 0 3 Economics and Financing 0 70 20 90 4 Capacity Building 100 100 100 300 5 Public Awareness 10 100 100 210 6 Inter-Agency Collaboration 10 10 10 30 7 Research and Development 50 50 50 150 8 Monitoring and Evaluation 0 10 10 20 Sub-Total 170 430 322 922 BIOMASS
1 Data Acquisition 200 100 100 400 2 Capacity Building: Manpower 1082 2246 6,978 10,3063 Market Development and Promotion 271 315 290 876 4 Site Identification 30 90 90 210 5 Technology Assessment & Review 10 10 15 35 6 Biogas Technology/Diffussion Programme 60 120 180 360 7 Intensive Plantation of fast growing trees 100 300 600 1000 8 Capacity Building 40 50 3100 3190 Sub-Total 1,793 3,231 11,353 16,377 SOLAR
1 Data Acquisition 40 80 100 220 2 Capacity Building: Manpower 60 240 260 560 3 Capacity Building : Manufacturing and Production 10 100 100 210 4 Capacity Building; Support Infrastructure 100 500 800 1400 5 Market Development and Promotion 650 1100 1100 2850 6 Research and Development Framework 50 100 200 350 7 International, Regional and Inter-Agency Cooperation 10 50 100 160 8 Public Awareness 10 10 50 70 9 Policy, legal, & regulatory framework 310 345 500 1155 Sub-Total 1240 2525 3210 6975

165
SMALL HYDRO
S/No. Activity ST
(Nm) MT
(Nm) LT
(Nm) TOTAL (Nm)
1 National Survey 18 0 0 18 2 Assessment of Agricultural & Industrial Demand 6 0 0 6 3 Implementation of Fiscal measures 0 0 0 0 4 Codes and Standards 5 0 0 5 5 Institutional Structure 0 200 0 200 6 Power Purchase Agreement 3 0 0 3 7 Information System 4 0 0 4 8 Public Awareness 10 0 0 10 9 Domestic, Private Sector Participation 4 0 0 4
10 Water Resource Management 4 0 0 4 11 Pilot Schemes 14 840 1,500 2,354 12 Capacity Building 30 120 120 270 13 Research and Development 36 80 100 216 14 Private Sector Participation 0 4 6 10
Sub-Total 134 1244 1,726 3,104 WIND
1 Data Acquisition 150 100 140 390 2 Data Analysis 0 0 200 200 3 Establishment of a wind test facility 500 0 100 600 4 Capacity Building: Manpower 60 100 0 160 5 Establishment of a Hybrid Demonstration Plant 200 0 0 200 6 Policy Framework 10 0 0 10 7 Capacity Addition 0 170,000 380,200 550,2008 Capacity Building; Support Infrastructure 0 0 30,000 30,000 Sub-Total 920 170,200 410,640 581,760
NEW ENERGY RESEARCH & DEVELOPMENT
PROGRAMME A. Hydrogen Energy
1 Research and Development Centres 5 5 50 60 2 Proposal Development 2 10 50 62 3 Appropriation 0 0 30 30 4 Budget Line 0 0 0 0 5 Commencement of Research 10 25 0 35 Sub-Total 17 40 130 187 B. Ocean Energy
1 Research and Development Centres 5 5 50 60 2 Proposal Development 2 10 50 62 3 Appropriation 0 0 30 30 4 Budget Line 0 0 0 0 5 Commencement of Research 10 25 0 35 Sub-Total 17 40 130 187

166
C. Geothermal Energy 1 Research and Development Centres 5 5 50 60 2 Proposal Development 2 10 50 62 3 Appropriation 0 0 30 30 4 Budget Line 0 0 0 0 5 Commencement of Research 10 25 0 35 Sub-Total 17 40 130 187 GRAND TOTAL 4,308 177,750 427,641 609,699
Implementing the REMP will demand an estimated investment portfolio of 4billion, 178billion and 610billion Naira, in the short (2005 – 2007), medium (2008 – 2015) and long term (2016 – 2025), respectively. Financing these investments will depend on the mobilization of resources from Governments at all levels, the domestic private sector and international sources. International investments will include Foreign Director Investments, Grants and projected revenues from carbon credits.

167
CChhaapptteerr 55:: SSttrraatteeggyy aanndd IImmpplleemmeennttaattiioonn IIssssuueess To realize the objectives and achieve the targets and milestones set out in the REMP, clear strategies and implementation issues will be addressed. The following is an overview of key strategies and implementation issues:
5.1 Policy, Legal and Regulatory Framework As the nation faces the challenges of ensuring the availability of easily sourced and competitively priced energy supply, it is incumbent on Government to create the appropriate policy framework of legal, fiscal and regulatory instruments that would attract domestic and international investments. Such framework will involve actions that all stakeholders must take to in order to achieve a sustainable energy future in which renewable energies play an important role. Clear rules, legislation, roles and responsibilities of various stakeholders along every stage of the energy flow from supply to end use sector are key elements of the overall policy framework needed to promote renewable energy technologies. Given the breath of the policy space, no single policy instrument is appropriate for every application or renewable energy technologies or socio-political conditions. Hence, a mix of appropriate and effective policy instruments are proposed. 5.1.1 Creating a Level Playing Field A key priority policy objective is to transform energy market so that it can function efficiently and effectively. In achieving this objective it is important to create a level playing field in the energy market by adequately addressing the present market distortions and giving incentives to market operators for the introduction of RE systems and encouraging consumers to have access to RE products. Without addressing these concerns it will be impossible for renewable energy technologies to compete. 5.1.2 Renewable Portfolio Standard (RPS) Beyond creating a level playing field, another key element of the overall framework is the setting of firm and realistic portfolio standards for renewable energies. Portfolio standards refer to minimum targets of renewable energy contents of the overall energy supply to specific areas. Essentially, a policy should be put in place that will require that a certain percentage of annual electricity and thermal energy use in the country comes from renewable energy. Such a portfolio will be all inclusive for all renewable energy forms in the country. It will set the minimum requirement of renewable energy in the overall energy mix in the country as well as the target quantity and year of entry into the energy mix. It will also include the target quantity and target year of each specific renewable energy form in the overall renewable energy requirement. In many cases, regulatory instruments, including legislation are often used to achieve the targets. 5.1.3 Fiscal Incentives Another element of the policy framework is the creation of innovative incentives to encourage the renewable energy technology supply companies at the initial stage. A

168
preferential policy of customs duty exemption for imported components of renewable energies will enhance their penetration into the national energy equation. Other most commonly applied incentives that may be necessary include tax credits, capital incentives (investment assistance in the form of grants and allowances, and operational cost grants), and long term preferential loans. Tax credits are given as exemptions, reductions, or accelerated depreciation. They can be used to reduce the investment costs of renewables and attract investors. Deductions of income tax and of profit tax for corporations and higher write-off possibilities in the initial years for investors or users (accelerated depreciation allowance) have in many countries proved to be powerful means to stimulate the use of renewables. Capital incentives are given, for example in the form of investment grants, for the purchase and installation of renewable energy systems. Direct investment grants are of particular importance when the technology to be assisted is still far away from being competitive, since other financial assistance such as loans and tax breaks by and large cannot sufficiently guarantee an economical operation. Direct grants offer the advantage that they directly increase the investor’s liquidity, and even small amounts often act as an important psychological incentive for investment. Their disadvantage however is that the grants are paid out regardless of the performance or extent to which the installation operates. Government strategy to provide incentives should not be limited to the supplier of the RET. To further encourage rapid dissemination of renewable energies, government strategy should also extend to provision of subsidies to the first cost or the investment cost to the end-user of the RET. This will enhance overall access to energy to a larger population of the poor in the society. Micro finance schemes are particularly useful vehicles to deliver such support. Any capital incentive policy should follow pre-established rules that are clear and transparent to all parties, and provide incentives for cost minimization. In addition, incentives should be temporary, with clear phase-out scheme. Incentives for renewable energy should be spread out over time in order to facilitate planning for producers and investors; the assistance should be dependable, with short processing time. Introduction of elements of competition into the financial support system prepares the producers of RET plants better for the market (e.g. the British Non-Fossil Fuel Obligation); and incentives should be reviewed on an ongoing basis to determine their impact and efficiency of use of funds. 5.1.4 Market Incentives With firm targets for renewable energy entry into the national energy mix established, the stage is set for a market to develop. However, the major obstacle of renewable energy development globally is creating a market for a product that is not yet cost-competitive. Hence, this calls for highly innovative incentive policies. This obstacle is being addressed in many countries through government-led initiatives and entrepreneurial response. Some of these initiatives include fixed price or fixed payment system and fixed capacity or fixed quantity target pursued by competitive mechanisms. payment system and fixed capacity or fixed quantity target pursued by competitive mechanisms.

169
The fixed price approach is often based on guaranteeing the renewable based power producers a fixed price that takes care of the generation cost, loan repayment, interest and a reasonable profit. International bench-marking helps ensure that prices are not too high. This approach, which is being practiced in Germany and Denmark, is non-competitive but easy to administer, and encourages a large amount of development and local ownership particularly under a deregulated electric power regime. The generous feature of this approach is that it is usually for a limited time as prices are subject to review and are typically phased down as the renewable sector gains economic strength through cumulative projects. The bidding for contracts in the fixed quantity/competitive bidding approach may be based on price per kWh, or on the amount of capital grant required. This approach which is being practiced in the UK, often results in the lowest prices for renewable energy based generated electricity and thus the lowest initial unit investment. Although, competitive approaches differ in detail, they have a common factor which is that, fewer renewable energy development projects come to fruition than is the case with fixed payment systems. Systems of competitive bidding for license areas or concessions, which has long been in use in the petroleum industry, or in rural electrification programmes in countries such as Chile can help to accelerate market development for renewable energy. The concessionary approach refers to the prior delineation of license areas big enough to support very large wind power or small hydro plant. Its major advantage is that, it enables the government in an orderly way to match invitations for large projects with declared national targets for power supply. By this, the government could plan and create a succession of very large power plants, the size of which could justify transmission over long distances from under-populated areas to areas where appreciable market exists. It also allows the government to determine the scale of the projects and the speed of their deployment. In the near and medium term of this Master Plan, it is proposed that the government adopts the fixed price or fixed payment approach due to its advantages which will most likely enhance access to renewable energy. Furthermore, the prices are still subject to review especially as the renewable energies gain economic strength through cumulative RE projects. In the long term, market franchise and free market system may be adopted. 5.1.5 Power Purchase Agreement Developers of RE based electricity projects e.g. wind farms or solar PV need to sell the generated electricity to electric utilities. Since most of the RE generated electricity is yet to be cost competitive with the fossil-fuel generated electricity, selling price will have to be carefully considered. That is because the RE based electricity developer will desire a price that will cover the production cost as well as some profit. At the same time, because the electric utility has the options of getting electricity from more cost-effective energy sources, it might not find it economically reasonable to buy from RE based producers at a higher price. Hence, the Power Purchase Agreement (PPA) is an important arrangement that needs to be put in place. This will allow the responsibilities and rights of the electric utility

170
and RE based producers to be clearly stated and agreed upon. The PPA sets the terms by which power is marketed and/or exchanged. It determines the delivery location, power characteristics, price, quality, schedule, and terms of agreement and penalties for breach of contract. Legally, binding long-term PPAs are a must as they provide comfort to the developers as well as lenders, and would also encourage the expansion of renewable electricity development in the country. Hence, a model PPA that would be generally applicable and acceptable to all stakeholders needs to be developed. There are two major institutional barriers to creating PPA. First, the utility grid/distributor holds substantial market power over small scale RE based producers. While the utility grid has many potential alternative sources of power, the wind energy producer is solely dependent on the grid for its market. There is therefore little incentive for the distributor to enter into negotiations in good faith, and there is even no incentive for the distributor to recognize the externalities from RE based production and thereby agree to pay a price higher than the avoided cost of power of equal value to its system from the least-cost alternative source. This can be resolved by using the Renewable Portfolio Standard earlier on discussed. Second, negotiations over terms are exceedingly complex and expensive and the expense itself is a barrier to even initiating an effort to establish a RE based energy project. However, this problem can be reduced by establishing a PPA that is subject to specific adjustments under specific conditions. For instance, since the major difficulty in developing a PPA is to determine the price at which power is to be transferred, then it is best to make a clear regulation about the nationwide unified price for RE based power. PPA is practiced in a well deregulated electricity market. Since Nigeria is already going into a deregulated electricity market, PPA will of necessity be an important component for the system operators. This has been taken into consideration by making it one aspect of the proposed electricity reform bill. It is hoped that in the implementation of its provision that some of the issues raised above will be taken into consideration. 5.1.6 Integration of RE into non-Energy Sector Policies Activities in the energy sector affect those in the other sectors because energy is an input into all economic activities. Similarly, policies in other sectors affect energy demand and supply. In order to achieve the overall developmental objectives, it is important to implement coherent and integrated policies. In particular it is imperative to incorporate renewable energy policies into non-energy sector policies. The key areas are in rural development including rural electrification, poverty alleviation, agriculture, transport, industry and infrastructural development. For example, government should encourage every housing unit to incorporate solar energy systems in their designs.
5.2 Institutional Framework In Nigeria, the present coordination between government ministries, parastatals and agencies responsible for rural development and renewable energy development is weak and rather complex. Unlike oil and gas, no agency has a clear mandate to oversee the development of renewable. Against this background, a new initiative is

171
required which should promote renewable energy in the country, and at the same time encourage efficiency in the provision and use of all types of energy form; raise the quality of management and training in energy provision and use; heighten public awareness of energy-related issues; encourage local institutional reforms to help meet policy goals; reduce environmental problems. 5.2.1 Establishment of Nigeria RE Development Agency There are a few ministries and government agencies whose roles and responsibilities affect renewable energy technologies. The Energy Commission of Nigeria which is under the Federal Ministry of Science and Technology has as one of its mandate the responsibility for strategic energy planning policy coordination and performance, monitoring of the entire energy sector, laying down guidelines on the utilization of energy types for specific purposes, developing recommendations on the exploitation of a new source of energy. Renewable energy is therefore a key component of this mandate. The Commission does not have an implementation mandate. Under the supervision of the Commission we have two renewable energy centres located at Sokoto and Nsukka with the mandate for research and development for renewable energy. Without doubt there is a need to strengthen the existing national renewable energy centers in terms of adequate funding for Research and Development (R&D). In addition the ECN as the apex energy coordinating agency should be reinforced. There are other agencies that have significant renewable energy components in their programmes; such as Nigerian Metrological Services (NIMET), Nigerian Building and Road Research Institute (NBRRI), Project Development Institute (PRODA), Federal Institute of Industrial Research Oshodi (FIIRO), Federal Ministry of Environment, Federal Ministry of Science and Technology, Federal Ministry of Power and Steel, and a few Universities and Polytechnics. In spite of the above mentioned agencies, there is inadequate institutional capacity, and lack of effective inter-sectoral communication and co-ordination to promote renewable energy use in the country. The creation of a Nigerian Renewable Energy Agency will go along way to address the institutional issues enumerated above. With time the Agency can grow into a full Ministry of Non-Conventional Energy as is the case in some developing countries like India. In addition the other levels of government (State and Local) should also be encouraged to set up units which will plan, manage and implement renewables energy systems. For effectiveness there should be coordination between the federal, state and local government levels to avoid duplication of efforts and to learn from each other’s experience and promote rapid proliferation of success stories. 5.2.2 Standardization of RE Products Industry standards and permits can prevent inferior hardware from getting into the marketplace and eroding investor and customer confidence, while also addressing potential sources of opposition such as noise and visual impact (applicable to wind farms and solar thermal on rooftops). Therefore, Standard Organization of Nigeria (SON) should establish RE standards in collaboration with relevant research institutes which can be designated as RE Technology Centres, and relevant stakeholders. In addition, such test centres will gather data on performance of the deployed RET so that their suitability to local conditions is known. Such information will be necessary when planning to adapt imported technology to suit local conditions.

172
5.2.3 Encouraging the emergence of RE Professional/Industry Associations In many countries the emergence of professional and industry association has been a key driving force for the promotion of renewable energy technologies. In Nigeria only one of such professional body exists - the Solar Energy Society of Nigeria. Other professional associations for wind energy, small hydro or biomass will be useful. In addition the setting up of trade /industry associations will certainly help provide pressure/advocacy group which will develop the renewable energy industry. For instance, the establishment of the Nigerian Wind Energy Association (NIWEA) will create a forum for the emerging wind energy industry group to interact with other similar existing associations on wind energy both on the regional and national levels such the European Wind Energy Association (EWEA), Indian Wind Energy Association (INWEA). The trade association provides another forum for exchange of ideas and discussion on common problems facing the industry.
5.3 Economics and Financing Even though they have low O&M costs, most RETs have high up-front capital cost compared to their conventional energy alternatives. Apart from the higher capital costs most RET face the barrier of being perceived as untested technologies. Given these twin barriers to RET, investors face higher risks and uncertainties when making investment decisions. Therefore in a capital constrained economy like Nigeria, where there are many competing demands for available scarce capital resources, the promoters of RET face the problems of high transaction costs and restricted access to capital. The RET also faces some economic barriers from the end users, especially the poor. Given the low income and therefore limited purchasing power of the poor, the big challenge is to find ways to empower the poor to pay upfront costs of new RETs. Therefore, new and innovative financial tools and measures are needed to address this barrier. 5.3.1 Suspension of RE Import Duties Most RET are imported e.g. solar PV, wind turbines, and will still be imported in the near future. The current import duty tariffs on their components are high, thereby contributing to high capital cost. As a cost reduction strategy it is proposed that government should impose zero import duties and taxes on RET in the near and medium term. The implementation of this strategy has to be monitored very closely to avoid unscrupulous business men from taking undue advantage of this tariff waiver by fraudulently reclassifying other imported goods as RET. In the long term, cost reduction strategy will revolve around having a substantial local manufacturing capability and efficient production system. This can only happen if the nation embarks on a comprehensive capacity development initiative and R&D programme. 5.3.2 Establishment of a Renewable Energy Fund (RE-Fund) In order to implement various incentives, initiatives and programmes that will promote the adoption of RET, it is proposed that a RE Fund be created by

173
government. The funds will provide resources for providing incentives, micro-credit schemes, training, R&D, building up rapidly the initial market volume, local expertise, user awareness, appropriate technology adaptation, quality standards and entrepreneurial activities. One major sustainable source of financial resources for the Fund is to impose a 0.1% of money accruing from export crude. The Fund is to be managed by the proposed National Renewable Energy Agency (NREA).With time, there should be a shift from capital based to production based incentives. 5.3.3 Funds from Multilateral and Donor Communities Multilateral organizations such as the World Bank, UN, International Finance Corporation, African Development Bank, fund renewable energy projects. In particular the Global Environment Facility (GEF) has a strong portfolio of renewable energy projects. For instance, GEF has funded many PV projects all over the world. Within the Kyoto protocol of the United Nations Framework Convention on Climate Change (UNFCCC) the Clean Development Mechanism (CDM) is also a source of funds for RET. Unfortunately while many developing countries have benefited from these global initiatives, Nigeria is yet to fully participate. There is therefore the need to strengthen the focal points for GEF and UNFCCC in Nigeria so the country may submit project proposals for funding. It is imperative that Government makes contacts, cooperates or enters into global partnerships with these agencies for needed support and funding. 5.3.4 Innovative Credit Schemes One of the major challenges of poverty reduction is how to increase energy services to the poor, especially in the rural areas. The poor in rural areas have limited ability to pay the high upfront cost of energy systems. Demand load in such poor and remote areas are usually very low. Hence, rural energy supply enterprises face a high-risk, low margin, low volume and high transaction costs. Historically, affordability of rural energy has been addressed through government subsidies, donor programmes and private cash sales of small systems. However the weight of evidence in Nigeria as in many developing countries shows that this model has not brought about the required increase in access to modern energy for sustainable development. This is a major drawback for RET because of high up-front capital cost. Converting high up front payment to streams of small payments over along time is a possible strategy to overcome this problem of high initial cost. This will entail granting of credits, which cannot be done effectively without a developed, and supporting financial system. Therefore credit risk is a major issue. Even when the credit issue can be surmounted, it is important that energy services are used to generate income. If the rural poor demand energy services only for lighting, listening to radio or watching TV, rural households will not have sufficient income to pay for the energy services on a sustainable basis. This approach will end up “lighting up poverty”. Beyond micro credit and income generation, other approaches include: vendor-supplied credit, leasing, cooperatives, and rental models. Mainstreaming and integrating energy projects into non-energy sectors such as water supply, sanitation, health, cottage industry and education will also ensure the effectiveness of promoting renewable energy utilization for development. Avoiding stand alone renewable energy projects in the rural area is the beginning of wisdom in tackling the lack of energy access and poverty nexus in the rural setting.

174
5.3.5 Creating an Enabling Investment Climate The investment needed for RE development cannot be provided by government sources alone. In any case given the drive towards reforms that emphasizes liberalization, privatization and restructuring, private sector (local and foreign) investments will be needed. Therefore the creation of enabling environment conducive to investment will have to be put in place. Also adequate provision of infrastructural facilities should be provided to reduce the cost of doing business in the country. Related to this is the need to involve the local financial sector in RE development. This will certainly entail awareness and capacity development for operators in the financial sectors. In addition, the scope of ventures capital financing (e.g. National Risk Fund PLC) should be expanded to include investing in emerging RET.
5.4 Capacity Building Human and institutional capacity building at all levels is required to sustain the scientific, engineering and technical skills relevant for the design, development, fabrication, installation and maintenance of RETs. In particular, capacity building in four areas are most essential, namely; training of manpower to install, operate and maintain RETs, development of manufacturing capabilities, development of critical mass of scientists, engineers, economists etc. for R&D, and design and effective functioning of institutional framework. A comprehensive training programme including training the trainers, vocational training, short courses, and workshops will be designed and implemented in the various geographical zones of the country. This will involve creating training and extension centres in the country. The breadth of the training programme must recognize the multidisciplinary nature of RE, and therefore there must be conscious efforts to include training not only for engineers and technicians but also for other disciplines especially social sciences and law. One effective way of developing capacity is to build training components in to all donor funded demonstration projects. The educational system has a major role to play in the overall capacity building. Hence RE energy education should be integrated as part of the syllabus of secondary and tertiary levels. Capturing the interest and attention of young people is also a vital stimulant to the acceptance of the RE technologies involved. Another way of doing this is the introduction of RE technologies both for electricity and thermal use in the energy mix of both secondary and tertiary institutions.
5.5 Public Awareness Awareness of the opportunities offered by renewable energies and their technologies is low among public and private sector stakeholders. This lack of information and awareness creates a market distortion that results in higher risk perception for potential renewable energy projects. The general perception is that RET is not yet a mature technology, hence it is only suited for niche market and even then it will require heavy subsidy to make it viable.

175
There is therefore a need for dissemination of information on RE resource availability, benefits and opportunity to the general public in order to raise public awareness and generate activities in the sector. Such process is key to building public confidence and acceptance of RET. Providing information to selected stakeholder groups like the investors can help mobilize financial resources needed to promote RET projects. The proposed NREDA and non-governmental organizations (NGOs) can assist in increasing public awareness through the following strategies:
• Information brochures on dissemination of renewable energy systems • Mass media coverage of pilot projects. • Aggressive country-wide effort campaign approach on the dissemination and
implementation of RE systems. • Enlightenment campaign by NGOs and environmental managers. • Sponsored documentaries, programs, adverts, billboards, etc. in the electronic
and print media. • Using opinion molders as vehicles for dissemination of RE
technologies/systems. • Using Website to disseminate information.
5.6 Inter-Agency Collaboration (including public-private partnership) As already discussed, the present coordination between the government ministries, parastatals and agencies responsible for rural development and renewable energy development is weak and rather complex. The current governance structure suffers from the responsibility for renewable energy development not being clearly assigned to a single government institution as is the case with oil and gas. A National Renewable Energy Development Agency has been suggested as an implementing Agency, while the Energy Commission of Nigeria will retain her responsibility as the apex policy formulation and monitoring body. There should be an inter-agency forum to harmonize and coordinate the activities of the various units not only at the Federal but also at the States and local government level. One such forum is the Technical Committee of the Energy Commission of Nigeria which has representatives from many Ministries, parastatals and professional bodies. Empowering such a committee to be more functional will certainly allow for cooperation and coordination of policies and programmes.. The Technical Committee could be expanded to include states and local government representatives. Another kind of coordination that is necessary is between public and private sectors. First, it is important to engage the private sector in production, marketing and adoption of renewable energy technologies, creating a market environment where companies innovate, compete and ultimately profit from these investments. Second, private sector participation and ownership in the renewables development process increase political support and the likelihood of success. There is therefore the need to harmonise the roles of the public and private sector. Market facilitation organizations which are public-private entities that support market growth through networking, partner matching, information dissemination, market research, user education, business-deal identification and facilitation, technical assistance, consulting services,

176
financing, and policy advocacy or advice (e.g. Winrock International) are necessary to support the development of Renewable Energy in the country. Moreover, great demand exists for international cooperation, experience exchange, coordination of programmes, technology transfer, and collaboration with donor and financing organizations and institutions. Action at the national level must be supplemented at the bilateral, multilateral, and regional levels (research, joint ventures, joint projects, etc.). Such international collaboration and cooperation often leads to transferring knowledge and to developing local skills for producing and deploying components of and entire renewable energy systems.
5.7 Research and Development The past three decades have seen the development and maturing of RET. This process has been possible largely through extensive global programs of research, development, demonstration, (R,D&D) and financial incentives most especially in the developed countries. If Nigeria is to optimally benefit from the application of RET it must have a credible R&D infrastructure for adapting and modifying imported RET to local conditions, set a stage for innovation and local manufacturing of RET, derive applicable business models, and appropriate policies. R&D is also needed to address the social and cultural dimensions of deploying RET to secure their contribution to sustainable and participatory development. Designing and ensuring the success of RET R&D programmes will require the articulation of near-term as well as long-term goals and targets. 5.7.1 Funding of Research Government needs to make adequate funds available to the two Energy Research Centres on renewable energy in the country as well as other individuals and research groups in institutions of higher learning involved in similar research work. A substantial part of the money that comes into the proposed Renewable Energy Fund should be channeled into R, D & D. 5.7.2 Collaborative Research between Industry and Academia The synergy of both private sectors initiated and supported R & D and public sector funded R & D cannot be overstated in any sector. Therefore targeted industry-academic research collaboration programs should be encouraged with financing from the private sector. Another type of collaborative efforts involving joint projects between local researchers and their counterparts in other sub-regions and internationally will help to sharpen the local researcher’s skills to the benefit of local industry. 5.7.3 Commercialization of R&D Output Research and development should be accompanied by preparation for commercialization so that successful projects can rapidly be put to practical use. Research is not an end in itself. The purpose of R&D is to produce technologies for practical use. The final stage of a successful R&D programme is commercialization, the movement of a functioning technology into the marketplace. As scientific and technical advances are made, economic and institutional barriers to commercialization

177
should also be addressed, so that if technical success is achieved in R&D programmes, commercialization can take place rapidly.
5.8 Monitoring and Evaluation Effective monitoring and evaluation is crucial to realizing the objectives and targets of the REMP. This will provide tools to measure progress against set milestones and provide opportunities to review strategies It is therefore essential that a formal monitoring and evaluation strategy be put in place to ensure the success of the implementation of the REMP. 5.8.1 Establishment of National Steering Committee and State Coordinating Units To continuously provide monitoring and evaluation of the programmes under this master plan, a National Steering Committee (NSC) representing key stakeholders will be constituted. The NSC will ensure that programme are focused, that milestones are reached and that the overall objectives are attained. It is proposed that the Energy Commission of Nigeria (ECN) serve as the secretariat of NSC and charged with the responsibility of consolidating work programmes and budgets. For effective monitoring of individual projects in their States a coordination unit (CU) should be established in each state. The NSC will oversee the work of the CU and evaluate, consolidate, and harmonize the reports coming from the different CUs. An annual workshop should be held to consider progress made and disseminate lessons learnt to the wider public.
178
Chapter 6: Risk Identification and Analysis Several factors will challenge the successful implementation of planned activities and milestones and may jeopardize the realization of the targets and objectives of the REMP. These potential risk factors include policy and political changes, uncertainties in the energy market, instability in the macroeconomic framework, international shocks, operational risk (inadequate public awareness, human resources and raw materials availability) and risks associated with neglect of infrastructure. Identification and analysis of these risks will allow stakeholders in the renewable energy economy to factor in these risks, or seek alternative approaches to reaching national renewable energy targets and objectives.
6.1 Policy and Political Risks Several policy and political risks confront the renewable energy sector. These risks include the following:
• Outlined policies not adopted. Sound policies elaborately developed by government might at the end of the day not be adopted, and when adopted may not be implemented to significant levels. Several policy documents, including Vision 2010, several Rolling Plans and the recent NEEDS and SEEDS documents have reserved key roles for renewable energy. Such policy attention may not necessarily translate into tangible changes in actions of government. Strategies in addressing such implementation risks include the setting of realistic targets, identification of make-or-break implementation issues, outlining concrete activities to address risks and proactively securing the political will to reach agreed targets.
The proposed RE bill which is currently before the National Assembly should be passed in to law in order to overcome some of these problems.
• Policy inconsistency, instability and contending interests within Government.
A certain risk will prevail when elements of the REMP are not properly aligned to the overall economic policy thrust of the government or are at cross-purposes to some broader energy policy objectives. This may result in policy inconsistencies and poor performance of the Master Plan. Inconsistencies may also result with frequent changes in policy thrusts, for instance in trade policies. Endemically unpredictable, particularly in the application of tariffs and exemptions, transaction costs at ports, customs clearance procedures, and the use of import bans on goods, merchandize, products, equipment and production machinery; tariff and non-tariff barriers poses great risk on investment in RE.
When government is irresolute as a result of poor planning or pressure from contending interests, the overall objectives of the Master Plan may be compromised. To address these risks, it is not enough to design rational and ambitious plans, meeting the concerns and interests of all relevant stakeholders is important in reducing potential conflicts and inertia. Greater

179
chances of success will be achieved when key stakeholders participate fully, and where implementation agencies are properly equipped.
• Risk of policy implementation short sightedness. A certain degree of policy
short sightedness characterizes the implementation of policies of the country. Even when energy policy documents encourage long term planning, few concrete actions are taken to build the groundwork for meeting future security, economic, social and environmental challenges. The large income from finite hydrocarbons and present abundance of conventional energy resources may becloud the future challenges of a growing population and declining resource base. Accelerated energy policy reforms where pricing increasingly reflect the opportunity cost of resource use will stimulate conservation and a price regime that encourages investments in renewables.
• Lack of continuity in government policies. The present government has
embarked on several reforms leading to increased liberalization of the energy market, and potentially creating opportunities for renewable energy to make increased market entry. Uncertainties loom over the policy direction of the government that will succeed the present one. In an atmosphere where continuity of policy is often lacking, the risk of a new government discarding prevailing reforms is real. Accelerating the pace of implementation of the REMP and rapidly institutionalizing its activities will assist in entrenching the key activities and achieving its objectives.
• Socio-cultural conflicts. Local conflicts and trade disputes often interrupt
supply of some RE resources and end products. Restive youths and armed bandits, long-drawn trade disputes, electoral malpractices and endless election petitions – all create a political atmosphere that is not supportive of investments, including potential renewable energy businesses.
6.2 Market Risks Price distortions, poor regulatory environment and inadequate infrastructure characterize current energy market conditions in the country. This has reduced the scope for competition, growth and innovation in the market. Such market conditions create a disincentive for market entry for mature RE technologies such as solar photovoltaic, small scale hydro and wind power; and make hydrogen, ocean and geothermal energy systems prohibitive. The energy market in Nigeria is on the verge of vital reforms. These include the power sector reform, solid minerals, oil and gas and specific initiatives on renewable energy. The outcome of these converging agenda will introduce a more vibrant energy market that will stimulate growth, build infrastructure, increase competition and create a basis for investments in tomorrow’s energy systems. The innovations that will follow will be important in reducing market constraints for RE systems. However, growing the renewable energy sector will depend on a stable macroeconomic framework. Already the NEEDS outlined a number of risks that are inherent in the Nigerian economy, and they include:

180
• high cost of doing business in Nigeria which constrains investment and industrial production;
• weak infrastructure; poorly implemented incentives, especially fiscal and tariff regimes;
• massive smuggling, counterfeiting, and dumping of products; • lack of standardization required for international competitiveness; • unfavourable international trade rules; • national trade policy stance which is endemically unpredictable, particularly in
the application of tariffs and exemptions, transaction costs at ports, customs clearance procedures, and the use of import bans on goods, merchandize, products, equipment and production machinery;
• tariff and non-tariff barriers which on the average exceed those of other ECOWAS countries;
• corruption and public sector mismanagement of policy programmes and projects;
• excessively high percentage of the population in the poverty bracket and • near insignificant contribution of the manufacturing sector to the GDP –
NEEDS document states that manufacturing accounts for less than 1 per cent of Nigeria’s GDP.
These factors constrain the development of more rational and liberal macroeconomic framework that is supportive of market development for renewable energy. The following specific factors constitute major risks for the success of the REMP:
• Weak purchasing power. The level of poverty in Nigeria is high, and increasing. This reduces opportunities to embark on fuel switching from traditional to modern renewable uses. Certain renewable technologies are comparatively expensive. Even low cost improved woodstoves seem increasingly beyond the affordability of the extreme poor that make up about 70 percent of the population. The risk of increasing poverty will therefore compromise the objectives of the REMP. The situation may change if current reforms in years to come begin to reduce poverty, and when middle class preferences change to greener energy options. Increased emphasis on the provision of micro finance will also assist in boosting the ability of the poor to afford new and cleaner energy options.
• Inadequate access to investment capital. There is a major shortage of
investment capital, leading to high interest rates. Several promising projects, especially in new areas like renewable energy investments suffer setbacks due to the scarcity of funds from banks and financial institutions. The reforms in the financial sector aimed at creating more solid financial institutions and also warehousing some of Nigeria’s current external reserves will help bolster the financial market and improve overall access and cost of credits.
• High initial cost for electricity generation. Even though, conventional energy
prices are assumed to hold back the development of alternative energy supplies, but the fact of the matter is that the RE systems for electricity generation are more expensive at the initial investment. However in the long run, the capital investment is cheaper than the conventional sources.

181
• Poor infrastructure. Poor infrastructure increases transaction costs and
reduces the profitability of businesses. Roads, telecommunication – and in fact, access to energy is important for local manufacturing of renewable energy systems and components.
• Macroeconomic factors. Changes in the Nigerian economy or contagion from
the global economy can result in significantly unstable conditions for the Nigerian currency. The generally upward movement of the exchange rate of the Naira to all international currencies, high interest rate, unfriendly tax regime and exercise duty and other levies are great risk to local manufacturing industry, which needs to source in the international market for machinery, parts, and in many cases raw materials that are not locally available. Currency depreciation poses major risks for investment plans by both private and public sectors. It is therefore important that the REMP is viewed within a broader macroeconomic context where exchange rate stability is important in long-term efforts to develop the renewable energy sector.
• Non-implementation of financial incentives. The REMP’s vision is premised
on the immediate imperative to make the playing field among competing energy sources more even. It also envisages a rapid increase in financial incentives to support the growth and development of renewable energy in Nigeria. However, there is always a risk that the implementation of these agreed incentives might fall short of the requirements of the sector. Non- implementation or withdrawal of government incentives such as subsidies would result in low return on investment, which could ultimately lead to project abandonment.
• Willingness to pay. Unfortunately, Nigeria has not been able to develop the culture of prompt loan repayment as many other African countries especially in southern and eastern sub-regions have successfully done. This is a great threat and risk to renewable energy market development, as loans would necessarily have to be repaid in order to sustain and expand the market. The fund managers also are a great risk to the market as examples of failed banks and national project funds that have been mismanaged are many. The state of public utilities, are worrisome glaring example of public reluctance to pay bills. Utility’s unintelligible tariff and billing have to be avoided in the new renewable energy market.
• Counterpart funding. Projects requiring counterpart funding have found
Nigeria wanting in the past, with the result that programmes and projects get off to a delayed or slow start and in some cases a no-start at all. Investing in realistic projects and increased political will to back them up is essential.
6.3 International Development Risks In an increasingly interdependent world, globalization in the movement of capital, technology, goods and ideas transcend boundaries and subject plans like the REMP to pressure. Of particular importance to the success of the REMP is the global market for

182
renewable energy technologies and the actions of other governments and international agencies.
• Global market risks. Several international developments with strong impacts on the successful implementation of the REMP are outside Nigeria’s control. For instance, while the objectives of the REMP are premised on lowering the cost of renewable energy technologies, such as PVs, phenomenal growth in demand from developed countries, primarily USA and Germany, have kept the price of solar modules at a high level. Local incentives in other countries can both influence the prices of our renewable import, and will also determine the appetite of major manufacturers of these technologies to venture into our markets.
• International cooperation risks. Multi-lateral agencies such as the World
Bank, UNDP, ADB as well as bilateral agencies such as USAID have contributed greatly to lifting renewable energy from relative obscurity to the mainstream of energy policy making. Much of the planned activities of the REMP are expected to be financed from international sources of funding. This constitutes a major risk factor that must be managed to prevent the crumbling of the main pillars of the REMP. Managing other related issues such as democracy, economic reforms and good governance is important in securing international support for clean and renewable energy programmes.
6.4 Standards and Quality Control Risks A major constraint to the development of the renewable energy market in Nigeria is the poorly established standard and quality control of locally manufactured and imported technologies. Creating quality assurance is a precondition for building consumer confidence and in growing the market for renewable energy. Three important dimensions to issues of quality include the perception potential users, poorly developed regime for standard setting and testing as well as professionalism among operators.
• Perception of untested technologies. Much of the technologies envisaged in the REMP are “new”, or non-conventional. This is so much the case for improved fuelwood burning stoves as they are for biogas plants or solar water heaters. Potential users are worried about their efficacy or complexities in using them. The perception that most of these systems are untested technologies can only countered by increased public awareness and policy reform that makes them more affordable.
• Poorly developed standards and testing procedures. Presently, there are no
testing centers for both locally made and imported renewable energy technologies. Consequently the requisite regulatory environment does not exist. This results to sub-standard technologies that harm the market. The REMP recommends the strengthening of agencies responsible for quality control and standards for product entering the Nigerian market with emphasis on RE technologies.

183
• Entry of unqualified people in the field. The lack of professional associations and strong entrepreneurship in emerging renewable energy businesses, particularly solar PV and improved woodstoves result in people without the relevant professional background to enter the industry. They achieve bad publicity for the industry and make market growth difficult.
6.5 Research and Development Risks A vibrant R&D capacity and infrastructure is crucial in achieving several objectives of the REMP. Building the capacities to launch and sustain programmes are major concerns.
• R&D capacity risk. Achieving the targets of the RE will depend on the identification of appropriate resource centres and professionals to lead the long term R&D programmes. The conditions of Nigeria’s R&D institutions fall short of expectations in several respects, including funding, infrastructure, professional morale, etc. Poor economic conditions in the country have also reduced the stock and quality of existing scientists. Achieving set targets and milestones are therefore difficult under these conditions.
Identifying vibrant resource centres can assist in mitigating R&D capacity risks. Such a long term and collaborative programme should be overseen by a strong board and should be submitted to periodic monitoring and evaluation.
• R&D funding risk. Funding for R&D has always been in short supply in
Nigeria. This may be more so for research on futuristic energy systems. Leveraging adequate financial resources to launch and sustain R&D programmes, including the proposed NERDP will therefore be challenging.
Part of the failure to raise enough financial resources for R&D efforts in Nigeria is the over-dependence on public budgets. A mitigation strategy will focus on expanding the scope for funding by actively engaging international agencies, the private sector and fostering international collaboration among R&D centres.
6.6 Environmental Risks Despite the known fact that renewable energy represents a cleaner alternative, certain environmental risk occurs, and these include:
• Distortion of the environment. Large and small hydro plants are known for their impacts on fish life. Wind turbines are also likely to affect bird life and cause noise pollution. Poorly managed biofuel consumption may also result deforestation. In some situations, the production of liquid fuels from biological sources may consume so much conventional energy that their environmental effects might be questionable. In addition to these environmental externalities, what to do with these technologies when their life span expires is also an important issue. Several environmental tools could be useful in addressing these concerns, and they include environmental impact assessment, environmental audits and environmental strategic planning.

184
• Human dislocation and resettlement. Hydro power plants are known to cause
dislocation to local livelihoods, including farming, fishing and transportation. In severe cases, they lead to resettlement of communities. These environmental trade-offs must be properly assessed, and alternative approaches to meeting energy needs considered.
• Esthetics. Several clean and renewable energy forms unfortunately might not
be so pleasant to behold. Wind farms, for instance arouse significant resentment by environmentalist, as they seem to deface natural environments. Large PV farms as currently obtainable in Germany and the US also invoke such concerns, handling of domestic waste such as excreta for biogas generation will as well pose some problems.

185
AAnnnneexx:: PPrroojjeecctt CCoonncceepptt NNootteess The following concept notes provide ideas on potential renewable energy projects on a range of energy sources and technologies. The concepts presented here are not exhaustive. The objective is to develop a repository for project ideas that could be further developed and implemented by any stakeholder alone, or in partnership with others. Potential Project Concept Notes: Biomass 1. Project Title: Biomass Energy Programme 2. Potential Implementation Organizations: Federal, States and Local Government, Federal Ministry
of Agriculture and Natural Resources, Rural Development Agencies, Federal Ministry of Power and Steel. Energy Centres and NGO’s. To be supervised by the ECN.
3. Potential Implementation Partners: UNIDO,UNDP, IDB, World Bank WHO and Private Sector. Renewable Energy Sub- Sector (s)
Biogas and other Biomass
4. REMP Strategic areas:
- Biogas Diffusion Programme - Establishment of Wood Farm
lands - Establishment Of Biomass Power
Plants - Establishment of Decentralize
Biomass power Plants for Industrial Applications
5. Implementation Period: 2005 – 2025 6. Project Overall Rationale and Objectives: Biomass has several attractions as energy source.
Unlike conventional fossil fuel, resources, which are unevenly distributed over the earth’s surface and are finite in magnitude, biomass is a widely available resource that can be produced renewably. Biomass conversion appears to be more economically attractive in most cases. Hence, serious thoughts must be given to the idea of using Biomass as an energy source. Studies have shown that Biomass utilization as energy has significant advantages and it deserve serious attention.
7. Project Specific Objectives: To promote biogas utilization among Nigerians especially in the rural areas and to contribute to the national grid and also make our industries less dependent on national grid.
8. Expected Outcomes: The project is expected to generate biogas and electric power from biomass for various applications in the country.
9. Planned Activities to Achieve Outcomes: To make biogas technology popular among Nigerians, there is the need for all the three tiers of government to embark upon distribution of biogas plants to a greater extent in order to promote its utilization especially in the rural areas. Biogas plants, if correctly operated and maintained, would improve the technical abilities and economic capacity of Nigerian farmers and rural dwellers. To do this, the government should first identify all potential project sites in the country and available biomass resources in each area and then jointly try to construct more than 6,000 biogas plants across the country each year. The Government through the relevant agencies should also establish biomass power plants, that can contribute to the National grid. The government should also establish 100,000 hectares of woodland each year within the project period in order to establish national reliance on wood for electricity generation in the country.

186
10. Project linkage to national priorities, action plans and program: The project is a very important project and should not be left out in the National Development programme. 11. Stakeholders involved in Project: Government agencies involved in rural development, rural
dwellers, private sectors, Ministries of Agriculture, Power and Steel, petroleum, and Solid Minerals, States and Local Governments and Research Institutes.
12. Implementation Arrangement: The Government at State, Local and Federal level should provide the funds, while the Energy Commission of Nigeria should co-ordinate. To be able to implement this project, the Federal Government through relevant government agencies, NGO and International organization should be able to carry out the following activities prior to the commencement of the projects:- Public Consultations and Education, Identification of Project Sites, Assessment for Environmental Consequences of Biomass Energy Conversion, Identification of Research and Development needs, Training and Manpower Development Programmes and Adopt the Master Plan on Renewable Energy Activities.
13. Estimated Budget and Information on how costs will be met: About N3.5B should be made available to the co-ordinating agency each year between 2005 – 2025 for the execution of this project. The fund can be raised through budgetary provisions and by taxing all the industries operating in Nigeria 2% of oil revenue and 5% of profit generate from NEPA could be set aside for this project also. Potential Project Concept Notes: Biomass Continued
1. Project Title: Improved Re-enforced Clay Stove Development and utilization Programme 2. Potential Implementation Organizations: Energy Commission of Nigeria in Collaboration
with Ministry of Environment and Ministry of Agriculture (Fed. Dept. of forestry, FEPA), CERD, SERC ADP and NGO’s
3. Potential Implementation Partners: Federal Ministry of Agriculture and Federal Ministry of Environment, FEPA, CERD, SERC ADP and NGO’s
Renewable Energy Sub-sector (s)
Improved Re-enforced Clay Woodstoves
4. REMP strategic areas. Ecologically balanced environment through energy utilization. Area (s) of Intervention Energy efficiency for
economic growth and Job creation.
5. Implementation Period: 2005 – 2025. 6. Project Overall Rationale and Objectives Factors such as problems of fire wood alternativewhich is usually obtained by self collection with associated problems of accesibilility and affodability of alternative fuels called for an improvement in our existing cooking practice. The overall rationale istthe judious use of fuelwood, reduction in cooking time and to eliminate smoke hazards to our women folk through the intergration of chimney to the stoves 7. Project Specific Objectives: Reduction of firewood through the efficient energy cooking systems conservation and effective utilization of other biomass as cooking fuels. Development of fast growing tree species to supplement the existing firewood consumption’s. 8. Expected Outcomes: To revolutionise the cooking systems through the use of efficient woodstoves particularly in rural areas of Nigeria, thereby reducing the quantity of fuelwood-wasted daily during the cooking activities as a result of heat losses. 9. Planned Activities to Achieve Outcomes: - Establishment of capacity building programme for the improved wood stoves projects. - Establishment of standards to cater for the nation’s cooking culture.
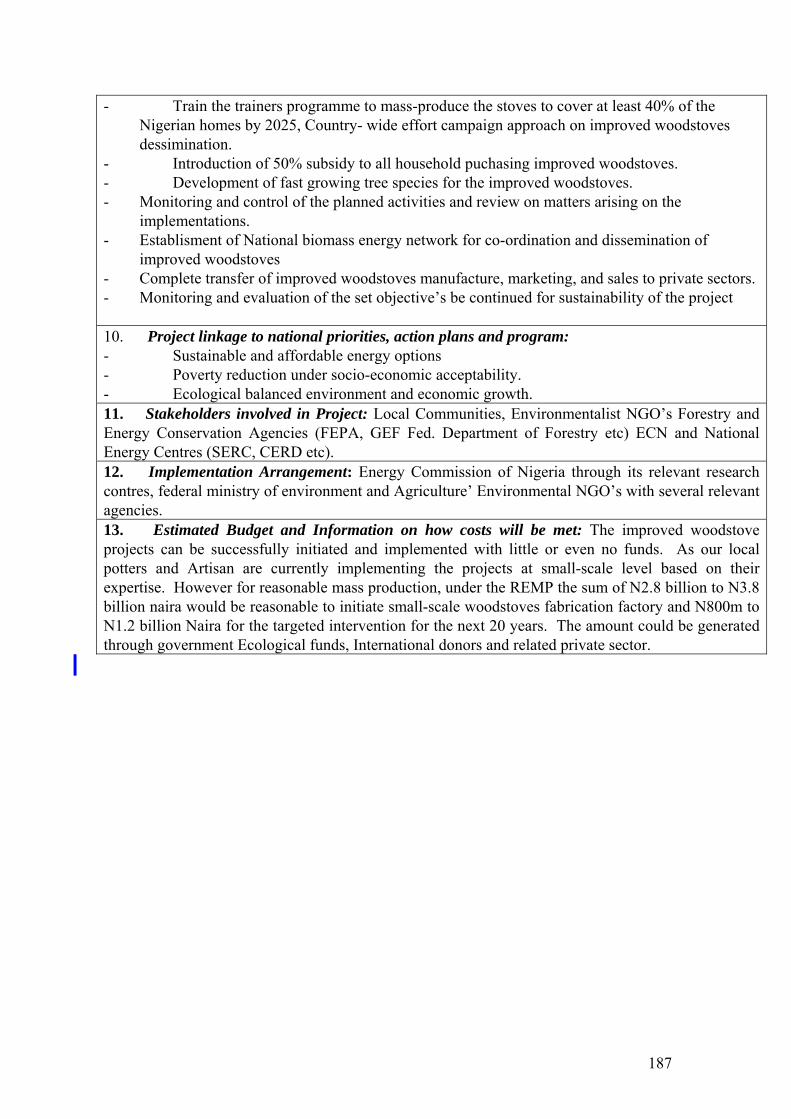
187
- Train the trainers programme to mass-produce the stoves to cover at least 40% of the Nigerian homes by 2025, Country- wide effort campaign approach on improved woodstoves dessimination.
- Introduction of 50% subsidy to all household puchasing improved woodstoves. - Development of fast growing tree species for the improved woodstoves. - Monitoring and control of the planned activities and review on matters arising on the
implementations. - Establisment of National biomass energy network for co-ordination and dissemination of
improved woodstoves - Complete transfer of improved woodstoves manufacture, marketing, and sales to private sectors. - Monitoring and evaluation of the set objective’s be continued for sustainability of the project 10. Project linkage to national priorities, action plans and program: - Sustainable and affordable energy options - Poverty reduction under socio-economic acceptability. - Ecological balanced environment and economic growth. 11. Stakeholders involved in Project: Local Communities, Environmentalist NGO’s Forestry and Energy Conservation Agencies (FEPA, GEF Fed. Department of Forestry etc) ECN and National Energy Centres (SERC, CERD etc). 12. Implementation Arrangement: Energy Commission of Nigeria through its relevant research contres, federal ministry of environment and Agriculture’ Environmental NGO’s with several relevant agencies. 13. Estimated Budget and Information on how costs will be met: The improved woodstove projects can be successfully initiated and implemented with little or even no funds. As our local potters and Artisan are currently implementing the projects at small-scale level based on their expertise. However for reasonable mass production, under the REMP the sum of N2.8 billion to N3.8 billion naira would be reasonable to initiate small-scale woodstoves fabrication factory and N800m to N1.2 billion Naira for the targeted intervention for the next 20 years. The amount could be generated through government Ecological funds, International donors and related private sector.

188
Potential Projects Concept Notes: Woodstoves 1. Project Title: Community based improved wood burning stoves programme 2. Potential Implementation Organizations: Energy Commission of Nigeria in Collaboration
with Ministry of Environment and Ministry of Agriculture (Fed. Dept. of forestry, FEPA), CERD, SERC ADP and NGO’s
3. Potential Implementation Partners: Federal Ministry of Agriculture and Federal Ministry of Environment, FEPA, CERD, SERC ADP and NGO’s
Renewable Energy Sub-sector (s)
Improved community based woodstoves
4. REMP strategic areas. Ecologically balanced environment through energy utilization.
Area (s) of Intervention Energy efficiency for economic growth and Job creation
5. Implementation Period: 2005 – 2025. 6. Project Overall Rationale and Objectives Factors such as problems of fire wood alternative which is usually obtained by self collection with associated problems of accessibility and affordability of alternative fuels called for an improvement in our existing cooking practice. The overall rationale is the judicious use of fuelwood, reduction in cooking time and to eliminate smoke hazards to our women folk through the integration of chimney to the stoves 7. Project Specific Objectives: Reduction of substantial amount of fuelwood through the efficient energy cooking system in community based setup. Optimum conservation of energy through the efficient community based brick stoves. Development and utilisation of fast growing free species to supplement the existing firewood consumption. 8. Expected Outcomes: To reduce pressure on the existing forest through the efficient utilization of cooking fuel of an improved version of stove with expected reduction in consumption by at least 30-40% before 2025. 9. Planned Activities to Achieve Outcomes: - Establishment of capacity building programme for the improved wood stoves projects. - Establishment of standards to cater for the nation’s cooking culture. - Train the trainers programme to mass-produce the stoves to cover at least 40% of the
Nigerian homes by 2025, Country- wide effort campaign approach on improved woodstoves dissemination.
- Introduction of 50% subsidy to all household purchasing improved woodstoves. - Development of fast growing tree species for the improved woodstoves. - Monitoring and control of the planned activities and review on matters arising on the
implementations. - Establishment of National biomass energy network for co-ordination and dissemination of
improved woodstoves - Complete transfer of improved woodstoves manufacture, marketing, and sales to private sectors. - Monitoring and evaluation of the set objective’s be continued for sustainability of the project 10. Project linkage to national priorities, action plans and program: Sustainable and affordable energy options - Poverty reduction under socio-economic acceptability. - Ecological balanced environment and economic growth.

189
11. Stakeholders involved in Project: Local Communities, Environmentalist NGO’s Forestry and Energy Conservation Agencies (FEPA, GEF Fed. Department of Forestry etc) ECN and National Energy Centres (SERC, CERD etc). 12. Implementation Arrangement: Energy Commission of Nigeria through its relevant research centres, federal ministry of environment and Agriculture’ Environmental NGO’s with several relevant agencies. 13. Estimated Budget and Information on how costs will be met: The improved community based wood burning stoves is equally not very capital intensive and technologically appropriated with available material virtually everywhere in Nigeria. The sum of N1.7 billion Naira only will be adequate to install the planned community based improved versions of brick stoves. The estimated budget can be met through the intervention of Federal Government budget ecological funds such GEF, Environmental NGO’s, Private sector participation and other countries special grants.

190
Potential projects concept notes: Woodstoves continued
1. Project Title: Improved Metallic Wood burning stoves Development Programme 2. Potential Implementation Organizations: Energy Commission of Nigeria in Collaboration
with Ministry of Environment and Ministry of Agriculture (Fed. Dept. of forestry, FEPA), CERD, SERC ADP and NGO’s
3. Potential Implementation Partners: Federal Ministry of Agriculture and Federal Ministry of Environment, FEPA, CERD, SERC ADP and NGO’s
Renewable Energy Sub-sector (s)
Improved Metallic stoves 4. Sustainable environment through efficient energy utilization
Area (s) of Intervention Efficient Energy Utilisation for economic growth and Job creation.
5. Implementation Period: 2005 – 2025. 6. Project Overall Rationale and Objectives Factors such as problems of fire wood alternative which is usually obtained by self collection with associated problems of accessibility and affordability of alternative fuels called for an improvement in our existing cooking practice. The overall rationale is the judious use of fuelwood, reduction in cooking time and to eliminate smoke hazards to our women folk through the integration of chimney to the stoves 7. Project Specific Objectives: Reduction of firewood through the efficient energy cooking systems conservation and effective utilization of other biomass as cooking fuels. Development of fast growing tree species to supplement the existing firewood consumption’s. 8. Expected Outcomes: To revolutionalise the cooking systems through the use of efficient woodstoves particularly in rural areas of Nigeria, thereby reducing the quantity of fuelwood-wasted daily during the cooking activities as a result of heat losses. 9. Planned Activities to Achieve Outcomes: - Establishment of capacity building programme for the improved wood stoves projects. - Establishment of standards to cater for the nation’s cooking culture. - Train the trainers programme to mass-produce the stoves to cover at least 40% of the
Nigerian homes by 2025, Country- wide effort campaign approach on improved woodstoves dissemination.
- Introduction of 50% subsidy to all household purchasing improved woodstoves. - Development of fast growing tree species for the improved woodstoves. - Monitoring and control of the planned activities and review on matters arising on the
implementations. - Establishment of National biomass energy network for co-ordination and dissemination of
improved woodstoves - Complete transfer of improved woodstoves manufacture, marketing, and sales to private sectors. - Monitoring and evaluation of the set objective’s be continued for sustainability of the project 10. Project linkage to national priorities, action plans and program: Sustainable and affordable energy options - Poverty reduction under socio-economic acceptability. - Ecological balanced environment and economic growth.

191
11. Stakeholders involved in Project: Local Communities, Environmentalist, NGO’s Forestry and Energy Conservation Agencies (FEPA, GEF Fed. Department of Forestry etc) ECN and National Energy Centres (SERC, CERD etc). 12. Implementation Arrangement: Energy Commission of Nigeria through its relevant research centres, federal ministry of environment and Agriculture’ Environmental NGO’s with several relevant agencies. 13. Estimated Budget and Information on how costs will be met: The improved metallic stove is one of the efficient wood burning stoves planned for the intervention. The raw material which is galvanised iron sheet is available in Nigerian Markets. The budgetary requirement of N1.7 billion Naira only would be required for the intervention. The amount can be met through Federal budget, ecological funds such as GEF, Environmental NGO’s, Private Sector share participation and other countries special grants.

192
Potential Projects Concept Notes: Biomass Briquetting
1. Project Title: Multi cylinder biomass briquetting programme 2. Potential Implementation Organizations: Energy Commission of Nigeria in Collaboration
with Ministry of Environment and Ministry of Agriculture (Fed. Dept. of forestry, FEPA), CERD, SERC ADP and NGO’s
3. Potential Implementation Partners: Federal Ministry of Agriculture and Federal Ministry of Environment, FEPA, CERD, SERC ADP and NGO’s
Renewable Energy Sub-sector (s)
Biomass briquetting 4. REMP strategic areas: Ecologically balanced environment through supplementation of energy
Area (s) of Intervention Capacity building job creation and sustainable energy security.
5. Implementation Period: 2005 – 2025. 6. Project Overall Rationale and Objectives: Conservation and maximum utilization of wood and agricultural waste to provide alternatives to fuelwood and reduce over dependence on depletable fuelwood mostly used for domestic energy supply. 7. Project Specific Objectives: To supplement the firewood cooking fuels thereby reducing firewood consumption and minimizing pressure on the already depleted forest with additional environmental protection. 8. Expected Outcomes: It is expected that by the year 2025 the biomass briquttes will provide at least 8 to 10% of the fuelwood required by supplement.
9. Planned Activities to Achieve Outcomes: - Demonstrating the technical feasibility studies on the agricultural biomass resources to
categories them for biomass briquette production and those for land fertilizer. - Aggressive mass production of biomass briquette - Conducting studies on indigenous expertise to manufacture and operate the briquetting plants. - Introduction of subsidy and other financial incentive such as lower profit tax and tax holidays on
the importation of equipment for the briquettes manufacturing. - Production and promotion of domestic cooking stoves designed for briquettes. - Localization of expertise in briquettes production by 2025 and meeting the 8 to 10%
supplements for fuelwood based on proper monitoring and control. - Establishment of biomass energy networks for co-ordination and dissemination of briquette
fuels. - Localization of expertise to manufacture and operate briquetting plants - Complete Transfer of biomass briquetting, marketing and sales to private sectors. - Monitoring and Evaluation of the planned activity be continued 10. Project linkage to national priorities, action plans and program: Sustainable and affordable energy options - Poverty reduction under socio-economic acceptability. - Ecological balanced environment and economic growth. 11. Stakeholders involved in Project:

193
Local Communities, Environmentalist NGO’s Forestry and Energy Conservation Agencies (FEPA, GEF Fed. Department of Forestry etc) ECN and National Energy Centres (SERC, CERD etc). 12. Implementation Arrangement: Energy Commission of Nigeria through its relevant research centres, federal ministry of environment and Agriculture’ Environmental NGO’s with several relevant agencies. 13. Estimated Budget and Information on how costs will be met: The biomass briquetting projects to achieved the required average industrial set up ranges from N1,000,000:00 to N2,500,000:00 for equipment, raw materials and personnel. To successfully utilize small and middle scale project on briquetting. However, for the expected target of 20years the sum of N2,5 billion Naira will be required for the programme which can be met through Government, International donors and NGO’s intervention.

194
Potential Projects Concept Notes: Biomass Briquetting Continued 1. Project Title: Development of Screw shaft briquetting Machine for sawdust rice husk and
groundnut shells briquettes. 2. Potential Implementation Organizations: Energy Commission of Nigeria in Collaboration
with Ministry of Environment and Ministry of Agriculture (Fed. Dept. of forestry, FEPA), CERD, SERC ADP and NGO’s
3. Potential Implementation Partners: Federal Ministry of Agriculture and Federal Ministry of Environment, FEPA, CERD, SERC ADP and NGO’s
Renewable Energy Sub-sector (s)
Biomass Briquetting using screwshaft
4. REMP strategic areas. Ecologically balanced environment through energy utilization.
Area (s) of Intervention To provide job creation and sustainable energy security.
5. Implementation Period: 2005 – 2025. 6. Project Overall Rationale and Objectives Factors such as problems of fire wood alternative which is usually obtained by self collection with associated problems of accessibility and affordability of alternative fuels called for an improvement in our existing cooking practice. The overall rationale is the judicious use of fuelwood, reduction in cooking time and to eliminate smoke hazards to our women folk through the integration of chimney to the stoves 7. Project Specific Objectives: To supplement the firewood cooking fuels thereby reducing firewood consumption and minimizing pressure on the already depleted forest with additional environmental protection. 8. Expected Outcomes: It is expected that by the year 2025 the biomass briquttes will provide at least 8 to 10% of the fuelwood required by supplement.
9. Planned Activities to Achieve Outcomes: - Establishment of capacity building programme for the improved wood stoves projects. - Establishment of standards to cater for the nation’s cooking culture. - Train the trainers programme to mass-produce the stoves to cover at least 40% of the
Nigerian homes by 2025, Country- wide effort campaign approach on improved woodstoves dissemination.
- Introduction of 50% subsidy to all household purchasing improved woodstoves. - Development of fast growing tree species for the improved woodstoves. - Monitoring and control of the planned activities and review on matters arising on the
implementations. - Establishment of National biomass energy network for co-ordination and dissemination of
improved woodstoves - Complete transfer of improved woodstoves manufacture, marketing, and sales to private sectors. - Monitoring and evaluation of the set objective’s be continued for sustainability of the project 10. Project linkage to national priorities, action plans and program: Sustainable and affordable energy options - Poverty reduction under socio-economic acceptability. - Ecological balanced environment and economic growth.

195
11. Stakeholders involved in Project: Local Communities, Environmentalist NGO’s Forestry and Energy Conservation Agencies (FEPA, GEF Fed. Department of Forestry etc) ECN and National Energy Centres (SERC, CERD etc). 12. Implementation Arrangement: Energy Commission of Nigeria through its relevant research centres, federal ministry of environment and Agriculture’ Environmental NGO’s with several relevant agencies. 13. Estimated Budget and Information on how costs will be met: The screwshaft briquetting machine for the production of briquettes using the raw materials of rice, millet, sawdust and groundnut shells can be successfully developed in Nigeria. The sum of N2.4 billion Naira would be required for the intervention, which can be met through several funding organisations, such as Federal Government budget, ecological funds, CDM, mechanisms, NGO’s and private sector contributions.

196
Potential Projects Concept Notes: Small Scale Hydro
1. Project Title: Small Scale Hydro Power (SHP) 2. Potential Implementation Organizations: River Basin Development Authorities, Rural
Electrification Boards (REB), State and Local Governments with ECN supervision and coordination.
3. Potential Implementation Partners: NEPA, World Bank, UNDP, International Development Banks
Renewable Energy Sub-sector(s)
Small of Scale Hydro Power 4. REMP strategic areas:
Area(s) of Intervention National Resources Identification and Inventory, Resources Assessment, Public Awareness, Financing, Layout of Development Program.
5. Implementation Period: Present to Yr. 2025 6. Project Overall Rationale and Objectives: Favourable and integral component of a
diversified and expanding energy structure. Provision of supply to growing and unsatisfied demand by the Nation’s majority but substantially neglected population. Resource Conservation.
7. Project Specific Objectives: Meet local demands, promote cost effective consumption of local energy resources, stimulate rural area industrialization, power cottage industries, discourage rural-urban migration, improve local awareness, raise community standard of living, rural development
8. Expected Outcomes: Generation of hydropower and supply to local communities and, perhaps, the National Grid; Creation of employment; Industrialization; Improvement of local access and road network; Development of local Communities; Contribution of local resources to National Development.
9. Planned Activities to Achieve Outcomes: In the short term up to Yr. 2007 – adopt Master Plan, complete national survey and inventory of potential Small –Scale Hydro Power (SHP) sites, develop codes and standards, establish national information system, evaluate existing SHPs, establish adequate infrastructure for personnel training, staff training, commence construction of one SHP plant in each of seven geographical zones of the country, and provide funding including support from International Donor Agencies to cover tasks. Over the medium-term through yr 2015-monitoing of Master Plan performance, continuing contact with Donor Agencies, implementation of codes and standards, continued manpower training, Nigerianization of SHP operations, construction of additional SHP plants, continued financing by Government and Donor Agencies. In the long-term period ending Yr. 2025, uncompleted tasks of the medium-term would be concluded and construction of SHPs to full national capacity.

197
10. Project linkage to national priorities, action plans and program: SHP development
should be integrated, under high priority, into the National Development Plan and Budgeting.
11. Stakeholders involved in Project: Local communities, Individuals, the Private Sector, Local and State Governments, River Basin Development Authorities, NEPA, Rural Electrification outfits, and the Federal Government via the ECN.
12. Implementation Arrangement: The ECN would identify, initiate and coordinate actions (via studies, field works and project reports); works to be done through individual experts or consultancy firms. Lead site agency should be the River Basin Development Authority. Initial project operation can be the responsibility of the Rural Electrification Board until eventual Privatization of the development.
13. Estimated Budget and Information on how costs will be met: Up to N20 Billion to be required annually in the next 10 yrs beginning presently with about N5 billion/annum, and increasing at N4 billion per year. Funding through annual budget of the Federal Government and assistance from International Donor Agencies. Additional support from State and Local Governments.

198
Potential Projects Concept Notes: Solar PV
1. Project Title: Solar Photovoltaics
2. Potential Implementation Organizations: Federal,Ministries of Mines and Power, Water Resources, Health, Education, Communications, Petroleum Resources, Rural Electrification Boards (REB), Renewable Energy Research Centres, State and Local Governments with ECN supervision and coordination.
3. Potential Implementation Partners: NEPA, World Health Organisation, World Bank, UNDP, International Development Banks, Cooperative Societies.
Renewable Energy Sub-sector(s)
Solar Energy 4. REMP strategic areas:
Area(s) of Intervention National Resources Identification and Inventory, Resources Assessment, Public Awareness, Financing, Local Production, Layout of Development Program.
5. Implementation Period: Present to Yr. 2025
6. Project Overall Rationale and Objectives: Incorporation of Solar-photovoltaics into the national energy supply mix, particularly in the remote, rural communities. Provision of electricity for water pumping, village electrification, vaccine refrigeration, education/research(computers, teaching aids, documentaries), communications(telephony, television, radio), pipeline and metal structures corrosion control.
7. Project Specific Objectives: To harness the abundant solar energy resources for electricity generation to meet local demands for healthcare, water supply, lighting, education, job creation in the rural areas, sensitise the local population on the potentials of solar electricity, rural development.
8. Expected Outcomes: Generation of solar electricity and supply to local communities and, perhaps, the National Grid. Improvement in the standard of living and poverty reduction in the country through the creation of employment; industrialization; provision of social infrastructure in local Communities; harnessing of the potentials in the rural communities to foster national development.

199
9. Planned Activities to Achieve Outcomes: Between 2005 and 2007, begin implementation of REMP, install demonstation projects, capacity building and training in the renewable energy centres, install two pilot production plants for modules, develop codes and standards, establish financing mechanisms to promote the dissemination of PV. In the medium term, increase the local production capacity of plants to include newer technologies, increase funding of the research centres for basic research on cells, modules and systems, monitor the realization of REMP objectives in PV particularly as it affects rural electricity infrastructure development. Increase the megawatt power output from solar photovoltaics systems up to 50MW. Mount workshops, seminars and intensive training of local technicians, craftsmen, artisans to support the increasing dissemination of PV systems. In the long term, from 2016 to 2025, further increase in the production capacity of plants to meet the demand for solar modules and balance of system components in the West African subregion; dissemination of about 500MW of PV systems, including utility-tied systems; research on high-effciency cells to meet world-class efficiencies; evaluation of outcomes to ascertain to what extent they meet REMP objectives.
10. Project linkage to national priorities, action plans and program: Solar-PV development should be linked to the overall national development plan, particularly to the rural development initiatives of the three tiers of government; the National Economic Empowerment for Development Strategies(NEEDS).
11. Stakeholders involved in Project: The Federal Government through the Ministries of Power and Steel, Health, Education , Communication, Water Resources. State and Local Governments; Local communities, Individuals, the Private Sector, NEPA, Rural Electrification outfits; the Energy Commission of Nigeria as the overall coordinator of the REMP projects.
12. Implementation Arrangement: The ECN would collaborate with local and international Agencies on technical and financial assistances required for project implementation, it will monitor and regulate the activities of the stakeholders to ensure compliance with standards. The Renewable Energy Research Centres will be involved in carrying out surveys, feasibility studies, R&D, training and manpower development to support the project implementation.
13. Estimated Budget and Information on how costs will be met: About N5 Billion to be required annually in the next two years up to 2007 and increasing to N7 Billion/annum up to 2015. About N10 Billion/annum would be required from 2016 up to 2025. Funding through the annual budgets of the Federal, State and Local Governments, the private sector and International agencies will meet the cost requirements.

200
Potential Projects Concept Notes: Solar Thermal 1. Project title: National Solar Heating Programme (NASHP) 2. Potential implementing organizations: Energy Commission of Nigeria in collaboration with other stakeholders such as the Ministries of Environment and of Health. 3. Potential implementing partners: SERCC, NERDC, CERD, UNDP/GEF
Renewable energy subsector(s)
Solar thermal energy 4. REMP strategic areas: Renewable energy adoption to meet energy targets
Area(s) of intervention Technology adoption, capacity building, job creation
5. Implementing period : 2005 – 2025
6. Project overall rationale and objectives: To replace a significant fraction of low temperature (< 80oC) heating applications in the domestic, commercial, institutional and industrial sectors, thereby resulting in thousands of tonnes of avoided carbon dioxide into the environment while releasing the fossil fuels and biomass that would otherwise have been used for more useful work. 7. Project specific objectives: To meet or exceed the specific targets set for the following: Solar water and air heaters Solar cookers Solar dryers and brooders Solar stills, pasteurizers, desalination, & sterilizers Expected outcomes:
• Specific targets for each solar heating technology met or exceeded in target year
• Significant contribution of solar thermal to the national energy mix as set in the targets
• Creation of thousands of jobs for artisans, technicians, engineers, bankers, project managers
• Development of a virile solar thermal energy manufacturing base in the ECOWAS sub-region
• Development of an internationally competitive and export-oriented solar thermal industrial base by the mid-term of 2015
9.Planned activities to achieve the outcomes:
• Enact the National Solar Heating Obligation ordinance or bill at the local, state and national assemblies for solar water heaters on all new buildings (commercial, government, hospitals, clinics, and institutions)
• Provide attractive fiscal market incentives for the adoption of solar heaters in the domestic, commercial, and industrial sectors through specific Solar Thermal Market Incentive Programmes (STMIP)
• Standards Organization of Nigeria (SON), together with other stakeholders such as the building industry and relevant professional bodies, to develop;
• Codes of Practice and Codes of Conduct/Ethics for manufacturers and vendors,
• Performance & Technical Standards for: solar water air heaters; solar dryers; solar cookers; solar stills; etc.

201
• Minimum Specifications to be met for solar thermal products for the Nigerian market
• Testing procedures, certification scheme, product quality and safety assurance criteria, compliance strategy, standards enforcement and corrective, implementable sactions
• Product standardization methodology for the Nigerian solar thermal energy industry
• Launch training and certification programmes for artisans, technicians, engineers, business community, banking community, public sector officials, etc. on solar thermal technologies through the national energy centres and other higher institutions and NGOs as soon as possible within the year 2005
10. Project linkage to national priorities, action plans, and programs:
• NEEDS programme document • NAPEP • National Environmental Protection and Sustainability Programmes • National economic growth • Renewable Rural Energy Programme in the Department of Rural
Development, Ministry of Agriculture and Rural Development 11. Stakeholders involved in project:
• Government Ministries and Agencies • Private sector companies and CBOs & NGOs • International agencies such as UNDP/Global Environmental Facility, GEF • National energy centres and other higher institutions of learning and research
12. Implementation arrangement: The implementing agency is the Energy Commission of Nigeria, ECN, which will coordinate, monitor, assess, evaluate and direct the programme. Estimated budget and information on how costs will be met: the USD 100 million to be met from:
• Federal government budget • Allocation of a share of excess crude oil earnings and returned loot from
national treasury • National Non-Fossil Fuel Obligation, NNFFO • International agencies particularly Global Environmental Facility which has
approved grants for similar projects in other countries in the recent past.

202
Potential Projects Concept Notes: Solar Thermal Continued 1. Project title: National Solar Cooling Programme (NASCooP) 2. Potential implementing organizations: Energy Commission of Nigeria in collaboration with other stakeholders such as the Ministries of Environment and of Health. 3. Potential implementing partners: SERCC, NERDC, CERD, UNDP/GEF
Renewable energy subsector(s)
Solar thermal energy 4. REMP strategic areas: Renewable energy adoption to meet energy targets
Area(s) of intervention Technology adoption, capacity building, job creation
5. Implementing period : 2006 – 2025
6. Project overall rationale and objectives: To replace a significant fraction of grid electricity used for compression refrigeration and air conditioning in the commercial, institutional and industrial sectors, thereby resulting in thousands of tonnes of avoided carbon dioxide into the environment while releasing the electricity that would otherwise have been used for more useful work in manufacturing and production activities. 7. Project specific objectives: To meet or exceed the specific targets set for :solar refrigeration and air conditioning of large commercial and institutional buildings Expected outcomes:
• Specific targets for solar refrigeration and air conditioning (Solar R/AC) technology met or exceeded in target year 2015
• Significant contribution of Solar R/AC to the national R/AC mix by 2015 in commercial and institutional buildings, in no case should it be less than 50%
• Creation of thousands of jobs for artisans, technicians, engineers, bankers, project managers
• Development of a virile solar R/AC manufacturing base in the ECOWAS sub-region
• Development of an internationally competitive and export-oriented solar R/AC industrial base by the end of the plan period 2025
9.Planned activities to achieve the outcomes: • Enact the National Solar Cooling Obligation ordinance or bill at the local,
state and national assemblies for solar air conditioning of all new buildings (commercial, government, hospitals, clinics, and institutions)
• Provide attractive fiscal market incentives for the adoption of solar cooling in the domestic, commercial, and industrial sectors through specific Solar Cooling Market Incentive Programmes (SCooMIP)
• Standards Organization of Nigeria (SON), together with other stakeholders such as the building industry and relevant professional bodies, to develop;
• Codes of Practice and Codes of Conduct/Ethics for manufacturers and vendors,
• Performance & Technical Standards for: solar R/AC equipment • Minimum Specifications to be met for solar R/AC products for the Nigerian
market • Testing procedures, certification scheme, product quality and safety assurance
criteria, compliance strategy, standards enforcement and corrective,

203
implementable sanctions • Product standardization methodology for the Nigerian solar R/AC industry • Launch training and certification programmes for artisans, technicians,
engineers, business community, banking community, public sector officials, etc. on solar thermal technologies through the national energy centres and other higher institutions and NGOs as soon as possible within the year 2005
10. Project linkage to national priorities, action plans, and programs:
• NEEDS programme document • NAPEP • National Environmental Protection and Sustainability Programmes • National economic growth • Vaccine preservation and National/International health programmes of the
Federal Government and such agencies as the WHO, e.g. the recent polio vaccination program
11. Stakeholders involved in project:
• Government Ministries and Agencies • Private sector companies and CBOs & NGOs • International agencies such as UNDP/Global Environmental Facility, GEF • National energy centres and other higher institutions of learning and research
12. Implementation arrangement: The implementing agency is the Energy Commission of Nigeria, ECN, which will coordinate, monitor, assess, evaluate and direct the programme. Estimated budget and information on how costs will be met: the USD 50 million to be met from:
• Federal government budget • Allocation of a share of excess crude oil earnings • National Non-Fossil Fuel Obligation, NNFFO • International agencies particularly Global Environmental Facility which has
approved grants for similar projects in other countries in the recent past.

204
Potential Projects Concept Notes: Solar Thermal Continued 1. Project title: National Solar Passive Architecture Programme (NASPAP) 2. Potential implementing organizations: Energy Commission of Nigeria in collaboration with other stakeholders such as the Ministries of Environment and of Works and Housing. 3. Potential implementing partners: SERCC, NERDC, CERD, UNDP/GEF
Renewable energy subsector(s)
Solar thermal energy 4. REMP strategic areas: Renewable energy adoption to meet energy targets
Area(s) of intervention Technology adoption, capacity building, job creation
5. Implementing period : 2005 – 2025
6. Project overall rationale and objectives: To reduce significantly the building energy consumption in the commercial, institutional and industrial sectors, thereby resulting in thousands of tonnes of avoided carbon dioxide into the environment while releasing the electricity and other energy forms that would otherwise have been used for more useful work in manufacturing and production activities. 7. Project specific objectives: To meet or exceed the specific targets set for :solar passive architecture, particularly of large commercial and institutional buildings Expected outcomes:
• Specific targets for solar passive architecture met or exceeded in target year 2015
• Significant contribution of solar passive architecture to the national building mix by 2015 in commercial and institutional buildings, in no case should it be less than 25%
• Creation of thousands of jobs for architects, draughtsmen, artisans, technicians, engineers, bankers, project managers, project developers, etc.
• Development of a virile passive architecture design and technology base in the ECOWAS sub-region
• Development of an internationally competitive and export-oriented solar solar passive architecture and industrial base by the end of the plan period 2025
9.Planned activities to achieve the outcomes: • Enact the National Solar Passive Architecture Obligation ordinance or bill at
the local, state and national assemblies for incorporation of solar passive design into all new buildings (commercial, government, hospitals, clinics, and institutions)
• Provide attractive fiscal market incentives for the adoption of solar passive architecture in the domestic, commercial, and industrial sectors through specific Solar Passive Architeccture Market Incentive Programmes (SPAMIP)
• Standards Organization of Nigeria (SON), together with other stakeholders such as the building industry and relevant professional bodies, to develop;
• Codes of Practice and Codes of Conduct/Ethics for manufacturers and vendors,
• Performance & Technical Standards for: solar passive equipment • Minimum Specifications to be met for solar passsive products for the
Nigerian market • Testing procedures, certification scheme, product quality and safety assurance
criteria, compliance strategy, standards enforcement and corrective,

205
implementable sanctions • Product standardization methodology for the Nigerian solar passive industry • Launch training and certification programmes for artisans, technicians,
engineers, business community, banking community, public sector officials, etc. on solar thermal technologies through the national energy centres and other higher institutions and NGOs as soon as possible within the year 2005
10. Project linkage to national priorities, action plans, and programs:
• NEEDS programme document • NAPEP • National economic growth • State and National Housing Programmes • United Nations Habitat Programme
11. Stakeholders involved in project:
• Government Ministries and Agencies • Private sector companies and CBOs & NGOs • International agencies such as UNDP/Global Environmental Facility, GEF
National energy centres and other higher institutions of learning and research 12. Implementation arrangement: The implementing agency is the Energy Commission of Nigeria, ECN, which will coordinate, monitor, assess, evaluate and direct the programme. Estimated budget and information on how costs will be met: the USD 25 million to be met from:
• Federal government budget • Allocation of a share of excess crude oil earnings and national loot returned
from abroad • National Non-Fossil Fuel Obligation, NNFFO • International agencies particularly Global Environmental Facility which has
approved grants for similar projects elsewhere.

206
Potential Projects Concept Notes: Solar Thermal Continued 1. Project title: National Solar Thermal Electricity Programme (NASTEP) 2. Potential implementing organizations: Energy Commission of Nigeria in collaboration with other stakeholders such as the Ministries of Power and Steel, Environment and of Health. 3. Potential implementing partners: SERCC, NERDC, CERD, UNDP/GEF
Renewable energy subsector(s)
Solar thermal energy 4. REMP strategic areas: Renewable energy adoption to meet energy targets
Area(s) of intervention Technology adoption, capacity building, job creation
5. Implementing period : 2005 – 2025
6. Project overall rationale and objectives: To engage solar thermal electricity into the national electricity energy mix thereby resulting in thousands of tonnes of avoided carbon dioxide into the environment. 7. Project specific objectives: To meet or exceed the specific targets set for solar thermal electricity in 2015 and 2025 respectively. Expected outcomes:
• Specific targets for solar thermal electricity technology met or exceeded in the target years
• Significant contribution of solar thermal electricity to the national energy mix as set in the targets
• Creation of thousands of jobs for artisans, technicians, engineers, bankers, project managers
• Development of a virile solar thermal electricity manufacturing base in the ECOWAS sub-region
• Development of an internationally competitive and export-oriented solar thermal electricity industrial base by the end of 2025 target year
9.Planned activities to achieve the outcomes:
• Enact the National Fossil Fuel Obligation law at the National Assembly mandating the electricity vendor companies to a minimum stipulated percentage from renewable electricity sources, of which solar thermal electricity is a prominent part
• Provide attractive fiscal market incentives for the private sector participation through specific Renewable Electricity Market Incentive Programmes (REMIP)
• Standards Organization of Nigeria (SON), together with other stakeholders such as the electricity industry and relevant professional bodies, to develop;
• Codes of Practice and Codes of Conduct/Ethics for manufacturers and vendors,
• Performance & Technical Standards for: solar thermal electricity technologies, systems, and components
• Minimum Specifications to be met for solar thermal electricity systems, components and products for the Nigerian market
• Testing procedures, certification scheme, product quality and safety assurance criteria, compliance strategy, standards enforcement and corrective,

207
implementable sactions • Product standardization methodology for the Nigerian and ECOWAS solar
thermal electricity industry • Launch training and certification programmes for artisans, technicians,
engineers, business community, banking community, public sector officials, etc. on solar thermal technologies through the national energy centres and other higher institutions and NGOs as soon as possible within the year 2005
10. Project linkage to national priorities, action plans, and programs:
• NEEDS programme document • NAPEP • National economic growth • Renewable Rural Energy Programme in the Department of Rural
Development, Ministry of Agriculture and Rural Development 11. Stakeholders involved in project:
• Government Ministries and Agencies • Private sector companies and CBOs & NGOs • International agencies such as UNDP/Global Environmental Facility, GEF • National energy centres and other higher institutions of learning and research
12. Implementation arrangement: The implementing agency is the Energy Commission of Nigeria, ECN, which will coordinate, monitor, assess, evaluate and direct the programme. Estimated budget and information on how costs will be met: the USD 500 million to be met from:
• Federal government budget • Allocation of a share of excess crude oil earnings • National Non-Fossil Fuel Obligation, NNFFO • International agencies particularly Global Environmental Facility which has
approved grants for the first solar thermal electricity projects in Egypt, India, Mexico and Morocco of approximately US$200 million in year 2000.

208
Potential Projects Concept Notes: Wind Energy 1. Project title: Wind Resource Assessment 2. Potential implementing organizations: 3. Potential Implementation Partners:
Renewable energy sub-sector(s)
4. REMP strategic areas:
Area(s) of intervention
5. Implementation period: 6. Project overall rationale and objectives:
Presently, only a few wind maps for limited sites are available, and there is no national or local wind atlas in the country. Hence, there is the to develop wind maps and atlases for the country that will provide information about the quantity, quality, distribution and utilization possibilities to determine the commercial feasibility of wind energy generation and decision making on investments. The overall objective of the project is to develop a comprehensive wind maps and atlases for the country and establish a local wind assessment capability.
7. Project specific objectives: These include:
i. To develop wind maps and atlases for the country;
ii. To develop a comprehensive wind energy database;
iii. To provide necessary information/data for decision making on investment in wind energy development in the country;
iv. To build institutional and technological capacity in the country through transfer of technical know-how regarding wind resource assessment as part of a national wind energy programme
8. Expected outcomes: i. Wind maps; ii. Wind atlases; iii. Local capacity development on wind resource assessment
9. Planned activities to achieve outcomes: i. To source for a reputable technical consultant (either a company or an institution) for the project; ii. To raise a national team for the project comprising all federal ministries, agencies and parastatals
involved in renewable energy in the country. The team should also include private sector, universities and research centre/institutions involved in renewable energy development;
iii. To set the terms of reference (TOR) and time-table for the project; iv. To periodically monitor and evaluate the progress of the project with respect to the TOR.
10. Project linkage to national priorities, action plans, and programs: 11. Stakeholders involved in project: 12. Implementation arrangement:
13. Estimated budget and information on how costs will be met:

209
Potential Projects Concept Notes: Wind Energy Continued 1. Project title: Detailed Wind Farm Measurement Feasibility Study 2. Potential implementing organizations: 3. Potential Implementation Partners:
Renewable energy sub-sector(s)
4. REMP strategic areas:
Area(s) of intervention
5. Implementation period: 6. Project overall rationale and objectives:
The results of a wind resource assessment project will be the identification of particular sites that appear promising for wind farm development. When such sites have been identified, detailed site-specific measurements are carried out through the erection of a meteorology mast. Actual measurements are needed because the power output of a wind farm is sensitive to wind speed. Hence, the overall objectives of the project are the measurements to obtain detailed and reliable information on variation in wind speeds and direction over the year, the wind speed frequency distribution, etc. in order to determine the viability or otherwise of the wind farm project.
7. Project specific objectives: i. To select a site for project feasibility analysis;
ii. To carry out the necessary wind measurements;
iii. To carry out an environmental impact assessment (EIA) of the project;
iv. To determine the viability or otherwise of a wind farm project;
v. To build institutional and technological capacity in the country through transfer of technical know-how regarding planning, implementation and operation of wind farms as part of national wind energy programme.
8. Expected outcomes: i. Project feasibility report; ii. Capacity building on wind farm measurement feasibility study.
9. Planned activities to achieve outcomes: i. To select a site for implementation of the project; ii. To source for a reputable technical consultant (either a company or an institution) for the project; iii. To raise a national team for the project comprising all federal ministries, agencies and parastatals
involved in renewable energy in the country. The team should also include private sector, universities and research centre/institutions involved in renewable energy development;
iv. To set the terms of reference (TOR) and time-table for the project; v. To periodically monitor and evaluate the progress of the project with respect to the TOR.
10. Project linkage to national priorities, action plans, and programs: 11. Stakeholders involved in project: 12. Implementation arrangement:
13. Estimated budget and information on how costs will be met:

210
Potential Projects Concept Notes: Wind Energy Continued 1. Project title: Non-Grid Hybrid System Demonstration Project 2. Potential implementing organizations: 3. Potential Implementation Partners:
Renewable energy sub-sector(s)
4. REMP strategic areas:
Area(s) of intervention
5. Implementation period: 6. Project overall rationale and objectives:
Access to electricity in the rural areas has been put at about 20%. In many rural areas of the country, there is no access to national grid essentially due to economy of scale and the remoteness of the national grid to such areas. Wind energy, therefore, provides a cost effective option for rural electrification. However, wind is intermittent; hence, it can be augmented with either a photovoltaic (PV) system or a diesel generator plant. This hybrid system could be highly patronized in the country for promoting sustainable energy development, and by implication, sustainable development generally. The overall objective of this project, therefore, is to demonstrate the viability of the hybrid system to boost rural electrification programme and promote sustainable development in the country.
7. Project specific objectives i. To build a non-grid hybrid system comprising wind energy and either PV system or a diesel
generator plant;
ii. To provide some initial results and documentation regarding the behaviour of a wind hybrid system for rural electrification in the country;
iii. To build capacity on the design, building and maintenance of a non-grid wind hybrid system in the country;
8. Expected outcomes: i. Establishment of a wind hybrid system; ii. Documentation on the behavioural pattern of the system; iii. Capacity building on the installation and maintenance of a wind hybrid system; iv. Ability to replicate the project in any other part of the country without employing an international
consultant (transfer of technical know-how). 9. Planned activities to achieve outcomes:
i. To select a site for implementation of the project; ii. To source for a reputable technical consultant (either a company or an institution) for the project; iii. To raise a national team for the project comprising all federal ministries, agencies and parastatals
involved in renewable energy in the country. The team should also include private sector, universities and research centre/institutions involved in renewable energy development;
iv. To set the terms of reference (TOR) and time-table for the project; v. To periodically monitor and evaluate the progress of the project with respect to the TOR.
10. Project linkage to national priorities, action plans, and programs: 11. Stakeholders involved in project: 12. Implementation arrangement: 13. Estimated budget and information on how costs will be met:

211
Potential Projects Concept Notes: Wind Energy Continued 1. Project title: A National Wind Energy Technology Centre 2. Potential implementing organizations: 3. Potential Implementation Partners:
Renewable energy sub-sector(s)
4. REMP strategic areas:
Area(s) of intervention
5. Implementation period: 6. Project overall rationale and objectives:
Lack of manufacturing capacity of wind energy components will slow down the rapid introduction of wind power into the national electricity supply mix. Experiences from other developing countries like China, India and Egypt show that it is necessary to have some local manufacturing capability as well as technical capacity for maintenance of wind turbines and other components, in order to facilitate a large scale development of wind power. The overall objective of this project is therefore, to establish a wind energy technology centre with a demonstration wind farm, wind turbine test facilities and wind energy assessment tools, to support and demonstrate the ability of Nigeria to manufacture, supply and maintain locally produced wind turbines and other components; and also for the purposes of research, development, development and deployment of wind turbines and other components in the country and even in Africa.
7. Project specific objectives i. To build facilities with control room, test room, classrooms, offices and workshops for the
manufacture, repair and maintenance of wind power components;
ii. To supply and install test station equipment;
iii. To set up instrumentation and testing of wind turbines;
iv. To introduce the centre to, and corporate with international test stations for test station activities and other possible collaborative activities;
v. To build institutional and technological capacity in the manufacture, installation, repair and maintenance, instrumentation and testing of wind turbines and other wind power components and on wind energy assessment, as part of a national wind energy programme;
vi. To carry out research, development, demonstration and dissemination of wind energy.
8. Expected outcomes: i. A national wind energy technology centre; ii. Capacity building on manufacture, installation, instrumentation and testing, repair and maintenance
of wind turbines and other components; iii. Active research and development on wind energy components
9. Planned activities to achieve outcomes: i. To select a site for implementation of the project; ii. To source for a reputable technical consultant (either a company or an institution) for the project; iii. To raise a national team for the project comprising all federal ministries, agencies and parastatals
involved in renewable energy in the country. The team should also include private sector, universities and research centre/institutions involved in renewable energy development;
iv. To set the terms of reference (TOR) and time-table for the project; v. To periodically monitor and evaluate the progress of the project with respect to the TOR.
10. Project linkage to national priorities, action plans, and programs: 11. Stakeholders involved in project: 12. Implementation arrangement:
13. Estimated budget and information on how costs will be met:

212
Potential Projects Concept Notes: Hydrogen, Ocean and Geothermal Energy 1. Project title: New Energy Research and Development Programme (NERDP) 2. Potential implementing organizations: Energy Commission of Nigeria in collaboration with other agencies 3. Potential Implementation Partners: SHESTCO, NIMOR, CERD, SERC, NERDC
Renewable energy sub-sector(s)
Hydrogen, Ocean and Geothermal Energy
4. REMP strategic areas: Research and Development
Area(s) of intervention Research and Development Capacity Building
5. Implementation period: 2005 – 2025 6. Project overall rationale and objectives: The overall objective is to conduct research and development on hydrogen, ocean and geothermal energy with a view to preparing these energy sources to play important roles in meeting the energy challenges of Nigeria in a post-fossil economy. 7. Project specific objectives: The specific objectives include:
• Providing Nigeria a vision and road map for a post-fossil economy • Integrating hydrogen into the national energy mix by 2025 • Developing R&D capacity and producing prototypes for tidal and wave technologies • Providing resource assessment and conducting exploration of geothermal energy • Positioning Nigeria at the forefront of emerging energy technologies research and
development 8. Expected outcomes:
• Future national energy security ensured • Access to energy services to all social segments achieved • Cost-effective energy services in the future achieved • Cleaner national energy system developed
9. Planned activities to achieve outcomes: • Identification of relevant centers • Development of proposals • Provision of budget lines • Launching of R&D • Peer review through international conferences • Development of technology prototypes • Development of niche markets
10. Project linkage to national priorities, action plans, and programs:
• National security • Economic growth • Poverty reduction

213
• Environmental sustainability 11. Stakeholders involved in project:
• Governmental agencies • Private sector • International agencies and R&D centres
12. Implementation arrangement: Energy Commission of Nigeria in collaboration with several agencies
13. Estimated budget and information on how costs will be met: USD 50 million to be met through:
• Federal Government budget • International agencies • Private sector contribution

214
AAnnnneexx:: SSttaakkeehhoollddeerrss CCoonnssuulltteedd Centre for Energy Research and Development, Obafemi Awolowo University, Ile Ife Department of Industrial Technology and Energy Research (DITER) of the Federal Ministry of Science and Technology Department of Power, Federal Ministry of Power and Steel, Department of Power Energy Commission of Nigeria Faculty of Agriculture, UDUS Federal Department of Forestry Federal Ministry of Agriculture Federal Ministry of Environment Federal Ministry of Science and Technology, Department of Industrial Technology & Energy Research Federal Office of Statistics Forest Management, Evaluation and Co-ordinating Unit International Institute for Tropical Agriculture (IITA), Ibadan Lagos State University National Centre for Energy Research and Development (NCERD) National Planning Commission, Directorate of Infrastructure and Public National Planning Commission, Directorate of Rural Development Nigeria Meteorological Agency, Federal Ministry of Aviation RISØ National Laboratory, Denmark Sokoto Energy Research Centre Sokoto State Ministry of Agriculture United Nations Development Program, Abuja United Nations Development Program, Sokoto Utilities

215
AAnnnneexx:: RReeffeerreenncceess Adelekan B. A., (2002) “Assessing Nigeria’s Agricultural Biomass Potential as a Supplementary, Energy Source Through Adoption of Biogas Technology”, Nigerian Journal of Renewable Energy, Vol. 10, Nos 1 & 2, pp 145-150 Adeyefa, Z.D. and Adedokun, J.A., Pyrheliometric determination of atmospheric turbidity in harmattan season over Ile-Ife, Nigeria, Nig. J. Ren. Ener., vol. 1, 3/4, 555-566, 1991. Adeyefa, Z.D. and Holmgren, B., Spectral solar irradiance before and during a harmattan dust spell, Sol. Ener., vol. 57, No. 3, pp. 195-203, 1996. Adeyefa, Z.D., Holmgren, B. and Adedokun, J.A., Spectral solar irradiance under harmattan conditions, Nig. J. Ren. Ener., vol. 6, No. 8, pp. 989-996, 1995. Adeyefa, Z.D., The effect of advected harmattan dust on spectral solar irradiance, Nig. J. Ren. Ener., vol. 7, Nos. 1&2, pp. 17-25, 1999. Akinbami J.F.R (1997): Comparative Environmental Effects and Cost Analysis Between Conventional Energy Sources. A Case Study for Objective Analysis and Decision Making in Nigeria’s Energy Policy. Nig. Journal of Solar Energy vol. 5, No. 1&2 PP131-139 Akinbode F.O (1996): Development of a Sawdust Stove. Nig. Journal of Solar Energy Vol. 4, No.1 PP53-57 Akinbode, F.O., Solar radiation in Minna: Correlation with meteorological data, Nig. J. Ren. Ener., vol. 3, Nos. 1&2, pp. 9-17, 1992 Akingbade, F.O.A., Prediction and performance assessments of external horizontal global illuminance of measured data from Prt-Harcourt, Nigeria, Nig. J. Ren. Ener., 10, 1&2, 1-5, 2002. Alfa, B, Jiya, J. D., Sambo, A. S., and Asere, A. A., Prediction of hourly solar radiation using neural network, Nig. J. Ren. Ener., vol. 9, Nos. 1&2, pp. 42-46, 2001. Aliyu, A.G. and Sambo, A.S, Development of a model for computing the total component of solar radiation in Sokoto, Nig. J. Ren. Ener., vol. 3, 1&2, 10-17, 1991. American Society of Agricultural Engineers, (1984) ASAE, ASAE Data: D381.1 Manure Production and Characteristics. Agricultural Engineering Standards. ASAE, St Joseph, MI 49085, USA Anderson L. L. and Tillman D. A., (1977) “Fuels From Waste”, Academic Press (NY). Anozie A.N and Ejike A (2003): Development of Sawdust Briquetting Machine (Screw Press) M.Sc Project Dept of Chemical Engineering OAU Ile-Ife

216
Antia, E. E. (2003) Vulnerability and Adaptation to Climate Change in the Coastal Zone and Marine Ecosystems of Nigeria. A Report prepared for the Nigerian Environmental Study/ Action Team. (Ibadan: Nest). Audu F.G. (2000): Design, Construction and Testing of a Motorized Briquetting Machine for Agricultural Wastes, M. Eng report ATBU Bauchi Awachie, I.R.N., The effect of climatological factor on total solar radiation in some towns in Nigeria, Nig. J. Solar Energy, vol. 4, pp. 20-22, 1985. Babalola, O. O. (1984) High Potential Geothermal Energy Resource Areas of Nigeria and their Geologic and Geophysical Assessment. Abstract: American Association of Petroleum Geology. Vol/Issue 68/4. AAPG Annual Convention, 20 May 1984; San Antonio, Texas. Babatunde, E.B. and Aro, T.O., Characteristic variations of total (global) solar radiation at Ilorin, Nigeria, Nig. J. Sol. Ener., 9, 157-173, 1991 Babatunde, E.B., Direct solar radiation at a tropical station (Ilorin, Nigeria), Nig. J. Ren. Ener., vol. 7, Nos. 1&2, pp. 46-49, 1999 Bala E.J, Ileoje O.C and Umar I.H: An Overview of Energy Components of and Related Issues in the Vision 2010 report of the Federal Republic of Nigeria. Nigerian Journal of Solar Energy Vol. 11 Nos. 1&2 PP96-103 Bala, E,J, and Muhammad, M.H., Hourly and daily average ambient temperature and total radiation in Bauchi, Nigeria, Nig. J. Ren. Ener., vol. 7, Nos. 1&2, pp. 1-11, 1999. Bala, E. J., Analysis of some meteorological data for four cities in the north western zone of Nigeria, Nig. J. Ren. Ener., 9, 1&2, 37-41, 2001. Bamiro, O.A., Empirical relations for the determination of solar radiation in Ibadan, Nigeria, Sol. Ener., vol. 31, No. 1, pp. 85-94,1983 Bhattacharga S.C et al (1990): Ranking of Selected Residing for Bio-Coal Production Case of Thailand. International Journal of Energy Research John Wiley and Son USA 14: (8) pp869-879 Biogas Forum (1984) Technical Information Service, Fuelwood Strategies and Action Programs, in Asia 1992/11 No.49 and 50 BORDA SCNCER, Boer F. D.; (1984) By-products and Wastes in Animal Husbandry. Proceedings of an International Symposium on Animals as Waste Converters, Wageningen, pp 10-11 . Bremen Overseas Research and Development Association (BORDA). International Biogas Workshop on Community Plants. Workshop Report, pp 212-213. Brennand, T.P. (2001) Wind Energy in China: Policy Options for Development. Energy for Sustainable Development, Vol V, No 4

217
Brodman, John (2001) U.S. Energy Challenges and Opportunities. Paper presented at the National Workshop on Creating Demand and Removing Barriers to Renewable Energy Market Development in Nigeria, Abuja. BTM Consult & Dorf, R.C. (1978), “Energy, Resources & Policy”, Addison-Wesley Publishing Company, Inc., California. BTM Consult (2001). International Wind Energy Development, World Market Update, Addison-Wesley Publishing Company, Inc.California. Burari, F. W. and Sambo, A. S., Estimation of global solar radiation in Bauchi, Nig. J. Ren. Ener., vol. 9, Nos. 1&2, pp. 30-33, 2001 Burari, F. W., Sambo, A. S. and Mshelia, E. D., Analysis of some meteorological data for four cities in the north western zone of Nigeria, Nig. J. Ren. Ener., vol. 9, 1&2, pp. 34-36, 2001 Burari, F.W. and Sambo, A.S., Alternative model for the determination of Angstrom coefficients for Bauchi, Nig, J. Ren. Energy, vol. 8, Nos. 1&2, pp. 66-68, 2000. Central Bank of Nigeria, Statistical Bulletin (2002): Production and Consumption - Electricity Generation and Consumption, vol. 13, pp. 260-261, Central Bank of Nigeria, Statistical Bulletin: Production and consumption – Electricity generation and consumption, vol. 13, pp. 260-261, December 2002. Centre for Renewable Energy Sources (2002) Wave Energy Utilisation in Europe – Current Status and Prospects. Pikermi, Greece. Charles Y. W. and Hagen, E. B. (2000). Biomass Conversion and Technology, John Wiley and Sons, pp 1-2. Danshehu B. G. (2002) Development of Community Based Brick Stove; Nigeria Prison Home Experience Paper Presented at Kadpoly NASEF. Danshehu B.G and Sambo A.S (1993): The Role of Changing on the Performance of Improved Wood Burning Stoves. Nigeria Journal Solar Energy Vol. 12 1-5 Danshehu B.G, Aliku A.T and Tambawal A.D (1996): Effect of Glazing on the Performance of Improved Wood Burning Stoves Energy vol.4 No.1 pp15-18 Danshehu B.G. and Sambo A.S (1992). The Effect of Number of Rules on the Performance of Improved Wood Burning Stoves. Nigeria Journal. Solar Energy 10.3037 Danshehu B.G. et al (1985) Fabrication and Performance Analysis of Some Traditional and Improved Wood Burning Stoves Nigeria Journal of Solar Energy Vol.4 65-70

218
Deng, A. and Wang, R.Z. (2001), Literature Review on Solar Absorption Technologies for Ice-Making and Air-Conditioning Purposes and Recent Developments in Solar Technology, Renewable and Sustainable Energy Reviews, 5, pp.313-342, Pergamon. Deng, A.O. and Wang, R.Z., Literature review on solar adsorption technologies for ice-making and air-conditioning purposes and recent developments in solar technology, Renewable and Sustainable Energy Reviews, 5, pp.313-342, Pergamon, 2001. Doyle, M.D.C. and Sambo, A.S., Correlation of diffuse solar radiation with air mass, Solar and Wind Tech., vol. 5, pp. 99-102, 1988 ECN-UNIDO (2003) Renewable Energy for Rural Industrialization and Development in Nigeria. Energy Commission of Nigeria (2003). National Energy Policy. Federal Republic of Nigeria. (ECN: Abuja). Energy Commission of Nigeria, (2004), Energy Demand Projection Document, Section 4.4.2 - Analysis and Comparison of Sectoral Energy Demand, pp. 115-128. Energy Commission of Nigeria, (2004), Energy Demand Projection Document, Section 4.4.2 – Analysis and Comparison of Sectoral Energy Demand, pp. 115-128. Energy Information Administration, US Department of Energy website, http://usdoe/eia 1980 - 2002 World wide Energy Database. European Commission (2001), “Future Needs and Challenges for Non-Nuclear Energy Research in the European Union”, Discussion Paper. European Commission (2004) New and Renewable Energy – Ocean Energy. http://europa.eu.int/comm/energy/res/sectors/ocean_energy_en.htm European Commission (2004). New and Renewable Energy – Geothermal Energy. http://europa.eu.int/comm/energy/res/sectors/geothermal_energy_en.htm Eurosolar e.V, Irm Pontenagel ed. (1999). Financing Renewable Energies – Window for New Opportunities. Bochum. Evans M. R. and Svoboda I. F. (1985). The Recovery of Energy from Aeration. Agricultural Waste Utilization and Management. Proceeding 5th International Symposium on Agricultural Wastes ASAE, pp 22-28 EWEA (2002) Wind Energy: The Facts – An Analysis of Wind Energy in the EU-25 Fagbenle, R. ‘L., A comparative study of some simple models for global solar irradiance in Ibadan, Nigeria.; Int. J. Energy Research, vol, 16(7), pp. 583-596, 1992. Fagbenle, R. ‘L., Solar irradiation isolines for rapid design of solar systems in Nigeria. RERIC Int. Energy J. , vol. 14(2), pp. 37-48, 1992

219
Fagbenle, R. ’L., Salt-gradient solar ponds for the tropics: Technical and economic appraisal for Nigeria, Int. J. Ambient Energy, 4, 1, 41-52, 1993. Fagbenle, R. L. and Karayiannis, T.G. (1994). On the wind energy resource of Nigeria, International Journal of Energy Research, 18(5), 493-508. Fagbenle, R. 'L.(1993), Salt-Gradient Solar Ponds for the Tropics: Technical and Economic Appraisal for Nigeria. Int. J. Ambient Energy, vol. 4(1), pp. 41-52. Fagbenle, R. Layi, Oguaka, A.B.C. and Olakoyejo, O.T. (2004), A thermodynamic analysis of a biogas-fired integrated gasification steam injected gas turbine (BIG/STIG) plant. 3rd International Conference on Heat Powered Cycles, 11-13 October, 2004, Lanarca, Cyprus. Paper selected for special issue publication of the international journal, Applied Thermal Engineering, Elsevier Publishers, 2005. Fagbenle, R. Layi, Oladiram, M.T. and Oyedemi, T.I. (2003), The potential generating capacity of solar PV-clad residential and commercial buildings in Nigeria. Joint International Solar Energy Society (ISES) and American Society of Mechanical Engineers (ASME) Conference, Hawaii, 15-18 March, 2003. Fagbenle, R.’L. (1993). Total solar radiation estimates in Nigeria using a maximum-likelihood quadratic fit, Renewable Energy Int. J., vol. 3(6/7), pp. 813-817, 1993 Fagbenle, R.’L., Estimation of total solar radiation in Nigeria using meteorological data, Nig. J. Ren. Ener., vol. 1, pp. 1-10, 1990 Fagbenle, R.’L., Fagbenle, R.’L. (1993). Correlation of monthly mean diffuse Fagbenle, R.’L., Harmonic analysis of monthly solar irradiation in Nigeria. Renewable Energy Int. J., vol. 4(5), pp. 551-559, 1994 Fagbenle, R.’L., On monthly-averaged daily extraterrestrial solar radiation for Nigerian latitudes. Nigerian J. Renewable Energy, vol. 2, No. 2, pp. 1-9, 1991 Fagbenle, R.’L., Salt-gradient solar ponds for the tropics : Technical and economic appraisal for Nigeria. Int. J. Ambient Energy, vol. 4(1), pp. 41-52, 1993. Fagbenle, R.’L., Zifeng, C, Jomjunyong, S., Limtragool, J., and Suleiman, E. (1992). Stochastic analysis of hourly insolation sequences at Ibadan, Nigeria. Nigerian J. Ren. Energy, vol. 3(1/2), pp. 1-8, 1992 Fagbenle, R.O., Ogunlade, O., and Odetola, B. (1979). Design and operation of a solar seed germinator. Proceedings of the 18th International Conference on Solar Energy, COMPLES, vol. 3, pp. 355-365, Milan, Italy, 1979. Federal Ministry of Agriculture, FMA (1997). Nigerian Agricultural Statistics. Pocket Book Department of Planning, Research and Statistics, FMA Abuja. Federal Ministry of Environment (2004). Environmental and Social Assessment, Synthesis Report, on the First Africa Stockpiles Programme Project I (ASP-P1)

220
Federal Ministry of Science and Technology (1987). Policy Guidelines of Energy for Nigeria. FMST, Lagos Federal Ministry of Science and Technology (2004) Report of the Inter-Ministerial Committee on the Available Energy Resources and Estimated Quantity of Electricity Deliverable from these Resources. Abuja. Federal Republic of Nigeria (2000) Report of the Inter-ministerial Committee on Combating Desertification and Deforestation. Final Year Student Projects on Solar Furnace Design, Construction and Testing at the University of Ibadan Under the Supervision of Professor R. A. Fagbenle, Mechanical Engineering Department, University of Ibadan, Ibadan, 2002-2003. Final year student projects on solar furnace design, construction and testing at the University of Ibadan under the supervision of Professor R. O. Fagbenle, Mechanical Engineering Department, University of Ibadan, Ibadan, 2002-2003. FOA: (1997) Analysis of an FAO Survey of Post Harvest Crop Losses in Developing Countries, FAO Rome. Folayan, C. O., Estimates of global solar radiation bounds for some Nigerian cities, Nig. J. Sol. Ener., vol. 3, pp. 3-10, 1998. Garba B., Sambo A.S and Danshehu B.G (1991): The Effect of Design Parameters on the Performance of Improved Wood-Burning Stoves Nig. J. Solar Energy Vol. 10,85-94 Ghederim V.; Negulescu A. L., and Gueron I. J., (1985) Present State and Trends in Animal Farm Waste Management in Romania. Proceedings of the 5th International Symposium on Agricultural Wastes, ASAE pp 426-438 Hankins M. (1993); Solar Rural Electrification in the Developing World; Solar-Electric Light Fund. Heltberg P. H.; Woods T. S.; Asby A. B.; and Ait R. C., (1985) Baseline Projections of the United States Energy Supply and Demand to 2010. Gas Research Institute. Chicago, USA Hill R. A. (1983), Risk Analysis and the Concepts of Expected Monetary Value and Utility Certified Accountant Students Newsletter Ideriah, F.J.K. and Bamiro, O.A., The determination of diffuse component of solar radiation in Ibadan, Nig. J. Sol. Ener., 2, 81-88, 1982 IEA (2001), International Energy Agency (IEA R & D Wind) Iheonu, E. E., Model for prediction of average monthly global solar radiation on horizontal surfaces for some locations in the tropics, using temperature data, Nig. J. Ren. Ener., vol. 9, Nos. 1&2, pp. 12-15, 2001

221
Iloeje O.C. (1999) Renewable Energy for Agricultural Processing in West African Sub Region Iloeje, O.C.(2000), Solar energy refrigeration, Proceedings of the World Renewable Energy Congress VI, WREC 2000,1-7 July 2000, Brighton, UK., Part I, pp. 975-981 Iloeje, O.C., Design, construction and test run of a solar powered solid absorption refrigerator, Solar Energy, vol. 35, pp. 447-455, 1985. Iloeje, O.C., Solar energy refrigeration, Proceedings of the World Renewable Energy Congress VI, WREC 2000, 1-7 July 2000, Brighton, UK., Part I, pp. 975-981, 2000. International Energy Agency (2003) Renewables for Power Generation – Status and Prospects. 2003 Edition. Paris: IEA. International Energy Agency, IEA, website database, http://www.iea.org International Energy Agency, lEA, website database, http://www.iea.org ITT India, (1984) Woodstoves, a report. J.Voger (1996): Understanding Wood Wastes as Fuel. Volunteers Technical Assistance (VITA) Virginia 22209 U.S.A pp 1-30 Jiya, J.D. and Alfa, B., Parameterisation of solar radiation using neural network, Nig. J. Ren. Ener., 10, 1&2, 6-10, 2002 Kovacs K.; Vas A. and Juhasz J., (1985) Energy Production by Fermentation of Bulk Organic Wastes. Proceedings of the 5th International Symposium on Agriculture, Wastes, ASAE, pp 346-353 Kovas K.; Vas A. and Juhasz J., (1985) Energy Production by Fermentation of Bulk Organic Wastes. Proceeding of the 5th International on Agric. Wastes, ASAE, pp 346-353 Legg B J., (1990) Farm and Food Waste Utilization Without Pollution. Proceedings of the 6th International Symposium on Lives Wastes. ASAE. St. Joseph, MI pp xi-xxi Liu, W-Q., Zhang, X-I and Gan, L. (2002) Wind Energy Development in China: Institutional Dynamics and Policy Incentives. International Journal for Energy Technology and Policy, Vol 1 Nos 1/2. Lombard E. J. (2003), Lesbons on Improved Cook Store Diffusion; India, Kenya and China chapter nine 2003, An Internet Materials. Maduekwe, A.A.L, Iheonu, E.E. and Akingbade, F.O.A., Verification of some simple solar radiation models in the Nigerian environment, Nig. J. Ren. Ener., 10, 1&2, 11-14, 2002. Maduekwe, A.A.L. and Chendo, M.A.C., Diffuse solar radiation analysis for Lagos, Nig. J. Ren. Ener., vol. 3, Nos. 1&2, pp. 18-24, 1992 . Maduekwe, A.A.L. and Chendo, M.A.C., Sol. Ener., 61, 4, 241-249, 1997

222
Maduekwe, A.A.L. and Garba, B., Characteristics of the monthly averaged hourly diffuse irradiance at Lagos and Zaria, Nigeria, Nig. J. Ren.. Ener., vol. 4, No. 2, pp. 64-74, 1996 Maduekwe, A.A.L., Sensitivity studies of solar radiation models using GLM approach: Case study of two models using data from instruments of different precision, Nig. J. Ren. Ener., vol. 4, No. 2, pp. 26-33, 1996. May cock D., Stirewalt E.N. (1985); A Guide to the Photovoltaics Revolution, Rodale Press, Emmaus, Pa USA. Pg 246-247. Ministry of Non-Conventional Energy Sources, MNES (2003), Soft Loan Programme on Solar Water Heaters, India. http://www.mnes.nic. Ministry of Non-Conventional Energy Sources, MNES, Soft Loan Programme on Solar Water Heaters, Lodi Road, New Delhi, India. http://www.mnes.nic.in September 2003. Momoh S. and Soaga J. (1999) Biomass Energy Consumption in Nigeria: Integrating Demand and Supply. Nigerian Journal of Renewable Energy, Vol. 7, Nos. 1 & 2, pp 78 –82. Moulik T. M., (1985) The Biogas Program in India and China Ambio. A Journal of Human Environment Royal Swedish Academy of Science and Pergamon Press. In Cooperation with the World Resources Institute (WRI) Vol. xiv, Number 45, pp 288-292 National Economic Empowerment and Development Strategy, NEEDS, National Planning Commission, Abuja, Nigeria, 2004. National Energy Plan of the United State of America, (1977), Ballinger Publishing Company. National Energy Policy Document, Federal Republic of Nigeria, The Presidency, Energy Commission of Nigeria; pp. 22-23, August 2002.. National Planning Commission (2004) National Economic Empowerment and Development Strategy, NEEDS, Abuja, Nigeria. Nemzer, Marilyn L., Carter, Anna K. & Nemzer, Kenneth P. (2004): Geothermal Energy Facts. Geothermal Education Office. www.geothermal.org Nigeria Country Profile Implementation of Agenda 21 Renew of Progress Made Since UN Conference on Environment and Development 1992. Njoroge, Edward (2004) Energy in Africa – Geothermal Potential. Business in Africa Online. www.businessinafrica.net Odewunmi S. G., Private Sector Participation in Waste from Management. Lesson from Lagos Study

223
Ojosu, J. O., Development of solar radiation models for Nigeria, NBRRI Research Report No. 8, 1990 Ojosu, J. O., The iso-radiation map for Nigeria, Solar and Wind Technology, vol. 7, pp. 563-575, 1990 Ojosu, J.O. (1989), “Wind Energy Characteristics and Availability for the Design of Wind Energy Conversion Systems in Nigeria”, Nigerian Journal of Solar Energy, Vol.8, pp.123 Ojosu, J.O., A correlation of global solar radiation with cloud cover and sunshine hours, Nig. J. Sol. Ener., vol. 9, pp. 133-142, 1990. Ojosu, J.O., and Salawu, R.I. (1989), “A Statistical Analysis of Wind Energy Potential for Power Generation in Nigeria”, Nigerian Journal of Solar Energy, Vol. 8, pp.273 Ojosu, J.O., and Salawu, R.I. (1990), “Wind Energy Development in Nigeria”, Nigerian Journal of Solar Energy, Vol.9, pp.209-222. Ojosu, J.O., Frequency distribution analysis of daily solar radiation measurement at Ikeja (Lagos) for solar systems design, Nig. J. Ren. Ener., vol. 5, Nos. 1&2, pp. 41-44, 1997. Olorunnisola A.O (2003): Briquetting Rattan Furniture Waste for Domestic and Agro Industrial Fuel Applications. Nig J. Renewable Energy Vol 11, Nos 1 and 2 pp 130-135 One Sky/Energetic Solution Conference (2004). Status of Renewable Energy in Nigeria, Nigeria. Onyegegbu, S. O., Solar distillation of pond (muddy) water, Energy Conversion and Management, vol. 24, pp. 1-4, 1984. Osakwe E.N.C (Ed.) (1978). Towards a Comprehensive Energy Policy for Nigeria. Proc of the Energy Policy Conference, Jos. Petroncini and R.W. Yemm (2004) Introducing Wave Energy into the Renewable Energy Marketplace. Centre for the Study of Environmental Change and Sustainability, University of Edinburgh. Proceedings of the 6th International Symposium on Agric. and Food Processing Wastes, ASAE pp 308-318, Conversion Technologies and Opportunities for their Use in Developing Countries. Safley Ur L. M.; Westerman P. W., and Barker J. C. (1985) Fresh Dairy Manure Characteristics and Barnlot Nutrient Losses. 5th International Symposium on Agric. Wastes. ASAE pp 191-199

224
Sambo A.S, Jatau J.S., Tokan A, Ali M.D (1996): Technical Report on the Manually Operated Briquetting Machines. Report submitted to (RMRDC) Sambo, A. S., Empirical models for the correlation of global solar radiation with meteorological data for northern Nigeria, Sol. and Wind Technology, 3, 89-93, 1986. Sambo, A.S. and Doyle, M.D.C., Estimation of the global and diffuse components of solar radiation for some Nigerian cities, Nig. J. Sol. Ener., 7, 16-24, 1986. Sambo, A.S., Solar radiation in Kano: A correlation with meteorological data, Nig. J. Sol. Ener., vol. 4, pp. 59-64, 1985. Sambo, A.S., The measurement and prediction of global and diffuse components of solar radiation for Kano in northen Nigeria, Solar and Wind Tech., 5,1-6, 1988 Sasse, L.S. (1984) “Biogas Supply for the Fictitious Village of Kama in India. SCNCER, Technical Information Service, (1986) “Recent Development in Thermal Conversion Technology of Biomass” Swartman, R. K. and Ogunlade, O., Solar radiation estimates from common parameters, Solar Energy, vol. 11, pp. 170-172, 1967. Technical Committee on Quantification of Energy Resources (2004), “Report of the Inter-Ministerial Committee on the Available Energy Resources and Estimated Quantity of Electricity Derivable from These Resources: Executive Summary” Thomas S., (1990) Evaluation of Plant Biomass Research for Liquid Fuels. Brighton Science Policy Research Unit, university of Sussex Tiwari, G.N., Yadav ,Y.P., Eames, P.C. and Norton, B. (1994), Solar Distillation Systems: the State of the Art in Design, Development and Performance Analysis. Renewable Energy, Proceedings of the World Renewable Energy Congress, WREC, 11-16, vol. 5, Part I, pp. 509-516 UK. Udo, S.O. and Aro, T.O, Contribution to the study of diurnal pattern of global radiation in the tropics: A case study of Ilorin, Nigeria, Nig, J. Ren. Energy, vol. 8, Nos. 1&2, pp. 69-72, 2000. Umar, B. and Weingartmann, Suitability of silica gel and water for solar cooling applications, Nig. J. Ren. Energy, vol. 8, Nos. 1&2, pp. 36-44. Umar, I.H. (2004), A Review of Renewable Energy in Nigeria: Opportunities for Rural Development and Development of a Renewable Energy Master Plan. Paper Presented at the Renewable Energy Conference, "Energetic Solutions", Abuja/Calabar. Umar, I.H., Iloeje, O.C. and Bala, E.J., Review of renewable energy technologies in Nigeria, Nig. J. Ren. Energy, vol. 8, Nos. 1&2, pp. 99-109, 2000. Umar, I.H., Overview of renewable energy in Nigeria: Opportunities for rural development and development of a Renewable Energy Master Plan. Paper presented

225
at the Renewable Energy Conference, “Energetic Solutions”, Abuja/Calabar, 21-26 November, 2004 UNIDO (2003). Renewable Energy for Rural Industrialization and Development in Nigeria. Abuja United States Department of Energy (2001) Ocean Energy. National Renewable Energy Laboratory. United States Department of Energy (2002) A National Vision of America’s Transition to a Hydrogen Economy to 2030 and Beyond. Based on the National Hydrogen Vision Meeting, Washington D.C. 15-16 November 2002. United States Department of Energy (2002) National Hydrogen Energy Roadmap. Based on the National Hydrogen Energy Roadmap Workshop Washington D.C. 2-3 April 2002. United States Department of Energy (2004) Energy Efficiency and Renewable Energy Savers: Ocean Energy. www.nrel.gov Van Dyne D. C. and Gilbertson C. B., (1978) Estimating US Livestock and Poultry Manure Nutrient Production. US Report Agric. ESCS-12 VITA Particular. Testing the Efficiency of Wood Burning Stove Provisional International Standard. Volunteers in Technical Assistance, VITA, (1980) 3-Cubic Metre Biogas Plant A Construction Manual. Waddle D. B.; Perlack R. D. and Wimberly J., (1990) “A Summary of the Status of Biomass Weiss, W.(2004), Solar Heating Systems: Status and Recent Developments, pp. 214-225, Renewable Energy World, Review Issue 2004-2004, Jul-Aug, 2004, James and James (Science Publishers) Ltd., UK. Weiss, W., Solar heating systems: status and recent developments, pp. 214-225, Renewable Energy World, Review Issue 2004-2004, Jul-Aug, 2004, James and James (Science Publishers) Ltd., UK. 2004. Wereko-Brobby, Charles Y. & Hagen E. B. (1996) Biomass Conversion and Technology, John Wiley & Sons WINDPOWER NOTE (2002), “WINDPOWER NOTE Nr. 27”, March 2002, Vindimolleindustriens Arsberetning (in Danish). Wiser, R. and Pickle, S. (1997) Financing Investments in Renewable Energy: The Role of Policy Design and Restructuring. Environmental Energy Technologies Division, Ernest Orlando Lawrence Berkeley, National Laboratory (LBNL), University of California, USA. LBNL Report – LBNL-39826, UC-1321

226
World Bank (2004) Geothermal Energy – An Assessment. www.worldbank.org World Energy Council (2004) Ocean Energy. www.worldenergy.org/wec-geis/publications/reports/ser/wave World Energy Council, (1993) Energy for Tomorrow’s World, St. Martin’s press (KOGAN PAGE) Zervos, A. (2001), “Wind Power Achievements and Perspectives”, Proceedings of the European Wind Energy Conference, Copenhagen, Denmark, pp.xxxviii-xiii. Other Web Sites World Energy Council www.worldenergy.org/wec-geis/publications/reports/ser/wave Centre for the Analysis and Dissemination of Demonstrated Energy Technologies (CADDET): Ocean Energy Information Features Information on Ocean Energy Technologies from CADDET. http://europa.eu.int/comm/energy/res/sectors/ocean_energy_en.htm Features an Overview of European Programs on Ocean Energy Ocean Thermal Energy Conversion National Renewable Energy Laboratory Features Information on OTEC, Including its Applications and Resources. Tidal Energy EUROPA: Energy & Transport European Commission Features an Overview on Tidal Energy, as well as more Detailed Information. Wave Energy EUROPA: Energy & Transport European Commission Features an Overview on Wave Energy, as well as more Detailed Information. Waveenergy.dk Provides Information on Wave Energy in Denmark. Hydrogen Energy www.nrel.gov/programs/hydrogen.html Features and Overview of the USDOE Program with Documents and Links www.eere.energy.gov/hydrogenandfuelcells The Hydrogen and Fuel Cell Program of the USDOE Geothermal Energy www.nrel.gov/geothermal http://europa.eu.int/comm/energy/res/sectors/geothermal_energy_en.htm

227
Features and Overview of European Programs on Geothermal Energy Resources