renewable energy profile of oic countries - comstech.org energy profile of oic... · consumption in...
TRANSCRIPT
Shaukat Hameed Khan and Muhammad Haris Akram
February 2018, COMSTECH.
Renewable Energy Profile
of OIC Countries
Renewable Energy Profile
of OIC Countries
COMSTECH Series of Reports on Science,
Technology, and Innovation in OIC Member States
COMSTECH Secretariat,
33-Constitution Avenue, G-5/2, Islamabad-44000, Pakistan
Telephone: 92 51 9220681-3, Fax: 92 51 9211115 / 9220265 / 9205264 http://www.comstech.org
Melting glaciers, freak storms, extended periods of drought,
extreme precipitations, and stranded polar bears -- the mascots
of climate change -- show how quickly and drastically
greenhouse gas emissions (GHG) are changing our planet.
i
Dr. Shaukat Hameed Khan, started the laser programme in Pakistan in 1969
in the PAEC (Pakistan Atomic Energy Commission), where he was actively
engaged in research, teaching and production. His research included atomic
and molecular spectroscopy, ultrafast high voltage switching, and design and
development of lasers from the UV to the IR. As Visiting Scientist at CERN,
Geneva, 1999-2001, he helped design the laser based detector position
monitoring system for the CMS system, where 40 Pakistani laser systems are
now operational.
A Rhodes Scholar, he obtained his BSc and DPhil degrees from Oxford University. He is a Fellow
of the Pakistan Academy of Sciences and recipient of the President’s Medal for Pride of
Performance.
After retiring as Chief Scientist at the PAEC, he worked as Member of the Planning Commission of
Pakistan from 2005-08 and was responsible for national programmes in higher education science
and technology and industry. He also authored the Vision 2030 foresight exercise in 2007. He has
been Rector of GIKI, and was a member of the World Bank team which prepared the National
Industrial Policy, 2011 (timelines, costs, and necessary structural reforms).
He was a member of the President’s Steering Committee, which resulted in the establishment of
the Higher Education Commission, and the National Nanotechnology Commission, which helped
start ‘seed’ activities in this field in Pakistani Universities. His current interests include the emerging
relation between science and society and the role of technology in development, leveraging the
energy crisis for industrial development, and reforming secondary education in Pakistan.
Apart from lectures at the National Management School, (Lahore), he has been speaking in various
Pakistani and International Conferences on topics such as the ‘Economics and Politics of Energy
Transit through Afghanistan’, ‘Pakistan’s Energy Options’, and ‘Nuclear Energy Prospects in South
Asia’, with a chapter on 'Technology Status, and Costs of Renewable Energy (Powering Pakistan’,
Ed: Hathaway & Kugelman, Woodrow Wilson Centre, Washington, OUP, 2009).
Muhammad Haris Akram graduated with a Bachelor’s degree in Electrical Power Engineering and
a Master’s in Energy Systems Engineering. He has worked in energy efficiency projects in different
industries for over five years, and has international trainings in solar power plants designing,
industrial solar heating & cooling systems, energy auditing and green
economies. He is the lead contributor from Pakistan for the “Renewables
Global Status Report 2017” REN 21. Also, a peer reviewer of the annual
Renewables Global Status Reports of Renewable Energy Policy Network for
the 21st Century.
He is currently engaged in preparing the “Science Profile of OIC Countries” at
COMSTECH.
Brief Notes about the Authors
ii
This report presents the renewable energy (RE) profile of the 57 OIC countries (population of
1.8 billion or 24 percent of the world population), which span the geographical region from
South-East Asia to Central Asia, the EU, MENA, Sub-Saharan Africa and the Caribbean. It
examines the status of different types renewable technologies installed or planned for the
future, and national incentives and policies, within the global transition towards RE.
The priority everywhere remains the assurance of universal access to affordable, reliable and
modern energy services, as more people move out of poverty and demand access to energy
and electricity. Demand is likely to double by 2050 compared with 2000 and emerging
economies are projected to be responsible for 90% of the growth.
To meet rising demands for energy and power, new forms of energy generation and efficiency,
driven by technology, falling cost of RE systems, and more efficient batteries, have developed
quite rapidly unlike previous periods when this happened gradually over decades. The energy
mix is changing everywhere and renewable energy presents new opportunities and challenges
in the context of global warming caused by anthropogenic emissions of greenhouse gases.
The OIC countries have extremely diverse economies, energy consumption, and demand, and
many are short of affordable and reliable energy and power. In 2017 over 81 percent of their
energy needs were met by fossil fuels led by natural gas (48 percent), followed by fuel oil (19
percent), coal (15 percent) and hydel (14 percent). The share of renewables (RE) was only 4
percent of their overall energy mix and only 2 percent of the global installed capacity of 920
GW. However, this is changing fast and vigorous plans are underway for RE deployment in
consonance with the global target of achieving greenhouse gas neutrality at some time in the
second half of the century. The oil and gas rich countries have the highest per capita electricity
consumption in all of OIC, which is higher than the developed countries.
Generally wind and solar are the most popular technologies in the OIC regions. Solar CSP
predominate in MENA, while Turkey leads with power from wind and solar PV, and Indonesia
in geothermal sources. Nuclear power plants are operational only in Pakistan, (1430 MW) and
Iran (915 MW), while another nine countries have either signed contracts or announced their
intentions to do so since 2012. The UAE has started construction of four South Korean plants
(5,600 MW), of while Saudi Arabia recently announced plans to install 17,000 MW by 2035.
The total estimated GHG emission in OIC countries is about 7,875 million tons (21 percent of
the global emissions of 37,116 million tons). The biggest emitters of CO2 are in the MENA
region with 48 percent, followed by EU/Central Asia (24 percent) and S.E. Asia with 14 percent.
The report also examines the challenges faced by RE for wider deployment, especially
efficiency in generation, transmission, and storage systems. Carbon capture and storage may
not be able to take off in spite of two decades of deployment and development. A holistic view
of RE is presented including lifetime costs, ecological deficits, energy efficiency, and energy
returns on energy invested.
The RE technologies are changing rapidly and data volatility is high. Storage is the key and RE
alone may not be the only answer to meet GHG reduction targets, which are at best aspirational
goals and may not be very realistic. Auctions have introduced a new dynamic in RE system
cost within the global fall in prices of solar and wind power systems.
Finally, how do the OIC countries plan to manage the transition to sustainable
‘green’ energy, and can they provide the required skill set and productivity?
COMSTECH, 19th February 2018.
Preface
iii
AREI African Renewable Energy Initiative
BIPV Building Integrated Photovoltaics
BNEF Bloomberg New Energy Finance
BRT Bus Rapid Transport
CDM Clean Development Mechanism
CHP Combined Heat & Power
COP21 Conference of the Parties, 21st meeting
CPV Concentrated Solar Photovoltaic
CSP Concentrated Solar Power
DNI Direct Normal Insolation
DRE Distributed Renewable Energy
DSM Demand Side Management
EPC Engineering Procurement & Construction
FIT Feed in Tariff
GDP Gross Domestic Product
GEF Global Environment Facility
GW / GWh / GWth Gigawatt / Gigawatt hour / Gigawatt thermal
IEA International Energy Agency
INDC Intended Nationally Determined Contributions
IPCC Intergovernmental Panel on Climate Change
IPP Independent Power Producer
IRENA International Renewable Energy Agency
LCOE Levelized Cost of Electricity
LED Light Emitting Diode
MENA Middle East & North Africa
NZEB Net Zero Energy Building
OECD Organization for Economic Cooperation & Development
O&M Operations & Maintenance
PAYG Pay As You Go
PPA Power Purchase Agreement
PPP Public Private Partnership
PV Photovoltaic
RPS Renewable Portfolio Standards
SE4ALL United Nations Sustainable Energy for All Initiative
SHS Solar Home System
SIDS Small Island Developing States
SWH Solar Water Heating
TES Thermal Energy Storage
TFEC Total Final Energy Consumption
ABBREVIATIONS
iv
Table of Contents
SECTION 1 – SCOPE OF THE STUDY
1.1 The Energy Transition………………………………………………………………… 3
1.2 Climate Change and the Case for Renewable Energy………………..………...... 5
1.3 Challenges for Deployment of Renewable Energy………………………………… 6
1.4 Declining Costs and Faster Deployment of Renewable Energy Sources…..…… 7
1.5 Global Installed Capacity for Renewable Energy………………………………..… 9
1.6 Effect of Feed-in Tariffs (FITs) and Subsidies in the EU……………….……….… 9
1.7 Life Cycle Assessment (LCA) of Emissions from Solar PV and Wind Power...… 10
1.8 Impact of Tenders on RE Power Purchase Price……………………………….…. 10
1.9 Storage and Grid Integration…………………………………………………….…... 10
1.10 Investment Trends in Renewable Energy………………………………………...... 11
SECTION 2 – RENEWABLE ENERGY IN THE OIC COUNTRIES
2.1 Overall Energy Mix In OIC Countries……………………………………………….. 13
2.2 Regional Summary……………………………………………………………………. 15
a) EU and Central Asia…………………………………………………………...………….. 15
b) Sub Saharan Africa and Latin America…………………………………….……………. 16
c) The MENA Region………………………………………………………….……….…….. 17
d) South Asia……………………………………………………………………...…………... 18
e) South East Asia……………………………………………………………………......…... 18
SECTION 3 – TYPES OF RE RESOURCES USED IN OIC COUNTRIES
3.1 Wind Power……………………………………………………………………….…… 19
3.1.1 Emerging Trends in Wind Energy Systems……………………….………….………… 20
3.2 Solar Photovoltaic Systems in the OIC Member States…………………………… 20
3.2.1 Technology Trends in Solar PV Modules………………………………..........….…….. 21
3.2.2 Low Bid Prices for Solar PV Systems…………………………………………………… 22
3.2.3 GHG Emissions from Solar Based systems……………………………………..……… 22
3.2.4 The Duck Curve and Grid management……………………………………….....…….. 23
3.2.5 Manufacturing Capacity and Shipment of Solar PV Modules…………………...……. 23
3.2.6 ‘Soft’ Cost of Solar Energy Systems………………………………..….………………... 24
3.2.7 The True Life Cycle Cost of the Solar PV System………………………….…...….…. 24
3.3 Solar CSP………………………………………………………...………………...….. 24
3.3.1 Trends in CSP…………………………………………………..…………………………. 25
3.3.2 Outlook for CSP………………………………………………………...…………………. 26
3.3.3 Land Area Required for Solar Power Generation……………………..………….……. 27
3.3.4 Cleaning Water for Solar Systems: Mitigation Strategies…………...…….………….. 27
3.3.5 The Nexus between Energy and Water…………………………………………...……. 28
3.3.6 Solar Heating and Cooling………………………………………………...………….….. 28
3.4 Energy and Power from Biomass……………………………………………………...…. 29
3.4.1 The Poor Man’s Choice: Wood Pellets and Farm Waste…………………….…..…... 30
3.5 Geothermal Energy in OIC Member States………………………………..…..…… 31
3.6 Hydropower…………………………………………………………………….........… 31
Executive Summary
v
3.6.1 Small Hydropower Plants…………………………………………………….…………… 32
3.6.2 Large Hydropower Dams are not Renewable or Sustainable in the Long Run…….. 32
3.7 The Case for Nuclear Power………………………………………………..………… 33
3.7.1 The Economics of Nuclear Power…………………………………………….….….……. 35
3.7.2 The Carbon Footprint of Nuclear Power………………………………………................ 35
3.7.3 The Emergence of UPEC………………………………………………………..………… 35
3.8 Energy from the Oceans………………………………………………………….....… 35
3.9 The Nexus between Energy and Water………………………………………….….. 36
3.9.1 Water Use in Power Plants………………………………………………………………… 36
3.9.2 Water for Cleaning Solar Energy Systems; Mitigation Strategies…………...………… 37
SECTION 4 – ENERGY STORAGE
4.1 Choosing the Correct Storage System………………………………………………. 38
4.2 Pumped Storage……………………………………………………..……….……..…. 39
4.3 Batteries………………………………..……………………………..………....…....… 40
4.4 ESOI…………………………………………………………………………….............. 42
4.5 Battery Storage for Utility Scale Applications…..………………..….……..……..… 42
4.6 Sources for Lithium…………………………………………………………….……… 43
SECTION 5 – THE ECOLOGICAL DEFICIT AND ENERGY EFFICIENCY
5.1 Source of GHG Emissions………………………………………………..………..….…. 45
5.2 The Competition from Evolution of Fossil Fuel Power Plants…………….…..…… 46
5.3 The Case of EROI - Energy Return on Energy Invested…………….………..…… 47
5.4 Green Buildings in the OIC States………………………………………………….......… 47
5.5 Electric Vehicles………………………………………………………………….…...…..… 49
5.6 Carbon Credits, Emission Trading, and Carbon Tax………………………….………… 49
5.7 Price of Carbon in the Market…………………………………………….………............. 50
5.8 Clean Coal: Carbon Capture and Sequestration (CCS)……………...……………...… 50
5.9 Suitable Geological Sites for CCS………………………………………………………… 51
5.10 The Case of Indonesia…………………….…………………………….…………….…… 52
SECTION 6 – INVESTMENT AND MARKET TRENDS IN RENEWABLE ENERGY
6.1 Cost Competitiveness of RE Technologies with Conventional Sources…………. 54
6.2 DRE Financing Schemes, Business Models & Policy Framework……………….. 55
6.3 Social Inclusion and Jobs in the Renewable Energy Sector………………………. 55
ANNEX A – INSTALLED POWER GENERATION CAPACITY…………………………………… 57
ANNEX B – UNDER CONSTRUCTION RENEWABLE ENERGY PROJECTS………………… 59
ANNEX C – NATIONAL POLICIES & RENEWABLE ENERGY INCENTIVES………..……..… 61
ANNEX D – RENEWABLE ENERGY TARGETS……………………………………………..……. 64
ANNEX E – FEED IN TARIFF VS ELECTRICITY PRICES…………………………………...…… 65
ANNEX F – OIL & GAS NATURAL RESERVES………………………………………...…………. 67
vi
Figure 1 – Snapshot of Energy Sources………………………………………………….…….....… 4
Figure 2 – Projected Changes in Source of Electricity………………………………...………..…. 4
Figure 3 – IEEJ Predictions on Global Power Generation………………………..….…..…..……. 4
Figure 4 – Greenhouse Gas Emissions………………………….…......................................…… 5
Figure 5 – Global Solar Horizontal Irradiation…………………………………….……..……..…… 6
Figure 6 – Typical Daily Solar Variability 2011, Springerville, AZ, USA……………...…..……… 7
Figure 7 – Texas Wind Farm, Hourly Output………………………………………...……….….…. 7
Figure 8 – North Sea Offshore Wind Farm; 12-month variation, in MWh/h……...………...….… 7
Figure 9 – Levelised Cost of Electricity from Selected RE Sources, (Q4 2009 to HQ4 2016)… 7
Figure 10 – Share of RE in New Global Power Generation Capacity, 2007-2016…………...….. 8
Figure 11 – Global RE Installed Capacity (GW), June 2017…………………………………....….. 9
Figure 12 – Ten Year CAGRS in the EU Market………………………………………………....….. 9
Figure 13 – The Major Trend in the Energy Future is Efficiency Enhancement……………..…… 11
Figure 14 – Installed RE Capacity (MW) by Six Geographical Regions (excl. Nuclear)……...…. 12
Figure 15 – Top 15 OIC Countries for RE (MW), including Nuclear………………………...…..… 13
Figure 16 – Electricity Generation (MW) by Region, including Nuclear………………………..….. 13
Figure 17 – Primary Energy Mix % for Electricity Generation in the Six OIC Regions…...…...… 14
Figure 18 – Electricity Consumption, kWh/capita, in EU and Central Asia…………………....….. 15
Figure 19 – RE by Type in EU and Central Asia (MW)……………………………………...…....… 15
Figure 20 – Consumption (kWh / capita), Sub-Saharan Africa & Latin America……………....…. 16
Figure 21 – RE by Technology in Sub Saharan Africa Latin America…………………………...... 16
Figure 22 – Electricity Consumption in MENA, kWh/capita……………………………………....… 17
Figure 23 – RE by Type (MW) in MENA Countries………………………………………...……...… 17
Figure 24 – Electricity Consumption. KWh/capita………………………………………….......……. 18
Figure 25 – RE by Type, South Asia………………………………………………………..…........… 18
Figure 26 – Electricity use, kWh/capita, S. E. Asia………………………………………..…....…… 18
Figure 27 – RE (MW) by Type in South East Asia………………………………………….....…….. 18
Figure 28 – Wind Power across Regions and Top Five Producers……………………...….......… 19
Figure 29 – Vestas Super Wind Turbine (a), and the old Vindeby Offshore Wind Farm (b)….… 20
Figure 30 – Solar PV Installed Capacity by Region……………………………………………...….. 21
Figure 31 – Top Six Countries for Solar PV……………………………………………………….….. 21
Figure 32 – Research Trends in Conversion Efficiencies of Solar PV Cells……………………… 21
Figure 33 – Life-cycle Emissions from Solar Energy Systems………………………………….….. 22
Figure 34 – Projected Scenario of Net Load Curves, 2012-20, California 2016………...……….. 23
Figure 35 – Country Capacity versus Shipments, 2015……………………………….................… 23
Figure 36 – CSP Deployment by Region and Country……..……………………………….....….… 25
Figure 37 – Types of CSP Solar Thermal Systems…………………………………………….....… 25
Figure 38 – Trends in Different CSP Technologies, 2017………………………………………...… 26
Figure 39 – The 1 GWth Miraah CSP Parabolic Trough Plant in Oman…………………………… 28
Figure 40 – Regional Bio Power Installed Capacity……………………………………………….… 29
Figure 41 – Top Five OIC States for Bio-Power……………………………………………………… 29
List of Figures
vii
Figure 42 – Biomass use by Sector in the World………………………………………………... 30
Figure 43 – Transition of Rural Fuel from Traditional Dung Cakes to Bio-Digesters….…….. 30
Figure 44 – Top Five Geothermal Power Producers………………………………………….... 31
Figure 45 – Hydel Power Generation by Region…………………………………………….….. 31
Figure 46 – Top 8 Countries for Hydel power…………………………………………….....…... 31
Figure 47 – Typical Mini-hydel Plant in Pakistan………………………………………………… 32
Figure 48 – Reactor Age in Years…………………………………………………………........... 33
Figure 49 – Reactors under Construction, 2017…………………………………………..…..… 33
Figure 50 – Average Capacity Factor (%) of Different Types of Power Plants……………..... 34
Figure 51 – Uranium Production vs Reserves, 2017………………………………………….… 35
Figure 52 – Water Use for Electricity Generation by Plant Cooling Technology……….......... 37
Figure 53 – PHS Schematic…………………………………………………………………..…… 39
Figure 54 – Module Size and Power Rating of Storage Systems……………………………… 40
Figure 55 – Specific Energy, kWh/kg…………………………………………………………...… 41
Figure 56 – Energy Stored vs Energy Invested in the System………………………………… 42
Figure 57 – Major Countries for Lithium Mine Production……………………..………….……. 43
Figure 58 – Major Country Reserves of Lithium……………………………………………..….. 43
Figure 59 – Percent Change in Intensity/Unit GDP, 1981 – 2016……………..…..……….…. 44
Figure 60 – Global Ecological Deficits (red), and Reserves (green), 2016……..…………..… 44
Figure 61 – World Energy Consumption by End-Use Sector………………………………...… 45
Figure 62 – CO2 Share by Sector …………………….………………………………….……..… 45
Figure 63 – Top 15 OIC Contributors to GHG Emissions…………………………………..….. 45
Figure 64 – Effect of Improved Efficiency on Emissions and Fuel Consumed…………….…. 46
Figure 65 – Comparison of EROI for Different Power Generation Technologies………….… 47
Figure 66 – EV Production in The Major Economies………………………………………….… 49
Figure 67 – Volatility in Carbon Prices………………………………………………………........ 50
Figure 68 – Rising CO2 and Acidification of Oceans………………………………………...….. 50
Figure 69
– LCOE of Various Energy Sources………………………………………………...…. 54
Figure 71 – FITs in US Cents / kWh for RE in the OIC Regions…………………………...….. 54
Table 1 – LCOE in US cents/kWh for various sources, includes CAPEX, OPEX, Lifecycle Costs.. 8
Table 2 – Emissions in Grams of CO2-equivalent / KWh of Power Generated………….…………… 10
Table 3 – Overall Energy Mix for Electricity Generation in OIC countries…………………….……… 13
Table 4 – Global View of Population, Energy & GHG’s………………..………………………..……… 14
Table 5 – Average Direct and Indirect Land Use for Solar PV and Solar CSP Systems……........... 27
Table 6 – Typical Midsize Biogas Plants in Pakistan (IRR: *Internal Rates of Return)…….............. 30
Table 7 – Reactors by Type…………………………………………………………………….…………. 33
Table 8 – Status of Nuclear Power in OIC Countries……………………………………….…..………. 34
Table 9 – Water Required for Primary Energy Sources ………………………………………………. 36
Table 10 – Status of Global Energy Storage Deployment, 2016………………………………………... 38
Table 11 – Typical Cost Range in US$ / MWh for Storage Technology by Type……………………... 39
Table 12 – Voltage Degradation Measured and Projected for H2 Fuel Cells…………………………... 42
Table 13 – Pakistani CER’s in 2016..………………………………………………………….….……….. 49
– Status of Assessment of Global Carbon Capture and Storage………………..… 51
Figure 70
List of Tables
1
Executive Summary
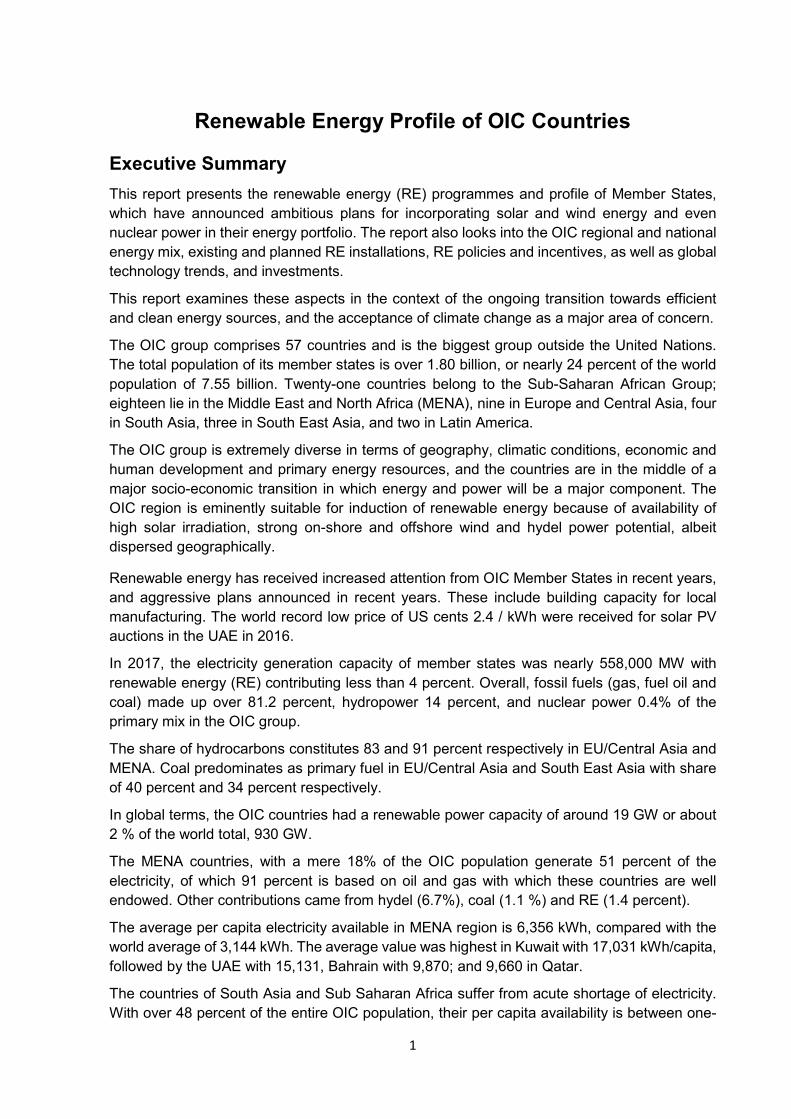
This report presents the renewable energy (RE) programmes and profile of Member States,
which have announced ambitious plans for incorporating solar and wind energy and even
nuclear power in their energy portfolio. The report also looks into the OIC regional and national
energy mix, existing and planned RE installations, RE policies and incentives, as well as global
technology trends, and investments.
This report examines these aspects in the context of the ongoing transition towards efficient
and clean energy sources, and the acceptance of climate change as a major area of concern.
The OIC group comprises 57 countries and is the biggest group outside the United Nations.
The total population of its member states is over 1.80 billion, or nearly 24 percent of the world
population of 7.55 billion. Twenty-one countries belong to the Sub-Saharan African Group;
eighteen lie in the Middle East and North Africa (MENA), nine in Europe and Central Asia, four
in South Asia, three in South East Asia, and two in Latin America.
The OIC group is extremely diverse in terms of geography, climatic conditions, economic and
human development and primary energy resources, and the countries are in the middle of a
major socio-economic transition in which energy and power will be a major component. The
OIC region is eminently suitable for induction of renewable energy because of availability of
high solar irradiation, strong on-shore and offshore wind and hydel power potential, albeit
dispersed geographically.
Renewable energy has received increased attention from OIC Member States in recent years,
and aggressive plans announced in recent years. These include building capacity for local
manufacturing. The world record low price of US cents 2.4 / kWh were received for solar PV
auctions in the UAE in 2016.
In 2017, the electricity generation capacity of member states was nearly 558,000 MW with
renewable energy (RE) contributing less than 4 percent. Overall, fossil fuels (gas, fuel oil and
coal) made up over 81.2 percent, hydropower 14 percent, and nuclear power 0.4% of the
primary mix in the OIC group.
The share of hydrocarbons constitutes 83 and 91 percent respectively in EU/Central Asia and
MENA. Coal predominates as primary fuel in EU/Central Asia and South East Asia with share
of 40 percent and 34 percent respectively.
In global terms, the OIC countries had a renewable power capacity of around 19 GW or about
2 % of the world total, 930 GW.
The MENA countries, with a mere 18% of the OIC population generate 51 percent of the
electricity, of which 91 percent is based on oil and gas with which these countries are well
endowed. Other contributions came from hydel (6.7%), coal (1.1 %) and RE (1.4 percent).
The average per capita electricity available in MENA region is 6,356 kWh, compared with the
world average of 3,144 kWh. The average value was highest in Kuwait with 17,031 kWh/capita,
followed by the UAE with 15,131, Bahrain with 9,870; and 9,660 in Qatar.
The countries of South Asia and Sub Saharan Africa suffer from acute shortage of electricity.
With over 48 percent of the entire OIC population, their per capita availability is between one-
Renewable Energy Profile of OIC Countries
2
quarter and one-sixth of the world average of 3,144 power units. Major new power plants based
on hydrocarbons are under construction in two of the largest countries, Pakistan and Nigeria,
although renewable energy sources are also receiving considerable attention.
Among RE sources, wind power is the most popular, followed by solar photovoltaic (PV),
biomass, geothermal and small hydel plants. Most solar PV installations use crystalline cells
and panels, which have low conversion efficiencies. This reflects falling prices amid a global
glut in solar PV panels.
Only Malaysia has a substantial assembly and manufacturing base in solar PV; it is actually
the world’s third largest assembler of solar modules after China and Taiwan, with 13.5 percent
of global capacity assembly of crystalline and thin film modules.
In sub Saharan Africa, the leading renewable sources are solar PV, small hydel and wind in
that order. Small, distributed, solar power markets are expanding and Bangladesh has the
highest penetration of such systems.
At present, only Pakistan and Iran have nuclear power plants in operation (total capacity 2,345
MW) with Pakistan having over fifty years of experience in operating and building such systems.
Conclusion:
The study shows that fossil fuels are not going away anywhere soon, and will continue to be a
major player for several decades in this century.
There has been a major transition towards electrification of the economies everywhere
and the OIC countries are no exception, whose people expect reliable access to
affordable energy and power.
The OIC countries are increasing the share of renewable energy in their energy mix;
several countries are formulating their incentive structures.
The OIC member countries are focusing more on onshore wind power plants, adding
over 1.2 GW in 2015.
An additional 4,000 MW of solar PV plants are under construction, with expected
completion by 2018.
Focus has shifted towards efficiency in generation and use of energy and power, and
reducing emissions of greenhouse gases in line with global trends.
The integration of renewable technologies will continue to have a major impact on the
evolution of modern transmission and distribution systems, as well as completely new
supply chains and employment opportunities.
The intrinsic variability of solar, wind and even hydel power remains a major challenge
for their wider deployment and acceptance, and storage technologies will receive the
most attention.
The true life-cycle costs of renewable technologies reveal that these are not completely
carbon neutral, and waste management will remain a particular area of concern.
While the Paris Agreement stated that “the world must achieve greenhouse gas
neutrality sometime in the second half of the century”, it is felt that there is no single
solution for reduction of greenhouse gas emissions, and limiting the global temperature
rise to 1.5oC while desirable, may remain only a wish list.
3
Modern industrial economies are built upon access to cheap, carbon based energy sources,
which have provided affordability, availability, and security over the past two hundred years.
This has been a major factor in the quality of life of their citizens, and has resulted in an ever-
improving skill-set and productivity.
The priority everywhere remains the assurance of universal access to affordable, reliable and
modern energy services, as more people move out of poverty and demand access to energy
and electricity. Demand is likely to double by 2050 compared with 2000 and the emerging
economies are expected to be responsible for 90% of the growth. A key feature of this transition
is the electrification of the global economy during the last 25 years, which grew by a factor of
about 3.5, while primary energy supplies doubled during this period.
To meet rising demands for energy and power, new forms of energy generation and efficiency,
driven by technology, have developed quite rapidly, unlike previous periods when this
happened gradually over decades. The energy mix is changing everywhere and renewable
energy presents new opportunities and challenges in the context of global warming caused by
emissions of greenhouse gases.
There are serious concerns however, that consumption of water, land, and fuel resources may
become unsustainable at the present rates of consumption. The likely impact on climate change
of the energy, water, food and pollution nexus, will therefore remain a major focus of concern
and attention in this century. The recent Paris Agreement has announced a target to limit rise
in global temperatures to less than 2oC as compared to pre-industrial levels.
As of June 2017, the global installed RE capacity (excluding hydropower and nuclear) was 920
GW, in which the share of the 57 OIC countries was a mere 2.06% (18.97 GW).
Several national and even global targets for RE deployment (such as 30% of all electricity from
wind by 2030, 50% of all energy from non-fossil sources by 2050), have been announced.
However, these are at best aspirational goals and may not be very realistic.
There is a major transition globally towards cleaner and more efficient sources of energy and
power, which is also underway in OIC Member States. This transition is driven by technology
advancements, falling costs of RE systems, as well as the expected impact of climate change
on the human habitat. At a broader level, the transition is impacted by:
i. Electrification of the global economy, and an increasing emphasis on efficiency in its
generation and use.
ii. The looming drawdown of fossil fuel resources, and volatility in their production and
prices, with the USA emerging as the world’s largest producer of oil and gas.
iii. Retreat from nuclear in some countries, and start of new plants in others.
iv. Reduction in the costs of renewable energy systems, especially solar PV and wind.
v. Integration of RE in existing T&D (transmission and distribution) infrastructure.
vi. Development of new storage systems.
This study examines various aspects of the transition, as well as technology trends and
investment needed to meet the target of 2oC with reasonable probability.
SECTION 1: SCOPE OF THE STUDY
1.1 The Energy Transition
4
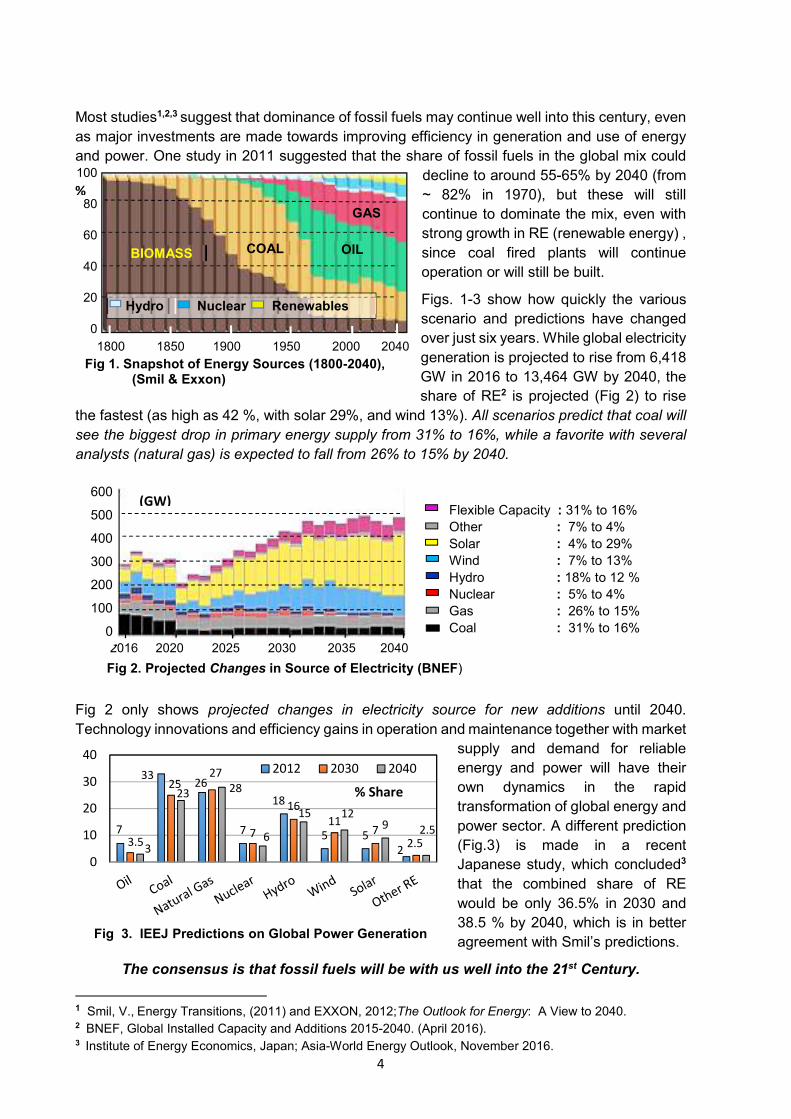
Most studies1,2,3 suggest that dominance of fossil fuels may continue well into this century, even
as major investments are made towards improving efficiency in generation and use of energy
and power. One study in 2011 suggested that the share of fossil fuels in the global mix could
decline to around 55-65% by 2040 (from
~ 82% in 1970), but these will still
continue to dominate the mix, even with
strong growth in RE (renewable energy) ,
since coal fired plants will continue
operation or will still be built.
Figs. 1-3 show how quickly the various
scenario and predictions have changed
over just six years. While global electricity
generation is projected to rise from 6,418
GW in 2016 to 13,464 GW by 2040, the
share of RE2 is projected (Fig 2) to rise
the fastest (as high as 42 %, with solar 29%, and wind 13%). All scenarios predict that coal will
see the biggest drop in primary energy supply from 31% to 16%, while a favorite with several
analysts (natural gas) is expected to fall from 26% to 15% by 2040.
Fig 2 only shows projected changes in electricity source for new additions until 2040.
Technology innovations and efficiency gains in operation and maintenance together with market
supply and demand for reliable
energy and power will have their
own dynamics in the rapid
transformation of global energy and
power sector. A different prediction
(Fig.3) is made in a recent
Japanese study, which concluded3
that the combined share of RE
would be only 36.5% in 2030 and
38.5 % by 2040, which is in better
agreement with Smil’s predictions.
The consensus is that fossil fuels will be with us well into the 21st Century.
1 Smil, V., Energy Transitions, (2011) and EXXON, 2012;The Outlook for Energy: A View to 2040. 2 BNEF, Global Installed Capacity and Additions 2015-2040. (April 2016). 3 Institute of Energy Economics, Japan; Asia-World Energy Outlook, November 2016.
Fig 1. Snapshot of Energy Sources (1800-2040), (Smil & Exxon)
1800 1850 1900 1950 2000 2040
100
80
60
40
20
0
GAS
OIL COAL BIOMASS
%
Hydro Nuclear Renewables
2016 2020 2025 2030 2035 2040
Fig 2. Projected Changes in Source of Electricity (BNEF)
600
500
400
300
200
100
0
Flexible Capacity : 31% to 16%
Other : 7% to 4%
Solar : 4% to 29%
Wind : 7% to 13%
Hydro : 18% to 12 %
Nuclear : 5% to 4%
Gas : 26% to 15%
Coal : 31% to 16%
(GW)
7
3326
7
18
5 5
23.5
2527
7
16
117
2.53
23 28
6
15 129 2.5
0
10
20
30
402012 2030 2040
% Share
Fig 3. IEEJ Predictions on Global Power Generation
5
There is general acceptance that rise in global temperatures need to be kept well below two
degrees Celsius (2°C) above pre-industrial levels. The emphasis is on the desirability to pursue
efforts to limit the temperature increase even further to 1.5oC in this century, as set out in the
Paris Agreement4 whose basic message is that “The world must achieve greenhouse gas
neutrality at some time in the second half of the century”. This implies reduction in the
prevalence of atmospheric CO2 (which reached 400 ppm for the first time in 2013), to be to the
level of 275 ppm before the start of the industrial revolution.
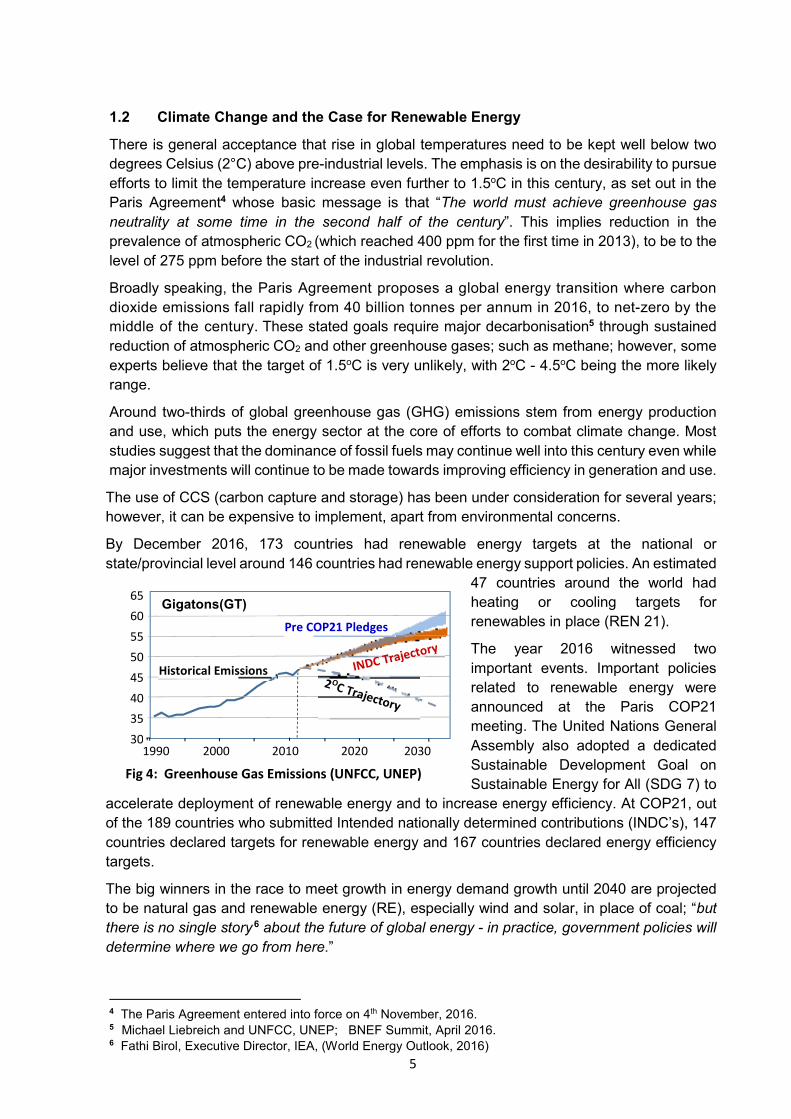
Broadly speaking, the Paris Agreement proposes a global energy transition where carbon
dioxide emissions fall rapidly from 40 billion tonnes per annum in 2016, to net-zero by the
middle of the century. These stated goals require major decarbonisation5 through sustained
reduction of atmospheric CO2 and other greenhouse gases; such as methane; however, some
experts believe that the target of 1.5oC is very unlikely, with 2oC - 4.5oC being the more likely
range.
Around two-thirds of global greenhouse gas (GHG) emissions stem from energy production
and use, which puts the energy sector at the core of efforts to combat climate change. Most
studies suggest that the dominance of fossil fuels may continue well into this century even while
major investments will continue to be made towards improving efficiency in generation and use.
The use of CCS (carbon capture and storage) has been under consideration for several years;
however, it can be expensive to implement, apart from environmental concerns.
By December 2016, 173 countries had renewable energy targets at the national or
state/provincial level around 146 countries had renewable energy support policies. An estimated
47 countries around the world had
heating or cooling targets for
renewables in place (REN 21).
The year 2016 witnessed two
important events. Important policies
related to renewable energy were
announced at the Paris COP21
meeting. The United Nations General
Assembly also adopted a dedicated
Sustainable Development Goal on
Sustainable Energy for All (SDG 7) to
accelerate deployment of renewable energy and to increase energy efficiency. At COP21, out
of the 189 countries who submitted Intended nationally determined contributions (INDC’s), 147
countries declared targets for renewable energy and 167 countries declared energy efficiency
targets.
The big winners in the race to meet growth in energy demand growth until 2040 are projected
to be natural gas and renewable energy (RE), especially wind and solar, in place of coal; “but
there is no single story 6 about the future of global energy - in practice, government policies will
determine where we go from here.”
4 The Paris Agreement entered into force on 4th November, 2016. 5 Michael Liebreich and UNFCC, UNEP; BNEF Summit, April 2016. 6 Fathi Birol, Executive Director, IEA, (World Energy Outlook, 2016)
Fig 4: Greenhouse Gas Emissions (UNFCC, UNEP)
1990 2000 2010 2020 2030
65
60
55
50
45
40
35
30
Gigatons(GT)
Historical Emissions
Pre COP21 Pledges
1.2 Climate Change and the Case for Renewable Energy
6
Natural gas is currently regarded as an important and critical ‘bridge fuel’ in the transition from
carbon intensive coal and petroleum, for meeting electricity demand and reducing emissions of
greenhouse gases (GHG). The dilemma is that natural gas is also becoming a major polluter,
and CO2 emissions from natural gas exceeded 7 that from coal by 10% in the USA in 2016.
Production of natural gas (methane) generally entails leakages of 3% - 7%, whose carbon
footprint may be 29 times higher than that of from coal fired plants8.
While the trajectory for deep de-carbonization needs to be maintained over the short term, the
transition in the long term, demands new, and as yet unavailable technologies, and tools.
The problem with power generation from solar and wind is that it does not offer ‘base-load’
supply (i.e. 24/7 availability), which is only possible at present through fossil or nuclear fuels.
The intrinsic variability and even intermittency of solar and wind power (Fig. 6-8), is the biggest
challenge for their integration with existing systems. Hydropower also cannot always provide
base-load in many countries, as it can be seasonal, its primary function often being water
storage for agriculture.
Bio-fuels can have negative impact on food crops, and reaching 2% of global share could
require an area as large as France. Biofuels have lost popularity for new investment because
of over-capacity in countries (USA and Brazil) which had stipulated mandatory levels for use in
the vehicles fuel system, coupled with non-emergence of economical non-food sources, and
finally the emergence of electric vehicles, which may or may not be more effective in reducing
emissions.
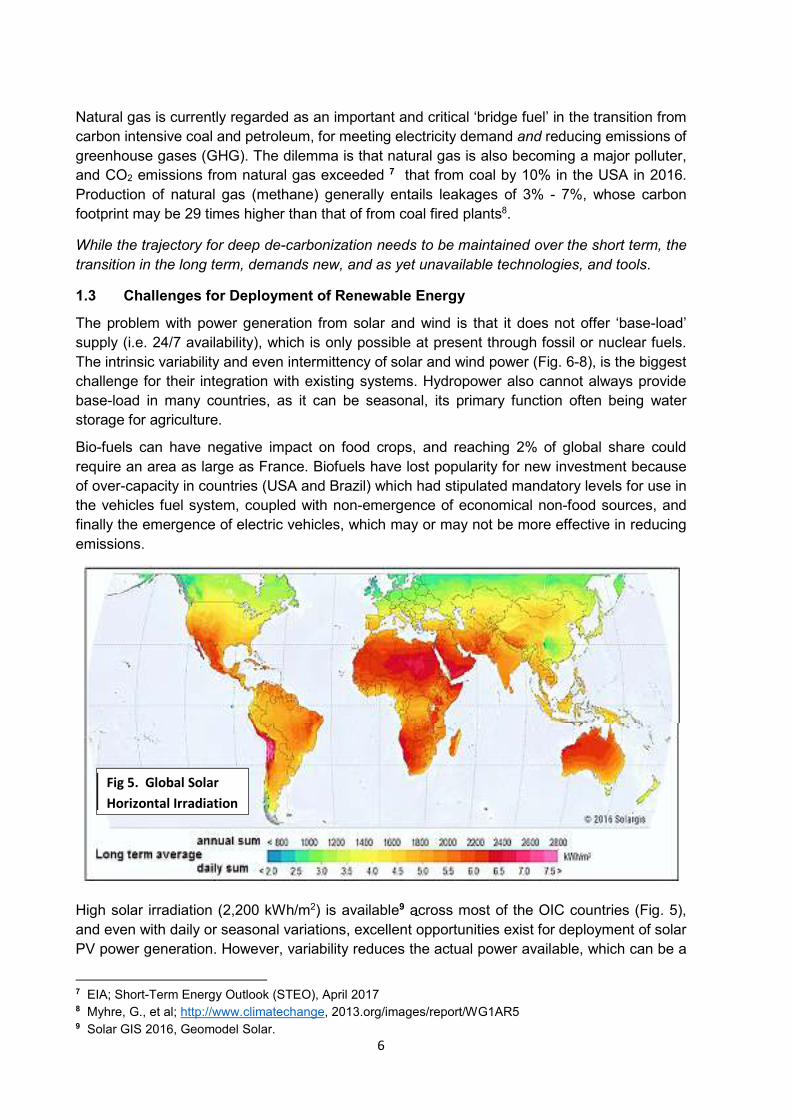
High solar irradiation (2,200 kWh/m2) is available9 across most of the OIC countries (Fig. 5),
and even with daily or seasonal variations, excellent opportunities exist for deployment of solar
PV power generation. However, variability reduces the actual power available, which can be a
7 EIA; Short-Term Energy Outlook (STEO), April 2017 8 Myhre, G., et al; http://www.climatechange, 2013.org/images/report/WG1AR5 9 Solar GIS 2016, Geomodel Solar.
Fig 5. Global Solar
Horizontal Irradiation
1.3 Challenges for Deployment of Renewable Energy
7
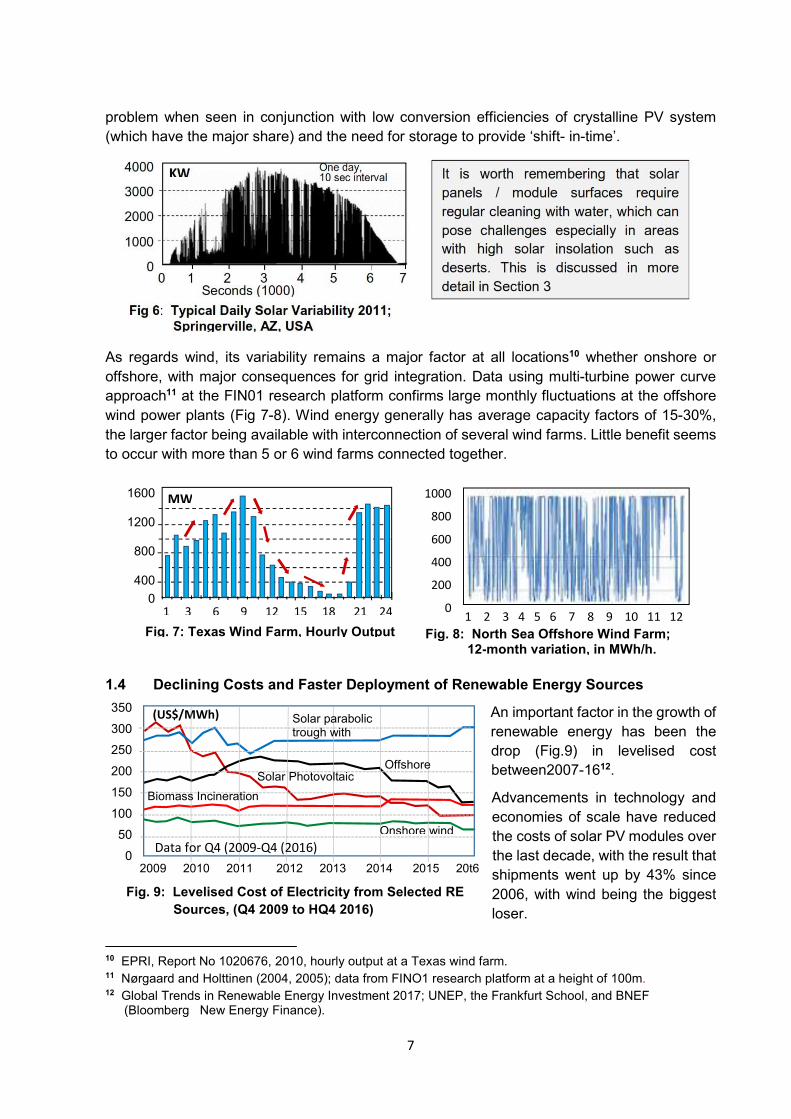
problem when seen in conjunction with low conversion efficiencies of crystalline PV system
(which have the major share) and the need for storage to provide ‘shift- in-time’.
As regards wind, its variability remains a major factor at all locations10 whether onshore or
offshore, with major consequences for grid integration. Data using multi-turbine power curve
approach11 at the FIN01 research platform confirms large monthly fluctuations at the offshore
wind power plants (Fig 7-8). Wind energy generally has average capacity factors of 15-30%,
the larger factor being available with interconnection of several wind farms. Little benefit seems
to occur with more than 5 or 6 wind farms connected together.
An important factor in the growth of
renewable energy has been the
drop (Fig.9) in levelised cost
between2007-1612.
Advancements in technology and
economies of scale have reduced
the costs of solar PV modules over
the last decade, with the result that
shipments went up by 43% since
2006, with wind being the biggest
loser.
10 EPRI, Report No 1020676, 2010, hourly output at a Texas wind farm. 11 Nørgaard and Holttinen (2004, 2005); data from FINO1 research platform at a height of 100m. 12 Global Trends in Renewable Energy Investment 2017; UNEP, the Frankfurt School, and BNEF
(Bloomberg New Energy Finance).
It is worth remembering that solar
panels / module surfaces require
regular cleaning with water, which can
pose challenges especially in areas
with high solar insolation such as
deserts. This is discussed in more
detail in Section 3
4000
3000
2000
1000
0
KW One day, 10 sec interval
Fig 6: Typical Daily Solar Variability 2011; Springerville, AZ, USA
0 1 2 3 4 5 6 7 Seconds (1000)
1600
1200
800
400
0
MW
1 3 6 9 12 15 18 21 24
Fig. 7: Texas Wind Farm, Hourly Output Fig. 8: North Sea Offshore Wind Farm; 12-month variation, in MWh/h.
1000
800
600
400
200
0 1 2 3 4 5 6 7 8 9 10 11 12
(US$/MWh) 350
300
250
200
150
100
50
0 Data for Q4 (2009-Q4 (2016)
2009 2010 2011 2012 2013 2014 2015 20t6
Fig. 9: Levelised Cost of Electricity from Selected RE
Sources, (Q4 2009 to HQ4 2016)
Solar Photovoltaic
Solar parabolic trough with
Offshore
Biomass Incineration
Onshore wind
1.4 Declining Costs and Faster Deployment of Renewable Energy Sources
8
Solar PV registered the biggest price fall (a factor of 3) during 2009-16 and hence the largest
increase in shipment; offshore wind power still costs nearly twice as much as onshore power.
The main driver in cost reductions, especially in the solar PV sector, has been the extraordinary
increase in production in China since 2009, after the country adopted the German model for
FITs (feed-in-tariffs) and special subsidies.
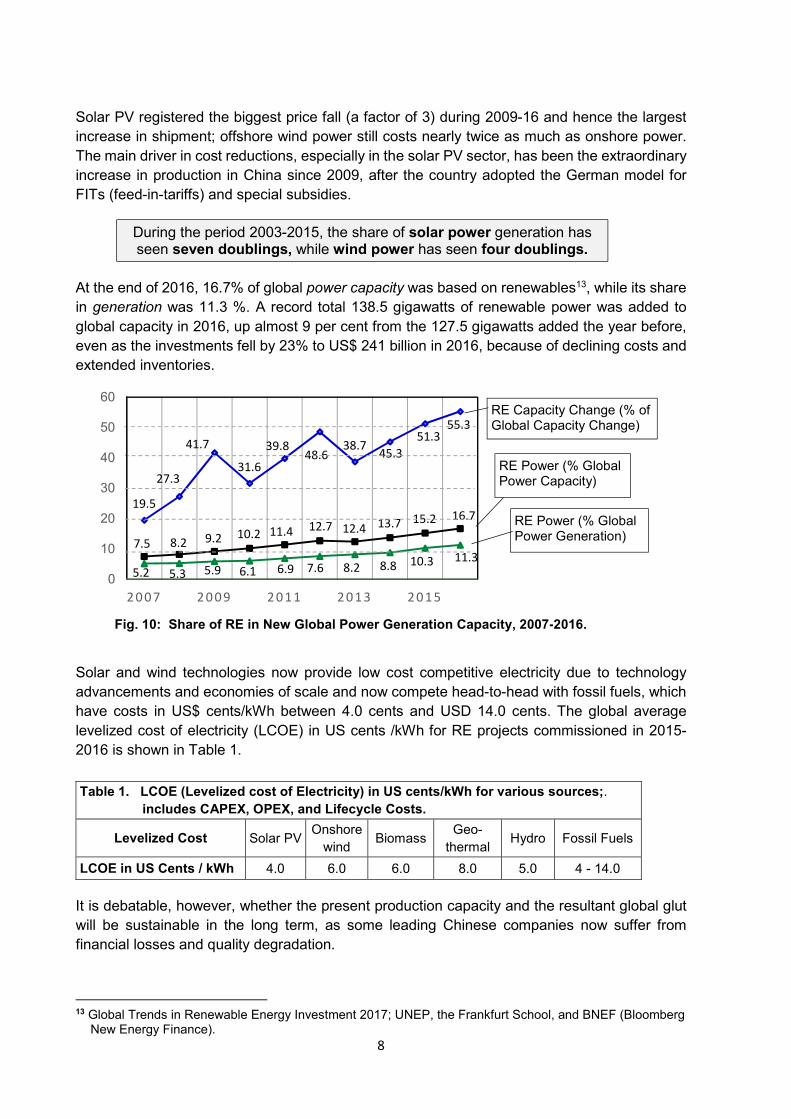
At the end of 2016, 16.7% of global power capacity was based on renewables13, while its share
in generation was 11.3 %. A record total 138.5 gigawatts of renewable power was added to
global capacity in 2016, up almost 9 per cent from the 127.5 gigawatts added the year before,
even as the investments fell by 23% to US$ 241 billion in 2016, because of declining costs and
extended inventories.
Solar and wind technologies now provide low cost competitive electricity due to technology
advancements and economies of scale and now compete head-to-head with fossil fuels, which
have costs in US$ cents/kWh between 4.0 cents and USD 14.0 cents. The global average
levelized cost of electricity (LCOE) in US cents /kWh for RE projects commissioned in 2015-
2016 is shown in Table 1.
It is debatable, however, whether the present production capacity and the resultant global glut
will be sustainable in the long term, as some leading Chinese companies now suffer from
financial losses and quality degradation.
13 Global Trends in Renewable Energy Investment 2017; UNEP, the Frankfurt School, and BNEF (Bloomberg
New Energy Finance).
Table 1. LCOE (Levelized cost of Electricity) in US cents/kWh for various sources;.
includes CAPEX, OPEX, and Lifecycle Costs.
Levelized Cost Solar PV Onshore
wind Biomass
Geo-
thermal Hydro Fossil Fuels
LCOE in US Cents / kWh 4.0 6.0 6.0 8.0 5.0 4 - 14.0
During the period 2003-2015, the share of solar power generation has seen seven doublings, while wind power has seen four doublings.
19.5
27.3
41.7
31.6
39.848.6
38.745.3
51.355.3
7.5 8.2 9.2 10.2 11.4 12.7 12.4 13.7 15.2 16.7
5.2 5.3 5.9 6.1 6.9 7.6 8.2 8.8 10.3 11.3
0
10
20
30
40
50
60
2 0 0 7 2 0 0 9 2 0 1 1 2 0 1 3 2 0 1 5
Fig. 10: Share of RE in New Global Power Generation Capacity, 2007-2016.
RE Power (% Global Power Capacity)
RE Power (% Global Power Generation)
RE Capacity Change (% of Global Capacity Change)
9
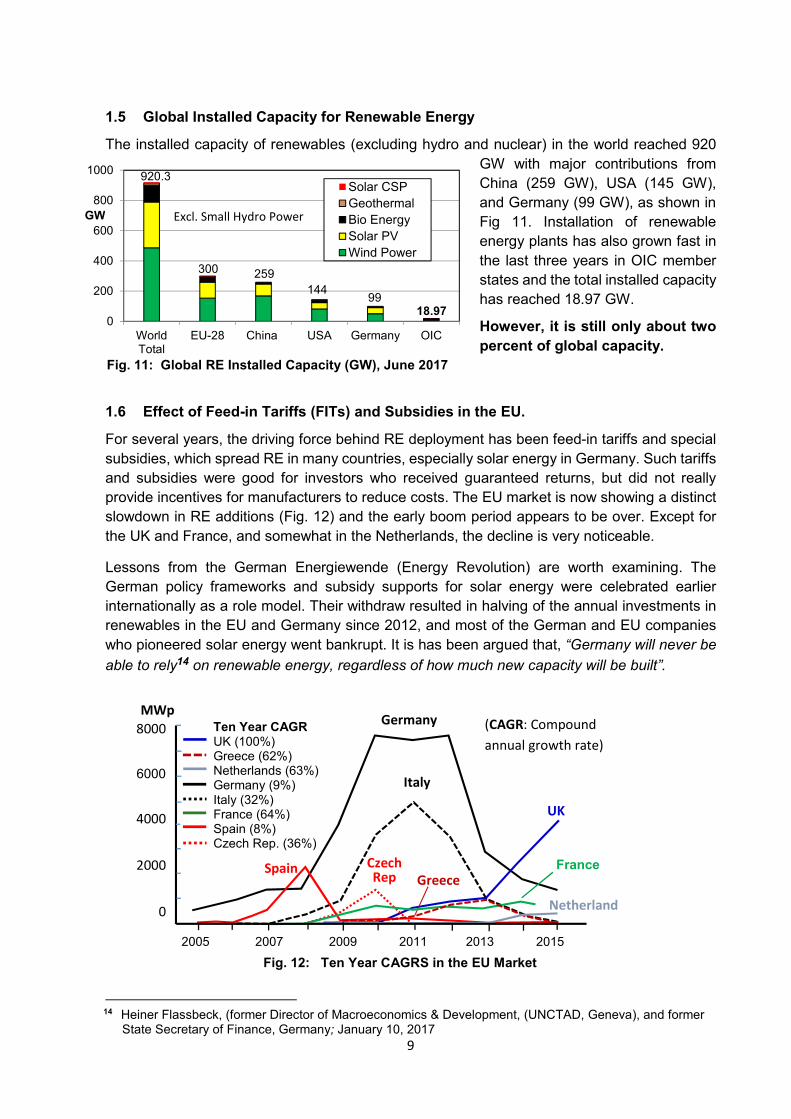
The installed capacity of renewables (excluding hydro and nuclear) in the world reached 920
GW with major contributions from
China (259 GW), USA (145 GW),
and Germany (99 GW), as shown in
Fig 11. Installation of renewable
energy plants has also grown fast in
the last three years in OIC member
states and the total installed capacity
has reached 18.97 GW.
However, it is still only about two
percent of global capacity.
Lessons from the German Energiewende (Energy Revolution) are worth examining. The
German policy frameworks and subsidy supports for solar energy were celebrated earlier
internationally as a role model. Their withdraw resulted in halving of the annual investments in
renewables in the EU and Germany since 2012, and most of the German and EU companies
who pioneered solar energy went bankrupt. It is has been argued that, “Germany will never be
able to rely14 on renewable energy, regardless of how much new capacity will be built”.
14 Heiner Flassbeck, (former Director of Macroeconomics & Development, (UNCTAD, Geneva), and former
State Secretary of Finance, Germany; January 10, 2017
0
200
400
600
800
1000
WorldTotal
EU-28 China USA Germany OIC
Solar CSP
Geothermal
Bio Energy
Solar PV
Wind Power
920.3
300 259
144 99
18.97
Fig. 11: Global RE Installed Capacity (GW), June 2017
GW
MWp
8000
6000
4000
2000
0
Germany Ten Year CAGR UK (100%) Greece (62%) Netherlands (63%) Germany (9%) Italy (32%) France (64%) Spain (8%) Czech Rep. (36%)
2005 2007 2009 2011 2013 2015
Italy
UK
Spain Czech Rep
France
Greece
Netherland
Fig. 12: Ten Year CAGRS in the EU Market
(CAGR: Compound
annual growth rate)
Excl. Small Hydro Power
1.5 Global Installed Capacity for Renewable Energy
For several years, the driving force behind RE deployment has been feed-in tariffs and special
subsidies, which spread RE in many countries, especially solar energy in Germany. Such tariffs
and subsidies were good for investors who received guaranteed returns, but did not really
provide incentives for manufacturers to reduce costs. The EU market is now showing a distinct
slowdown in RE additions (Fig. 12) and the early boom period appears to be over. Except for
the UK and France, and somewhat in the Netherlands, the decline is very noticeable.
1.6 Effect of Feed-in Tariffs (FITs) and Subsidies in the EU.
10
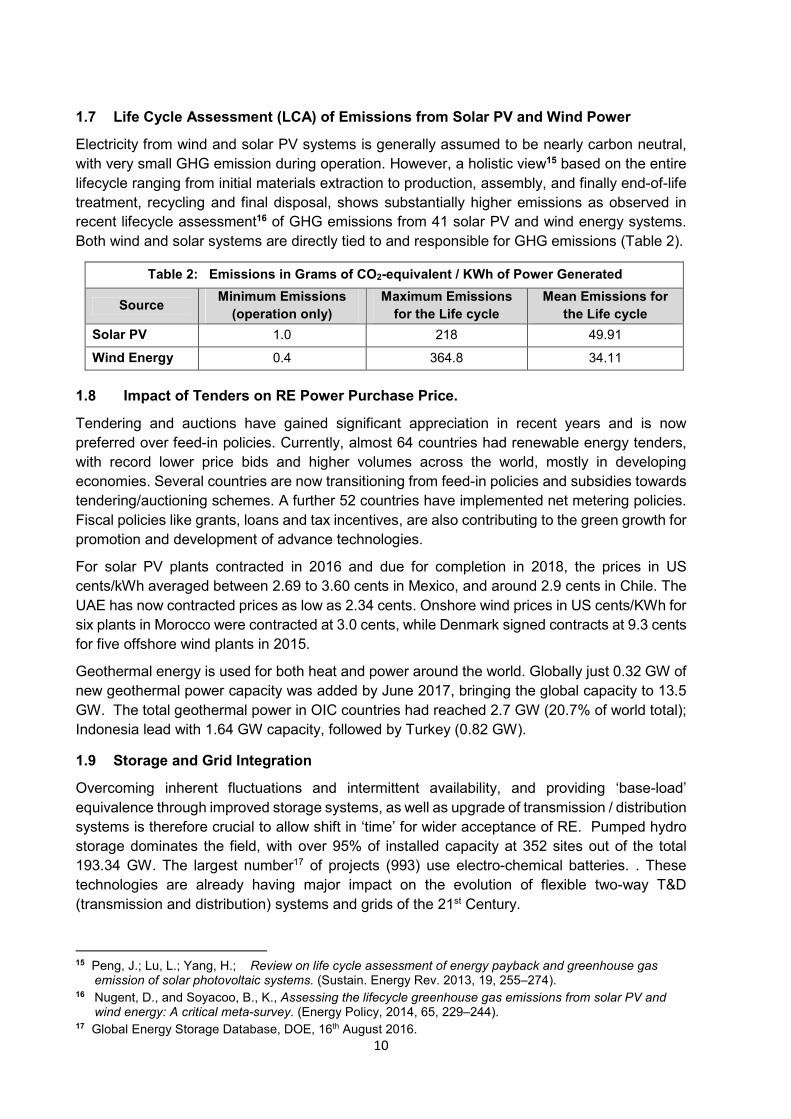
Electricity from wind and solar PV systems is generally assumed to be nearly carbon neutral,
with very small GHG emission during operation. However, a holistic view15 based on the entire
lifecycle ranging from initial materials extraction to production, assembly, and finally end-of-life
treatment, recycling and final disposal, shows substantially higher emissions as observed in
recent lifecycle assessment16 of GHG emissions from 41 solar PV and wind energy systems.
Both wind and solar systems are directly tied to and responsible for GHG emissions (Table 2).
Tendering and auctions have gained significant appreciation in recent years and is now
preferred over feed-in policies. Currently, almost 64 countries had renewable energy tenders,
with record lower price bids and higher volumes across the world, mostly in developing
economies. Several countries are now transitioning from feed-in policies and subsidies towards
tendering/auctioning schemes. A further 52 countries have implemented net metering policies.
Fiscal policies like grants, loans and tax incentives, are also contributing to the green growth for
promotion and development of advance technologies.
For solar PV plants contracted in 2016 and due for completion in 2018, the prices in US
cents/kWh averaged between 2.69 to 3.60 cents in Mexico, and around 2.9 cents in Chile. The
UAE has now contracted prices as low as 2.34 cents. Onshore wind prices in US cents/KWh for
six plants in Morocco were contracted at 3.0 cents, while Denmark signed contracts at 9.3 cents
for five offshore wind plants in 2015.
Geothermal energy is used for both heat and power around the world. Globally just 0.32 GW of
new geothermal power capacity was added by June 2017, bringing the global capacity to 13.5
GW. The total geothermal power in OIC countries had reached 2.7 GW (20.7% of world total);
Indonesia lead with 1.64 GW capacity, followed by Turkey (0.82 GW).
Overcoming inherent fluctuations and intermittent availability, and providing ‘base-load’
equivalence through improved storage systems, as well as upgrade of transmission / distribution
systems is therefore crucial to allow shift in ‘time’ for wider acceptance of RE. Pumped hydro
storage dominates the field, with over 95% of installed capacity at 352 sites out of the total
193.34 GW. The largest number17 of projects (993) use electro-chemical batteries. . These
technologies are already having major impact on the evolution of flexible two-way T&D
(transmission and distribution) systems and grids of the 21st Century.
15 Peng, J.; Lu, L.; Yang, H.; Review on life cycle assessment of energy payback and greenhouse gas
emission of solar photovoltaic systems. (Sustain. Energy Rev. 2013, 19, 255–274). 16 Nugent, D., and Soyacoo, B., K., Assessing the lifecycle greenhouse gas emissions from solar PV and
wind energy: A critical meta-survey. (Energy Policy, 2014, 65, 229–244). 17 Global Energy Storage Database, DOE, 16th August 2016.
Table 2: Emissions in Grams of CO2-equivalent / KWh of Power Generated
Source Minimum Emissions
(operation only)
Maximum Emissions
for the Life cycle
Mean Emissions for
the Life cycle
Solar PV 1.0 218 49.91
Wind Energy 0.4 364.8 34.11
1.7 Life Cycle Assessment (LCA) of Emissions from Solar PV and Wind Power
1.8 Impact of Tenders on RE Power Purchase Price.
1.9 Storage and Grid Integration
11
Some Conclusions:
i. The energy transition is part of the move towards cleaner and more efficient power
generation and use, driven by increased production capacity and rapid technological
changes.
ii. The global RE installed capacity in Jan 2017 was 920 GW, in which the share of all OIC
countries was about 18.97 GW (~2.06%).
iii. 2016 was a good year for RE which contributed over 55% share of new power additions
around the globe. The annual shipments of solar PV increased the most, followed by
offshore wind power. However, severe strain has emerged in Chinese solar panel
makers, as the government has started reducing special subsidies and tariffs.
iv. The year 2016 was also exceptional for low power prices from RE because of
tendering/auctions and the availability of extended module capacity and inventories.
v. Storage technologies and regulation of on-site batteries is an important current issue.
vi. Several OIC countries have ambitious plans for incorporating solar, wind energy, and
even nuclear power in their energy mix, with an additional 4.2 GW of wind and solar
under construction
vii. Local manufacturing has not yet received adequate attention by OIC countries.
viii. Wind and solar power generation is not completely carbon neutral if the complete
lifecycle (material extraction, manufacture, and ultimate disposal is considered.
ix. There is major debate underway about the true life of the solar PV systems, which
includes batteries, other material and even the PV module itself.
x. An area of concern for OIC Member States is the need for clean water for regular
cleaning of module surfaces, which is extremely relevant for water scarce states.
xi. Will we reach the intended target in global warming of under 2oC by the end of this
century? Probably not, but decarbonisation coupled with changes in lifestyles will are
essential to reach close to even 2oC with any reasonable certainty.
xii. A key message is that fossil fuels are not going away anywhere soon. Renewable
energies will only complement and will not replace fossil fuels entirely.
18 The New Policies Scenario, NEA, 2015.
2014-2020
2021-2025
2026-2030
2031-2035
(Percent) 20 40 60 80 100
Fossil Fuels
Power T&D
Non-Fossil
Efficiency
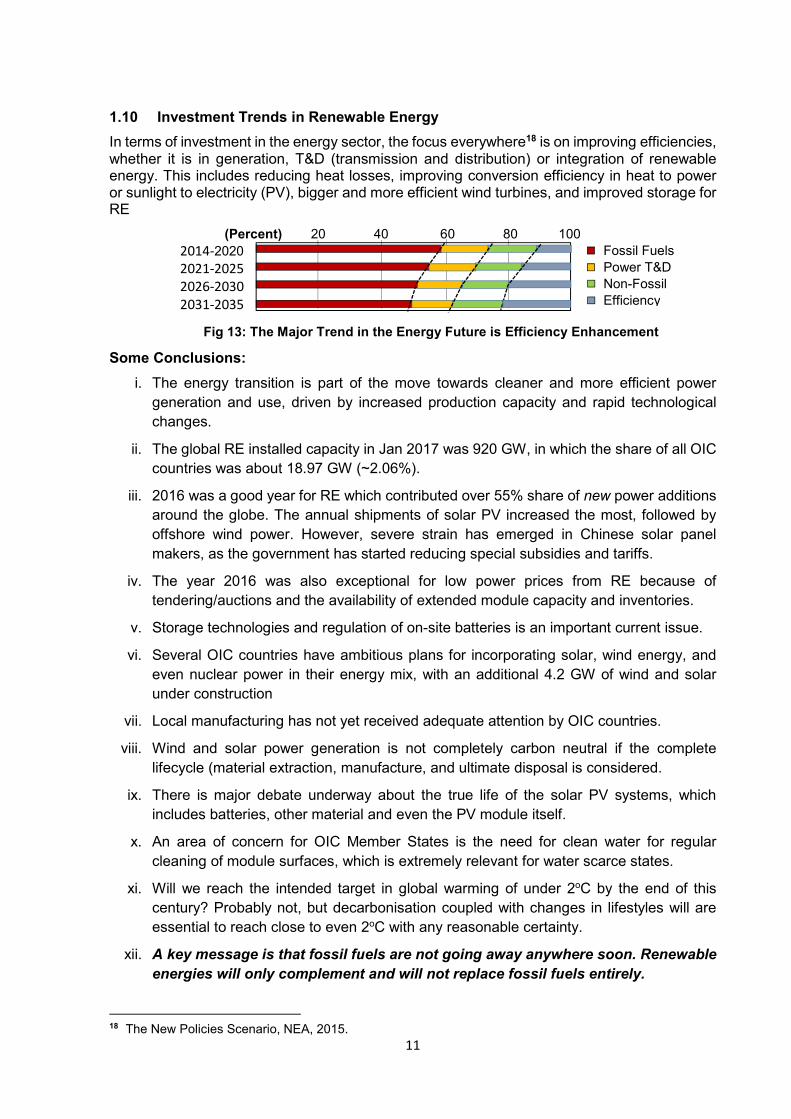
Fig 13: The Major Trend in the Energy Future is Efficiency Enhancement
In terms of investment in the energy sector, the focus everywhere18 is on improving efficiencies, whether it is in generation, T&D (transmission and distribution) or integration of renewable energy. This includes reducing heat losses, improving conversion efficiency in heat to power or sunlight to electricity (PV), bigger and more efficient wind turbines, and improved storage for RE
1.10 Investment Trends in Renewable Energy
12
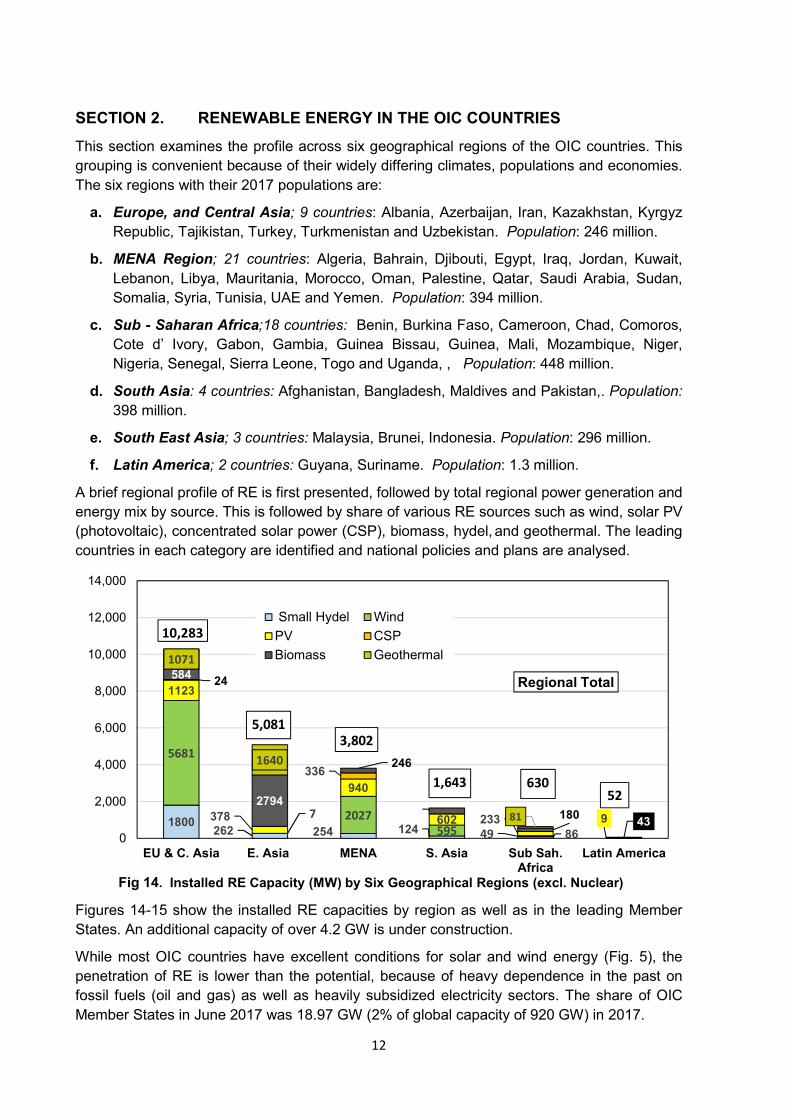
This section examines the profile across six geographical regions of the OIC countries. This
grouping is convenient because of their widely differing climates, populations and economies.
The six regions with their 2017 populations are:
a. Europe, and Central Asia; 9 countries: Albania, Azerbaijan, Iran, Kazakhstan, Kyrgyz
Republic, Tajikistan, Turkey, Turkmenistan and Uzbekistan. Population: 246 million.
b. MENA Region; 21 countries: Algeria, Bahrain, Djibouti, Egypt, Iraq, Jordan, Kuwait,
Lebanon, Libya, Mauritania, Morocco, Oman, Palestine, Qatar, Saudi Arabia, Sudan,
Somalia, Syria, Tunisia, UAE and Yemen. Population: 394 million.
c. Sub - Saharan Africa;18 countries: Benin, Burkina Faso, Cameroon, Chad, Comoros,
Cote d’ Ivory, Gabon, Gambia, Guinea Bissau, Guinea, Mali, Mozambique, Niger,
Nigeria, Senegal, Sierra Leone, Togo and Uganda, , Population: 448 million.
d. South Asia: 4 countries: Afghanistan, Bangladesh, Maldives and Pakistan,. Population:
398 million.
e. South East Asia; 3 countries: Malaysia, Brunei, Indonesia. Population: 296 million.
f. Latin America; 2 countries: Guyana, Suriname. Population: 1.3 million.
A brief regional profile of RE is first presented, followed by total regional power generation and
energy mix by source. This is followed by share of various RE sources such as wind, solar PV
(photovoltaic), concentrated solar power (CSP), biomass, hydel, and geothermal. The leading
countries in each category are identified and national policies and plans are analysed.
Figures 14-15 show the installed RE capacities by region as well as in the leading Member
States. An additional capacity of over 4.2 GW is under construction.
While most OIC countries have excellent conditions for solar and wind energy (Fig. 5), the
penetration of RE is lower than the potential, because of heavy dependence in the past on
fossil fuels (oil and gas) as well as heavily subsidized electricity sectors. The share of OIC
Member States in June 2017 was 18.97 GW (2% of global capacity of 920 GW) in 2017.
1800262 254 124 86
5681
7 2027
595 49
1123
378
940
602 233 9
24
336
584
2794
246
323 18043
1071
1640
81
0
2,000
4,000
6,000
8,000
10,000
12,000
14,000
EU & C. Asia E. Asia MENA S. Asia Sub Sah.Africa
Latin America
Regional Total
Small Hydel Wind
PV CSP
Biomass Geothermal
Fig 14. Installed RE Capacity (MW) by Six Geographical Regions (excl. Nuclear)
10,283
3,802
5,081
1,643 630
52
SECTION 2. RENEWABLE ENERGY IN THE OIC COUNTRIES
13
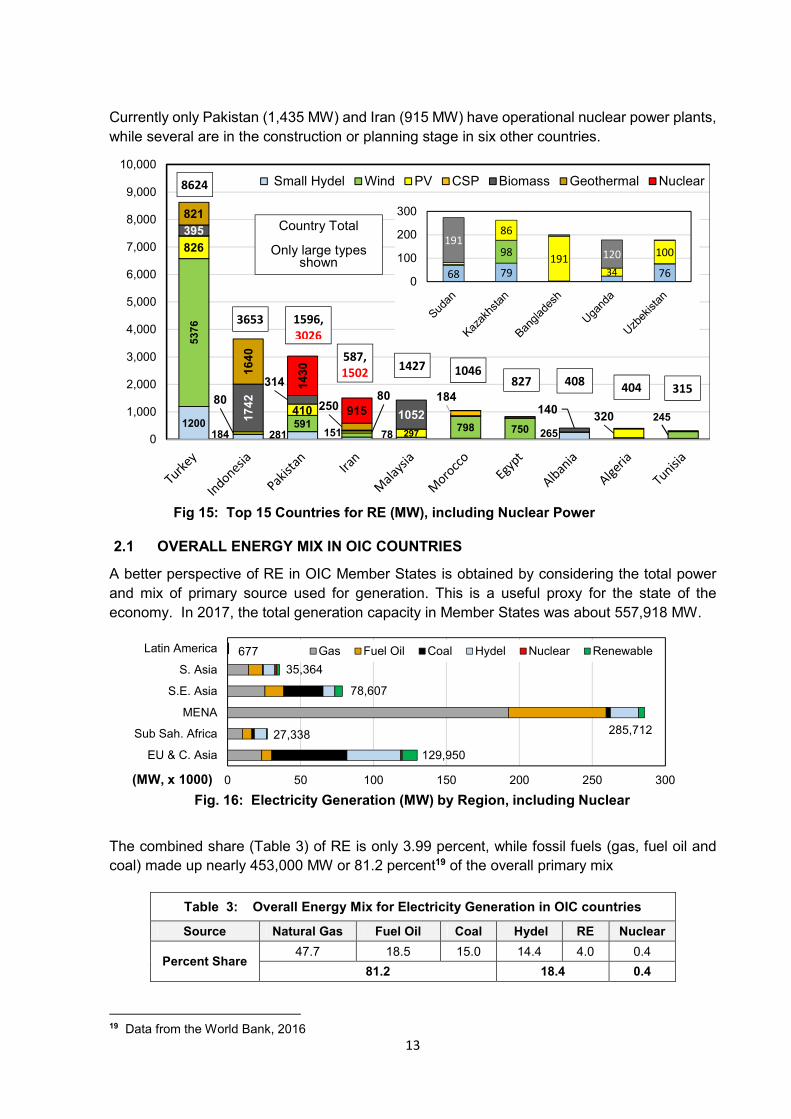
Currently only Pakistan (1,435 MW) and Iran (915 MW) have operational nuclear power plants,
while several are in the construction or planning stage in six other countries.
A better perspective of RE in OIC Member States is obtained by considering the total power
and mix of primary source used for generation. This is a useful proxy for the state of the
economy. In 2017, the total generation capacity in Member States was about 557,918 MW.
The combined share (Table 3) of RE is only 3.99 percent, while fossil fuels (gas, fuel oil and
coal) made up nearly 453,000 MW or 81.2 percent19 of the overall primary mix
19 Data from the World Bank, 2016
Table 3: Overall Energy Mix for Electricity Generation in OIC countries
Source Natural Gas Fuel Oil Coal Hydel RE Nuclear
Percent Share 47.7 18.5 15.0 14.4 4.0 0.4
81.2 18.4 0.4
1200184 281 78 265
5376
591151
798 750245
826
80410
80
297
320
184
395
17
42
314
1052 140
821
16
40
250
14
30
915
0
1,000
2,000
3,000
4,000
5,000
6,000
7,000
8,000
9,000
10,000
Small Hydel Wind PV CSP Biomass Geothermal Nuclear
Country Total
Only large types shown
68 79 76
98
86
191
34
100191
120
0
100
200
300
Fig 15: Top 15 Countries for RE (MW), including Nuclear Power
0 50 100 150 200 250 300
EU & C. Asia
Sub Sah. Africa
MENA
S.E. Asia
S. Asia
Latin America Gas Fuel Oil Coal Hydel Nuclear Renewable
Fig. 16: Electricity Generation (MW) by Region, including Nuclear
677
35,364
78,607
129,950
285,71227,338
(MW, x 1000)
8624
1427 587,
1502
1596,
3026
3653
827 1046
408 404 315
2.1 OVERALL ENERGY MIX IN OIC COUNTRIES
14
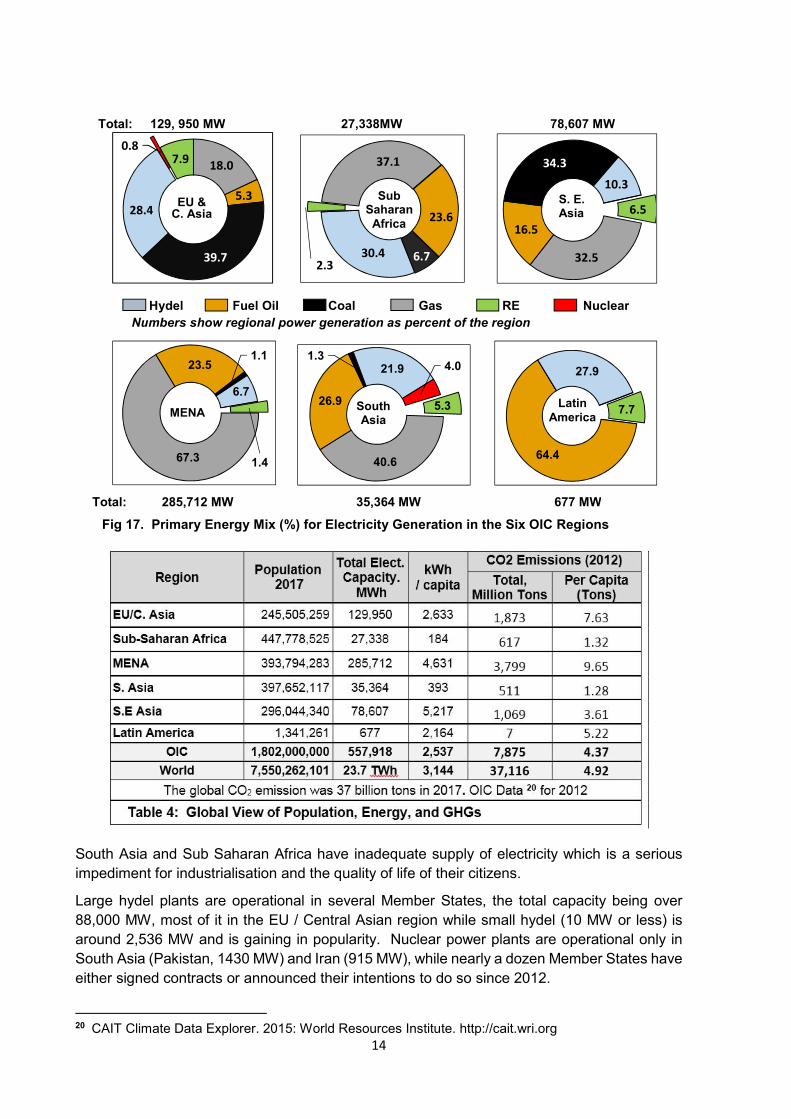
South Asia and Sub Saharan Africa have inadequate supply of electricity which is a serious
impediment for industrialisation and the quality of life of their citizens.
Large hydel plants are operational in several Member States, the total capacity being over
88,000 MW, most of it in the EU / Central Asian region while small hydel (10 MW or less) is
around 2,536 MW and is gaining in popularity. Nuclear power plants are operational only in
South Asia (Pakistan, 1430 MW) and Iran (915 MW), while nearly a dozen Member States have
either signed contracts or announced their intentions to do so since 2012.
20 CAIT Climate Data Explorer. 2015: World Resources Institute. http://cait.wri.org
Region Population
2017
Total Elect. Capacity.
MWh
kWh / capita
CO2 Emissions (2012)
Total, Million Tons
Per Capita (Tons)
EU/C. Asia 245,505,259 129,950 2,633 1,873 7.63
Sub-Saharan Africa 447,778,525 27,338 184 617 1.32
MENA 393,794,283 285,712 4,631 3,799 9.65
S. Asia 397,652,117 35,364 393 511 1.28
S.E Asia 296,044,340 78,607 5,217 1,069 3.61
Latin America 1,341,261 677 2,164 7 5.22
OIC 1,802,000,000 557,918 2,537 7,875 4.37
World 7,550,262,101 23.7 TWh 3,144 37,116 4.92
The global CO2 emission was 37 billion tons in 2017. OIC Data 20 for 2012
Table 4: Global View of Population, Energy, and GHGs
32.5
16.5
34.3
10.3
6.5S. E. Asia
37.1
23.6
6.730.42.3
18.0
5.3
39.7
28.4
0.87.9
EU & C. Asia
Hydel Fuel Oil Coal Gas RE Nuclear
Numbers show regional power generation as percent of the region
Total: 129, 950 MW 27,338MW 78,607 MW
Fig 17. Primary Energy Mix (%) for Electricity Generation in the Six OIC Regions
Total: 285,712 MW 35,364 MW 677 MW
Sub Saharan
Africa
40.6
26.9
1.321.9 4.0
5.3South Asia
67.3
23.51.1
6.7
1.4
MENA
64.4
27.9
7.7Latin
America
15
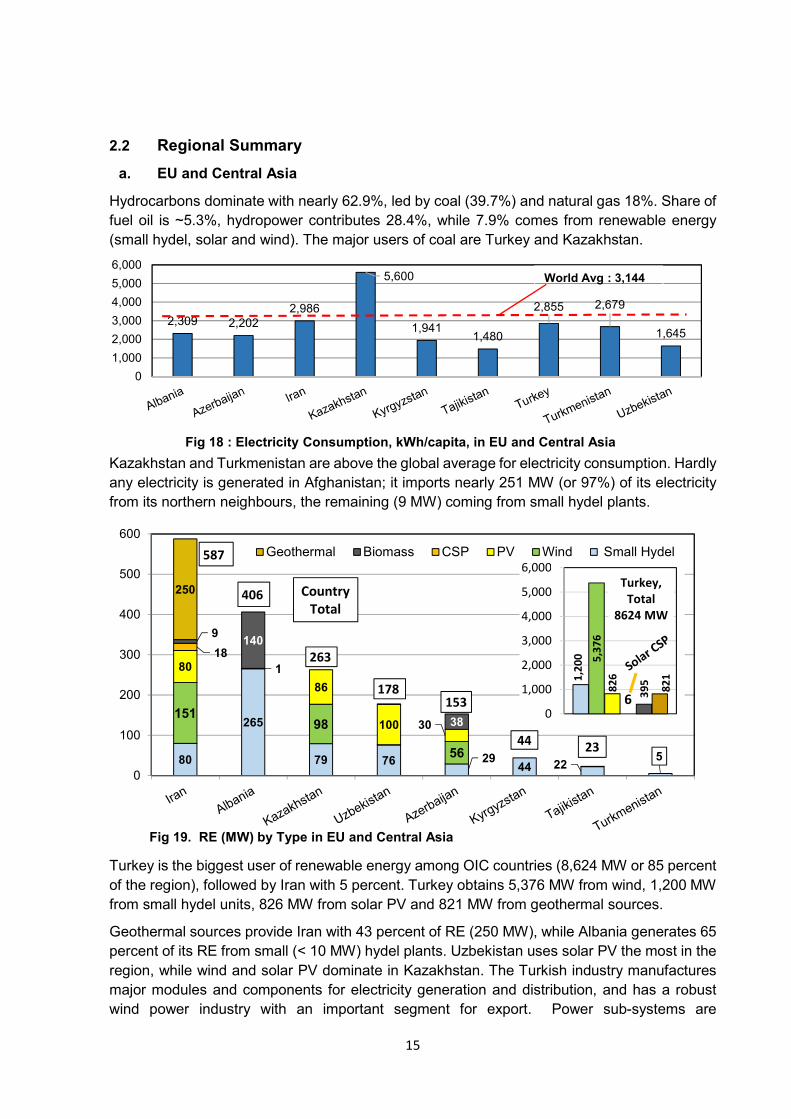
a. EU and Central Asia
Hydrocarbons dominate with nearly 62.9%, led by coal (39.7%) and natural gas 18%. Share of
fuel oil is ~5.3%, hydropower contributes 28.4%, while 7.9% comes from renewable energy
(small hydel, solar and wind). The major users of coal are Turkey and Kazakhstan.
Kazakhstan and Turkmenistan are above the global average for electricity consumption. Hardly
any electricity is generated in Afghanistan; it imports nearly 251 MW (or 97%) of its electricity
from its northern neighbours, the remaining (9 MW) coming from small hydel plants.
Turkey is the biggest user of renewable energy among OIC countries (8,624 MW or 85 percent
of the region), followed by Iran with 5 percent. Turkey obtains 5,376 MW from wind, 1,200 MW
from small hydel units, 826 MW from solar PV and 821 MW from geothermal sources.
Geothermal sources provide Iran with 43 percent of RE (250 MW), while Albania generates 65
percent of its RE from small (< 10 MW) hydel plants. Uzbekistan uses solar PV the most in the
region, while wind and solar PV dominate in Kazakhstan. The Turkish industry manufactures
major modules and components for electricity generation and distribution, and has a robust
wind power industry with an important segment for export. Power sub-systems are
2,309 2,202
2,986
5,600
1,9411,480
2,855 2,679
1,645
0
1,000
2,000
3,000
4,000
5,000
6,000
Fig 18 : Electricity Consumption, kWh/capita, in EU and Central Asia
World Avg : 3,144
80
265
79 76 2944 22
5
15198
56
80 1
86
100 30
18
9140
38
250
0
100
200
300
400
500
600
Geothermal Biomass CSP PV Wind Small Hydel587
406
263
178153
4423
Fig 19. RE (MW) by Type in EU and Central Asia
Country
Total
1,2
00 5,3
76
82
6
6 39
5
82
1
0
1,000
2,000
3,000
4,000
5,000
6,000
Turkey,
Total
8624 MW
2.2 Regional Summary
16
manufactured in Iran, Pakistan, and Uzbekistan. All these countries are expanding their RE
portfolio. Details of targets and plants under construction are available in Annex B.
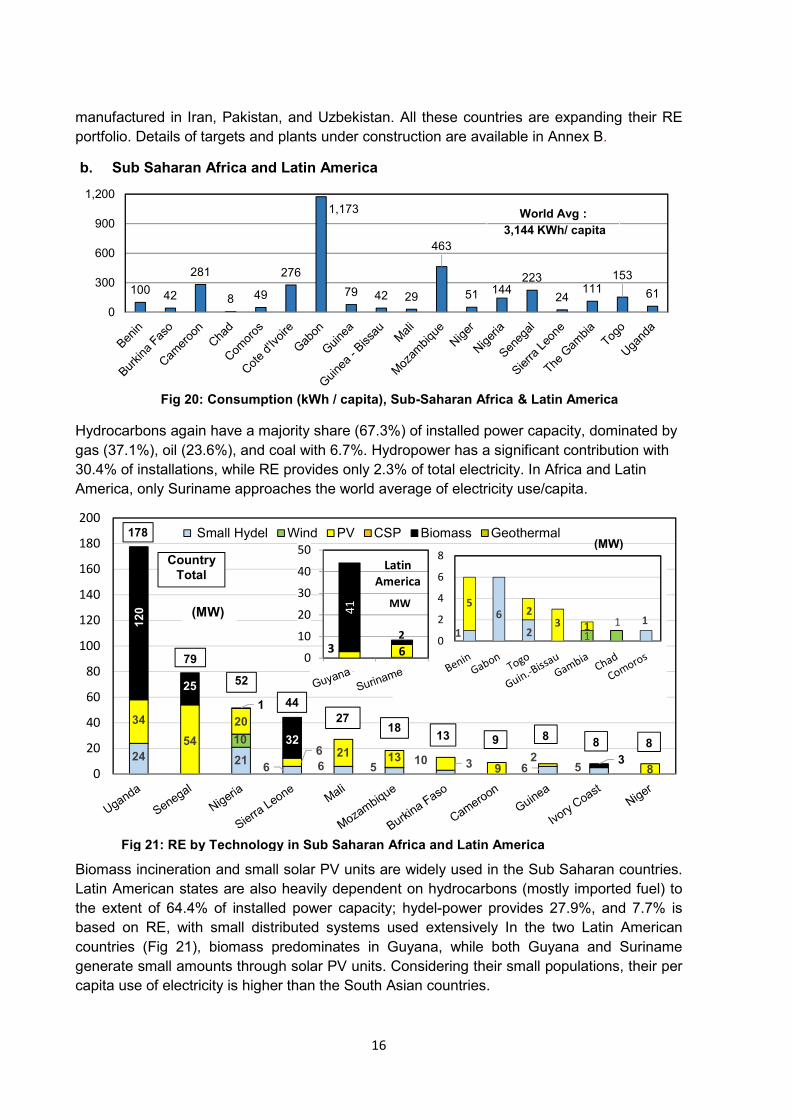
b. Sub Saharan Africa and Latin America
Hydrocarbons again have a majority share (67.3%) of installed power capacity, dominated by
gas (37.1%), oil (23.6%), and coal with 6.7%. Hydropower has a significant contribution with
30.4% of installations, while RE provides only 2.3% of total electricity. In Africa and Latin
America, only Suriname approaches the world average of electricity use/capita.
Biomass incineration and small solar PV units are widely used in the Sub Saharan countries.
Latin American states are also heavily dependent on hydrocarbons (mostly imported fuel) to
the extent of 64.4% of installed power capacity; hydel-power provides 27.9%, and 7.7% is
based on RE, with small distributed systems used extensively In the two Latin American
countries (Fig 21), biomass predominates in Guyana, while both Guyana and Suriname
generate small amounts through solar PV units. Considering their small populations, their per
capita use of electricity is higher than the South Asian countries.
(MW) 10042
281
8 49
276
1,173
79 42 29
463
51 144223
24111
153
61
0
300
600
900
1,200
Fig 20: Consumption (kWh / capita), Sub-Saharan Africa & Latin America
World Avg :
3,144 KWh/ capita
24 216 6 5 3 6 5
10
34
54
20
6 21 13 109
28
12
0
25
1
32
3
0
20
40
60
80
100
120
140
160
180
200
Small Hydel Wind PV CSP Biomass Geothermal178
79
52
44
91318
27
88 8
1
6
21
1
1
52
3 1
0
2
4
6
8
3 6
41
2
0
10
20
30
40
50
MW
Latin
America
Country
Total
Fig 21: RE by Technology in Sub Saharan Africa and Latin America
(MW)
(MW)
17
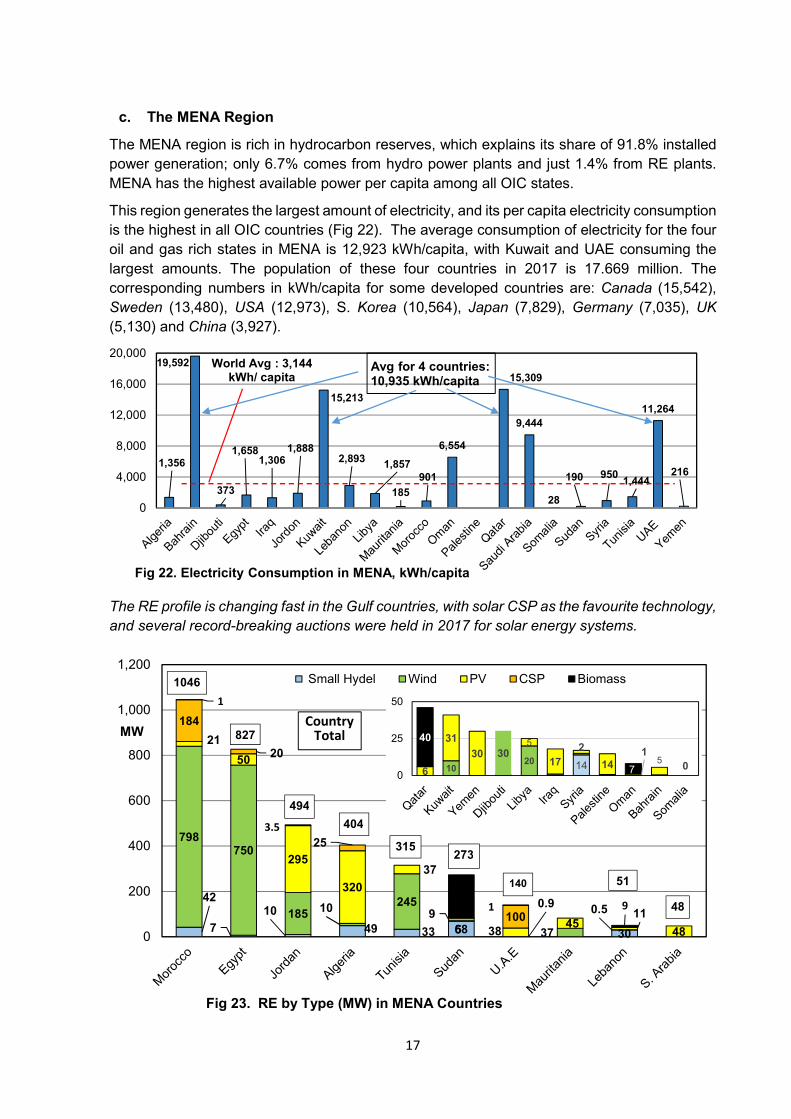
c. The MENA Region
The MENA region is rich in hydrocarbon reserves, which explains its share of 91.8% installed
power generation; only 6.7% comes from hydro power plants and just 1.4% from RE plants.
MENA has the highest available power per capita among all OIC states.
This region generates the largest amount of electricity, and its per capita electricity consumption
is the highest in all OIC countries (Fig 22). The average consumption of electricity for the four
oil and gas rich states in MENA is 12,923 kWh/capita, with Kuwait and UAE consuming the
largest amounts. The population of these four countries in 2017 is 17.669 million. The
corresponding numbers in kWh/capita for some developed countries are: Canada (15,542),
Sweden (13,480), USA (12,973), S. Korea (10,564), Japan (7,829), Germany (7,035), UK
(5,130) and China (3,927).
The RE profile is changing fast in the Gulf countries, with solar CSP as the favourite technology,
and several record-breaking auctions were held in 2017 for solar energy systems.
42
7
10
49 33 68 30
798750
18510
245
5
0.9
37
0.5
21
50
295
320
37
9
3845
11
48
184
20
25
100
1
3.5
1911 9
0
200
400
600
800
1,000
1,200 Small Hydel Wind PV CSP Biomass
Fig 23. RE by Type (MW) in MENA Countries
1046
827
494
404
315 273
140 51
48
Country Total
141020
6
31
305
17
2
14
15
07
40
30
0
25
50
MW
1,356
19,592
373
1,6581,306
1,888
15,213
2,8931,857
185
901
6,554
15,309
9,444
28
190 9501,444
11,264
216
0
4,000
8,000
12,000
16,000
20,000
Fig 22. Electricity Consumption in MENA, kWh/capita
World Avg : 3,144 kWh/ capita
Avg for 4 countries: 10,935 kWh/capita
18
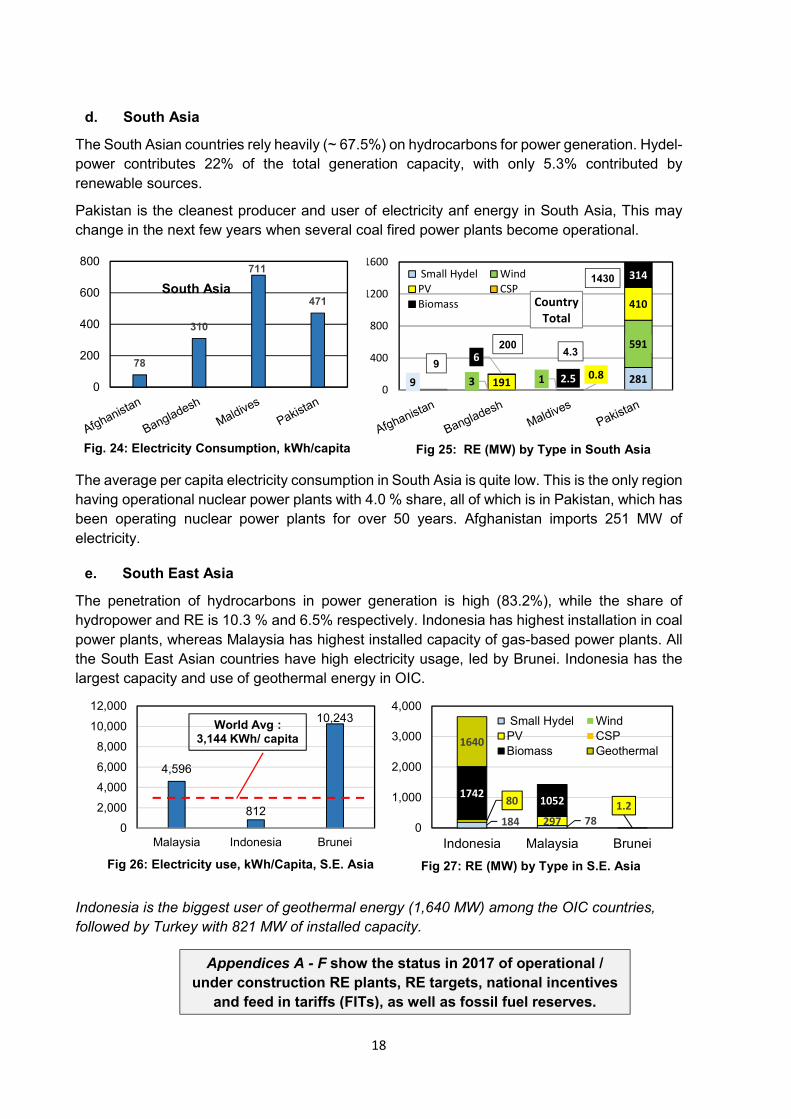
d. South Asia
The South Asian countries rely heavily (~ 67.5%) on hydrocarbons for power generation. Hydel-
power contributes 22% of the total generation capacity, with only 5.3% contributed by
renewable sources.
Pakistan is the cleanest producer and user of electricity anf energy in South Asia, This may
change in the next few years when several coal fired power plants become operational.
The average per capita electricity consumption in South Asia is quite low. This is the only region
having operational nuclear power plants with 4.0 % share, all of which is in Pakistan, which has
been operating nuclear power plants for over 50 years. Afghanistan imports 251 MW of
electricity.
e. South East Asia
The penetration of hydrocarbons in power generation is high (83.2%), while the share of
hydropower and RE is 10.3 % and 6.5% respectively. Indonesia has highest installation in coal
power plants, whereas Malaysia has highest installed capacity of gas-based power plants. All
the South East Asian countries have high electricity usage, led by Brunei. Indonesia has the
largest capacity and use of geothermal energy in OIC.
Indonesia is the biggest user of geothermal energy (1,640 MW) among the OIC countries,
followed by Turkey with 821 MW of installed capacity.
Appendices A - F show the status in 2017 of operational /
under construction RE plants, RE targets, national incentives
and feed in tariffs (FITs), as well as fossil fuel reserves.
9 2813 1
591
1910.8
410
6
2.5
314
0
400
800
1200
1600
Country
Total
Small Hydel Wind
PV CSP
Biomass
Fig 25: RE (MW) by Type in South Asia
78
310
711
471
0
200
400
600
800
South Asia
Fig. 24: Electricity Consumption, kWh/capita
9 4.3
200
1430
Fig 27: RE (MW) by Type in S.E. Asia
184 78
80
297
1.21742
1052
1640
0
1,000
2,000
3,000
4,000
Indonesia Malaysia Brunei
Small Hydel Wind
PV CSP
Biomass Geothermal
4,596
812
10,243
0
2,000
4,000
6,000
8,000
10,000
12,000
Malaysia Indonesia Brunei
World Avg : 3,144 KWh/ capita
Fig 26: Electricity use, kWh/Capita, S.E. Asia
19
This section examines the type of renewable source popular in the OIC regions, their
prevalence, and their global technology trends.
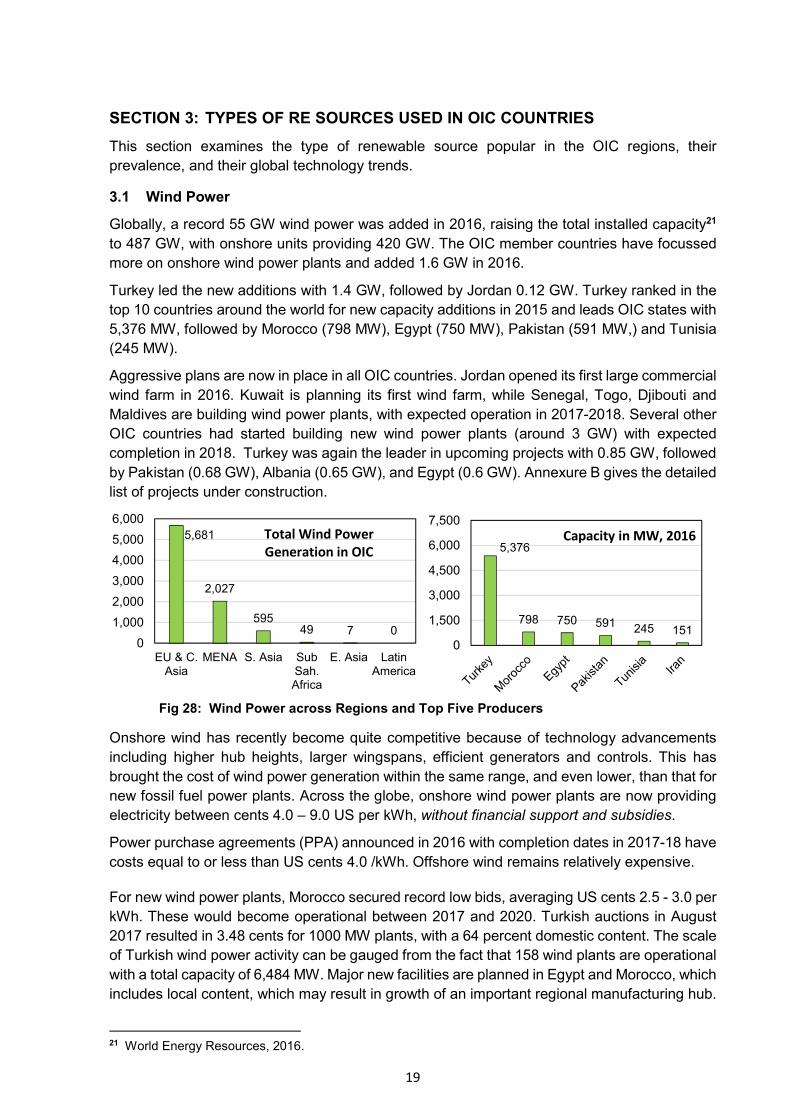
Globally, a record 55 GW wind power was added in 2016, raising the total installed capacity21
to 487 GW, with onshore units providing 420 GW. The OIC member countries have focussed
more on onshore wind power plants and added 1.6 GW in 2016.
Turkey led the new additions with 1.4 GW, followed by Jordan 0.12 GW. Turkey ranked in the
top 10 countries around the world for new capacity additions in 2015 and leads OIC states with
5,376 MW, followed by Morocco (798 MW), Egypt (750 MW), Pakistan (591 MW,) and Tunisia
(245 MW).
Aggressive plans are now in place in all OIC countries. Jordan opened its first large commercial
wind farm in 2016. Kuwait is planning its first wind farm, while Senegal, Togo, Djibouti and
Maldives are building wind power plants, with expected operation in 2017-2018. Several other
OIC countries had started building new wind power plants (around 3 GW) with expected
completion in 2018. Turkey was again the leader in upcoming projects with 0.85 GW, followed
by Pakistan (0.68 GW), Albania (0.65 GW), and Egypt (0.6 GW). Annexure B gives the detailed
list of projects under construction.
Onshore wind has recently become quite competitive because of technology advancements
including higher hub heights, larger wingspans, efficient generators and controls. This has
brought the cost of wind power generation within the same range, and even lower, than that for
new fossil fuel power plants. Across the globe, onshore wind power plants are now providing
electricity between cents 4.0 – 9.0 US per kWh, without financial support and subsidies.
Power purchase agreements (PPA) announced in 2016 with completion dates in 2017-18 have
costs equal to or less than US cents 4.0 /kWh. Offshore wind remains relatively expensive.
For new wind power plants, Morocco secured record low bids, averaging US cents 2.5 - 3.0 per
kWh. These would become operational between 2017 and 2020. Turkish auctions in August
2017 resulted in 3.48 cents for 1000 MW plants, with a 64 percent domestic content. The scale
of Turkish wind power activity can be gauged from the fact that 158 wind plants are operational
with a total capacity of 6,484 MW. Major new facilities are planned in Egypt and Morocco, which
includes local content, which may result in growth of an important regional manufacturing hub.
21 World Energy Resources, 2016.
5,376
798 750 591 245 151
0
1,500
3,000
4,500
6,000
7,5005,681
2,027
59549 7 0
0
1,000
2,000
3,000
4,000
5,000
6,000
EU & C.Asia
MENA S. Asia SubSah.Africa
E. Asia LatinAmerica
Total Wind Power
Generation in OIC
Fig 28: Wind Power across Regions and Top Five Producers
Capacity in MW, 2016
SECTION 3: TYPES OF RE SOURCES USED IN OIC COUNTRIES
3.1 Wind Power
20
However, challenges remain for both onshore and offshore wind power, driven by lack of
transmission infrastructure, and delays in grid connectivity and integration, which make it
difficult to integrate large amounts of widely variable wind energy into the grid systems.
CAES (compressed air energy storage) in abandoned mines or above ground in special tanks
can provide later ‘shift in time’, but additional costs and environment concerns can be
discouraging. However, hybrid systems combined with pumped hydropower can be attractive.
These use wind power to throw back turbine exit water from a secondary lower dam up into the
main dam when power demand is low22.
The wind turbine manufacturing industry has seen several years of double digital growth, and
is now adapting to slower growth in its main market, Europe. The long-term perspectives are
positive, however, driven by China and emerging markets.
The focus now is on building larger and lighter wind turbines to achieve higher energy output
and consistent, reliable operation, with major investments in new materials, design of better
gearboxes and easier installation kits, lightweight cables, and better connectivity. This is having
a positive impact on the entire supply chain and cost reductions.
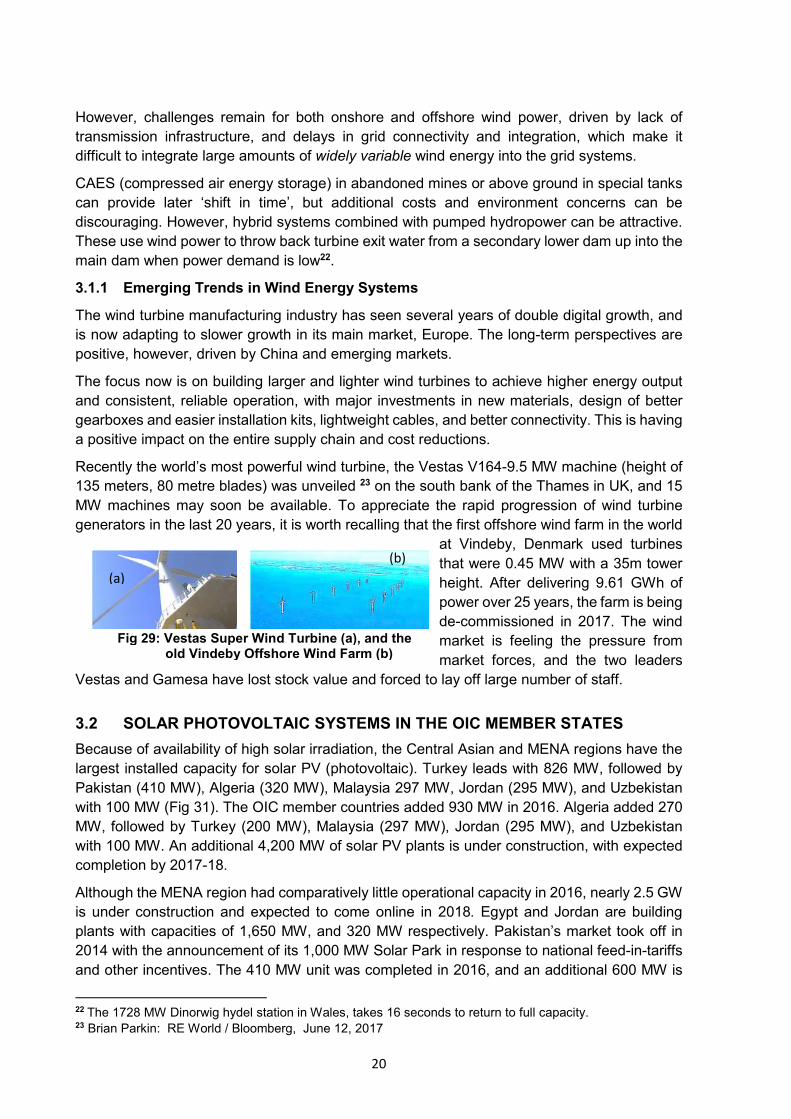
Recently the world’s most powerful wind turbine, the Vestas V164-9.5 MW machine (height of
135 meters, 80 metre blades) was unveiled 23 on the south bank of the Thames in UK, and 15
MW machines may soon be available. To appreciate the rapid progression of wind turbine
generators in the last 20 years, it is worth recalling that the first offshore wind farm in the world
at Vindeby, Denmark used turbines
that were 0.45 MW with a 35m tower
height. After delivering 9.61 GWh of
power over 25 years, the farm is being
de-commissioned in 2017. The wind
market is feeling the pressure from
market forces, and the two leaders
Vestas and Gamesa have lost stock value and forced to lay off large number of staff.
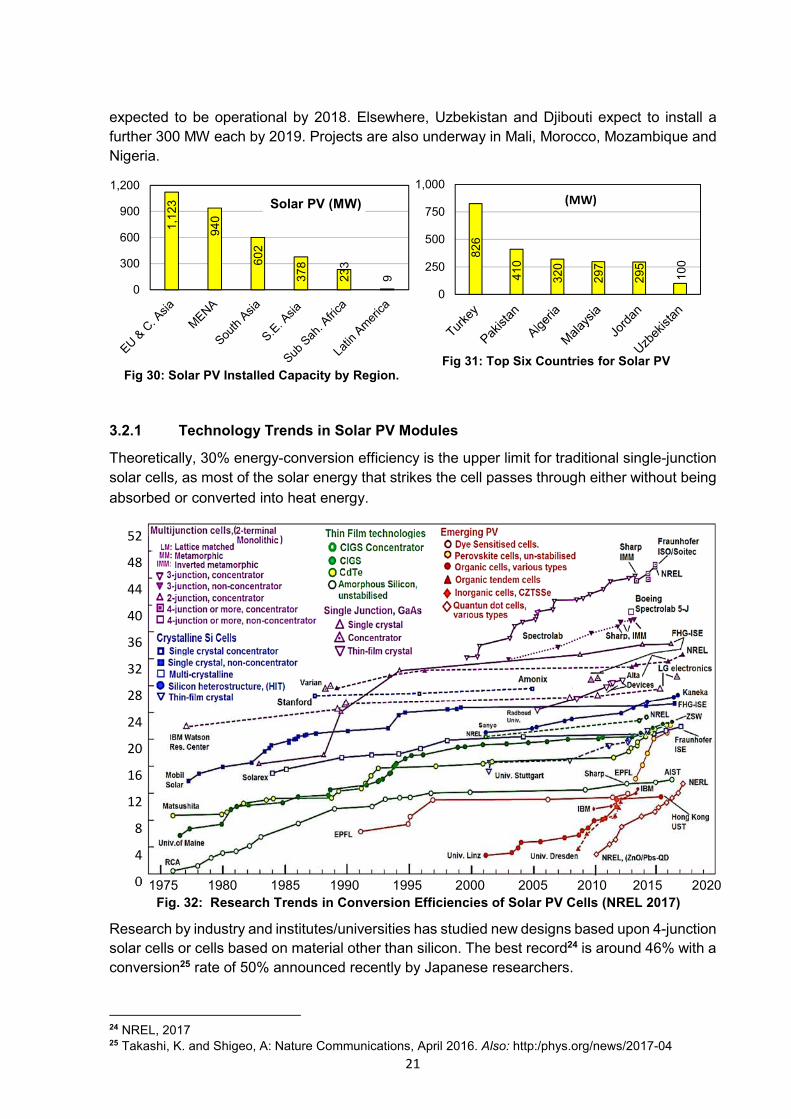
Because of availability of high solar irradiation, the Central Asian and MENA regions have the
largest installed capacity for solar PV (photovoltaic). Turkey leads with 826 MW, followed by
Pakistan (410 MW), Algeria (320 MW), Malaysia 297 MW, Jordan (295 MW), and Uzbekistan
with 100 MW (Fig 31). The OIC member countries added 930 MW in 2016. Algeria added 270
MW, followed by Turkey (200 MW), Malaysia (297 MW), Jordan (295 MW), and Uzbekistan
with 100 MW. An additional 4,200 MW of solar PV plants is under construction, with expected
completion by 2017-18.
Although the MENA region had comparatively little operational capacity in 2016, nearly 2.5 GW
is under construction and expected to come online in 2018. Egypt and Jordan are building
plants with capacities of 1,650 MW, and 320 MW respectively. Pakistan’s market took off in
2014 with the announcement of its 1,000 MW Solar Park in response to national feed-in-tariffs
and other incentives. The 410 MW unit was completed in 2016, and an additional 600 MW is
22 The 1728 MW Dinorwig hydel station in Wales, takes 16 seconds to return to full capacity. 23 Brian Parkin: RE World / Bloomberg, June 12, 2017
Fig 29: Vestas Super Wind Turbine (a), and the old Vindeby Offshore Wind Farm (b)
(a)
(b)
3.1.1 Emerging Trends in Wind Energy Systems
3.2 SOLAR PHOTOVOLTAIC SYSTEMS IN THE OIC MEMBER STATES
21
expected to be operational by 2018. Elsewhere, Uzbekistan and Djibouti expect to install a
further 300 MW each by 2019. Projects are also underway in Mali, Morocco, Mozambique and
Nigeria.
Theoretically, 30% energy-conversion efficiency is the upper limit for traditional single-junction
solar cells, as most of the solar energy that strikes the cell passes through either without being
absorbed or converted into heat energy.
Research by industry and institutes/universities has studied new designs based upon 4-junction
solar cells or cells based on material other than silicon. The best record24 is around 46% with a
conversion25 rate of 50% announced recently by Japanese researchers.
24 NREL, 2017 25 Takashi, K. and Shigeo, A: Nature Communications, April 2016. Also: http:/phys.org/news/2017-04
52
48
44
40
36
32
28
24
20
16
12
8
4
0 1975 1980 1985 1990 1995 2000 2005 2010 2015 2020
Fig. 32: Research Trends in Conversion Efficiencies of Solar PV Cells (NREL 2017)
1,1
23
94
0
60
2
37
8
23
3
9
0
300
600
900
1,200
Solar PV (MW)
Fig 30: Solar PV Installed Capacity by Region.
82
6
41
0
32
0
29
7
29
5
10
0
0
250
500
750
1,000
Fig 31: Top Six Countries for Solar PV
(MW)
3.2.1 Technology Trends in Solar PV Modules
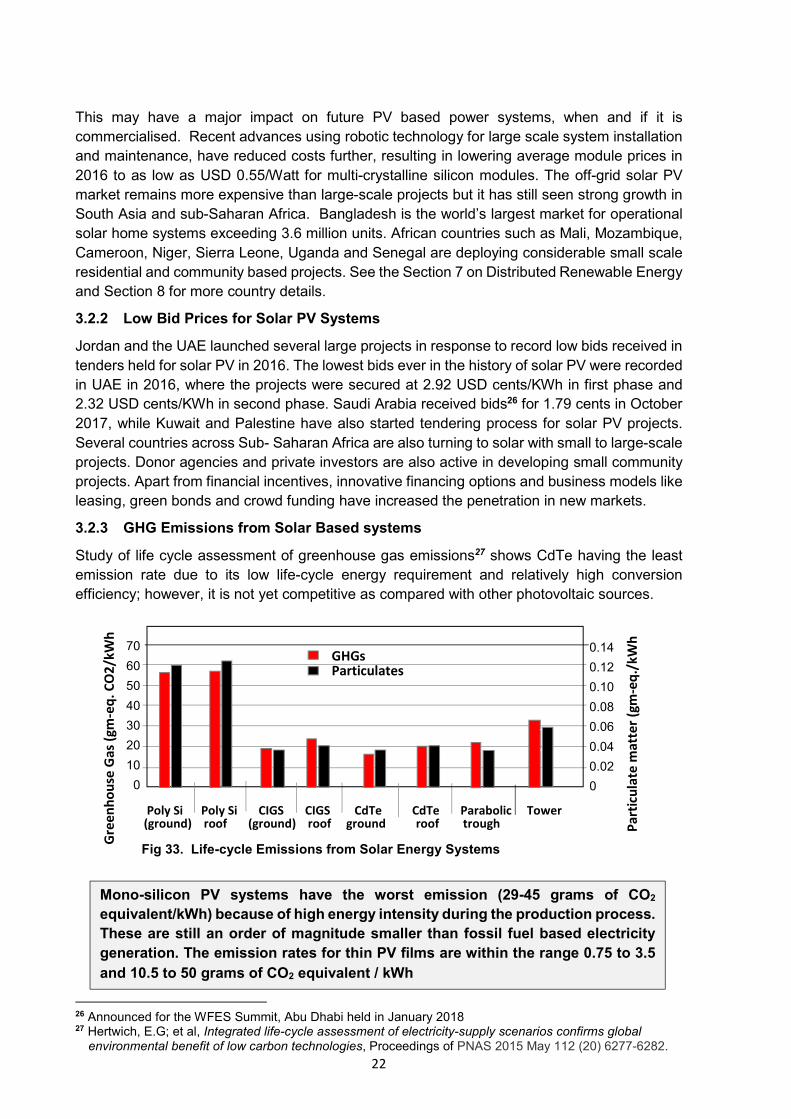
22
This may have a major impact on future PV based power systems, when and if it is
commercialised. Recent advances using robotic technology for large scale system installation
and maintenance, have reduced costs further, resulting in lowering average module prices in
2016 to as low as USD 0.55/Watt for multi-crystalline silicon modules. The off-grid solar PV
market remains more expensive than large-scale projects but it has still seen strong growth in
South Asia and sub-Saharan Africa. Bangladesh is the world’s largest market for operational
solar home systems exceeding 3.6 million units. African countries such as Mali, Mozambique,
Cameroon, Niger, Sierra Leone, Uganda and Senegal are deploying considerable small scale
residential and community based projects. See the Section 7 on Distributed Renewable Energy
and Section 8 for more country details.
Jordan and the UAE launched several large projects in response to record low bids received in
tenders held for solar PV in 2016. The lowest bids ever in the history of solar PV were recorded
in UAE in 2016, where the projects were secured at 2.92 USD cents/KWh in first phase and
2.32 USD cents/KWh in second phase. Saudi Arabia received bids26 for 1.79 cents in October
2017, while Kuwait and Palestine have also started tendering process for solar PV projects.
Several countries across Sub- Saharan Africa are also turning to solar with small to large-scale
projects. Donor agencies and private investors are also active in developing small community
projects. Apart from financial incentives, innovative financing options and business models like
leasing, green bonds and crowd funding have increased the penetration in new markets.
Study of life cycle assessment of greenhouse gas emissions27 shows CdTe having the least
emission rate due to its low life-cycle energy requirement and relatively high conversion
efficiency; however, it is not yet competitive as compared with other photovoltaic sources.
26 Announced for the WFES Summit, Abu Dhabi held in January 2018 27 Hertwich, E.G; et al, Integrated life-cycle assessment of electricity-supply scenarios confirms global environmental benefit of low carbon technologies, Proceedings of PNAS 2015 May 112 (20) 6277-6282.
Mono-silicon PV systems have the worst emission (29-45 grams of CO2
equivalent/kWh) because of high energy intensity during the production process.
These are still an order of magnitude smaller than fossil fuel based electricity
generation. The emission rates for thin PV films are within the range 0.75 to 3.5
and 10.5 to 50 grams of CO2 equivalent / kWh
Pa
rtic
ula
te m
att
er
(gm
-eq
./k
Wh
`
`
`
`
`
` `
`
`
`
`
`
Gre
en
ho
use
Ga
s (g
m-e
q.
CO
2/k
Wh
70
60
50
40
30
20
10
0
0.14
0.12
0.10
0.08
0.06
0.04
0.02
0
Poly Si Poly Si CIGS CIGS CdTe CdTe Parabolic Tower (ground) roof (ground) roof ground roof trough
Fig 33. Life-cycle Emissions from Solar Energy Systems
GHGs Particulates
3.2.2 Low Bid Prices for Solar PV Systems
3.2.3 GHG Emissions from Solar Based systems
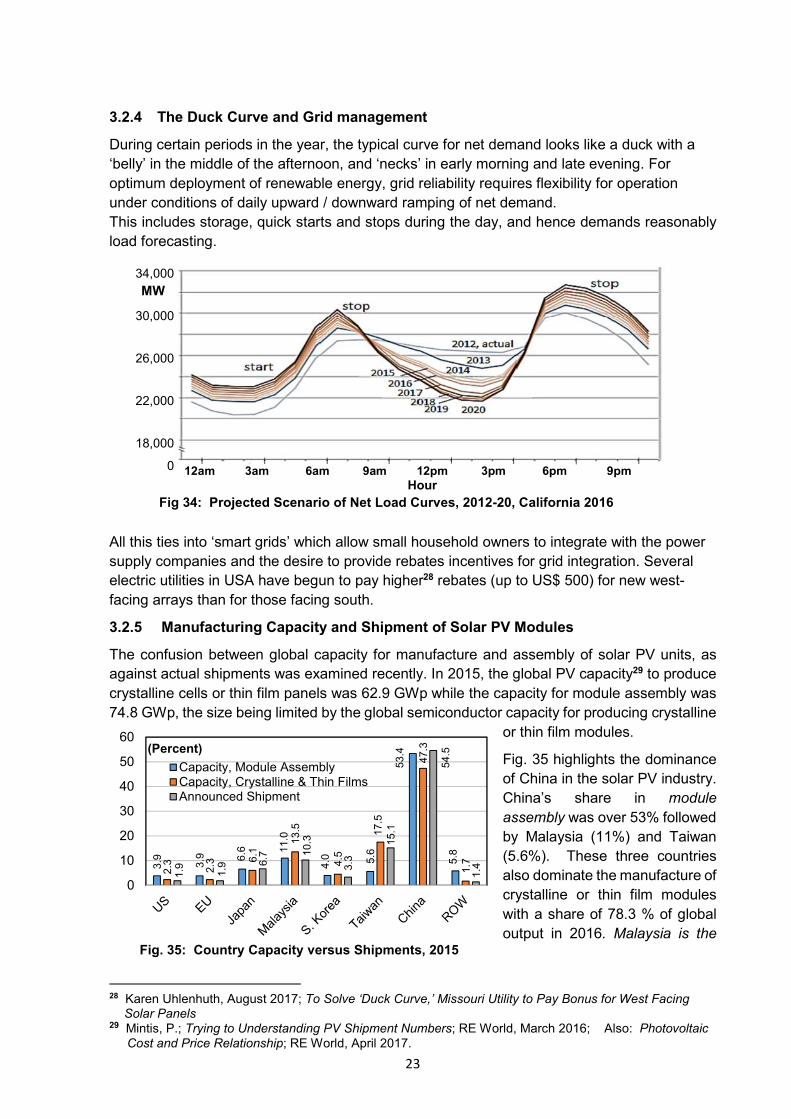
23
During certain periods in the year, the typical curve for net demand looks like a duck with a
‘belly’ in the middle of the afternoon, and ‘necks’ in early morning and late evening. For
optimum deployment of renewable energy, grid reliability requires flexibility for operation
under conditions of daily upward / downward ramping of net demand.
This includes storage, quick starts and stops during the day, and hence demands reasonably
load forecasting.
All this ties into ‘smart grids’ which allow small household owners to integrate with the power
supply companies and the desire to provide rebates incentives for grid integration. Several
electric utilities in USA have begun to pay higher28 rebates (up to US$ 500) for new west-
facing arrays than for those facing south.
The confusion between global capacity for manufacture and assembly of solar PV units, as
against actual shipments was examined recently. In 2015, the global PV capacity29 to produce
crystalline cells or thin film panels was 62.9 GWp while the capacity for module assembly was
74.8 GWp, the size being limited by the global semiconductor capacity for producing crystalline
or thin film modules.
Fig. 35 highlights the dominance
of China in the solar PV industry.
China’s share in module
assembly was over 53% followed
by Malaysia (11%) and Taiwan
(5.6%). These three countries
also dominate the manufacture of
crystalline or thin film modules
with a share of 78.3 % of global
output in 2016. Malaysia is the
28 Karen Uhlenhuth, August 2017; To Solve ‘Duck Curve,’ Missouri Utility to Pay Bonus for West Facing
Solar Panels 29 Mintis, P.; Trying to Understanding PV Shipment Numbers; RE World, March 2016; Also: Photovoltaic
Cost and Price Relationship; RE World, April 2017.
3.9 3.9 6
.6 11.0
4.0 5.6
53.4
5.8
2.3 2.3 6
.1
13.5
4.5
17.5
47.3
1.7
1.9 1.9 6
.7 10.3
3.3
15.1
54.5
1.4
0
10
20
30
40
50
60
Capacity, Module AssemblyCapacity, Crystalline & Thin FilmsAnnounced Shipment
(Percent)
Fig. 35: Country Capacity versus Shipments, 2015
34,000
30,000
26,000
22,000
18,000
0
MW
12am 3am 6am 9am 12pm 3pm 6pm 9pm Hour
Fig 34: Projected Scenario of Net Load Curves, 2012-20, California 2016
3.2.4 The Duck Curve and Grid management
3.2.5 Manufacturing Capacity and Shipment of Solar PV Modules

24
only OIC country with a reasonable share (13.5%) of the supply chain with an annual production
capacity of 1,300 MW.
Overall, a capacity glut coupled with low profit margins has resulted in bankruptcies, mergers,
and takeovers of several major European, in spite of FITs (feed-in tariffs). The Chinese
manufacturers, with over 53% of global solar capacity and low module costs (nearly half those
of the rest of the world) are also now relocating production activities and equipment to other
S.E. Asian countries such as Vietnam, and Thailand to preserve margins. Several OIC
countries (Malaysia, Qatar, Egypt, Iran, Algeria and Pakistan) have realized the need of
setting up manufacturing units for solar PV modules to meet regional requirements.
Other countries with assembly facilities include Qatar (300 MW), Pakistan (110 MW) and
Algeria with 50 MW capacity. Egypt and Iran plan to establish 200 MW manufacturing facilities
for solar PV module. These will essentially be pilot scale facilities.
Studies by the Sun Shot Initiative (USA) suggest that the soft or “plug-in” cost of solar can
account30 for as much as 64% of the total cost of a new solar system. This information gap
can create barriers for, and slow down, wider deployment.
Power utility projects need to include details of factors such as availability, reliability,
maintainability, testability, and safety. These tend to be side-lined to secondary or tertiary
levels31 in the PV bidding process/documentation, resulting in minimal specifications, with
negative impact on life cycle costs, such as operability, conversion efficiency or re-powering
in10, 15 or 20 years’ time which is essential for the consumer.
added globally raising the capacity to 4,800 MW. Within OIC States, only the MENA region has
shown interest and progress in solar CSP installations, while the other regions have not
favoured this technology. Morocco and UAE have the largest share (Fig. 36) with 184 MW and
100 MW respectively. Deployment elsewhere is slow, but several countries have expressed
interest in tower technologies and parabolic troughs, and have also started research in thermal
storage facilities. In 2016, five countries had projects under construction, which included
Morocco (350 MW), Egypt (150 MW), Saudi Arabia (100 MW), Kuwait (60 MW) and
Tunisia (50 MW). The 160 MW Noor-1 plant in Morocco became operational in 2016, as part
30 https://energy.gov/eere/sunshot/soft-costs 31 Balfour, J. K; The Solar PV Life Cycle Dilemma; Ren Energy World, May 2017.
Rapid solar PV deployments has highlighted the challenge related to curtailment issues because
of inadequate grid capacity and quality products. The pace of new installations may slow down
because of shortage of skills necessary for installation, operation and maintenance and delays
in subsidy collection by private investors. The solar PV industry continued reduction in costs
through optimisation and improvement of equipment, including: cell efficiency, robust inverters,
developing “smart” 1500 volt modules that reduce transmission losses while increasing average
system size and reducing labour costs.
3.2.6 ‘Soft’ Cost of Solar Energy Systems
3.2.7 The True Life Cycle Cost of the Solar PV System
3.3 SOLAR CSP
Concentrated solar power (CSP) has seen little addition in recent years, with only 400 MW
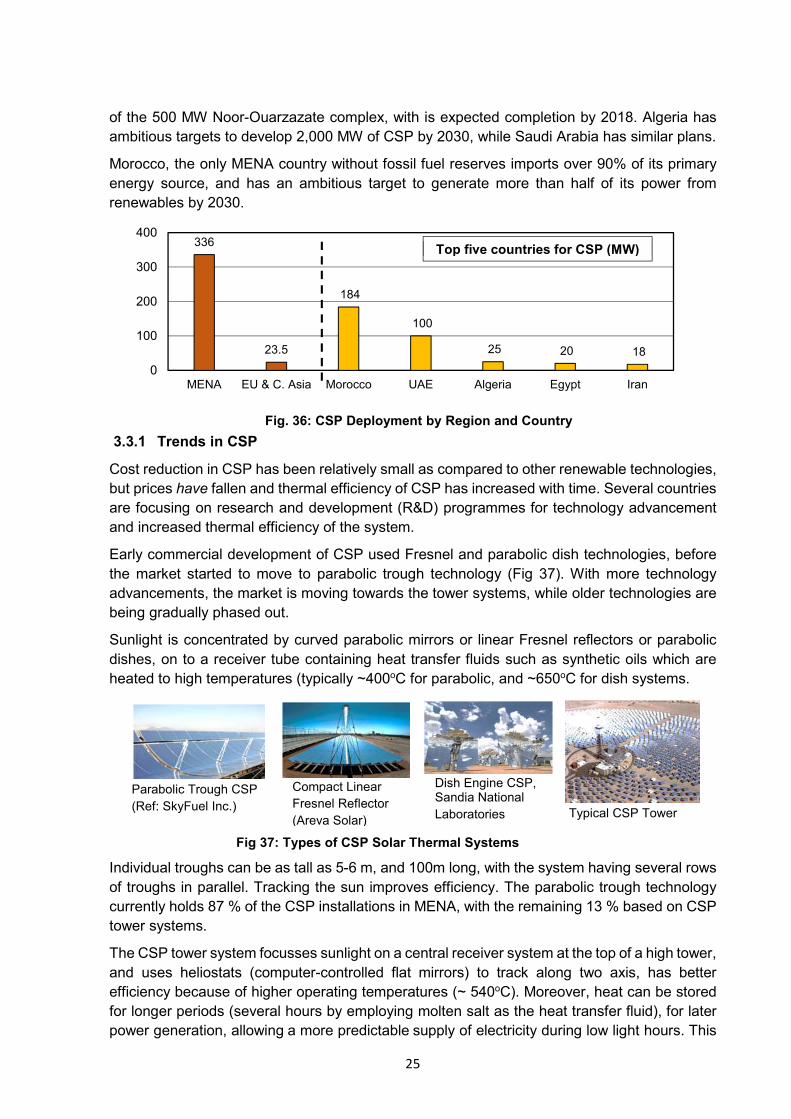
25
of the 500 MW Noor-Ouarzazate complex, with is expected completion by 2018. Algeria has
ambitious targets to develop 2,000 MW of CSP by 2030, while Saudi Arabia has similar plans.
Morocco, the only MENA country without fossil fuel reserves imports over 90% of its primary
energy source, and has an ambitious target to generate more than half of its power from
renewables by 2030.
Cost reduction in CSP has been relatively small as compared to other renewable technologies,
but prices have fallen and thermal efficiency of CSP has increased with time. Several countries
are focusing on research and development (R&D) programmes for technology advancement
and increased thermal efficiency of the system.
Early commercial development of CSP used Fresnel and parabolic dish technologies, before
the market started to move to parabolic trough technology (Fig 37). With more technology
advancements, the market is moving towards the tower systems, while older technologies are
being gradually phased out.
Sunlight is concentrated by curved parabolic mirrors or linear Fresnel reflectors or parabolic
dishes, on to a receiver tube containing heat transfer fluids such as synthetic oils which are
heated to high temperatures (typically ~400oC for parabolic, and ~650oC for dish systems.
Individual troughs can be as tall as 5-6 m, and 100m long, with the system having several rows
of troughs in parallel. Tracking the sun improves efficiency. The parabolic trough technology
currently holds 87 % of the CSP installations in MENA, with the remaining 13 % based on CSP
tower systems.
The CSP tower system focusses sunlight on a central receiver system at the top of a high tower,
and uses heliostats (computer-controlled flat mirrors) to track along two axis, has better
efficiency because of higher operating temperatures (~ 540oC). Moreover, heat can be stored
for longer periods (several hours by employing molten salt as the heat transfer fluid), for later
power generation, allowing a more predictable supply of electricity during low light hours. This
Compact Linear
Fresnel Reflector
(Areva Solar)
Parabolic Trough CSP
(Ref: SkyFuel Inc.)
Dish Engine CSP, Sandia National
Laboratories Typical CSP Tower
Fig 37: Types of CSP Solar Thermal Systems
336
23.5
184
100
25 20 18
0
100
200
300
400
MENA EU & C. Asia Morocco UAE Algeria Egypt Iran
Fig. 36: CSP Deployment by Region and Country
Top five countries for CSP (MW)
3.3.1 Trends in CSP

26
advantage over solar PV may erode with improved life and lower cost of storage batteries.
These systems are nearer to conventional thermal power systems in operating procedures.
For solar CSP systems, the LCOE - the cost of generating electricity - is however, higher than
the parabolic trough or solar PV because of higher capital costs.
A novel application of CSP is the use of steam for enhanced oil recovery in Oman by injecting
it into wells to heat and loosen oil and so increase the amount that can be extracted. This also
reduces the amount of carbon dioxide released during the process, as there is no thermal
storage or electricity generation.
R&D in the CSP sector is driven primarily by the private sector, aiming at reducing the cost of
its components, (heliostats and mirrors; reduced of water usage in both steam/power
generation and maintenance i.e. mirror cleaning). Research programmes in thermal energy
storage (TES) have considered novel storage media such as sand and concrete in Morocco
and UAE. Programmes have also started in Morocco, Saudi Arabia, Egypt and UAE to promote
local manufacturing and local skill development, which has resulted in considerable job
creation.
Solar thermal plants are certainly becoming cheaper, but PV costs are falling more, and the
global installation for solar thermal CSP is about 5 GW compared with over 325 GW for solar
PV. The recent bid in September 2017 by Riyadh based ACWA for the Dubai 200 MW CSP is
for 9.45 cents/kWh which is almost half the recent world CSP price of 15-18 cents/KWh; but it
is still about 4 times higher than recent bids in the Middle East for solar PV. The Dubai Electricity
and Water Authority (DEWA) awarded a contract in September 2017 to the ACWA group and
its Chinese32 partner, for a record low of 7.3 US cents per kWh on a capacity of 700 MW.
Although parabolic troughs currently have the highest share (84%) of operational plants33
globally, the tower technology is favoured at for new plants under planning or construction.
The long-term sustainability of CSP (solar thermal) has recently become debatable, as only two
companies34 have managed to survive
the competition from cheaper solar PV,
while others having gone bankrupt.
Current emphasis on research in CSP is
two-fold. First, molten salt for thermal
storage is extremely promising; however,
the French company – Areva - left the
field in 2016 just when it seemed on the
verge of a cost-reduction breakthrough,
apparently because of the challenge of
keeping the salt in fluid form across
kilometres of tubing in the farm.
32 With China’s Shanghai Electric as its partner 33 CSP Today, Quarterly Update, October, 2017; www.csptoday.com 34 Hirtenstein and Carr; NEP 2017, BNEF
Many in the Industry believe that cost reduction in CSP is more bankable with improved heliostats rather than molten salts
20
0
10
113
1
31
5
21
1
1 17
0
39
83
17
74
14
69
89
3
50
43
18
4040
5252
4208
941
651
0
1000
2000
3000
4000
5000
6000Dish Fresnel Parabolic Trough Tower
Fig. 38: Trends in Different CSP Technologies, 2017
3.3.2 Outlook for CSP
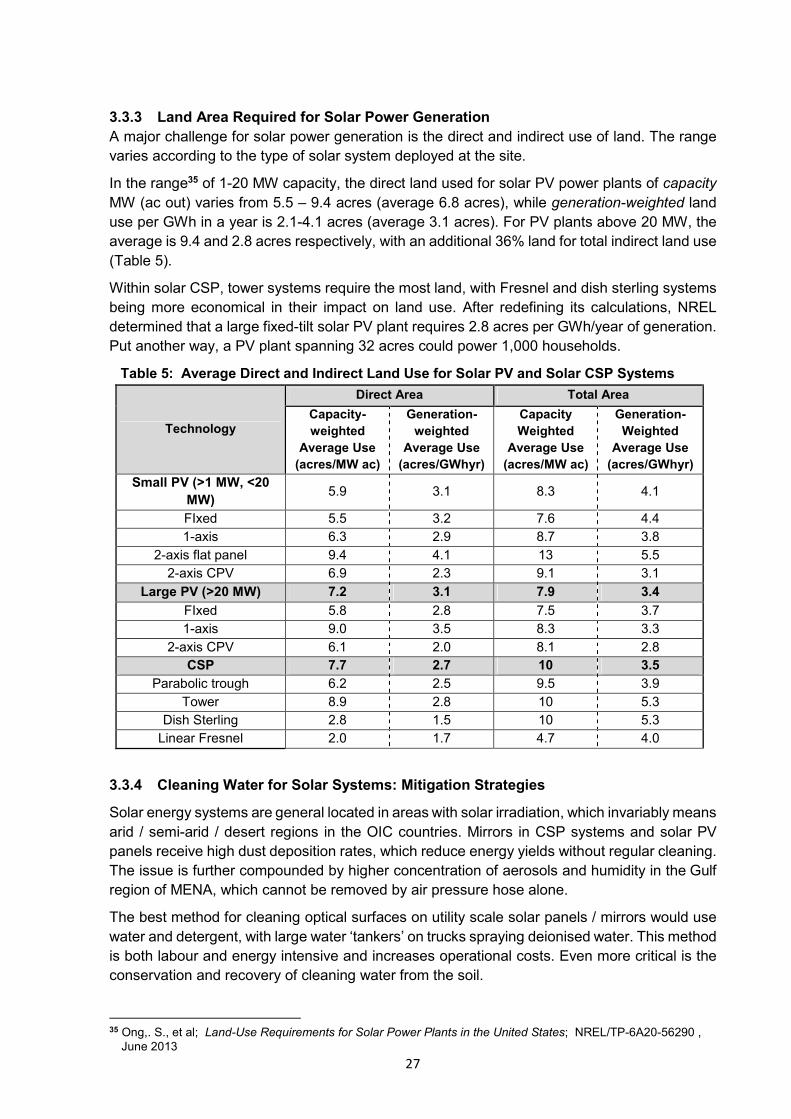
27
In the range35 of 1-20 MW capacity, the direct land used for solar PV power plants of capacity
MW (ac out) varies from 5.5 – 9.4 acres (average 6.8 acres), while generation-weighted land
use per GWh in a year is 2.1-4.1 acres (average 3.1 acres). For PV plants above 20 MW, the
average is 9.4 and 2.8 acres respectively, with an additional 36% land for total indirect land use
(Table 5).
Within solar CSP, tower systems require the most land, with Fresnel and dish sterling systems
being more economical in their impact on land use. After redefining its calculations, NREL
determined that a large fixed-tilt solar PV plant requires 2.8 acres per GWh/year of generation.
Put another way, a PV plant spanning 32 acres could power 1,000 households.
arid / semi-arid / desert regions in the OIC countries. Mirrors in CSP systems and solar PV
panels receive high dust deposition rates, which reduce energy yields without regular cleaning.
The issue is further compounded by higher concentration of aerosols and humidity in the Gulf
region of MENA, which cannot be removed by air pressure hose alone.
The best method for cleaning optical surfaces on utility scale solar panels / mirrors would use
water and detergent, with large water ‘tankers’ on trucks spraying deionised water. This method
is both labour and energy intensive and increases operational costs. Even more critical is the
conservation and recovery of cleaning water from the soil.
35 Ong,. S., et al; Land-Use Requirements for Solar Power Plants in the United States; NREL/TP-6A20-56290 ,
June 2013
Table 5: Average Direct and Indirect Land Use for Solar PV and Solar CSP Systems
Technology
Direct Area Total Area
Capacity-
weighted
Average Use
(acres/MW ac)
Generation-
weighted
Average Use
(acres/GWhyr)
Capacity
Weighted
Average Use
(acres/MW ac)
Generation-
Weighted
Average Use
(acres/GWhyr)
Small PV (>1 MW, <20
MW) 5.9 3.1 8.3 4.1
FIxed 5.5 3.2 7.6 4.4
1-axis 6.3 2.9 8.7 3.8
2-axis flat panel 9.4 4.1 13 5.5
2-axis CPV 6.9 2.3 9.1 3.1
Large PV (>20 MW) 7.2 3.1 7.9 3.4
FIxed 5.8 2.8 7.5 3.7
1-axis 9.0 3.5 8.3 3.3
2-axis CPV 6.1 2.0 8.1 2.8
CSP 7.7 2.7 10 3.5
Parabolic trough 6.2 2.5 9.5 3.9
Tower 8.9 2.8 10 5.3
Dish Sterling 2.8 1.5 10 5.3
Linear Fresnel 2.0 1.7 4.7 4.0
3.3.3 Land Area Required for Solar Power Generation
A major challenge for solar power generation is the direct and indirect use of land. The range
varies according to the type of solar system deployed at the site.
3.3.4 Cleaning Water for Solar Systems: Mitigation Strategies
Solar energy systems are general located in areas with solar irradiation, which invariably means
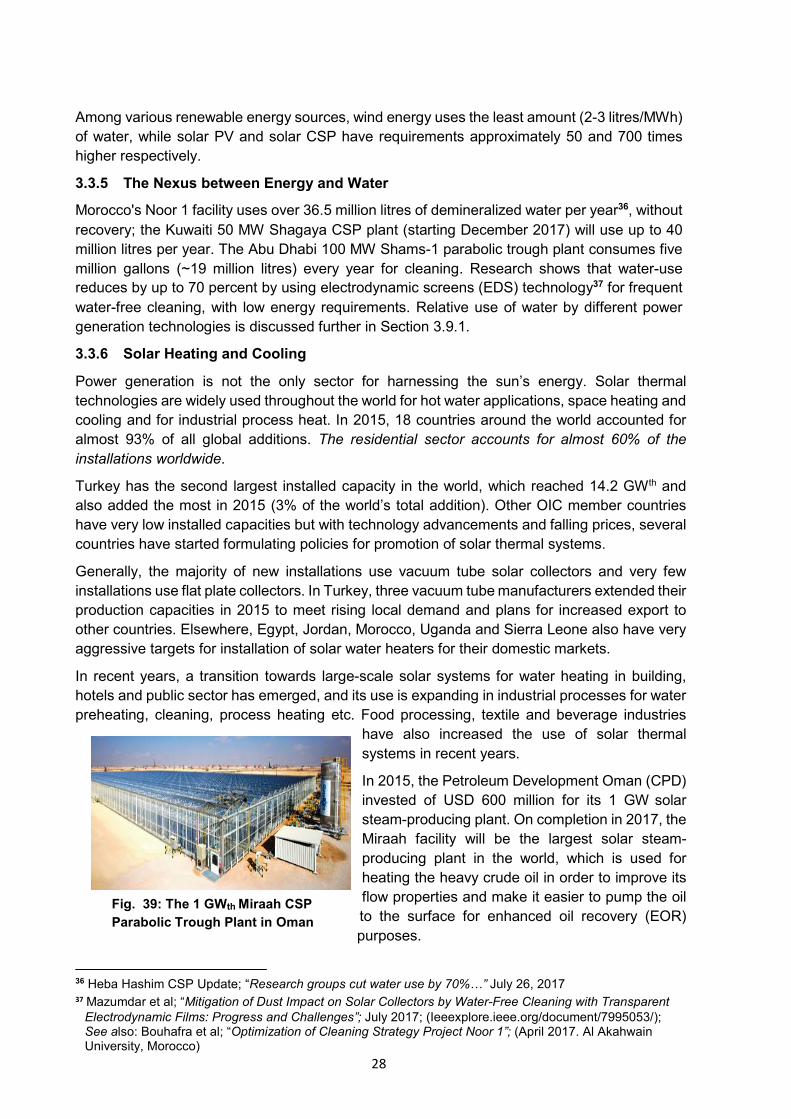
28
Among various renewable energy sources, wind energy uses the least amount (2-3 litres/MWh)
of water, while solar PV and solar CSP have requirements approximately 50 and 700 times
higher respectively.
Morocco's Noor 1 facility uses over 36.5 million litres of demineralized water per year36, without
recovery; the Kuwaiti 50 MW Shagaya CSP plant (starting December 2017) will use up to 40
million litres per year. The Abu Dhabi 100 MW Shams-1 parabolic trough plant consumes five
million gallons (~19 million litres) every year for cleaning. Research shows that water-use
reduces by up to 70 percent by using electrodynamic screens (EDS) technology37 for frequent
water-free cleaning, with low energy requirements. Relative use of water by different power
generation technologies is discussed further in Section 3.9.1.
Power generation is not the only sector for harnessing the sun’s energy. Solar thermal
technologies are widely used throughout the world for hot water applications, space heating and
cooling and for industrial process heat. In 2015, 18 countries around the world accounted for
almost 93% of all global additions. The residential sector accounts for almost 60% of the
installations worldwide.
Turkey has the second largest installed capacity in the world, which reached 14.2 GWth and
also added the most in 2015 (3% of the world’s total addition). Other OIC member countries
have very low installed capacities but with technology advancements and falling prices, several
countries have started formulating policies for promotion of solar thermal systems.
Generally, the majority of new installations use vacuum tube solar collectors and very few
installations use flat plate collectors. In Turkey, three vacuum tube manufacturers extended their
production capacities in 2015 to meet rising local demand and plans for increased export to
other countries. Elsewhere, Egypt, Jordan, Morocco, Uganda and Sierra Leone also have very
aggressive targets for installation of solar water heaters for their domestic markets.
In recent years, a transition towards large-scale solar systems for water heating in building,
hotels and public sector has emerged, and its use is expanding in industrial processes for water
preheating, cleaning, process heating etc. Food processing, textile and beverage industries
have also increased the use of solar thermal
systems in recent years.
In 2015, the Petroleum Development Oman (CPD)
invested of USD 600 million for its 1 GW solar
steam-producing plant. On completion in 2017, the
Miraah facility will be the largest solar steam-
producing plant in the world, which is used for
heating the heavy crude oil in order to improve its
flow properties and make it easier to pump the oil
to the surface for enhanced oil recovery (EOR)
purposes.
36 Heba Hashim CSP Update; “Research groups cut water use by 70%…” July 26, 2017 37 Mazumdar et al; “Mitigation of Dust Impact on Solar Collectors by Water-Free Cleaning with Transparent
Electrodynamic Films: Progress and Challenges”; July 2017; (Ieeexplore.ieee.org/document/7995053/); See also: Bouhafra et al; “Optimization of Cleaning Strategy Project Noor 1”; (April 2017. Al Akahwain University, Morocco)
Fig. 39: The 1 GWth Miraah CSP
Parabolic Trough Plant in Oman
3.3.5 The Nexus between Energy and Water
3.3.6 Solar Heating and Cooling
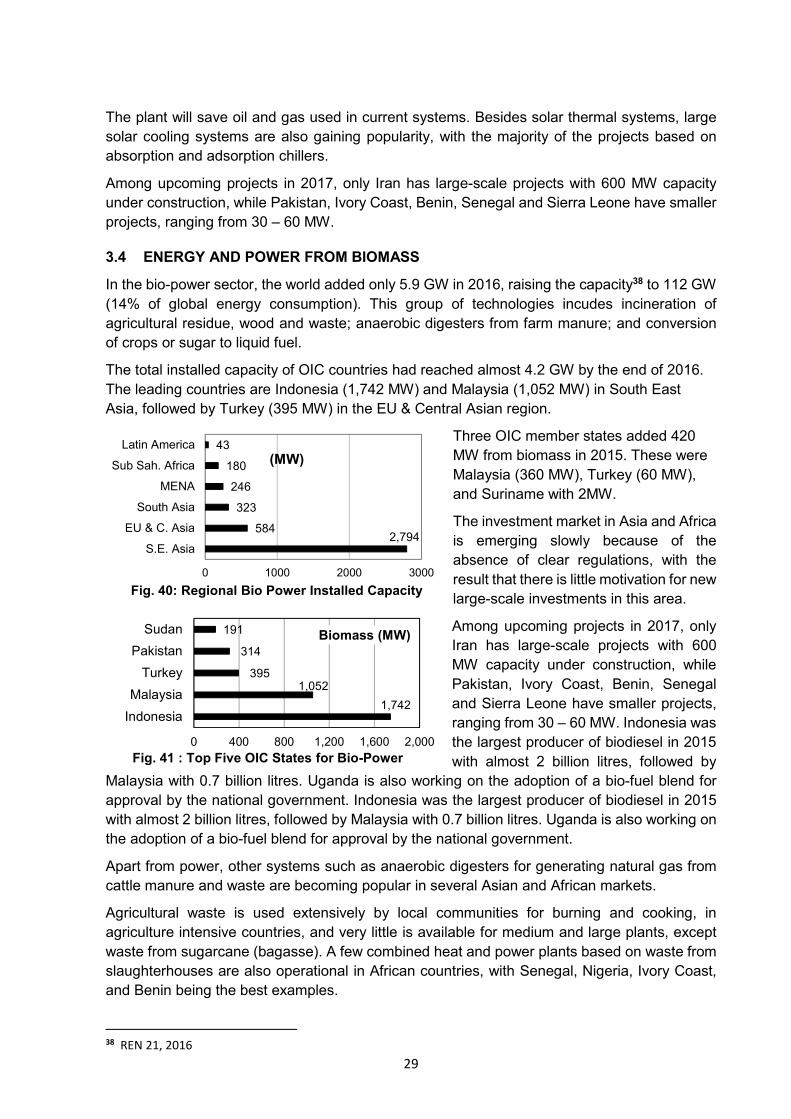
29
The plant will save oil and gas used in current systems. Besides solar thermal systems, large
solar cooling systems are also gaining popularity, with the majority of the projects based on
absorption and adsorption chillers.
Among upcoming projects in 2017, only Iran has large-scale projects with 600 MW capacity
under construction, while Pakistan, Ivory Coast, Benin, Senegal and Sierra Leone have smaller
projects, ranging from 30 – 60 MW.
In the bio-power sector, the world added only 5.9 GW in 2016, raising the capacity38 to 112 GW
(14% of global energy consumption). This group of technologies incudes incineration of
agricultural residue, wood and waste; anaerobic digesters from farm manure; and conversion
of crops or sugar to liquid fuel.
The total installed capacity of OIC countries had reached almost 4.2 GW by the end of 2016.
The leading countries are Indonesia (1,742 MW) and Malaysia (1,052 MW) in South East
Asia, followed by Turkey (395 MW) in the EU & Central Asian region.
Three OIC member states added 420
MW from biomass in 2015. These were
Malaysia (360 MW), Turkey (60 MW),
and Suriname with 2MW.
The investment market in Asia and Africa
is emerging slowly because of the
absence of clear regulations, with the
result that there is little motivation for new
large-scale investments in this area.
Among upcoming projects in 2017, only
Iran has large-scale projects with 600
MW capacity under construction, while
Pakistan, Ivory Coast, Benin, Senegal
and Sierra Leone have smaller projects,
ranging from 30 – 60 MW. Indonesia was
the largest producer of biodiesel in 2015
with almost 2 billion litres, followed by
Malaysia with 0.7 billion litres. Uganda is also working on the adoption of a bio-fuel blend for
approval by the national government. Indonesia was the largest producer of biodiesel in 2015
with almost 2 billion litres, followed by Malaysia with 0.7 billion litres. Uganda is also working on
the adoption of a bio-fuel blend for approval by the national government.
Apart from power, other systems such as anaerobic digesters for generating natural gas from
cattle manure and waste are becoming popular in several Asian and African markets.
Agricultural waste is used extensively by local communities for burning and cooking, in
agriculture intensive countries, and very little is available for medium and large plants, except
waste from sugarcane (bagasse). A few combined heat and power plants based on waste from
slaughterhouses are also operational in African countries, with Senegal, Nigeria, Ivory Coast,
and Benin being the best examples.
38 REN 21, 2016
1,742
1,052 395
314
191
0 400 800 1,200 1,600 2,000
Indonesia
Malaysia
Turkey
Pakistan
Sudan Biomass (MW)
Fig. 41 : Top Five OIC States for Bio-Power
2,794584
323
246
180
43
0 1000 2000 3000
S.E. Asia
EU & C. Asia
South Asia
MENA
Sub Sah. Africa
Latin America
Fig. 40: Regional Bio Power Installed Capacity
(MW)
3.4 ENERGY AND POWER FROM BIOMASS
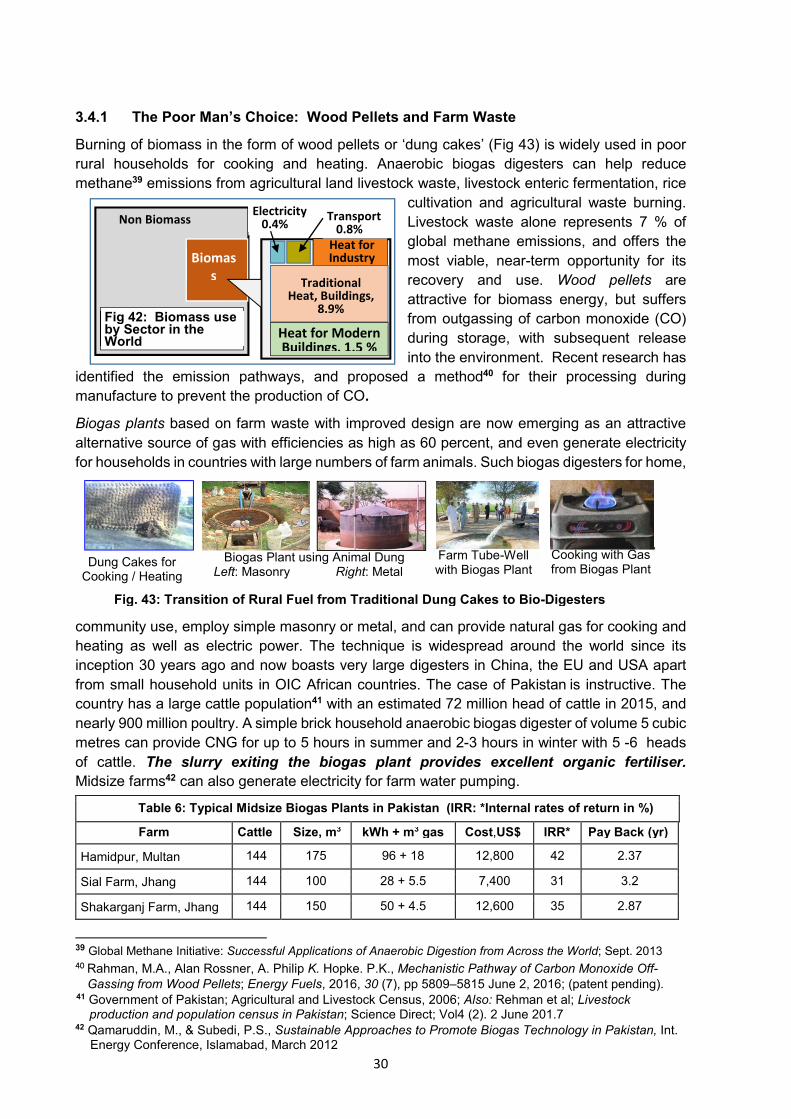
30
Burning of biomass in the form of wood pellets or ‘dung cakes’ (Fig 43) is widely used in poor
rural households for cooking and heating. Anaerobic biogas digesters can help reduce
methane39 emissions from agricultural land livestock waste, livestock enteric fermentation, rice
cultivation and agricultural waste burning.
Livestock waste alone represents 7 % of
global methane emissions, and offers the
most viable, near-term opportunity for its
recovery and use. Wood pellets are
attractive for biomass energy, but suffers
from outgassing of carbon monoxide (CO)
during storage, with subsequent release
into the environment. Recent research has
identified the emission pathways, and proposed a method40 for their processing during
manufacture to prevent the production of CO.
Biogas plants based on farm waste with improved design are now emerging as an attractive
alternative source of gas with efficiencies as high as 60 percent, and even generate electricity
for households in countries with large numbers of farm animals. Such biogas digesters for home,
community use, employ simple masonry or metal, and can provide natural gas for cooking and
heating as well as electric power. The technique is widespread around the world since its
inception 30 years ago and now boasts very large digesters in China, the EU and USA apart
from small household units in OIC African countries. The case of Pakistan is instructive. The
country has a large cattle population41 with an estimated 72 million head of cattle in 2015, and
nearly 900 million poultry. A simple brick household anaerobic biogas digester of volume 5 cubic
metres can provide CNG for up to 5 hours in summer and 2-3 hours in winter with 5 -6 heads
of cattle. The slurry exiting the biogas plant provides excellent organic fertiliser.
Midsize farms42 can also generate electricity for farm water pumping.
39 Global Methane Initiative: Successful Applications of Anaerobic Digestion from Across the World; Sept. 2013 40
Rahman, M.A., Alan Rossner, A. Philip K. Hopke. P.K., Mechanistic Pathway of Carbon Monoxide Off-
Gassing from Wood Pellets; Energy Fuels, 2016, 30 (7), pp 5809–5815 June 2, 2016; (patent pending). 41 Government of Pakistan; Agricultural and Livestock Census, 2006; Also: Rehman et al; Livestock
production and population census in Pakistan; Science Direct; Vol4 (2). 2 June 201.7 42 Qamaruddin, M., & Subedi, P.S., Sustainable Approaches to Promote Biogas Technology in Pakistan, Int.
Energy Conference, Islamabad, March 2012
Table 6: Typical Midsize Biogas Plants in Pakistan (IRR: *Internal rates of return in %)
Farm Cattle Size, m3 kWh + m3 gas Cost,US$ IRR* Pay Back (yr)
Hamidpur, Multan 144 175 96 + 18 12,800 42 2.37
Sial Farm, Jhang 144 100 28 + 5.5 7,400 31 3.2
Shakarganj Farm, Jhang 144 150 50 + 4.5 12,600 35 2.87
Fig. 43: Transition of Rural Fuel from Traditional Dung Cakes to Bio-Digesters
Dung Cakes for Cooking / Heating
Farm Tube-Well with Biogas Plant
Cooking with Gas from Biogas Plant
Biogas Plant using Animal Dung Left: Masonry Right: Metal
Non Biomass
Biomas
s
Heat for Industry
2.2% Traditional
Heat, Buildings, 8.9%
Heat for Modern Buildings, 1.5 %
Electricity 0.4%
Transport 0.8%
Fig 42: Biomass use by Sector in the World
3.4.1 The Poor Man’s Choice: Wood Pellets and Farm Waste
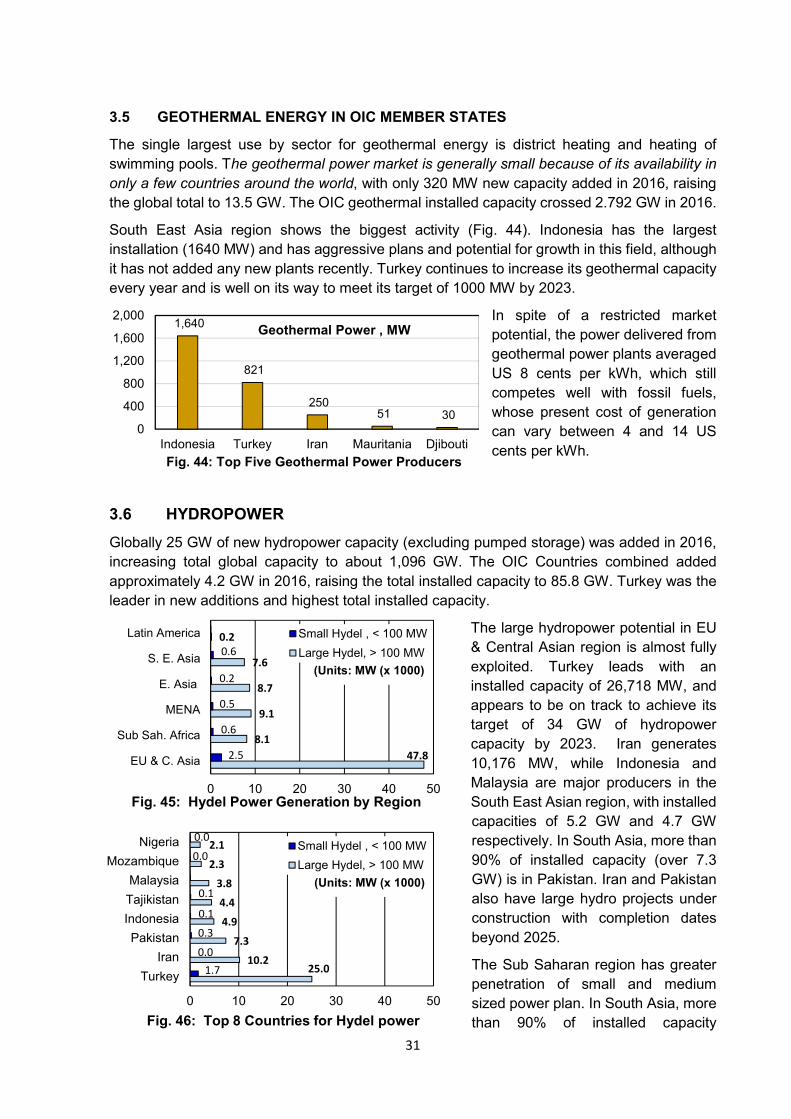
31
The single largest use by sector for geothermal energy is district heating and heating of
swimming pools. The geothermal power market is generally small because of its availability in
only a few countries around the world, with only 320 MW new capacity added in 2016, raising
the global total to 13.5 GW. The OIC geothermal installed capacity crossed 2.792 GW in 2016.
South East Asia region shows the biggest activity (Fig. 44). Indonesia has the largest
installation (1640 MW) and has aggressive plans and potential for growth in this field, although
it has not added any new plants recently. Turkey continues to increase its geothermal capacity
every year and is well on its way to meet its target of 1000 MW by 2023.
In spite of a restricted market
potential, the power delivered from
geothermal power plants averaged
US 8 cents per kWh, which still
competes well with fossil fuels,
whose present cost of generation
can vary between 4 and 14 US
cents per kWh.
increasing total global capacity to about 1,096 GW. The OIC Countries combined added
approximately 4.2 GW in 2016, raising the total installed capacity to 85.8 GW. Turkey was the
leader in new additions and highest total installed capacity.
The large hydropower potential in EU
& Central Asian region is almost fully
exploited. Turkey leads with an
installed capacity of 26,718 MW, and
appears to be on track to achieve its
target of 34 GW of hydropower
capacity by 2023. Iran generates
10,176 MW, while Indonesia and
Malaysia are major producers in the
South East Asian region, with installed
capacities of 5.2 GW and 4.7 GW
respectively. In South Asia, more than
90% of installed capacity (over 7.3
GW) is in Pakistan. Iran and Pakistan
also have large hydro projects under
construction with completion dates
beyond 2025.
The Sub Saharan region has greater
penetration of small and medium
sized power plan. In South Asia, more
than 90% of installed capacity
1,640
821
250 51 30
0
400
800
1,200
1,600
2,000
Indonesia Turkey Iran Mauritania Djibouti
Geothermal Power , MW
Fig. 44: Top Five Geothermal Power Producers
47.8
8.1
9.1
8.7
7.6
0.2
2.5
0.6
0.5
0.2
0.6
0 10 20 30 40 50
EU & C. Asia
Sub Sah. Africa
MENA
E. Asia
S. E. Asia
Latin America Small Hydel , < 100 MW
Large Hydel, > 100 MW
Fig. 45: Hydel Power Generation by Region
(Units: MW (x 1000)
25.010.2
7.3
4.9
4.4
3.8
2.3
2.1
1.7
0.0
0.3
0.1
0.1
0.0
0.0
0 10 20 30 40 50
Turkey
Iran
Pakistan
Indonesia
Tajikistan
Malaysia
Mozambique
Nigeria Small Hydel , < 100 MW
Large Hydel, > 100 MW
Fig. 46: Top 8 Countries for Hydel power
(Units: MW (x 1000)
3.5 GEOTHERMAL ENERGY IN OIC MEMBER STATES
3.6 HYDROPOWER
Globally 25 GW of new hydropower capacity (excluding pumped storage) was added in 2016,
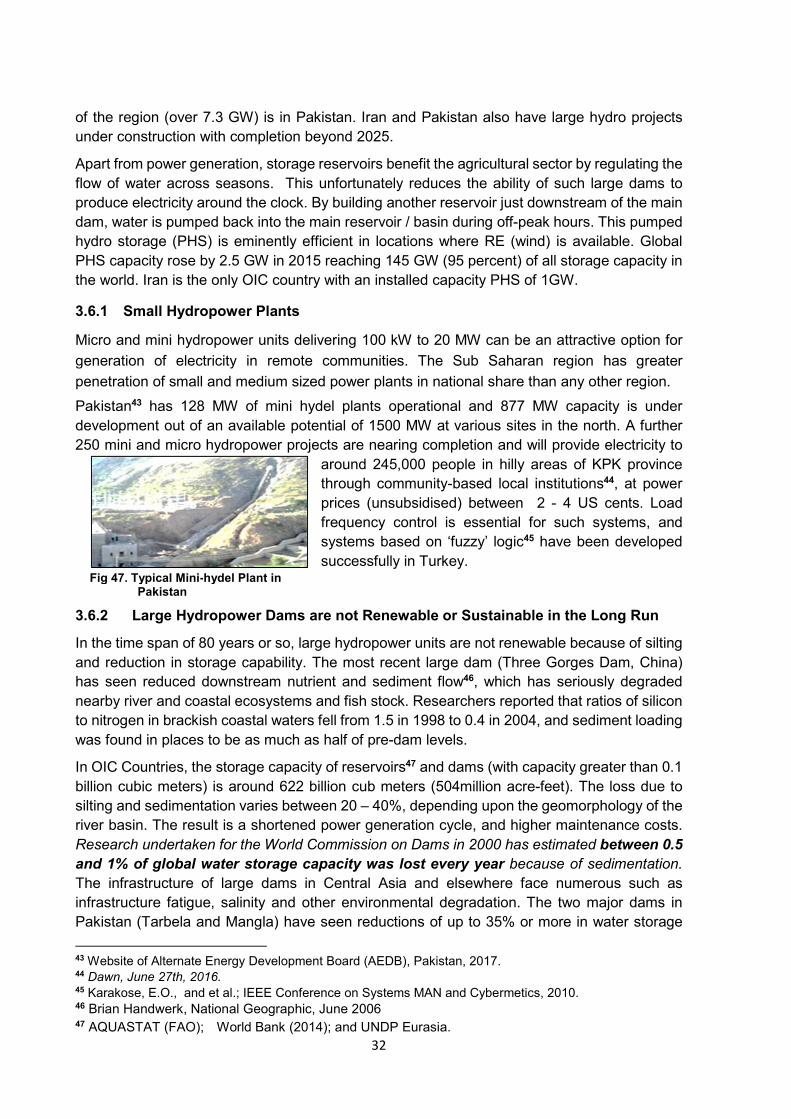
32
of the region (over 7.3 GW) is in Pakistan. Iran and Pakistan also have large hydro projects
under construction with completion beyond 2025.
Apart from power generation, storage reservoirs benefit the agricultural sector by regulating the
flow of water across seasons. This unfortunately reduces the ability of such large dams to
produce electricity around the clock. By building another reservoir just downstream of the main
dam, water is pumped back into the main reservoir / basin during off-peak hours. This pumped
hydro storage (PHS) is eminently efficient in locations where RE (wind) is available. Global
PHS capacity rose by 2.5 GW in 2015 reaching 145 GW (95 percent) of all storage capacity in
the world. Iran is the only OIC country with an installed capacity PHS of 1GW.
Micro and mini hydropower units delivering 100 kW to 20 MW can be an attractive option for
generation of electricity in remote communities. The Sub Saharan region has greater
penetration of small and medium sized power plants in national share than any other region.
Pakistan43 has 128 MW of mini hydel plants operational and 877 MW capacity is under
development out of an available potential of 1500 MW at various sites in the north. A further
250 mini and micro hydropower projects are nearing completion and will provide electricity to
around 245,000 people in hilly areas of KPK province
through community-based local institutions44, at power
prices (unsubsidised) between 2 - 4 US cents. Load
frequency control is essential for such systems, and
systems based on ‘fuzzy’ logic45 have been developed
successfully in Turkey.
and reduction in storage capability. The most recent large dam (Three Gorges Dam, China)
has seen reduced downstream nutrient and sediment flow46, which has seriously degraded
nearby river and coastal ecosystems and fish stock. Researchers reported that ratios of silicon
to nitrogen in brackish coastal waters fell from 1.5 in 1998 to 0.4 in 2004, and sediment loading
was found in places to be as much as half of pre-dam levels.
In OIC Countries, the storage capacity of reservoirs47 and dams (with capacity greater than 0.1
billion cubic meters) is around 622 billion cub meters (504million acre-feet). The loss due to
silting and sedimentation varies between 20 – 40%, depending upon the geomorphology of the
river basin. The result is a shortened power generation cycle, and higher maintenance costs.
Research undertaken for the World Commission on Dams in 2000 has estimated between 0.5
and 1% of global water storage capacity was lost every year because of sedimentation.
The infrastructure of large dams in Central Asia and elsewhere face numerous such as
infrastructure fatigue, salinity and other environmental degradation. The two major dams in
Pakistan (Tarbela and Mangla) have seen reductions of up to 35% or more in water storage
43 Website of Alternate Energy Development Board (AEDB), Pakistan, 2017. 44 Dawn, June 27th, 2016. 45 Karakose, E.O., and et al.; IEEE Conference on Systems MAN and Cybermetics, 2010. 46 Brian Handwerk, National Geographic, June 2006 47 AQUASTAT (FAO); World Bank (2014); and UNDP Eurasia.
Fig 47. Typical Mini-hydel Plant in Pakistan
3.6.1 Small Hydropower Plants
3.6.2 Large Hydropower Dams are not Renewable or Sustainable in the Long Run
In the time span of 80 years or so, large hydropower units are not renewable because of silting
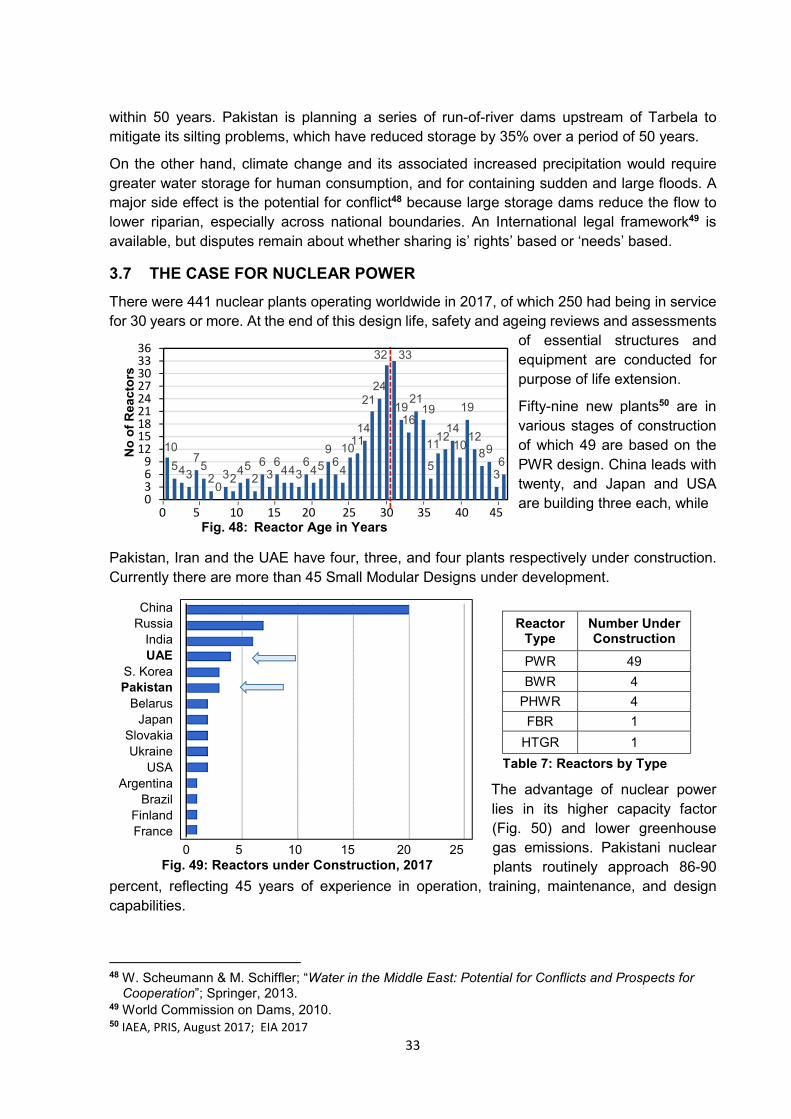
33
within 50 years. Pakistan is planning a series of run-of-river dams upstream of Tarbela to
mitigate its silting problems, which have reduced storage by 35% over a period of 50 years.
On the other hand, climate change and its associated increased precipitation would require
greater water storage for human consumption, and for containing sudden and large floods. A
major side effect is the potential for conflict48 because large storage dams reduce the flow to
lower riparian, especially across national boundaries. An International legal framework49 is
available, but disputes remain about whether sharing is’ rights’ based or ‘needs’ based.
There were 441 nuclear plants operating worldwide in 2017, of which 250 had being in service
for 30 years or more. At the end of this design life, safety and ageing reviews and assessments
of essential structures and
equipment are conducted for
purpose of life extension.
Fifty-nine new plants50 are in
various stages of construction
of which 49 are based on the
PWR design. China leads with
twenty, and Japan and USA
are building three each, while
Pakistan, Iran and the UAE have four, three, and four plants respectively under construction.
Currently there are more than 45 Small Modular Designs under development.
The advantage of nuclear power
lies in its higher capacity factor
(Fig. 50) and lower greenhouse
gas emissions. Pakistani nuclear
plants routinely approach 86-90
percent, reflecting 45 years of experience in operation, training, maintenance, and design
capabilities.
48 W. Scheumann & M. Schiffler; “Water in the Middle East: Potential for Conflicts and Prospects for
Cooperation”; Springer, 2013. 49 World Commission on Dams, 2010. 50 IAEA, PRIS, August 2017; EIA 2017
Reactor Type
Number Under Construction
PWR 49
BWR 4
PHWR 4
FBR 1
HTGR 1
Table 7: Reactors by Type
China
Russia
India
UAE
S. Korea
Pakistan
Belarus
Japan
Slovakia
Ukraine
USA
Argentina
Brazil
Finland
France
0 5 10 15 20 25 Fig. 49: Reactors under Construction, 2017
10
543
75
20
3245
2
63
6443
645
96
4
101114
2124
32 33
1916
2119
5
1112
14
10
19
12
89
36
0369
121518212427303336
0 5 10 15 20 25 30 35 40 45
Fig. 48: Reactor Age in Years
No
of
Re
ac
tors
3.7 THE CASE FOR NUCLEAR POWER
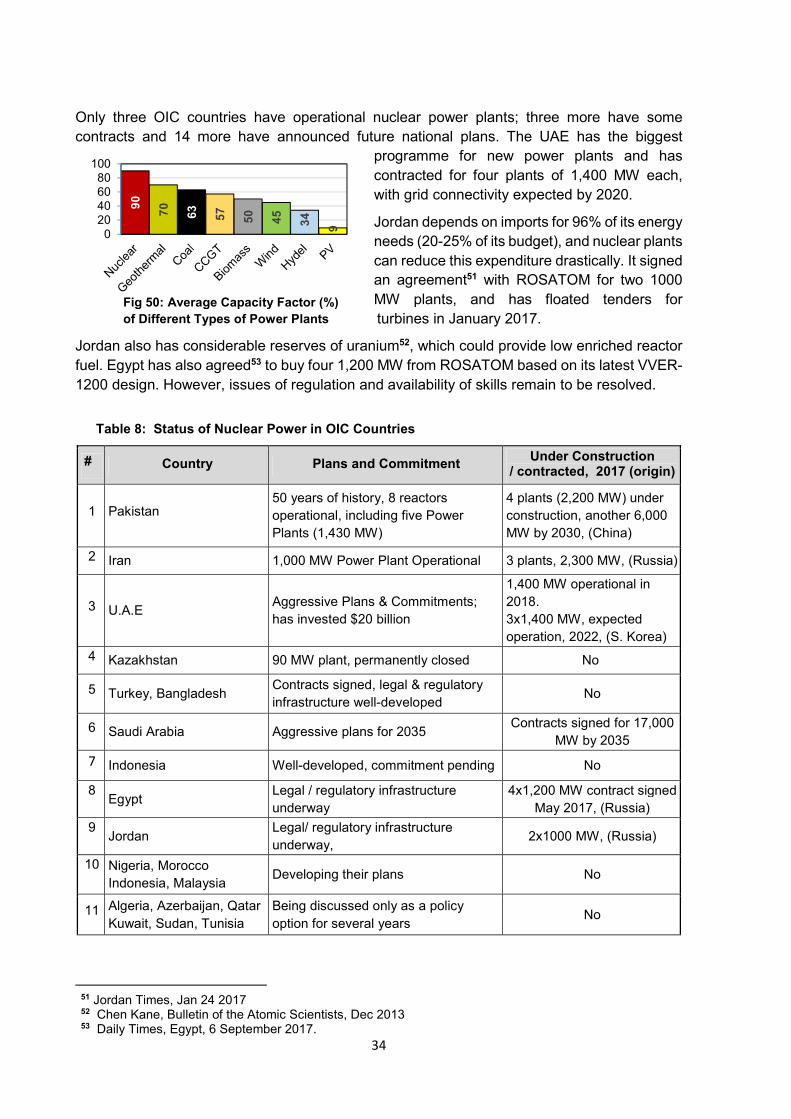
34
Only three OIC countries have operational nuclear power plants; three more have some
contracts and 14 more have announced future national plans. The UAE has the biggest
programme for new power plants and has
contracted for four plants of 1,400 MW each,
with grid connectivity expected by 2020.
Jordan depends on imports for 96% of its energy
needs (20-25% of its budget), and nuclear plants
can reduce this expenditure drastically. It signed
an agreement51 with ROSATOM for two 1000
MW plants, and has floated tenders for
turbines in January 2017.
Jordan also has considerable reserves of uranium52, which could provide low enriched reactor
fuel. Egypt has also agreed53 to buy four 1,200 MW from ROSATOM based on its latest VVER-
1200 design. However, issues of regulation and availability of skills remain to be resolved.
51 Jordan Times, Jan 24 2017 52 Chen Kane, Bulletin of the Atomic Scientists, Dec 2013 53 Daily Times, Egypt, 6 September 2017.
Table 8: Status of Nuclear Power in OIC Countries
# Country Plans and Commitment Under Construction
/ contracted, 2017 (origin)
1 Pakistan 50 years of history, 8 reactors
operational, including five Power
Plants (1,430 MW)
4 plants (2,200 MW) under
construction, another 6,000
MW by 2030, (China)
2 Iran 1,000 MW Power Plant Operational 3 plants, 2,300 MW, (Russia)
3 U.A.E Aggressive Plans & Commitments;
has invested $20 billion
1,400 MW operational in
2018.
3x1,400 MW, expected
operation, 2022, (S. Korea)
4 Kazakhstan 90 MW plant, permanently closed No
5 Turkey, Bangladesh Contracts signed, legal & regulatory
infrastructure well-developed No
6 Saudi Arabia Aggressive plans for 2035 Contracts signed for 17,000
MW by 2035
7 Indonesia Well-developed, commitment pending No
8 Egypt
Legal / regulatory infrastructure
underway
4x1,200 MW contract signed
May 2017, (Russia)
9 Jordan
Legal/ regulatory infrastructure
underway, 2x1000 MW, (Russia)
10 Nigeria, Morocco
Indonesia, Malaysia Developing their plans No
11 Algeria, Azerbaijan, Qatar
Kuwait, Sudan, Tunisia
Being discussed only as a policy
option for several years No
90
70
63
57
50
45
34
9
020406080
100
Fig 50: Average Capacity Factor (%)
of Different Types of Power Plants
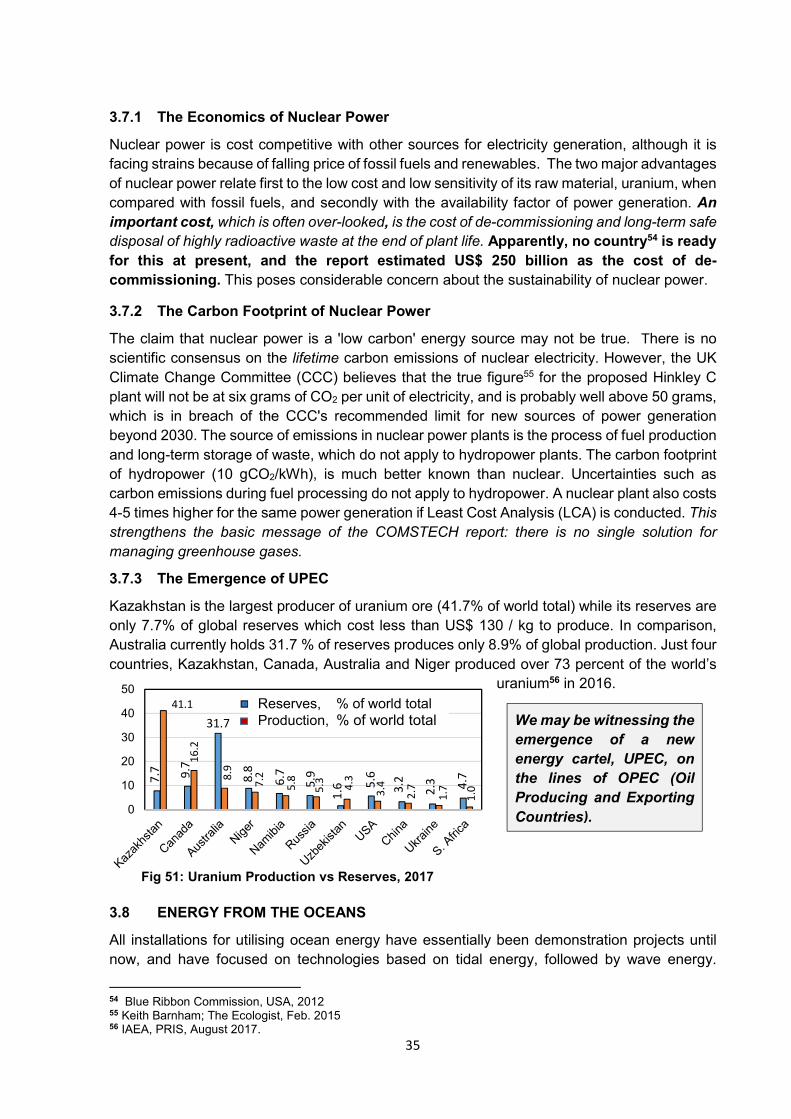
35
Nuclear power is cost competitive with other sources for electricity generation, although it is
facing strains because of falling price of fossil fuels and renewables. The two major advantages
of nuclear power relate first to the low cost and low sensitivity of its raw material, uranium, when
compared with fossil fuels, and secondly with the availability factor of power generation. An
important cost, which is often over-looked, is the cost of de-commissioning and long-term safe
disposal of highly radioactive waste at the end of plant life. Apparently, no country54 is ready
for this at present, and the report estimated US$ 250 billion as the cost of de-
commissioning. This poses considerable concern about the sustainability of nuclear power.
The claim that nuclear power is a 'low carbon' energy source may not be true. There is no
scientific consensus on the lifetime carbon emissions of nuclear electricity. However, the UK
Climate Change Committee (CCC) believes that the true figure55 for the proposed Hinkley C
plant will not be at six grams of CO2 per unit of electricity, and is probably well above 50 grams,
which is in breach of the CCC's recommended limit for new sources of power generation
beyond 2030. The source of emissions in nuclear power plants is the process of fuel production
and long-term storage of waste, which do not apply to hydropower plants. The carbon footprint
of hydropower (10 gCO2/kWh), is much better known than nuclear. Uncertainties such as
carbon emissions during fuel processing do not apply to hydropower. A nuclear plant also costs
4-5 times higher for the same power generation if Least Cost Analysis (LCA) is conducted. This
strengthens the basic message of the COMSTECH report: there is no single solution for
managing greenhouse gases.
Kazakhstan is the largest producer of uranium ore (41.7% of world total) while its reserves are
only 7.7% of global reserves which cost less than US$ 130 / kg to produce. In comparison,
Australia currently holds 31.7 % of reserves produces only 8.9% of global production. Just four
countries, Kazakhstan, Canada, Australia and Niger produced over 73 percent of the world’s
uranium56 in 2016.
All installations for utilising ocean energy have essentially been demonstration projects until
now, and have focused on technologies based on tidal energy, followed by wave energy.
54 Blue Ribbon Commission, USA, 2012 55 Keith Barnham; The Ecologist, Feb. 2015 56 IAEA, PRIS, August 2017.
We may be witnessing the
emergence of a new
energy cartel, UPEC, on
the lines of OPEC (Oil
Producing and Exporting
Countries).
7.7 9.7
31.7
8.8
6.7
5.9
1.6 5
.6
3.2
2.3 4.7
41.1
16
.2
8.9
7.2
5.8
5.3 4.3
3.4
2.7
1.7
1.0
0
10
20
30
40
50
Fig 51: Uranium Production vs Reserves, 2017
Reserves, % of world total Production, % of world total
3.7.1 The Economics of Nuclear Power
3.7.2 The Carbon Footprint of Nuclear Power
3.7.3 The Emergence of UPEC
3.8 ENERGY FROM THE OCEANS
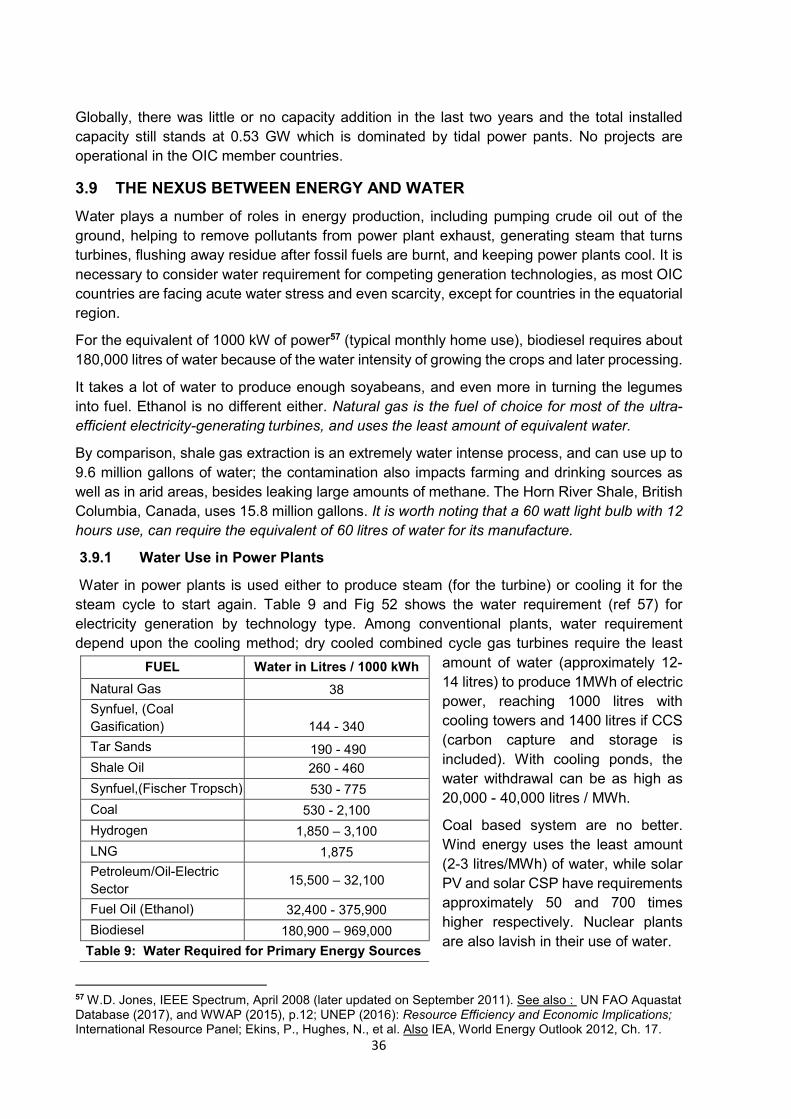
36
Globally, there was little or no capacity addition in the last two years and the total installed
capacity still stands at 0.53 GW which is dominated by tidal power pants. No projects are
operational in the OIC member countries.
Water plays a number of roles in energy production, including pumping crude oil out of the
ground, helping to remove pollutants from power plant exhaust, generating steam that turns
turbines, flushing away residue after fossil fuels are burnt, and keeping power plants cool. It is
necessary to consider water requirement for competing generation technologies, as most OIC
countries are facing acute water stress and even scarcity, except for countries in the equatorial
region.
For the equivalent of 1000 kW of power57 (typical monthly home use), biodiesel requires about
180,000 litres of water because of the water intensity of growing the crops and later processing.
It takes a lot of water to produce enough soyabeans, and even more in turning the legumes
into fuel. Ethanol is no different either. Natural gas is the fuel of choice for most of the ultra-
efficient electricity-generating turbines, and uses the least amount of equivalent water.
By comparison, shale gas extraction is an extremely water intense process, and can use up to
9.6 million gallons of water; the contamination also impacts farming and drinking sources as
well as in arid areas, besides leaking large amounts of methane. The Horn River Shale, British
Columbia, Canada, uses 15.8 million gallons. It is worth noting that a 60 watt light bulb with 12
hours use, can require the equivalent of 60 litres of water for its manufacture.
Water in power plants is used either to produce steam (for the turbine) or cooling it for the
steam cycle to start again. Table 9 and Fig 52 shows the water requirement (ref 57) for
electricity generation by technology type. Among conventional plants, water requirement
depend upon the cooling method; dry cooled combined cycle gas turbines require the least
amount of water (approximately 12-
14 litres) to produce 1MWh of electric
power, reaching 1000 litres with
cooling towers and 1400 litres if CCS
(carbon capture and storage is
included). With cooling ponds, the
water withdrawal can be as high as
20,000 - 40,000 litres / MWh.
Coal based system are no better.
Wind energy uses the least amount
(2-3 litres/MWh) of water, while solar
PV and solar CSP have requirements
approximately 50 and 700 times
higher respectively. Nuclear plants
are also lavish in their use of water.
57 W.D. Jones, IEEE Spectrum, April 2008 (later updated on September 2011). See also : UN FAO Aquastat Database (2017), and WWAP (2015), p.12; UNEP (2016): Resource Efficiency and Economic Implications; International Resource Panel; Ekins, P., Hughes, N., et al. Also IEA, World Energy Outlook 2012, Ch. 17.
FUEL Water in Litres / 1000 kWh
Natural Gas 38
Synfuel, (Coal
Gasification) 144 - 340
Tar Sands 190 - 490
Shale Oil 260 - 460
Synfuel,(Fischer Tropsch) 530 - 775
Coal 530 - 2,100
Hydrogen 1,850 – 3,100
LNG 1,875
Petroleum/Oil-Electric
Sector 15,500 – 32,100
Fuel Oil (Ethanol) 32,400 - 375,900
Biodiesel 180,900 – 969,000
Table 9: Water Required for Primary Energy Sources
3.9 THE NEXUS BETWEEN ENERGY AND WATER
3.9.1 Water Use in Power Plants
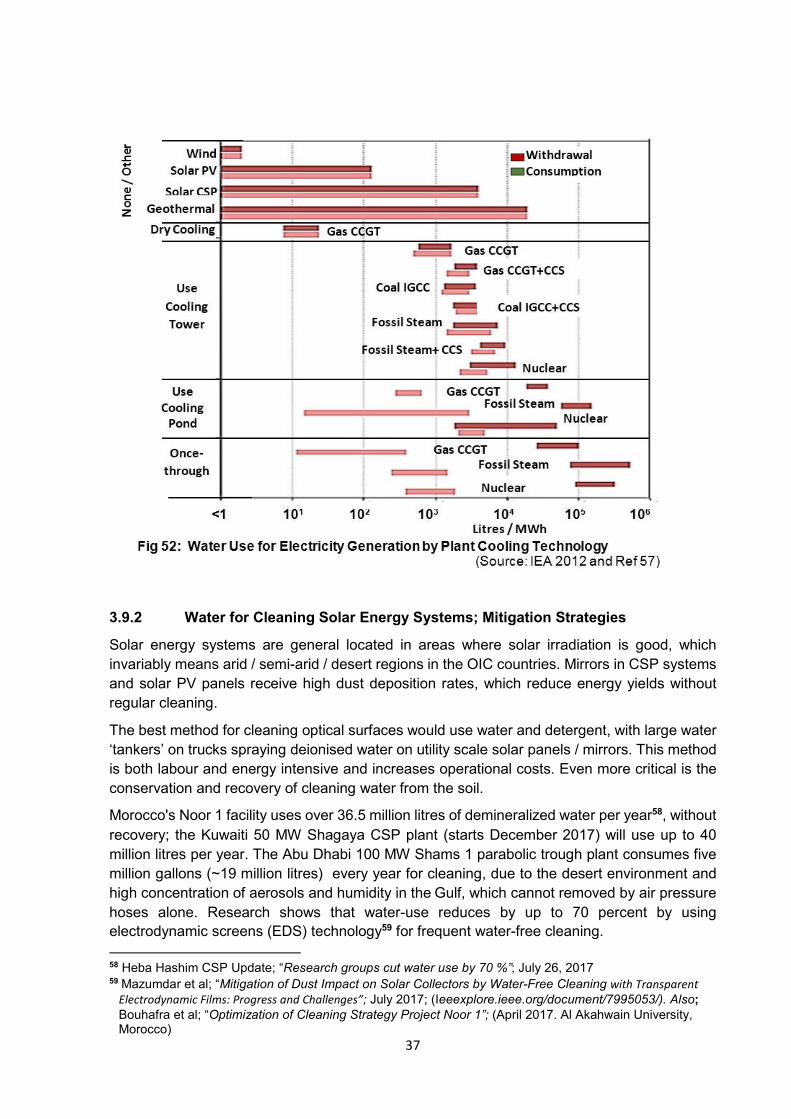
37
Solar energy systems are general located in areas where solar irradiation is good, which
invariably means arid / semi-arid / desert regions in the OIC countries. Mirrors in CSP systems
and solar PV panels receive high dust deposition rates, which reduce energy yields without
regular cleaning.
The best method for cleaning optical surfaces would use water and detergent, with large water
‘tankers’ on trucks spraying deionised water on utility scale solar panels / mirrors. This method
is both labour and energy intensive and increases operational costs. Even more critical is the
conservation and recovery of cleaning water from the soil.
Morocco's Noor 1 facility uses over 36.5 million litres of demineralized water per year58, without
recovery; the Kuwaiti 50 MW Shagaya CSP plant (starts December 2017) will use up to 40
million litres per year. The Abu Dhabi 100 MW Shams 1 parabolic trough plant consumes five
million gallons (~19 million litres) every year for cleaning, due to the desert environment and
high concentration of aerosols and humidity in the Gulf, which cannot removed by air pressure
hoses alone. Research shows that water-use reduces by up to 70 percent by using
electrodynamic screens (EDS) technology59 for frequent water-free cleaning.
58 Heba Hashim CSP Update; “Research groups cut water use by 70 %”; July 26, 2017 59 Mazumdar et al; “Mitigation of Dust Impact on Solar Collectors by Water-Free Cleaning with Transparent
Electrodynamic Films: Progress and Challenges”; July 2017; (Ieeexplore.ieee.org/document/7995053/). Also; Bouhafra et al; “Optimization of Cleaning Strategy Project Noor 1”; (April 2017. Al Akahwain University, Morocco)
Geothermal
Wind
Solar PV
Solar CSP
Gas CCGT
Coal IGCC
Gas CCGT+CCS
Coal IGCC+CCS
Fossil Steam
Fossil Steam+ CCS
Nuclear
Gas CCGT
Fossil Steam
Nuclear
Gas CCGT Fossil Steam
Nuclear
Dry Cooling
Once-
through
Use
Cooling
Pond
Use
Cooling
Tower
Gas CCGT
Withdrawal
Consumption
Fig 52: Water Use for Electricity Generation by Plant Cooling Technology (Source: IEA 2012 and Ref 57)
No
ne
/ O
the
r
<1 101 102 103 104 105 106 Litres / MWh
3.9.2 Water for Cleaning Solar Energy Systems; Mitigation Strategies
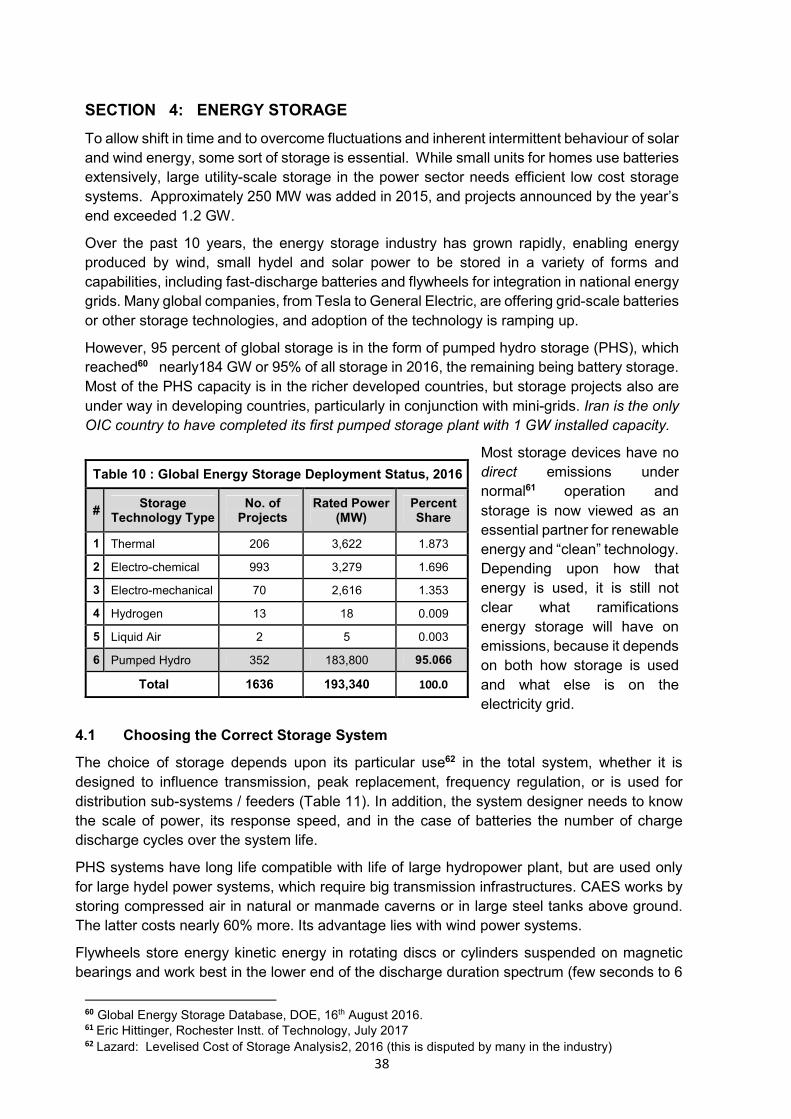
38
To allow shift in time and to overcome fluctuations and inherent intermittent behaviour of solar
and wind energy, some sort of storage is essential. While small units for homes use batteries
extensively, large utility-scale storage in the power sector needs efficient low cost storage
systems. Approximately 250 MW was added in 2015, and projects announced by the year’s
end exceeded 1.2 GW.
Over the past 10 years, the energy storage industry has grown rapidly, enabling energy
produced by wind, small hydel and solar power to be stored in a variety of forms and
capabilities, including fast-discharge batteries and flywheels for integration in national energy
grids. Many global companies, from Tesla to General Electric, are offering grid-scale batteries
or other storage technologies, and adoption of the technology is ramping up.
However, 95 percent of global storage is in the form of pumped hydro storage (PHS), which
reached60 nearly184 GW or 95% of all storage in 2016, the remaining being battery storage.
Most of the PHS capacity is in the richer developed countries, but storage projects also are
under way in developing countries, particularly in conjunction with mini-grids. Iran is the only
OIC country to have completed its first pumped storage plant with 1 GW installed capacity.
Most storage devices have no
direct emissions under
normal61 operation and
storage is now viewed as an
essential partner for renewable
energy and “clean” technology.
Depending upon how that
energy is used, it is still not
clear what ramifications
energy storage will have on
emissions, because it depends
on both how storage is used
and what else is on the
electricity grid.
The choice of storage depends upon its particular use62 in the total system, whether it is
designed to influence transmission, peak replacement, frequency regulation, or is used for
distribution sub-systems / feeders (Table 11). In addition, the system designer needs to know
the scale of power, its response speed, and in the case of batteries the number of charge
discharge cycles over the system life.
PHS systems have long life compatible with life of large hydropower plant, but are used only
for large hydel power systems, which require big transmission infrastructures. CAES works by
storing compressed air in natural or manmade caverns or in large steel tanks above ground.
The latter costs nearly 60% more. Its advantage lies with wind power systems.
Flywheels store energy kinetic energy in rotating discs or cylinders suspended on magnetic
bearings and work best in the lower end of the discharge duration spectrum (few seconds to 6
60 Global Energy Storage Database, DOE, 16th August 2016. 61 Eric Hittinger, Rochester Instt. of Technology, July 2017 62 Lazard: Levelised Cost of Storage Analysis2, 2016 (this is disputed by many in the industry)
Table 10 : Global Energy Storage Deployment Status, 2016
# Storage
Technology Type No. of
Projects Rated Power
(MW) Percent Share
1 Thermal 206 3,622 1.873
2 Electro-chemical 993 3,279 1.696
3 Electro-mechanical 70 2,616 1.353
4 Hydrogen 13 18 0.009
5 Liquid Air 2 5 0.003
6 Pumped Hydro 352 183,800 95.066
Total 1636 193,340 100.0
SECTION 4: ENERGY STORAGE
4.1 Choosing the Correct Storage System
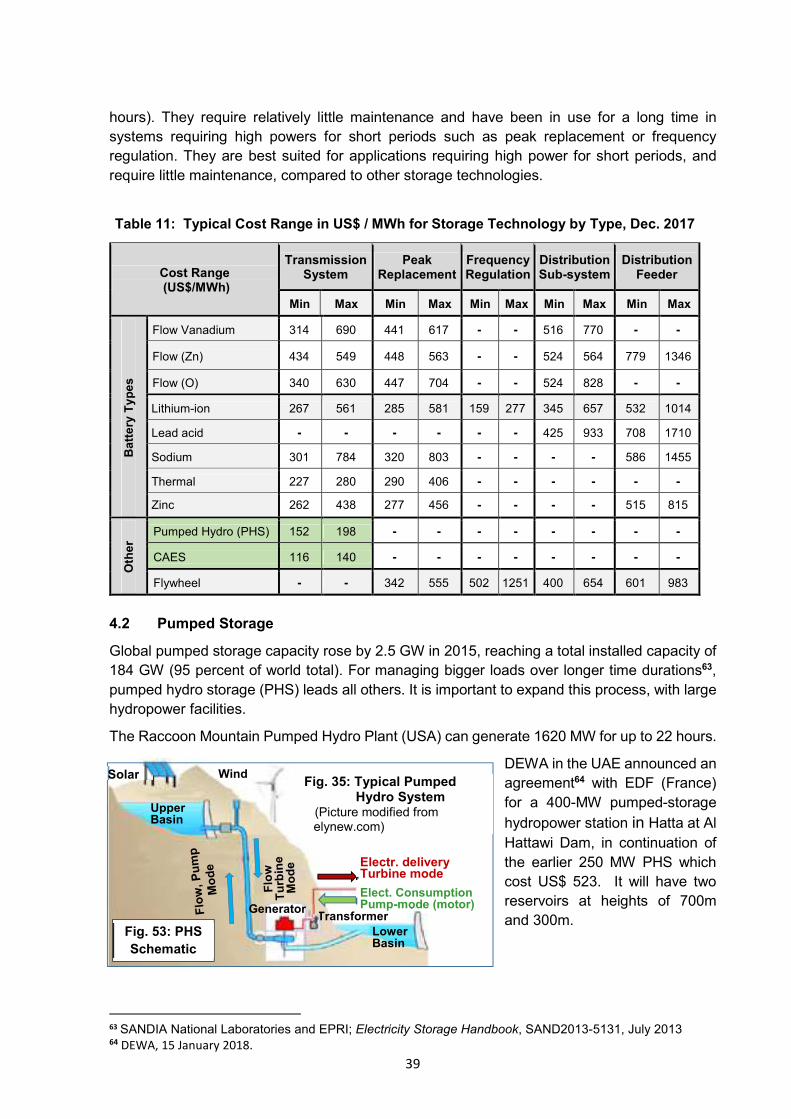
39
hours). They require relatively little maintenance and have been in use for a long time in
systems requiring high powers for short periods such as peak replacement or frequency
regulation. They are best suited for applications requiring high power for short periods, and
require little maintenance, compared to other storage technologies.
Global pumped storage capacity rose by 2.5 GW in 2015, reaching a total installed capacity of
184 GW (95 percent of world total). For managing bigger loads over longer time durations63,
pumped hydro storage (PHS) leads all others. It is important to expand this process, with large
hydropower facilities.
The Raccoon Mountain Pumped Hydro Plant (USA) can generate 1620 MW for up to 22 hours.
DEWA in the UAE announced an
agreement64 with EDF (France)
for a 400-MW pumped-storage
hydropower station in Hatta at Al
Hattawi Dam, in continuation of
the earlier 250 MW PHS which
cost US$ 523. It will have two
reservoirs at heights of 700m
and 300m.
63 SANDIA National Laboratories and EPRI; Electricity Storage Handbook, SAND2013-5131, July 2013 64 DEWA, 15 January 2018.
Table 11: Typical Cost Range in US$ / MWh for Storage Technology by Type, Dec. 2017
Cost Range (US$/MWh)
Transmission System
Peak Replacement
Frequency Regulation
Distribution Sub-system
Distribution Feeder
Min Max Min Max Min Max Min Max Min Max
Ba
tte
ry T
yp
es
Flow Vanadium 314 690 441 617 - - 516 770 - -
Flow (Zn) 434 549 448 563 - - 524 564 779 1346
Flow (O) 340 630 447 704 - - 524 828 - -
Lithium-ion 267 561 285 581 159 277 345 657 532 1014
Lead acid - - - - - - 425 933 708 1710
Sodium 301 784 320 803 - - - - 586 1455
Thermal 227 280 290 406 - - - - - -
Zinc 262 438 277 456 - - - - 515 815
Oth
er
Pumped Hydro (PHS) 152 198 - - - - - - - -
CAES 116 140 - - - - - - - -
Flywheel - - 342 555 502 1251 400 654 601 983
Lower Basin
Upper Basin
Transformer
Electr. delivery Turbine mode
Elect. Consumption Pump-mode (motor) Generator
Fig. 35: Typical Pumped Hydro System (Picture modified from
elynew.com)
Wind Solar
Fig. 53: PHS
Schematic
4.2 Pumped Storage
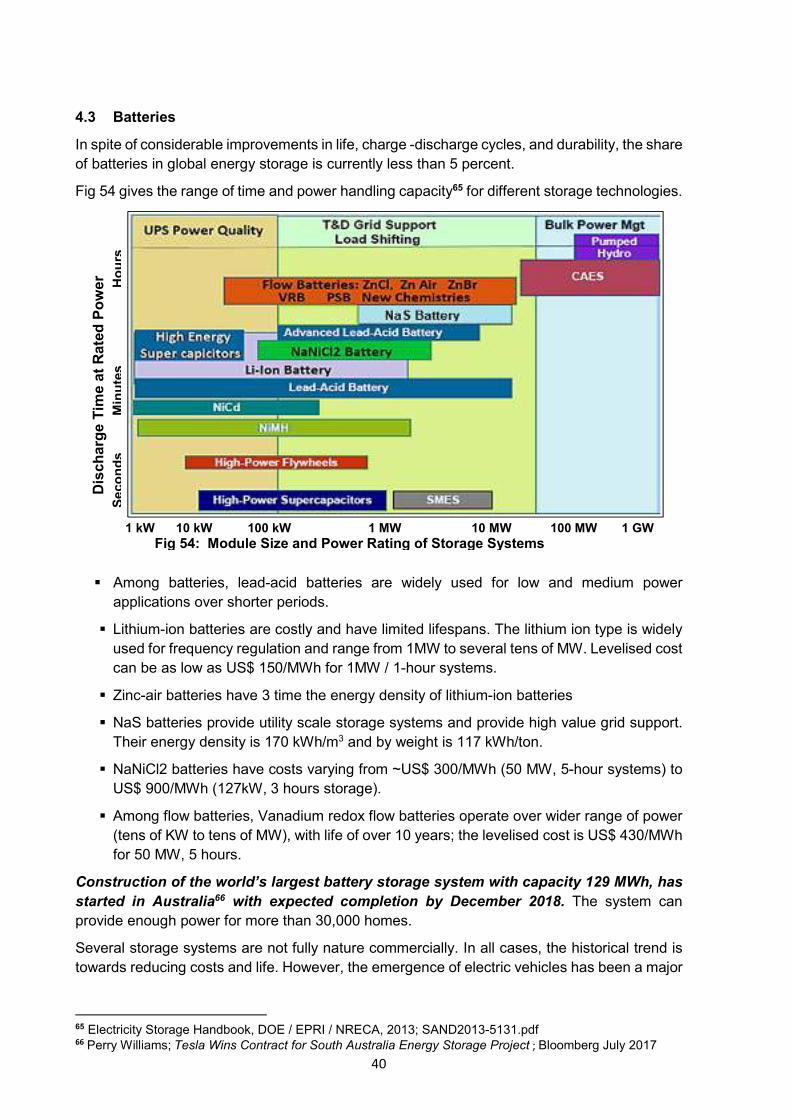
40
In spite of considerable improvements in life, charge -discharge cycles, and durability, the share
of batteries in global energy storage is currently less than 5 percent.
Fig 54 gives the range of time and power handling capacity65 for different storage technologies.
Among batteries, lead-acid batteries are widely used for low and medium power
applications over shorter periods.
Lithium-ion batteries are costly and have limited lifespans. The lithium ion type is widely
used for frequency regulation and range from 1MW to several tens of MW. Levelised cost
can be as low as US$ 150/MWh for 1MW / 1-hour systems.
Zinc-air batteries have 3 time the energy density of lithium-ion batteries
NaS batteries provide utility scale storage systems and provide high value grid support.
Their energy density is 170 kWh/m3 and by weight is 117 kWh/ton.
NaNiCl2 batteries have costs varying from ~US$ 300/MWh (50 MW, 5-hour systems) to
US$ 900/MWh (127kW, 3 hours storage).
Among flow batteries, Vanadium redox flow batteries operate over wider range of power
(tens of KW to tens of MW), with life of over 10 years; the levelised cost is US$ 430/MWh
for 50 MW, 5 hours.
Construction of the world’s largest battery storage system with capacity 129 MWh, has
started in Australia66 with expected completion by December 2018. The system can
provide enough power for more than 30,000 homes.
Several storage systems are not fully nature commercially. In all cases, the historical trend is
towards reducing costs and life. However, the emergence of electric vehicles has been a major
65 Electricity Storage Handbook, DOE / EPRI / NRECA, 2013; SAND2013-5131.pdf 66 Perry Williams; Tesla Wins Contract for South Australia Energy Storage Project ; Bloomberg July 2017
1 kW 10 kW 100 kW 1 MW 10 MW 100 MW 1 GW
Fig 54: Module Size and Power Rating of Storage Systems
Dis
ch
arg
e T
ime a
t R
ate
d P
ow
er
S
eco
nd
s
M
inu
tes
Ho
urs
4.3 Batteries
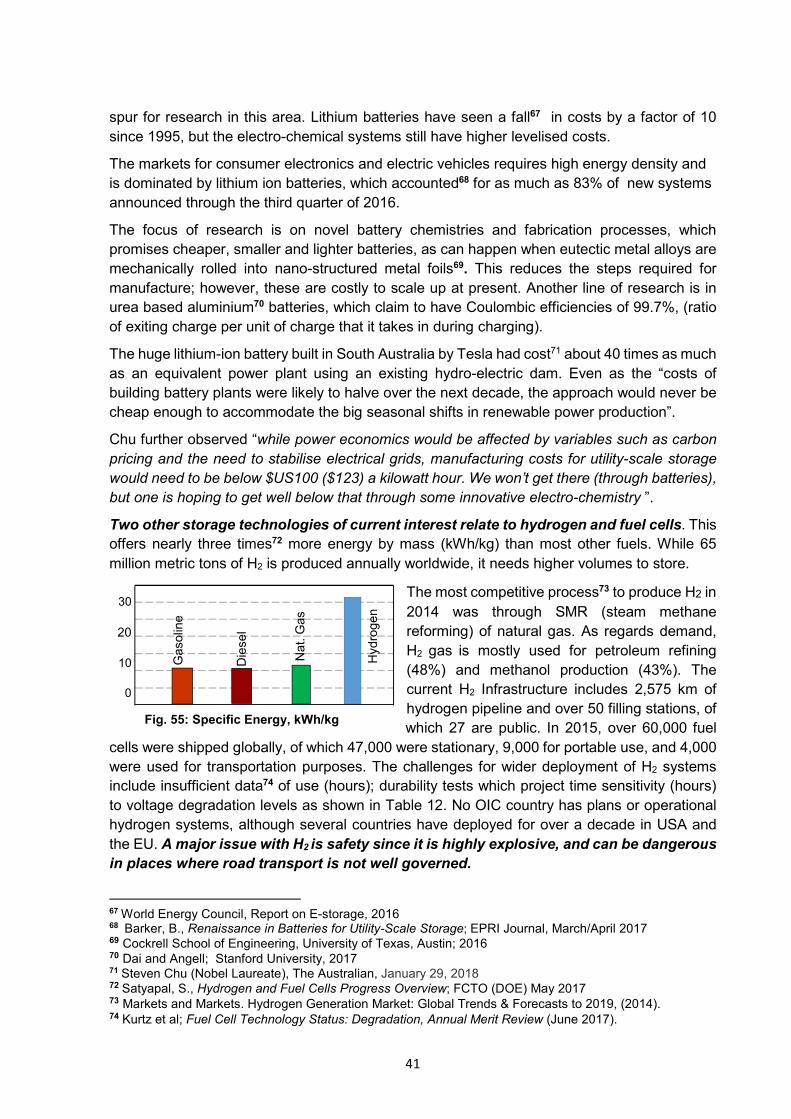
41
spur for research in this area. Lithium batteries have seen a fall67 in costs by a factor of 10
since 1995, but the electro-chemical systems still have higher levelised costs.
The markets for consumer electronics and electric vehicles requires high energy density and
is dominated by lithium ion batteries, which accounted68 for as much as 83% of new systems
announced through the third quarter of 2016.
The focus of research is on novel battery chemistries and fabrication processes, which
promises cheaper, smaller and lighter batteries, as can happen when eutectic metal alloys are
mechanically rolled into nano-structured metal foils69. This reduces the steps required for
manufacture; however, these are costly to scale up at present. Another line of research is in
urea based aluminium70 batteries, which claim to have Coulombic efficiencies of 99.7%, (ratio
of exiting charge per unit of charge that it takes in during charging).
The huge lithium-ion battery built in South Australia by Tesla had cost71 about 40 times as much
as an equivalent power plant using an existing hydro-electric dam. Even as the “costs of
building battery plants were likely to halve over the next decade, the approach would never be
cheap enough to accommodate the big seasonal shifts in renewable power production”.
Chu further observed “while power economics would be affected by variables such as carbon
pricing and the need to stabilise electrical grids, manufacturing costs for utility-scale storage
would need to be below $US100 ($123) a kilowatt hour. We won’t get there (through batteries),
but one is hoping to get well below that through some innovative electro-chemistry ”.
Two other storage technologies of current interest relate to hydrogen and fuel cells. This
offers nearly three times72 more energy by mass (kWh/kg) than most other fuels. While 65
million metric tons of H2 is produced annually worldwide, it needs higher volumes to store.
The most competitive process73 to produce H2 in
2014 was through SMR (steam methane
reforming) of natural gas. As regards demand,
H2 gas is mostly used for petroleum refining
(48%) and methanol production (43%). The
current H2 Infrastructure includes 2,575 km of
hydrogen pipeline and over 50 filling stations, of
which 27 are public. In 2015, over 60,000 fuel
cells were shipped globally, of which 47,000 were stationary, 9,000 for portable use, and 4,000
were used for transportation purposes. The challenges for wider deployment of H2 systems
include insufficient data74 of use (hours); durability tests which project time sensitivity (hours)
to voltage degradation levels as shown in Table 12. No OIC country has plans or operational
hydrogen systems, although several countries have deployed for over a decade in USA and
the EU. A major issue with H2 is safety since it is highly explosive, and can be dangerous
in places where road transport is not well governed.
67 World Energy Council, Report on E-storage, 2016 68 Barker, B., Renaissance in Batteries for Utility-Scale Storage; EPRI Journal, March/April 2017 69 Cockrell School of Engineering, University of Texas, Austin; 2016 70 Dai and Angell; Stanford University, 2017 71 Steven Chu (Nobel Laureate), The Australian, January 29, 2018 72 Satyapal, S., Hydrogen and Fuel Cells Progress Overview; FCTO (DOE) May 2017 73 Markets and Markets. Hydrogen Generation Market: Global Trends & Forecasts to 2019, (2014). 74 Kurtz et al; Fuel Cell Technology Status: Degradation, Annual Merit Review (June 2017).
Fig. 55: Specific Energy, kWh/kg
30
25
20
15
10
5
0
Ga
so
line
Die
se
l
Na
t. G
as
Hyd
rog
en
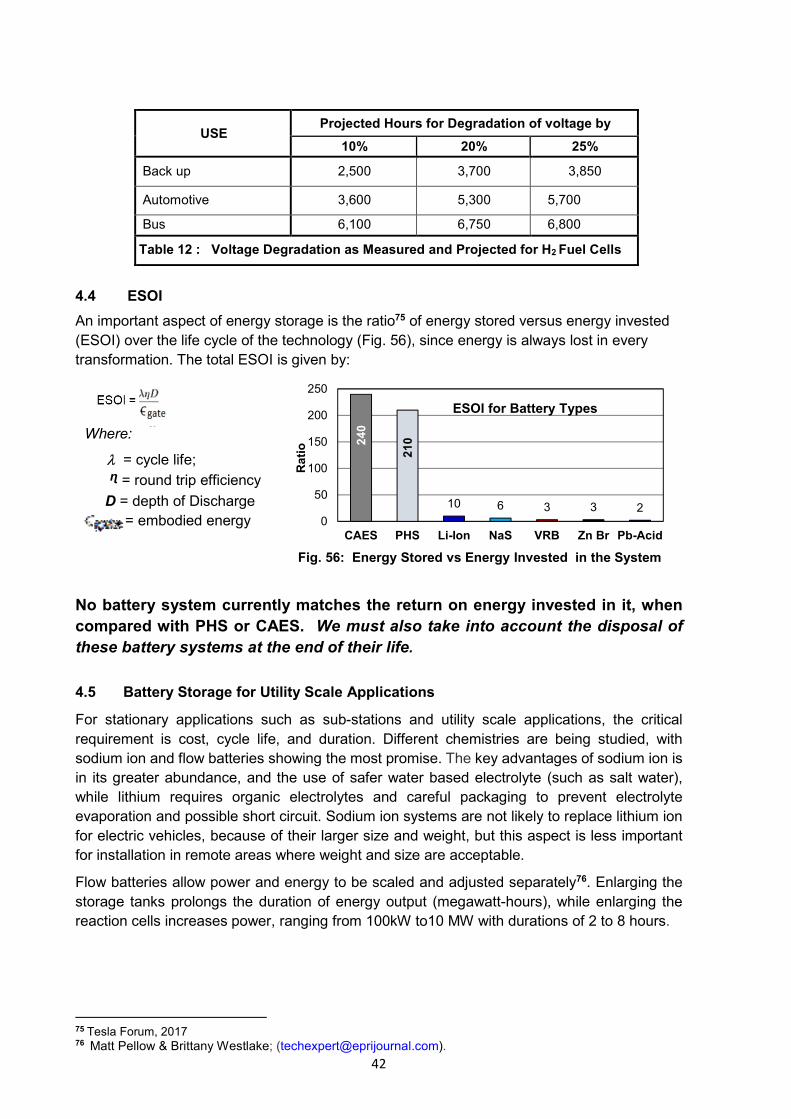
42
An important aspect of energy storage is the ratio75 of energy stored versus energy invested
(ESOI) over the life cycle of the technology (Fig. 56), since energy is always lost in every
transformation. The total ESOI is given by:
No battery system currently matches the return on energy invested in it, when
compared with PHS or CAES. We must also take into account the disposal of
these battery systems at the end of their life.
For stationary applications such as sub-stations and utility scale applications, the critical
requirement is cost, cycle life, and duration. Different chemistries are being studied, with
sodium ion and flow batteries showing the most promise. The key advantages of sodium ion is
in its greater abundance, and the use of safer water based electrolyte (such as salt water),
while lithium requires organic electrolytes and careful packaging to prevent electrolyte
evaporation and possible short circuit. Sodium ion systems are not likely to replace lithium ion
for electric vehicles, because of their larger size and weight, but this aspect is less important
for installation in remote areas where weight and size are acceptable.
Flow batteries allow power and energy to be scaled and adjusted separately76. Enlarging the
storage tanks prolongs the duration of energy output (megawatt-hours), while enlarging the
reaction cells increases power, ranging from 100kW to10 MW with durations of 2 to 8 hours.
75 Tesla Forum, 2017 76 Matt Pellow & Brittany Westlake; ([email protected]).
USE Projected Hours for Degradation of voltage by
10% 20% 25%
Back up 2,500 3,700 3,850
Automotive 3,600 5,300 5,700
Bus 6,100 6,750 6,800
Table 12 : Voltage Degradation as Measured and Projected for H2 Fuel Cells
24
0
21
0
10 6 3 3 20
50
100
150
200
250
CAES PHS Li-Ion NaS VRB Zn Br Pb-Acid
ESOI for Battery Types
Fig. 56: Energy Stored vs Energy Invested in the System
Ra
tio
Where:
= cycle life;
ᶯ = round trip efficiency
D = depth of Discharge
= embodied energy
ESOI =
4.4 ESOI
4.5 Battery Storage for Utility Scale Applications
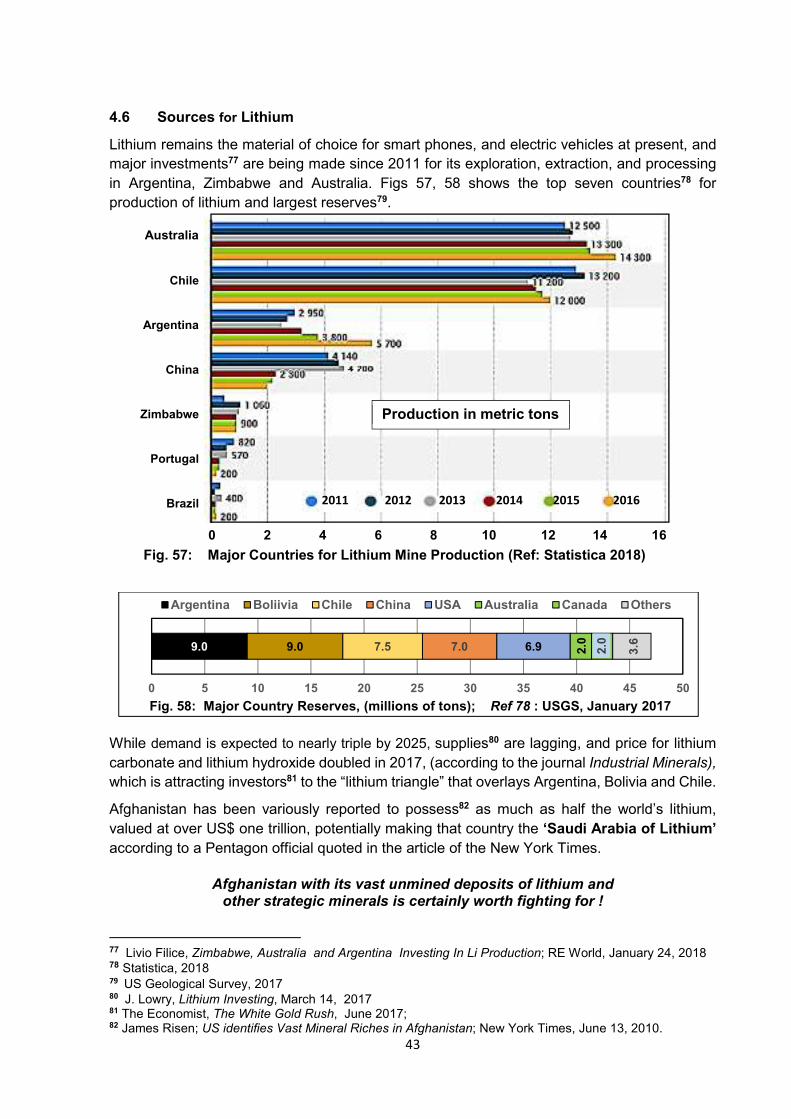
43
Lithium remains the material of choice for smart phones, and electric vehicles at present, and
major investments77 are being made since 2011 for its exploration, extraction, and processing
in Argentina, Zimbabwe and Australia. Figs 57, 58 shows the top seven countries78 for
production of lithium and largest reserves79.
While demand is expected to nearly triple by 2025, supplies80 are lagging, and price for lithium
carbonate and lithium hydroxide doubled in 2017, (according to the journal Industrial Minerals),
which is attracting investors81 to the “lithium triangle” that overlays Argentina, Bolivia and Chile.
Afghanistan has been variously reported to possess82 as much as half the world’s lithium,
valued at over US$ one trillion, potentially making that country the ‘Saudi Arabia of Lithium’
according to a Pentagon official quoted in the article of the New York Times.
Afghanistan with its vast unmined deposits of lithium and
other strategic minerals is certainly worth fighting for !
77 Livio Filice, Zimbabwe, Australia and Argentina Investing In Li Production; RE World, January 24, 2018 78 Statistica, 2018 79 US Geological Survey, 2017 80 J. Lowry, Lithium Investing, March 14, 2017 81 The Economist, The White Gold Rush, June 2017; 82 James Risen; US identifies Vast Mineral Riches in Afghanistan; New York Times, June 13, 2010.
9.0 9.0 7.5 7.0 6.9 2.0
2.0
3.6
0 5 10 15 20 25 30 35 40 45 50
Argentina Boliivia Chile China USA Australia Canada Others
Fig. 58: Major Country Reserves, (millions of tons); Ref 78 : USGS, January 2017
Fig. 57: Major Countries for Lithium Mine Production (Ref: Statistica 2018)
Australia
Chile
Argentina
China
Zimbabwe
Portugal
Brazil 2011 2012 2013 2014 2015 2016
Production in metric tons
0 2 4 6 8 10 12 14 16
4.6 Sources for Lithium
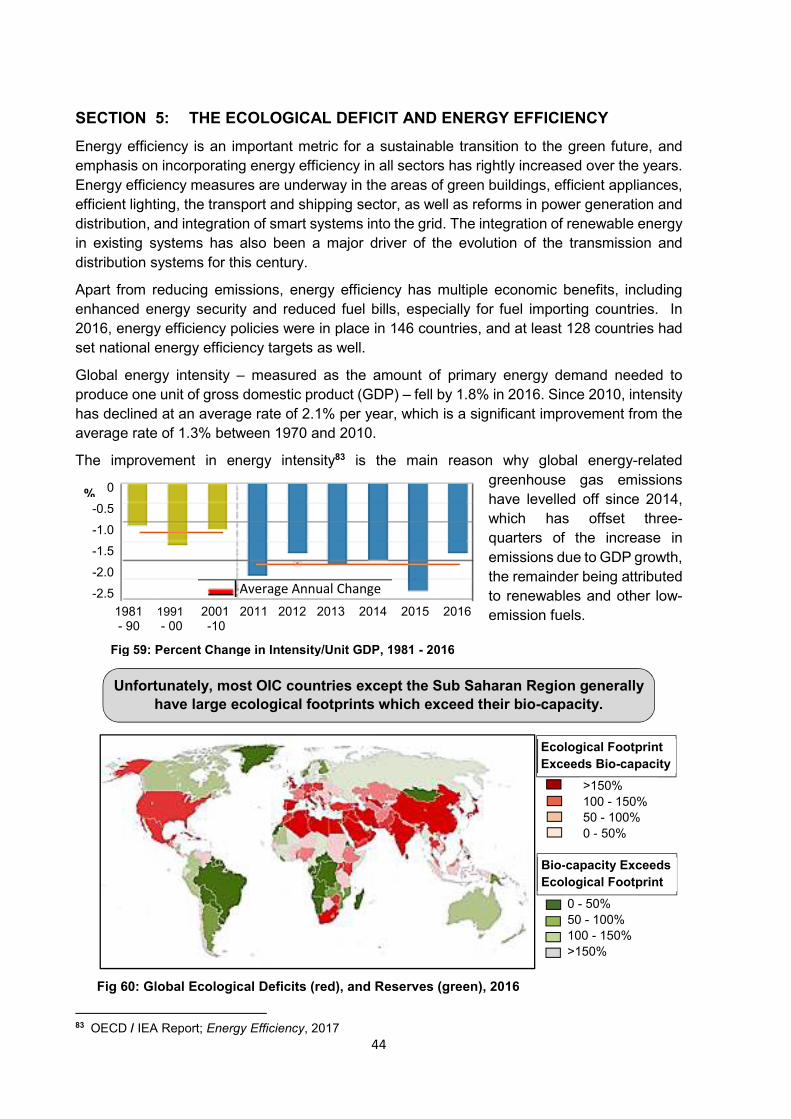
44
Energy efficiency is an important metric for a sustainable transition to the green future, and
emphasis on incorporating energy efficiency in all sectors has rightly increased over the years.
Energy efficiency measures are underway in the areas of green buildings, efficient appliances,
efficient lighting, the transport and shipping sector, as well as reforms in power generation and
distribution, and integration of smart systems into the grid. The integration of renewable energy
in existing systems has also been a major driver of the evolution of the transmission and
distribution systems for this century.
Apart from reducing emissions, energy efficiency has multiple economic benefits, including
enhanced energy security and reduced fuel bills, especially for fuel importing countries. In
2016, energy efficiency policies were in place in 146 countries, and at least 128 countries had
set national energy efficiency targets as well.
Global energy intensity – measured as the amount of primary energy demand needed to
produce one unit of gross domestic product (GDP) – fell by 1.8% in 2016. Since 2010, intensity
has declined at an average rate of 2.1% per year, which is a significant improvement from the
average rate of 1.3% between 1970 and 2010.
The improvement in energy intensity83 is the main reason why global energy-related
greenhouse gas emissions
have levelled off since 2014,
which has offset three-
quarters of the increase in
emissions due to GDP growth,
the remainder being attributed
to renewables and other low-
emission fuels.
83 OECD / IEA Report; Energy Efficiency, 2017
0
-0.5
-1.0
-1.5
-2.0
-2.5
1981 1991 2001 2011 2012 2013 2014 2015 2016 - 90 - 00 -10
Average Annual Change
Fig 59: Percent Change in Intensity/Unit GDP, 1981 - 2016
%
Unfortunately, most OIC countries except the Sub Saharan Region generally
have large ecological footprints which exceed their bio-capacity.
Ecological Footprint
Exceeds Bio-capacity
>150%
100 - 150%
50 - 100%
0 - 50%
Bio-capacity Exceeds
Ecological Footprint
0 - 50%
50 - 100%
100 - 150%
>150%
Fig 60: Global Ecological Deficits (red), and Reserves (green), 2016
SECTION 5: THE ECOLOGICAL DEFICIT AND ENERGY EFFICIENCY
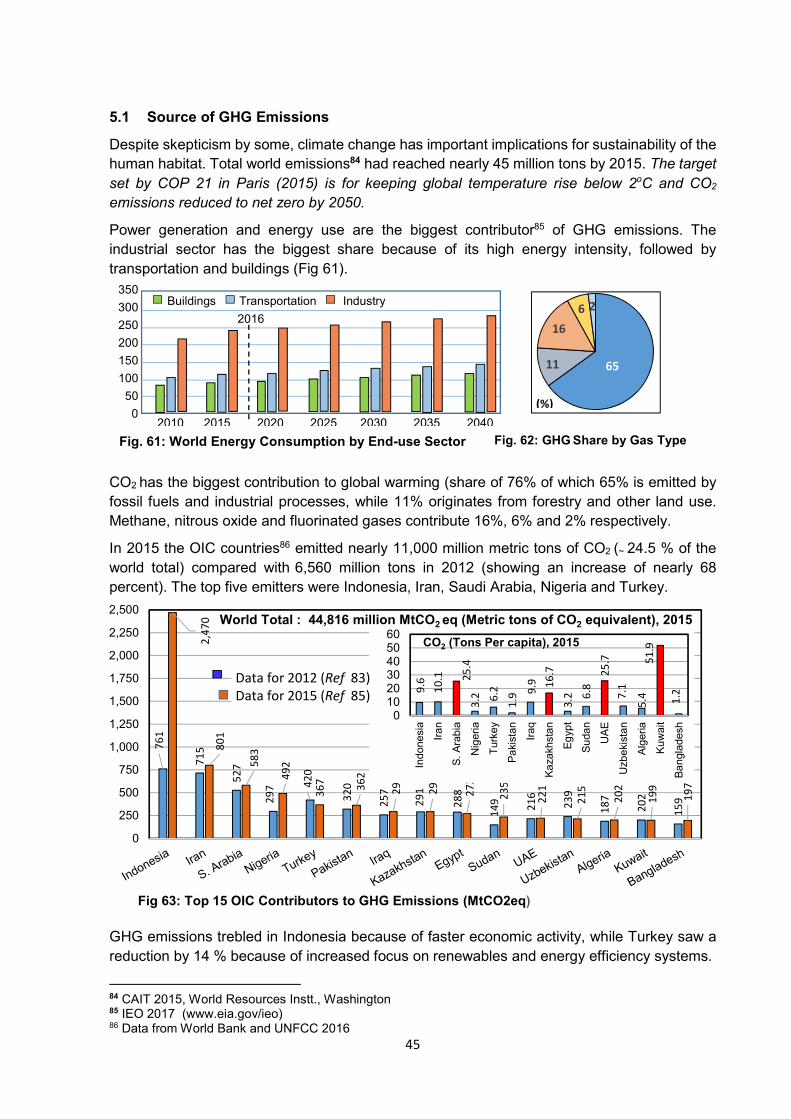
45
Despite skepticism by some, climate change has important implications for sustainability of the
human habitat. Total world emissions84 had reached nearly 45 million tons by 2015. The target
set by COP 21 in Paris (2015) is for keeping global temperature rise below 2oC and CO2
emissions reduced to net zero by 2050.
Power generation and energy use are the biggest contributor85 of GHG emissions. The
industrial sector has the biggest share because of its high energy intensity, followed by
transportation and buildings (Fig 61).
CO2 has the biggest contribution to global warming (share of 76% of which 65% is emitted by
fossil fuels and industrial processes, while 11% originates from forestry and other land use.
Methane, nitrous oxide and fluorinated gases contribute 16%, 6% and 2% respectively.
In 2015 the OIC countries86 emitted nearly 11,000 million metric tons of CO2 (~ 24.5 % of the
world total) compared with 6,560 million tons in 2012 (showing an increase of nearly 68
percent). The top five emitters were Indonesia, Iran, Saudi Arabia, Nigeria and Turkey.
GHG emissions trebled in Indonesia because of faster economic activity, while Turkey saw a
reduction by 14 % because of increased focus on renewables and energy efficiency systems.
84 CAIT 2015, World Resources Instt., Washington 85 IEO 2017 (www.eia.gov/ieo) 86 Data from World Bank and UNFCC 2016
76
1
71
5
52
7
29
7 42
0
32
0
25
7
29
1
28
8
14
9
21
6
23
9
18
7
20
2
15
9
2,4
70
80
1
58
3
49
2
36
7
36
2
29
3
29
2
27
2
23
5
22
1
21
5
20
2
19
9
19
7
0
250
500
750
1,000
1,250
1,500
1,750
2,000
2,250
2,500
Fig 63: Top 15 OIC Contributors to GHG Emissions (MtCO2eq)
World Total : 44,816 million MtCO2 eq (Metric tons of CO2 equivalent), 2015
9.6
10
.1 25
.43
.2 6.2
1.9
9.9 1
6.7
3.2 6
.8
25
.7
7.1
5.4
51
.9
1.2
0102030405060
Indonesi
a
Iran
S.
Ara
bia
Nig
eria
Turk
ey
Pa
kist
an
Iraq
Ka
zakh
sta
n
Eg
ypt
Su
dan
UA
E
Uzb
eki
stan
Alg
eria
Ku
wait
Ba
ngla
desh
CO2 (Tons Per capita), 2015
Data for 2012 (Ref 83)
Data for 2015 (Ref 85)
2016
350
300
250
200
150
100
50
0 2010 2015 2020 2025 2030 2035 2040
Buildings Transportation Industry
Fig. 61: World Energy Consumption by End-use Sector
6511
16
6 2
Fig. 62: GHG Share by Gas Type
(%)
5.1 Source of GHG Emissions
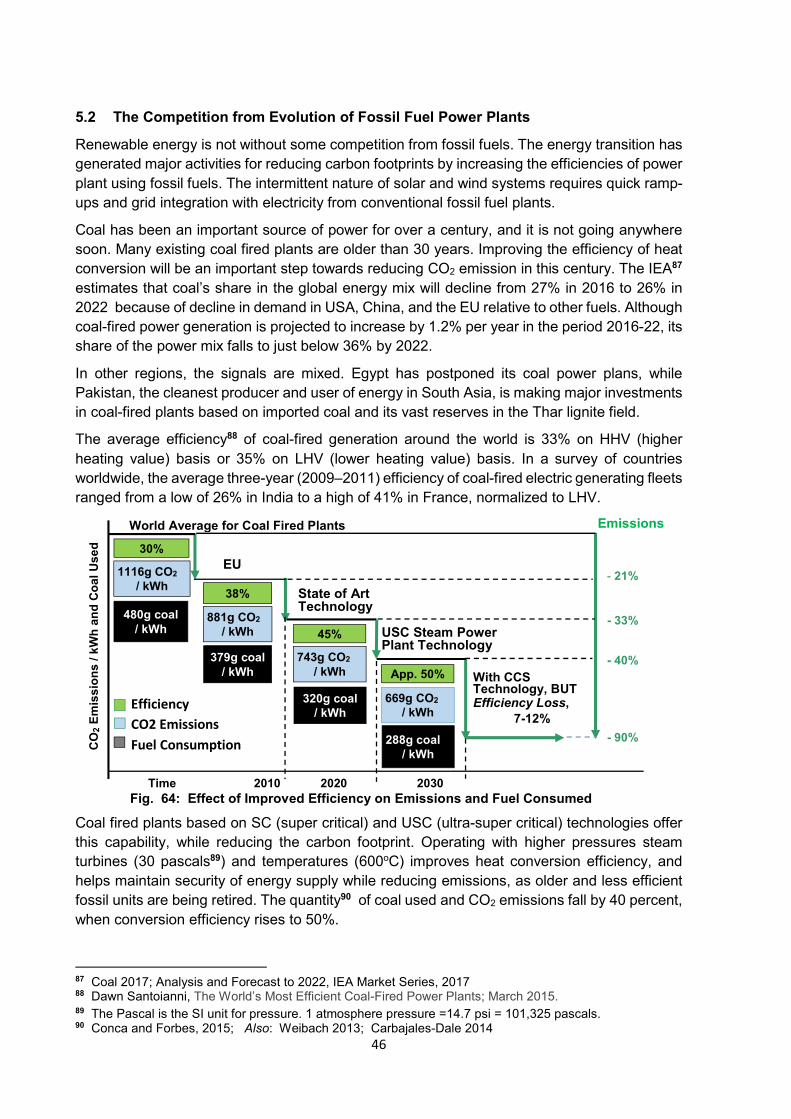
46
Renewable energy is not without some competition from fossil fuels. The energy transition has
generated major activities for reducing carbon footprints by increasing the efficiencies of power
plant using fossil fuels. The intermittent nature of solar and wind systems requires quick ramp-
ups and grid integration with electricity from conventional fossil fuel plants.
Coal has been an important source of power for over a century, and it is not going anywhere
soon. Many existing coal fired plants are older than 30 years. Improving the efficiency of heat
conversion will be an important step towards reducing CO2 emission in this century. The IEA87
estimates that coal’s share in the global energy mix will decline from 27% in 2016 to 26% in
2022 because of decline in demand in USA, China, and the EU relative to other fuels. Although
coal-fired power generation is projected to increase by 1.2% per year in the period 2016-22, its
share of the power mix falls to just below 36% by 2022.
In other regions, the signals are mixed. Egypt has postponed its coal power plans, while
Pakistan, the cleanest producer and user of energy in South Asia, is making major investments
in coal-fired plants based on imported coal and its vast reserves in the Thar lignite field.
The average efficiency88 of coal-fired generation around the world is 33% on HHV (higher
heating value) basis or 35% on LHV (lower heating value) basis. In a survey of countries
worldwide, the average three-year (2009–2011) efficiency of coal-fired electric generating fleets
ranged from a low of 26% in India to a high of 41% in France, normalized to LHV.
Coal fired plants based on SC (super critical) and USC (ultra-super critical) technologies offer
this capability, while reducing the carbon footprint. Operating with higher pressures steam
turbines (30 pascals89) and temperatures (600oC) improves heat conversion efficiency, and
helps maintain security of energy supply while reducing emissions, as older and less efficient
fossil units are being retired. The quantity90 of coal used and CO2 emissions fall by 40 percent,
when conversion efficiency rises to 50%.
87 Coal 2017; Analysis and Forecast to 2022, IEA Market Series, 2017 88 Dawn Santoianni, The World’s Most Efficient Coal-Fired Power Plants; March 2015. 89 The Pascal is the SI unit for pressure. 1 atmosphere pressure =14.7 psi = 101,325 pascals. 90 Conca and Forbes, 2015; Also: Weibach 2013; Carbajales-Dale 2014
With CCS Technology, BUT Efficiency Loss,
7-12%
CO
2 E
mis
sio
ns /
kW
h a
nd
Co
al
Us
ed
Time 2010 2020 2030
Fig. 64: Effect of Improved Efficiency on Emissions and Fuel Consumed
- 21%
- 33%
- 40%
- 90%
EU
State of Art Technology
USC Steam Power Plant Technology
Emissions World Average for Coal Fired Plants
30%
1116g CO2
/ kWh
480g coal
/ kWh
38%
881g CO2
/ kWh
379g coal
/ kWh
45%
743g CO2
/ kWh
320g coal
/ kWh
App. 50%
669g CO2
/ kWh
288g coal
/ kWh
Efficiency
CO2 Emissions
Fuel Consumption
5.2 The Competition from Evolution of Fossil Fuel Power Plants
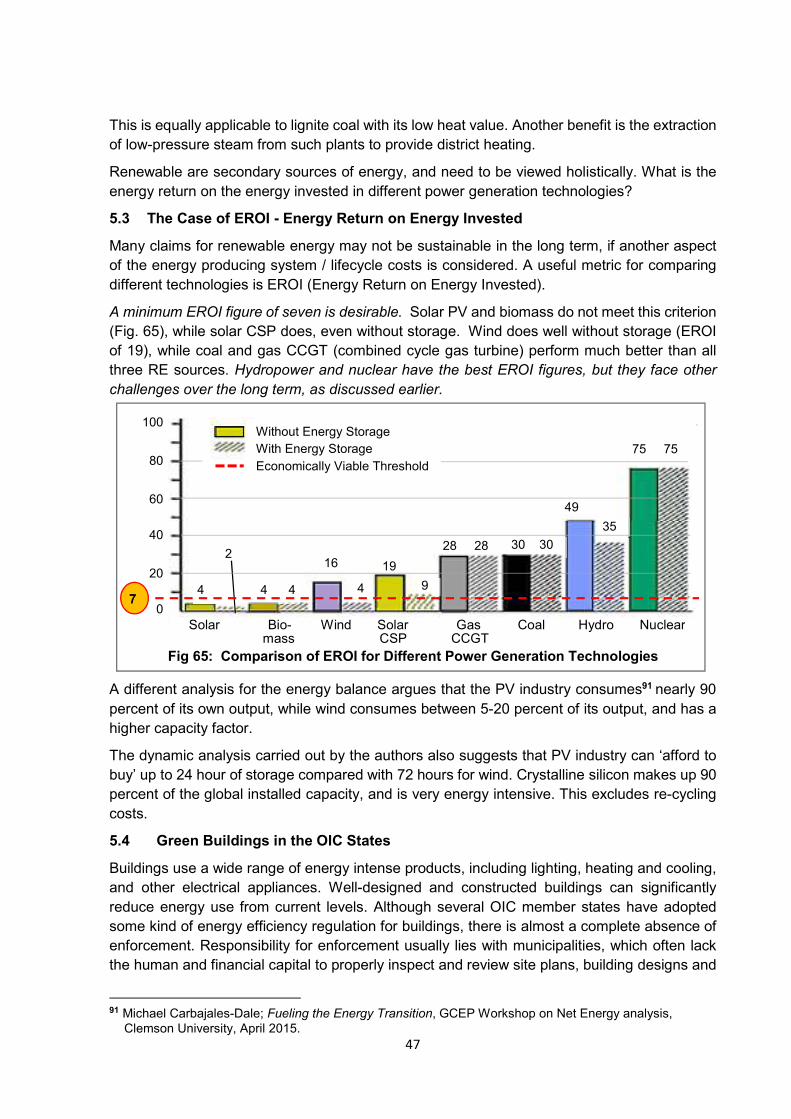
47
This is equally applicable to lignite coal with its low heat value. Another benefit is the extraction
of low-pressure steam from such plants to provide district heating.
Renewable are secondary sources of energy, and need to be viewed holistically. What is the
energy return on the energy invested in different power generation technologies?
Many claims for renewable energy may not be sustainable in the long term, if another aspect
of the energy producing system / lifecycle costs is considered. A useful metric for comparing
different technologies is EROI (Energy Return on Energy Invested).
A minimum EROI figure of seven is desirable. Solar PV and biomass do not meet this criterion
(Fig. 65), while solar CSP does, even without storage. Wind does well without storage (EROI
of 19), while coal and gas CCGT (combined cycle gas turbine) perform much better than all
three RE sources. Hydropower and nuclear have the best EROI figures, but they face other
challenges over the long term, as discussed earlier.
A different analysis for the energy balance argues that the PV industry consumes91 nearly 90
percent of its own output, while wind consumes between 5-20 percent of its output, and has a
higher capacity factor.
The dynamic analysis carried out by the authors also suggests that PV industry can ‘afford to
buy’ up to 24 hour of storage compared with 72 hours for wind. Crystalline silicon makes up 90
percent of the global installed capacity, and is very energy intensive. This excludes re-cycling
costs.
Buildings use a wide range of energy intense products, including lighting, heating and cooling,
and other electrical appliances. Well-designed and constructed buildings can significantly
reduce energy use from current levels. Although several OIC member states have adopted
some kind of energy efficiency regulation for buildings, there is almost a complete absence of
enforcement. Responsibility for enforcement usually lies with municipalities, which often lack
the human and financial capital to properly inspect and review site plans, building designs and
91 Michael Carbajales-Dale; Fueling the Energy Transition, GCEP Workshop on Net Energy analysis,
Clemson University, April 2015.
Fig 65: Comparison of EROI for Different Power Generation Technologies
Solar Bio- Wind Solar Gas Coal Hydro Nuclear mass CSP CCGT
100
80
60
40
20
0 7
49
35
30 30 28 28
19
9 4
16
4 4 4
2
75 75
Without Energy Storage
With Energy Storage
Economically Viable Threshold
5.3 The Case of EROI - Energy Return on Energy Invested
5.4 Green Buildings in the OIC States
48
construction sites. Design, construction and renovation according to energy efficiency
specifications requires better skills and expertise in the building sector, which is currently still
lacking in most OIC countries.
Some efforts are being made in this direction through demonstration and pilot projects, but
these are insufficient, and more efforts are needed to develop compliance tools and
strengthening the implementation capacity.
Compared to the number of new constructions every year, the number of new energy efficient
buildings is negligible. Leadership in Energy and Environmental Design (LEED) certified
buildings go beyond energy efficiency, and take into account all other environmental aspects
of a building such as waste, materials used, water consumption, and health impacts.
The building sector in the OIC countries continues to expand, because of rapid urbanization
and growing populations; it therefore represents an important opportunity for the construction
industry, by leveraging the entire supply chain from materials to construction.
Energy efficiency was not visible in the OIC member countries in the past. Its importance is
now recognised, and is being actively embraced in the MENA region. Qatar and UAE have
adopted new energy efficiency standards and made it mandatory for every new building to be
energy efficient and to have roof top solar PV systems installed, while existing buildings will be
retrofitted to meet these standards. Some countries have started to invest in efficient transport
systems as well.
In 2012, the Gulf Organisation for Research and Development Introduced the GSAS (Global
Sustainability Assessment System) which is the first green building standard adopted for Middle
Eastern conditions with the aim to create a built environment where ecological impact is
minimised. The GSAS rating covers a range of elements of the building sector that generates
impacts on the environment, including energy use, water consumption, and urban connectivity.
Qatar stands out among the Member States in adopting an excellent regulatory framework for
promoting energy efficiency buildings. A growing number of other OIC countries have set
energy efficiency targets, by adopting new policies, and updating existing ones for increased
energy efficiency across all sectors.
Contributions from the scientific community and financial sector has also come forward.
Seventy major financial institutions from more than 20 countries have committed to increase
financing for energy efficiency projects and investments, and several developed countries have
announced new financial incentives to channel additional funding towards energy efficiency
measures.
In Abu Dhabi, the Sheikh Zayed Desert Learning Centre in Al Ain was inaugurated in
2016 as an exercise in sustainable buildings. The centre’s special design resulted in
reducing solar heat absorption by 70 per cent, with a further 50 per cent saving in energy and
water usage. The structure uses 92 per cent recycled and reused construction waste material.
In Sub-Saharan Africa, Benin has emerged as a leader in the building sector, identifying a
potential for 35% reduction in energy use in public buildings. Both Ivory Coast and Senegal
have established domestic programmes for building efficiency. Pakistan is working with World
Green Building Council to develop new policies and update existing ones for green building
codes for future constructions. Investment in building efficiency upgrades needs to be
conducted before installing solar array in order to reduce electricity consumption for a
marginal increase in cost.
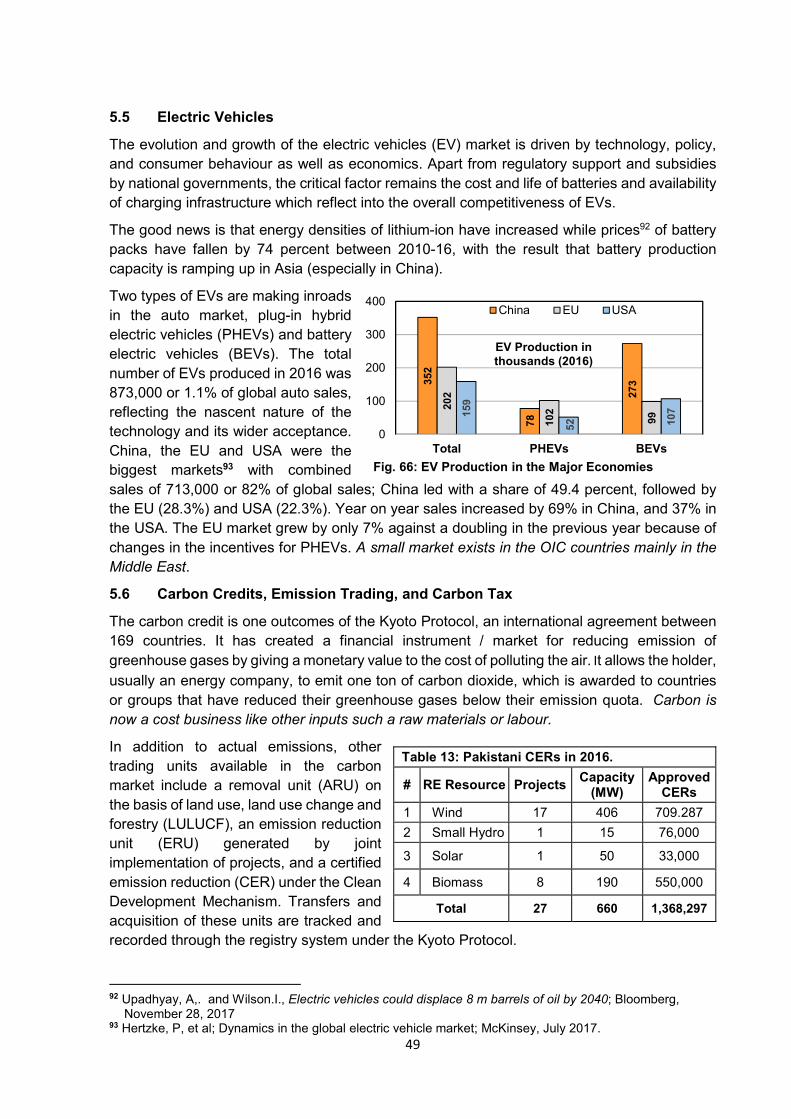
49
The evolution and growth of the electric vehicles (EV) market is driven by technology, policy,
and consumer behaviour as well as economics. Apart from regulatory support and subsidies
by national governments, the critical factor remains the cost and life of batteries and availability
of charging infrastructure which reflect into the overall competitiveness of EVs.
The good news is that energy densities of lithium-ion have increased while prices92 of battery
packs have fallen by 74 percent between 2010-16, with the result that battery production
capacity is ramping up in Asia (especially in China).
Two types of EVs are making inroads
in the auto market, plug-in hybrid
electric vehicles (PHEVs) and battery
electric vehicles (BEVs). The total
number of EVs produced in 2016 was
873,000 or 1.1% of global auto sales,
reflecting the nascent nature of the
technology and its wider acceptance.
China, the EU and USA were the
biggest markets93 with combined
sales of 713,000 or 82% of global sales; China led with a share of 49.4 percent, followed by
the EU (28.3%) and USA (22.3%). Year on year sales increased by 69% in China, and 37% in
the USA. The EU market grew by only 7% against a doubling in the previous year because of
changes in the incentives for PHEVs. A small market exists in the OIC countries mainly in the
Middle East.
The carbon credit is one outcomes of the Kyoto Protocol, an international agreement between
169 countries. It has created a financial instrument / market for reducing emission of
greenhouse gases by giving a monetary value to the cost of polluting the air. It allows the holder,
usually an energy company, to emit one ton of carbon dioxide, which is awarded to countries
or groups that have reduced their greenhouse gases below their emission quota. Carbon is
now a cost business like other inputs such a raw materials or labour.
In addition to actual emissions, other
trading units available in the carbon
market include a removal unit (ARU) on
the basis of land use, land use change and
forestry (LULUCF), an emission reduction
unit (ERU) generated by joint
implementation of projects, and a certified
emission reduction (CER) under the Clean
Development Mechanism. Transfers and
acquisition of these units are tracked and
recorded through the registry system under the Kyoto Protocol.
92 Upadhyay, A,. and Wilson.I., Electric vehicles could displace 8 m barrels of oil by 2040; Bloomberg,
November 28, 2017 93 Hertzke, P, et al; Dynamics in the global electric vehicle market; McKinsey, July 2017.
Table 13: Pakistani CERs in 2016.
# RE Resource Projects Capacity
(MW) Approved
CERs
1 Wind 17 406 709.287
2 Small Hydro 1 15 76,000
3 Solar 1 50 33,000
4 Biomass 8 190 550,000
Total 27 660 1,368,297
352
78
273
202
102
991
59
52 107
0
100
200
300
400
Total PHEVs BEVs
China EU USA
Fig. 66: EV Production in the Major Economies
EV Production in
thousands (2016)
5.5 Electric Vehicles
5.6 Carbon Credits, Emission Trading, and Carbon Tax
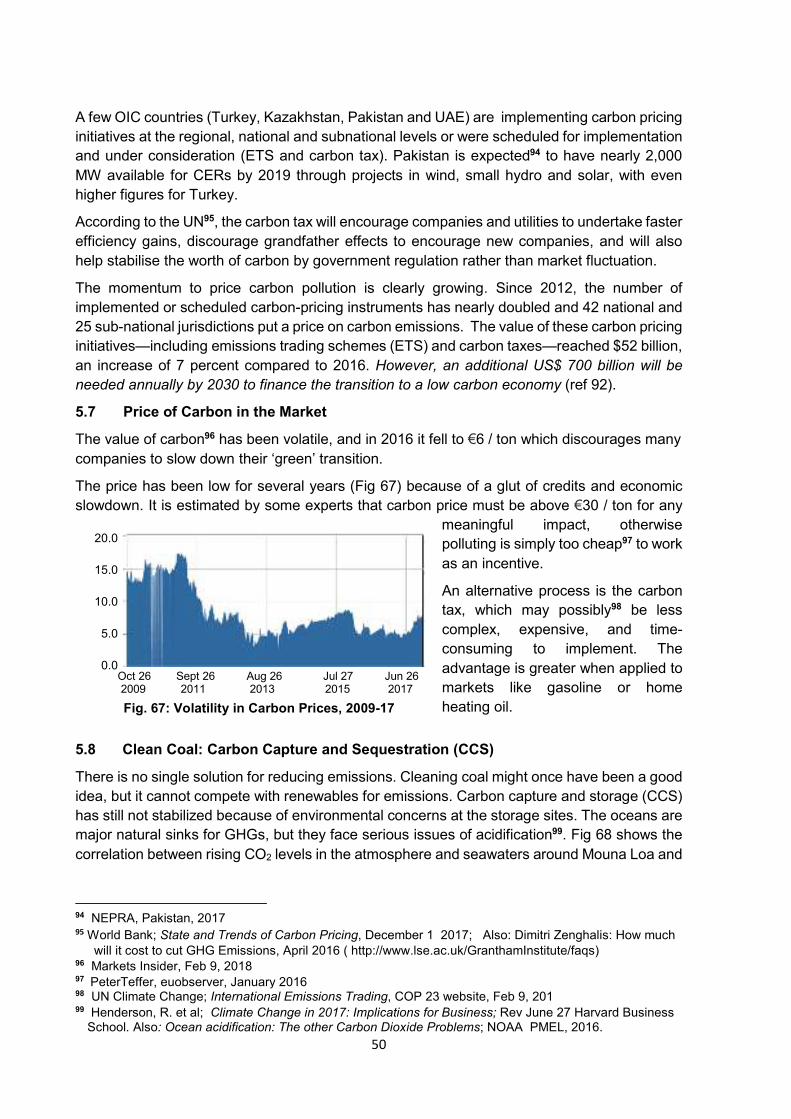
50
A few OIC countries (Turkey, Kazakhstan, Pakistan and UAE) are implementing carbon pricing
initiatives at the regional, national and subnational levels or were scheduled for implementation
and under consideration (ETS and carbon tax). Pakistan is expected94 to have nearly 2,000
MW available for CERs by 2019 through projects in wind, small hydro and solar, with even
higher figures for Turkey.
According to the UN95, the carbon tax will encourage companies and utilities to undertake faster
efficiency gains, discourage grandfather effects to encourage new companies, and will also
help stabilise the worth of carbon by government regulation rather than market fluctuation.
The momentum to price carbon pollution is clearly growing. Since 2012, the number of
implemented or scheduled carbon-pricing instruments has nearly doubled and 42 national and
25 sub-national jurisdictions put a price on carbon emissions. The value of these carbon pricing
initiatives—including emissions trading schemes (ETS) and carbon taxes—reached $52 billion,
an increase of 7 percent compared to 2016. However, an additional US$ 700 billion will be
needed annually by 2030 to finance the transition to a low carbon economy (ref 92).
The value of carbon96 has been volatile, and in 2016 it fell to €6 / ton which discourages many
companies to slow down their ‘green’ transition.
The price has been low for several years (Fig 67) because of a glut of credits and economic
slowdown. It is estimated by some experts that carbon price must be above €30 / ton for any
meaningful impact, otherwise polluting is simply too cheap97 to work
as an incentive.
An alternative process is the carbon
tax, which may possibly98 be less
complex, expensive, and time-
consuming to implement. The
advantage is greater when applied to
markets like gasoline or home
heating oil.
There is no single solution for reducing emissions. Cleaning coal might once have been a good
idea, but it cannot compete with renewables for emissions. Carbon capture and storage (CCS)
has still not stabilized because of environmental concerns at the storage sites. The oceans are
major natural sinks for GHGs, but they face serious issues of acidification99. Fig 68 shows the
correlation between rising CO2 levels in the atmosphere and seawaters around Mouna Loa and
94 NEPRA, Pakistan, 2017 95 World Bank; State and Trends of Carbon Pricing, December 1 2017; Also: Dimitri Zenghalis: How much
will it cost to cut GHG Emissions, April 2016 ( http://www.lse.ac.uk/GranthamInstitute/faqs) 96 Markets Insider, Feb 9, 2018 97 PeterTeffer, euobserver, January 2016 98 UN Climate Change; International Emissions Trading, COP 23 website, Feb 9, 201 99 Henderson, R. et al; Climate Change in 2017: Implications for Business; Rev June 27 Harvard Business
School. Also: Ocean acidification: The other Carbon Dioxide Problems; NOAA PMEL, 2016.
20.0
15.0
10.0
5.0
0.0 Oct 26 Sept 26 Aug 26 Jul 27 Jun 26 2009 2011 2013 2015 2017
Fig. 67: Volatility in Carbon Prices, 2009-17
5.7 Price of Carbon in the Market
5.8 Clean Coal: Carbon Capture and Sequestration (CCS)
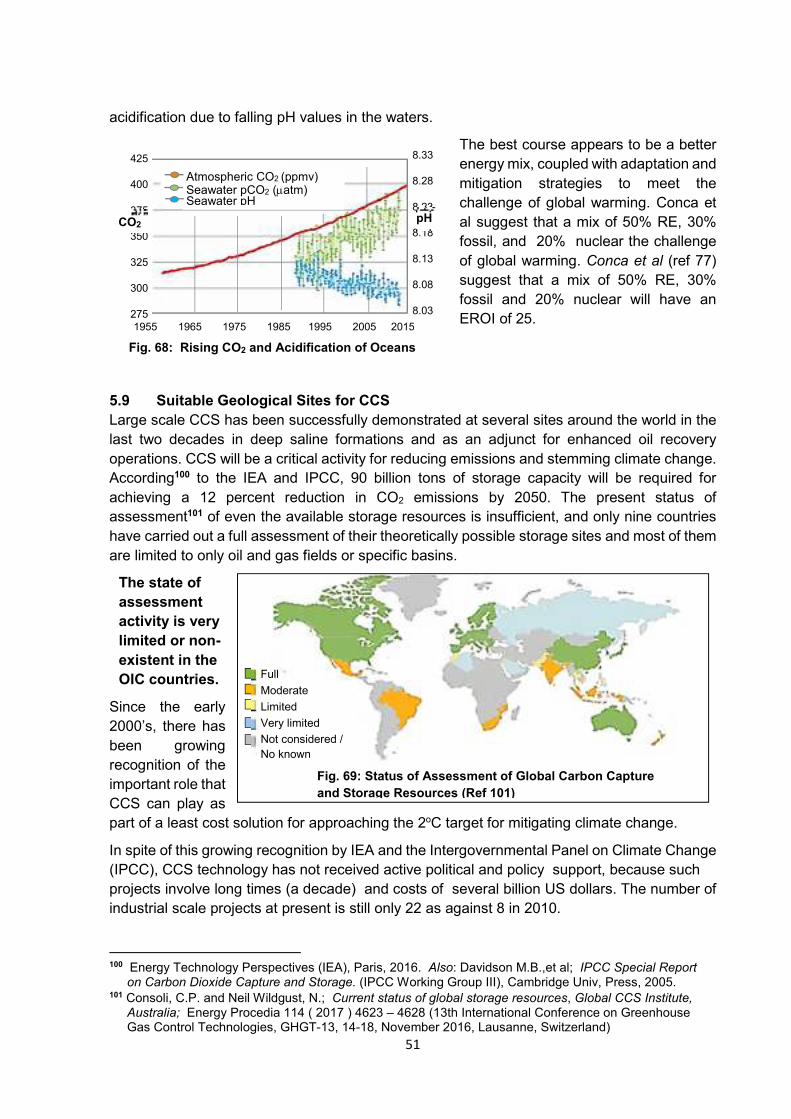
51
acidification due to falling pH values in the waters.
The best course appears to be a better
energy mix, coupled with adaptation and
mitigation strategies to meet the
challenge of global warming. Conca et
al suggest that a mix of 50% RE, 30%
fossil, and 20% nuclear the challenge
of global warming. Conca et al (ref 77)
suggest that a mix of 50% RE, 30%
fossil and 20% nuclear will have an
EROI of 25.
The state of
assessment
activity is very
limited or non-
existent in the
OIC countries.
Since the early
2000’s, there has
been growing
recognition of the
important role that
CCS can play as
part of a least cost solution for approaching the 2oC target for mitigating climate change.
In spite of this growing recognition by IEA and the Intergovernmental Panel on Climate Change
(IPCC), CCS technology has not received active political and policy support, because such
projects involve long times (a decade) and costs of several billion US dollars. The number of
industrial scale projects at present is still only 22 as against 8 in 2010.
100 Energy Technology Perspectives (IEA), Paris, 2016. Also: Davidson M.B.,et al; IPCC Special Report
on Carbon Dioxide Capture and Storage. (IPCC Working Group III), Cambridge Univ, Press, 2005. 101 Consoli, C.P. and Neil Wildgust, N.; Current status of global storage resources, Global CCS Institute,
Australia; Energy Procedia 114 ( 2017 ) 4623 – 4628 (13th International Conference on Greenhouse Gas Control Technologies, GHGT-13, 14-18, November 2016, Lausanne, Switzerland)
Full
Moderate
Limited
Very limited
Not considered /
No known
Fig. 69: Status of Assessment of Global Carbon Capture
and Storage Resources (Ref 101)
Atmospheric CO2 (ppmv) Seawater pCO2 (atm) Seawater pH
1955 1965 1975 1985 1995 2005 2015
8.33
8.28
8.23
8.18
8.13
8.08
8.03
425
400
375
350
325
300
275
CO2 pH
Fig. 68: Rising CO2 and Acidification of Oceans
5.9 Suitable Geological Sites for CCS
Large scale CCS has been successfully demonstrated at several sites around the world in the
last two decades in deep saline formations and as an adjunct for enhanced oil recovery
operations. CCS will be a critical activity for reducing emissions and stemming climate change.
According100 to the IEA and IPCC, 90 billion tons of storage capacity will be required for
achieving a 12 percent reduction in CO2 emissions by 2050. The present status of
assessment101 of even the available storage resources is insufficient, and only nine countries
have carried out a full assessment of their theoretically possible storage sites and most of them
are limited to only oil and gas fields or specific basins.
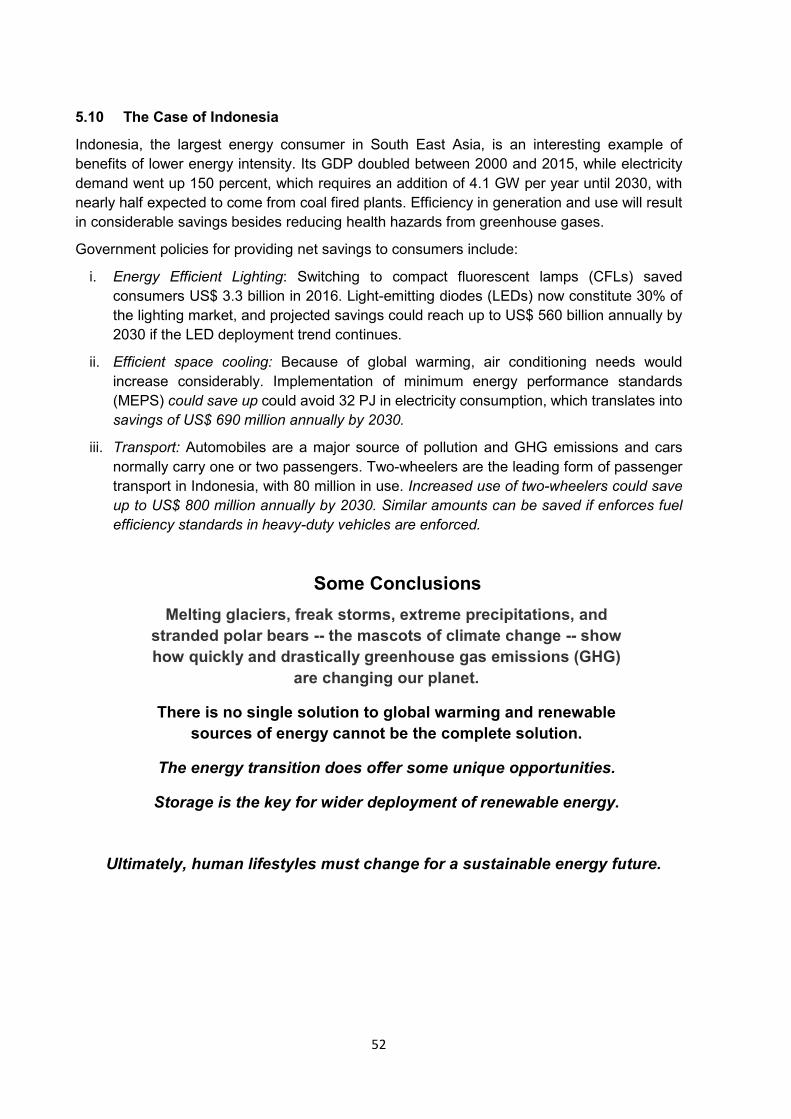
52
Indonesia, the largest energy consumer in South East Asia, is an interesting example of
benefits of lower energy intensity. Its GDP doubled between 2000 and 2015, while electricity
demand went up 150 percent, which requires an addition of 4.1 GW per year until 2030, with
nearly half expected to come from coal fired plants. Efficiency in generation and use will result
in considerable savings besides reducing health hazards from greenhouse gases.
Government policies for providing net savings to consumers include:
i. Energy Efficient Lighting: Switching to compact fluorescent lamps (CFLs) saved
consumers US$ 3.3 billion in 2016. Light-emitting diodes (LEDs) now constitute 30% of
the lighting market, and projected savings could reach up to US$ 560 billion annually by
2030 if the LED deployment trend continues.
ii. Efficient space cooling: Because of global warming, air conditioning needs would
increase considerably. Implementation of minimum energy performance standards
(MEPS) could save up could avoid 32 PJ in electricity consumption, which translates into
savings of US$ 690 million annually by 2030.
iii. Transport: Automobiles are a major source of pollution and GHG emissions and cars
normally carry one or two passengers. Two-wheelers are the leading form of passenger
transport in Indonesia, with 80 million in use. Increased use of two-wheelers could save
up to US$ 800 million annually by 2030. Similar amounts can be saved if enforces fuel
efficiency standards in heavy-duty vehicles are enforced.
Some Conclusions
Melting glaciers, freak storms, extreme precipitations, and
stranded polar bears -- the mascots of climate change -- show
how quickly and drastically greenhouse gas emissions (GHG)
are changing our planet.
There is no single solution to global warming and renewable
sources of energy cannot be the complete solution.
The energy transition does offer some unique opportunities.
Storage is the key for wider deployment of renewable energy.
Ultimately, human lifestyles must change for a sustainable energy future.
5.10 The Case of Indonesia
53
ENERGY
In 2016, global investment in new renewable power was twice as much as that in coal and
natural gas power plants, which is a continuation of the trend of the last five years. Total global
investments102 made in the renewable energy sector was about USD 243 billion, in which the
share of developed countries, China, and other developing countries was 125 billion, 38 billion
and 80 billion respectively.
Bloomberg estimates that renewable energy sources will “represent almost three quarters of
the US$10.2 trillion the world will invest in new power generating technologies until 2040,
thanks to rapidly falling costs for solar and wind power, and a growing role for batteries,
including electric vehicles in balancing supply and demand”.
New investments have focussed largely on-shore wind and solar power plants. Solar power
saw the largest investment in terms of money committed during 2016, which was nearly US$
114 billion followed by wind power with USD 112 billion of investment. Investment in biomass
and waste-to-energy was only USD 6 billion, with US$ 3.9 billion in small-scale hydropower,
bio-fuels with USD 3.1 billion, geothermal energy with US$ 2 billion, and ocean energy with
US$ 0.2 billion.
The sector of bio-fuels has shown some future prospects for reducing fossil fuel consumption.
Aviation bio-fuels took strong strides forward in 2016, and 22 airlines based in Europe, North
America and Asia had performed more than 2,000 commercial passenger flights with blends of
up to 50% bio-jet fuel made from used cooking oil, jatropha, camelina, algae and sugar cane.
Investment dropped during 2016, because of slowdown in investments in Japan, China and
some other emerging countries, but mainly because of significant cost reductions in solar PV
and in onshore and offshore wind power, which improved their cost-competitiveness. This
enabled investors to acquire more renewable energy capacity for less money.
Cost of RE sources have declined sharply in recent years because of technology
improvements, higher inventories and auctions in recent years coupled with national incentives.
Different analysis give different projections reflecting the extreme volatility in the field. BNEF
projected a share of over 50% for RE by 2030 compared with 36.5% by IEE (Japan) in their
reports of 2016 (Section1, Figures 2, 3).
A useful metric for evaluating cost competitiveness is LCOE (Levelized Cost of Energy in
US$/MWh), which includes cost of capital, fuel, fixed and variable O&M and transmission.
Extensive studies by IRENA, EIA and others such as BNEF and LAZARD103 show that onshore
wind and geothermal are already becoming competitive with fossil fuels (Fig 70). While RE
capacity factors have improved, they remain much lower than fossil fuels, nuclear or
geothermal which are in the range of 85-91 percent. Battery capacity and life impose further
limits on deployment. Carbon capture and storage (CCS) increases the LCOE by about 30%
for fossil fuels, apart from grid connectivity issues of RE for utility scale projects.
102 REN 2017 103 LAZARD: Levelized Cost of Energy Analysis, November 2017 (version 11.0)
SECTION 6: INVESTMENT AND MARKET TRENDS IN RENEWABLE
6.1 Cost Competitiveness of RE Technologies with Conventional Sources
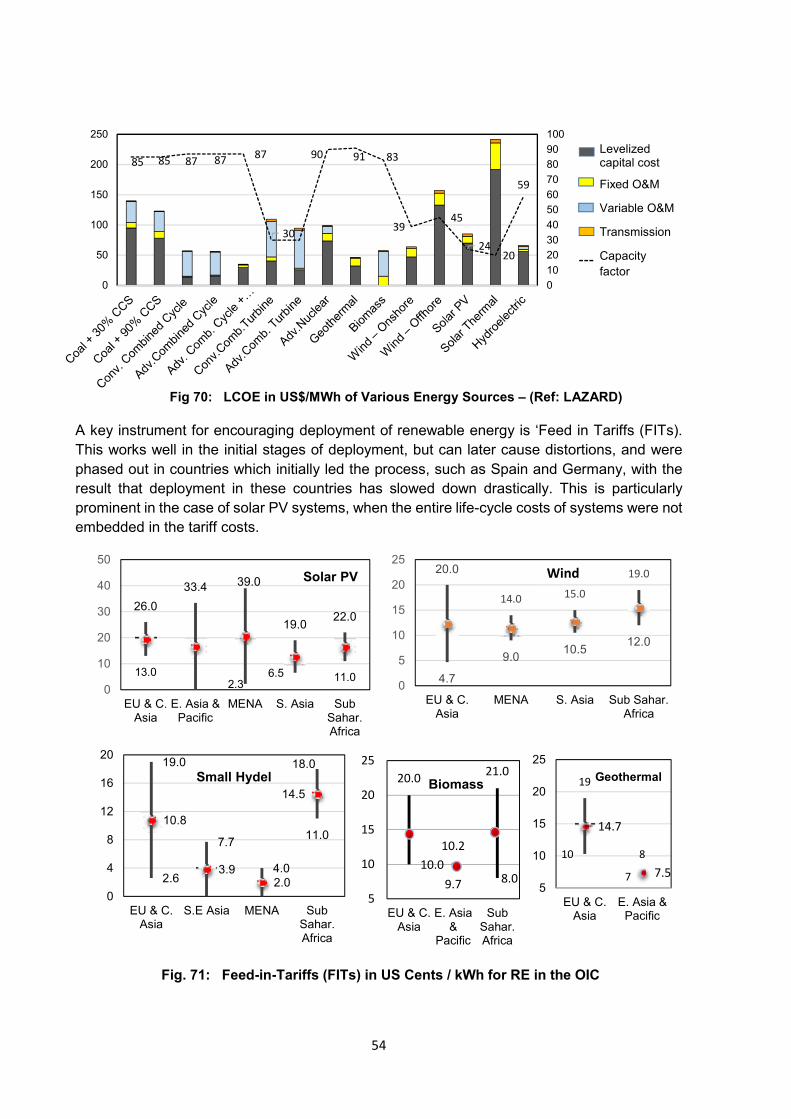
54
A key instrument for encouraging deployment of renewable energy is ‘Feed in Tariffs (FITs).
This works well in the initial stages of deployment, but can later cause distortions, and were
phased out in countries which initially led the process, such as Spain and Germany, with the
result that deployment in these countries has slowed down drastically. This is particularly
prominent in the case of solar PV systems, when the entire life-cycle costs of systems were not
embedded in the tariff costs.
Fig. 71: Feed-in-Tariffs (FITs) in US Cents / kWh for RE in the OIC Regions
19.0
7.7
4.0
18.0
2.6
11.010.8
3.92.0
14.5
0
4
8
12
16
20
EU & C.Asia
S.E Asia MENA SubSahar.Africa
Small Hydel19
810
7
14.7
7.5
5
10
15
20
25
EU & C.Asia
E. Asia &Pacific
Geothermal 20.0
10.2
21.0
10.0
9.78.0
5
10
15
20
25
EU & C.Asia
E. Asia&
Pacific
SubSahar.Africa
Biomass
26.0
33.4 39.0
19.022.0
13.02.3
6.5 11.00
10
20
30
40
50
EU & C.Asia
E. Asia &Pacific
MENA S. Asia SubSahar.Africa
Solar PV20.0
14.015.0
19.0
4.7
9.010.5
12.0
0
5
10
15
20
25
EU & C.Asia
MENA S. Asia Sub Sahar.Africa
Wind
85 85 87 8787
30
90 91 83
3945
2420
59
0
10
20
30
40
50
60
70
80
90
100
0
50
100
150
200
250
Levelized capital cost
Fixed O&M
Variable O&M
Transmission
Capacity
factor
Fig 70: LCOE in US$/MWh of Various Energy Sources – (Ref: LAZARD)
(LAZARD)
55
Strong policy frameworks, regulations and financing support are the driving factors of the
market. Policies that support DRE deployment include electrification targets, auctions,
initiatives for clean cooking technologies and fiscal incentives e.g. exemptions on VAT and
import duties. Bangladesh has declared its intention to install up to 6 million SHS by 2018 and
plans to finance the installation of about 1,550 solar irrigation pumps by the end of 2017.
Guyana announced plans to install 6,000 SHS (Solar Home Systems) in its rural communities.
Pakistan announced 30 thousand solar pumps for farmers, solar electrification of 5 thousand
schools and 5,800 homes in remote areas. Federal Banks in few states like Pakistan and Egypt
have announced flexible loans as low as 6% interest rate for 15 years for small, medium and
MW scale solar projects.
Innovative business models are developed and deployed in many countries worldwide, and it
is receiving increased recognition in developing countries also. The use of mobile payment
systems has become very popular, especially as energy companies and telcos came up with
such solutions, such as Mobisol. The market for Pay As You Go (PAYG) solar has grown a lot
in recent years.
The PAYG model had been commercialised by some 32 companies operating in nearly 30
countries worldwide, out of which 8 of them are OIC member countries (Uganda, Sierra Leone,
Sudan, Burkina Faso, Ivory Coast, Nigeria, Mauritania, Comoros). Power Africa initiative
through the US Overseas Private Investment Corporation (OPIC) has agreed to provide flexible
loans in Nigeria to power 90,000 households through solar energy.
Apart from technical and financial aspects of renewable energy sector, the social impact of
green transition needs to be taken in account. According to estimates, direct and indirect jobs
in renewable energy accounted for 9.8 million jobs in 2016.
Globally Bangladesh stands at sixth position in job creation in the renewable energy sector and
remained the leader in OIC member states creating 162 thousand jobs in 2016 alone. Almost
90% (140 thousand) of the jobs created in Bangladesh were in the Solar PV sector alone due
to their solar home system initiative. Other countries like Turkey, Morocco, Egypt and Malaysia
have also been in the forefront towards job creation in renewable energy sector.
While the RE sector is booming, it is facing a serious shortage of skills and talent. A recent
survey104 by the Global Energy Talent Index showed four out of five hiring managers believe
that a skills shortage is now hitting the renewables industry and blame lack of planning, as
compared with the oil and gas sector where only a third were worried about their sector. Since
several thousand jobs have been lost in the oil and gas sector, there is opportunity for
transferring their skill to the renewables sector. The challenge is to retain the work force after
the RE system is installed.
It is worth repeating that fossil fuels are not going anywhere soon
104 Grace Kimberly; “The Renewables Sector needs the Staffing Industry …” ; Energy Jobline, May 23,
2017
6.2 DRE Financing Schemes, Business Models & Policy Framework
6.3 Social Inclusion and Jobs in the Renewable Energy Sector
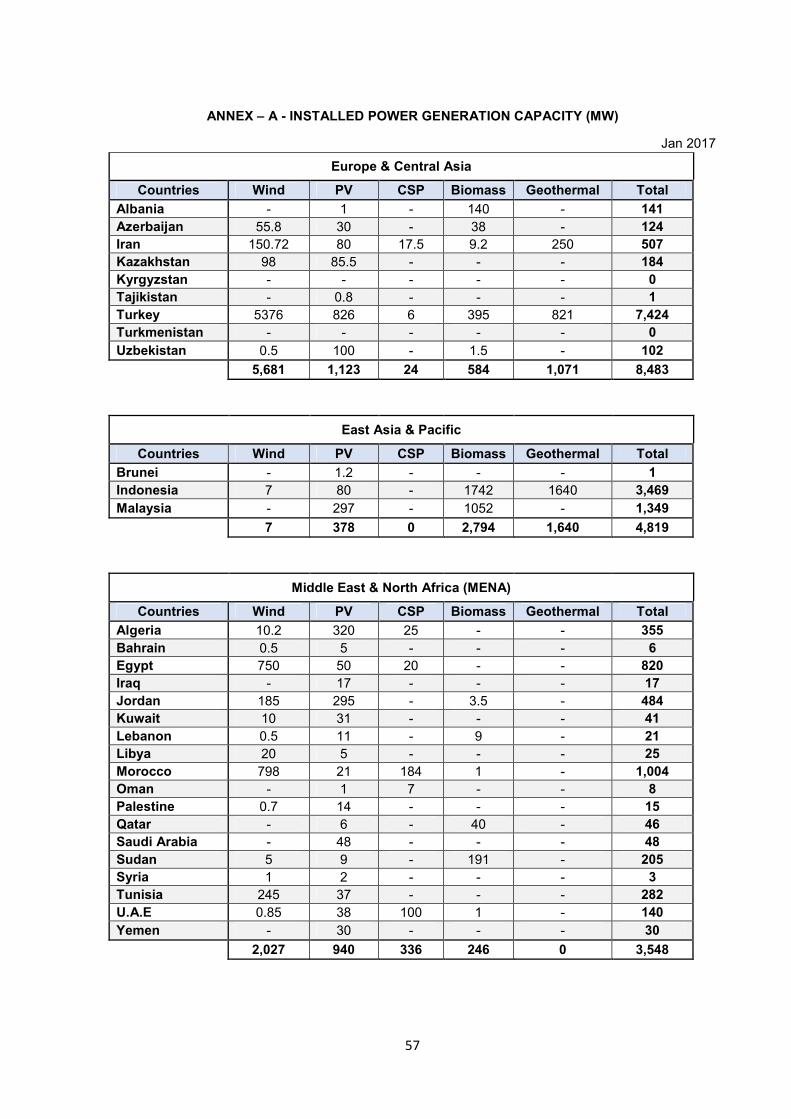
57
Jan 2017
Europe & Central Asia
Countries Wind PV CSP Biomass Geothermal Total
Albania - 1 - 140 - 141
Azerbaijan 55.8 30 - 38 - 124
Iran 150.72 80 17.5 9.2 250 507
Kazakhstan 98 85.5 - - - 184
Kyrgyzstan - - - - - 0
Tajikistan - 0.8 - - - 1
Turkey 5376 826 6 395 821 7,424
Turkmenistan - - - - - 0
Uzbekistan 0.5 100 - 1.5 - 102
5,681 1,123 24 584 1,071 8,483
East Asia & Pacific
Countries Wind PV CSP Biomass Geothermal Total
Brunei - 1.2 - - - 1
Indonesia 7 80 - 1742 1640 3,469
Malaysia - 297 - 1052 - 1,349
7 378 0 2,794 1,640 4,819
Middle East & North Africa (MENA)
Countries Wind PV CSP Biomass Geothermal Total
Algeria 10.2 320 25 - - 355
Bahrain 0.5 5 - - - 6
Egypt 750 50 20 - - 820
Iraq - 17 - - - 17
Jordan 185 295 - 3.5 - 484
Kuwait 10 31 - - - 41
Lebanon 0.5 11 - 9 - 21
Libya 20 5 - - - 25
Morocco 798 21 184 1 - 1,004
Oman - 1 7 - - 8
Palestine 0.7 14 - - - 15
Qatar - 6 - 40 - 46
Saudi Arabia - 48 - - - 48
Sudan 5 9 - 191 - 205
Syria 1 2 - - - 3
Tunisia 245 37 - - - 282
U.A.E 0.85 38 100 1 - 140
Yemen - 30 - - - 30
2,027 940 336 246 0 3,548
ANNEX – A - INSTALLED POWER GENERATION CAPACITY (MW)
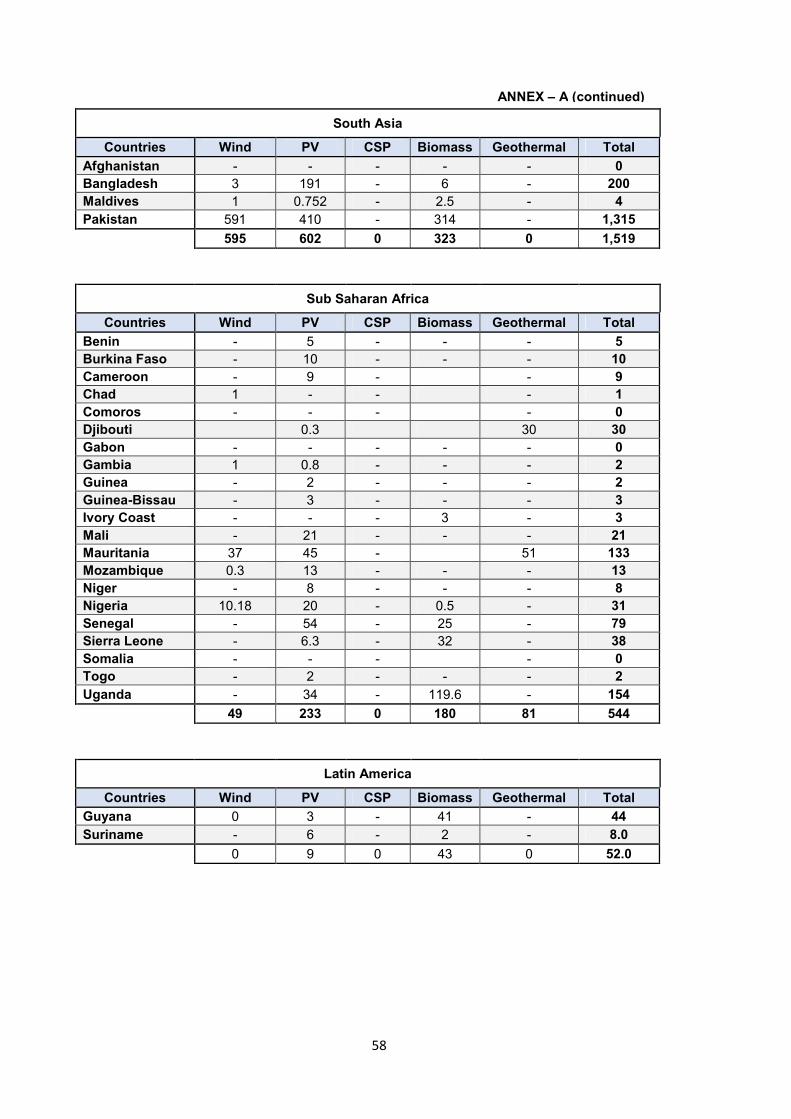
58
South Asia
Countries Wind PV CSP Biomass Geothermal Total
Afghanistan - - - - - 0
Bangladesh 3 191 - 6 - 200
Maldives 1 0.752 - 2.5 - 4
Pakistan 591 410 - 314 - 1,315
595 602 0 323 0 1,519
Sub Saharan Africa
Countries Wind PV CSP Biomass Geothermal Total
Benin - 5 - - - 5
Burkina Faso - 10 - - - 10
Cameroon - 9 - - 9
Chad 1 - - - 1
Comoros - - - - 0
Djibouti 0.3 30 30
Gabon - - - - - 0
Gambia 1 0.8 - - - 2
Guinea - 2 - - - 2
Guinea-Bissau - 3 - - - 3
Ivory Coast - - - 3 - 3
Mali - 21 - - - 21
Mauritania 37 45 - 51 133
Mozambique 0.3 13 - - - 13
Niger - 8 - - - 8
Nigeria 10.18 20 - 0.5 - 31
Senegal - 54 - 25 - 79
Sierra Leone - 6.3 - 32 - 38
Somalia - - - - 0
Togo - 2 - - - 2
Uganda - 34 - 119.6 - 154
49 233 0 180 81 544
Latin America
Countries Wind PV CSP Biomass Geothermal Total
Guyana 0 3 - 41 - 44
Suriname - 6 - 2 - 8.0
0 9 0 43 0 52.0
ANNEX – A (continued)

59
Europe & Central Asia
Countries Wind PV CSP Biomass Geothermal Total
Albania 650 - - - - 650
Azerbaijan 110 - - - - 110
Iran - - - 600 - 600
Kazakhstan - 75 - - - 75
Kyrgyzstan - - - - - 0
Tajikistan - - - - - 0
Turkey 750 - - - - 750
Turkmenistan - - - - - 0
Uzbekistan - 300 - - - 300
1,510 375 0 600 0 2,485
East Asia & Pacific
Countries Wind PV CSP Biomass Geothermal Total
Brunei - - - - - 0
Indonesia - - - - - 0
Malaysia - - - - - 0
0 0 0 0 0 0
Middle East & North Africa (MENA)
Countries Wind PV CSP Biomass Geothermal Total
Algeria - 30 - - 5 35
Bahrain - - - - - 0
Egypt 460 1650 150 - - 2,260
Iraq - - - - - 0
Jordan 117 55 - - - 172
Kuwait - - 60 - - 60
Lebanon - - - - - 0
Libya 60 14 - - - 74
Morocco 357 68 350 - - 775
Oman 50 - - - - 50
Palestine - - - - - 0
Qatar - - - - - 0
Saudi Arabia - 65 100 - - 165
Sudan 100 - - - - 100
Syria - - - - - 0
Tunisia - 10 50 - - 60
U.A.E - 1000 - - - 1,000
Yemen - - - - - 0
1,144 2,892 710 0 5 4,751
ANNEX – B - UNDER CONSTRUCTION RENEWABLE ENERGY PROJECTS (MW)
As of Jan 2017
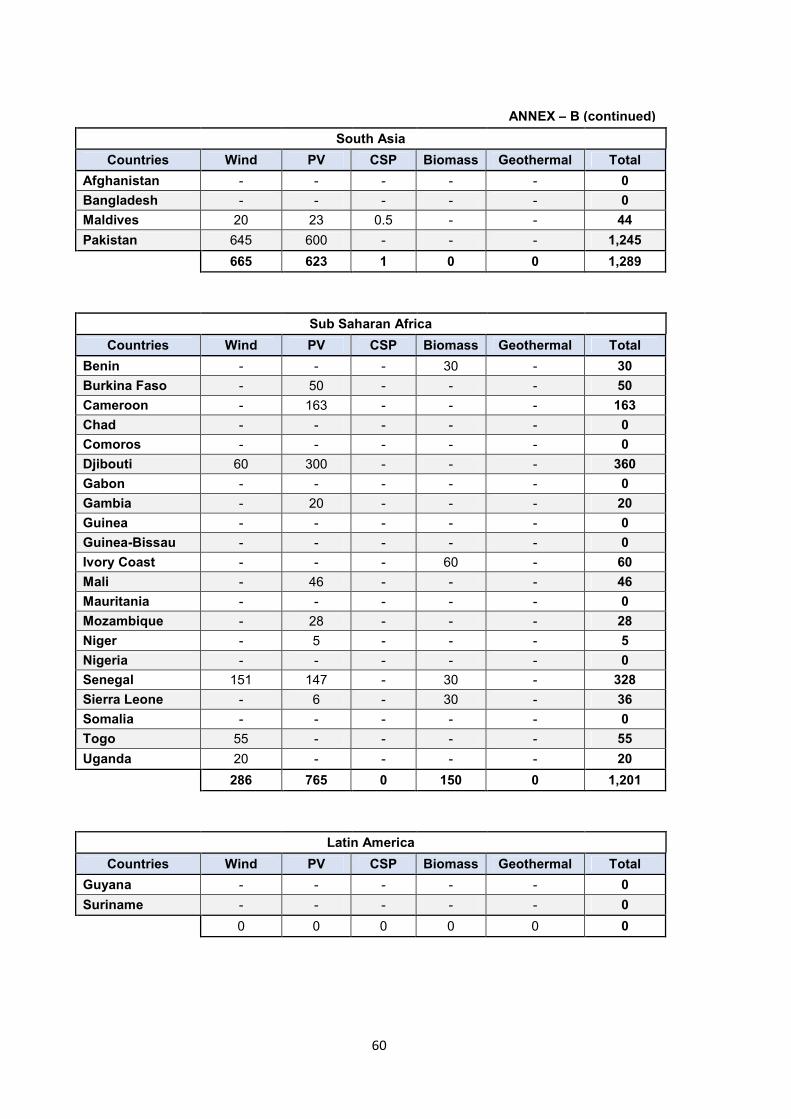
60
South Asia
Countries Wind PV CSP Biomass Geothermal Total
Afghanistan - - - - - 0
Bangladesh - - - - - 0
Maldives 20 23 0.5 - - 44
Pakistan 645 600 - - - 1,245
665 623 1 0 0 1,289
Sub Saharan Africa
Countries Wind PV CSP Biomass Geothermal Total
Benin - - - 30 - 30
Burkina Faso - 50 - - - 50
Cameroon - 163 - - - 163
Chad - - - - - 0
Comoros - - - - - 0
Djibouti 60 300 - - - 360
Gabon - - - - - 0
Gambia - 20 - - - 20
Guinea - - - - - 0
Guinea-Bissau - - - - - 0
Ivory Coast - - - 60 - 60
Mali - 46 - - - 46
Mauritania - - - - - 0
Mozambique - 28 - - - 28
Niger - 5 - - - 5
Nigeria - - - - - 0
Senegal 151 147 - 30 - 328
Sierra Leone - 6 - 30 - 36
Somalia - - - - - 0
Togo 55 - - - - 55
Uganda 20 - - - - 20
286 765 0 150 0 1,201
Latin America
Countries Wind PV CSP Biomass Geothermal Total
Guyana - - - - - 0
Suriname - - - - - 0
0 0 0 0 0 0
ANNEX – B (continued)
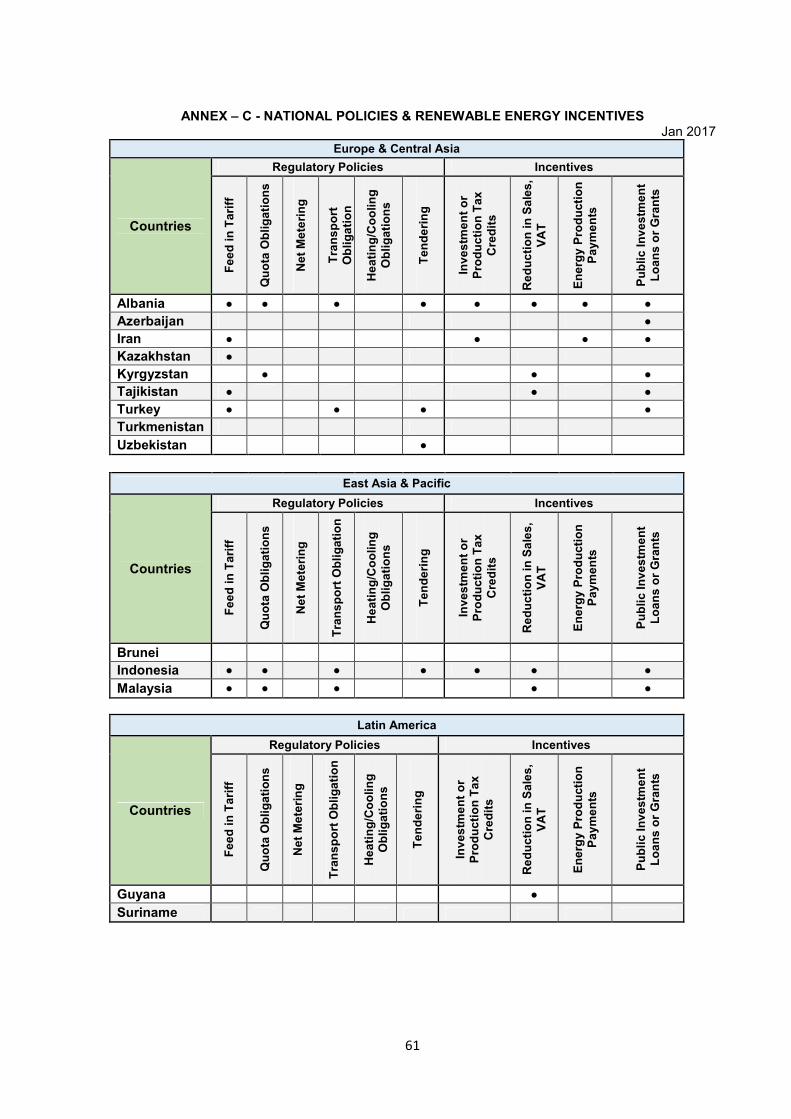
61
Europe & Central Asia
Countries
Regulatory Policies Incentives
Fe
ed
in
Ta
riff
Qu
ota
Ob
lig
ati
on
s
Ne
t M
ete
rin
g
Tra
ns
po
rt
Ob
lig
ati
on
He
ati
ng
/Co
olin
g
Ob
lig
ati
on
s
Te
nd
eri
ng
Inv
es
tme
nt
or
Pro
du
cti
on
Ta
x
Cre
dit
s
Re
du
cti
on
in
Sa
les
,
VA
T
En
erg
y P
rod
ucti
on
Pa
ym
en
ts
Pu
bli
c I
nv
es
tme
nt
Lo
an
s o
r G
ran
ts
Albania ● ● ● ● ● ● ● ●
Azerbaijan ●
Iran ● ● ● ●
Kazakhstan ●
Kyrgyzstan ● ● ●
Tajikistan ● ● ●
Turkey ● ● ● ●
Turkmenistan
Uzbekistan ●
East Asia & Pacific
Countries
Regulatory Policies Incentives
Fe
ed
in
Ta
riff
Qu
ota
Ob
lig
ati
on
s
Ne
t M
ete
rin
g
Tra
ns
po
rt O
bli
ga
tio
n
He
ati
ng
/Co
olin
g
Ob
lig
ati
on
s
Te
nd
eri
ng
Inv
es
tme
nt
or
Pro
du
cti
on
Ta
x
Cre
dit
s
Re
du
cti
on
in
Sa
les
,
VA
T
En
erg
y P
rod
ucti
on
Pa
ym
en
ts
Pu
bli
c I
nv
es
tme
nt
Lo
an
s o
r G
ran
ts
Brunei
Indonesia ● ● ● ● ● ● ●
Malaysia ● ● ● ● ●
Latin America
Countries
Regulatory Policies Incentives
Fe
ed
in
Ta
riff
Qu
ota
Ob
lig
ati
on
s
Ne
t M
ete
rin
g
Tra
ns
po
rt O
bli
ga
tio
n
He
ati
ng
/Co
olin
g
Ob
lig
ati
on
s
Te
nd
eri
ng
Inv
es
tme
nt
or
Pro
du
cti
on
Ta
x
Cre
dit
s
Re
du
cti
on
in
Sa
les
,
VA
T
En
erg
y P
rod
ucti
on
Pa
ym
en
ts
Pu
bli
c I
nv
es
tme
nt
Lo
an
s o
r G
ran
ts
Guyana ●
Suriname
ANNEX – C - NATIONAL POLICIES & RENEWABLE ENERGY INCENTIVES Jan 2017
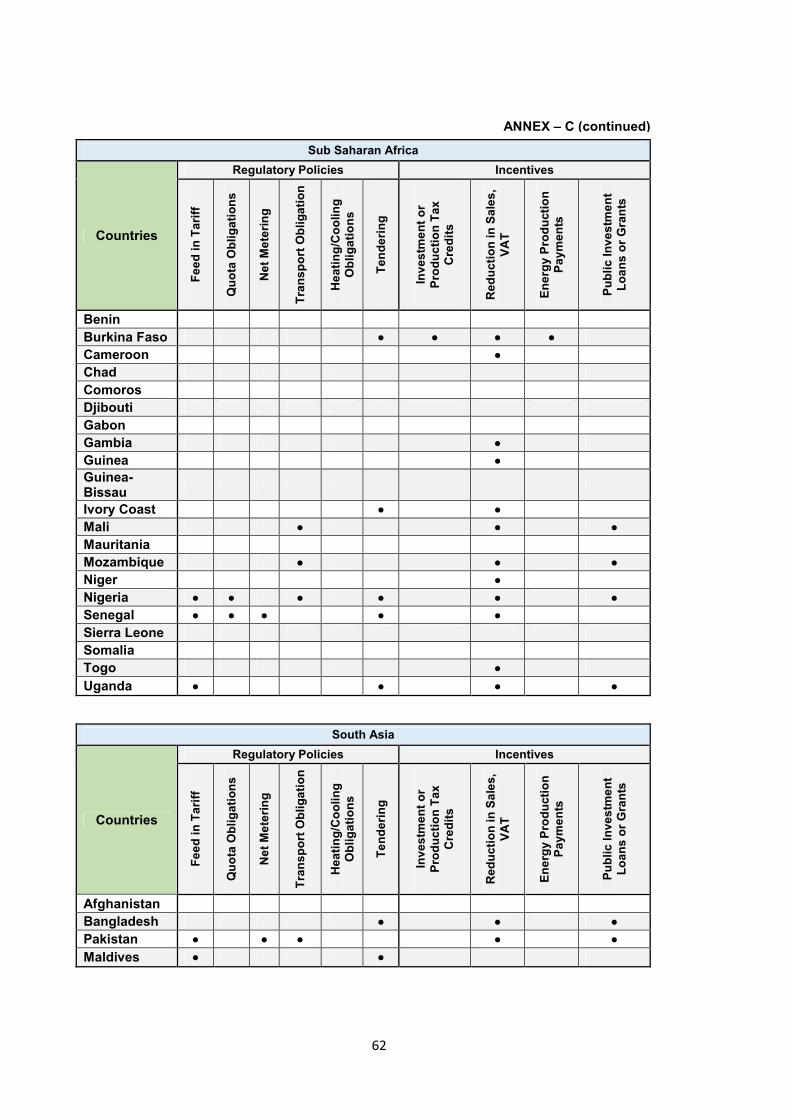
62
Sub Saharan Africa
Countries
Regulatory Policies Incentives
Fe
ed
in
Ta
riff
Qu
ota
Ob
lig
ati
on
s
Ne
t M
ete
rin
g
Tra
ns
po
rt O
bli
ga
tio
n
He
ati
ng
/Co
olin
g
Ob
lig
ati
on
s
Te
nd
eri
ng
Inv
es
tme
nt
or
Pro
du
cti
on
Ta
x
Cre
dit
s
Re
du
cti
on
in
Sa
les
,
VA
T
En
erg
y P
rod
ucti
on
Pa
ym
en
ts
Pu
bli
c I
nv
es
tme
nt
Lo
an
s o
r G
ran
ts
Benin
Burkina Faso ● ● ● ●
Cameroon ●
Chad
Comoros
Djibouti
Gabon
Gambia ●
Guinea ●
Guinea-Bissau
Ivory Coast ● ●
Mali ● ● ●
Mauritania
Mozambique ● ● ●
Niger ●
Nigeria ● ● ● ● ● ●
Senegal ● ● ● ● ●
Sierra Leone
Somalia
Togo ●
Uganda ● ● ● ●
South Asia
Countries
Regulatory Policies Incentives
Fe
ed
in
Ta
riff
Qu
ota
Ob
lig
ati
on
s
Ne
t M
ete
rin
g
Tra
ns
po
rt O
bli
ga
tio
n
He
ati
ng
/Co
olin
g
Ob
lig
ati
on
s
Te
nd
eri
ng
Inv
es
tme
nt
or
Pro
du
cti
on
Ta
x
Cre
dit
s
Re
du
cti
on
in
Sa
les
,
VA
T
En
erg
y P
rod
ucti
on
Pa
ym
en
ts
Pu
bli
c I
nv
es
tme
nt
Lo
an
s o
r G
ran
ts
Afghanistan
Bangladesh ● ● ●
Pakistan ● ● ● ● ●
Maldives ● ●
ANNEX – C (continued)
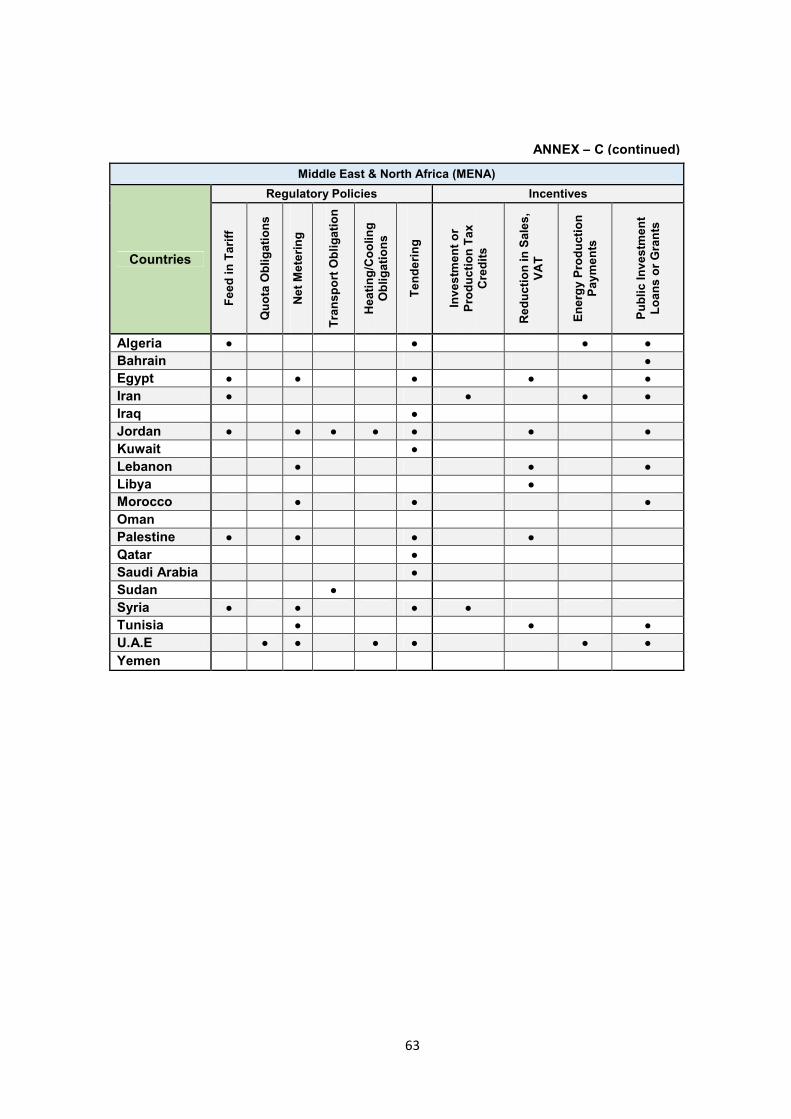
63
Middle East & North Africa (MENA)
Countries
Regulatory Policies Incentives
Fe
ed
in
Ta
riff
Qu
ota
Ob
lig
ati
on
s
Ne
t M
ete
rin
g
Tra
ns
po
rt O
bli
ga
tio
n
He
ati
ng
/Co
olin
g
Ob
lig
ati
on
s
Te
nd
eri
ng
Inv
es
tme
nt
or
Pro
du
cti
on
Ta
x
Cre
dit
s
Re
du
cti
on
in
Sa
les
,
VA
T
En
erg
y P
rod
ucti
on
Pa
ym
en
ts
Pu
bli
c I
nv
es
tme
nt
Lo
an
s o
r G
ran
ts
Algeria ● ● ● ●
Bahrain ●
Egypt ● ● ● ● ●
Iran ● ● ● ●
Iraq ●
Jordan ● ● ● ● ● ● ●
Kuwait ●
Lebanon ● ● ●
Libya ●
Morocco ● ● ●
Oman
Palestine ● ● ● ●
Qatar ●
Saudi Arabia ●
Sudan ●
Syria ● ● ● ●
Tunisia ● ● ●
U.A.E ● ● ● ● ● ●
Yemen
ANNEX – C (continued)
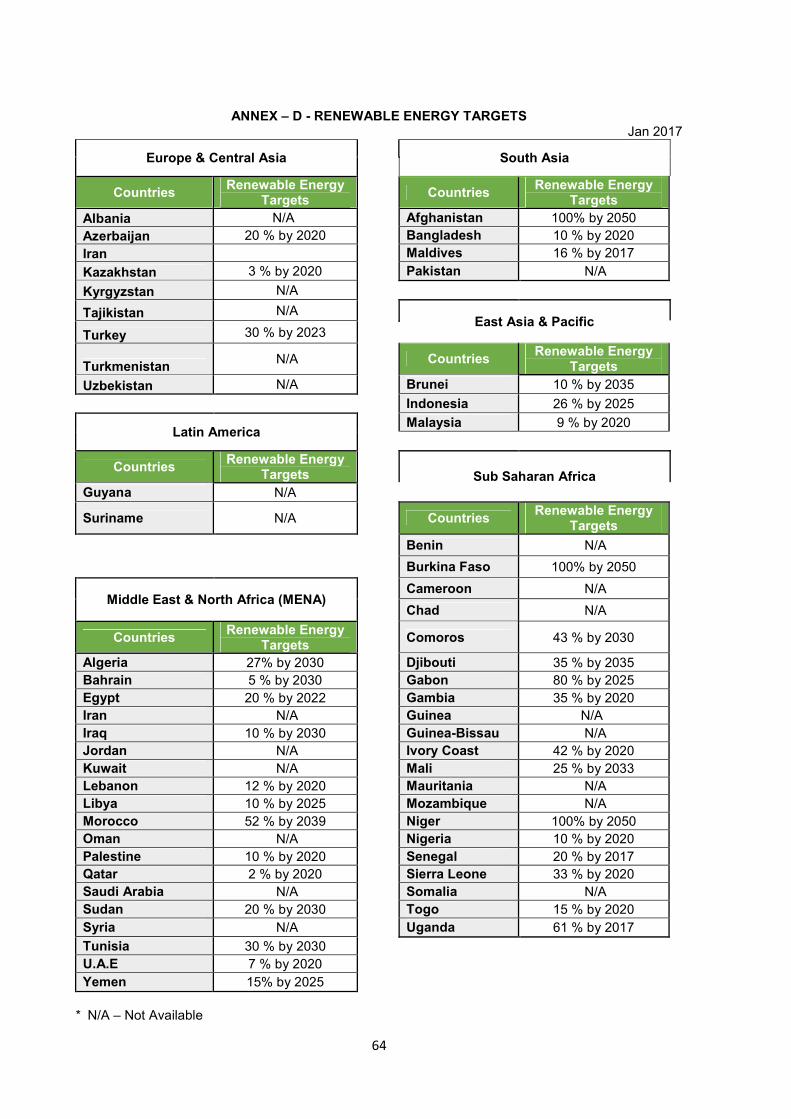
64
Europe & Central Asia
South Asia
Countries Renewable Energy
Targets Countries
Renewable Energy Targets
Albania N/A Afghanistan 100% by 2050
Azerbaijan 20 % by 2020 Bangladesh 10 % by 2020
Iran Maldives 16 % by 2017
Kazakhstan 3 % by 2020 Pakistan N/A
Kyrgyzstan N/A
Tajikistan N/A East Asia & Pacific
Turkey 30 % by 2023
Turkmenistan N/A
Countries
Renewable Energy Targets
Uzbekistan N/A Brunei 10 % by 2035
Indonesia 26 % by 2025
Latin America Malaysia 9 % by 2020
Countries Renewable Energy
Targets Sub Saharan Africa
Guyana N/A
Suriname N/A
Countries Renewable Energy
Targets
Benin N/A
Burkina Faso 100% by 2050
Middle East & North Africa (MENA) Cameroon N/A
Chad N/A
Countries Renewable Energy
Targets Comoros 43 % by 2030
Algeria 27% by 2030 Djibouti 35 % by 2035
Bahrain 5 % by 2030 Gabon 80 % by 2025
Egypt 20 % by 2022 Gambia 35 % by 2020
Iran N/A Guinea N/A
Iraq 10 % by 2030 Guinea-Bissau N/A
Jordan N/A Ivory Coast 42 % by 2020
Kuwait N/A Mali 25 % by 2033
Lebanon 12 % by 2020 Mauritania N/A
Libya 10 % by 2025 Mozambique N/A
Morocco 52 % by 2039 Niger 100% by 2050
Oman N/A Nigeria 10 % by 2020
Palestine 10 % by 2020 Senegal 20 % by 2017
Qatar 2 % by 2020 Sierra Leone 33 % by 2020
Saudi Arabia N/A Somalia N/A
Sudan 20 % by 2030 Togo 15 % by 2020
Syria N/A Uganda 61 % by 2017
Tunisia 30 % by 2030
U.A.E 7 % by 2020
Yemen 15% by 2025
* N/A – Not Available
ANNEX – D - RENEWABLE ENERGY TARGETS Jan 2017
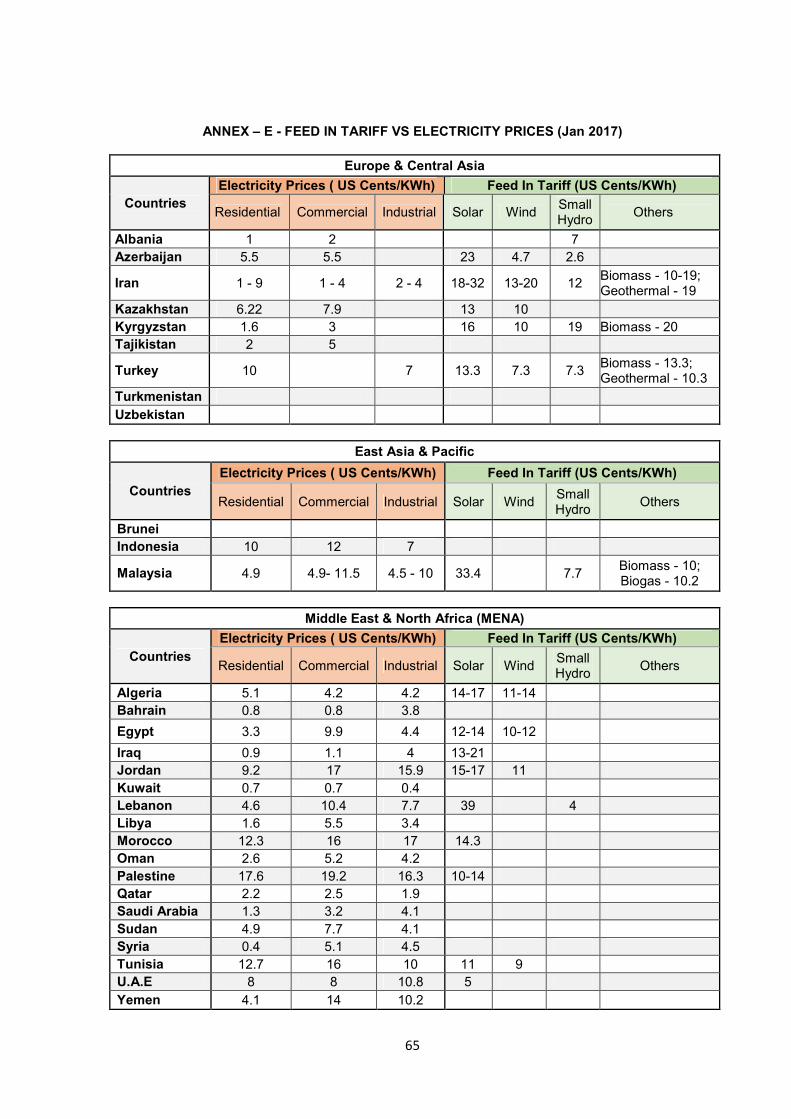
65
Europe & Central Asia
Countries
Electricity Prices ( US Cents/KWh) Feed In Tariff (US Cents/KWh)
Residential Commercial Industrial Solar Wind Small Hydro
Others
Albania 1 2 7
Azerbaijan 5.5 5.5 23 4.7 2.6
Iran 1 - 9 1 - 4 2 - 4 18-32 13-20 12 Biomass - 10-19; Geothermal - 19
Kazakhstan 6.22 7.9 13 10
Kyrgyzstan 1.6 3 16 10 19 Biomass - 20
Tajikistan 2 5
Turkey 10 7 13.3 7.3 7.3 Biomass - 13.3; Geothermal - 10.3
Turkmenistan
Uzbekistan
East Asia & Pacific
Countries
Electricity Prices ( US Cents/KWh) Feed In Tariff (US Cents/KWh)
Residential Commercial Industrial Solar Wind Small Hydro
Others
Brunei
Indonesia 10 12 7
Malaysia 4.9 4.9- 11.5 4.5 - 10 33.4 7.7 Biomass - 10; Biogas - 10.2
Middle East & North Africa (MENA)
Countries
Electricity Prices ( US Cents/KWh) Feed In Tariff (US Cents/KWh)
Residential Commercial Industrial Solar Wind Small Hydro
Others
Algeria 5.1 4.2 4.2 14-17 11-14
Bahrain 0.8 0.8 3.8
Egypt 3.3 9.9 4.4 12-14 10-12
Iraq 0.9 1.1 4 13-21
Jordan 9.2 17 15.9 15-17 11
Kuwait 0.7 0.7 0.4
Lebanon 4.6 10.4 7.7 39 4
Libya 1.6 5.5 3.4
Morocco 12.3 16 17 14.3
Oman 2.6 5.2 4.2
Palestine 17.6 19.2 16.3 10-14
Qatar 2.2 2.5 1.9
Saudi Arabia 1.3 3.2 4.1
Sudan 4.9 7.7 4.1
Syria 0.4 5.1 4.5
Tunisia 12.7 16 10 11 9
U.A.E 8 8 10.8 5
Yemen 4.1 14 10.2
ANNEX – E - FEED IN TARIFF VS ELECTRICITY PRICES (Jan 2017)
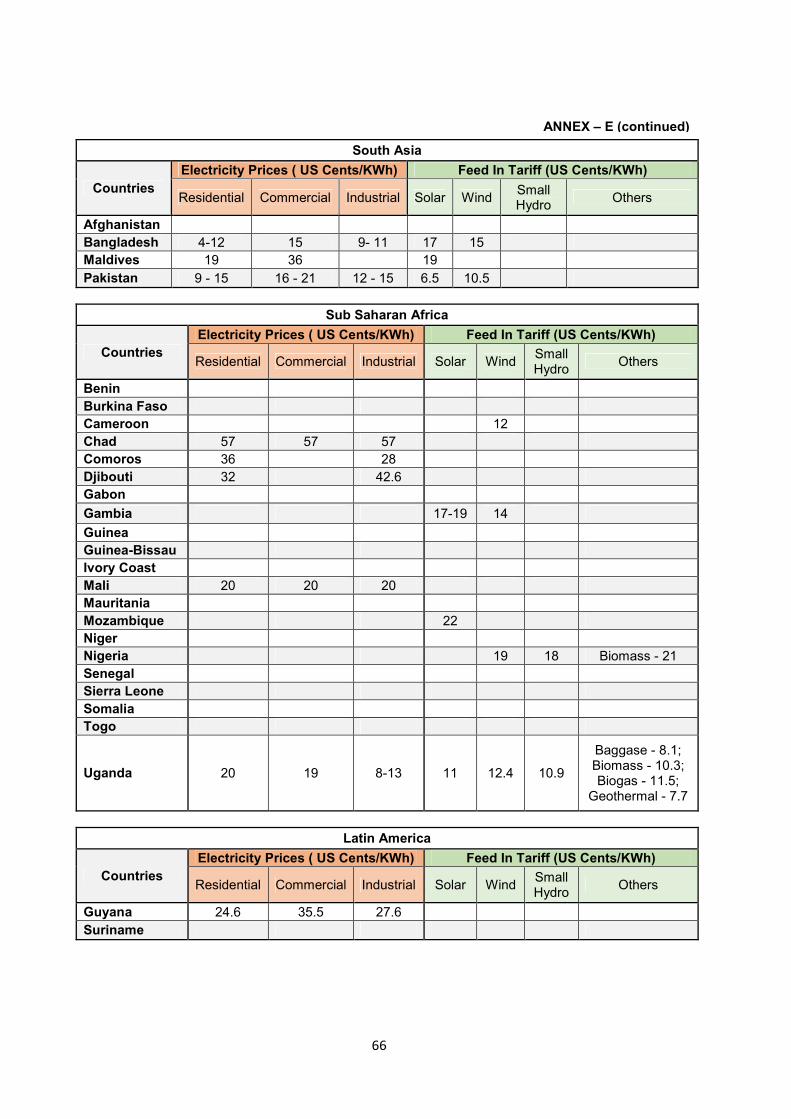
66
South Asia
Countries
Electricity Prices ( US Cents/KWh) Feed In Tariff (US Cents/KWh)
Residential Commercial Industrial Solar Wind Small Hydro
Others
Afghanistan
Bangladesh 4-12 15 9- 11 17 15
Maldives 19 36 19
Pakistan 9 - 15 16 - 21 12 - 15 6.5 10.5
Sub Saharan Africa
Countries
Electricity Prices ( US Cents/KWh) Feed In Tariff (US Cents/KWh)
Residential Commercial Industrial Solar Wind Small Hydro
Others
Benin
Burkina Faso
Cameroon 12
Chad 57 57 57
Comoros 36 28
Djibouti 32 42.6
Gabon
Gambia 17-19 14
Guinea
Guinea-Bissau
Ivory Coast
Mali 20 20 20
Mauritania
Mozambique 22
Niger
Nigeria 19 18 Biomass - 21
Senegal
Sierra Leone
Somalia
Togo
Uganda 20 19 8-13 11 12.4 10.9
Baggase - 8.1; Biomass - 10.3; Biogas - 11.5;
Geothermal - 7.7
Latin America
Countries
Electricity Prices ( US Cents/KWh) Feed In Tariff (US Cents/KWh)
Residential Commercial Industrial Solar Wind Small Hydro
Others
Guyana 24.6 35.5 27.6
Suriname
ANNEX – E (continued)
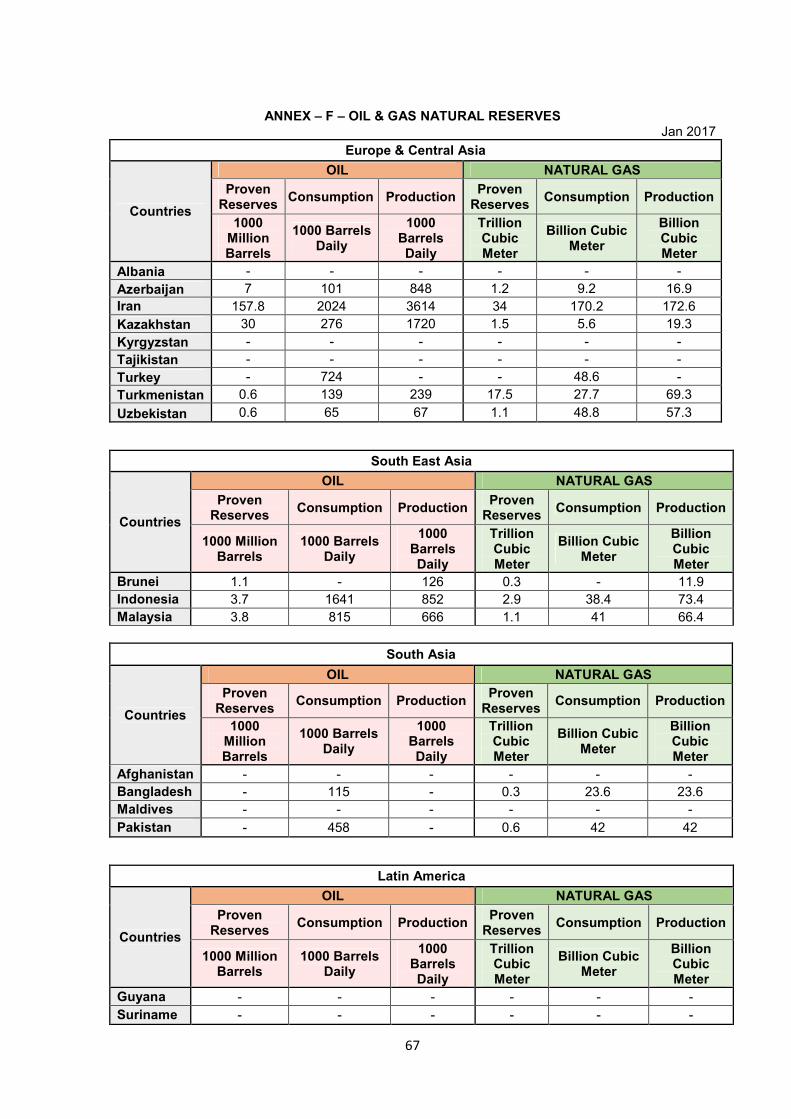
67
Europe & Central Asia
Countries
OIL NATURAL GAS
Proven Reserves
Consumption Production Proven
Reserves Consumption Production
1000 Million Barrels
1000 Barrels Daily
1000 Barrels Daily
Trillion Cubic Meter
Billion Cubic Meter
Billion Cubic Meter
Albania - - - - - -
Azerbaijan 7 101 848 1.2 9.2 16.9
Iran 157.8 2024 3614 34 170.2 172.6
Kazakhstan 30 276 1720 1.5 5.6 19.3
Kyrgyzstan - - - - - -
Tajikistan - - - - - -
Turkey - 724 - - 48.6 -
Turkmenistan 0.6 139 239 17.5 27.7 69.3
Uzbekistan 0.6 65 67 1.1 48.8 57.3
South East Asia
Countries
OIL NATURAL GAS
Proven Reserves
Consumption Production Proven
Reserves Consumption Production
1000 Million Barrels
1000 Barrels Daily
1000 Barrels Daily
Trillion Cubic Meter
Billion Cubic Meter
Billion Cubic Meter
Brunei 1.1 - 126 0.3 - 11.9
Indonesia 3.7 1641 852 2.9 38.4 73.4
Malaysia 3.8 815 666 1.1 41 66.4
South Asia
Countries
OIL NATURAL GAS
Proven Reserves
Consumption Production Proven
Reserves Consumption Production
1000 Million Barrels
1000 Barrels Daily
1000 Barrels Daily
Trillion Cubic Meter
Billion Cubic Meter
Billion Cubic Meter
Afghanistan - - - - - -
Bangladesh - 115 - 0.3 23.6 23.6
Maldives - - - - - -
Pakistan - 458 - 0.6 42 42
Latin America
Countries
OIL NATURAL GAS
Proven Reserves
Consumption Production Proven
Reserves Consumption Production
1000 Million Barrels
1000 Barrels Daily
1000 Barrels Daily
Trillion Cubic Meter
Billion Cubic Meter
Billion Cubic Meter
Guyana - - - - - -
Suriname - - - - - -
ANNEX – F – OIL & GAS NATURAL RESERVES Jan 2017
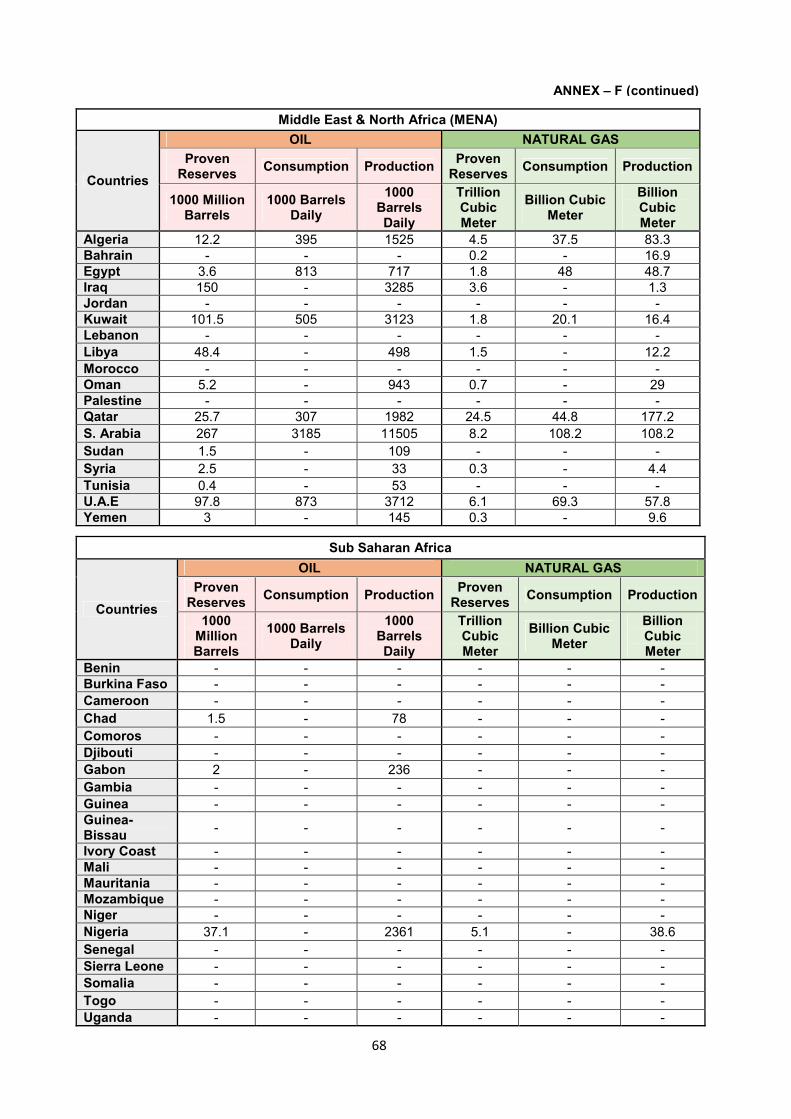
68
Middle East & North Africa (MENA)
Countries
OIL NATURAL GAS
Proven Reserves
Consumption Production Proven
Reserves Consumption Production
1000 Million Barrels
1000 Barrels Daily
1000 Barrels Daily
Trillion Cubic Meter
Billion Cubic Meter
Billion Cubic Meter
Algeria 12.2 395 1525 4.5 37.5 83.3
Bahrain - - - 0.2 - 16.9
Egypt 3.6 813 717 1.8 48 48.7
Iraq 150 - 3285 3.6 - 1.3
Jordan - - - - - -
Kuwait 101.5 505 3123 1.8 20.1 16.4
Lebanon - - - - - -
Libya 48.4 - 498 1.5 - 12.2
Morocco - - - - - -
Oman 5.2 - 943 0.7 - 29
Palestine - - - - - -
Qatar 25.7 307 1982 24.5 44.8 177.2
S. Arabia 267 3185 11505 8.2 108.2 108.2
Sudan 1.5 - 109 - - -
Syria 2.5 - 33 0.3 - 4.4
Tunisia 0.4 - 53 - - -
U.A.E 97.8 873 3712 6.1 69.3 57.8
Yemen 3 - 145 0.3 - 9.6
Sub Saharan Africa
Countries
OIL NATURAL GAS
Proven Reserves
Consumption Production Proven
Reserves Consumption Production
1000 Million Barrels
1000 Barrels Daily
1000 Barrels Daily
Trillion Cubic Meter
Billion Cubic Meter
Billion Cubic Meter
Benin - - - - - -
Burkina Faso - - - - - -
Cameroon - - - - - -
Chad 1.5 - 78 - - -
Comoros - - - - - -
Djibouti - - - - - -
Gabon 2 - 236 - - -
Gambia - - - - - -
Guinea - - - - - -
Guinea-Bissau
- - - - - -
Ivory Coast - - - - - -
Mali - - - - - -
Mauritania - - - - - -
Mozambique - - - - - -
Niger - - - - - -
Nigeria 37.1 - 2361 5.1 - 38.6
Senegal - - - - - -
Sierra Leone - - - - - -
Somalia - - - - - -
Togo - - - - - -
Uganda - - - - - -
ANNEX – F (continued)
69
Absorption Chillers. Chillers that use heat energy from any source (solar, biomass, waste heat, etc.) to drive air conditioning or refrigeration systems. The heat source replaces the electric power consumption of a mechanical compressor.
Bioenergy. Energy derived from any form of biomass (solid, liquid or gaseous) for heat, power and transport. Biofuels. A fuel derived from biomass that may include liquid fuel ethanol and biodiesel, as well as biogas. Biofuels can be combusted in vehicle engines as transport fuels and in stationary engines for heat and electricity generation. They also can be used for domestic heating and cooking.
Building Codes & Standards. Rules specifying the minimum standards for buildings and other structures for increasing energy efficiency. These can refer to new and/or renovated and refurbished buildings.
Capacity factor. The ratio of the actual output of a unit of electricity or heat generation over a period of time to the theoretical output that would be produced if the unit were operating without interruption at its rated capacity during the same period of time. Combined Heat and Power (CHP). CHP facilities produce both heat and power from the combustion of fossil and/or biomass fuels, as well as from geothermal and solar thermal resources. The term also is applied to plants that recover “waste heat” from thermal power generation processes.
Concentrating Photovoltaics (CPV). Technology that uses mirrors or lenses to focus and concentrate sunlight onto a relatively small area of photovoltaic cells that generate electricity. Concentrating Solar Thermal Power (CSP). Technology that uses mirrors to focus sunlight into an intense solar beam that heats a working fluid in a solar receiver, which then drives a turbine or heat engine/generator to produce electricity. There are four types of commercial CSP systems: parabolic troughs, linear Fresnel, power towers and dish/engines. The first two technologies are line-focus systems, capable of concentrating the sun’s energy to produce temperatures of 400°C, while the latter two are point focus systems that can produce temperatures of 800°C or higher. Conversion Efficiency. The ratio between the useful energy output from an energy conversion device and the energy input into it.
Curtailment. A reduction in the output of a generator, typically on an involuntary basis, from what it could produce otherwise given the resources available. Curtailment of electricity generation has long been a normal occurrence in the electric power industry and can occur for a variety of reasons, including a lack of transmission access or transmission congestion. Distributed Generation. Generation of electricity from dispersed, generally small-scale systems that are close to the load centers. Distributed Renewable Energy. Energy systems are considered to be distributed if 1) the systems of production are relatively small and dispersed (such as small-scale solar PV on rooftops), rather than relatively large and centralized 2) generation and distribution occur independently from a centralized network.
GLOSSARY

70
Energy Audit. Analysis of energy flows in a building, process or system, conducted with the goal of reducing energy inputs into the system without negatively affecting outputs. Energy Efficiency. The measure that accounts for delivering more services for the same energy input, or the same amount of services for less energy input. Conceptually, this is the reduction of losses from the conversion of primary source fuels through final energy use, as well as other active or passive measures to reduce energy demand without diminishing the quality of energy services delivered. Energy Efficiency Mandate/Obligation. A measure that requires designated parties (consumers, suppliers, generators) to meet a minimum, and often gradually increasing, target for energy efficiency. Energy Efficiency Target. An official commitment, plan, or goal set by a government to achieve a certain amount of energy efficiency by a future date. Targets may be backed by specific compliance mechanisms or policy support measures. Some targets are legislated, while others are set by regulatory agencies, ministries or public officials.
Feed-in Tariff/Policy. A policy that typically guarantees renewable generators specified payments per unit (e.g. USD/kWh) over a fixed period. Feed-in tariff (FIT) policies also may establish regulations by which generators can interconnect and sell power to the grid. Final Energy Consumption. Energy that is supplied to the consumer for all final energy services such as cooling and lighting, building or industrial heating or mechanical work including transportation. Fiscal Incentive. An incentive that provides individuals, households or companies with a reduction in their contribution to the public treasury via income or other taxes. Geothermal Energy. Heat energy emitted from within the earth’s crust, usually in the form of hot water and steam. It can be used to generate electricity in a thermal power plant or to provide heat directly at various temperatures. Green Bond. A bond issued by a bank or company, the proceeds of which will go entirely into clean energy and other environmentally friendly projects. The issuer will normally label it as a green bond. There is no internationally recognized standard for what constitutes a green bond. Investment Tax Credit. A fiscal incentive that allows investments in renewable energy to be fully or partially credited against the tax obligations or income of a project developer, industry, building owner, etc. Labelling. System in which the energy efficiency of the product/ appliance is rated/listed on a label to inform customers of product energy performance so that they can select among various models. Labelling systems can be voluntary or mandatory. Levelized Cost of Energy (LCOE). The unique cost price of energy outputs (e.g. USD/kWh) of a project that makes the present value of the revenues equal to the present value of the costs over the lifetime of the project. Mandate/Obligation. A measure that requires designated parties (consumers, suppliers, generators) to meet a minimum, and often gradually increasing target for renewable energy, such as a percentage of total supply.
71
Micro-grids. For distributed renewable energy in developing countries, micro-grids typically refer to independent grid networks operating on a scale of 1–10 kW. Net Metering. A regulated arrangement in which utility customers with on-site electricity generators can receive credits for excess generation, which can be applied to offset consumption in other billing periods. Under net metering, customers typically receive credit at the level of the retail electricity price. Ocean Energy. Energy captured from ocean waves, tides, currents, salinity gradients and ocean temperature differences. Wave energy converters capture the energy of surface waves to generate electricity; tidal stream generators use kinetic energy of moving water to power turbines; and tidal barrages are essentially dams that cross tidal estuaries and capture energy as tides ebb and flow. Pumped Storage Hydropower. Plants that pump water from a lower reservoir to a higher storage basin using surplus electricity, and that reverse the flow to generate electricity when needed. They are not energy sources but means of energy storage and can have overall system efficiencies of around 80–90%. Renewable Energy Target. An official commitment, plan or goal set by a government level to achieve a certain amount of renewable energy by a future date. Targets may be backed by specific compliance mechanisms or policy support measures. Some targets are legislated while others are set by regulatory agencies, ministries or public officials. Renewable Portfolio Standard (RPS). An obligation placed by a government on a utility company, group of companies or consumers to provide or use a predetermined minimum targeted renewable share of installed capacity. Smart Grid. Electrical grid that uses information and communications technology to co-ordinate the needs and capabilities of the generators, grid operators, end-users and electricity market stakeholders in a system, with the aim of operating all parts as efficiently as possible, minimizing costs and environmental impacts and maximizing system reliability, resilience and stability. Solar Home System (SHS). A stand-alone system composed of a relatively small-power photovoltaic module, a battery and sometimes a charge controller that can power small electric devices and provide modest amounts of electricity to homes for lighting and radios. Usually in rural or remote regions that are not connected to the electricity grid. Subsidies. Government artificially reduce the price that consumers pay for energy or reduce production costs. Tendering. A procurement mechanism by which renewable energy supply or capacity is competitively solicited from sellers, who offer bids at the lowest price that they would be willing to accept. Bids may be evaluated on both price and non-price factors.

COMSTECH Secretariat,
33- Constitution Avenue, G-5/2, Islamabad, Pakistan
www.comstech.org