renewable fuels from concentrated solar power: … supplementary materials renewable fuels from...
TRANSCRIPT

1
Supplementary Materials
Renewable Fuels from Concentrated Solar Power: Towards Practical Artificial Photosynthesis
Shannon A. Bonke,†a Mathias Wiechen,†*a Douglas R. MacFarlanea and Leone Spiccia*a
Affiliations a School of Chemistry and ARC Centre of Excellence for Electromaterials Science (ACES), Monash University, Victoria, 3800, Australia.
† These authors contributed equally to this work
* Correspondence should be addressed to: M.W. ([email protected]) or L.S. ([email protected]).
Electronic Supplementary Material (ESI) for Energy & Environmental Science.This journal is © The Royal Society of Chemistry 2015
2
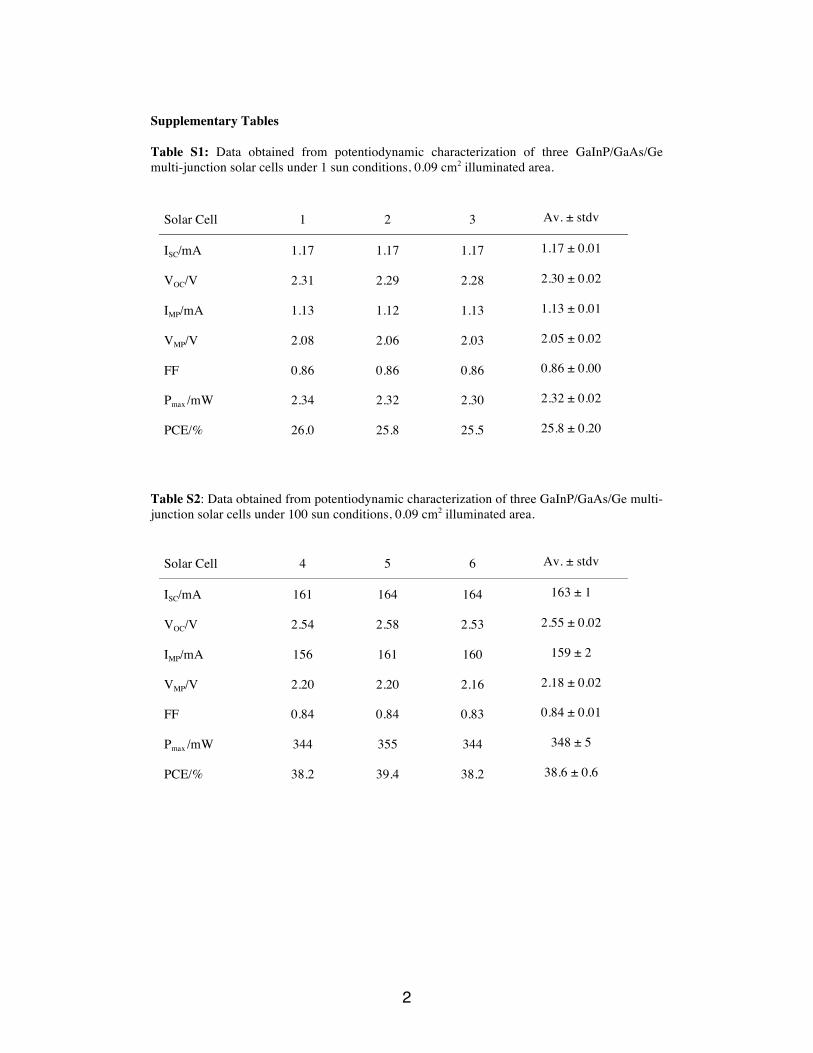
Supplementary Tables
Table S1: Data obtained from potentiodynamic characterization of three GaInP/GaAs/Ge multi-junction solar cells under 1 sun conditions, 0.09 cm2 illuminated area.
Table S2: Data obtained from potentiodynamic characterization of three GaInP/GaAs/Ge multi-junction solar cells under 100 sun conditions, 0.09 cm2 illuminated area.
Solar Cell 4 5 6 Av. ± stdv
ISC/mA 161 164 164 163 ± 1
VOC/V 2.54 2.58 2.53 2.55 ± 0.02
IMP/mA 156 161 160 159 ± 2
VMP/V 2.20 2.20 2.16 2.18 ± 0.02
FF 0.84 0.84 0.83 0.84 ± 0.01
Pmax /mW 344 355 344 348 ± 5
PCE/% 38.2 39.4 38.2 38.6 ± 0.6
Solar Cell 1 2 3 Av. ± stdv
ISC/mA 1.17 1.17 1.17 1.17 ± 0.01
VOC/V 2.31 2.29 2.28 2.30 ± 0.02
IMP/mA 1.13 1.12 1.13 1.13 ± 0.01
VMP/V 2.08 2.06 2.03 2.05 ± 0.02
FF 0.86 0.86 0.86 0.86 ± 0.00
Pmax /mW 2.34 2.32 2.30 2.32 ± 0.02
PCE/% 26.0 25.8 25.5 25.8 ± 0.20

3
Table S3: Potentiodynamic data of the reference solar cell as stated in the calibration certificate by CalLab, Frauenhofer ISE and measured for the calibration of the solar simulator used for this project (spectral irradiance distribution: AM1.5G).
Supplementary Figures
Fig. S1 Potentiodynamic data of the calibration solar cell. The light intensity of the used solar simulator was adjusted to match potentiodynamic data recorded within our laboratory (red traces) on data given in the calibration certificate provided by CalLab, Frauenhofer ISE (black traces). After calibration of the solar simulator for 1 sun conditions, current output (solid lines, left axis), power output (dashed lines, right axis) and maximum power point (circles, left axis) are in good agreement.
as stated measured
ISC/mA 15.35 ± 0.38 15.33
VOC/mV 614.9 ± 3.1 617.4
IMP/mA 14.391 14.339
VMP/V 520.684 526.416
FF 79.41 ± 0.79 79.75
Pmax /mW 7.493 7.548

4
Fig. S2 Potentiodynamic characterization of the GaInP/GaAs/Ge multi-junction solar cells under simulated 1 sun conditions (AM 1.5G). The current output (solid lines, left axis), power output (dashed lines, right axis) and maximum power point (circles, left axis) of three GaInP/GaAs/Ge multi-junction solar cells are shown (cf. Table S1). Due to the small beam size under solar concentrated conditions and for a better comparison, the active area of the solar cells was reduced from 1.0 cm2 to 0.09 cm2 using a square mask (3x3 mm).
Fig. S3 Potentiodynamic characterization of the GaInP/GaAs/Ge multi-junction solar cells under simulated 100 sun conditions. The current output (solid lines, left axis), power output (dashed lines, right axis) and maximum power point (circles, left axis) of three GaInP/GaAs/Ge multi-junction solar cells are shown (cf. Table S2). Due to the small beam size under solar concentrated conditions, the active area of the solar cells was reduced from 1.0 cm2 to 0.09 cm2 using a square mask (3x3 mm).
5
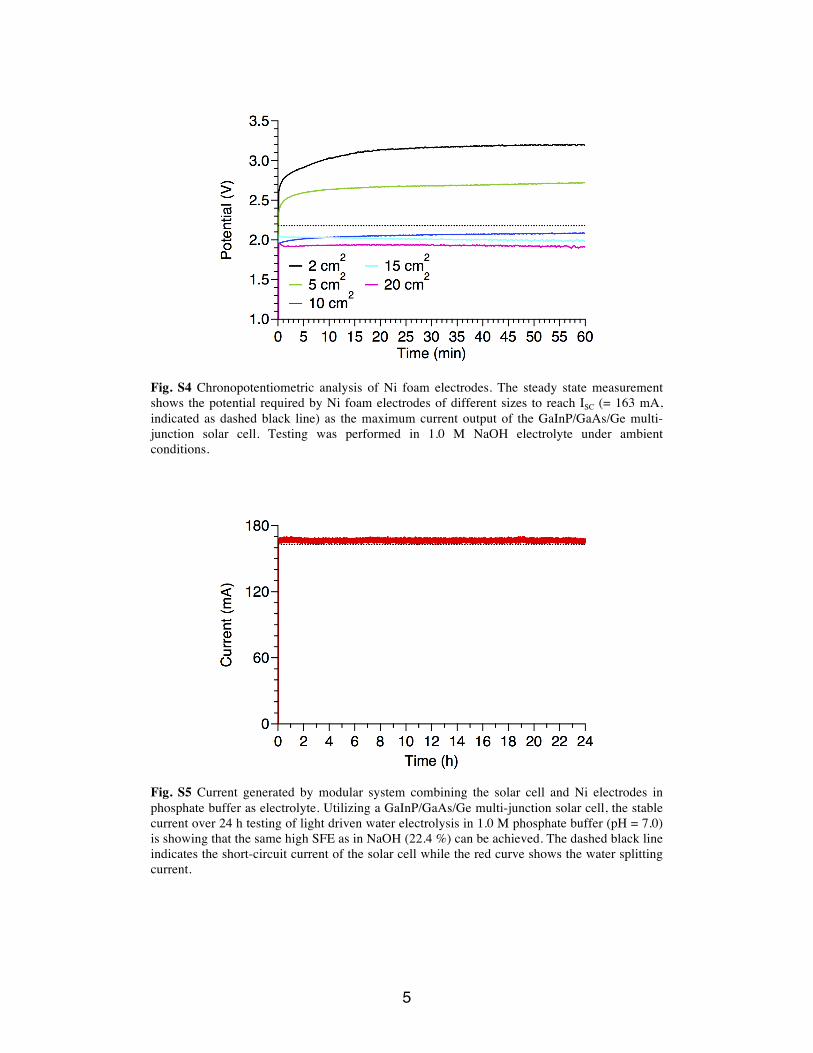
Fig. S4 Chronopotentiometric analysis of Ni foam electrodes. The steady state measurement shows the potential required by Ni foam electrodes of different sizes to reach ISC (= 163 mA, indicated as dashed black line) as the maximum current output of the GaInP/GaAs/Ge multi-junction solar cell. Testing was performed in 1.0 M NaOH electrolyte under ambient conditions.
Fig. S5 Current generated by modular system combining the solar cell and Ni electrodes in phosphate buffer as electrolyte. Utilizing a GaInP/GaAs/Ge multi-junction solar cell, the stable current over 24 h testing of light driven water electrolysis in 1.0 M phosphate buffer (pH = 7.0) is showing that the same high SFE as in NaOH (22.4 %) can be achieved. The dashed black line indicates the short-circuit current of the solar cell while the red curve shows the water splitting current.

6
Fig. S6 Current generated by modular system combining the solar cell and Ni electrodes with sodium sulfate and sulfuric acid as electrolytes. 24 h testing of light driven water electrolysis in 1.0 M Na2SO4 solution (pH = 6.5, red trace) shows that the same high SFE as in NaOH (22.4 %) can be achieved. The strong drop of the current after about 2 h when testing water electrolysis in 1.0 M H2SO4 (pH = 0.0, green trace) illustrates the low stability of the Ni electrodes at low pH. The dashed black line indicates the short-circuit current of the solar cell.
Fig. S7 Current generated by modular system combining the solar cell and Ni electrodes in phosphate buffer made up with local river water as electrolyte. 24 h testing of light driven water electrolysis in 1.0 M phosphate buffer (pH = 7), made up with filtered water from the Yarra River in Melbourne, Australia. After an optimization of the electrode size (15 cm2, red curve; 20 cm2 green curve), the same high SFE as in NaOH (22.4 %) can be achieved. The dashed black line indicates the short-circuit current of the solar cell.

7
Fig. S8 Pourbaix diagram of Ni. The E/pH diagram illustrates the stability of solid and dissolved Ni species at a given combination of potentials and proton activity. The thermodynamic, pH dependent potentials for water oxidation and reduction are shown as blue dashed lines. The figure is simplified from Pourbaix diagrams given in ref 1.
Fig. S9 Ni foam electrodes. The wires (red and black) to contact the electrodes were soldered onto the Ni foam (electrode size here 10 cm2). To protect the connection from corrosion under electrolysis conditions and to define the active area of the electrodes, silicone sealant (white) was used. To ensure that the silicone sealant penetrated into the pores of the Ni foam, it was diluted with n-hexane.

8
Calculation of PCE The power conversion efficiency (PCE, eq. S1) is defined as the quotient of maximum power output of the solar cell (Pmax) and the power input from the light source (Pin). Pmax is the product of short circuit current (ISC), open circuit voltage (VOC) and fill factor (FF) of the solar cell.
(S1)
The Fill Factor (FF, eq. S2) is a measure of solar cell performance (“squareness” of the curve of the potentiodynamic characterization), which is defined as the quotient of the products of current (IMP) and voltage (VMP) at the maximum power point and ISC and VOC.
(S2) References
1 N. Takeno, Atlas of Eh-pH diagrams, Geological Survey of Japan Open File Report No.419, http://www.gsj.jp/data/openfile/no0419/openfile419e.pdf, 2005.