renewing manufacturing jobs while protecting health · pdf filerenewing manufacturing jobs...
TRANSCRIPT
The Economic Benefits of a Green
Chemical Industry in the United States Renewing Manufacturing Jobs While
Protecting Health and the Environment
This report is also available at www.bluegreenalliance.org and www.peri.umass.edu
James Heintz and Robert Pollin Political Economy Research Institute (PERI)
University of Massachusetts, Amherst
Commissioned by
The Political Economy Research Institute (PERI) www.peri.umass.edu promotes human and ecological well-being through our original research. Our approach is to translate what we learn into workable policy proposals that are capable of improving life on our planet today and in the future. In the words of the late Professor Robert Heilbroner, we at PERI “strive to make a workable science out of morality.”
Established in 1998, PERI is an independent unit of the University of Massachusetts, Amherst, with close ties to the Department of Economics. PERI staff frequently work collaboratively with faculty members and graduate students from the University of Massachusetts, and other economists from around the world. Many of these colleagues have become PERI Research Associates. Since its founding, PERI has become a leading source of research and policy initiatives on issues of globalization, unemployment, financial market instability, central bank policy, living wages and decent work, and the economics of peace, development, and the environment. James Heintz, PERI Associate Research Professor, is the primary author of this report.
The BlueGreen Alliance www.bluegreenalliance.org is a national, strategic partnership between labor unions and environmental organizations dedicated to expanding the number and quality of jobs in the green economy. Launched in 2006 by the United Steelworkers and the Sierra Club, this unique labor-environmental collaboration has grown to include the Communications Workers of America (CWA), Natural Resources Defense Council (NRDC), Service Employees International Union (SEIU), National Wildlife Federation (NWF), Laborers’ International Union of North America (LIUNA), Union of Concerned Scientists (UCS), Utility Workers Union of America (UWUA), American Federation of Teachers (AFT), Amalgamated Transit Union (ATU), Sheet Metal Workers’ International Association, United Auto Workers and the United Food and Commercial Workers (UFCW). The Blue Green Alliance unites more than 14 million members and supporters in pursuit of good jobs, a clean environment and a green economy.
The Blue Green Alliance works on issues ranging from energy and climate change to transportation to workers’ rights and green chemistry. This report was commissioned by the Chemicals, Public Health and Green Chemistry program of the BlueGreen Alliance. Charlotte Brody, that program’s director, played a pivotal role in supporting the research that went into this report.
Photos: All photographs by Earl Dotter, www.earldotter.com
Design: Kieran Daly and Parisa Damian of Winking Fish, www.winkingfish.com
B L U E G R E E N A L L I A N C E PA R T N E R O R G A N I Z A T I O N S

3The Economic Benefits of a Green Chemical Industry in the United States
EXECUTIVE SUMMARY ...................................................................................................................................... 5
Creating an Effective Regulatory System in the United States ........................................................................................5
Changing the Basis of Competitiveness ...............................................................................................................................6
Regulatory Reform Can Support Innovation .........................................................................................................................6
Sustainable Chemistry and Job Creation ..............................................................................................................................7
Recommendations.....................................................................................................................................................................7
1. Introduction ...................................................................................................................................................... 9
2. Overview of the U.S. Chemical Industry Today ..........................................................................................10
2A) Employment and the Manufacturing Sector ............................................................................................................... 10
TABLE 1. Average Growth Rates of the Contribution of U.S. Manufacturing Sectors to GDP, 1991-2008. ....................................................................11
FIGURE 1. Trends in Employment in the U.S. Chemical, Petroleum,and Plastics Products Industries, 1992-2010 ......................................................11
FIGURE 2. Non-Pharmaceutical Chemical Employment,Actual and Projected Jobs (1992, 2010, and 2030)............................................................12
FIGURE 3. Job Losses in Non-Pharmaceutical Chemicals by State, 2030, ‘Business as Usual Scenario’ .................................................................12
2B) Markets for U.S. Chemical Products ............................................................................................................................ 12
FIGURE 4. Distribution of the Value of Production of the Global Chemical Industry, 2009 .............................................................................................13
FIGURE 5. Exports as a Share of the Total Value of Shipments, U.S. Chemical Industry, 1989-2009 ..........................................................................13
2C) Off-shoring and Global Production ............................................................................................................................... 13
TABLE 2. Employment in Majority-Owned Foreign Affiliates of U.S. Companies, (2008). ................................................................................................14
2D) The Major Sectors within the Chemical Industry ........................................................................................................ 14
FIGURE 6. Major Segments of the Chemical Industry, Shares of Total Output. 2009 .......................................................................................................15
2E) Safer and Greener Chemistry ......................................................................................................................................... 15
3. Opportunities and Challenges .....................................................................................................................16
3A) New Market Opportunities ............................................................................................................................................. 16
3B) Specific Cases of New Market Opportunities .............................................................................................................. 16
3C) An Evolving Regulatory Environment ........................................................................................................................... 18
Green Chemistry: Economic Growth and Job Creation in California .....................................................................................................................................18
3D) Proposed Reforms to the Toxic Substances Control Act of 1976 ............................................................................ 19
Proposed Reforms to the Toxic Substances Control Act .......................................................................................................................................................... 20
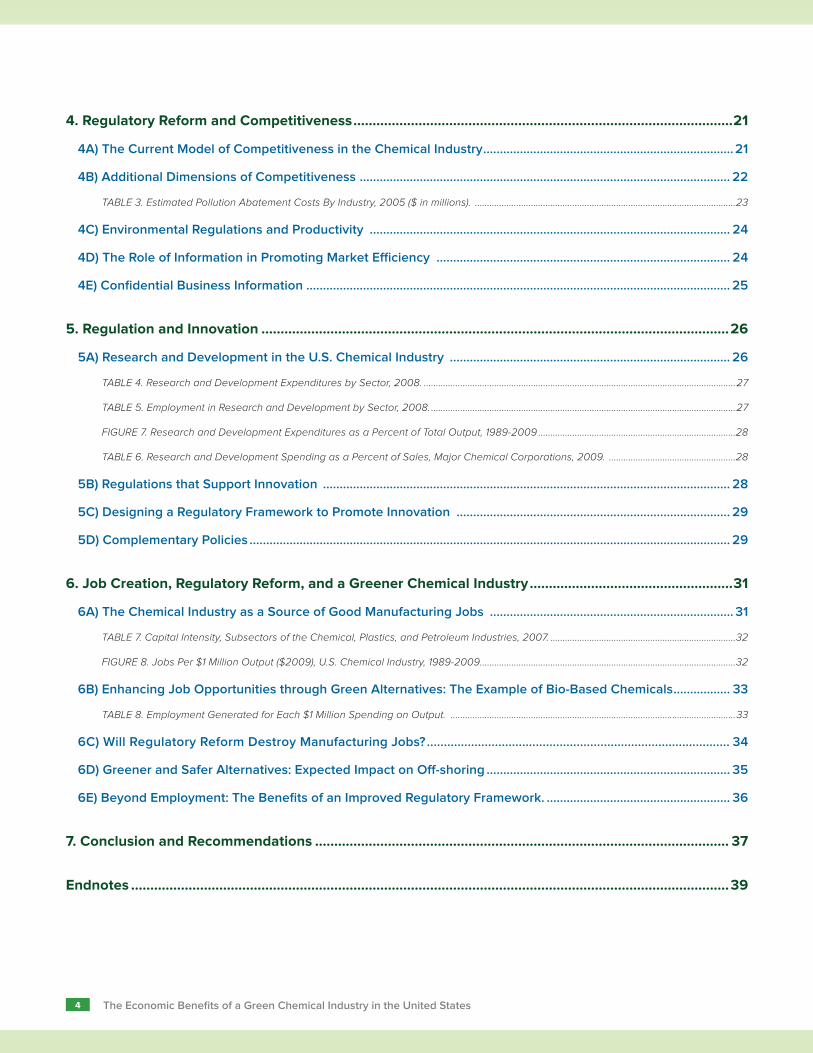
CONTENTS
4 The Economic Benefits of a Green Chemical Industry in the United States
4. Regulatory Reform and Competitiveness ...................................................................................................21
4A) The Current Model of Competitiveness in the Chemical Industry ........................................................................... 21
4B) Additional Dimensions of Competitiveness ............................................................................................................... 22
TABLE 3. Estimated Pollution Abatement Costs By Industry, 2005 ($ in millions). ...........................................................................................................23
4C) Environmental Regulations and Productivity ............................................................................................................ 24
4D) The Role of Information in Promoting Market Efficiency ........................................................................................ 24
4E) Confidential Business Information ............................................................................................................................... 25
5. Regulation and Innovation ..........................................................................................................................26
5A) Research and Development in the U.S. Chemical Industry .................................................................................... 26
TABLE 4. Research and Development Expenditures by Sector, 2008. ................................................................................................................................27
TABLE 5. Employment in Research and Development by Sector, 2008. .............................................................................................................................27
FIGURE 7. Research and Development Expenditures as a Percent of Total Output, 1989-2009 .................................................................................28
TABLE 6. Research and Development Spending as a Percent of Sales, Major Chemical Corporations, 2009. ....................................................28
5B) Regulations that Support Innovation .......................................................................................................................... 28
5C) Designing a Regulatory Framework to Promote Innovation .................................................................................. 29
5D) Complementary Policies ................................................................................................................................................ 29
6. Job Creation, Regulatory Reform, and a Greener Chemical Industry .....................................................31
6A) The Chemical Industry as a Source of Good Manufacturing Jobs ......................................................................... 31
TABLE 7. Capital Intensity, Subsectors of the Chemical, Plastics, and Petroleum Industries, 2007. ............................................................................32
FIGURE 8. Jobs Per $1 Million Output ($2009), U.S. Chemical Industry, 1989-2009 .........................................................................................................32
6B) Enhancing Job Opportunities through Green Alternatives: The Example of Bio-Based Chemicals ................. 33
TABLE 8. Employment Generated for Each $1 Million Spending on Output. .....................................................................................................................33
6C) Will Regulatory Reform Destroy Manufacturing Jobs? ......................................................................................... 34
6D) Greener and Safer Alternatives: Expected Impact on Off-shoring ......................................................................... 35
6E) Beyond Employment: The Benefits of an Improved Regulatory Framework. ....................................................... 36
7. Conclusion and Recommendations ............................................................................................................ 37
Endnotes ............................................................................................................................................................39

If we do not modernize U.S. chemical regula-tions, the analysis in this report shows that the chemical industry can be expected to continue its current model of competitiveness based on cost-cutting practices that eliminate jobs and minimize innovation:
• Research and development (R&D) spend-ing in the chemical industry is currently just 1.5 percent of sales, less than 45 percent of the average for the U.S. manu-facturing sector as a whole.
• Since 1992, the chemical industry, excluding pharmaceuticals, has eliminated more than 300,000 jobs. Employment in the chemical industry fell 38 percent between 1992 and 2010, even as the value of production expanded an average of 4 percent per year.
• If these trends continue, the present number of jobs in non-pharmaceutical chemicals will be effectively cut in half by 2030 and more than 230,000 additional jobs will disappear. These job losses will occur despite expectations that global production will expand by 4.5 percent on average each year over the next decade.
These job losses are not inevitable. New market opportunities demonstrate how to reverse negative employment trends and put people to work in the chemical industry in the United States. This report estimates that if, for example, 20 percent of current production were to shift from petrochemical-based plastics to bio-based plastics, 104,000 additional jobs would be created in the U.S. economy even if the output of the plastics sector remained unchanged.
The U.S. needs to catch up with changes happening elsewhere in the world, respond to the demand for safer, healthier products, improve the information that is available to the public, and support legislative and market efforts to move the chemical industry in new innovative directions. By taking these steps towards sustainable production, the U.S. chemical industry will become more competitive by:
• lowering handling and disposal costs for the chemical industry and downstream users;
• ensuring access to important global markets;
• reducing waste by using inputs more efficiently and curtailing future cost pres-sures by using fewer non-renewable fossil fuel inputs;
• meeting demands from consumers for safer products more effectively;
• protecting shareholder value; and
• encouraging research and the develop-ment of innovative products.
CREATING AN EFFECTIVE REGULATORY SYSTEM IN THE UNITED STATES
The outdated TSCA regulates many of the chemicals used in industrial production and consumer products. However, under TSCA, the ability of the Environmental Protection Agency (EPA) to oversee the development and marketing of chemicals is constrained. The EPA is required to demonstrate that products are harmful before regulating them. Moreover, TSCA grandfathered in about 62,000 chemi-
cals which were in use prior to 1979. The end result is that the information available on chemicals is limited or non-existent and many remain virtually unregulated.
A failure to reform TSCA has a number of implications for the future of the U.S. chemi-cal industry and the U.S. economy:
• The U.S. regulatory framework lags far behind other countries and regions, such as the European Union and Canada, with consequences for access to important markets.
• TSCA fails to address the problem that significant costs associated with hazardous chemicals are being imposed on consum-ers and downstream users.
• Consumers, investors, workers, and busi-nesses have inadequate information on chemical products, limiting their ability to make informed decisions and creating market failures.
• TSCA perpetuates perverse incentives that hamstring innovation and cause produc-ers to favor existing chemicals rather than investing in safer alternatives.
The U.S. chemical industry is at a cross-roads. We can either follow the path of weak and inappropriate regulation — and continue to produce potentially hazardous chemicals while manufacturing jobs disap-pear — or we can move toward disclosure, regulation and sustainability, thereby encouraging innovation, creating stability for businesses and investors and new mar-kets for safe and sustainable chemicals.
E X E C U T I V E S U M M A R Y
A shift to the production of chemicals that are safer for workers, the environment and human health, supported by reform of the 1976 Toxic Substances Control Act (TSCA), can create American jobs and new market opportunities, reversing the decline in employment that has occurred over the past 20 years.
5E X E C U T I V E S U M M A RY — The Economic Benefits of a Green Chemical Industry in the United States

CHANGING THE BASIS OF COMPETITIVENESS
While it is frequently argued that imposing new standards on the chemical industry will damage competitiveness and cost the U.S. economy jobs, this report finds instead that appropriately designed regulations support innovation, productivity, and employment.
Because the chemical industry passes sig-nificant costs onto consumers and users of chemicals, traditional chemical production looks more competitive than it actually is. Even low-end estimates of the health costs of exposure to hazardous chemicals amount to billions of dollars. In terms of children’s health outcomes, chemical exposure has been estimated to play a significant role in 100 percent of the cases of lead poisoning, 10 to 35 percent of asthma cases, 2 to 10 percent of certain cancers, and 5 to 20 percent of neurological problems. In California, with regard to deaths specifically linked to occupational health and safety factors, 80 to 90 percent of cancer deaths, 100 percent of pneumoconiosis (occupational lung disease) deaths, 40 to 50 percent of deaths associated with neurological disorders, and 40 to 50 percent of deaths associated with renal disor-ders are attributable to chemical exposures.
The costs to the chemical industry itself of managing the substances used in the produc-tion of its products are sizeable. The chemical industry has the largest pollution abatement costs of any manufacturing sector (see table above) — an estimated $5.2 billion in 2005. Environmental performance also affects share-holder value. Negative environmental out-comes, measured in terms of environmental lawsuits and toxic releases, reduce the market value of an average firm in the U.S. chemical industry by an estimated 31.2 percent of the replacement value of assets — or approxi-mately $200 billion.
Instead of undermining growth and employ-ment, regulatory reform will provide consum-ers, investors, and workers with better informa-tion on chemical products, helping to create new markets which can shift the chemical industry onto a more sustainable growth path. Greener and more sustainable chemistry will boost competitiveness in the industry and the U.S. economy by reducing the costs associated with producing and using chemical products.
REGULATORY REFORM CAN SUPPORT INNOVATION
The National Science Foundation estimates that research and development (R&D) spending in the chemical industry, exclud-ing pharmaceuticals, is just 1.5 percent of sales, compared to 7.6 percent of sales for computers and electronics, another high-tech sector, and 3.4 percent of sales for the U.S. manufacturing sector as a whole. TSCA contributes to low R&D spending by reduc-ing incentives for industry to innovate, since many of the existing chemicals grandfathered in under TSCA face fewer regulations. The current regulatory environment makes the playing field more unbalanced since it is diffi-cult for the EPA to regulate chemicals of high concern. Potentially hazardous chemicals remain on the market, while new chemicals enter without adequate testing, undermin-ing incentives to develop safer alternatives. Regulatory reform must level the playing field between new and existing chemicals in order to encourage innovation while maintaining core protections for all chemical products.
6 E X E C U T I V E S U M M A RY — The Economic Benefits of a Green Chemical Industry in the United States

Although the right regulatory framework can support innovation in the chemical industry, it is insufficient to foster the growth of green chemistry alone. Complementary policies are needed. These include policies that provide incentives to invest in sustainable chemistry, educational programs, and public support for research, development, and technological innovation.
SUSTAINABLE CHEMISTRY AND JOB CREATION
This decline in employment in the U.S. chemical industry has been driven by a num-ber of factors. Efforts to compete on the basis of labor costs have reduced job opportuni-ties in the sector by lowering the number of workers hired to produce a given level of output. In addition, jobs have been moving off-shore. In 2008, an estimated 627,100 employees worked producing chemical products in majority-owned foreign affili-ates of U.S. companies, compared to total employment within the U.S of 847,100 that same year, including non-pharmaceutical and pharmaceutical chemicals.
The job-shedding trends in the chemical industry can be turned around by boosting demand for U.S. products through innovative alternatives and by increasing the job creation potential of the chemical industry. In many cases, greener alternatives generate more jobs for a given level of output. Therefore, chang-ing the composition of production to include greener products can, in itself, create jobs.
Regulatory reforms are unlikely to under-mine this job creation potential. Impact assessments of the chemical regulations adopted in the European Union (REACH) have estimated that the direct costs of registering and testing chemicals were expected to be less than one percent of sales. Such costs are only incurred once for each product. The U.S. chemical industry has the capacity to absorb once-off costs of this magnitude without jeopardizing jobs. Importantly, these cost estimates do not take into account the wide-ranging benefits associated with reform. The benefits of a more sustainable chemical industry extend beyond job creation and include less pol-lution, better health outcomes, a stronger foundation for the long-run sustainability of the U.S. economy, technological innovation, and markets that work better for consumers, workers, investors, and businesses.
RECOMMENDATIONS
Three major recommendations for building a stronger chemical industry emerge out of this study:
1. Reform TSCA to create an effective new regulatory environment that reduces hazards and supports innovation and com-petitiveness. The reforms should require a minimum data set on all new and existing chemicals sufficient to determine safety. They should shift the burden of proof, so that industry would need to show that their chemicals are safe, instead of the EPA proving that there is harm. The unfair advantage given to chemicals grandfathered in under TSCA must end and be replaced by reforms that support innovation and provide access to infor-mation that allows consumers, down-stream users, and shareholders to make
better decisions without compromising fundamental safety standards.
2. Implement complementary policies to promote innovation, commercialization, and the development of human resources to create a greener and safer chemical industry. The federal government has supported innovative developments in agricul-ture, biotechnology, computers and the Internet. Similar support will help build a green chemical industry. Strategies include implementing policies, such as tax incentives that spur investment in sustain-able chemistry, support green chemistry education, and scale up public support for technological innovation. Govern-ment programs can facilitate coordination between industry, academic researchers, and innovative managers, critical for the successful development and transfer of technologies.
3. Disseminate environmental and health-related information on the chemical industry as widely as possible to improve the choices available to consumers, workers, downstream users, and investors and to mobilize investment in emerging oppor-tunities. If new markets and invest-ment opportunities are to be realized, consumers, workers, and businesses need as much information as possible on the ongoing environmental damage and health hazards associated with all chemicals and the possibilities that exist to develop alternatives. TSCA reforms should also insure that the relevant infor-mation generated by better regulations is readily accessible and disseminated as widely as possible.
7E X E C U T I V E S U M M A RY — The Economic Benefits of a Green Chemical Industry in the United States

8 The Economic Benefits of a Green Chemical Industry in the United States

9The Economic Benefits of a Green Chemical Industry in the United States
9The Economic Benefits of a Green Chemical Industry in the United States
Despite the critical role chemicals play in the economy and in our lives, the level of understanding about their characteristics and the hazards they pose is generally low. Health problems are increasingly linked to chemical exposure, tests reveal that chemicals are accumulating in our bodies, and the nega-tive consequences for the environment are becoming increasingly clear. Moreover, the vast majority of chemicals on which we rely today depend on fossil fuels as a basic input. In addition to the environmental problems associated with fossil fuels as non-renewable, carbon-emitting resources, global energy markets have been highly unstable for much of the past generation, and this is likely to continue for the foreseeable future.
The growing awareness of the long-run consequences of greenhouse gases for climate change has driven economic dynamics and policy choices that are opening up new mar-kets and generating job-creating investments in clean energy. Similar changes are unfold-ing with regard to the production and use of chemicals. Efforts to move the chemical industry onto a more sustainable path — by eliminating hazards, reducing waste, and developing innovative products — will unleash similar economic forces that can cre-ate new economic opportunities and generate jobs in the U.S. economy.
New opportunities already exist. They involve the production of safer, more sustainable, and greener chemical products. In this context, the need for regulatory reform has become more pronounced. The Toxic Substances Control Act (TSCA), passed in 1976, is now outdated. In the absence of reform, individual states have adopted their own legislation. Other countries and regions, including the EU and other important markets, have already adopted new regulations for their chemical products or are quickly moving to do so.
As consumers and businesses demand more information and greater disclosure of the potential hazards posed by the chemicals, this creates important growth opportunities for the chemical industry, but at the same time requires the industry to move quickly to take advantage of these promising possibilities.
The aim of this study is to examine the current state of the U.S. chemical industry and to consider opportunities for creating a greener and safer industry in the coming years. Building a green chemical industry can, in turn, serve as a foundation for U.S. manu-facturing sector moving forward, and thereby, as a basis for maintaining and expanding millions of high-quality jobs throughout the country. Reforming the existing regulatory structure tied to TSCA is integral to achiev-ing a successful transition to a green chemical industry, along with policies to support innovation and competitiveness. As such, this study considers in depth the ways in which regulatory reform supports innovation and sustainable growth.
The study is organized as follows. Section 2 provides an overview of the current state of the U.S. chemical industry, with particular emphasis on changes in global markets, recent employment trends, and sustainable alternatives. Section 3 documents the emerg-ing opportunities and challenges facing the chemical industry, including new regulations and proposals for reform. Two concerns over the direction of reform involve maintaining the industry’s global competitiveness and capacity for innovation. Sections 4 and 5 examine the issues of competitiveness and innovation. Section 6 returns to the question of employment opportunities, focusing in particular on the issue of how a transition to a green chemicals industry can be an engine of job creation for the U.S. economy. Section 7 concludes the study by outlining the study’s main recommendations.
1.INTRODUCTION
Each year, the U.S. economy produces over 27 trillion pounds of chemicals, or about 86,000 pounds per person.1 By 2050, the volume of chemicals produced and consumed worldwide is expected to more than triple.2 Chemicals are used in the production of most goods made in the U.S. — they are present in the commodities we import, and every day we use a wide array of chemical products, from paint to cosmetics to pharmaceuticals. The chemical industry remains a cornerstone of American manufacturing and is connected to numerous jobs throughout the U.S. Approximately 4.2 million jobs in the economy are directly or indirectly linked to the productive activities of the chemical industry.3

10 The Economic Benefits of a Green Chemical Industry in the United States
2A) EMPLOYMENT AND THE MANUFACTURING SECTOR
The chemical industry is a crucial segment within the overall operations of the U.S. economy. This remains true even while — or perhaps especially while — pressures have increased from global competition. Keeping the domestic chemical industry vibrant must be a priority for maintaining a healthy manu-facturing sector in the U.S. economy.
In 2009, the chemical and plastics industries directly contributed $273 billion to the U.S. economy, as measured by gross domestic product or GDP. This represents over 17 per-cent of the total contribution to GDP of all U.S. manufacturing businesses. If we include petroleum products in a broader measure of activities related to chemical manufactur-ing, the total rises to over $390 billion. This represents 25 percent of the total contribu-tion of the manufacturing sector as a whole.4 These figures refer to chemical, plastics, and petroleum product manufacturing that takes place within the U.S., regardless of who owns the production facilities.
At the same time, these numbers only begin to illustrate the centrality of the chemical industry to the U.S. economy. Chemi-cal products are important inputs used by goods-producing sectors and many services, such as healthcare. It is hard to identify any product produced in the U.S. that does not use some input produced by the chemical industry. The American Chemistry Council (ACC), the national trade association for chemical manufacturers, estimates that 96 percent of U.S. manufactured goods directly use some product from the chemical indus-try. According to estimates produced by the ACC, businesses dependent on the chemical industry — defined as industries which spend more than five percent of their input purchases on chemical products — account for approximately one-quarter of the U.S. GDP, or $3.6 trillion.5
The chemical industry, including plastics and petroleum products, is critical to sus-taining U.S. manufacturing. Table 1 shows the average annual growth rate of selected manufacturing sectors from 1991 to 2009.6 Growth is measured in terms of the expan-sion of each sector’s contribution to GDP. With the exception of computer and related products, the chemical and petroleum products industries experienced the fastest growth in the manufacturing sector over the past two decades. Petroleum and coal prod-ucts grew nearly 10 percent per year, while chemical products grew at four percent. The plastic products sector had lower growth rates, around 2.4 percent per year. Manufac-turing overall maintained an average annual growth rate of 3.1 percent between 1991 and 2008.
While production in these sectors has been growing at a healthy rate, employment has fallen in much of the chemical and plas-tics industries. Figure 1 shows the trend in employment in the chemical, plastics, and petroleum products industries from 1992 to 2010. Pharmaceutical employment is shown separately from non-pharmaceutical chemicals.
As we see in Figure 1, the largest employer in the sector overall has been plastic prod-ucts and the next largest has been non-pharmaceutical chemicals (excluding plastic and petroleum products). However, both of these sub-sectors have experienced sharp declines in employment between 1992 and 2010. Employment in both subsectors was about 807,000 in early 1992. But plastics employment fell to around 626,000 by the end of 2010, after having risen to nearly one million around 2000 — a drop of 22 percent between 1992 and 2010. With non-phar-maceutical chemicals, the decline was steady, reaching a low of about 504,000 by the end of 2010 — a 38 percent reduction from 1992 to 2010. The pharmaceutical subsector is the only one showing net gains in employ-ment over this period, from 220,000 in early 1992 to approximately 273,000 by the end
2.OVERVIEW OF THE U.S. CHEMICAL INDUSTRY TODAY
The chemical industry plays a critical role in sustaining U.S. manufacturing and supporting the U.S. economy.
Employment in the U.S. chemical industry has declined sharply in the last 20 years.
To remain a source of relatively high-quality manufacturing jobs, the U.S. chemical industry must ensure better access to growing global demand for safer chemical products, and take advantage of new markets through on-going innovation.
The U.S. remains the world’s largest producer of chemical products and competes in both domestic and global markets. Yet demand for U.S. chemical products lags global growth in demand.
The potential for future devel-opment of safer and greener chemistry will support U.S. global competitiveness and will help sustain U.S. manufacturing into the 21st century while preventing further erosion of good jobs.

11The Economic Benefits of a Green Chemical Industry in the United States
OVERVIEW OF THE U.S. CHEMICAL INDUSTRY TODAY
TABLE 1. Average Growth Rates of the Contribution of U.S. Manufacturing Sectors to GDP, 1991-2008.
SectorAverage Annual
Growth, 1991-2009 Rank
ALL MANUFACTURING 2.7% —
Petroleum and coal products 9.8% 1
Computer and electronic products 4.3% 2
Chemical products 4.0% 3Food and beverage and tobacco products 3.5% 4
Motor vehicles, bodies and trailers, and parts 2.5% 5
Fabricated metal products 2.5% 6
Plastics and rubber products 2.4% 7
Other transportation equipment 2.4% 8
Nonmetallic mineral products 2.3% 9
Furniture and related products 1.7% 10
Machinery 1.7% 11
Electrical equipment, appliances, and components
1.7% 12
Primary metals 1.3% 13
Paper products 1.3% 14
Wood products 0.7% 15
Printing and related support activities 0.3% 16
Textile mills and textile product mills -0.8% 17
Apparel and leather and allied products -3.8% 18
Source: Bureau of Economic Analysis.Note: Growth rates represent the growth of nominal value-added.
Empl
oym
ent
–
200,000
400,000
600,000
800,000
1,000,000
1,200,000
Plastic products
Chemicals, excluding pharmaceuticals
Pharmaceuticals
Petroleum Products
FIGURE 1. Trends in Employment in the U.S. Chemical, Petroleum,and Plastics Products Industries, 1992-2010
Source: U.S. Bureau of Labor Statistics.
of 2010 — an increase of 24 percent. But clearly, even with the employment expansion in pharmaceuticals, the level of employment there remains well less than half of that in plastics or non-pharmaceuticals.
In fact, in considering the relationship between growth in output and employment more formally, between 1992 and 2010, every 1 percent increase in the output of non-pharmaceutical chemicals was associated with a 1 percent decline in the number of jobs. For the pharmaceutical industry, the employ-ment dynamics are different. A 1 percent increase in the output of pharmaceuticals was associated with a 0.6 percent gain in the number of jobs. 7
Why would employment fall when output is growing in non-pharmaceutical chemi-cals? The simple answer is that sales have not kept pace with productivity improve-ments. If labor productivity rises faster than the size of the market for U.S. chemicals, fewer workers are needed to produce a given level of output. This implies that if the chemical industry is to remain a significant source of relatively high-quality manufac-turing jobs, it must insure that the industry has access to growing global demand and takes advantage of new markets through on-going innovation.
The potential consequences of these trends for future employment in the chemical industry could be severe. If we assume that the trends continue with regard to the U.S. share of the global market and the number of jobs generated for a given amount of output, then more than 230,000 additional jobs would be lost from non-pharmaceuti-cal chemicals by 2030 compared to average employment levels at the end of 2010 — nearly cutting the total number of jobs in half.8 Figure 2 compares total employment in non-pharmaceutical chemicals at the beginning of 1992 with total employment at the end of 2010 and projected employ-ment in 2030 if these trends continue. These job losses would occur despite expec-tations that global production of chemicals will expand by 4.5 percent on average each year over the next decade.9 In addition, Figure 3 shows the state-by-state distribu-tion of jobs losses by 2030.10 As we show in this report, the successful development of a greener and safer chemical industry will counteract these job losses.

12 The Economic Benefits of a Green Chemical Industry in the United States
2B) MARKETS FOR U.S. CHEMICAL PRODUCTS
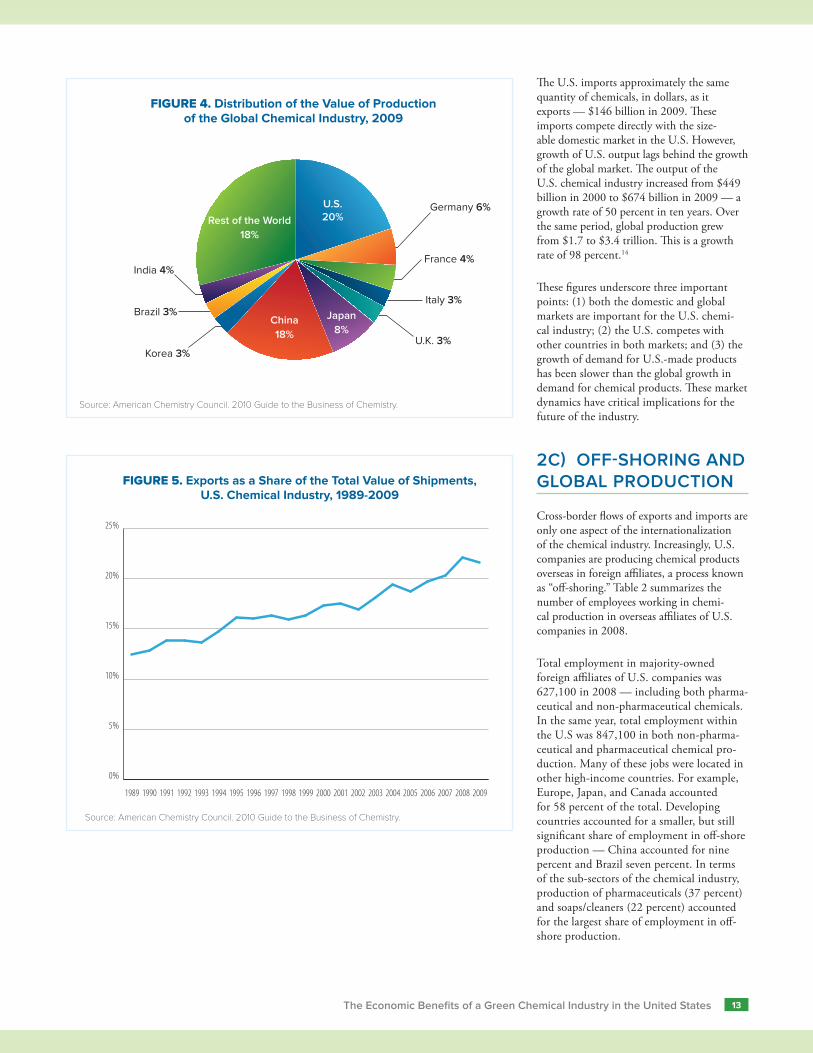
The value of the output of the U.S. chemical industry totaled $674 billion — about 20 percent of world production.11 The value of output has been growing at an aver-age annual rate of over 4 percent since 1992.12 The U.S. remains the world’s largest producer of chemical products, closely fol-lowed by China. Exports comprised $145 billion of the total $674 billion (or about 22 percent), with the remaining $529 billion being sold domestically. The U.S. is the world’s second largest exporter of chemi-cal products, after Germany. Other major exporters include France, Belgium, Japan, and China. Beginning in 2006, exports from China exceeded those from Japan, making China the largest exporter in Asia.13 Figure 4 shows the distribution of the value of global chemical production.
It is important to recognize that export mar-kets have become increasingly important to the U.S. chemical industry over the past two decades. Figure 5 shows exports as a share of total shipments for U.S. producers from 1989 to 2009. Exports as a share of output have risen from just over 12 percent in 1989 to roughly 22 percent in 2009.
FIGURE 3. Job Losses in Non-Pharmaceutical Chemicals by State, 2030, ‘Business as Usual Scenario’
Source: See text and endnotes. Job losses are relative to the average level of employment in 2009.
0
5,000
10,000
15,000
20,000
25,000
30,000
35,000
Texa
sOh
ioCa
liforn
iaIlli
nois
New
Jerse
yNe
w Yo
rkTe
nnes
see
Louis
iana
Penn
sylva
niaNo
rth Ca
rolina
Mich
igan
Sout
h Caro
lina
Georg
iaFlo
rida
Miss
ouri
Virgin
iaKe
ntuc
kyW
iscon
sinInd
iana
Wes
t Virg
inia
Alab
ama
Mas
sach
usett
sIow
aM
innes
ota
Conn
ectic
utM
aryla
ndM
ississ
ippi
Kans
asAr
kans
asUt
ahNe
bras
kaAr
izona
Was
hingt
onCo
lorad
oDe
laware
Oreg
onOk
lahom
aIda
hoRh
ode I
sland
Wyo
ming
Sout
h Dak
ota
New
Ham
pshir
eVe
rmon
tNe
vada
New
Mex
icoM
ontan
aM
aine
North
Dak
ota
Hawa
iiAl
aska
–
100,000
200,000
300,000
400,000
500,000
600,000
700,000
800,000
900,000
Projected 2030December 2010January 1992
807,200
503,900
271,000
FIGURE 2. Non-Pharmaceutical Chemical Employment, Actual and Projected Jobs (1992, 2010, and 2030)
Source: U.S. Bureau of Labor Statistics. For 2030 projections, see text.
13The Economic Benefits of a Green Chemical Industry in the United States
Germany 6%
France 4%
Italy 3%
U.K. 3%Korea 3%
Brazil 3%
India 4%
Japan8%
U.S.20%
China18%
Rest of the World18%
Source: American Chemistry Council. 2010 Guide to the Business of Chemistry.
FIGURE 4. Distribution of the Value of Productionof the Global Chemical Industry, 2009
The U.S. imports approximately the same quantity of chemicals, in dollars, as it exports — $146 billion in 2009. These imports compete directly with the size-able domestic market in the U.S. However, growth of U.S. output lags behind the growth of the global market. The output of the U.S. chemical industry increased from $449 billion in 2000 to $674 billion in 2009 — a growth rate of 50 percent in ten years. Over the same period, global production grew from $1.7 to $3.4 trillion. This is a growth rate of 98 percent.14
These figures underscore three important points: (1) both the domestic and global markets are important for the U.S. chemi-cal industry; (2) the U.S. competes with other countries in both markets; and (3) the growth of demand for U.S.-made products has been slower than the global growth in demand for chemical products. These market dynamics have critical implications for the future of the industry.
2C) OFF-SHORING AND GLOBAL PRODUCTION
Cross-border flows of exports and imports are only one aspect of the internationalization of the chemical industry. Increasingly, U.S. companies are producing chemical products overseas in foreign affiliates, a process known as “off-shoring.” Table 2 summarizes the number of employees working in chemi-cal production in overseas affiliates of U.S. companies in 2008.
Total employment in majority-owned foreign affiliates of U.S. companies was 627,100 in 2008 — including both pharma-ceutical and non-pharmaceutical chemicals. In the same year, total employment within the U.S was 847,100 in both non-pharma-ceutical and pharmaceutical chemical pro-duction. Many of these jobs were located in other high-income countries. For example, Europe, Japan, and Canada accounted for 58 percent of the total. Developing countries accounted for a smaller, but still significant share of employment in off-shore production — China accounted for nine percent and Brazil seven percent. In terms of the sub-sectors of the chemical industry, production of pharmaceuticals (37 percent) and soaps/cleaners (22 percent) accounted for the largest share of employment in off-shore production.
0%
5%
10%
15%
20%
25%
200920082007200620052004200320022001200019991998199719961995199419931992199119901989
FIGURE 5. Exports as a Share of the Total Value of Shipments,U.S. Chemical Industry, 1989-2009
Source: American Chemistry Council. 2010 Guide to the Business of Chemistry.

14 The Economic Benefits of a Green Chemical Industry in the United States
Employment in overseas affiliates of U.S. companies is partially off-set by employment in U.S.-based affiliates of foreign companies. In 2008, an estimated 305,800 employees had jobs in affiliates of foreign chemical companies operating in the U.S. Most all of these affiliates were associated with parent companies in high-income countries. The difference in employment in U.S. affili-ates abroad (627,100) and employment in foreign affiliates in the U.S. (305,800) is 321,300 jobs.15
2D) THE MAJOR SECTORS WITHIN THE CHEMICAL INDUSTRY
The chemical industry is diverse, producing a wide range of products. These products oper-ate within a variety of industrial and market dynamics. It is therefore useful to discuss broad product categories within the chemical industry. Five general categories are particu-larly important:
• Commodity chemicals
• Specialty chemicals
• Pharmaceuticals
• Agricultural chemicals
• Consumer products produced directly by the chemical industry
Figure 6 shows the share of total output for each of these five categories. Note that this section refers only to the chemical industry itself and does not include the closely related industrial sectors that manufacture petroleum and plastic products.
With regard to non-pharmaceutical chemi-cals, the two most significant categories are commodity chemicals and specialty chemicals. Commodity chemicals, some-times called basic chemicals, are produced in large volumes and sold in bulk as inputs into other industrial processes. They account for the majority of chemical production in the U.S. and many of these substances have been manufactured in essentially the same form for decades. Commodity chemicals are homogenous in nature — there is little
scope for product differentiation. Com-modity chemical markets are competitive and firms producing commodity chemicals compete on the basis of price, productivity, and input costs.
The two major categories of commod-ity chemicals are inorganic chemicals and petrochemicals, including organic chemicals derived from petrochemicals.16 Inorganic chemicals are based on metals and minerals which do not contain carbon as a core ele-ment. Examples of major inorganic com-modity chemicals include chlorine, sodium hydroxide, hydrogen peroxide, and sodium carbonate. Carbon is the critical element in organic chemicals, the bulk of which are currently derived from petroleum and natural gas, but also other carbon-based resources, such as coal. Organic commodity chemicals are important inputs into the production of various plastics, resins, synthetic fibers, and other polymers.
In contrast to commodity chemicals, specialty chemicals are produced in smaller batches and are often custom-designed for specific industrial uses. The scope for prod-uct differentiation is greater for specialty chemicals. Mark-ups are higher for specialty chemicals, and producers of these products invest significantly more in sales, marketing, and customer service than do producers in commodity chemical markets — i.e. spe-cialty chemicals have higher profit margins than commodity chemicals.17 Competitive-ness is based on a number of factors in addi-tion to production costs. Specialty chemicals typically have a shorter product lifecycle than commodity chemicals and there is generally greater scope for innovation and introducing new products. Although the potential for product differentiation and mark-ups is greater for specialty chemicals, the markets remain competitive and cost-cutting is an important component to the overall competitive dynamic. Examples of specialty chemicals include catalysts, indus-trial cleaners, chemicals used in electronic applications, flavorings, food additives, and special coatings and adhesives.
Agricultural chemicals account for just 5 percent of U.S. chemical production. The two main categories of agricultural chemicals are fertilizers and pesticides. Agricultural chemicals can also be divided into commodity and specialty products. In many respects, agricultural chemicals are not greatly dissimilar from other broad categories of chemicals. But since they are
TABLE 2. Employment in Majority-Owned Foreign Affiliates of U.S. Companies, (2008).
BY COUNTRY/REGION
(a) Country/region Employment % of total
Europe 298,500 48%
Canada 38,000 6%
Mexico 32,000 5%
Japan 26,200 4%
Brazil 42,000 7%
China 56,000 9%
India 18,700 3%
Other 115,700 18%
Total 627,100 100%
BY SEGMENT OF INDUSTRY
(b) Segment Employment % of total
Basic chemicals 75,800 12%
Resins and synthetic fibers 64,200 10%
Pharmaceuticals 234,100 37%
Soap and cleaning products 135,000 22%
Pesticides & fertilizers 13,400 2%
Paint and adhesives 49,000 8%
Other 55,600 9%
Total 627,100 100%
Source: Bureau of Economic Analysis.

15The Economic Benefits of a Green Chemical Industry in the United States
used in food production, they are subject to a distinct set of regulations.18
Many of the outputs of the chemical industry find their way into a wide range of consumer products. Although the bulk of chemical products are intermediate inputs used by other sectors, the chemical industry itself produces a number of consumer products, including soaps, cleaning products, plastic wraps, body care products, insulation, glues, paints, and cosmetics. Like specialty chemi-cals, product differentiation and marketing are important dimensions of competitive market dynamics for consumer chemical products.
2E) SAFER AND GREENER CHEMISTRY
Green chemistry refers to the design, production, and use of chemical products that reduce or eliminate substances harm-ful to human health and the environment, and which can be produced in a sustainable way.19 Paul Anastas, whose pioneering work helped to establish the principles of green chemistry, describes the core concept of green chemistry in this way: “what green chemistry is all about, at its heart, is the redesign of ... the material that is the basis of our society and our economy.”20 For the purposes of this report, the ultimate goals of this redesign of the material basis of our economy are (a) to reduce the costs, often unrecognized, associated with the existing set of products and production practices, and (b) to develop innovative new products for driving the economy forward. The costs include health problems, unsafe workplaces, handling of wastes and harmful substances, disposal of by-products, waste, and products which have reached the end of their useful life, and environmental degradation associated with the production and use of chemical products. Formal definitions exist which describe the discipline and practice of green chemistry more precisely. 21 In this report, we consider a range of chemical manufacturing activities whose processes and products are safer, more sustainable, and less harmful.
Where does green chemistry fit into the overall structure of the chemical industry? More sustainable and less toxic products and processes cut across the traditional divisions within the chemical industry, and reflect the wide range of products which are currently produced. Examples include:
• The building blocks of plastics and synthetic fibers, derived from renewable biomass, not only petrochemicals.
• Specialty catalysts that reduce hazard-ous waste and improve the efficiency of chemical production processes.
• Safer additives to food and plastics and less polluting industrial cleaners.
• Safer pesticides and crop protection products.
• Household cleaners, personal care prod-ucts, and cosmetics that exclude poten-tially hazardous substances.
In terms of official economic and employ-ment statistics, the concept of a ‘green chemical’ sector is evolving and it is currently difficult to know with any certainty the size of these activities relative to the economy as a whole, or how fast these products, taken together, have been growing. However, as we document later in the report, there are numerous areas of green chemistry which already have been growing rapidly, creating new opportunities for the future.
The focus on greener and safer chemicals does not imply that these attributes are the only ones which are important. The performance of alternatives must be comparable to the traditional substances that they replace. Traditional chemicals are used because they
are functional — both economically and technically. Green alternatives must meet these same standards.
Regardless of the current size of sustainable chemical production, the potential for the future development in this area to under-gird the competiveness of the U.S. chemical industry is clear. The development of this sector could help sustain U.S. manufactur-ing into the 21st century while preventing the further erosion of good quality jobs. A failure to develop the country’s potential with regard to green chemistry will mean that U.S. firms will have less and less access to overseas markets as other countries adopt up-to-date regulatory frameworks. Moreover, the shift towards alternative approaches to chemical manufacturing will reduce toxic releases, lower health risks, decrease reliance on non-renewable resources, and improve our quality of life without compromising economic performance. These are the issues we explore in the remaining sections of this study.
Agriculturalchemicals
5%
Consumer products
12%Pharmaceuticals
28%
Commoditychemicals
38%
Specialtychemicals
17%
Source: American Chemistry Council. 2010 Guide to the Business of Chemistry.
FIGURE 6. Major Segments of the Chemical Industry, Shares of Total Output. 2009

16 The Economic Benefits of a Green Chemical Industry in the United States
The U.S. chemical industry faces numerous challenges. These include volatile input costs, changing consumer markets, new regulations, and a competitive global environment. In this context, environmentally sustainable and safer chemical products present the industry with a variety of economic opportunities. These are possibilities which could help secure the future of the chemical industry in the years to come. If the U.S. is successful in taking advantage of these opportunities, it would help sustain quality manufacturing jobs.
3A) NEW MARKET OPPORTUNITIES
There are a number of drivers behind the emerging opportunities in green chemicals:
Demand-driven: Purchasers of chemical products and products containing chemicals are increasingly demanding safer and more sustainable products. These buyers include final consumers, but perhaps more important are the new demands arising from down-stream users — larger retailers, manufacturers of consumer products, and the construction industry. As the regulatory environment changes, users of chemical products will be more informed of the hazard and safety pro-files of the products they purchase, changing market dynamics in important ways.
Cost-driven: Of all the chemical substances produced in the U.S. every day, the vast majority rely on fossil fuels as a fundamental input.22 The future price trajectory for fossil fuels is uncertain, but is almost certain to rise significantly in the medium to long run. In the meantime, heightened volatility in the crude oil and natural gas markets has imposed significant costs on the indus-try, making production and supply chain management more difficult. Diversifying the industry’s input base to use more renewable resources will improve risk management and strengthen competitiveness in the long run.
Market creation through innovation: Despite the existence of large corporate play-ers, global markets for chemical products are generally highly competitive. Sustaining mar-ket share by relying on older technologies and standardized products will not be a winning strategy for U.S. firms in the future. There is enormous scope for innovation in the area of green chemistry, with new products creating new market opportunities.
3B) SPECIFIC CASES OF NEW MARKET OPPORTUNITIES
To illustrate how these new market oppor-tunities are emerging, we briefly look at five examples: bioplastics, building materials, flame retardants, healthcare and personal care.
Bioplastics. Plastic materials and products are produced from polymers, or molecules composed of repeating chemical units. The vast majority of polymers used to produce plastics are derived from bulk petrochemicals, such as ethylene, propylene, and benzene. However, the polymers used to produce plastics and resins can also be derived from renewable biomass. In addition to relying on renewable instead of non-renewable resources, bioplastics provide a substitute for plastics with toxic footprints, such as polyvinyl chloride. Although bioplastics and bioresins currently account for a small fraction of the overall plastics market, their growth potential is significant.23 A recent study from Utrecht University in the Neth-erlands finds that bio-based polymers could technically substitute for up to 90 percent of the polymers currently in use that are derived from petrochemicals.24 The same study esti-mates that the production of bioplastics will grow at approximately 37 percent per year until 2013 and at a rate of 6 percent between 2013 and 2020.
3.OPPORTUNITIES AND CHALLENGES
Major new opportunities currently exist in developing alternatives to traditional chemical products. Examples of fast-growing markets include:
• Bio-plastics
• Building materials
• Flame retardants
• Healthcare
• Personal care and household cleaners
The regulatory environment is shifting with implications for U.S. competitiveness and access to global markets:
• New REACH regulations in the European Union
• Similar developments in other countries, such as Canada and China
• State-level laws to regulate toxic substances
Reform of the Toxic Substances Control Act is essential to modernize the regulatory environment for the chemical industry.
17The Economic Benefits of a Green Chemical Industry in the United States
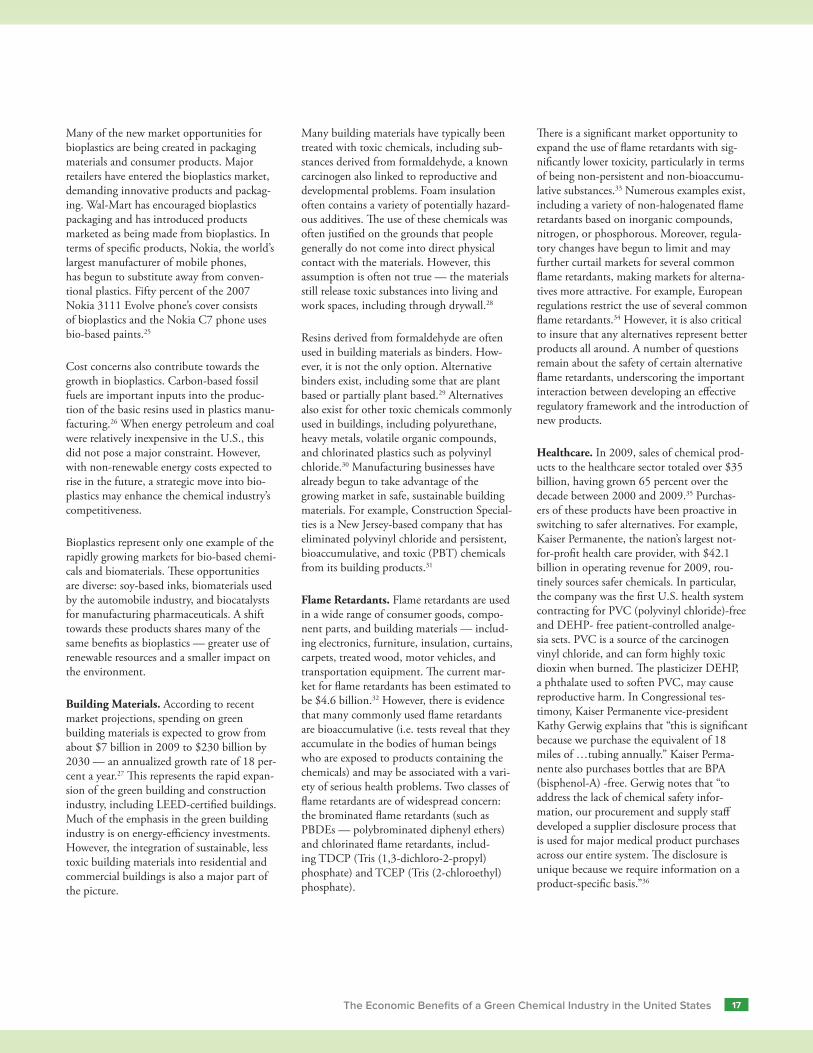
OPPORTUNITIES AND CHALLENGES Many of the new market opportunities for bioplastics are being created in packaging materials and consumer products. Major retailers have entered the bioplastics market, demanding innovative products and packag-ing. Wal-Mart has encouraged bioplastics packaging and has introduced products marketed as being made from bioplastics. In terms of specific products, Nokia, the world’s largest manufacturer of mobile phones, has begun to substitute away from conven-tional plastics. Fifty percent of the 2007 Nokia 3111 Evolve phone’s cover consists of bioplastics and the Nokia C7 phone uses bio-based paints.25
Cost concerns also contribute towards the growth in bioplastics. Carbon-based fossil fuels are important inputs into the produc-tion of the basic resins used in plastics manu-facturing.26 When energy petroleum and coal were relatively inexpensive in the U.S., this did not pose a major constraint. However, with non-renewable energy costs expected to rise in the future, a strategic move into bio-plastics may enhance the chemical industry’s competitiveness.
Bioplastics represent only one example of the rapidly growing markets for bio-based chemi-cals and biomaterials. These opportunities are diverse: soy-based inks, biomaterials used by the automobile industry, and biocatalysts for manufacturing pharmaceuticals. A shift towards these products shares many of the same benefits as bioplastics — greater use of renewable resources and a smaller impact on the environment.
Building Materials. According to recent market projections, spending on green building materials is expected to grow from about $7 billion in 2009 to $230 billion by 2030 — an annualized growth rate of 18 per-cent a year.27 This represents the rapid expan-sion of the green building and construction industry, including LEED-certified buildings. Much of the emphasis in the green building industry is on energy-efficiency investments. However, the integration of sustainable, less toxic building materials into residential and commercial buildings is also a major part of the picture.
Many building materials have typically been treated with toxic chemicals, including sub-stances derived from formaldehyde, a known carcinogen also linked to reproductive and developmental problems. Foam insulation often contains a variety of potentially hazard-ous additives. The use of these chemicals was often justified on the grounds that people generally do not come into direct physical contact with the materials. However, this assumption is often not true — the materials still release toxic substances into living and work spaces, including through drywall.28
Resins derived from formaldehyde are often used in building materials as binders. How-ever, it is not the only option. Alternative binders exist, including some that are plant based or partially plant based.29 Alternatives also exist for other toxic chemicals commonly used in buildings, including polyurethane, heavy metals, volatile organic compounds, and chlorinated plastics such as polyvinyl chloride.30 Manufacturing businesses have already begun to take advantage of the growing market in safe, sustainable building materials. For example, Construction Special-ties is a New Jersey-based company that has eliminated polyvinyl chloride and persistent, bioaccumulative, and toxic (PBT) chemicals from its building products.31
Flame Retardants. Flame retardants are used in a wide range of consumer goods, compo-nent parts, and building materials — includ-ing electronics, furniture, insulation, curtains, carpets, treated wood, motor vehicles, and transportation equipment. The current mar-ket for flame retardants has been estimated to be $4.6 billion.32 However, there is evidence that many commonly used flame retardants are bioaccumulative (i.e. tests reveal that they accumulate in the bodies of human beings who are exposed to products containing the chemicals) and may be associated with a vari-ety of serious health problems. Two classes of flame retardants are of widespread concern: the brominated flame retardants (such as PBDEs — polybrominated diphenyl ethers) and chlorinated flame retardants, includ-ing TDCP (Tris (1,3-dichloro-2-propyl) phosphate) and TCEP (Tris (2-chloroethyl) phosphate).
There is a significant market opportunity to expand the use of flame retardants with sig-nificantly lower toxicity, particularly in terms of being non-persistent and non-bioaccumu-lative substances.33 Numerous examples exist, including a variety of non-halogenated flame retardants based on inorganic compounds, nitrogen, or phosphorous. Moreover, regula-tory changes have begun to limit and may further curtail markets for several common flame retardants, making markets for alterna-tives more attractive. For example, European regulations restrict the use of several common flame retardants.34 However, it is also critical to insure that any alternatives represent better products all around. A number of questions remain about the safety of certain alternative flame retardants, underscoring the important interaction between developing an effective regulatory framework and the introduction of new products.
Healthcare. In 2009, sales of chemical prod-ucts to the healthcare sector totaled over $35 billion, having grown 65 percent over the decade between 2000 and 2009.35 Purchas-ers of these products have been proactive in switching to safer alternatives. For example, Kaiser Permanente, the nation’s largest not-for-profit health care provider, with $42.1 billion in operating revenue for 2009, rou-tinely sources safer chemicals. In particular, the company was the first U.S. health system contracting for PVC (polyvinyl chloride)-free and DEHP- free patient-controlled analge-sia sets. PVC is a source of the carcinogen vinyl chloride, and can form highly toxic dioxin when burned. The plasticizer DEHP, a phthalate used to soften PVC, may cause reproductive harm. In Congressional tes-timony, Kaiser Permanente vice-president Kathy Gerwig explains that “this is significant because we purchase the equivalent of 18 miles of …tubing annually.” Kaiser Perma-nente also purchases bottles that are BPA (bisphenol-A) -free. Gerwig notes that “to address the lack of chemical safety infor-mation, our procurement and supply staff developed a supplier disclosure process that is used for major medical product purchases across our entire system. The disclosure is unique because we require information on a product-specific basis.”36

18 The Economic Benefits of a Green Chemical Industry in the United States
Personal Care and Household Products. Around the world, one of the fastest grow-ing segments of the personal care product market is natural and organic products, with recent annual increases in sales of up to 20 percent.37 Procter & Gamble (P&G) was an early leader in taking advantage of these market trends and provides a number of examples of emerging opportunities. As early as the 1990s, Procter & Gamble began substituting away from PVC (polyvinyl chloride) and now uses PVC in only 1.5 percent of its plastic packaging.38 P&G’s chemicals division has worked with other companies to develop new solvents that reduce volatile organic compounds in glossy paint.39 In terms of personal care products, P&G also reformulated the Herbal Essence shampoo line to reduce its concentra-tion of 1,4-dioxane, which is potentially harmful to the nervous system, liver, and kidneys.40 Other companies have taken steps to improve consumer awareness and help consumers make better choices. Seventh Generation, one of the leading green house-hold product innovators, has developed a web-based label reading guide. Users can download the guide to their computer or mobile phone, search ingredient names used in cleaning products, and receive informa-tion on ingredient uses and environmental health risks.41 Seventh Generation also requires its suppliers to adopt techniques to reduce toxicity levels.42
Although the totality of all the market oppor-tunities emerging from sustainable chemistry initiatives are hard to assess due to limited data and the evolving nature of these activi-ties, a range of sectors — healthcare, personal products, building materials, and consumer products — offer snapshots of strong growth potential that creates a composite picture of a new approach to chemical production that has the potential to reverse the nega-tive employment trends in the industry. This potential has already begun to be realized in states like California, which prioritized the development of a green chemical industry. However, to capture that potential, the U.S. needs to catch up with changes happening elsewhere in the world, reform how chemicals are regulated, and improve the information that is available to the public.
3C) AN EVOLVING REGULATORY ENVIRONMENT
The regulations governing the production and distribution of so-called industrial chemicals43 and associated chemical products in the U.S. have not kept up with the times. The Toxic Substances Control Act (TSCA) became federal law in 1976 and gave the Environmental Protection Agency (EPA) limited authority to regulate the develop-ment and introduction of chemicals into the marketplace. However, the ability of the EPA to actively oversee the development and marketing of chemicals is constrained. TSCA grandfathered in about 62,000 chemicals which were in use prior to 1979 when the first inventory of chemicals under TSCA was compiled.44 The information available
on these chemicals is limited or non-existent and the vast majority remain unregulated. Under TSCA, the chemical industry is not routinely required to generate information on the potential hazards of its products before introducing them into the market place. Moreover, chemical companies can request exemptions from the limited information requirements that do exist for newly intro-duced chemicals.45
Some products of the chemical industry — notably pharmaceuticals, food additives, and pesticides — are regulated under laws other than TSCA. Nevertheless, a large share of the industry’s output is only weakly regulated. For example, since TSCA was introduced, the EPA has required testing on less than 300 of the 62,000 chemicals that were grandfathered in under the legislation, and has regulated only five to some extent.46
Green Chemistry: Economic Growth and Job Creation in California
The State of California has made the strategic decision to prioritize the development of a green chemistry industry. It has done so through a number of legislative measures: creating an online toxic information clearinghouse to provide residents with information on known hazards of chemicals widely in use; strengthening the role of the California Environmental Protection Agency to regulate toxic substances; and launching a Green Chemistry Initiative in the state. During a presentation at the conference Green Chemistry: Collaborative Approaches and New Solutions, held at the University of California, Berkeley, in March 2011, state Senator Joe Simitian gave examples of the economic and employment impacts that green chemistry already has had in California:
• Klean Kanteen, a water bottle company based in Chico, California, intro-duced stainless steel alternatives to plastic water bottles. In just one year, from 2007 to 2008, employment at the company increased by a factor of six.
• A San Francisco-based company that manufacturers cleaning products, Method, launched a non-toxic, biodegradable product line in 2000. By 2007, it was ranked the seventh fastest growing company in America by INC magazine.
• Computer giants Hewlett-Packard and Apple, operating in the Bay Area, have required suppliers to eliminate substances of concern, such as bromi-nated flame retardants, in their products. By doing so, they maintain access to global markets.
• The pharmaceutical company, Pfizer, a major employer in La Jolla, California, used the principles of green chemistry to reduce the amount of solvent used in the production of the antidepressant Zoloft by 90 percent — cutting costs while reducing hazardous waste.
Source: Webcast of Senator Simitian’s comments during the conference, Green Chemistry: Collaborative Approaches and New Solutions, University of California, Berkeley, March 24, 2011.

19The Economic Benefits of a Green Chemical Industry in the United States
Recently, the regulatory environment has begun to change in other areas of the world. One of the most significant changes has been the introduction of a new regulatory framework in the European Union, known as REACH (Registration, Evaluation, Authori-zation and Restriction of Chemical Sub-stances).47 REACH went into effect in 2007 and its provisions will be progressively rolled out over an 11-year period.48
The REACH regulation reflects a number of fundamental differences with TSCA. REACH requires chemical companies to develop and disclose more information on the health and environmental effects of their products. The data requirements vary with the level of production. That is, a chemical that is produced in larger volumes will have to perform a larger number of tests than a newly introduced product with very limited production. REACH applies to both new and existing chemicals; its requirements are phased in for existing chemicals.
In addition, for certain “substances of very high concern” designated by government as subject to authorization — including persistent, bioaccumulative and toxic (PBT) chemicals — their use is prohibited unless specifically authorized. To continue the use of such chemicals, companies must demonstrate that there are no feasible alternatives and that the social and economic benefits outweigh the costs. In some cases, “substances of very high concern” can be authorized simply by demonstrating adequate control.
Perhaps most fundamentally, REACH repre-sents a new philosophy of chemical regula-tion. The U.S. regulatory framework requires the regulator, the EPA, to demonstrate that chemicals will cause “unreasonable” risk and, if the EPA is able to show that unreasonable risks exist, to choose a regulatory approach which is the least burdensome to the indus-try.49 The concept of “unreasonable risk” applies a cost-benefit standard as opposed to a health-based standard. In contrast, REACH requires the chemical industry to demonstrate that “adequate control” can be achieved over the risks associated with their products.
Although the REACH regulation does not directly apply within the U.S., it has important implications for U.S. chemical companies. REACH does apply to all the member countries of the European Union. As we have seen, Europe remains an important export market for the U.S. chemical industry
and they must comply with REACH in order to export to the E.U. In addition, under REACH, consumers will have access to more information about the potentially harmful effects of chemical products. Although the disclosure requirements only apply within the E.U., the information on the properties of a wide range of chemicals will become more widely available. Organizations working to improve the safety of chemical products sold in the U.S. will use this information to better inform consumers of the properties of the products they buy, changing the competitive dynamics of the domestic market.
Similar changes are underway in other coun-tries. For example, Canada has recently made changes to the way the country regulates chemicals. The Canadian Environmental Protection Act, in 1999, required the govern-ment to conduct a review of all chemicals on its inventory — called the Domestic Sub-stances List — to identify potentially toxic or high-exposure chemicals. More hazardous substances would be subject to further assess-ment and, potentially, regulatory require-ments. Once the review of the Domestic Substances List was completed in 2006, the government introduced a chemicals manage-ment plan to better address the health and environmental risks posed by toxic chemi-cals.50 Recently, China announced that it will adopt regulations for new chemicals that are in line with the REACH regulation.51 This is particularly notable, since the U.S. chemical industry has been concerned with the rise of China as a major global competitor.
REACH is not the only European regulation that alters the regulatory environment for hazardous substances. The Restriction of Haz-ardous Substances Directive (RoHS), adopted in 2003, prohibits the use of a number of hazardous metals and flame retardants in electrical equipment sold within the EU. The Waste Electrical and Electronic Equipment (WEEE) Directive, which also came into effect in 2003, requires electronics manufac-turers to set up systems to recycle and manage waste from obsolete electronic equipment.52 Since Europe is a significant market for elec-tronics products produced by U.S. companies, these directives have already had an impact on the materials used in the production of electronic products beyond the European market.53 European Union regulations also banned approximately 1,100 chemicals from cosmetic products and this initiative has been used in consumer campaigns to push for the elimination of these substances from similar products sold in the U.S.54
Not all the legislative changes have taken place overseas. Faced with outdated federal legislation, many states have taken the initia-tive themselves and established their own policies. A recent review of these legislative changes, Healthy States: Protecting Families from Toxic Chemicals while Congress Lags Behind, by Mike Belliveau, found that 18 states passed over 70 chemical safety laws in the eight years leading up to the end of 2010 with broad bipartisan support.55 Many of these laws were focused on specific chemicals, often with an emphasis on children’s exposure to potential toxins. However, in some cases, states adopted more comprehensive reforms with regard to chemicals regulation. The report cites four notable cases: California, Maine, Minnesota, and Washington.
In short, the movement for stronger regula-tions has been gaining momentum in recent years, after having been stagnant for decades. Countries other than the U.S. are now setting the rules of the game and individual states within the U.S. are filling the vacuum left by federal government inaction. The end result is a rapidly evolving environment for the chemical industry. These institutional changes underscore the important market opportuni-ties that are emerging for environmentally sustainable, non-toxic chemical products.
3D) PROPOSED REFORMS TO THE TOXIC SUBSTANCES CONTROL ACT OF 1976
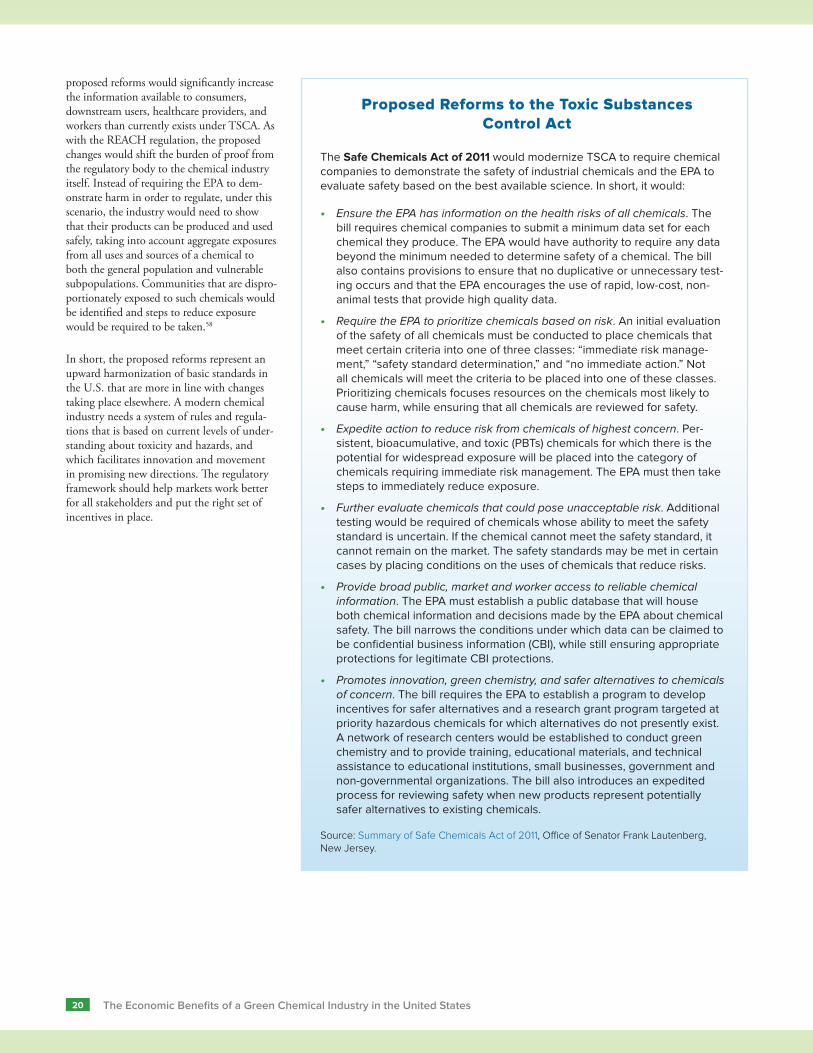
On April 14, Senator Frank Lautenberg of New Jersey introduced the Safe Chemicals Act of 2011. This bill, along with the Toxic Chemicals Safety Act of 2010 (H.R. 5820), which was introduced by Reps. Bobby Rush and Henry Waxman in the House of Representatives,56 represent efforts to update TSCA in accord with modern realities and provide roadmaps for important regulatory reforms (See “Proposed Reforms to the Toxic Substances Control Act”).57
The bills would require chemical companies to submit, within a reasonable time period after enactment, a minimum set of basic data on all chemicals produced, which would include information on characteristics of the substances in question, their uses and poten-tial exposures, and any potential hazards with regard to health and safety. Most of this basic information would be made public and the
20 The Economic Benefits of a Green Chemical Industry in the United States
proposed reforms would significantly increase the information available to consumers, downstream users, healthcare providers, and workers than currently exists under TSCA. As with the REACH regulation, the proposed changes would shift the burden of proof from the regulatory body to the chemical industry itself. Instead of requiring the EPA to dem-onstrate harm in order to regulate, under this scenario, the industry would need to show that their products can be produced and used safely, taking into account aggregate exposures from all uses and sources of a chemical to both the general population and vulnerable subpopulations. Communities that are dispro-portionately exposed to such chemicals would be identified and steps to reduce exposure would be required to be taken.58
In short, the proposed reforms represent an upward harmonization of basic standards in the U.S. that are more in line with changes taking place elsewhere. A modern chemical industry needs a system of rules and regula-tions that is based on current levels of under-standing about toxicity and hazards, and which facilitates innovation and movement in promising new directions. The regulatory framework should help markets work better for all stakeholders and put the right set of incentives in place.
Proposed Reforms to the Toxic Substances Control Act
The Safe Chemicals Act of 2011 would modernize TSCA to require chemical companies to demonstrate the safety of industrial chemicals and the EPA to evaluate safety based on the best available science. In short, it would:
• Ensure the EPA has information on the health risks of all chemicals. The bill requires chemical companies to submit a minimum data set for each chemical they produce. The EPA would have authority to require any data beyond the minimum needed to determine safety of a chemical. The bill also contains provisions to ensure that no duplicative or unnecessary test-ing occurs and that the EPA encourages the use of rapid, low-cost, non-animal tests that provide high quality data.
• Require the EPA to prioritize chemicals based on risk. An initial evaluation of the safety of all chemicals must be conducted to place chemicals that meet certain criteria into one of three classes: “immediate risk manage-ment,” “safety standard determination,” and “no immediate action.” Not all chemicals will meet the criteria to be placed into one of these classes. Prioritizing chemicals focuses resources on the chemicals most likely to cause harm, while ensuring that all chemicals are reviewed for safety.
• Expedite action to reduce risk from chemicals of highest concern. Per-sistent, bioacumulative, and toxic (PBTs) chemicals for which there is the potential for widespread exposure will be placed into the category of chemicals requiring immediate risk management. The EPA must then take steps to immediately reduce exposure.
• Further evaluate chemicals that could pose unacceptable risk. Additional testing would be required of chemicals whose ability to meet the safety standard is uncertain. If the chemical cannot meet the safety standard, it cannot remain on the market. The safety standards may be met in certain cases by placing conditions on the uses of chemicals that reduce risks.
• Provide broad public, market and worker access to reliable chemical information. The EPA must establish a public database that will house both chemical information and decisions made by the EPA about chemical safety. The bill narrows the conditions under which data can be claimed to be confidential business information (CBI), while still ensuring appropriate protections for legitimate CBI protections.
• Promotes innovation, green chemistry, and safer alternatives to chemicals of concern. The bill requires the EPA to establish a program to develop incentives for safer alternatives and a research grant program targeted at priority hazardous chemicals for which alternatives do not presently exist. A network of research centers would be established to conduct green chemistry and to provide training, educational materials, and technical assistance to educational institutions, small businesses, government and non-governmental organizations. The bill also introduces an expedited process for reviewing safety when new products represent potentially safer alternatives to existing chemicals.
Source: Summary of Safe Chemicals Act of 2011, Office of Senator Frank Lautenberg, New Jersey.

21The Economic Benefits of a Green Chemical Industry in the United States
A key argument against reforming the regula-tory framework for the chemical industry is that it will impose excessive costs on the industry and undermine its competitiveness. Given the increasingly global nature of trade in and production of chemical products, including the rising importance of U.S. exports and the large volume of imports, these concerns need to be taken seriously. At the same time, we need to account for all costs associated with the current production system, not just those which the chemical industry bears. Indicators of productivity and efficiency must take into account the handling, storage, and disposal of toxic and unsafe products and by-products. Instead of undermining competition, appropriately designed legislation will support innovation, productivity and competitiveness in the chemical industry itself and in other sectors which rely on chemical products.
4A) THE CURRENT MODEL OF COMPETITIVENESS IN THE CHEMICAL INDUSTRY
This report previously described how the chemical industry operates in relatively com-petitive markets. This is generally true of all non-pharmaceutical chemicals, and competi-tion is particularly strong among producers of commodity chemicals. Cost-cutting is a significant component of the overall competi-tive strategy of the U.S. chemical industry. The poor performance of the industry in creating jobs, even when output is expand-ing, indicates that the industry has increased labor productivity significantly. A central motivation for raising labor productivity is to cut costs — in this case, the labor costs that go into producing a particular quantity of product. The higher the productivity, the less labor is needed in production, reducing overall costs. If higher productivity is not matched with growth in markets, the result
is fewer jobs. This makes the reorientation of the industry to take advantage of emerg-ing market opportunities — such as those promised by green chemistry — particularly critical if the concern is retaining U.S. manu-facturing jobs.
Cost reduction can also be achieved by pass-ing costs onto consumers and users of the products being manufactured. These external costs are particularly high in the chemical industry. They include:
• Cost to consumers of toxic or unsafe products
• Cost to workers who are exposed to haz-ardous substances
• Costs to downstream users, who may have to pay for expensive storage, handling, and disposal systems for handling hazard-ous chemicals
• Costs to the environment, for example, with regard to the release of toxic wastes
When others in the economy, apart from the chemical industry, pay these costs, it improves the competitiveness of the chemical industry. However, passing on costs does not improve the competitiveness of the U.S. economy as a whole. Other companies that use these products face higher costs in terms of handling, storage, and disposal. They also risk losing market share if consumers become aware of the safety profile of their products. Households must pay higher healthcare costs, which places upward pressure on insurance premiums and, for firms that provide health benefits, the cost of paying their employees. Toxic releases degrade the environment and affect the productivity of other sectors of the economy.
The principal costs borne by people exposed to hazardous chemicals are in terms of health and safety. There has been a rise in the incidence of many reproductive disor-ders, developmental problems, and cancers in the U.S., the risks of which have been
4.REGULATORY REFORM AND COMPETITIVENESS
A greener and safer chemical industry enhances competitive-ness throughout the economy:
• It lowers handling, storage, and disposal costs for the chemical industry and down-stream users.
• It cuts wastes by using inputs more efficiently. It also reduces cost pressures in the long run by using fewer non-renewable fossil fuel inputs.
• It allows firms to compete on the basis of consumers’ and downstream users’ demands for safer products.
• It protects shareholder value and creates profitable new investment opportunities.
• It reduces costs to households in terms of healthcare and lost productivity which improve the overall competitiveness of the economy.
Research suggests that environ-mental regulations can promote greater productivity by reducing unwanted by-products, such as toxic emissions, for a given level of production.
Regulatory reforms will provide valuable information which will make markets work better for all stakeholders.

22 The Economic Benefits of a Green Chemical Industry in the United States
linked to exposure to chemical substances.59 Given our current state of knowledge and the lack of information on potential hazards, the increased prevalence of these health problems in the general population cannot always be directly attributed to chemical exposure, but there is significant cause for concern that exposure to toxic substances has far-reaching consequences. Moreover, there is reason to believe these costs have been increasing over time.
The distribution of these costs is uneven, with more vulnerable populations (e.g. children) and communities that are disproportionately exposed to hazardous substances shoulder-ing a larger burden. In terms of children’s health outcomes, chemical exposure has been estimated to play a significant role in 100 percent of the cases of lead poisoning, 10 to 35 percent of asthma cases, 2 to 10 percent of certain cancers, and 5 to 20 percent of neu-rological problems.60 Nursing children have been found to have risked exposure to a range of toxic chemicals in breast milk, includ-ing xylene, dioxins, PCBs (polychlorinated biphenyls), chloroform, and PBDEs (poly-brominated diphenyl ethers).61 The latest report of the President’s Cancer Panel, which focused on environmental factors linked to cancer, emphasized the role that exposure to toxic and hazardous chemicals play in height-ening the probability of developing cancer. The Cancer Panel included the development of green chemistry and safer alternatives in its recommendations for reducing the risks of cancer.62
Chemical exposure also contributes to hazardous workplaces and puts employees at risk for serious health problems. Recent research on occupational health problems in California shows that chemical exposure frequently plays a central role. In terms of deaths that are directly linked to occupational health and safety factors, 80 to 90 percent of cancer deaths, 100 percent of pneumo-coniosis (occupational lung disease) deaths, 40 to 50 percent of deaths associated with neurological disorders, and 40 to 50 percent of deaths associated with renal disorders are attributable to chemical exposures.63
Research has also estimated the cost of chemical exposure at the global level. A study by researchers at the World Health Organization found that, worldwide, an estimated 4.9 million deaths were attribut-able to chemical exposure in 2004.64 The same study estimated that individuals lost a total of 86 million years due to chemical exposure in terms of ill-health, disability, and premature death — a concept known as ‘disability-adjusted life years.’
Even very low-end estimates of the health costs of exposure to hazardous chemicals in the U.S. amount to billions of dollars.65 Such estimates are likely to significantly understate the true costs. This is because studies which estimate the health costs of chemical exposure tend to include only a subset of diseases and medical problems, or focus on a particular population. The extent to which health prob-lems can be attributed to chemical exposure
is uncertain, so studies often make conser-vative assumptions. Finally, the estimates frequently focus on direct health costs and often do not incorporate a broader range of costs — such as the losses, economic and other, associated with premature deaths. We may not be able to pinpoint a dollar value for the health costs of exposure to hazardous substances, but clearly the costs are substan-tial. However, the manufacturers of these products are not the ones paying the bills. As such, the competitiveness of the chemical industry is partly based on the industry’s abil-ity to pass on these costs.
Even if we chose to ignore the substantial external costs of hazardous chemicals, the costs to the chemical industry itself of man-aging the substances used in the production of its products are sizeable. One strategy for improving the industry’s competitiveness would be to reduce these costs through the development of safer, less toxic, and more sustainable alternatives. Table 3 shows the estimated pollution abatement costs for various U.S. manufacturing sectors. The chemical industry has the largest pollution abatement costs of any manufacturing sec-tor — an estimated $5.2 billion in 2005. This represents approximately 25 percent of all the expenditures by U.S. manufacturing firms on pollution abatement. Treatment and disposal activities account for the majority of these expenditures. Greener alternatives would require less treatment and pose fewer disposal problems — with the end result of reducing these costs and improving the competitive-ness of the industry.
4B) ADDITIONAL DIMENSIONS OF COMPETITIVENESS
Reducing costs is only one factor — and often not the most important factor — determining a company’s competitiveness. Consumers respond to more than price, and are increasingly concerned about the characteristics of the products they purchase. Consumers increasingly demand products which are less hazardous and do not have potential long-term health effects. There is a market for products produced in ways that eliminate toxic wastes and reduce environ-mental damage. Pressure from consumers affects firms producing chemical products sold directly to consumers, but also affects firms that use chemical inputs to produce consumer goods. Companies that are able to

23The Economic Benefits of a Green Chemical Industry in the United States
adapt to these changes in consumer demand will be more competitive.
The market for children’s toys provides an illustrative example. The release of toys con-taining toxic substances into the U.S. mar-ketplace has led to expensive recalls and rising consumer awareness.66 For example, in 2007, more than 17 million toys were recalled because they violated lead paint standards. In 2010, over 50,000 pieces of children’s jewelry and 12 million ‘Shrek’ drinking glasses were recalled because these products contained excessive levels of cadmium.67 Concerns over the toxicity of products to which children are routinely exposed has led to the introduc-tion of state-level legislation banning certain substances, such as BPA (bisphenol-A), in children’s products.68 All of these develop-ments have created a market for green toys and children’s products, allowing smaller specialized producers to compete in markets dominated by larger players.69 Clearly, toys are not the only example of markets in which consumers are demanding safer and less toxic products. Numerous other examples could be highlighted, including cosmetics, building materials, organic produce, and food prod-ucts with no or minimal additives.
In some cases, downstream users are develop-ing their own chemical policies in response
to consumer concerns. In 2006, Wal-Mart began to implement its own chemicals policy, which required that many hazardous chemicals not be used in the manufacture of the products it sells.70 Specifically, Wal-Mart has begun to evaluate the chemicals used in products based on the hazards they pose throughout their lifecycle, using a tool called GreenWERCS (Worldwide Environmental Regulatory Compliance Solutions) which allows the company to screen the products it offers for potentially hazardous substances.71 These include probable carcinogens and chemicals linked to developmental and repro-ductive problems. The policy pays particular attention to persistent, bioaccumulative, and toxic (PBT) chemicals. Clearly, Wal-Mart felt that the advantages of adopting an internal chemicals policy outweighed the costs of such a measure in terms of enhancing the company’s own competitive position.
Other companies have adopted similar efforts to manage their supply chains with regard to potentially hazardous and toxic chemicals. SC Johnson, manufacturer of Windex glass cleaner, Ziploc bags, Saran Wrap, and other household products, has introduced a system which provides the developers of its product lines information on the toxicity and hazards associated with the materials used in produc-tion. The company has used this informa-
tion to reformulate its products to increase their safety profile and to change the way it makes sourcing decisions about the inputs it purchases.72
Shareholders may also demand bet-ter environmental performance from the corporations they finance. Poor environ-mental management and a lack of serious environmental innovation can harm long-run profitability and undermine the market value of the firm. This is of particular concern for companies in the chemical industry, many of which are highly dependent on equity financing and must therefore be responsive to shareholders.73 Reputation effects are extremely important in determining the value of intangible assets. A sizeable public relations disaster can cost shareholders billions of dol-lars. The large number of chemicals on U.S. markets with limited information on toxicity and potential hazards represents a significant concern for shareholders who have invested in companies that produce and/or use these products. Access to better information would be of great interest to investors and such access can be guaranteed through appropriate regulatory reforms.
For example, research has shown that there is a positive relationship between good environ-mental performance and the value of a firm.
TABLE 3. Estimated Pollution Abatement Costs By Industry, 2005 ($ in millions).
Sector Total Treatment Prevention Recycling Disposal
Food manufacturing $1,572.8 $859.1 $172.7 $108.0 $433.0
Wood products $566.6 $310.3 $128.3 $31.3 $96.7
Paper manufacturing $1,796.2 $1,072.0 $189.4 $118.6 $416.2
Printing and publishing $238.8 $111.6 $35.9 $35.5 $55.8
Petroleum and coal products $3,746.1 $1,896.2 $1,294.1 $273.6 $282.2
Chemical manufacturing $5,217.2 $2,757.9 $809.6 $417.2 $1,232.5
Plastic products $503.2 $214.0 $79.4 $50.2 $159.6
Non-metallic mineral prod. $696.0 $398.0 $125.6 $50.5 $121.9
Metal manufacturing $2,291.1 $1,238.3 $273.2 $219.3 $560.4
Fabricated metals $763.3 $353.1 $84.1 $92.4 $233.8
Machinery $315.8 $108.4 $49.8 $34.3 $123.2
Computers & electronics $623.8 $338.4 $54.5 $63.9 $167.0
Electrical equipment $190.8 $80.8 $28.6 $20.7 $60.7
Transportation equipment $1,319.1 $592.8 $173.0 $157.3 $396.1
Other sectors $836.8 $431.9 $101.2 $75.5 $227.9
All industries $20,677.6 $10,762.8 $3,599.4 $1,748.3 $4,567.0
Source: Pollution Abatement Costs and Expenditures (U.S. Census Department, 2008).
24 The Economic Benefits of a Green Chemical Industry in the United States
A study by Shameek Konar and Mark Cohen measured environmental performance in two ways: in terms of reported toxic releases from the Toxic Releases Inventory (TRI) and in terms of the number of pending environmen-tal lawsuits.74 Controlling for other factors which determine the value of a firm’s assets, they found that the average firm, with regard to the negative impact of environmental out-comes on the firm’s market value, experienced a reduction in its market value equivalent to nine percent of the replacement value of its assets. For the chemical industry, they estimated the loss in value to be 31.2 percent of the replacement value of assets.
To give a better sense of the magnitude of these effects, it is helpful to translate the percentages into dollar values. The Census Department estimates that the total assets of the non-pharmaceutical chemical industry were valued at approximately $650 billion in the third quarter of 2010.75 Therefore, the reduction in the value of the U.S. chemical industry due to environmental performance, using Konar and Cohen’s estimates, would be over $200 billion. Shareholders have a strong incentive to improve the environmen-tal performance of the industry in order to boost the value of the firms in which they have invested.
4C) ENVIRONMENTAL REGULATIONS AND PRODUCTIVITY
One argument against the implementation of regulations is that they will lower average productivity by diverting resources to meet regulatory requirements. According to this line of reasoning, more resources will be used to produce a given amount of output — in other words, productivity will decline. Lower productivity raises the average costs of production and will ultimately undermine competitiveness. Given the potential negative impact on manufacturing output and employ-ment, it is worth examining these arguments in more detail to see if they really hold.
Productivity is generally defined as the amount of output a firm can produce with a given set of inputs and a given technology. However, this definition will overstate the productivity of the chemical industry when undesired by-products (such as toxic wastes or potential hazards) are produced during the manufacturing process. Therefore, productiv-
ity should be defined in such a way as to take into account the costs of harmful wastes, even if the firm does not pay the full costs of han-dling and safely disposing of these substances. A company that produces the same amount of product with a given amount of inputs, but is able to do so with lower levels of haz-ardous waste, has improved its productivity. But the simple definition of productivity — the amount of product produced relative to inputs used — would show no change in productivity. Similarly, the production of a non-toxic substitute using similar levels of inputs should be construed as a productivity improvement, although it would not show up in traditional measurements.
When productivity is measured properly — that is, to properly account for undesired by-products, or “bads,” as well as “goods” — environmental regulations have been shown to have no negative impact on productivity. A study by Bruce Domazlicky and William Weber of six subsectors of the chemical industry found that environmental regula-tions did not affect productivity growth when the productivity measurement included toxic chemical releases.76 The study estimates productivity changes at a detailed sectoral level for industrial inorganic chemicals, plastics materials and synthetics, pharmaceu-ticals, soaps, cleaners and toilet goods, paints and allied products, and industrial organic chemicals. Productivity was measured taking into account reported toxic releases from the EPA’s Toxic Releases Inventory. In other words, if the subsector were able to maintain the same output and reduce toxic releases using a given level of resources, this would represent a productivity improvement. They then examine whether productivity growth would be affected by the costs associated with controlling pollution. They found no relationship between pollution control and productivity growth in these important sub-sectors of the chemical industry.
Other studies, not specifically focused on the chemical industry, reach similar conclusions. A study of the impact of air pollution regula-tions on oil refineries in Los Angeles com-pared the productivity of refineries subject to pollution regulations in the South Coast Air Basin to firms located elsewhere that were not subject to the regulations.77 Compliance with the regulations required significant invest-ments in capital improvements and the study finds that regulations induced investment in pollution control technologies. Despite the sizeable costs of the investments to ensure compliance, the researchers found that
productivity in the regulated plants increased relative to the productivity of non-regulated plants — even when the productivity measures do not account for the reduction in emissions in the regulated plants. One explanation of this outcome is that regula-tions prompt capital upgrading and adoption of new technologies which enhance, rather than undermine, productivity.
It is important to bear in mind that an import goal of innovations in green chemis-try is to reduce the waste produced dur-ing the manufacturing process. Less waste means that the inputs into production are better utilized. However, striving to “utilize inputs more efficiently” and taking steps to “enhance productivity” are just two different ways of saying the same thing. To the extent that the policy environment facilitates the development of green chemistry, it will also improve productivity.
To sum up: when productivity is properly measured to account for undesired outputs, regulations need not lead to any reduction in productivity growth. Regulations may also improve productivity and competitiveness, if they lead to new investments and tech-nological upgrading. These kinds of capital improvements will be even more likely if regulatory changes are accompanied by pub-lic policies like tax benefits, public subsidies, and efforts to improve access to financing that support up-grading plants and produc-tion facilities.
4D) THE ROLE OF INFORMATION IN PROMOTING MARKET EFFICIENCY
Regulations are not just about efficiency at the level of production. Well-functioning markets also require a good regulatory infra-structure. Agreements need to be enforceable and economic transactions require a legal framework. Markets also work best when information is freely available to both par-ties in a transaction. The lack of adequate information can cause significant market failures and a loss of efficiency. The critical role of information is commonly accepted in economic theory and has been used to shed light on the functioning of product markets, labor markets, and credit markets.78

25The Economic Benefits of a Green Chemical Industry in the United States
The reform proposals for TSCA are primarily aimed at improving the information available on the chemical products used and sold in the U.S. economy. The legislative changes require that more information be made available to downstream users, consumers, workers, and shareholders. Although indi-vidual chemical firms may have an incentive to keep such information to themselves, the disclosure of such information will make the markets for these products work better in the future. In other words, the reforms will improve efficiency.
The current state of the institutions that collect and release information on chemical products sold in the U.S. market is abys-mal. At the federal level, we have already described how the reporting requirements are inadequate and uneven. Reforms at the state level may help fill this gap, but also create a patchwork of regulatory requirements that differ from one state to the next. Internation-ally, the implementation of new standards, such as REACH in the European Union, will make more information available. But these reporting and disclosure requirements do not apply to U.S. markets. There is a real need for reform and upward harmonization of these standards and significant improvements in the information gathering and dissemination infrastructure of the U.S. market for chemical products.
4E) CONFIDENTIAL BUSINESS INFORMATION
In general, greater access to information makes markets work better. But some argue that free access to certain types of information has unintended consequences. For example, a failure to protect intellec-tual property rights is often presumed to compromise competitiveness and economic performance by reducing incentives to invest in new knowledge.79 Chemical companies have stated that if they are required to release information they feel is proprietary, they will be reluctant to invest resources in creating innovative products.80 The argument is that other firms will free-ride on the investment in new product development if sufficiently detailed information were readily available. That is, competitors could simply replicate the products created by other firms rather than developing new products and processes themselves. Chemical companies that take risks to create new products would be put at a competitive disadvantage. They pay the
costs of innovation, but may not reap the full benefits. Under these circumstances, the industry may under-invest in new product development.
However, under the existing system, chemical companies have, in some cases, overused the confidentiality protections which prevent information on chemicals from being released to the public.81 Under TSCA, confidential business information, or CBI, may be dis-closed if the EPA determines it necessary to protect health or the environment against an unreasonable risk. Although the CBI protec-tions under TSCA do not extend to health and safety studies, chemical identities and company names may be eligible. This makes it nearly impossible to respond to potential hazards when the chemical and/or the com-pany producing it cannot be identified due to CBI protections.82 Indeed, under the current system it is frequently presumed that virtually any data could qualify to be considered CBI. In addition, the EPA’s policies and practices with regard to CBI have led to many illegiti-mate claims being made, with no ability for the EPA to effectively police the system.83 For example, the EPA does not always require the companies requesting CBI protections to justify why such a designation is warranted and does not require a review of these claims in order for CBI protections to be renewed.84
The validity of CBI requests fall along a continuum. At the one end, certain informa-tion will clearly warrant CBI protection, specifically in cases when the information clearly represents trade secrets and its release would bring about no public benefit. On the other extreme is information that does not constitute trade secrets in the first place and for which there is no need for protection. The cases in the middle are those in which there is some valid claim to CBI protection but there are also public benefits that could be realized by the disclosure of information. The excep-tion from nondisclosure for health and safety studies under TSCA represents this middle ground. In these cases, a balance needs to be struck between supplying consumers, shareholders, and downstream users with adequate information on the products in question and extending sufficient protection to CBI in order to support competitiveness. This balance can be achieved by designing an appropriate regulatory framework which takes into account both of these concerns. It is not a question of regulation versus no regulation, but rather creating the right set of regulations that supports innovative firms.
For example, protection of CBI should not be automatically granted. Instead, firms should be required to apply for CBI protec-tions and substantiate their requests. Their applications should be subject to a meaning-ful review process. Any protections granted should be for a limited period and companies would need to re-apply once the time has elapsed. CBI protections should not come at the expense of basic guarantees of product safety. Legislation must also define CBI pre-cisely and categorically. This includes specific, well-defined inclusions and exclusions which allow a determination of what constitutes CBI and what does not. A problem with the current system is that almost any type of information can be claimed as CBI. The proposed reforms to TSCA include many of these provisions.85
The REACH legislation in the European Union provides an example of a regulatory system that is already in place and which con-tains provisions to define and protect legiti-mate CBI while requiring greater disclosure of information on potential hazards. REACH automatically treats some types of informa-tion as confidential, including (a) complete details of the chemical’s preparation; (b) the precise ways in which chemicals are pro-duced; (c) detailed information on produc-tion volumes; and (d) business relationships between specific producers and downstream users. If there are immediate hazards to human health or to the environment, REACH allows the European Chemicals Agency to publicly disclose the above types of information, but this would represent an exception, not the general rule.86
REACH generally does not allow CBI protections to apply to (a) safe usage guidelines; (b) information on the physical properties of chemical products, such as boiling points; and (c) the results of health and environmental tests.87
The issues surrounding confidential business information are indicative of a larger set of concerns — that regulations may create perverse incentives which undermine inno-vation. Since innovation is the cornerstone of U.S. competitiveness in manufacturing, this is of particular concern. Therefore, we turn to the question of how regulatory reforms can support innovation, research, and development.
26 The Economic Benefits of a Green Chemical Industry in the United States
One argument against regulations that would require more evaluation and disclosure is that they would impose costs on innova-tive companies and reduce the incentives to develop safer and more sustainable products. Since green chemistry is still in its infancy, the future of these alternatives depends on adequate investment in research and development. The argument against reform is that such regulations will have unintended consequences — they will discourage the very same innovations that are necessary for the field of green, safe, and sustainable chemistry to flourish. Left alone, the chemical industry will take advantage of these profitable opportunities. In contrast, regulation has the potential to squash innovation.
In this section, we evaluate the evidence that regulation hurts innovation. What we find is that appropriate regulation has actually facilitated innovation. TSCA reform can therefore promote the research and develop-ment needed to advance green chemistry. In the absence of such reforms, the U.S. chemical industry may be left behind the rest of the world.
5A) RESEARCH AND DEVELOPMENT IN THE U.S. CHEMICAL INDUSTRY
Throughout much of its industrial history, the U.S. has been a leader in research and development in the chemical industry — particularly during the rapid growth of manufacturing during the final decades of the 19th century and the first two-thirds of the 20th century. Notably, the discipline of ‘chemical engineering’ was invented in the U.S., a prime example of the kind of university-industry linkages which continue to contribute to economically valuable inno-vation. Innovation in the chemical industry has often involved the scaling up of labora-tory research for industrial application. In the
history of innovation in the U.S. chemical industry, petroleum companies played a central role in providing resources to finance research and development, particularly in the development of plastics and polymers.88 The chemical industry continues to rely on industrial sources of research and develop-ment financing.89
The tradition of research and development in the chemical industry is not as evident today as it was in the past. Table 4 shows data on research and development expenditures by U.S. companies and U.S. affiliates of foreign corporations for selected manufacturing and non-manufacturing sectors. The data come from the statistical program of the National Science Foundation on research and develop-ment spending.90 Table 4 shows total R&D and R&D spending as a percentage of total sales. For the entire manufacturing sector, R&D spending was 3.4 percent of total sales. A number of sectors had higher than average R&D spending relative to the size of the industry. For example, pharmaceutical R&D was 13.1 percent of sales and computer and electronics R&D was 7.6 percent of sales. If we exclude the pharmaceutical sector, chemi-cal R&D spending was just 1.5 percent of sales based on the NSF number, well below the average for manufacturing as a whole. The plastics sector invested just 1.3 percent of sales revenues in research and development.
For pharmaceutical companies, development of new products is an essential part of their competitive strategy. Therefore, it is impor-tant to separate out the pharmaceutical sector when considering total R&D spending by the chemical industry in the U.S. Also, dif-ferent sources of information have somewhat different figures for research and develop-ment spending in the chemical industry. For example, the American Chemical Council estimates that R&D in non-pharmaceutical chemicals was 2.1 percent of the value of shipments in 2008, slightly above the NSF numbers, but still below the average for manufacturing as a whole.91
5.REGULATION AND INNOVATION
Average research and devel-opment (R&D) spending in the chemical industry, excluding phar-maceuticals, is low relative to the manufacturing sector as a whole.
The Toxic Substances Control Act (TSCA) reduces incentives for industry to innovate, since older chemicals grandfathered in under TSCA face fewer regulations.
Regulatory reform must level the playing field between new and existing chemicals in order to encourage innovation while main-taining a core set of protections for all chemical products.
Regulatory reform must be combined with complementary policies to support innovation.
• Examples include the Green Chemistry Research and Development Act to advance industry innovation — which has not been enacted.
• Policies to promote coordina-tion between industry, aca-demic research, and investors are critical to support com-mercialization of innovative technologies.

27The Economic Benefits of a Green Chemical Industry in the United States
REGULATION AND INNOVATION Spending on research and development may not always be the best indicator of the resources dedicated to innovation. Human resources are the most critical input into research. Therefore, as an alternative measure, we consider R&D employment as a percent-age of total employment by sector. Again, data are taken from the National Science Foundation and include employment in U.S. companies and U.S. affiliates of foreign corporations.92 Table 5 summarizes R&D employment — in absolute numbers and as a share of total employment. The general picture remains the same. For the entire manufacturing sector, R&D employment represented 6.9 percent of total employ-ment. For the non-pharmaceutical chemical industry it was just 4.7 percent. Other sectors had dedicated a substantially higher share of their workforce to innovation: computers and electronics (15.5 percent), pharmaceuticals (14.1 percent), transportation equipment (7.4 percent), and software development (17.8 percent).
Trends in the chemical industry’s spending on research and development over the past two decades reveal a similar pattern — as shown in Figure 7. In this case, we take the estimates of research and development expenditures from the American Chemi-cal Council which, as noted earlier, were slightly higher than the NSF estimates for 2008.93 Figure 7 shows R&D spending as a percent of total shipments for pharmaceu-ticals and non-pharmaceutical chemistry.94 Spending by pharmaceutical companies on research and development is significantly higher relative to total revenues and has been increasing over time. In contrast, R&D expenditures for non-pharmaceutical chemi-cals have been low and stagnant — they declined slightly over the 20-year period, from 3.4 percent in 1989 reaching a low of 1.9 percent in 2007.
Not all companies look alike in terms of their spending on research and develop-ment. Table 6 shows R&D spending as a percentage of sales for the 15 largest chemical corporations in 2009. Note that we do not have information on the R&D spending of all these companies, but Table 6 is able to show data on ten of the top 15. R&D spending ranges from a low of 0.3 percent to a high of 7.2 percent. There are many reasons why R&D spending would be
expected to vary. The pharmaceutical indus-try spends more on R&D relative to its size than the rest of the chemical industry. Producers of specialty chemicals have higher R&D expenditures on average than do producers of commodity chemicals.95 Even taking into account these considerations, R&D spending by the major chemical cor-
porations remains comparatively low. The median R&D expenditures among ICIS’s list of the top 100 chemical corporations is 2.4 percent of sales.96
TABLE 4. Research and Development Expenditures by Sector, 2008.
Total R&D Spending ($ millions)
R&D Spending as a % of Sales Revenue
SELECTED MANUFACTURING
All manufacturing $233,326 3.4%
Food $4,000 0.9%
Computer/electronics $69,737 7.6%
Chemicals (non-pharm.) $10,452 1.5%
Pharmaceuticals $69,516 13.1%
Plastics $3,335 1.3%
Transportation equipment $38,221 2.9%
SELECTED NON-MANUFACTURING
Software development $35,070 11.1%
Healthcare $1,217 4.0%
Source: National Science Foundation (2010).
TABLE 5. Employment in Research and Development by Sector, 2008.
Total R&D Employment (thousands)
R&D Employment as % of Total Employment
SELECTED MANUFACTURING
All manufacturing 16,364 6.9%
Food 1,310 1.5%
Computer/electronics 2,455 15.5%
Chemicals (non-pharm.) 1,205 4.7%
Pharmaceuticals 1,053 14.1%
Plastics 689 4.2%
Transportation equipment 3,159 7.4%
SELECTED NON-MANUFACTURING
Software development 1,179 17.8%
Healthcare 204 5.9%
Source: National Science Foundation (2010).

28 The Economic Benefits of a Green Chemical Industry in the United States
0%
5%
10%
15%
20%
25%
200920082007200620052004200320022001200019991998199719961995199419931992199119901989
FIGURE 7. Research and Development Expenditures as a Percent of Total Output, 1989-2009
Source: American Chemistry Council. 2010 Guide to the Business of Chemistry.
Non-pharmaceuticals
Pharmaceuticals
5B) REGULATIONS THAT SUPPORT INNOVATION
Spending by the chemical industry falls below the average level of R&D spending relative to all U.S. manufacturing firms. Later in this section, we offer a suggestion of how the cur-rent regulatory environment slows down the pace of innovation. At the same time, we can-not assume that TSCA reform will necessarily promote innovation. Overall, it will be useful now to examine the relationship between innovation and regulation in more detail.
Researchers have argued that, instead of undermining innovation, appropriate regula-tion can spur innovation. Appropriately designed regulations provide incentives for firms to innovate in order to overcome con-straints and enhance their profitability. For example, Nicholas Ashford, Christine Stone, and Robert Stone, writing at the Massachu-setts Institute of Technology, documented many cases of “technology-forcing” regulation in response to various pieces of environmen-tal legislation.97 In a later influential article, Michael Porter, the well-known manage-ment expert at the Harvard Business School, similarly argued that the regulation of CFCs
in order to protect the ozone layer prompted DuPont to develop a more environmentally benign substitute.98 The constraints imposed by regulations provided incentives that sup-ported innovation — a relationship which became known as the “Porter Hypothesis” or “PH.”99
The “Porter Hypothesis,” has been assessed many times in the professional literature.100 The results from the research have been mixed. In particular, a recent (2010) overview of this literature finds that “there is conflict-ing evidence, alternative theories that might explain the PH, and oftentimes a misunder-standing of what the PH does and does not say.”101 Nevertheless, this review article shows that there is strong evidence that environ-mental regulation can promote technical innovation. It is imperative to be clear under which conditions regulations will either promote or impede innovation, and to thus design policies most likely to be successful, given that we know that some policies, under some conditions can succeed.
Considering this question in a broad Euro-pean context, a recent study conducted a survey of 90 companies which are involved in developing environmental technologies from 13 different European countries. The
researchers asked the companies what “they considered to be the key success factors in environmental innovation and regulation.”102 All the firms identified government policy as a critical factor influencing the success of environmental innovation — with a strong emphasis on the role of regulatory actions in spurring innovation. Within the companies themselves, they identified having a skilled workforce, corporate investment in research and development, and access to financial resources as being most important in driving innovations.
Innovations that improve the safety of the products we use need not be confined to firms that are specifically engaged in producing environmental technologies. Other industries, engaged in a wide range of activities, also respond to incentives created by environmental constraints. In the U.S., pressures from consumer groups and state-level campaigns to ban BPA (bisphenol-A) from products provided an incentive for East-man, a U.S. chemical company, to develop an alternative substance which it called Titan — a copolyester used to manufacture BPA-free and halogen-free plastics.103 Simi-larly, the German firm Bayer developed IDS (iminodisuccinate) as a substitute for EDTA (ethylene diamine tetraacidic acid). EDTA is
TABLE 6. Research and Development Spending as a Percent of Sales, Major Chemical Corporations, 2009.
BASF 2.8%
Dow Chemical 3.3%
ExxonMobil n/a
Sinopec n/a
LyondellBasell Industries 0.5%
Shell n/a
SABIC n/a
Mitsubishi Chemical 5.4%
DuPont 5.3%
INEOS 0.3%
Bayer 5.9%
Total n/a
AkzoNobel 2.4%
Sumitomo Chemical 7.2%
Air Liquide 1.8%
Source: ICIS Top 100, 2010.

29The Economic Benefits of a Green Chemical Industry in the United States
a widely used chelating agent for a range of industrial applications — including industrial cleaners, in the production of textiles, and in the pulp and paper industry. However, EDTA accumulates in the environment and has been connected with reproductive and developmental problems. Growing pressures to find a substitute which is biodegradable led Bayer to develop IDS, which has better environmental properties, to take advantage of the market opportunities created.104
Case studies are useful for demonstrating the link between regulation and innovation, but their findings cannot necessarily be general-ized. However, the relationship between regulation and innovation has also been shown to exist across a large number of firms over time. One such study examines the rela-tionship between environmental compliance expenditures and research and development spending using detailed data from the U.S. Economic Census and the PACE (Pollu-tion Abatement and Cost) survey.105 R&D and pollution abatement expenditures were collected for detailed industrial sectors from 1975 to 1991. The study finds a positive rela-tionship between pollution abatement costs and spending on R&D after controlling for other factors. In other words, when firms face the higher costs of their polluting activities, they tend to spend more on innovation.
5C) DESIGNING A REGULATORY FRAMEWORK TO PROMOTE INNOVATION
Appropriate regulations can support tech-nological change. However, the challenge is “to fashion regulatory strategies for eliciting the best possible technological response to achieve specific health, safety, or environ-mental goals.”106 Technological innovation and improvements in health, safety, and environmental protections can be mutually reinforcing, but regulations must be designed in a way to facilitate such innovation. The wrong regulatory framework can undermine innovation, just as the right regulations can support or spur research and development.
Under TSCA, approximately 62,000 existing chemicals were grandfathered in — i.e. they were not required to be reviewed for safety, in contrast to the provisions applicable to new chemicals. Because of this, the cur-rent regulatory structure creates an uneven
playing field. Existing, outdated chemicals have fewer regulatory requirements than new products. This creates perverse incentives which undermine innovation. Why invent safer and more sustainable chemicals, which would be subject to regulation, when one can continue to produce existing products? These backwards incentives likely contribute to the low level of R&D expenditures in the chemical industry relative to the rest of the manufacturing sector.
The playing field is made more uneven by the fact that the current regulatory system makes it extremely difficult for the EPA to identify and restrict chemicals of high concern. This allows potentially hazardous chemicals to remain on the market and new chemicals to enter it without adequate testing or assess-ment, hence further undermining incentives to develop safer chemicals.
We need to replace the current rules with regulations that level the playing field and incentivize the introduction of chemicals which are inherently low hazard or represent safer alternatives. At the same time, we need to recognize that data and safety assessment standards for new chemicals remain deficient under TSCA and a better system must be put in place. Therefore, a universal set of informa-tion and safety standards should be required of all chemicals. As Richard Denison, Senior Scientist at the Environmental Defense Fund, put it, “The solution ... is to expedite the requirement for minimum data for existing chemicals — not to do away with the require-ment for safety data for new chemicals.”107
Beyond these core standards, more stringent requirements would apply based on the inherent hazards of the products, the volume of production, and potential exposure. For example, the information requirements could be linked to the total amount of a particular chemical produced and distributed in the marketplace. Chemicals with widespread use would be required to generate a more comprehensive set of information on toxicity and potential hazards than chemicals which are currently produced in small quantities. Nevertheless, a core set of information and safety determinations would be required of new chemicals, before they are introduced into the market.
A comprehensive and progressive system would accomplish a number of important goals. First, all chemicals, both new and exist-ing, would be subject to the same core regula-
tory standards. For new chemicals, these requirements would be met before introduc-ing the product into the marketplace. In this respect, it would level the playing field while assuring that fundamental standards are in place for all products. Second, chemicals with large market shares or greater inherent hazards would face more stringent report-ing requirements. This would reverse the incentives currently in place under TSCA and provide positive incentives for developing innovative alternatives. Finally, the reporting and disclosure requirements would evolve over time. A new chemical product would be required to meet the core safety assess-ment before being introduced. However, if the product takes off in the marketplace and its production grows rapidly, the regulatory requirements would also increase. In short, the regulatory system would be transformed into one that supports, rather than under-mines, innovation while maintaining funda-mental safety and reporting standards.
5D) COMPLEMENTARY POLICIES
Although the right regulatory framework can support innovation in the chemical industry, it would be wrong to depend on regulations alone to foster the growth of green chemistry. Similarly, policies which collect and dissemi-nate information on the chemicals currently used, how these substances are used, and the dangers they pose, will also support innova-tion but, in themselves, are not enough. Other complementary policies are needed. These include fiscal policies and similar instruments that provide the right incen-tives to invest in greener and safer chemistry, educational programs, and public support for research, development, and technological innovation.108
Much of the financing of research and development in the chemical industry itself is provided by the companies.109 However, it is uncertain that sufficient resources will be directed at building the technologies underly-ing green chemistry, since not all of the benefits of developing safer and more sustain-able chemicals are captured by the companies producing them. The social returns are higher than the private returns and businesses, acting in their own interest, will not have strong enough incentives to fully realize the social benefits. Given this situation, there is a powerful justification for public support for innovation in this area. The U.S. has a long

30 The Economic Benefits of a Green Chemical Industry in the United States
tradition of public support for technological innovation — in its universities and through public-private partnerships.110
Government initiatives already exist to help promote green chemistry. Perhaps the best known is the Presidential Green Chemistry Challenge Awards, introduced in 1995 under the Clinton Administration. The award recognizes individuals, institutions, and busi-nesses for developing innovative technologies that create safer and more sustainable chemi-cal products and processes. The EPA admin-isters the award in five categories: academia, small business, green chemical synthesis (e.g. use of renewable inputs to produce chemical products), the development of green reaction conditions (e.g. processes that replace hazard-ous solvents with better alternatives), and designing green chemicals (e.g. producing new chemicals that substitute for more toxic products).
Although the Presidential Green Chemistry Challenge Awards recognize innovations once they have been achieved, public research sup-port for sustainable innovations in chemistry remains fairly limited. The EPA, through its green chemistry program, sponsors some research with grants and fellowships.111 The EPA also participates with 10 other federal agencies in the Small Business Innovation Research program, which has the capacity to support environmental research among small producers.
Federal legislation has been introduced to both the House and the Senate to better support the development of green chemistry, although these policies have not yet become law. The Green Chemistry Research and Development Act would introduce programs to coordinate federal research, education, and technology transfer initiatives related to green chemistry.112 This includes sustained support for green chemistry research, development, and educational initiatives in science and engineering. The bill also would initiate, with the National Research Council, a study of the barriers to commercializing the results from innovative green chemistry research. Although the legislation in support of green chemistry has not yet moved forward, the reauthorization of the America COMPETES Act, aimed at supporting technological inno-vation to support the U.S. economy, did call for the establishment of a green chemistry basic research program.113 Nevertheless, the level of public support for research and development currently remains inadequate to jump-start a vibrant green chemicals industry
that has the potential to contribute to U.S. manufacturing performance.114
What role could universities and research institutions play in developing a dynamic, innovative green chemical industry? The history of innovation in the tradition chemi-cal industry provides some guidance. The principles of green chemistry will need to be promoted strongly in institutions of higher education, following the example, over a hundred years ago, of the creation in U.S. universities of the discipline of chemical engi-neering. Universities have already taken the lead in redefining the discipline of chemistry to include the principles of green chemistry. This often means continuing to teach tradi-tional concepts and techniques, but showing how knowledge of chemistry can be used to find sustainable solutions to a wide range of challenges.115 Many universities, including the University of Oregon and the University of California, have launched programs in green chemistry that coordinate research and educate chemists for the future.
Providing a foundation in green chemistry also motivates talented students to pur-sue research and professional careers that emphasize making the practice of chemistry more sustainable. Graduate students — particularly those who have been exposed to the principles of green chemistry — are increasingly seeking out universities and labs which conduct green chemistry research.116 This builds the skills needed to move towards a greener and safer chemical industry. However, such educational opportunities are limited by the amount of funding for such research. Therefore, increasing support for university research in the area of green chemistry has multiple benefits — it supports the basic research needed to foster innovation and it provides educational opportunities for talented students.
Focusing on one policy area, such as more support for education and academic research, will not, in itself, shift the chemical industry. Coordination between industry, academic researchers, and innovative managers and entrepreneurs is needed for the successful development and transfer of technologies. Public programs can facilitate this process. For example, GreenCentre Canada, funded by the governments of Canada and Ontario and established by the technology transfer office of Queen’s University, brings together academic researchers, members of industry, and experts in the commercialization of tech-nology to create clean, more energy-efficient
alternatives to traditional chemical products and production processes.117 GreenCentre Canada has already been successful in facili-tating the development of several alternative chemical products.118
As already discussed, the current regulatory environment creates an uneven playing field which favors traditional chemical production. Moreover, the social returns to developing safer and more sustainable alternatives are greater than the private returns. Therefore, industry needs to be provided with the right incentives, and the accomplishments of com-panies which move in new, safer, and more sustainable directions need to be recognized. In addition to regulatory reform, there are numerous policies that would support the development of greener and safer chemical products, including production tax credits, research and development tax credits, govern-ment sponsored loan guarantee programs to support innovative investments, length-ened patent lives for green products, and an expansion of the grants available for applied research in green chemistry. 119
Green chemistry has the potential to revive the U.S. chemicals industry as a dynamic and innovative driver of manufacturing growth and performance. However, the realization of this goal requires new policies and a strong commitment from all stakeholders.

31The Economic Benefits of a Green Chemical Industry in the United States
In the beginning of this report, we showed that the chemical industry is important in American manufacturing and efforts to support growth in the chemical industry will contribute to sustaining good manufacturing jobs. However, instead of being a source of dynamic job creation, many sectors of the chemical industry have been shedding jobs, even as their output expands. To turn this situation around, the industry must change course and take advantage of emerging opportunities in the manufacture of green, safe, and sustainable chemical products. These opportunities already exist and, as we have pointed out, will grow rapidly in the future. In the following section, we take a closer look at employment in the chemical industry, including the role of green chemis-try and regulatory reform.
6A) THE CHEMICAL INDUSTRY AS A SOURCE OF GOOD MANUFACTURING JOBS
One reason why the chemical industry does not generate significant number of new jobs when its production expands is that chemical production tends to be capital intensive — i.e. it uses relatively more equipment and machinery and relatively less labor than other sectors of the economy. But the level of capital intensity varies significantly from one subsector of the chemical industry to the next. This suggests that the job creation potential of the chemical industry critically depends on the detailed composition of the industry’s productive activities. This is an important point: if safer and more sustain-able chemical manufacturing has a greater potential for employment creation than tradi-tional subsectors, then a move towards green chemistry will also support the expansion of manufacturing job opportunities in the U.S.
Table 7 presents labor-capital ratios for detailed subsectors of the chemical, petro-leum products, and plastics industries. The labor-capital ratio shows the number of jobs created for every $1 million invested in productive capital. The higher this number, the more labor-intensive (and less capital-intensive) the sector is.
Table 7 demonstrates that there is significant variation in the magnitude of capital intensity across these sectors. For example, plastic products have a higher labor-capital ratio than many of the other sectors. This indicates that new investment in the productive capac-ity of plastics manufacturing will generate more jobs on average than the equivalent dollar value of investment in more capital-intensive sectors.
Importantly, the subsector with the lowest labor-capital ratio is petrochemicals at 0.4 jobs per million dollars invested. Petrochemi-cals are the backbone of the plastics industry and of many other products based on organic (i.e. carbon-based) chemical inputs. If sub-stitutes for petrochemicals are developed that use less capital-intensive production tech-niques, the job creation potential of the chem-istry industry would increase significantly.
However, trends in the chemical industry are moving in the opposite direction. The chemical industry is producing fewer jobs for a given amount of production than it did in the past. Figure 8 shows the number of jobs generated for each $1 million in output, val-ued at 2009 prices.120 Trends for pharmaceu-ticals and non-pharmaceutical chemicals are shown separately. For pharmaceuticals, the number of jobs per $1 million in output, val-ued at 2009 prices, fell modestly from about 1.62 in 1989 to 1.49 in 2009, an 8 percent decline. However, for non-pharmaceutical chemicals the decline was more precipitous, down from 1.83 jobs per $1 million of output in 1989 to just about one job per $1 million in output two decades later — a 40 percent decline.
6.JOB CREATION, REGULATORY REFORM, AND A GREENER CHEMICAL INDUSTRY
Traditional chemical production has been shedding jobs and this trend is likely to continue in the future if the industry does not move in new directions.
Green chemistry can create more domestic jobs. For example, a switch to bio-based chemicals, such as bioplastics, has a greater job creation potential than tradi-tional plastic and chemical prod-ucts. Biomass feedstocks create 3-4 times more jobs per $1 million in spending than traditional petro-chemical feedstocks.
The estimated costs of regulation are relatively small. Studies of the REACH regulations estimate that compliance costs are less than 1 percent of sales and are only incurred once for each product.
Policies to support a greener chemical industry can promote domestic industries and jobs.
The benefits of a greener and safer chemical industry extend beyond job creation and include less pollution, better health out-comes, a stronger foundation for the long-run sustainability of the U.S. economy, technological inno-vations, and markets that work better for consumers, workers, investors, and businesses.

32 The Economic Benefits of a Green Chemical Industry in the United States
In order for the chemical industry to become a net source of job creation in U.S. manu-facturing once again, two things will need to change. The growth rate of demand for the industry’s output will need to accelerate and the average number of jobs created for a given amount of production will need to increase.
This report has already documented many of the new market opportunities for innovative firms in the area of sustainable chemical man-ufacturing. In so doing, it has argued that policies to reform the regulatory framework in the U.S. and to support the development of innovative new products will generate new markets for U.S. producers and new sources of demand.
However, increasing demand for U.S. products through the development of greener and safer alternatives is only half the story. For many products, greener alternatives also generate more jobs for a given level of out-put. Therefore, a shift in the composition of the products that the U.S. chemical industry produces towards more sustainable alterna-tives can, in itself, create jobs.
TABLE 7. Capital Intensity, Subsectors of the Chemical, Plastics, and Petroleum Industries, 2007.
Industrial SectorSales
($ millions) EmployeesLabor/Capital
Ratio NAICS codes Disposal
Plastics material and resins $85,232 71,216 1.4 325211 $433.0
Plastics product manufacturing (other) $84,130 421,780 10.4 326199 $96.7
Basic organic chemicals (other) $80,464 68,365 0.8 325199 $416.2
Petrochemical manufacturing $77,662 9,257 0.4 325110 $55.8
Soap and other detergent manufacturing $28,832 23,889 2.7 325611 $282.2
Paint and coating manufacturing $23,575 41,893 6.2 325510 $1,232.5
Basic inorganic chemicals (other) $22,829 35,801 2.4 325188 $159.6
Plastics bottle manufacturing $11,834 34,516 4.2 326160 $121.9
Urethane and other foam products $9,816 35,825 12.1 326150 $560.4
Plastics pipe and pipe fitting $8,910 24,027 7.8 326122 $233.8
Printing ink manufacturing $4,990 11,996 9.6 325910 $123.2
Plastics plumbing fixture manufacturing $4,082 26,102 21.2 326191 $167.0
ALL U.S. MAUFACTURING $5,298,310 13,272,370 6.3 n/a $60.7
Source: U.S. Census Department.
Jobs
per
$1
mill
ion
outp
ut
0.80
1.00
1.20
1.40
1.60
1.80
2.00
200920082007200620052004200320022001200019991998199719961995199419931992199119901989
FIGURE 8. Jobs Per $1 Million Output ($2009), U.S. Chemical Industry, 1989-2009
Source: U.S. Bureau of Labor Statistics and American Chemistry Council. 2010 Guide to the Business of Chemistry.
Non-pharmaceuticals
Pharmaceuticals

33The Economic Benefits of a Green Chemical Industry in the United States
6B) ENHANCING JOB OPPORTUNITIES THROUGH GREEN ALTERNATIVES: THE EXAMPLE OF BIO-BASED CHEMICALS
The employment generation potential of a greener chemical industry is not limited to increasing the labor intensity of particular sectors. The linkages between sectors should also be taken into account. For example, many chemicals and chemical products depend on petroleum and other fossil fuel inputs. The “upstream” linkages to the petro-leum sector limit the job creation potential of expanding production of these chemicals. This is because the upstream sectors tend to be highly capital intensive, as we have seen, and because the U.S. remains dependent on imported petroleum to meet all of its current consumption needs. The widespread use of imported materials does not directly create jobs in the U.S. economy.
However, a shift towards bio-based chemi-cals fundamentally changes these industrial linkages. Bio-based chemicals include a wide range of products, such as bioplastics, soy-based inks, biofuels, biocatalysts, and other chemicals and materials derived from renewable biomass. A recent report from the U.S. Department of Agriculture estimates that bio-based chemicals’ share of the global chemical market will rise from its current level of two percent to 22 percent or more by 2025.121 Agricultural production and forestry products are more labor intensive than fossil fuel processing. Large domestic supplies exist in the U.S., reducing the dependence on imports. When we take these factors into account, the employment creation potential of bio-based chemicals is significantly larger than traditional petro-based chemicals.
Bioplastics provide an illustrative example of the potential employment effects associated with a switch to bio-based chemicals. To bet-ter understand these differences in employ-ment outcomes, we use an input-output model of the entire U.S. economy to estimate the employment impacts associated with purchasing inputs used in the manufacture of traditional plastics and bioplastics.122 Specifi-cally, we explore the employment effects of a given level of spending on petrochemicals and the petroleum sector relative to the same level of spending on the products of
those sectors which supply the raw materi-als for bioplastics processing. The Bureau of Economic Analysis of the U.S. Department of Commerce maintains the input-output tables on which the following analysis is based. The input-output tables document the relationships between different sectors of the economy in the production of goods and services and allow us to estimate the effects on employment resulting from an increase in spending on the products and services of a given industry. For example, the model estimates the number of jobs directly created in the petrochemical industry for each $1 million of spending on petrochemicals. The model also estimates the jobs indirectly cre-ated in other industries with domestic links to the petrochemical industry.
We consider two sources of employment creation associated with such spend-ing: direct and indirect. The direct effect represents jobs that would be created by spending in the relevant area. For example, the addition of new capacity will involve expenditures by various businesses to install that capacity, including spending to pay for new employees. The additional employ-ment associated with these expenditures constitutes the direct effect. However, firms involved in the installation of new capacity will also purchase goods and services from other sectors. This increase in intermediate demand will also create jobs; the estimated size of this “second round” of employment creation constitutes the indirect effect.
One challenge is to identify those sectors which will supply the materials needed to produce bioplastics. Many of these raw mate-rials come from the agricultural and forestry sectors. Based on a highly detailed report123 of the global bioplastics sector, prepared in 2009 by researchers at Ultrecht University in the Netherlands, we focused on five catego-ries of bioplastics: starch plastics, cellulosic polymers, polylactic acid (PLA), bio-based polytrimethylene terephthalate (PTT), and bio-based polyamides/nylons. Each of these types of bioplastics relies on inputs from spe-cific agricultural sectors, including potatoes (starch plastics), cotton and trees (cellulose), sugar cane and sugar beets (PLA), corn (PLA, PTT, and starch plastics), and castor beans and olives (bionylons).
Table 8 presents estimates of the employ-ment effects of spending on the output of these agro-based sectors, traditional petrochemicals, and petroleum products. According to these estimates, $1 million in spending on petroleum extraction would generate 1.1 direct jobs and 2.2 indirect jobs, for a total of 3.3 jobs. Other industries in the traditional plastics supply chain have relatively low employment multipliers for each $1 million spent: oil and gas drill-ing (3.9 direct + indirect jobs), petroleum refineries (1.8 direct + indirect jobs), and petrochemicals (2.7 direct + indirect jobs). In contrast, the employment effects in the sectors which supply the raw materials for bio-based plastics are significantly higher: 9.3
TABLE 8. Employment Generated for Each $1 Million Spending on Output.
Industry Supplying Raw Materials Direct Indirect
Direct+ Indirect
BIO-BASED EMPHASIS
Grain farming 8.4 4.4 12.7
Vegetable farming 4.8 5.3 10.1
Sugarcane and sugar beets 26.1 5.3 31.4
Fruit farming 10.5 6.2 16.7
Wet corn milling 0.5 8.8 9.3
Plastics $3,335 1.3%
Transportation equipment $38,221 2.9%
PETROLEUM EMPHASIS
Petroleum and gas extraction 1.1 2.2 3.3
Petroleum and gas drilling 1.2 2.7 3.9
Petroleum refineries 0.1 1.7 1.8
Petrochemical manufacturing 0.2 2.5 2.7
Source: Author’s estimates using the IMPLAN 3.0 input-output model.
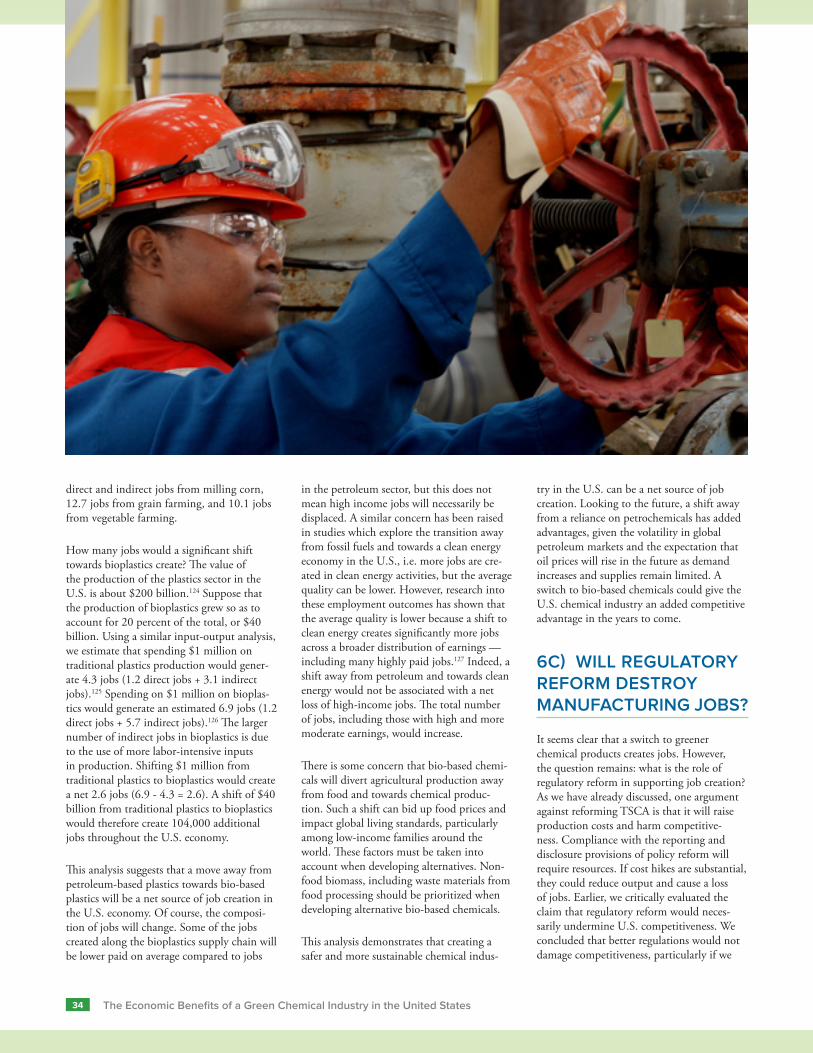
34 The Economic Benefits of a Green Chemical Industry in the United States
direct and indirect jobs from milling corn, 12.7 jobs from grain farming, and 10.1 jobs from vegetable farming.
How many jobs would a significant shift towards bioplastics create? The value of the production of the plastics sector in the U.S. is about $200 billion.124 Suppose that the production of bioplastics grew so as to account for 20 percent of the total, or $40 billion. Using a similar input-output analysis, we estimate that spending $1 million on traditional plastics production would gener-ate 4.3 jobs (1.2 direct jobs + 3.1 indirect jobs).125 Spending on $1 million on bioplas-tics would generate an estimated 6.9 jobs (1.2 direct jobs + 5.7 indirect jobs).126 The larger number of indirect jobs in bioplastics is due to the use of more labor-intensive inputs in production. Shifting $1 million from traditional plastics to bioplastics would create a net 2.6 jobs (6.9 - 4.3 = 2.6). A shift of $40 billion from traditional plastics to bioplastics would therefore create 104,000 additional jobs throughout the U.S. economy.
This analysis suggests that a move away from petroleum-based plastics towards bio-based plastics will be a net source of job creation in the U.S. economy. Of course, the composi-tion of jobs will change. Some of the jobs created along the bioplastics supply chain will be lower paid on average compared to jobs
in the petroleum sector, but this does not mean high income jobs will necessarily be displaced. A similar concern has been raised in studies which explore the transition away from fossil fuels and towards a clean energy economy in the U.S., i.e. more jobs are cre-ated in clean energy activities, but the average quality can be lower. However, research into these employment outcomes has shown that the average quality is lower because a shift to clean energy creates significantly more jobs across a broader distribution of earnings — including many highly paid jobs.127 Indeed, a shift away from petroleum and towards clean energy would not be associated with a net loss of high-income jobs. The total number of jobs, including those with high and more moderate earnings, would increase.
There is some concern that bio-based chemi-cals will divert agricultural production away from food and towards chemical produc-tion. Such a shift can bid up food prices and impact global living standards, particularly among low-income families around the world. These factors must be taken into account when developing alternatives. Non-food biomass, including waste materials from food processing should be prioritized when developing alternative bio-based chemicals.
This analysis demonstrates that creating a safer and more sustainable chemical indus-
try in the U.S. can be a net source of job creation. Looking to the future, a shift away from a reliance on petrochemicals has added advantages, given the volatility in global petroleum markets and the expectation that oil prices will rise in the future as demand increases and supplies remain limited. A switch to bio-based chemicals could give the U.S. chemical industry an added competitive advantage in the years to come.
6C) WILL REGULATORY REFORM DESTROY MANUFACTURING JOBS?
It seems clear that a switch to greener chemical products creates jobs. However, the question remains: what is the role of regulatory reform in supporting job creation? As we have already discussed, one argument against reforming TSCA is that it will raise production costs and harm competitive-ness. Compliance with the reporting and disclosure provisions of policy reform will require resources. If cost hikes are substantial, they could reduce output and cause a loss of jobs. Earlier, we critically evaluated the claim that regulatory reform would neces-sarily undermine U.S. competitiveness. We concluded that better regulations would not damage competitiveness, particularly if we

35The Economic Benefits of a Green Chemical Industry in the United States
account for all costs, we properly measure productivity, and the reforms are properly designed. Nevertheless, the concern remains that strengthening regulations will raise pro-duction costs and reduce employment.
One way of getting at this issue is to look at the cost estimates of similar regulatory reforms which have already taken place. A comparable example would be the REACH regulations in the European Union. While REACH was being developed, numerous impact assessments were conducted in order to anticipate any negative effects of the policy. The assessments examined the impact on costs, market share, and research and development spending. They are instructive with regard to anticipating any unintended consequences of chemical policy reform in the U.S.
Before the implementation of REACH, the European Commission coordinated an extended impact assessment of the proposed regulation.128 This included studies of the present value of the cost of the REACH regu-lations with regard to registration and testing of chemicals and the costs to downstream users.129 The total costs of registration and testing of chemicals within the European Union have been estimated to be 2.3 billion Euros.130 Estimated costs to downstream users ranged between 2.8 billion and 5.2 billion Euros.131 Therefore, one set of estimates of the total costs of the REACH ranged between 5.1 billion and 7.5 billion Euros. These cost estimates do not take into account any off-setting benefits of the regulations.
The total value of the annual output of the non-pharmaceutical chemical industry in the EU was approximately $450 billion Euros around the time these estimates were calcu-lated.132 Therefore, the present value of the direct costs of REACH with regard to testing and registration would amount to 0.5 percent of total sales. If we were to include the costs to downstream users, recognizing that the chemical industry would not necessarily pay these costs itself, the total estimated costs of 5.1 to 7.5 billion Euros represent about 1.1 to 1.7 percent of non-pharmaceutical sales. Cost increases of this magnitude will not trigger major disruptions in production or employment, particularly when we consider that the costs would not be incurred in a single year but would be spread out over time. They can be easily absorbed through price increases, modest reductions in profits, or productivity improvements.
It is particularly important to bear in mind that the costs of testing and collecting data on chemicals represent once-off costs. They do not represent a permanent increase in the cost of producing chemical products. Once the reporting, testing, and disclosure requirements of the new regulatory requirements are met, the costs associated with developing the mini-mum data set on that chemical will not recur.
A separate assessment of REACH, based on a memorandum of understanding between the European Commission and the Euro-pean Chemical Industry Council (UNICE/CEFIC), used a case study approach to document the expected effects of the regula-tion.133 The study found that REACH was expected to have no impact on market share, or, in some cases, that the expected impact was not known. There was little indication that chemical firms would relocate to other countries to avoid complying with REACH. The businesses studied did not anticipate making significant changes to research and development expenditures and most felt that they would be able to absorb the additional costs or pass them on through higher prices. The companies did report that they would explore ways of reducing the costs of compli-ance, including forming consortiums to pool resources in order to meet reporting and testing requirements. Taken together, the findings indicate that chemical producers did not anticipate making large adjustments to employment or production in response to the implementation of REACH.
This same research report did find that the expected costs of compliance varied from one business to the next. This raises concerns that the regulations will have different impacts on different firms. Specifically, larger corporate producers may be able to more easily absorb costs or pass them along than small- and medium-sized specialty producers. How-ever, support for small- and medium-sized enterprises can be addressed in the design of regulatory reforms. If regulatory require-ments vary with production volume, smaller, specialized producers would have lower compliance costs. Furthermore, not all costs of compliance are incurred at a single point in time. The regulatory requirements would be met over a specified time period. For firms facing particular cost pressures, such as small and medium-size enterprises, this time period could be varied, within certain parameters that do not compromise safety, to allow them to manage the transition.
The assessment of the impacts of REACH provide us with an indication of how firms in the U.S. will likely respond to similar reforms. When we consider the small size of the costs relative to output, the fact that the regulatory requirements represent once-off costs per product, and the scope for design-ing policies that allow companies to manage these costs over time, there is no reason to expect job losses from well-designed policy reform in the U.S. Indeed, throughout this report, we have shown that good regulations support competition and innovation, leading to a net gain in jobs.
6D) GREENER AND SAFER ALTERNATIVES: EXPECTED IMPACT ON OFF-SHORING
Off-shoring of chemical production — and hence employment — has been a growing concern. Even if more sustainable alternatives were developed in the chemical industry, there is no guarantee that manufacturing would take place in the U.S. Many point to the increased importance of China, Brazil, and India as sites of global chemical produc-tion. To what extent will the employment benefits of developing a green chemistry industry be off-set by the globalization of production?
Consider first the issue of regulatory reform. Updated regulations on chemical products would apply to both domestic producers and imports from other countries. Overseas pro-ducers, regardless of who owns the compa-nies, would be subject to new standards with regard to the safety of their products. This would prevent overseas producers from tak-ing advantage of the current lax regulations to sell potentially hazardous products on the U.S. market.
In some respects, strong enforcement of reformed chemical regulations on imports into the U.S. would function like a border tax adjustment. A border tax adjustment is a surcharge on goods entering a country which were produced under less stringent environmental regulations. The idea is often considered with regard to imports into countries that tax greenhouse gas emis-sions from countries that do not regulate greenhouse gases. By not paying the cost of damage to the environment, countries with lax environmental standards are effectively

36 The Economic Benefits of a Green Chemical Industry in the United States
subsidizing their exports. Enforcing strict regulations on chemical products would have a similar effect, but in this case imports which violate domestic safety standards would not be allowed into the U.S. unless companies meet the same burden of proof as domestic producers. The justification for such action is that the products impose significant environmental and health costs which are not reflected in the price of the imports. In the current situation under TSCA, potentially hazardous chemicals produced in other coun-tries have virtually unrestricted access to the U.S. market, even when hidden costs exist.
Apart from the issue of regulatory reform, there are reasons to believe that the devel-opment of a vibrant and innovative green chemistry sector would help keep manufac-turing jobs in the U.S. One of the primary justifications for off-shoring is that chemical companies currently compete on a cost basis, with labor being one cost over which firms can exercise some control. This competitive model drives off-shoring. However, we have shown in this report that these competitive dynamics are changing due to shifts in con-sumer behavior, the regulatory frameworks in major markets, and the long-run costs of critical non-labor inputs, such as petroleum and other fossil fuels. These shifts in competi-tive dynamics will support the development of a greener and safer chemical industry and, in so doing, reduce the reliance on off-shor-ing as a strategy for securing a competitive advantage.
Some areas of green chemistry — such as bio-based chemicals — reinforce linkages in the domestic economy. An expansion of these activities strengthens domestic economic activity and improves employment outcomes — both within and outside of the chemicals sector. The potential for exploiting these linkages remains high in the U.S. with a substantial agricultural sector that gener-ates significant non-food biomass. A recent assessment by the USDA confirmed that the U.S. agricultural and forestry sectors would be able to supply significant biomass in the future to help meet the needs of an expand-ing domestic bio-based chemical industry without diverting commercial cropland from traditional food production.134 As shown earlier, shifting 20 percent of current plastics production into bioplastics would create a net 104,000 jobs in the U.S. economy.135
As discussed previously, the development of a sustainable chemical industry requires the close interaction of academic research-
ers, industrial producers, and government institutions. If the U.S. were to prioritize the development of green chemistry — by strengthening education and research capac-ity in universities and domestic research institutions, facilitating technology transfer and commercialization, and insuring that the incentives are right — it could facilitate the development of innovative “clusters” of complementary activities, anchored in domestic institutions and businesses. Such cluster strategies have been used effectively to create jobs throughout the U.S.136 Moreover, high-quality human resources will be needed to take advantage of these opportunities to increase competitiveness. Investment in the education of the next generation of green chemists and chemical engineers will help to tie the source of future competitiveness to the domestic economy.
All of these factors contribute to linking productive activities and employment to the domestic economy and counteract the push towards off-shoring. Of course, production will likely continue to be globalized and the development of green chemistry, in itself, will not reverse this broader trend. How-ever, it is important to consider what would happen if the U.S. chemical industry does not transform itself. It will continue to favor older chemicals to innovative products. It will increasingly be shut out of important markets, specifically countries with modern regulatory regimes. And it will continue to try to compete primarily on the basis of costs. Under these conditions, the incentives to rap-idly expand overseas production will become stronger over time, off-shoring will continue to grow, and manufacturing jobs in the chemical industry will continue to disappear.
6E) BEYOND EMPLOYMENT: THE BENEFITS OF AN IMPROVED REGULATORY FRAMEWORK.
We have focused almost exclusively on employment outcomes in this section and have presented evidence which shows that there is no need to expect that TSCA reform and a transition to a safer, more sustainable chemical industry would come at the expense of U.S. jobs. However, it is important to keep in mind that the benefits of regulatory
reform extend well beyond the question of jobs. Better regulations will reduce environ-mental pollution, improve health outcomes, build a foundation for long-run sustainability of the U.S. economy, support technological innovations, and make markets work better for consumers, investors, and businesses. Many of these benefits are difficult to reliably quantify, and yet they are real, concrete gains that will make a difference to the economy and people’s lives.
Taken together, the current set of federal regulations delivers net benefits to the U.S. population. The Office of Management and Budget (OMB), in its 2010 report to Congress, The Benefits and Costs of Federal Regulations and Unfunded Mandates on State, Local, and Tribal Entities, found that:
The estimated annual benefits of major Federal regulations reviewed by OMB from October 1, 1999, to September 30, 2009, for which agencies estimated and monetized both benefits and costs, are in the aggregate between $128 billion and $616 billion, while the estimated annual costs are in the aggregate between $43 billion and $55 billion.137
Even if we consider the lowest level of benefits ($128 billion) and the highest costs ($55 billion), the current set of federal regulations improves the well-being of the U.S. population on average. We have not tried to monetize all the costs and benefits of TSCA reform in this report, partly because of the difficulty of doing so given available data and partly because the exact nature of the reforms, if they were to be implemented, is not yet known. Nevertheless, the findings presented here suggest that, like many other federal regulations, TSCA reforms would deliver net benefits to the American people.

37The Economic Benefits of a Green Chemical Industry in the United States
Despite these strong features, the U.S. chemical industry faces major challenges in addressing the demands of both consumers and regulators to establish a stronger commit-ment to non-toxic, safe, and environmentally benign products — i.e. to producing green products and utilizing green processes in areas such as bio-based chemicals, building materials, flame retardants, healthcare and personal care products. Consumers both in the U.S. and in export markets are express-
ing these demands with increasing force. The new REACH regulatory system in the E.U. operates in tandem with the general demands of consumers, downstream users, and workers for chemical firms to embrace a green chemi-cal agenda.
At the same time, the federal regulatory standards in the U.S. are outdated and in need of reform. At its inception, TSCA
grandfathered in no less than roughly 62,000 chemicals. Information on these chemicals remains very limited, and they are marketed to consumers virtually free of any regula-tory standards. Indeed, under TSCA, the chemical industry is not required to provide information on potentially hazardous effects of its products before introducing them into the marketplace. Moreover, companies can request exemptions from the limited report-ing requirements which do exist for newly introduced chemicals.
In assessing the viability of the chemical sector transforming itself into a greener, safer, and more sustainable industry, the major question is what effects such a transforma-tion will have on the competitiveness of U.S. firms and will it undermine innovation. Will costs go up, and if so, are there possible nega-tive consequences for employment?
7.CONCLUSION AND RECOMMENDATIONS
The U.S. chemical industry today is a major force in the overall economy. It remains a cornerstone of the U.S. manufacturing sector and a strong export performer. The chemical industry has also been a source of relatively good-quality manufacturing jobs in the U.S., even given the large cutbacks over the past 20 years in job opportunities in both the plastics industry and in non-pharmaceutical chemicals.

38 The Economic Benefits of a Green Chemical Industry in the United States
Our preliminary assessment is that such additional costs associated with regulatory reform should be readily absorbable within most firms’ ongoing operations. But more importantly, what seems evident is that firms that fail to undertake such a transformation will fall further behind their competitors over time. The firms that fail to innovate will lose their edge in both the domestic U.S. and in export markets. This would be a serious blow to the industry and to the U.S. manufactur-ing sector more generally.
In addition, the case on behalf of strong regulatory reform at the federal level becomes decisive once we take into account 1) the environmental benefits, as well as the initial business costs, of regulations that will pro-mote a green chemical industry; and 2) the potentially massive costs to U.S. competitive-ness if U.S. firms fail to keep pace with the cutting-edge firms in other countries.
Finally, as we have discussed, the develop-ment of a green chemical industry in the United States will be an important source of good job opportunities. Such a shift will improve competitiveness and spur innova-tion, helping to preserve jobs that would be lost if U.S. firms become uncompetitive or try to compete by shifting jobs overseas. In addition, some green chemistry activities, such as the development of bio-based chemi-cals, have larger potential employment effects than traditional chemical products based on fossil fuel inputs. Jobs will be threatened by a failure to act in ways that promote a greener, safer, and more sustainable chemical industry.
Three major recommendations for build-ing a stronger chemical industry in the U.S. emerge out of this study:
1. Create an effective new regulatory environ-ment. TSCA must be updated. A new set of regulations is needed to modernize U.S. regulations and to generate public information about the hazards of chemi-cal products. This information would support efforts by consumers and busi-nesses to substitute green chemical prod-ucts for more toxic and less sustainable products currently on the market. The reforms should require a minimum data set on all new and existing chemicals suf-ficient to determine safety. The reforms should shift the burden of proof, so that industry would need to show that their chemicals are safe, instead of the EPA proving that there is harm. The reforms should end the unfair advantage given to chemicals grandfathered in under TSCA and level the regulatory playing field.
2. Implement complimentary industrial poli-cies to promote innovation in a U.S. green chemical industry. The federal govern-ment has a successful track record in providing significant support for R&D and commercialization of innovations throughout the U.S. economy, including in agriculture, biotechnology, comput-ers and the Internet. Similar approaches should be employed to build a green chemical industry in the United States. These include fiscal policies and similar instruments that provide the right incen-tives to invest in greener and safer chem-istry, policies that extend and enhance
green chemistry education, and public support for research, development, and technological innovation. Coordination between industry, academic researchers, and innovative managers and entrepre-neurs is critical for the successful devel-opment and transfer of technologies. The aim is to create a solid foundation on which private-sector innovation can flourish, without the government being in a position to pick winners and losers with respect either to specific business firms or specific technologies.
3. Disseminate environmental and health-related information on the chemical industry as widely as possible. U.S. consumers, workers, and businesses need as much information as possible on the ongoing environmental damage and health hazards they face through continu-ing to rely on a range of conventional chemicals and the opportunities that are available to advance a green chemical industry, including investment in areas such as bioplastics, building materials, furnishings, healthcare, and personal care products. There is a need to insure that the relevant information generated by better regulations is disseminated as widely as possible. Regulatory reforms should be designed to support innova-tion and to disseminate information that allows consumers, downstream users, and shareholders to make better decisions without compromising fundamental safety standards.

39The Economic Benefits of a Green Chemical Industry in the United States
1 American Chemical Society Webinar. How Chemicals Policy Reform Can Spur Green Chemistry. Dr. Richard Denison, 18 November, 2010.
2 UC Centers for Occupational and Environmental Health, Green Chemistry: Cornerstone to a Sustainable California. University of California.
3 Estimates calculated from input-output accounts for the U.S. economy using the IMPLAN 3.0 model. Direct employment is associated with the output produced by the chemical industry itself. Indirect employment is associated with jobs in other sectors which supply goods and services to the chemical industry. Estimates are based on 2008 data.
4 Data on value added comes from the U.S. Bureau of Economic Analysis (www.bea.gov). Value-added refers to the value of output produced less the costs of intermediate inputs used, and GDP is measured in terms of total value added.
5 ACC. 2010. Guide to the Business of Chemistry. American Chemistry Council, Washington, D.C.
6 Growth rates refer to growth of value-added in the relevant sectors.
7 The estimated elasticity of employment to real output of non-pharmaceutical chemicals (i.e. the value of shipments adjusted by the producer price index for the chemicals industry) is -0.98 from 1992 to 2010 in a simple bivariate regression. The estimated elasticity of employment to output of pharmaceuticals (again, the value of shipments adjusted by the producer price index for pharmaceuticals) is 0.56 over the same time period. These estimates are based on monthly data from U.S. Census Bureau and the Bureau of Labor Statistics.
8 These estimates were calculated as follows: data were taken from the U.S. Bureau of Labor Statistics and the 2010 Guide to the Business of Chemistry, American Chemistry Council, Washington, D.C. Using simple regression analysis over the period 1989 to 2009, the average annual trend in the U.S. share of global production is -0.14 percentage points. This implies a drop in the U.S. share from 19.6 percent in 2009 to 16.7 percent in 2030. The American Chemistry Council projects annual global growth of output to average 4.5 percent from 2011 to 2020. This same growth rate was extended up to 2030 for the purposes of this exercise. In addition, share of non-pharmaceutical chemicals in total chemical production was assumed to remain constant. Regression analysis of the ratio of non-pharmaceutical employment to real output (expressed in 2009 dollars) over the period 1990-2009 finds that the trend rate of change is approximately -6.5 percent per year. Using this information and assuming that the trends continue into the future, employment in non-pharmaceutical chemicals is estimated to fall from an average level of 518,000 for the 12 months of 2009 to 271,000 in 2030, a loss of 247,000 jobs compared to the average level in 2009 or a loss of about 233,000 jobs compared to total non-pharmaceutical employment in December 2010.
9 The expectations of global growth come from the Global Chemistry Expectations, American Chemistry Council, 2010. According to these projections, real output is expected to grow by 5.4 percent in 2011, 5.1 percent in 2012, 4.8 percent in 2013, 4.5 percent in 2014, and 4.2 percent in 2015-2020. Averaging across these 10 years yields an average annual growth rate of 4.5 percent.
10 Job losses are allocated on the basis of each state’s share of employment in non-pharmaceutical chemicals in 2009. Data come from the U.S. Quarterly Census of Employment and Wages (QCEW).
11 The value of output is different from the value added figures cited earlier. Value-added is equal to the value of output less the value of intermediate inputs. Gross Domestic Product, or GDP, is measured in terms of value-added.
12 According to the U.S. Bureau of Economic Analysis, the average annual growth rate of the nominal value of gross output for the chemical industry as a whole was 4.1 percent from 1992 to 2009 (www.bea.gov). Data from the U.S. Census Department on the value of manufacturers’ shipments allow us to calculate similar growth rates for the chemical industry, excluding pharmaceuticals (www.census.gov). The average annual growth rate of the value of output of the non-pharmaceutical chemical industry was approximately 4.5 percent from 1992 to 2010.
13 ACC. 2010. Guide to the Business of Chemistry. American Chemistry Council, Washington, D.C. According to the ACC (2010), China imports more chemicals than Japan. In terms of net exports (i.e. exports minus imports), Japan has a more favorable balance than China.
14 ACC. 2010. Guide to the Business of Chemistry. American Chemistry Council, Washington, D.C.
15 Employment estimates of majority-owned affiliates of U.S. companies and majority-owned affiliates of foreign companies all come from the U.S. Bureau of Economic Analysis (ww.bea.gov).
16 The use of the term ‘organic’ in chemistry refers to chemical compounds based on carbon. It does not imply that such chemicals are inherently safer or ‘greener’ than inorganic chemicals.
17 ACC. 2010. Guide to the Business of Chemistry. American Chemistry Council, Washington, D.C.
18 EPA has the authority to license pesticides under the Federal Insecticide, Fungicide, and Rodenticide Act (FIFRA) and the Food Quality Protection Act of 1996.
19 This definition draws on the definition of green chemistry presented in a 2006 policy report from the California Policy Research Center, University of California, Berkeley. Wilson, Michael (with Daniel Chia and Bryan Ehlers), 2006. Green Chemistry in California: A Framework for Leadership in Chemicals Policy and Innovation, California Policy Research Center, University of California, Berkeley.
20 Webcast of Dr. Paul Anastas, Green Chemistry: Collaborative Approaches & New Solutions, University of California, Berkeley Conference, March 24, 2011 (http://bcgc.berkeley.edu). Link to webcast: http://www.youtube.com/user/citrisuc#p/c/E91175AF9EB3C1F3/2/9HhBSd8ntsQ.
21 Anastas and Warner (1998) have outlined 12 principles of green chemistry which are commonly used. It should be noted that translating these principles into a precise definition of an industrial sub-sector and measuring the size of these activities using existing statistical sources remain significant challenges. Anastas, P. T., Warner, J. C. 1998. Green Chemistry: Theory and Practice, Oxford University Press: New York.
22 UC Centers for Occupational and Environmental Health. 2008. Green Chemistry: Cornerstone to a Sustainable California. University of California.
23 ICIS. 2010. Innovative packaging aims to cut supply chain footprint. ICIS Chemical Business. 11 November 2010.
24 Shen, Li, Haufe, Juliane, and Patel, Martin K. 2009. Product Overview and Market Projection of Emerging Bio-based Plastics. PRO-BIP 2009. Report commissioned by European Polysaccharide Network of Excellence and European Bioplastics. Copernicus Institute for Sustainable Development and Innovation, Utrecht University, Netherlands.
25 http://www.nokia.com/environment/devices-and-services/creating-our-products/materials-and-substances.
26 ICIS. 2010. Innovative packaging aims to cut supply chain footprint. ICIS Chemical Business. 11 November 2010.
27 Watson, Rob. 2009. Green Building Market and Impact Report 2009. GreenerBuildings.com. Greener World Media, Oakland, CA.
28 Lent, Tom. 2010. New EPA study confirms health dangers of formaldehyde; Pharos reviews formaldehyde-free insulations. June 3, 2010. Pharos Project. www.pharosproject.net/index/blog/mode/detail/record/63/formaldehyde-free-insulation.
ENDNOTES
40 The Economic Benefits of a Green Chemical Industry in the United States
29 Lent, Tom. 2010. New EPA study confirms health dangers of formaldehyde; Pharos reviews formaldehyde-free insulations. June 3, 2010. Pharos Project. www.pharosproject.net/index/blog/mode/detail/record/63/formaldehyde-free-insulation.
30 Healthy Building Network. 2008. Toxic chemicals in building materials. Fact sheet. May. www.healthybuilding.net/healthcare/Toxic Chemicals in Building Materials.pdf.
31 See www.saferchemicals.org/PDF/resources/ConstructionSpecialties_casestudy.pdf and www.c-sgroup.com.
32 www.bccresearch.com/report/CHM014J.html.
33 www.chemsec.org/rohs/alternative-flame-retardants.
34 European Flame Retardants Association. 2010. Flame Retardants for a Changing Society. EFRA, Brussels.
35 ACC. 2010. Guide to the Business of Chemistry. American Chemistry Council, Washington D.C.
36 Testimony of Kathy Gerwig, Vice President for Workplace Safety and Environmental Stewardship Officer, Kaiser Permanente, at the Senate Committee on Environment and Public Works Subcommittee on Superfund, Toxics and Environmental Health Hearing on Business Perspectives on Reforming U.S. Chemical Safety Laws. March 9, 2010. http://epw.senate.gov/public/index.cfm?FuseAction=Files.View&FileStore_id=4acbc06b-75d1-41f8-b06b-e606bd681cfb
37 Natural Products Outperform the Overall Personal Care Market. Natural Cosmetic News (posted 18 February, 2011). http://www.naturalcosmeticnews.com/focus/natural-products-outperform-the-overall-personal-care-market/
38 Procter and Gamble. 2010. Now and For Generations to Come: 2010 Sustainability Overview. http://www.pg.com/en_US/downloads/ sustainability/reports/ PG_2010_Sustainability_Overview.pdf.
39 Madsen, Travis, Benjamin Davis, Shelley Vinyard, and John Rumpler. 2011. Safer by Design: Business can Replace Toxic Ingredients through Green Chemistry. Environment America Research and Policy Center. Boston, MA.
40 http://www.safecosmetics.org/downloads/Procter-Gamble-letter_March2010.pdf.
41 http://www.seventhgeneration.com/show-whats-inside/cleaning-products-ingredients-guide.
42 http://www.saferchemicals.org/resources/business/seventh-generation.html.
43 The discussion of TSCA, REACH, and regulatory proposals focuses on ‘industrial chemicals’, which typically exclude chemicals regulated under use-specific statutes. Chemicals used only as pharmaceuticals, cosmetic ingredients, pesticides or food additives, which are regulated under other statutes, are generally not considered ‘industrial chemicals.’ The term is not intended to mean that such chemicals are used only in industry; many ‘industrial chemicals’ are also present in consumer products.
44 GAO 2007. Chemical Regulation. Comparison of U.S. and Recently Enacted European Union Approaches to Protect Against the Risks of Toxic Chemicals. GAO-07-825. Washington, D.C.
45 Reporting requirements on new chemicals are generally limited to information on production volumes, basic information on processing, and a description of the number of employees that may be exposed to the product in the workplace.
46 American Chemical Society Webinar. How Chemicals Policy Reform Can Spur Green Chemistry. Dr. Richard Denison, 18 November, 2010.
47 For a summary of REACH from the European Commission, see http://ec.europa.eu/environment/chemicals/reach/reach_intro.htm.
48 GAO 2007. Chemical Regulation. Comparison of U.S. and Recently Enacted European Union Approaches to Protect Against the Risks of Toxic Chemicals. GAO-07-825. Washington, D.C.
49 GAO 2007. Chemical Regulation. Comparison of U.S. and Recently Enacted European Union Approaches to Protect Against the Risks of Toxic Chemicals. GAO-07-825. Washington, D.C.
50 www.chemicalspolicy.org/chemicalspolicy.canada.php. Accessed Jan. 3, 2011.
51 Richard Denison. Blog post. Data and safety requirements for new chemicals: China blows past the US. November 16, 2010. Environmental Defense Fund, Chemicals and Nanomaterials Blog. blogs.edf.org/nanotechnology/2010/11/16/data-and-safety-requirements-for-new-chemicals-china-blows-past-the-us/.
52 Wilson, Michael (with Daniel Chia and Bryan Ehlers) 2006. Green Chemistry in California: A Framework for Leadership in Chemicals Policy and Innovation. California Policy Research Center, University of California, Berkeley.
53 Shapiro, Mark. 2006. Exposed: The Toxic Chemistry of Everyday Products and What’s at Stake for American Power. White River Junction, VT: Chelsea Green.
54 See www.safercosmetics.org and Shapiro, Mark. 2007. Exposed: The Toxic Chemistry of Everyday Products and What’s at Stake for American Power. White River Junction, VT: Chelsea Green.
55 Belliveau, Michael. 2010. Healthy States: Protecting Families from Toxic Chemicals while Congress Lags Behind. Report published by Safer Chemicals Healthy Families (www.saferchemicals.org) and Safer States (www.saferstates.com). November 2010.
56 The full text of the Senate bill can be found at http://lautenberg.senate.gov/assets/SafeChem.pdf and the full text of the House bill can be found at http://thomas.loc.gov/cgi-bin/bdquery/z?d111:h5820:.
57 The House Bill and Senate Bill are similar, yet differ somewhat in terms of specific details. Box 2 summarizes the main provisions of the 2011 Senate Bill.
58 Safer Chemicals Healthy Families, House and Senate Bill Analysis: Legislation Introduced to Reform U.S. Chemical Law. September, 2010 (www.saferchemicals.org/PDF/resources/schf-bill-analysis-9sept10.pdf).
59 American Chemical Society Webinar. How Chemicals Policy Reform Can Spur Green Chemistry. Dr. Richard Denison, 18 November, 2010.
60 Landrigan, Philip J., Clyde B. Schechter, Jeffrey M. Lipton, Marianne C. Fahs, and Joel Schwartz. Environmental pollutants and disease in American children: estimates of morbidity, mortality, and costs for lead poisoning, asthma, cancer, and developmental disabilities. Environmental Health Perspectives. 110(7): 721-28.
61 Wilson, Michael (with Daniel Chia and Bryan Ehlers) 2006. Green Chemistry in California: A Framework for Leadership in Chemicals Policy and Innovation. California Policy Research Center, University of California, Berkeley.
62 National Cancer Institute. 2010. Reducing Environmental Cancer Risk: What we can do now. 2008-9 Annual Report of the President’s Cancer Panel. Washington, D.C.
63 Wilson, Michael (with Daniel Chia and Bryan Ehlers) 2006. Green Chemistry in California: A Framework for Leadership in Chemicals Policy and Innovation. California Policy Research Center, University of California, Berkeley.
64 Prüss-Ustün, Annette, Carolyn Vickers, Pascal Haeflinger, and Roberto Bertollini. 2011. Knowns and unknowns on burden of disease due to chemicals: a systematic review. Environmental Health 10(9), open access. The chemical exposures considered in the report include: chemicals involved in unintentional acute poisoning, chemicals involved in unintentional occupational poisoning, pesticides involved in self-inflicted injuries, asbestos, occupational lung carcinogens, occupational leukaemogens, occupational particulates, outdoor air pollutants, indoor air pollutants from solid fuel combustion, second-hand smoke, lead, and arsenic in drinking water.

41The Economic Benefits of a Green Chemical Industry in the United States
65 Landrigan, Philip J., Clyde B. Schechter, Jeffrey M. Lipton, Marianne C. Fahs, and Joel Schwartz. Environmental pollutants and disease in American children: estimates of morbidity, mortality, and costs for lead poisoning, asthma, cancer, and developmental disabilities. Environmental Health Perspectives. 110(7): 721-28. Safer Chemicals Healthy Families. 2010. The health case for reforming the Toxic Substances Control Act. January 2010.
66 For more information, see Becker, Monica, Sally Edwards, and Rachel Massey. 2010. Toxic chemicals in toys and children’s products: limitations of current responses and recommendations for government and industry. Environmental Science and Technology. 44: 7986-91.
67 Mulvey, Jeanette. Toxic toys create silver lining for green toy companies. Business News Daily, Dec. 19,2010.
68 Belliveau, Michael. 2010. Healthy States: Protecting Families from Toxic Chemicals while Congress Lags Behind. Report published by Safer Chemicals Healthy Families (www.saferchemicals.org) and Safer States (www.saferstates.com). November 2010.
69 Mulvey, Jeanette. Toxic toys create silver lining for green toy companies. Business News Daily, Dec. 19,2010.
70 www.besafenet.com/pvc/other_retailers_and_companies.htm (accessed Jan. 15, 2011).
71 Madsen, Travis, Benjamin Davis, Shelley Vinyard, and John Rumpler. 2011. Safer by Design: Business can Replace Toxic Ingredients through Green Chemistry. Environment America Research and Policy Center. Boston, MA.
72 Madsen, Travis, Benjamin Davis, Shelley Vinyard, and John Rumpler. 2011. Safer by Design: Business can Replace Toxic Ingredients through Green Chemistry. Environment America Research and Policy Center. Boston, MA.
73 Innovest. 2007. Overview of the Chemical Industry. Report prepared by Innovest Strategic Value Advisors. New York.
74 Konar, Shameek and Mark A. Cohen. 2001. Does the market value environmental performance? Review of Economics and Statistics, 83(2): 281-9.
75 Quarterly Financial Report, Manufacturing, Mining, and Trade Corporations. U.S. Census Department, Third quarter 2010. Note that the estimates value of assets in the entire chemical industry, including pharmaceuticals, was estimated to be $1.56 trillion in the third quarter of 2010.
76 Domazlicky, Bruce R. and William L. Weber. 2004. Does environmental protection lead to slower productivity growth in the chemical industry? Environmental and Resource Economics 28:301-24.
77 Berman, Eli and Linda T.M. Bui. 2001. Environmental regulation and productivity. Review of Economics and Statistics 83(3): 498-510.
78 The seminal paper on market failures and asymmetric information in product markets is Akerlof, George. 1970. The market for lemons: quality uncertainty and the market mechanism. Quarterly Journal of Economics 84(3): 488-500.
79 The fact that knowledge and information represent non-excludable and non-rival goods features prominently in economic models of endogenous change. See the classic paper: Romer, John. 1990. Endogenous technological change, Journal of Political Economy, 98(5): 71-102. In such models, the public goods nature of innovation means that markets will undersupply investment in technology. Interventions, such as publicly supported research and development or the creation of intellectual property rights, are needed to improve growth.
80 Hogue, Cheryl. 2011. Trade secret anxiety. Chemical and Engineering News. 89(14), April 4th.
81 Hogue, Cheryl. 2011. Trade secret anxiety. Chemical and Engineering News. 89(14), April 4th.
82 Denison, Richard A. 2007. Not that Innocent: A comparative analysis of Canadian, European Union, and United States policies on industrial chemicals. Research report. Environmental Defense and Pollution Probe.
83 Personal communication, Dr. Richard Denison, April 4th, 2011.
84 Denison, Richard A. 2007. Not that Innocent: A comparative analysis of Canadian, European Union, and United States policies on industrial chemicals. Research report. Environmental Defense and Pollution Probe.
85 American Chemical Society Webinar. How Chemicals Policy Reform Can Spur Green Chemistry. Dr. Richard Denison, 18 November, 2010.
86 GAO. 2007. Chemical Regulation. Comparison of U.S. and Recently Enacted European Union Approaches to Protect Against the Risks of Toxic Chemicals. GAO-07-825. Washington, D.C.
87 GAO. 2007. Chemical Regulation. Comparison of U.S. and Recently Enacted European Union Approaches to Protect Against the Risks of Toxic Chemicals. GAO-07-825. Washington, D.C.
88 Arora, Ashish and Alfonso Gambardella. 2010. Implications for energy innovation from the chemical industry. NBER Working Paper 15676, Cambridge, MA.
89 ACC 2010. Guide to the Business of Chemistry. American Chemistry Council, Washington D.C.
90 Wolfe, Raymond M. 2010. U.S. Business Report 2008 Worldwide R&D Expense of $330 Billion: Findings from New NSF Survey. InfoBrief NSF 10-322. NSF Division of Science Resource Statistics. Arlington, VA.
91 ACC 2010. Guide to the Business of Chemistry. American Chemistry Council, Washington D.C.
92 Moris, Francisco and Nirmala Kannankutty. 2010. New Employment Statistics from the 2008 Business R&D and Innovation Survey. InfoBrief NSF 10-326. NSF Division of Science Resource Statistics. Arlington, VA.
93 We use the ACC statistics to examine trends because of possible issues of comparability over time in the series from the National Science Foundation.
94 The ACC data on R&D spending for pharmaceutical companies contains an anomaly for the year 1994 – 7.7 percent of shipments. In Figure 7, we extrapolate from the other data points to estimate the value in 1994 – 15.2 percent. This is the number used in the figure.
95 ACC 2010. Guide to the Business of Chemistry. American Chemistry Council, Washington D.C.
96 This is based on the 66 out of 100 companies for which R&D data is available. See ICIS. 2010. Top 100. September.
97 Ashford, Nicholas A., Christine Ayers, and Robert Stone. 1985. Using Regulation to Change the Market for Innovation. Harvard Environmental Law Review. 9(2): 419-66.
98 Porter, Michael. 1991. America’s green strategy. Scientific American, April, p. 168.
99 Although often referred to as the “Porter Hypothesis,” the idea that regulations can spur technological innovation pre-dates Porter’s 1991 article.
100 Some examples over the past 12 years include Heidi Pickman, 1998, The Effect of Environmental Regulation on Environmental Innovation, Business Strategy and the Environment, 223-33; Mariana Coria, Regulation and the Chemical Industry, manuscript, 2007; and Stefan Ambec, Mark A. Cohen, Stewart Elgie, and Paul Lanoie, The Porter Hypthosis at 20: Can Environmental Regulation Enhance Innovation and Competitiveness? Scientific Series, CIRANO, Montreal, August 2010.
101 Stefan Ambec, Mark A. Cohen, Stewart Elgie, and Paul Lanoie, 2010. The Porter Hypthosis at 20: Can Environmental Regulation Enhance Innovation and Competitiveness? Scientific Series, CIRANO, Montreal.
102 Henzelmann, Torsten, Stefanie Mehner, and Thilo Zelt. 2007. Innovative environmental growth markets from a company perspective. Research Report prepared for the German Federal Ministry for the Environment, Nature Conservation, and Nuclear Safety. Roland Berger Strategy Consultants.
103 http://www.eastman.com/brands/eastman_tritan/Pages/Overview.aspx.
104 Monssen, Melanie. 2005. Environmental innovations in the chemical industry – case studies in a historical perspective. Sustainability and Innovation. Springer.
42 The Economic Benefits of a Green Chemical Industry in the United States
105 Jaffe, Adam B. and Karen Palmer. 1997. Environmental regulation and innovation: a panel data study. Review of Economics and Statistics 79(4): 610-19.
106 Ashford, Nicholas A., Christine Ayers, and Robert Stone. 1985. Using Regulation to Change the Market for Innovation. Harvard Environmental Law Review. 9(2): 419-66.
107 http://blogs.edf.org/nanotechnology/2010/05/09/raising-the-bar-for-chemical-safety-will-spur-not-stifle-innovation/.
108 See www.chemicalspolicy.org for additional details.
109 ACC 2010. Guide to the Business of Chemistry. American Chemistry Council, Washington D.C.
110 Military research has contributed to major technological leaps forward, from aviation to computer technology to the Internet.
111 See www.epa.gov/gcc/.
112 Based on the text of the bills introduced into the 110th Congress (2007-8): S.2669 and H.R. 2850.
113 COMPETES stands for Creating Opportunities to Meaningfully Promote Excellence in Technology, Education, and Science.
114 UC Centers for Occupational and Environmental Health. 2008. Green Chemistry: Cornerstone to a Sustainable California. University of California.
115 Personal communication, Dr. Julie Haack, University of Oregon. April 6th, 2011.
116 Personal communication, Dr. Julie Haack, University of Oregon. April 6th, 2011.
117 For more information, see http://www.greencentrecanada.com.
118 http://www.greencentrecanada.com/technologies/.
119 Biotechnology Industry Organization. 2010. Bio-based Chemicals and Products: A new driver of U.S. economic development and green jobs. Washington, D.C.
120 Price levels are measured by the Bureau of Labor Statistics producer price index for the chemical industry and for pharmaceutical manufacturing. Output is expressed in 2009 dollars.
121 U.S. Department of Agriculture. 2008. U.S. Bio-based Products Market Potential and Projections Through 2025. USDA, Washington, D.C.
122 The U.S. Commerce Department’s Bureau of Economic Analysis maintains input-output data for the U.S. economy. We use the IMPLAN 3.0 input-output model to generate the estimates in this report.
123 Shen, Li, Haufe, Juliane, and Patel, Martin K. 2009. Product Overview and Market Projection of Emerging Bio-based Plastics. PRO-BIP 2009. Report commissioned by European Polysaccharide Network of Excellence and European Bioplastics. Copernicus Institute for Sustainable Development and Innovation, Utrecht University, Netherlands.
124 The Bureau of Economic Analysis estimates that the value of output was $205 billion in 2007. This dropped somewhat during the 2008-9 recession.
125 This multiplier comes directly from the IMPLAN 3.0 input-output model.
126 For bioplastics, the employment multiplier was estimated as follows. The direct employment effect is identical to that for traditional plastics (1.2 jobs per $1 million in output). Similarly, the indirect employment effects in service industries were assumed to be the same (2.3 jobs per $1 million in output). However, we assume that the indirect effects for sectors producing goods as inputs into plastic production were four times as large — based on the multipliers for bio-based feedstocks relative to petroleum-based feedstocks. That is, the indirect effects for goods producing industries was estimated to be 3.4 jobs per $1 million in output for bioplastics compared to 0.85 jobs per $1 million in output for traditional plastics. Therefore the employment multiplier for bioplastics, including both direct and indirect effects, was estimated to be 1.2 + 2.3 + 3.4 = 6.9 jobs per $1 million in output.
127 Pollin, Robert, Jeannette Wicks-Lim, and Heidi Garrett-Peltier. 2009. Green Prosperity: How Clean Energy Policies Can Fight Poverty and Raising Living Standards in the United States. Political Economy Research Institute, Natural Resources Defense Council, and Green for All.
128 http://ec.europa.eu/enterprise/sectors/chemicals/documents/reach/archives/impact-assessment/index_en.htm.
129 The costs of the REACH legislation do not occur at a single moment and are spread out over a period of time. Therefore, the present value of these costs flows are used to estimate the total impact of the REACH policy on costs.
130 Holthuis, Egbert. 2003. Evaluation of Testing and Registration Costs. Presentation for Workshop on the Reach Impact Assessment. http://ec.europa.eu/enterprise/sectors/chemicals/files/reach/presentat1-2003_11_21_en.pdf.
131 Enterprise Directorate-General of the European Commission. 2003. Assessing the Impacts of REACH on Downstream Users. Presentation for Workshop on the Reach Impact Assessment. http://ec.europa.eu/enterprise/sectors/chemicals/files/reach/presentat4-2003_11_21_en.pdf.
132 Eurostat. 2007. European Business Facts and Figures. Eurostat, Luxembourg.
133 KPMG Business Advisory Services. 2005. REACH - Further Work on Impact Assessment: a case study approach. Report prepared based on a memorandum of understanding between the European Commission and UNICE/CEFIC.
134 U.S. Department of Agriculture. 2008. U.S. Bio-based Products Market Potential and Projections Through 2025. USDA, Washington, D.C.
135 The jobs are domestic jobs, since any employment losses due to imported goods and services are taken into account when calculating the employment multipliers.
136 Muro, Mark and Kenan Fikri. 2011. Job Creation on a Budget: How regional industry clusters can add jobs, bolster entrepreneurship, and spark innovation. Brookings-Rockefeller Project on State and Metropolitan Innovation. Brookings Institution (Washington, D.C.) and Rockefeller Foundation (New York).
137 Office of Management and Budget. 2010. 2010 Report to Congress on the Benefits and Costs of Federal Regulations and Unfunded Mandates on State, Local, and Tribal Entities. Washington, D.C.

