renn, s.c.p., aubin-horth, n. and hofmann, h.a. (2008)
TRANSCRIPT
3041
INTRODUCTIONBrain and behavior are sculpted by a dynamic interplay betweengenotype and environment. Changes in social status mediate changesin a wide range of molecular, neuroanatomical, endocrine andbehavioral characteristics (Oliveira et al., 2002; Fernald, 2004;Sapolsky, 2005) at different time scales (Hofmann, 2003). Nervoussystems respond by modulating neural properties andneuroendocrine responses. Such rapid, short-term changes will oftenlead to sustained, longer-term changes in the brain and behavior viadifferential gene expression, leading to subsequent structural andphysiological changes. However, few studies have attempted todetermine the molecular underpinnings of socially regulatedphenotypes within a comprehensive genomic framework, especiallyin vertebrates. In the present study, we apply a molecular systemsapproach in a highly social fish species to ask how social contextregulates the molecular and physiological substrates that, in turn,sculpt subsequent behavior.
The African cichlid fish, Astatotilapia burtoni (TaxonomicAuthority) (formerly Haplochromis burtoni) has become animportant model system to study the mechanisms underlyingsocially mediated behavioral change. In this species, 20–30% ofmales are dominant (D), slow growing, brightly coloured andactively defend territories for mating. The remaining subordinate(S) males mimic females by schooling and displaying crypticcoloration, while experiencing faster growth (Fernald, 1977;Hofmann et al., 1999a). Subordinate males show little aggression
and territoriality and, importantly, have regressed gonads and arethus not reproductive (Fernald and Hirata, 1977a; Fernald and Hirata,1977b; Francis et al., 1993). These behavioral and physiologicalcharacteristics are plastic and influenced by the immediate socialenvironment, such that an individual male switches between the Dand S phenotypes several times during its life depending upon itsrelative ability to obtain and maintain access to a territory throughencounters with other males (Hofmann et al., 1999a). Environmentalconditions, availability of territorial shelters, relative body size andphysiological condition influence the probability of acquiring andmaintaining a territory. The phenotypic switch occurs over atimescale of minutes to days to weeks in both the field and thelaboratory (White et al., 2002; Hofmann, 2003; Burmeister et al.,2005).
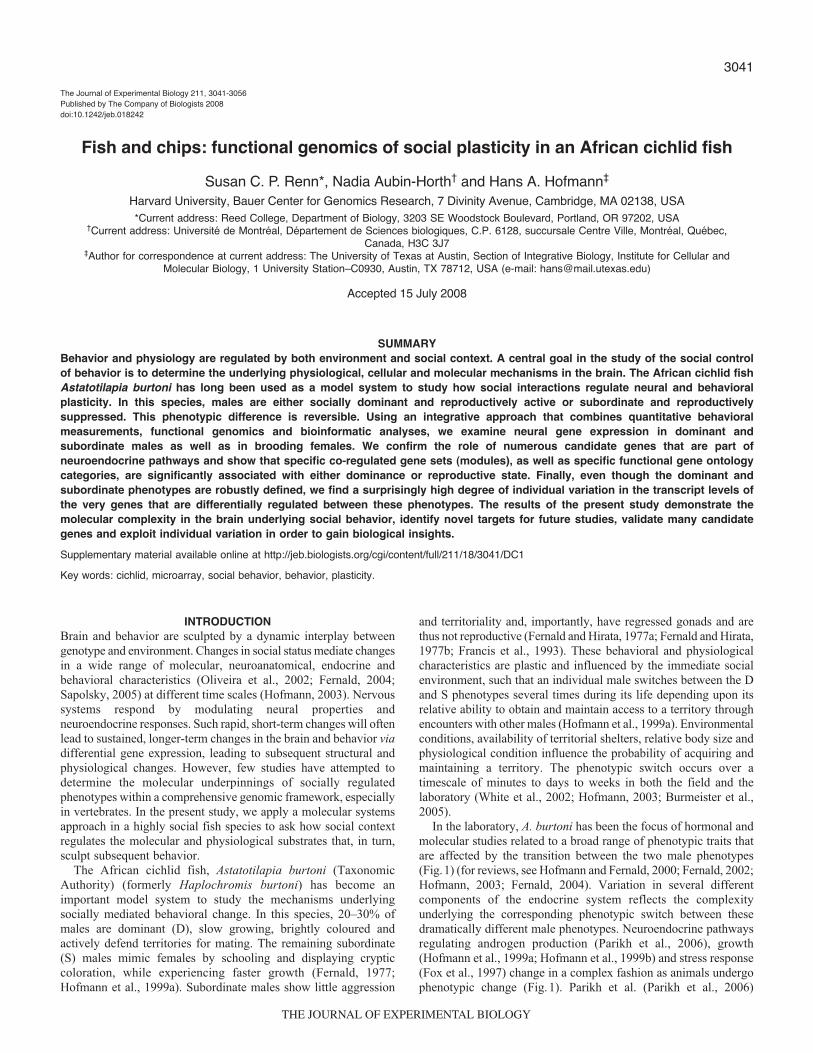
In the laboratory, A. burtoni has been the focus of hormonal andmolecular studies related to a broad range of phenotypic traits thatare affected by the transition between the two male phenotypes(Fig.1) (for reviews, see Hofmann and Fernald, 2000; Fernald, 2002;Hofmann, 2003; Fernald, 2004). Variation in several differentcomponents of the endocrine system reflects the complexityunderlying the corresponding phenotypic switch between thesedramatically different male phenotypes. Neuroendocrine pathwaysregulating androgen production (Parikh et al., 2006), growth(Hofmann et al., 1999a; Hofmann et al., 1999b) and stress response(Fox et al., 1997) change in a complex fashion as animals undergophenotypic change (Fig.1). Parikh et al. (Parikh et al., 2006)
The Journal of Experimental Biology 211, 3041-3056Published by The Company of Biologists 2008doi:10.1242/jeb.018242
Fish and chips: functional genomics of social plasticity in an African cichlid fishSusan C. P. Renn*, Nadia Aubin-Horth† and Hans A. Hofmann‡
Harvard University, Bauer Center for Genomics Research, 7 Divinity Avenue, Cambridge, MA 02138, USA*Current address: Reed College, Department of Biology, 3203 SE Woodstock Boulevard, Portland, OR 97202, USA
†Current address: Université de Montréal, Département de Sciences biologiques, C.P. 6128, succursale Centre Ville, Montréal, Québec, Canada, H3C 3J7
‡Author for correspondence at current address: The University of Texas at Austin, Section of Integrative Biology, Institute for Cellular andMolecular Biology, 1 University Station–C0930, Austin, TX 78712, USA (e-mail: [email protected])
Accepted 15 July 2008
SUMMARYBehavior and physiology are regulated by both environment and social context. A central goal in the study of the social controlof behavior is to determine the underlying physiological, cellular and molecular mechanisms in the brain. The African cichlid fishAstatotilapia burtoni has long been used as a model system to study how social interactions regulate neural and behavioralplasticity. In this species, males are either socially dominant and reproductively active or subordinate and reproductivelysuppressed. This phenotypic difference is reversible. Using an integrative approach that combines quantitative behavioralmeasurements, functional genomics and bioinformatic analyses, we examine neural gene expression in dominant andsubordinate males as well as in brooding females. We confirm the role of numerous candidate genes that are part ofneuroendocrine pathways and show that specific co-regulated gene sets (modules), as well as specific functional gene ontologycategories, are significantly associated with either dominance or reproductive state. Finally, even though the dominant andsubordinate phenotypes are robustly defined, we find a surprisingly high degree of individual variation in the transcript levels ofthe very genes that are differentially regulated between these phenotypes. The results of the present study demonstrate themolecular complexity in the brain underlying social behavior, identify novel targets for future studies, validate many candidategenes and exploit individual variation in order to gain biological insights.Supplementary material available online at http://jeb.biologists.org/cgi/content/full/211/18/3041/DC1Key words: cichlid, microarray, social behavior, behavior, plasticity.

3042
suggested that the higher levels of testosterone (T) and11–ketotestosterone (11–KT) that they measured in D males mightpromote aggressive behavior, as has been shown using androgenmanipulation in other fish species. Production and release ofneuropeptides and neuromodulators such as gonadotropin-releasinghormone (GnRH1) (White et al., 2002) and somatostatin (Hofmannand Fernald, 2000; Trainor and Hofmann, 2006; Trainor andHofmann, 2007) are higher in dominant males. According to Whiteet al., GnRH1 mRNA levels and gonadosomatic index (GSI) (ameasure of gonadal development) are positively correlated (Whiteet al., 2002). The higher level of GnRH1 in D males coincides withterritory acquisition and mating opportunity; as such, it is similarto GnRH changes in seasonally reproducing species (Amano et al.,1995; Dawson et al., 2001; Nelson, 2005; Hofmann, 2006).Fluctuations at the molecular level also co-vary with the observedbehavioral switch of male phenotype. In the case of GnRH (Parharet al., 2005; Au et al., 2006) and somatostatin (Trainor andHofmann, 2006), specific receptor sub-types are regulated accordingto social status. Furthermore, the membrane properties of GnRH1-expressing neurons, reduced excitability in S males correspond withthe differences in peptide release between D and S males(Greenwood and Fernald, 2004).
Manipulation of the social environment allows experimentalcontrol of the phenotypic switch (Francis et al., 1993; White et al.,2002; Burmeister et al., 2005). The ease of experimentalmanipulation is paired with a wealth of ecological and evolutionaryinformation available for haplochromine cichlids in general (for areview, see Kocher, 2004; Salzburger et al., 2005). For example,there is thought to be a trade-off between reproduction and survival,such that territorial males, the sole reproducers, are also subject tohigher mortality rates through predation, probably due to theirconspicuous coloration (Fernald and Hirata, 1977a; Fernald andHirata, 1977b; Maan et al., 2008). Furthermore, A. burtoni iscurrently undergoing whole-genome sequencing, along with threeother African cichlid species (see www.broad.mit.edu/models/tilapia/), and thus offers an unrivaled laboratory-based model
system for the genomic analysis of complex and ecologicallyrelevant phenotypes.
cDNA microarrays for transcript profiling, have become apowerful tool when applied to species of behavioral, ecological orevolutionary interest [e.g. alternative life histories (Aubin-Horth etal., 2005), cooperative breeding (Aubin-Horth et al., 2007), socialbehavior (Grozinger and Robinson, 2002; Whitfield et al., 2003;Robinson et al., 2005), response to heat stress (Buckley et al., 2006),response to environmental estrogens (Martyniuk et al., 2006) andphysiology of drug addiction (Rhodes and Crabbe, 2005)]. In thepresent study, we employ a microarray platform that contains manyknown candidate genes as well as ~4000 brain-derived cichlidcDNAs (Renn et al., 2004). Such a combined candidate gene andgenomic strategy allows hypothesis-driven and discovery-basedexperiments on a single platform. The obviously complex nature ofbehavioral traits – such as this socially regulated, reversible switchbetween D and S phenotypes – requires a discovery-based approachin order to identify the many genes involved.
In the present study, we analyze gene transcript patterns forreproductively active D males and reproductively suppressed Smales as well as for brooding females. We then compare theexpression patterns for each of the three phenotypes in order toidentify gene sets associated with reproduction or dominancebehavior, providing insight into the molecular modularity underlyingthese phenotypes. Next, we annotate the array features accordingto gene ontology (GO), with the goal of identifying gene regulationwithin molecular categories free of a priori expectations orexperimenter bias. Finally, we examine variation in gene expressionpatterns between individual animals within a social phenotype andask whether any of these variable genes are also those that aredifferentially expressed between the social phenotypes.
MATERIALS AND METHODSAnimals
Astatotilapia burtoni (Günter) from a wild-caught stock populationwere kept in aquaria under conditions mimicking their naturalenvironment (Fernald and Hirata, 1977b): pH8.0, 28°C watertemperature and 12h:12h light:dark cycle. Gravel substrate andterracotta shelters allowed the establishment and maintenance ofterritories necessary for reproduction (Fernald and Hirata, 1977a).Fish were fed every morning with cichlid pellets and flakes. Allwork was carried out in compliance with Animal Care and UseGuidelines.
Behavioral experimentsMales were marked using colored bead combinations attached nearto the dorsal fin. Nine groups of 2–3 males with 2–3 gravid femaleswere established in half of a 100 liters aquarium. Each group wasvisually isolated from neighboring fish. Ten-minute behavioralobservations were made approximately twice every week for fiveweeks by directly observing chasing, threat, display, border threat,courtship, flee, schooling and carousel (as described by Fernald,1977). Behavioral measures were used to calculate a dominanceindex (DI), i.e. the sum of all aggressive behaviors observed (threat,chasing, border threat and carousel) minus the number of submissivebehaviors observed (flee) and a reproductive index (RI), i.e. the totalof all reproductive behaviors (court, dig, spawn). On the final dayof the experiment, males of each status were taken for geneexpression profiling only if they had continuously expressed eitherthe D or S phenotype for the past 28days. Six mouth-broodingfemales were also selected for expression profiling. The 18 fish usedfor gene expression analysis were obtained from a total of seven
S. C. P. Renn, N. Aubin-Horth and H. A. Hofmann
Testosterone
GnRH1
Cortisol
Somatostatin
Growth hormone
Dominance
Coloration
Gonad size
Growth
A
B
D>SS>D Dominant Subordinate
D>SS>D
Subordinate
Dominant SubordinateSubordinate
Fig. 1. Schematic representation of (A) phenotypic and (B) physiologicalcharacteristics associated with dominant (D) and subordinate (S) malephenotypes in A. burtoni. The graphs are based on the following studies:gonad size (Hofmann and Fernald, 2000); growth (Hofmann et al., 1999a);GnRH1 (White et al., 2002); testosterone (Francis et al., 1993);somatostatin (Hofmann and Fernald, 2000); growth hormone (Hofmann etal., 1999b); and cortisol (Fox et al., 1997).

3043Functional genomics of social phenotype
different groups on the basis of stable phenotype. For the purposeof hybridization design the animals were treated as equivalent withinphenotype, though comparisons between individuals can be madeindirectly (see below). Close inspection of the behavioral andmicroarray data did not reveal any covariation between animalsderived from the same social group. Standard length, body massand gonad mass were measured for each fish in order to calculatethe GSI as gonad mass/body mass. Condition factor (CF) wascalculated based on the residuals from the regression of body masson standard length for before and after the experiment (r2=0.95;P=2.79!10–6), and growth rate (GR) was calculated as the relativechange in standard length over the course of the experiment. Wholebrains were dissected and stored in RNAlater (Ambion, Austin, TX,USA) within 5min of initial tank disturbance.
The array used in the present study has numerous redundantfeatures, i.e. two or more features represent the same gene. Weexploited this property for quality control purposes and to assessthe sensitivity of the approach. For example, the array includes fourindependent features that represent the neuropeptide GnRH1 (twopreviously cloned cDNAs and two obtained independently from thecDNA library), known to be expressed in only ~300neurons andupregulated in D males (Davis and Fernald, 1990; White et al.,2002). All four features were similarly significantly differentiallyexpressed, being upregulated with dominance, and thus serve asboth a biological and a technical control demonstrating the sensitivityeven with whole-brain RNA.
Microarray analysisBrains were homogenized (Tissue tearor, Biospec products,Bartlesville, OK, USA) and total RNA was extracted according tostandard Trizol (Invitrogen, Carlsbad, CA, USA) and phase-lockgel (Eppendorf; Westbury, NY, USA) protocols. RNA integrity wasdetermined on the Bioanalyzer (Agilent; Santa Clara, CA, USA)and spectrophotometer (Agilent) prior to indirect RNA labelingprotocol, starting with 2µg of total RNA according to Renn et al.(Renn et al., 2004). Briefly, each RNA sample was labeled twice,once with Cy3 and once with Cy5. After purification fromunincorporated label, each sample was divided in two, combinedwith the appropriate samples and every individual was comparedwith two individuals from each of the other two phenotypes in abalanced loop design incorporating a dye-reversal (see below forhow to access annotation of submitted data at NCBI’s GEOdatabasefor further details). Targets were hybridized to the brain-specificcDNA array from A. burtoni (Renn et al., 2004) at 65°C for 12–16h.Arrays were scanned on an Axon 4000B arrays scanner (Genepix4.0; Molecular Devices, Sunnyvale, CA, USA). The loop designallows for the direct comparison of samples of interest, thus offeringgreater statistical power with fewer replicates (Churchill, 2002).
After filtering for bad feature morphology, hybridization artifactsand low intensity (<2s.d. above local background), raw data wereimported into R software [v.1.0 R-Development team, 2004, Vienna,Austria (R Development Core Team 2006)] and normalized usingthe Linear Models for Microarray Data package [LIMMA v.1.6.6(Smyth et al., 2004)]. Background-subtracted mean intensities werenormalized using a within-array printtip-lowess normalization andused to calculate ratios for a Bayesian analysis of gene expressionlevels [BAGEL v.3.6 (Townsend and Hartl, 2002)]. BAGEL takesadvantage of additional information obtained from transitivecomparisons of individuals in loop designs experiments (Townsendand Hartl, 2002; Churchill, 2002). Genes represented by more thanone feature on the array were only counted as significant if at leastone representative passed the significance threshold and the full
complement survived Fisher’s test of combining probabilities frommultiple tests of significance [p.794 in Sokal and Rohlf (Sokal andRohlf, 1995]. All raw and processed data are available atGEOdatabase (www.ncbi.nlm.nih.gov/projects/geo/), samplenumbers GSM267785–819 of series GSE10624.
Functional annotationThe clone templates for PCR amplification were end sequenced(Salzburger et al., 2008), resulting in 4258 expressed sequence tags(ESTs), 3670 of which were deemed to be of high quality andhave been submitted to GenBank (accession numberCN472211–CN468542) and are maintained at the Dana-FarberCancer Institute as a GeneIndex (http://compbio.dfci.harvard.edu/tgi/cgi-bin/tgi/gimain.pl?gudb=a_burtoni) such that 1280 clonescombine into 399 tentative contigs (TC), leaving 2381 singletonsequences for a total of 2780 unique sequences. Half (49.5%) of thesequences (1408 out of 2842) could be annotated with a ‘best hit’ ata threshold of e–12 or better according to BLAST alignment to UniProt(v.5.2). GO terms were applied to 869 unique cichlid genes bytransitive annotation, meaning that the GO annotations for a cichlidgene’s best hit were collected and used in the present study for furtheranalysis. In order to avoid species bias, we collected GO terms fromall genes with the same name as the best hit annotation. GOannotations also include confidence codes. The less reliableannotations derive from ‘inferred sequence similarity (ISS)’ or‘inferred electronic annotation (IEA)’ (The Gene OntologyConsortium, 2000), therefore we excluded those annotations whentransitively applying GO terms to the ESTs represented on the A.burtoni microarray. The resulting GO graphs [referred to as directedacyclic graphs (DAGs)] were then ‘slimmed’ to 183 terms and a totalof 4102 total annotations. For the ‘slimming’ process, the leaf-mostnodes that were selected to contain a minimum of 10 annotated cichlidsequences, and parent nodes were retained only if an additional 10cichlid sequences were annotated at that level.
Over- and under-representation of GO terms for a regulated set ofgenes was determined in Cytoscape (Shannon et al., 2003) using theBiological Network Gene Ontology tool, BiNGO (Maere et al., 2005),which relies upon hypergeometric statistical significance. As GOcategories are highly non-independent, the statistical treatment of theseterms is still under discussion (Ge et al., 2003). Also, owing to thesmall number of genes for each ontology term and the relatively smallnumber of genes that are regulated, there is less statistical power toidentify significantly under-represented GO terms. For these reasons,we use GO analysis as a hypothesis-generating tool and report onlyuncorrected hypergeometric P-values.
ClusteringPrior to clustering, features representing replicate ESTs were collapsedby combining probabilities from multiple tests of significance [p. 794in Sokal and Rohlf (Sokal and Rohlf, 1995)], and the mean expressionlevel was determined for each set of features. A hierarchical clusteringanalysis was applied to the list of genes that were significantlyregulated according to D, S and brooding female phenotypes. Theestimated gene expression levels were used to obtain the dissimilaritymatrix by applying Euclidian distance measure, which integrates theeffects of amplitude of ratios as well as direction (correlation) inpatterns. Clustering analysis of gene expression patterns of eachindividual was performed using the hclust function in R softwarev.2.0.1. Clustering was based on dissimilarity measures obtained usingthe dist functions in the stats package. The consensus tree andbootstrap confidence values for each tree node were obtained withthe consensus function in the maanova package (Wu et al., 2002).

3044
The consensus tree and confidence values were calculated as theproportion of trees obtained with bootstrapped datasets that agreedwith the original tree. Each bootstrapped tree was based on theEuclidian distance matrix calculated for each of 1000 permutated geneexpression profile datasets obtained by resampling with replacement.Alternate clustering methods and different measures of distance areavailable and are similarly appropriate for gene expression analysis.Hierarchical clustering, based upon all features on the full array ratherthan on regulated genes only, provided a similar tree with reducedconfidence values at each node (not shown). The heatmap functionand colour options in the package gplots were used to visualize clustersof gene expression, the z-transformed expression ratios were groupedby k-means function in the stats package of R and ordered as such,while the samples were ordered according to the consensushierarchical cluster. GO terms provide a means to address thepossible functional relationship of a cluster of genes that arecoordinately regulated. However, no statistically significant over- orunder-representation of GO terms was seen for any of the gene groupsidentified by the k-means clusters according to a hypergeometric test(not shown).
RESULTS AND DISCUSSIONMale dominance behavior and gene expression differences
Individually tagged males were placed into community tanks withfemales such that naturalistic dominance hierarchies wereestablished among the males according to standard protocol(Hofmann et al., 1999a). Regular observations over the course offive weeks identified males of definitive dominant (D) andsubordinate (S) phenotypes. The territory-holding males (N=6)behaved more aggressively than S males (N=6), as reflected by theirsignificantly higher DI (D males, 15.7±1.7; S males, –3.5±0.8; t-test, P<0.001) and RI (D males, 2.12±0.57; S males, 0.0±0.0; t-test,P=0.004). The GSI varied continuously across the two groups,showing the expected (yet, in this study, non-significant) trend forhigher GSI in dominant males (D males, 0.85±0.23; S males,0.56±0.04; t-test, P=0.25). There was no significant difference ingrowth rate (GR) over the course of the experiment (D males,1.25±0.215; S males, 1.39±0.285; t-test, P=0.69) or CF (residuals)at the time of sacrifice (D males, 0.01±0.053; S males, –0.01±0.061;t-test, P=0.58). Note, however, that CF differed marginally whenthe social communities were established at the beginning of theexperiment (D males, 0.03±0.051; S males, –0.03±0.068; t-test,P=0.07), which could suggest that increased condition may be
advantageous when ascending to dominance in the first place.Specific behaviors also varied significantly and predictably betweenthe D and S males (Fig.2): increased presence of an eye-bar in D(P<0.001); increased schooling behavior of S (P=0.0005); morefleeing behavior by S (P=0.004); and more frequent chasingbehavior (P=0.0003), border threat behavior (P=0.08) and sexualbehavior (P=0.003) by D. These results are representative of D andS males in A. burtoni as previously described (e.g. Francis et al.,1993; Hofmann and Fernald, 2000; White et al., 2002).
For the first investigation of our microarray data, we conductedBayesian analysis of gene expression (Townsend and Hartl, 2002)by treating the six individuals of each phenotype as biologicalreplicates and calculated gene expression differences at thephenotype level (D, S or brooding female). When comparing thedifferent phenotypes, array features representing 3647 cichlidunique sequences passed quality filters in a sufficient number ofhybridizations to be considered in the results. D and S phenotypesshowed significant differences in gene expression for 171 genes[Bayesian posterior probability, BPP>0.99) (87 upregulated; 84downregulated with dominance (supplementary material TablesS1and S2)]. Permutation analysis of the data shows that, at thissignificance threshold of BPP>0.99, only ~17% of these 171 genescould be expected to show significant differential expression bychance, a reasonable rate of false positives (Table1). Therefore,almost five percent of the genes studied were differentially regulatedin the brain according to male dominance phenotype. Thispercentage is considerably smaller than that found in typical honeybee colonies (39%), where nurse and forager phenotypes are notonly distinguished by their social role but also differ in their dailybehavioral routines and the environment in which they move about(Whitfield et al., 2003). These results also show phenotype-specificregulation of a considerably smaller portion of the genome comparedwith the 15% observed difference between alternative matingtactics in a study of Atlantic salmon males, which similarlycompared sexually mature and immature males (Aubin-Horth et al.,2005).
Candidate genesThe microarray was designed to include candidate genes previouslystudied in the context of social dominance and other behavioralcontexts in A. burtoni (Hofmann, 2003; Fernald, 2004). The inclusionof known candidate genes allowed us to test multiple hypotheses andalso offered validation of the microarray results by comparison with
S. C. P. Renn, N. Aubin-Horth and H. A. Hofmann
Table1. False discovery rate (FDR) estimated by randomization of hybridization ratios both between genes and between arrays usingpermutation with replacement and resampling for analyses conducted at the level of phenotype and sex
Bayesian probability thresholdPhenotypes compared P"0.99 P"0.995 P"0.999 P"0.9995Male dominant>Male subordinate 89 61 41 37Male dominant>Female 273 218 148 127Male subordinate>Male dominant 84 61 26 23Male subordinate>Female 277 220 136 116Female>Dominant male 205 154 96 78Female>Subordinate male 219 164 95 83Males>Female 316 269 174 147Female>Males 253 211 119 103FDR % 17.08 10.76 3 2.07standard error 0.61 0.57 0.39 0.39The number of features identified by analysis of the permutated dataset as significant for each threshold is reported as the average (N=5) percentage of the
number of features identified at that threshold by analysis of the original dataset.

3045Functional genomics of social phenotype
previous studies for some of these genes (summarized in Fig.1). Forinstance, peptidergic neurons in the pre-optic area (POA) and otherbrain regions express several neurohormones (e.g. arginine vasotocin,GnRH1, galanin) as well as neurohormone receptors and steroidreceptors, which have previously been shown in separate studies toplay a role in the regulation of social behavior. Below, for the firsttime, we provide a combined analysis of these neuroendocrinepathways in A. burtoni.
As predicted from previous studies using ribonuclease protectionassays and in situ hybridization, among the three GnRH neuropeptidegenes that are expressed in the brain of fish, only GnRH1, the formexpressed in the POA (White et al., 1994; White et al., 2002), showedhighly significant regulation in the microarray results (BPP=0.9998),with D males having higher levels. Given the small number of cellsexpressing this neuropeptide (~300) (Soma et al., 1996; Munz,1999), confirmation of GnRH1 regulation by our microarray analysisprovides an important cross-validation and confirms the sensitivityof the array even when using whole-brain RNA. As predicted fromprevious studies (White et al., 1994; White et al., 2002), our resultsalso confirmed that the other two forms of GnRH, GnRH2,(midbrain) and GnRH3 (terminal nerve), are not regulated accordingto male social phenotype (BPP=0.366 and 0.700, respectively). Noneof the GnRH receptor sub-types on the array were significantlyregulated, although studies have demonstrated their regulation inthe pituitary relative to sexual maturity and social status (Parhar etal., 2005; Au et al., 2006).
Galanin, a neuropeptide that links metabolic activity andreproduction through regulation of GnRH release (reviewed byKageyama et al., 2005; Tortorella et al., 2007), was marginallyupregulated in D males (BPP=0.9592). There is considerableevidence from mammals that galanin reduces nociception(Wiesenfeldhallin et al., 1992), increases food intake (Schick et al.,1993) and stress reactivity (Holmes et al., 2002), plays a role inregulation of sexual behavior, and is itself regulated by GnRH and
estrogen (Gabriel et al., 1993). Specifically, in fish, galanin is thoughtto play a role in regulation of food intake and is widely distributedin the brain, being localized to the olfactory bulb, telencephalon,hypothalamus, midbrain and posterior brain (reviewed by Volkoffet al., 2005), as well as the pituitary (Jadhao and Pinelli, 2001) andperipheral tissues (Johnsson et al., 2001). The results of the presentstudy suggest the intriguing possibility that galanin might beupregulated in D males as a response to reduced food intake andconstant challenges to their social status by other individuals. Futurestudies will test these novel hypotheses.
Arginine vasotocin (AVT; represented by multiple clones on thearray), the non-mammalian homolog of arginine vasopressin (AVP),was among the most strongly regulated genes in this study, beingupregulated in the brains of D males (BPP>0.9999). AVP/AVT hasbeen implicated in the regulation of social behavior acrossvertebrates, including aggression and social affiliation (Goodson,1998; Goodson and Adkins-Regan, 1999; Winslow et al., 1993). Inteleost fish, AVT is known to play a role in male mating tactics[peacock blenny (Grober et al., 2002; Carneiro et al., 2003);midshipman (Goodson and Bass, 2001)], as well as in the behavioralregulation of sex change and the associated territory acquisition[bluehead wrasse (Semsar and Godwin, 2003; Semsar and Godwin,2004)]. AVT is also associated with territorial aggression[damselfish (Santangelo and Bass, 2006)] as well as dominant andterritorial behavior in both the male and female of a breeding pairwhen compared with their subordinate helpers in another cichlidspecies, the cooperative breeding Neolamprologus pulcher (Aubin-Horth et al., 2007). Our data from A. burtoni suggest a role for AVTin regulation of dominance and are consistent with an in situhybridization-based study (Greenwood et al., 2008). The AVT V1areceptor, which plays a fundamental role in affiliative behaviors involes (Lim et al., 2004), was not represented on the array.
The enzyme aromatase, which converts testosterone toestrogen, is important in sex determination (Nakamura and
A% time in school
120
100
80
60
40
20
0
BFlee
12
10
8
6
4
2
0
EBorder threat
12
10
8
6
4
2
0
FCourtship
6
5
4
3
2
1
0
GSpawning
0.6
0.5
0.4
0.3
0.2
0.1
0
C% time eye-bar on
1.2
1.0
0.8
0.6
0.4
0.2
0
DChasing
24
20
16
12
8
4
0
Subordinates
Dominants
Fig. 2. Social behavior variedsignificantly and predictablybetween the dominant (D) andsubordinate (S) males. y-axisrepresents (A,C) the percent timeor (B,D,E,F) the mean number ofobserved events per 10 min focalobservation. The numbers identifyindividual males (filled circles,dominants; open squares,subordinates).

3046
Kobayashi, 2005), sex change in fish (Black et al., 2005; Marshet al., 2006) and regulation of social behavior (Hallgren et al.,2006). There are two isoforms of aromatase, one localized to thebrain and the other to the gonads, and both are represented onthe microarray. In the present study, D males showed increasedneural expression of the brain form (two features on the array,BPP=0.9914; 0.9997) but not the gonad form of aromatase(BPP=0.3192). This result suggests that the elevated testosteronelevels found in D males (Parikh et al., 2006) may affectaggression, courtship or dominance through aromatization andsubsequent action via estrogen receptors in the brain. In birds,aromatase activity increases during the territorial period andcorrelates with aggression (e.g. Soma et al., 2003; Silverin et al.,2004). Blocking brain aromatase reduces male courtship inguppies (Hallgren et al., 2006), further suggesting estrogen-mediated neuroendocrine regulation of reproductive behavior forsome species. However, studies on gonadal sex change in fish(Black et al., 2005; Marsh et al., 2006) suggest the oppositerelationship between brain aromatase and male aggression andthus a more complex mechanism, possibly involving differencesin receptor expression, binding proteins or anatomical localization.Estrogen receptors did not show differential regulation on thearray, although they may have been expected to, according toBurmeister et al. (Burmeister et al., 2007). The inability to reliablydetect differences in receptor gene expression is probably due tosmall localized effects that are masked by whole-brain geneexpression levels.
Novel genesWe bioinformatically annotated the ESTs obtained from the cichlidcDNA library features represented on the microarray (see Materialsand methods). Several of the genes thus identified fall into categoriesthat represent candidates likely to play a role in the social regulationof a complex phenotype (Table2). In the present study, these genesare considered to be ‘novel genes’ rather than ‘candidate genes’because the annotation process does not involve rigorous manualcuration of genes a priori, which was employed for the candidategenes discussed above. In addition to many genes involved incellular metabolism that are differentially regulated between the twosocial phenotypes, we found genes encoding structural proteins, cell-cycle regulators, specific transcription factors, a plethora ofneuropeptides, components of the neurosecretory machinery andneurotransmitter receptors.
Genes coding for structural proteins, such as tubulin and actin,and proteins that bind scaffold elements, such as septin 7 and ELF-1a, were more highly expressed in D males reflecting the observeddifferences in soma size between D and S for pre-optic neuronsexpressing GnRH1 (Francis et al., 1993) and somatostatin (Hofmannand Fernald, 2000). Furthermore, genes involved in axonal growth,neuromodulin [also known to play a role in modeling of sex-specificbrain regions (Simerly, 2002)] and neuroserpin (Miranda andLomas, 2006), were also upregulated in D males. Taken together,the regulation of this gene set strongly suggests increased neuronalre-wiring in D males not previously reported and possibly similarin scale to the massive remodeling of neural circuits seen in seasonal
S. C. P. Renn, N. Aubin-Horth and H. A. Hofmann
Table2. Best hits for dominant (D) and subordinate (S) regulated genes Dominant (D) greater than subordinate (S) (D>S) Subordinate (S) greater than dominant (D) (S>D)
Peptides, neurotransmitters Prolactin 1 Orphan nuclear hormone receptorand growth hormones Prolactin 2 Kainate receptor
Somatotropin Cholecystokinin Somatolactin C-type natriuretic peptideProopiomelanocortinArginine vasotocinGABA (receptor β subunit)Tilapia growth hormoneGlycoprotein αGnRH1Brain aromatase
Granins ChromograninNeurogranin Secretogranin II
Cell structure β-actin Clasp2 (regulation of microtubule dynamics)β-tubulinSeptin 7Elongation factor 1a
Synaptic vesicle Similar to synaptophysinQ5RCZ2_PONPY (secretory vesicle electron transport)
Transcription factor ETS family efr1 bHLHHLH
Axonal growth NeuromodulinNeuroserpin
Cell-cycle regulation Schip-1 Rbm5 protein putative tumor suppressorPdcd4
Cellular metabolic enzymes Enolase 1 Many ATPasesEnolase 2 NADH dehydrogenase and oxidoreductaseUridine kinase Glutathione S-transferaseLactate dehydrogenase Glutamine synthetase
Betaine aldehyde dehydrogenaseLeucine carboxyl methyltransferase
Dominant (D) and subordinate (S) regulated genes were grouped according to presumed functional category (see Materials and methods for details). For arrayfeature identification and BPP for differential regulation see Tables S1 and S2 in supplementary material.
3047Functional genomics of social phenotype
accession to territoriality and mating accompanied by increasedtestosterone levels in song birds (Devoogd and Nottebohm, 1981;reviewed in Arnold, 1992). It is particularly intriguing thatneuroserpins may play a role in anxiety and sexual behaviors.Specifically, neuroserpin-deficient rats showed decreases inexploratory behavior together with increases in anxiety andneophobia (Madani et al., 2003). In swordtail fish, neuroserpinexpression increased in the brain of females exposed to an attractivemale compared with females exposed to a non-attractive male(Cummings et al., 2008). This association of neuroserpin with socialbehavior is intriguing in that it may enable dominant males toapproach and interact with novel stimuli such as competitors andpotential mates.
Similarly, several cell-cycle regulators (Table 2) weresignificantly regulated in D and S phenotypes, suggesting that theextent of neurogenesis and subsequent cell death may also differbetween these phenotypes, a hypothesis consistent with the findingthat cell proliferation in the brain is correlated with high social statusin rainbow trout (Sorensen et al., 2007). While there is currently noother evidence for plasticity of this kind in neuroanatomicalstructures outside the POA in A. burtoni, gross neuroanatomicaldifferences that correspond to species’ typical reproductive strategieshave been identified in other cichlid species (Pollen et al., 2007).
Genes encoding neuropeptides and protein hormones that havenot been previously studied in this system were perhaps the moststriking, although not unexpected, class of genes regulated accordingto social status. In addition to the neuropeptides GnRH1, AVT andgalanin discussed above, we found somatotropin, prolactin andsomatolactin [all members of the growth hormone (GH) family ofgenes], as well as proopiomelanocortin (POMC), to be upregulatedin D males. Interestingly, a similar pattern of endocrine generegulation (GH, prolactin, somatolactin, POMC) is observed inAtlantic salmon, such that the expression profile for the earlymaturing ‘sneaker’ male compared with immature males matchesthe profile observed in the present study for reproductive D males,suggesting conserved function of these pathways (Aubin-Horth etal., 2005). We found cholecystokinin (CCK) and natriuretic peptideto be upregulated in S males.
Since the activity of pituitary somatotrophes is associated withtestis maturity and is stimulated by high levels of GnRH in severalfish species (reviewed by Legac et al., 1993; Yu and Peter, 1991),we suggest that the increased expression of growth-related genesin D males is probably related to gonad maturation. Somatolactin,which thus far has been found only in teleost fish, is involved inboth growth (Forsyth and Wallis, 2002) and color change(Fukamachi and Sugimoto, 2004), two plastic traits associated withsocial dominance in A. burtoni. Importantly, the observed increasein expression of GH is consistent with the previous finding thatcirculating GH levels are higher in D males (Hofmann et al., 1999b).Additionally, the growth hormone-releasing hormone (GHRH)/GHaxis facilitates territorial behavior in A. burtoni (Hofmann et al.,1999b; Trainor and Hofmann, 2006) (note that GHRH was notrepresented on the array). Finally, antagonists of the neuropeptidesomatostatin (which inhibits GH production and release in thepituitary; this gene was not represented on the array) inhibitaggressive behavior in A. burtoni males without affecting sexualbehavior (Trainor and Hofmann, 2006).
In addition to neuropeptide genes, we found many genes involvedin production, maturation, release and reception of neuropeptidesand neurotransmitters to be differentially expressed between socialphenotypes. For example, secretory granule proteins, such as ahomolog of synaptophysin as well as members of the granin family
of acidic proteins, were upregulated in D males. These are notablyfound in a wide variety of endocrine and neuro-endocrine cells (forreviews, see Gerst, 1999; Helle, 2004), and the regulation patternfound in the present study may simply be a consequence ofincreased neuroendocrine activity in D males.
Although few neurotransmitter receptors were present on thearray, there is one very intriguing result to report: a GABA-(A)receptor was upregulated in D males whereas at least two subunitsof the kainate-type glutamate receptor were upregulated in S males.Clearly, these differences were not predicted nor do we have, atthis point, a clear understanding of their specific roles in regulatingsocial dominance. However, the fact that these receptors are affectedby (or affect) social phenotypes probably reflects the interconnectednature of neurotransmitter systems and suggests that regulation atall levels of neural circuits may underlie the transition from onesocial phenotype to another. Interestingly, an antagonisticrelationship between GABA and kainate signaling has beensuggested in the regulation of reproductive physiology in othersystems (e.g. Sagrillo et al., 1996; Chu and Moenter, 2005; Clarksonand Herbison, 2006; Liu et al., 2006) (see Molecular modulesunderlying dominance and reproduction).
Molecular functions, biological processes and cellularlocations
The GO annotation scheme applied to the cichlid microarray allowsrigorous statistical analysis for over- and under-representation ofparticular molecular functions, biological processes, and cellular
Bio
logi
cal
proc
ess
Electron transport GO:0006118Potassium ion transport GO:0006813Regulation of cell-cycle GO:0000079 Protein modification GO:0006464Biopolymer metabolism GO:0043283Catabolism GO:0009056
Extracellular region GO:0005576Cytoplasm GO:0005737Cytoskeleton GO:0005856 Mitochondrial inner membrane GO:0005743Nucleus GO:0005634
Cel
lula
rco
mpo
nent
Mol
ecul
ar
func
tion
Hormone activity GO:0005179Structural molecule activity GO:0005198GTP Binding GO:0005525 Iron ion binding GO:0005506Motor activity GO:0005506Nucleoside-triphosphatase activity GO:0003774Cation transport activity GO:0008324Extracellular ligand-gated ion channel activity GO:0005230Nucleic acid binding GO:0003676Transferase activity GO:0016740Zinc ion binding GO:0008270
Dom
inan
t
Sub
ordi
nate
.0001.0005
.001.005
.01 .05 .0001.0005
.001.005
.01.05
Under -represented
Over -represented
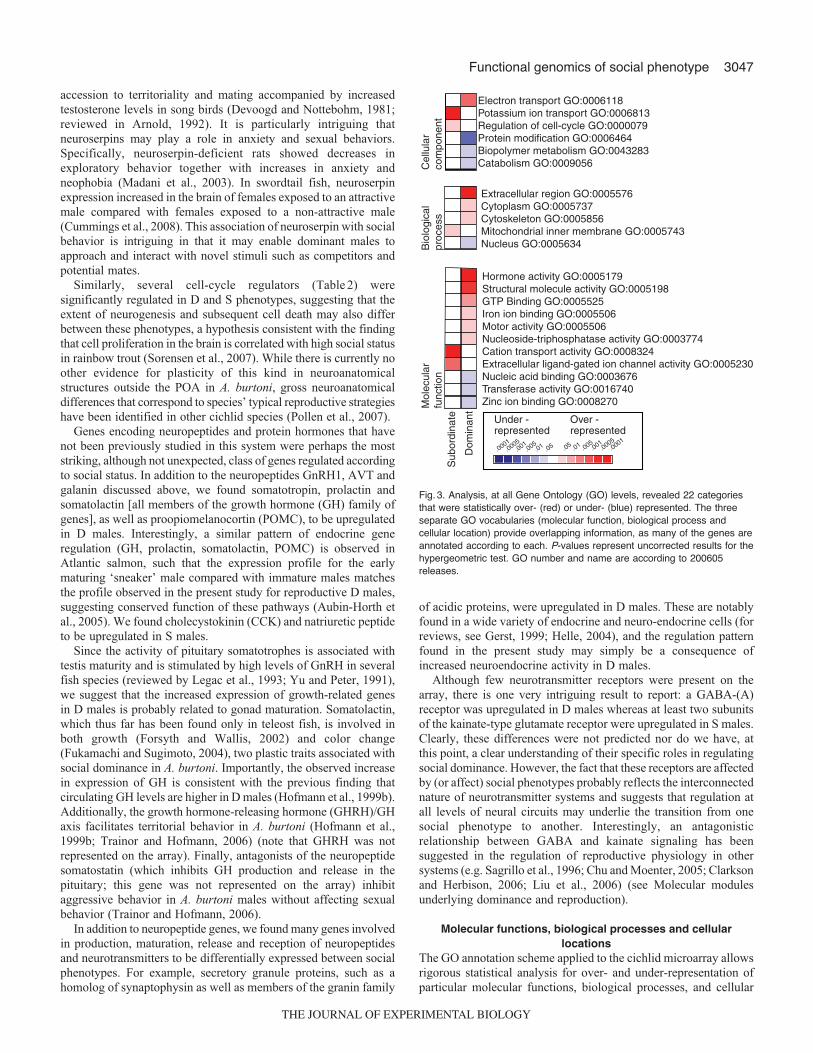
Fig. 3. Analysis, at all Gene Ontology (GO) levels, revealed 22 categoriesthat were statistically over- (red) or under- (blue) represented. The threeseparate GO vocabularies (molecular function, biological process andcellular location) provide overlapping information, as many of the genes areannotated according to each. P-values represent uncorrected results for thehypergeometric test. GO number and name are according to 200605releases.

3048
locations in genes that are differentially expressed in each malephenotype. Despite the biased nature of the GO terms due to theirorigin and application in model organisms and directed research,this tool offers a mechanism for statistical analysis of microarrayresults according to function (Shaw et al., 1999). These terms, unlikespecific gene names, avoid experimenter bias and cross-referencingbetween experiments and even between species and relateexperimental results between organisms and platforms. Of the 171features regulated according to male social phenotype, GO termscould be applied to 85. Analysis at all GO levels revealed 22categories that are statistically over- or under-represented amongthe genes that are regulated by social phenotype (P<0.05; comparedwith their representation among all genes above threshold) (Fig.3).Using permutation analysis, we determined that only five GO termswere expected to show significant over- or under-representation bychance alone (hypergeometric test P<0.05, only one GO term atP<0.01). Importantly, this unbiased statistical approach confirmsour observation discussed earlier that cytoskeleton/structuralmolecules as well as hormone signaling are upregulated in D males(Table3). Furthermore, cation/potassium transport pathways appearto be important building blocks for each male phenotype. In D males,the biological processes of GTP binding, iron ion binding and motoractivity were significantly enriched, whereas in S males potassiumion transport, regulation of cellular cation transport and ligand-gatedion channel function were activated. Although difficult to interpretdirectly, this bioinformatic approach results in a considerable datareduction, facilitates comparisons across species and platforms, andprovides a framework of hypotheses for future studies on themolecular underpinnings of socially regulated brain function.
Molecular modules underlying dominance and reproductionThe notion that biological entities (e.g. cognitive tasks,developmental programs, neural circuits, metabolic pathways)operate as functional and discrete (i.e. largely non-overlapping) units,or modules, is not new (Fodor, 1983; Redies and Puelles, 2001;Schlosser and Wagner, 2004; Op de Beeck et al., 2008). Inmolecular systems biology, a module can simply be defined as aset of co-regulated genes or proteins (Segal et al., 2004). Many suchmodules may serve as building blocks for the assembly of morecomplex processes. To date, most studies in this area have primarilybeen concerned with molecular and cellular networks and pathwaysin simple unicellular systems (Hartwell et al., 1999; Wolf and Arkin,2003). However, the ultimate challenge in the biology of complexsystems is the integration across many levels of biologicalorganization, from molecules to whole organisms, in an ever-changing environment. In the following, we make an initial attemptat such an integration of genomic data with physiological andbehavioral phenotypes to provide a comprehensive conceptualframework for understanding phenotypically plastic traits.Specifically, we examine male dominance phenotypes in terms ofmolecular modules of socially controlled traits such as aggression,territoriality, reproduction and growth.
As we also obtained neural expression profiles of broodingfemales, we examined variation in transcript levels in relation tosex. 569 genes were regulated according to sex (316 maleupregulated, 253 female upregulated) (Table1), a number that is fargreater than that observed for dominance phenotypes within males(171 genes or ~5%). This suggests that while the switch betweendominance phenotypes is multifaceted (see Fig.1), the differencein brain gene expression profiles between males and females is evenmore dramatic, affecting ~16% of the genes on the array.Interestingly, this proportion is comparable to the 15% observed
difference between alternative mating tactics in males of Atlanticsalmon (Aubin-Horth et al., 2005). A considerable proportion ofthe 171 genes associated with male social phenotypes was alsoregulated according to sex (supplementary material TablesS1 andS2). However, among the social status-regulated genes, there weresimilar proportions of female-enriched and male-enriched genes(Fig.4). Among the 87 dominant upregulated genes, were 11female-enriched and 20 male-enriched genes (hypergeometric test;P=0.09), and among the 84 subordinate upregulated genes there were16 female-enriched genes and 21 male-enriched genes(hypergeometric test; P=0.13). In other words, S males do not appearto be molecularly feminized nor are D males simply ‘super-males’.This result makes sense in light of the reproductive state of theseanimals. Although female behavior is, in many ways, similar to thatof S males, both brooding females and D males are reproductivelyactive. Furthermore, just as the metabolic demands of maintaininga territory are associated with reduced growth in D males (Hofmannet al., 1999a), mouth-brooding females starve while incubating theiroffspring and exhibit a marked reduction in body mass (Mrowk,1984). By contrast, S males do not reproduce, and metabolic energyis directed toward growth (Hofmann et al., 1999a). Thus, the 11genes (including synaptophysin, neuroserpin and GABA-receptor)upregulated in both D males and brooding females may be part ofa module facilitating reproduction and/or reducing growth and maynot necessarily be involved in dominance behavior per se.
Eighteen of the 316 male-enriched genes were even more highlyexpressed in D males compared with S males. We suggest that thesegenes, which include several structural proteins (actin, tubulin,ELF-1) and hormones (GnRH1, AVT, somatolactin, POMC)(supplementary material TableS1) are part of a ‘super-male’ module,which probably plays a role in the aggressive and/or sexualbehaviors typical of the D male (Fig.4). Even though we know fromprevious studies using other approaches that the absolute levels ofGnRH1 (Francis et al., 1993; White et al., 2002) and GH (Hofmannet al., 1999b) are higher in D males, it is important to note thatcDNA microarrays measure only relative transcript levels. Futurestudies will have to determine whether these genes must be activatedin order to produce a dominant phenotype or whether theirexpression needs to be suppressed for the subordinate phenotype tooccur. Following a similar rationale, we suggest that the 21 male-enriched genes (including neuroD and kainate receptor) that werefurther upregulated in S males relative to D males represent amasculinizing module in some sense. In this case, reducedexpression would be critical for the manifestation of behaviors linkedto aspects of social dominance and reproduction. Consequently, the21 genes in this masculinizing module could be considered to becomplementary to the super-male module. Finally, as broodingfemales and S males all display submissive behaviors and very littleaggression, it is tempting to suggest that the 16 genes (includingnatriuretic peptide) expressed in a similar pattern in these twophenotypes are part of a ‘subordination module’ (Fig.4).
The opposing pattern of regulation for receptor expression in twoclassic neurotransmitter systems that we observed between male socialphenotypes (see above) is also maintained in relation to sex. The geneencoding a GABA-(A) receptor was upregulated in D males and infemales whereas the kainate-type glutamate receptor was upregulatedin males in general and particularly in S males. There is a wealth ofresearch that ties the GABA-(A) receptor to the regulation of thehypothalamic–pituitary –gonadal axis via integration of steroidfeedback to GnRH neurons (for a review, see Sagrillo et al., 1996).In mammals, GABA has mixed inhibitory and excitatory effects onthe release of GnRH, due in part to a developmental switch from
S. C. P. Renn, N. Aubin-Horth and H. A. Hofmann

3049Functional genomics of social phenotype
Table 3. Gene Ontology (GO) terms that were significantly over- or under-represented among the genes regulated according to malephenotype
A. Biological process
GO: 0006118 Electron transport D>S over-represented P=1.01 10–3 (eight of 55)
tropsnart nortcele cificeps-elcisev yroterces ot ralimiSYPNOP_2ZCR5Q1999.0004CTprotein
HH_NB_Harvardcol_000005749 0.9914 Cloned fragment Brain aromatase
HH_AB_BRAIN2000_000003171 0.9999 Q803D7_BRARE Sb:cb825 protein (fragment)
HH_AB_BRAIN2000_000001582 0.9997 Q9DEZ3_ORENI Brain aromatase (fragment)
HH_AB_BRAIN2000_000001970 0.9925 Q6GLW8_XENLA Hypothetical protein
emorhcotyCELET9_5US49Q8899.095CT c oxidase polypeptide II
1 esanegordyhed HDANOMDAG_1XOC9999.0>2CT
emorhcotyCRMORT_BYC9999.0>9CT b family
GO:0006813 Potassium ion transport S>D over-represented P=4.83 10–4 (five of 25)
tinubus ahpla rotpecer etaniaKUARAC_97209Q9999.0>51CT
nietorp 1.a1a1ptAERARB_52UZ7Q2799.043CT
rotpecer etaniaKUARAC_87209Q899.061CT subunit
rotpecer etaniaKUARAC_87209Q9999.0>71CT subunit
aNERARB_2LGD9Q9099.0931CT +/K+ ATPase subunit
GO:0000079 Regulation of cell-cycle S>D over-represented P=4.76 10–2 (three of 30)
2 rotcaf hcir-KRDE llamSNAMUH_2FRES1799.0901CT
HH_AB_BRAIN2000_000001151 0.9919 RAS_CARAU Ras-like protein
HH_AB_BRAIN2000_000005191 0.9965 RBM5_HUMAN RNA-binding protein 5
GO:0006464 Protein modification D>S under-represented P=1.7 10–2 (none of 148)
GO:0043283 Biopolymer metabolism D>S under-represented P=3.47 10–2 (two of 161)
1 nietorp gnidnib-etalynedayloPNAMUH_1BAP9999.024CT
HH_AB_BRAIN2000_000004166 0.9992 Q6NX86_BRARE High mobility group box 1
GO:0009056 Catabolism D>S under-represented P=3.38 10–2 (none of 81)
B. Cellular component
GO:0005737 Cytoplasm D>S over-represented P=1.27 10–2 (23 of 383)
nietorp vorp-pbrAALNEX_3IVA8Q7999.004CT
EHNUF_BHDL9999.0>632CT L-lactate dehydrogenase B chain
HH_AB_BRAIN2000_000001815 0.993 Q9I921_CARAU -actin
1 esanegordyhed HDANOMDAG_1XOC9999.0>2CT
CREP9_6TFD9Q9999.0>82CT -tubulin
( 1 esalonEERARB_21CP6Q8999.023CT )
HH_AB_BRAIN2000_000001970 0.9925 Q6GLW8_XENLA Hypothetical protein
A6-baR nietorp detaler-saRNAMUH_A6BR9999.0>843CT
nisopasorPERARB_28GD9Q8999.0811CT
( 2 cimsalpotyc ,nitcAURGUF_2TCA7899.0192CT -actin 2)
HH_AB_BRAIN2000_000002804 0.9995 Q6P4P6_BRARE Zgc:73142 protein (HMP19 protein)
a1 rotcaf noitagnolEINERO_06WU8Q9999.0>81CT
1 nietorp gnidnib-etalynedayloPNAMUH_1BAP9999.024CT
M nietorponeleSERARB_7G208Q9999.0993CT
HH_AB_BRAIN2000_000003171 0.9999 Q803D7_BRARE Sb:cb825 protein (fragment)
2 esalonEERARB_9MQG6Q4499.073CT
HH_AB_BRAIN2000_000003205 0.9947 Q6GNE7_XENLA MGC82852 protein ribosome receptor activity
HH_AB_BRAIN2000_000003279 0.9905 Q9YHD1_ANGAN Vacuolar-type H+ transporting ATPase B2 subunit
emorhcotyCELET9_5US49Q8899.095CT c oxidase polypeptide II
CREP9_6TFD9Q4399.084CT -tubulin
emorhcotyCRMORT_BYC9999.0>9CT b family
HH_AB_BRAIN2000_000003055 0.9989 Q5U4S4_XENLA LOC495448 protein

3050 S. C. P. Renn, N. Aubin-Horth and H. A. Hofmann
Table 3 continuedGO:0005856 Cytoskeleton D>S over-represented P=2.85 10–2 (seven of 77)
( 2 cimsalpotyc ,nitcAURGUF_2TCA7899.0192CT -actin 2)
HH_AB_BRAIN2000_000001469 0.9967 SEPT7_MOUSE Septin 7
GO:0005856 Cytoskeleton D>S over-represented P=2.85 10–2 (seven of 77)CREP9_6TFD9Q9999.0>82CT -tubulin
NAMUH_6ABT9999.0>91CT -tubulin 6
( 1 cimsalpotycURGUF_1TCA9999.0>21CT -actin 1)
HH_AB_BRAIN2000_000001815 0.993 Q9I921_CARAU -actin
CREP9_6TFD9Q4399.084CT -tubulin
GO:0005576 Extracellular region D>S over-represented P=5.25 10–6 (15 of 106)
HH_AB_BRAIN2000_000004166 0.9992 Q6NX86_BRARE High mobility group box 1
rosrucerp niportotamoSINERO_AMOS9999.0>94CT
HH_AB_BRAIN2000_000003361 0.99 O70534_RAT ZOG protein
nisyhpotpanys ot ralimiSERARB_47MZ6Q8999.0421CT
HH_AB_BRAIN2000_000005345 >0.9999 Q9W7F7_OREMO Proopiomelanocortin
HH_AB_Stanfordcol_000005677 0.9998 Cloned fragment Arginine vasotocin
rotpecer ABAGNAMUH_5ARBG6899.0092CT -5 subunit
nisopasorPERARB_28GD9Q8999.0811CT
rosrucerp nipresorueNKCIHC_SUEN9999.0>491CT
HH_AB_BRAIN2000_000001923 >0.9999 PRL2_OREMO Prolactin-2 precursor
rosrucerp 1-nitcalorPOMERO_1LRP9999.0>523CT
rosrucerp nitcalotamoSLORAP_LMOS9999.0>133CT
nicotosav eninigrAUBPAH_7DHJ8Q7899.0013CT
HH_AB_Stanfordcol_000005722 >0.9999 Cloned fragment Arginine vasotocin
nietorpocylGOMERO_5IED9Q9999.0>431CT subunit
GO:0005743 Mitochondrial inner membrane S>D over-represented P=3.07 10–2 (four of 44)
nietorp 5 rebmem 52 ylimaf reirrac etuloSERARB_0IHJ8Q9299.063CT
esanegordyhed HDANUBPAH_225M8Q9999.0>31CT
esatcuderodixo enoniuqibu-HDANGEMS9_8YLH8Q8999.012CT
6 esahtnys PTARBAL9_6MDY7Q9999.0>4CT
GO:0005634 Nucleus D>S under-represented P=2.3 10–2 (five of 275)
( 1 cimsalpotyCURGUF_1TCA9999.0>21CT -actin 1)
( 1 esalonEERARB_21CP6Q8999.023CT )
HH_AB_BRAIN2000_000001906 0.9910 O42448_ONCMY Id2 protein
HH_AB_BRAIN2000_000003955 0.9919 Q5MBG6_BRARE ETS family transcription factor efr1
HH_AB_BRAIN2000_000004166 0.9992 Q6NX86_BRARE High mobility group box 1
C. Molecular function
GO:0005525 GTP binding D>S over-represented P=5.23 10–3 (seven of 56)
HH_AB_BRAIN2000_000001469 0.9967 SEPT7_MOUSE Septin 7
a1 rotcaf noitagnolEINERO_06WU8Q9999.0>81CT
NAMUH_6ABT9999.0>91CT -tubulin 6
HH_AB_BRAIN2000_000005599 0.9959 Q6PBW0_BRARE Hypothetical protein zgc:73218
CREP9_6TFD9Q9999.0>82CT -tubulin
CREP9_6TFD9Q4399.084CT -tubulin
A6-baR nietorp detaler-saRNAMUH_A6BR9999.0>843CT
GO:0005179 Hormone activity D>S over-represented P=1.08 10–9 (nine of 16)
rosrucerp niportotamoSINERO_AMOS9999.0>94CT
HH_AB_BRAIN2000_000001923 >0.9999 PRL2_OREMO Prolactin-2 precursor
rosrucerp 1-nitcalorPOMERO_1LRP9999.0>523CT
HH_AB_BRAIN2000_000005345 >0.9999 Q9W7F7_OREMO Proopiomelanocortin
rosrucerp nitcalotamoSLORAP_LMOS9999.0>133CT
nicotosav eninigrAUBPAH_7DHJ8Q7899.0013CT
nietorpocylGOMERO_5IED9Q9999.0>431CT subunit
HH_AB_Stanfordcol_000005722 >0.9999 Cloned fragment Arginine vasotocin
HH_AB_Stanfordcol_000005677 0.9998 Cloned fragment Arginine vasotocin

3051Functional genomics of social phenotype
Table 3 continuedGO:0005506 Iron ion binding D>S over-represented P=1.05 10–2 (five of 35)
tropsnart nortcele cificeps-elcisev yroterces ot ralimiSYPNOP_2ZCR5Q1999.0004CTprotein
GO:0005506 Iron ion binding D>S over-represented P=1.05 10–2 (five of 35)
HH_NB_Harvardcol_000005749 0.9914 cloned fragment Brain aromatase
HH_AB_BRAIN2000_000001582 0.9997 Q9DEZ3_ORENI Brain aromatase (fragment)
1 esanegordyhed HDANOMDAG_1XOC9999.0>2CT
emorhcotyCRMORT_BYC9999.0>9CT b family
GO:0003374 Motor activity D>S over-represented P=1.91 10–2 (three of 15)
( 2 cimsalpotyc ,nitcAURGUF_2TCA7899.0192CT -actin 2)
( 1 cimsalpotyCURGUF_1TCA9999.0>21CT -actin 1)
HH_AB_BRAIN2000_000001815 0.993 Q9I921_CARAU -actin
GO:001711 Nucleoside-triphosphatase activity D>S over-represented P=2.50 10–2 (seven of 75)
a1 rotcaf noitagnolEINERO_06WU8Q9999.0>81CT
NAMUH_6ABT9999.0>91CT -tubulin 6
HH_AB_BRAIN2000_000005599 0.9959 Q6PBW0_BRARE Hypothetical protein zgc:73218
CREP9_6TFD9Q9999.0>82CT -tubulin
HH_AB_BRAIN2000_000003279 0.9905 Q9YHD1_ANGAN Vacuolar-type H+ transporting ATPase B2 subunit
CREP9_6TFD9Q4399.084CT -tubulin
A6-baR nietorp detaler-saRNAMUH_A6BR9999.0>843CT
GO:0005198 Structural molecule activity D>S over-represented P=6.53 10–4 (11 of 93)
nietorp vorp-pbrAALNEX_3IVA8Q7999.004CT
EHNUF_BHDL9999.0>632CT L-lactate dehydrogenase B chain
( 2 cimsalpotyc ,nitcAURGUF_2TCA7899.0192CT -actin 2)
HH_AB_BRAIN2000_000001469 0.9967 SEPT7_MOUSE Septin 7
NAMUH_6ABT9999.0>91CT -tubulin 6
( 1 cimsalpotyCURGUF_1TCA9999.0>21CT -actin 1)
HH_AB_BRAIN2000_000005599 0.9959 Q6PBW0_BRARE Hypothetical protein zgc:73218
CREP9_6TFD9Q9999.0>82CT -tubulin
HH_AB_BRAIN2000_000001815 0.993 Q9I921_CARAU -actin
HH_AB_BRAIN2000_000003205 0.9947 Q6GNE7_XENLA MGC82852 protein ribosome receptor activity
CREP9_6TFD9Q4399.084CT -tubulin
GO:0008324 Cation transporter activity S>D over-represented P=2.84 10–4 (nine of 84)
esanegordyhed HDANUBPAH_225M8Q9999.0>31CTtinubus ahpla rotpecer etaniaKUARAC_97209Q9999.0>51CT
1 niahc esatcuderodixo enoniuqibu-HDANERARB_M1UN9999.0>1CTesatcuderodixo enoniuqibu-HDANGEMS9_8YLH8Q8999.012CT
6 esahtnys PTARBAL9_6MDY7Q9999.0>4CTnietorp 1.a1a1ptAERARB_52UZ7Q2799.043CT rotpecer etaniaKUARAC_87209Q899.061CT subunit rotpecer etaniaKUARAC_87209Q9999.0>71CT subunit
aNERARB_2LGD9Q9099.0931CT +/K+-ATPase subunit
GO:0005230 Extracellular ligand-gated ion channel activity S>D over-represented P=2.78 10–3 (three of 11)
rotpecer etaniaKUARAC_97209Q9999.0>51CT subunit rotpecer etaniaKUARAC_87209Q899.061CT subunit rotpecer etaniaKUARAC_87209Q9999.0>71CT subunit
GO:0003676 Nucleic acid binding D>S under-represented P=3.47 10–2 (six of 280)
a1 rotcaf noitagnolEINERO_06WU8Q9999.0>81CT( 1 esalonEERARB_21CP6Q8999.023CT )
nietorp vorp-pbrAALNEX_3IVA8Q7999.004CT1 nietorp gnidnib-etalynedayloPNAMUH_1BAP9999.024CT
HH_AB_BRAIN2000_000003955 0.9919 Q5MBG6_BRARE ETS family transcription factor efr1HH_AB_BRAIN2000_000004166 0.9992 Q6NX86_BRARE High mobility group box 1
GO:0016740 Transferase activity D>S under-represented P=1.25 10–2 (one of 150)
HH_AB_BRAIN2000_000004040 0.9925 UCKL1_HUMAN Uridine/cytidine kinase-like 1
GO:0008270 Zinc ion binding D>S under-represented P=1.13 10–2 (none of 106)
Each of the three independent ontologies is given. Significance is determined to be P<0.05 for the uncorrected hypergeometric P-value. TC numberrefers to tentative contig number assigned in release 1.0 A. burtoni cichlid gene index (compbio.dfci.harvard.edu).

3052
GABA-(A) receptor depolarization to hyperpolarization (Clarkson andHerbison, 2006). In fish, depending on the species, GABA has eitherexcitatory or inhibitory effects on GnRH release (Trudeau et al., 2000).Interestingly, glutamate-controlled GABA release has been implicatedin GnRH regulation (Chu and Moenter, 2005; Clarkson and Herbison,2006). The kainate system has also been proposed to underlieobserved sex differences in the mechanisms of the neuralglucocorticoid/stress response. Female mice show less atrophy ofhippocampal neurons in response to elevated glucocorticoid levels,possibly due to the increased expression of NMDA, AMPA andkainate glutamate receptor sub-types (Liu et al., 2006). In A. burtoni,the increased kainate receptor expression seen in S males couldsimilarly provide a neuroprotective effect against the elevated cortisollevels seen in S males during specific social situations (Fox et al.,1997). Future pharmacological and neurohistochemical experimentswill elucidate the mechanistic interactions of these neurotransmittersystems in relation to sex and social behavior.
Taken together, the molecular systems analysis in the presentstudy supports the notion that transcript patterns may indeed beorganized in a modular fashion and can be strongly associated withbehavioral and/or physiological traits associated with socialphenotypes or sex in either concordant or contrasting ways.Additionally, we can exploit expression variation betweenphenotypes for tentatively annotating gene function and predictingfunctional roles of these genes.
Individual variation in gene expressionTo appreciate the importance of variation in gene expression forphenotypic plasticity, we need to evaluate the expression differencesbetween individuals. To determine the extent to which individualsof the same phenotype differ in their expression profiles, weestimated transcript levels for each individual separately. Individualprofiles were then clustered for similarity according to the estimatedtranscript levels using the gene list that had been identified assignificantly regulated between any two phenotypes (BPP>0.99)(Euclidian distance matrix based on resampling for bootstrapconfidence levels) (Fig.5).
Similarities in expression profiles of individualsSex was a strong factor in the clustering of individual expressionprofiles, as five of the six females clustered separately from all males.While males of the same social phenotype tended to have similarbrain expression profiles, two D individuals (males 4 and 5)clustered with the S males. The analysis of behavioral data of thesemales did not suggest any obvious difference from other D males(Fig.2). It is unlikely (since we controlled for age and size and basedon our observations) that these two D males were experiencingdominance for the first time. Also, at the behavior level, these twoD males were not similar to each other. While male 5 did show thefewest chases and the most border threats (Fig.2) of all D males,the behaviors of male 4 were not in any way different from thoseof the other D males. While it is possible that there is more thanone molecular substrate for constructing and maintaining a dominantmale phenotype, the expression profiles of these two D males areno more similar to each other than to S males.
When individual profiles were clustered according to estimatedtranscript levels using all genes on the array that passed filteringfor every fish, rather than only those genes that showed significantregulation, similar results were obtained (data not shown). Whilethe bootstrapped confidence values were lower, the same four Dmales formed a cluster, suggesting that gene regulation accordingto sex and social status account for the greatest variation amongindividuals in this study. Principal component analysis (PCA)corroborated this conclusion (supplementary material Fig.S1).
Variation among individuals within and between male phenotypesWhile, overall, the clustering resulted in a robust separation of thethree phenotypes according to sex and social status, the individualvariation, already apparent at this level, prompted further inquiryinto expression variation between individuals of the same phenotype.In voles, expression patterns of oxytocin receptor for females andvasopressin receptor for males is correlated with individual variationin social and anxiety-related behaviors (Olazabal and Young, 2006).Similarly, male mice show individual variation in estrogen receptordistribution that correlates with aggressive behavior (Trainor et al.,
S. C. P. Renn, N. Aubin-Horth and H. A. Hofmann
Female226
Male277
D>S58
47S>D
16 21
11 18
SynaptophysinNeuroserpinGABA-receptor (α)Enolase 2MHC class 1 antigenSchwannomin interacting protein 1Two zebrafish ESTs
RNA binding protein 5C-type natriuretic peptideGlutamine synthetaseNa+/K+-ATPase (β)ATP synthase 6NADH dehydrogenase (subunit 2)NADH-ubiquinone oxidoreductase chain1Solute carrier family 25 α member 5Solute carrier family 25 α member 3
NeuroDCreatine kinase
Na+/K+-ATPase (α)Kainate receptor (β subunit)Kainate receptor (α subunit)
Cellular retinoic acid-binding proteinBetaine aldehyde dehydrogenase
NADH-ubiquinone oxidoreductase chain1Aldehyde dehydrogenase 9 family member A1
α-2-HS-glycoproteinAtp1a1a.a protein
Neuromodulin (GAP43)β actin
β tubulinElongation factor 1A
Glycoprotein α subunitArginine vasotocin preprohormone
Somatolactin precursorProopiomelanocortin
Brain aromataseGnRH1
Fig. 4. Venn diagram depicting the relationship ofsexually regulated and socially regulated genes.These relationships subdivide the gene classes toindicate modules of gene expression thatpotentially underlie reproduction (orange),submissive behavior (lavender), and super-maledominance (green) and opposing super-maledominance (teal). Numbers indicate total uniquesequences and unsequenced array features.Gene names given represent best-hit blastannotation for available sequences. The Venndiagram indicates regulation at a BPP of >0.99,(the specific BPP, down to 0.80, for regulation isindicated in supplementary material Tables S1 andS2)

3053Functional genomics of social phenotype
2006). Previous studies in A. burtoni and other cichlid species havealso reported strong covariation patterns within a social phenotypebetween the expression of candidate genes and specific phenotypemeasures [somatostatin correlated with aggression (Trainor andHofmann, 2006); AVT correlated with hormone titers (Aubin-Horthet al., 2007)]. We therefore asked whether significant differencesin gene expression existed between individuals of the samephenotype. Furthermore, we tested whether significant differencesin gene expression between individuals of the same phenotype couldbe found among those genes that are differentially regulated betweenphenotypes.In order to investigate the degree of individual variation in geneexpression, we determined the number of genes that variedsignificantly in expression between individuals of the same phenotypeand compared it with the number that varied between individuals ofdifferent phenotypes. Although statistical power was lower becausewe had only four technical replicates per individual as opposed to sixbiological replicates in the analyses above (Clark and Townsend,2007), we were able to measure the average number of genessignificantly regulated (BPP>0.99) in each possible pairwisecomparison of two individuals within and between phenotypes. Forintra-phenotype variations among males, a mean (±s.e.m.) of 82.8±4.5(2.3% of all genes analyzed) genes varied between any two D males,while a mean of 92.3±4.3 (2.6%) genes varied between any two Smales. The identity of these genes was substantially different for each
pairwise comparison, such that 38% of all the array features variedin at least one intra-phenotype comparison. Interestingly, for inter-phenotype variation between individual males, a mean of 132±8.4(3.6%) genes varied between any two males of differing socialphenotype, which was not significantly different from the intra-phenotype variation (t-test, P=0.13). Although it is difficult to set anequivalent threshold for significant variation between individuals andbetween phenotypes, this high degree of individual variation isconsistent with other studies that have examined genome-scaleindividual differences in gene expression in order to study themolecular basis of natural variation. Whitehead and Crawford foundthat 69% of the metabolic pathway genes showed significant variationbetween individuals within a population, while only 12% weresignificantly regulated between populations adapted to differenttemperatures (Whitehead and Crawford, 2006). Similarly, in yeast,up to 50% of the expressed genes show significantly different levelsof expression among individual strains (Brem et al., 2002). Not onlydo we find a similar number of genes to be regulated betweenindividuals of the same or different phenotypes, we also find nosignificant difference in coefficient of variation of expression levelfor sets of these individually regulated genes. This result indicatesthat absolute gene expression levels vary between individuals of thesame phenotype as much as between phenotypes.
While low variation within a phenotype for those genes thatdefine that phenotype can be expected, an alternative hypothesisposits that those genes that define the social phenotype vary acrossindividuals displaying that phenotype in a manner associated withvariation in physiological and behavioral traits (e.g. Trainor andHofmann, 2006; Aubin-Horth et al., 2007; Cummings et al., 2008).In support of this notion, we found a statistically significant over-representation of intra-phenotype regulated genes among those thatwere regulated by social status (Table 4). Approximately 72% ofthe 87 genes upregulated in the dominant phenotype were alsosignificantly regulated among individuals within a phenotype (41among D and 39 among S, 24 of which are shared). Similarly,64% of the 84 genes that were upregulated in the S phenotypewere also significantly regulated among individuals (47 among Dand 52 among S, 38 of which are shared). This variation cannotbe explained by technical variation in array hybridizations: for agiven animal, an array feature must show consistent results acrossfour dye-reversed hybridizations before it can be identified asregulated across individuals according to our statistical analysis.Rather, the results of the present study show that even considerableand potentially important within-phenotype variation in geneexpression can give rise to reliable and readily identifiablebetween-phenotype differences. Future integrative studies will helpdetermine whether the observed variation between individuals iscaused by, or causes, subtle phenotypic differences or representsa dramatic, alternative molecular mechanism for constructing thesame phenotype.
D S F
0.9 1.0
0.83
0.53
0.71
1.0
0.77
0.95
0.99
0.75
0.98
0.97
0.88
2 5 6 5 1 4 4 3 2 1 6 33 5 6 4 1 2
A B
Fig.5. Hierarchical clustering of phenotypes (A) and individuals (B) (based onexpression profiles for the genes regulated at level of phenotype). The geneshave been ordered according to k-means clustering. The heatmaps (red,upregulated, green, downregulated) show estimated gene expression levels.Heat values are relative only within, not across, genes. The numbers identifyindividual males consistent with Fig.2. Confidence values at the nodes wereobtained by bootstrap analysis (1000 permutations with resampling). Thecolors indicate S, subordinate males in teal; D, dominant males in gold; andF, brooding females in pink.
Table 4. Enrichment of intra-phenotype gene expression variation issignificant for genes that are both upregulated and downregulated
for that phenotype in comparison with the other phenotype Upregulated by phenotype
Dominant SubordinateRegulated by individual 87 84
w/in dominant 824 41 (P=2.9!10 –7) 47 (P=2.76!10 –11)w/in subordinate 925 39 (P=4.3!10 –5) 52 (P=1.2!10 –12)
Hypergeometric test (3598 total genes analyzed).

3054
CONCLUSIONSBy including candidate genes on the microarray, we have validatedthe discovery-based approach that identifies the gene expressionpatterns for reproductively active D males and reproductivelysuppressed S males as well as for brooding females. While theregulation of neuroendocrine genes was predicted from previousresearch, the unexpected and novel discovery of opposing roles fortwo classic neurotransmitter systems opens exciting new avenuesfor future research. Furthermore, the increased neuronal remodelingactivity in D males suggests that the known neuroanatomicalchanges observed in pre-optic GnRH and somatostatin neurons mayextend to other cell types and/or additional brain regions. Usingthe GO framework to interrogate the data for statistical significancereinforces the importance of hormonal regulation and highlightsthe hitherto under-appreciated roles of cytoskeletal components inaddition to neurotransmitter pathways. Interestingly, expressionprofiles vary among individuals within a male phenotype forroughly the same number of genes and with similar magnitudes oftranscript abundance as seen between male phenotypes.Specifically, there is a surprisingly high level of variation amongthose genes that molecularly define the very phenotypes in the firstplace. Taken together, our genome-scale analysis of molecularsystems in the brain has identified complex patterns of geneexpression that are associated with a socially regulated switch inbehavioral phenotype.
LIST OF ABBREVIATIONSAMPA alpha-amino-3-hydroxy-5-methyl-4-isoxazolepropionic acidAVP arginine vasopressinAVT arginine vasotocinBPP Bayesian posterior probabilityCF condition factorCCK cholecystokininDAG directed acyclic graphsDI dominance indexEST expressed sequence tagsFDR false discovery rateGABA gamma-aminobutyric acidGH growth hormoneGHRH growth hormone-releasing hormoneGnRH gonadotrophin-releasing hormoneGO gene ontologyGR growth rateGSI gonadosomatic indexIEA inferred electronic annotationISS inferred sequence similiarityKT ketotestosteroneNMDA N-methyl-D-aspartic acidPOA pre-optic areaPOMC proopiomelanocortinRI reproductive indexT testosteroneTC tentative contigs
All authors contributed to the design, implementation, analysis and presentation ofthis experimental data set. We are grateful to Josiah Altschuler and MelindaSnitow for animal care, Sarah Annis for assistance with the behavioralexperiments, Christian Landry for programming and photography, Amir Karger forbioinformatics advice, and Victoria Zero, Brian Dias, Lin Huffman and Kim Hokefor comments on earlier versions of this manuscript. We thank the H ofmannlaboratory and the members of the Bauer Center for Genomics Research forstimulating discussions. This research was supported by an NRSA post-doctoralfellowship to S.C.P.R., a postdoctoral fellowship from FQRNT (Fonds Québécoisde la Recherche sur la Nature et les Technologies) and a postdoctoral fellowshipfrom the Natural Science and Engineering Research Council of Canada (NSERC)to N.A.H., and by National Institutes of Health grant NIGMS GM068763, the BauerCenter for Genomics Research (H.A.H.).
REFERENCESAmano, M., Hyodo, S., Kitamura, S., Ikuta, K., Suzuki, Y., Urano, A. and Aida, K.
(1995). Short photoperiod accelerates preoptic and ventral telencephalic salmon GnRHsynthesis and precocious maturation in underyearling male masu salmon. Gen. Comp.Endocrinol. 99, 22-27.
Arnold, A. P. (1992). Hormonally-induced alterations in synaptic organization in the adultnervous-system. Exp. Gerontol. 27, 99-110.
Au, T. M., Anna, K. G. and Fernald, R. D. (2006). Differential social regulation of twopituitary gonadotropin-releasing hormone receptors. Behav. Brain Res. 170, 342-346.
Aubin-Horth, N., Landry, C. R., Letcher, B. H. and Hofmann, H. A. (2005). Alternativelife histories shape brain gene expression profiles in males of the same population.Proc. R. Soc. Lond. B 272, 1655-1662.
Aubin-Horth, N., Desjardins, J. K., Martei, Y. M., Balshine, S. and Hofmann, H. A.(2007). Masculinized dominant females in a cooperatively breeding species. Mol. Ecol.16, 1349-1358.
Black, M. P., Balthazart, J., Baillien, M. and Grober, M. S. (2005). Socially inducedand rapid increases in aggression are inversely related to brain aromatase activity in asex-changing fish, Lythrypnus dalli. Proc. Biol. Sci. 272, 2435-2440.
Brem, R. B., Yvert, G., Clinton, R. and Kruglyak, L. (2002). Genetic dissection oftranscriptional regulation in budding yeast. Science 296, 752-755.
Buckley, B. A., Gracey, A. Y. and Somero, G. N. (2006). The cellular response to heatstress in the goby Gillichthys mirabilis: a cDNA microarray and protein-level analysis. J.Exp. Biol. 209, 2660-2677.
Burmeister, S. S., Jarvis, E. D. and Fernald, R. D. (2005). Rapid behavioral andgenomic responses to social opportunity. PLoS Biol. 3, 1996-2004.
Burmeister, S. S., Kailasanath, V. and Fernald, R. D. (2007). Social dominanceregulates androgen and estrogen receptor gene expression. Horm. Behav. 51, 164-170.
Carneiro, L. A., Oliveira, R. F., Canario, A. V. M. and Grober, M. S. (2003). The effectof arginine vasotocin on courtship behaviour in a blenniid fish with alternativereproductive tactics. Fish Physiol. Biochem. 28, 241-243.
Churchill, G. A. (2002). Fundamentals of experimental design for cDNA microarrays.Nat. Genet. 32, 490-495.
Chu, Z. G. and Moenter, S. M. (2005). Endogenous activation of metabotropicglutamate receptors modulates GABAergic transmission to gonadotropin-releasinghormone neurons and alters their firing rate: a possible local feedback circuit. J.Neurosci. 25, 5740-5749.
Clark, T. A. and Townsend, J. P. (2007). Quantifying variation in gene expression. Mol.Ecol. 16, 2613-2616.
Clarkson, J. and Herbison, A. E. (2006). Development of GABA and glutamatesignaling at the GnRH neuron in relation to puberty. Mol. Cell. Endocrinol. 254, 32-38.
Cummings, M. E., Larkins-Ford, J., Reilly, C. R. L., Wong, R. Y., Ramsey, M. andHofmann, H. A. (2008). Sexual and social stimuli elicit rapid and contrasting genomicresponses. Proc. Biol. Sci. 275, 393-402.
Davis, M. R. and Fernald, R. D. (1990). Social control of neuronal soma size. J.Neurobiol. 21, 1180-1188.
Dawson, A., King. V. M., Bentley, G. E. and Ball, G. F. (2001). Photoperiodic control ofseasonality in birds. J. Biol. Rhythms 16, 365-380.
Devoogd, T. and Nottebohm, F. (1981). Gonadal-hormones induce dendritic growth inthe adult avian brain. Science 214, 202-204.
Fernald, R. D. (1977). Quantitative behavioural observations of Haplochromis burtoniunder semi-natural conditions. Anim. Behav. 25, 643-653.
Fernald, R. D. (2002). Social regulation of the brain: sex, size and status. In Geneticsand Biology of Sex Determination no. 244 (ed. Novartis Foundation), pp. 169-186.Chichester: John Wiley and Sons.
Fernald, R. D. (2004). Social influences on the brain. Horm. Behav. 46, 129-130.Fernald, R. D. and Hirata, N. R. (1977a). Field study of Haplochromis burtoni:
quantitative behavioral observations. Anim. Behav. 25, 964-975.Fernald, R. D. and Hirata, N. R. (1977b). Field study of Haplochromis burtoni: habitats
and co-habitants. Environ. Biol. Fishes 2, 299-308.Fodor, J. A. (1983). The Modularity of Mind. Cambridge, MA: The MIT Press.Forsyth, I. A. and Wallis, M. (2002). Growth hormone and prolactin-molecular and
functional evolution. J. Mammary Gland Biol. Neoplasia 7, 291-312.Fox, H. E., White, S. A., Kao, M. H. F. and Fernald, R. D. (1997). Stress and
dominance in a social fish. J. Neurosci. 17, 6463-6469.Francis, R. C., Soma, K. and Fernald, R. D. (1993). Social regulation of the brain
pituitary-gonadal axis. Proc. Natl. Acad. Sci. USA 90, 7794-7798.Fukamachi, S. and Sugimoto, M. (2004). Identification of the gene for morphological
body-color change: Somatolactin. Zool. Sci. 21, 1224.Gabriel, S. M., Koenig, J. I. and Washton, D. L. (1993). Estrogen stimulation of galanin
gene-expression and galanin-like immunoreactivity in the rat and its blockade by theestrogen antagonist keoxifene. Regul. Pept. 45, 407-419.
Ge, Y. C., Dudoit, S. and Speed, T. P. (2003). Resampling-based multiple testing formicroarray data analysis. Test 12, 1-77.
Gerst, J. E. (1999). SNAREs and SNARE regulators in membrane fusion andexocytosis. Cell. Mol. Life Sci. 55, 707-734.
Goodson, J. L. (1998). Territorial aggression and dawn song are modulated by septalvasotocin and vasoactive intestinal polypeptide in male field sparrows (Spizella pusilla).Horm. Behav. 34, 67-77.
Goodson, J. L. and Adkins-Regan, E. (1999). Effect of intraseptal vasotocin andvasoactive intestinal polypeptide infusions on courtship song and aggression in themale zebra finch (Taeniopygia guttata). J. Neuroendocrinol. 11, 19-25.
Goodson, J. L. and Bass, A. H. (2001). Social behavior functions and relatedanatomical characteristics of vasotocin/vasopressin systems in vertebrates. Brain Res.Rev. 35, 246-265.
Greenwood, A. K. and Fernald, R. D. (2004). Social regulation of the electricalproperties of gonadotropin-releasing hormone neurons in a Cichlid fish (Astatotilapiaburtoni). Biol. Reprod. 71, 909-918.
S. C. P. Renn, N. Aubin-Horth and H. A. Hofmann

3055Functional genomics of social phenotypeGreenwood, A. K., Wark, A. R., Fernald, R. D. and Hofmann, H. A. (2008). Arginine
vasotocin mediates both dominant and subordinate behavior via two distinct preopticpathways. Proc. Biol. Sci. doi:10.10981/rspb.2008.0622
Grober, M. S., George, A. A., Watkins, K. K., Carneiro, L. A. and Oliveira, R. F.(2002). Forebrain AVT and courtship in a fish with male alternative reproductive tactics.Brain Res. Bull. 57, 423-425.
Grozinger, C. M. and Robinson, G. E. (2002). Microarray analysis of pheromone-mediated gene expression in the honey bee brain. Integr. Comp. Biol. 42, 1237-1237.
Hallgren, S. L. E., Linderoth, M. and Olsen, K. H. (2006). Inhibition of cytochromep450 brain aromatase reduces two male specific sexual behaviours in the male Endlerguppy (Poecilia reticulata). Gen. Comp. Endocrinol. 147, 323-328.
Hartwell, L. H., Hopfield, J. J., Leibler, S. and Murray, A. W. (1999). From molecularto modular cell biology. Nature 402, C47-C52.
Helle, K. B. (2004). The granin family of uniquely acidic proteins of the diffuseneuroendocrine system: comparative and functional aspects. Biol. Rev. 79, 769-794.
Hofmann, H. A. (2003). Functional Genomics of Neural and Behavioral Plasticity. J.Neurobiol. 54, 272-282.
Hofmann, H. A. (2006). GnRH signaling in behavioral plasticity. Curr. Opin. Neurobiol.16, 343-350.
Hofmann, H. A. and Fernald, R. D. (2000). Social status controls somatostatin neuronsize and growth. J. Neurosci. 20, 4740-4744.
Hofmann, H. A., Benson, M. E. and Fernald, R. D. (1999a). Social status regulatesgrowth rate: Consequences for life-history strategies. Proc. Natl. Acad. Sci. USA 96,14171-14176.
Hofmann, H. A., Le Bail, P. Y. and Fernald, R. D. (1999b). Social control of growth andgrowth hormone levels in an African cichlid fish. Abstr. – Soc. Neurosci. 29, 348.16.
Holmes, A., Yang, R. J. and Crawley, J. N. (2002). Evaluation of an anxiety-relatedphenotype in galanin overexpressing transgenic mice. J. Mol. Neurosci. 18, 151-165.
Jadhao, A. and Pinelli, C. (2001). Galanin-like immunoreactivity in the brain andpituitary of the !four-eyed" fish, Anableps anableps. Cell Tissue Res. 306, 309-318.
Johnsson, M., Axelsson, M. and Holmgren, S. (2001). Large veins in the Atlantic cod(Gadus morhua) and the rainbow trout (Oncorhynchus mykiss) are innervated byneuropeptide-containing nerves. Anat. Embryol. 204, 109-115.
Kageyama, H., Takenoya, F., Kita, T., Hori, T., Guan, H. L. and Shioda, S. (2005).Galanin-like peptide in the brain: effects on feeding energy metabolism andreproduction. Regul. Pept. 126, 21-26.
Kocher, T. D. (2004). Adaptive evolution and explosive speciation: The cichlid fishmodel. Nat. Rev. Genet. 5, 288-298.
Legac, F., Blaise, O., Fostier, A., Lebail, P. Y., Loir, M., Mourot, B. and Weil, C.(1993). Growth-Hormone (GH) and Reproduction – a review. Fish Physiol. Biochem.11, 219-232.
Lim, M. M., Hammock, E. A. and Young, L. J. (2004). The role of vasopressin in thegenetic and neural regulation of monogamy. J. Neuroendocrinol. 16, 325-332.
Liu, H. H., Payne, H. R., Wang, B. and Brady, S. T. (2006). Gender differences inresponse of hippocampus to chronic glucocorticoid stress: Role of glutamate receptors.J. Neurosci. Res. 83, 775-786.
Maan, M. E., Eshuis, B., Haesler, M. P., Schneider, M. V., Van Alphen, J. J. M. andSeehausen, O. (2008). Color polymorphism and predation in a Lake Victoria cichlidfish. Copeia. 2008 (3), 621-629.
Madani, R., Kosloz, S., Akhmedov, A., Cinelli, P., Kinter, J., Lipp, H. P.,Sonderegger, P. and Wolfer, D. P. (2003). Impaired explorative behavior inneophobia in genetically modified mice lacking or overexpressing the extracellularserine protease inhibitor neuroserpin. Mol. Cell. Neurosci. 23, 473-494.
Maere, S., Heymans, K. and Kuiper, M. (2005). BiNGO: a Cytoscape plugin to assessoverrepresentation of Gene Ontology categories in Biological Networks. Bioinformatics21, 3448-3449.
Marsh, K. E., Creutz, L. M., Hawkins, M. B. and Godwin, J. (2006). Aromataseimmunoreactivity in the bluehead wrasse brain, Thalassoma bifasciatum:Immunolocalization and co-regionalization with arginine vasotocin and tyrosinehydroxylase. Brain Res. 1126, 91-101.
Martyniuk, C. J., Xiong, H. L., Crump, K., Chiu, S., Sardana, R., Nadler, A., Gerrie,E. R., Xia, X. H. and Trudeau, V. L. (2006). Gene expression profiling in theneuroendocrine brain of male goldfish (Carassius auratus) exposed to 17 alpha-ethinylestradiol. Physiol. Genomics 27, 328-336.
Miranda, E. and Lomas, D. A. (2006). Neuroserpin: a serpin to think about. Cell. Mol.Life Sci. 63, 709-722.
Mrowk, A. (1984). Brood care motivation and hunger in the mouth brooding cichlidPseudochrenilabrus multicolor. Behav. Processes 9, 181-190.
Munz, H. (1999). GnRH-systems in the forebrain of cichlid fish. Eur. J. Morphol. 37, 100-102.
Nakamura, M. and Kobayashi, Y. (2005). Sex change in coral reef fish. Fish Physiol.Biochem. 31, 117-122.
Nelson, R. J. (2005). An Introduction to Behavioral Endocrinology. 3rd edn. Sunderland,MA: Sinauer Associates.
Olazabal, D. E. and Young, L. J. (2006). Oxytocin receptors in the nucleus accumbensfacilitate !spontaneous" maternal behavior in adult female prairie voles. Neuroscience141, 559-568.
Oliveira, R. F., Hirschenhauser, K., Carneiro, L. A. and Canario, A. V. M. (2002).Social modulation of androgen levels in male teleost fish. Comp. Biochem. Physiol. B,Biochem. Mol. Biol. 132, 203-215.
Op de Beeck, H. P., Haushofer, J. and Kanwisher, N. G. (2008). Interpreting fMRIdata: maps, modules and dimensions. Nat. Rev. Neurosci. 9, 123-135.
Parhar, I. S., Ogawa, S. and Sakuma, Y. (2005). Three GnRH receptor types in laser-captured single cells of the cichlid pituitary display cellular and functional heterogeneity.Proc. Natl. Acad. Sci. USA 102, 2204-2209.
Parikh, V. N., Clement, T. S. and Fernald, R. D. (2006). Androgen level and malesocial status in the African cichlid, Astatotilapia burtoni. Behav. Brain Res. 166, 291-295.
Pollen, A. A., Dobberfuhl, A. P., Scace, J., Igulu, M. M., Renn, S. C. P., Shumway, C.A. and Hofmann, H. A. (2007). Environmental complexity and social organizationsculpt the brain in Lake Tanganyikan cichlid fish. Brain Behav. Evol. 70, 21-39.
R Development Core Team (2006). R:A language and environment for statisticalcomputing. R. Foundation for Statistical Computing, Vienna, Austria. !http://www.R-project.org"
Redies, C. and Puelles, L. (2001). Modularity in vertebrate brain development andevolution. BioEssays 23, 1100-1111.
Renn, S. C. P., Aubin-Horth, N. and Hofmann, H. A. (2004). Biologically meaningfulexpression profiling across species using heterologous hybridization to a cDNAmicroarray. BMC Genomics 5, 42.
Rhodes, J. S. and Crabbe, J. C. (2005). Gene expression induced by drugs of abuse.Curr. Opin. Pharmacol. 5, 26-33.
Robinson, G. E., Grozinger, C. M. and Whitfield, C. W. (2005). Sociogenomics: Sociallife in molecular terms. Nat. Rev. Genet. 6, 257-270.
Sagrillo, C. A., Grattan, D. R., McCarthy, M. M. and Selmanoff, M. (1996). Hormonaland neurotransmitter regulation of GnRH gene expression and related reproductivebehaviors. Behav. Genet. 26, 241-277.
Salzburger, W., Mack, T., Verheyen, E. and Meyer, A. (2005). Out of Tanganyika:genesis, explosive speciation, key-innovations and phylogeography of thehaplochromine cichlid fishes. BMC Evol. Biol. 5, 15.
Salzburger, W., Renn, S. C. P., Steinke, D., Hofmann, H. A., Braasch, I. and Meyer,A. (2008). Annotation of expressed sequence tags for the East African cichlid fishspecies Astatotilapia burtoni and evolutionary analyses of cichlid ORFs. BMCGenomics 9, 96-110.
Santangelo, N. and Bass, A. H. (2006). New insights into neuropeptide modulation ofaggression: field studies of arginine vasotocin in a territorial tropical damselfish. Proc.Biol. Sci. 273, 3085-3092.
Sapolsky, R. M. (2005). The influence of social hierarchy on primate health. Science308, 648-652.
Schick, R. R., Samsai, S., Zimmermann, J. P., Eberl, T., Endres, C., Schusdziarra,V. and Classen, M. (1993). Effect of galanin on food-intake in rats-involvement oflateral and ventromedial hypothalamic sites. Am. J. Physiol. 264, R355-R361.
Schlosser, G. and Wagner, G. P. (ed.) (2004). Modularity in Development andEvolution. Chicago: University Of Chicago Press.
Segal, E., Friedman Koller, D. and Regev, A. (2004). A module map showingconditional activity of expression modules in cancer. Nat. Genet. 36, 1090-1098.
Semsar, K. and Godwin, J. (2003). Social influences on the arginine vasotocin systemare independent of gonads in a sex-changing fish. J. Neurosci. 23, 4386-4393.
Semsar, K. and Godwin, J. (2004). Multiple mechanisms of phenotype development inthe bluehead wrasse. Hormones and Behavior 45, 345-353.
Shannon, P., Markiel, A., Ozier, O., Baliga, N. S., Wang, J. T., Ramage, D., Amin,N., Schwikowski, B. and Ideker, T. (2003). Cytoscape: a software environment forintegrated models of biomolecular interaction networks. Genome Res. 13, 2498-2504.
Shaw, D. R., Ashbumer, M., Blake, J. A., Baldarelli, R. M., Botstein, D., Davis, A.P., Cherry, J. M., Lewis, S., Lutz, C. M., Richardson, J. E. et al. (1999). Geneontology: a controlled vocabulary to describe the function, biological process andcellular location of gene products in genome databases. Am. J. Hum. Genet. 65,A419.
Silverin, B., Baillien, M. and Balthazart, J. (2004). Territorial aggression, circulatinglevels of testosterone, and brain aromatase activity in free-living pied flycatchers.Horm. Behav. 45, 225-234.
Simerly, R. B. (2002). Wired for reproduction: organization and development of sexuallydimorphic circuits in the mammalian forebrain. Annu. Rev. Neurosci. 25, 507-536.
Smyth, G. K., Thorne, N. P. and Wettenhall, J. (2004). LIMMA: Linear Models forMicroarray Data, Version 1.6.6, User"s Guide [http://bioinf.wehi.edu.au/limma/].
Sokal, R. R. and Rohlf, F. J. (1995). Biometry: The Principles and Practice of Statisticsin Biological Research. 3rd edn. New York: W.H. Freeman.
Soma, K. K., Francis, R. C., Wingfield, J. C. and Fernald, R. D. (1996). Androgenregulation of hypothalamic neurons containing gonadotropin-releasing hormone in acichlid fish: Integration with social cues. Horm. Behav. 30, 216-226.
Soma, K. K., Schlinger, B. A., Wingfield, J. C. and Saldanha, C. J. (2003). Brainaromatase, 5 alpha-reductase, and 5 beta-reductase change seasonally in wild malesong sparrows: relationship to aggressive and sexual behavior. J. Neurobiol. 56, 209-221.
Sorensen, C., Overli, O., Summers, C. H. and Nilsson, G. E. (2007). Social regulationof neurogenesis in teleosts. Brain Behav. Evol. 70, 239-246.
The Gene Ontology Consortium (2000). Gene ontology: tool for the unification ofbiology. Nat. Genet. 25, 25-29.
Tortorella, C., Neri, G. and Nussdorfer, G. G. (2007). Galanin in the regulation of thehypothalamic-pituitary-adrenal axis (Review). Int. J. Mol. Med. 19, 639-647.
Townsend, J. P. and Hartl, D. L. (2002). Bayesian analysis of gene expression levels:statistical quantification of relative mRNA level across multiple strains or treatments.Genome Biol. 3, research0071.1-0071.16.
Trainor, B. C. and Hofmann, H. A. (2006). Somatostatin regulates aggressive behaviorin an African cichlid fish. Endocrinology 147, 5119-5125.
Trainor, B. C. and Hofmann, H. A. (2007). Somatostatin and somatostatin receptorgene expression in dominant and subordinate males of an African cichlid fish. Behav.Brain Res. 179, 314-320.
Trainor, B. C., Kyomen, H. H. and Marler, C. A. (2006). Estrogenic encounters: Howinteractions between aromatase and the environment modulate aggression. Front.Neuroendocrinol. 27, 170-179.
Trudeau, V. L., Spanswick, D., Fraser, E. J., Lariviere, K., Crump, D., Chiu, S.,MacMillan, M. and Schulz, R. W. (2000). The role of amino acid neurotransmitters inthe regulation of pituitary gonadotropin release in fish. Biochem. Cell Biol. 78, 241-259.
Volkoff, H., Canosa, L. F., Unniappan, S., Cerda-Reverter, J. M., Bernier, N. J.,Kelly, S. P. and Peter, R. E. (2005). Neuropeptides and the control of food intake infish. Gen. Comp. Endocrinol. 142, 3-19.

3056White, S. A., Bond, C. T., Francis, R. C., Kasten, T. L., Fernald, R. D. and Adelman,
J. P. (1994). A 2nd gene for gonadotropin-releasing-hormone-cdna and expressionpattern in the brain. Proc. Natl. Acad. Sci. USA 91, 1423-1427.
White, S. A., Nguyen, T. and Fernald, R. D. (2002). Social regulation of gonadotropin-releasing hormone. J. Exp. Biol. 205, 2567-2581.
Whitehead, A. and Crawford, D. L. (2006). Variation within and among species in geneexpression: raw material for evolution. Mol. Ecol. 15, 1197-1211.
Whitfield, C. W., Cziko, A. M. and Robinson, G. E. (2003). Gene expression profiles inthe brain predict behavior in individual honey bees. Science 302, 296-299.
Wiesenfeldhallin, Z., Xu, X. J., Langel, U., Bedecs, K., Hokfelt, T. and Bartfai, T.(1992). Galanin-mediated control of pain-enhanced role after nerve injury. Proc. Natl.Acad. Sci. USA 89, 3334-3337.
Winslow, J. T., Hastings, N., Carter, C. S., Harbaugh, C. R. and Insel, T. R. (1993). Arole for central vasopressin in pair bonding in monogamous prairie voles. Nature 365,545-548.
Wolf, D. M. and Arkin, A. P. (2003). Motifs, modules and games in bacteria. Curr. Opin.Microbiol. 6, 125-134.
Wu, H., Kerr, M. K., Cui, X. and Churchill, G. A. (2002). MAANOVA: a softwarepackage for the analysis of spotted cDNA microarray experiments. In The Analysis ofGene Expression Data: Methods and Software (ed. G. Parmigiani, E. S. Garett, R. A.Irizarry and S. L. Zeger), pp. 313-341. New York: Springer-Verlag.
Yu, K. L. and Peter, R. E. (1991). Changes in brain levels of gonadotropin-releasing-hormone and serum levels of gonadotropin and growth-hormone in goldfish duringspawning. Can. J. Zool. 69, 182-188.
S. C. P. Renn, N. Aubin-Horth and H. A. Hofmann