repeatability case study of the 3d printer in the school
TRANSCRIPT

Western Kentucky UniversityTopSCHOLAR®
Masters Theses & Specialist Projects Graduate School
Spring 2018
Repeatability Case Study of the 3D Printer in theSchool of Engineering and Applied Science LabNaif Faleh S. AlbaijiWestern Kentucky University, [email protected]
Follow this and additional works at: https://digitalcommons.wku.edu/theses
Part of the Ergonomics Commons, Industrial Engineering Commons, Operational ResearchCommons, and the Other Operations Research, Systems Engineering and Industrial EngineeringCommons
This Thesis is brought to you for free and open access by TopSCHOLAR®. It has been accepted for inclusion in Masters Theses & Specialist Projects byan authorized administrator of TopSCHOLAR®. For more information, please contact [email protected].
Recommended CitationAlbaiji, Naif Faleh S., "Repeatability Case Study of the 3D Printer in the School of Engineering and Applied Science Lab" (2018).Masters Theses & Specialist Projects. Paper 2359.https://digitalcommons.wku.edu/theses/2359
REPEATABILITY CASE STUDY OF THE
3D PRINTER IN THE SCHOOL OF ENGINEERING AND APPLIED SCIENCES LAB
A Thesis
Presented to
The Faculty of the School of Engineering and Applied Science
Western Kentucky University
Bowling Green, Kentucky
In Partial Fulfillment
Of the Requirements for the Degree
Master of Science
By
Naif Albaiji
May 2018


I dedicate this thesis to my family, especially my mother, Laila Altaie, my father, Faleh,
and my brother, Fawaz Albaiji. They have supported me since day one to ensure that I
find my way to success. I also dedicate this work to the School of Engineering and
Applied Science, my thesis committee, and my professors who have guided me.

iv
ACKNOWLEDGMENTS
I would like to thank several people who inspired and helped me throughout my
journey with this study and degree: Dr. Greg Arbuckle, Dr. Douglas Chelson, Dr. Bryan
Reaka, Dr. Brent Askins and Dr. Daniel Jackson. I would also like to thank the Ogden
College of Science and Engineering for giving me the opportunity to use their facilities
and resources to finalize my thesis. I would like to thank the Royal Embassy of Saudi
Arabia and the Saudi Arabian Cultural Mission (SACM) in the U.S for providing
scholarship and support during my studies in the U.S. I would also like to thank Mr.
Amro Eissa, my advisor at SACM, for the guidance he provided and for his patience.

v
CONTENTS
Introduction ......................................................................................................................... 1
Review of Literature ........................................................................................................... 6
Methodology ..................................................................................................................... 18
Findings ............................................................................................................................ 30
Conclusion ...................................................................................................................... 335
References ......................................................................................................................... 37

vi
LIST OF FIGURES
Figure 1. Top of the product……………………………………………………………..22
Figure 2. Bottom of the product………………………………………………………….22
Figure 3. Top and side of the product……………………………………………………22
Figure 4. Top of the building table inside the 3D printer………………………………..27

vii
LIST OF TABLES
Table 1. Gage Repeatability Measurements (Caliper)……………...……………………24
Table 2. Gage Repeatability Measurements (Scale)……………………………………..26
Table 3. Products Measurements………………………………………..……………….29
Table 4. Weight ANOVA………………………………………………………………..30
Table 5. Weight ANOVA Calculations………………………………………………….30
Table 6. Width ANOVA…………………………………………………………………31
Table 7. Width ANOVA Calculations……………………………….…………………..31
Table 8. Depth ANOVA…………………………………………………………………32
Table 9. Depth ANOVA Calculations…………………………………………………...32
Table 10. Height ANOVA……………………………………………………………….33
Table 11. Height ANOVA Calculations…………………………………………………33
viii
REPEATABILITY CASE STUDY OF THE
3D PRINTER IN THE SCHOOL OF ENGINEERING AND APPLIED SCIENCES LAB
Naif Albaiji May 2018 42 Pages
Directed by: Greg Arbuckle, Bryan Reaka, and Brent Askins
School of Engineering and Applied Science Western Kentucky University
3DP (three-dimensional printing) technologies have become more than just a tool
to help companies with prototyping and designing in the pre-production stage. Some
firms have already implemented 3DP technology to produce parts and end-use products.
However, there are several challenges and barriers that this technology must overcome to
replace traditional manufacturing methods. One of the most significant obstacles
associated with 3D printing is its low level of accuracy in variable repeatability when it
comes to making separate batches of the same product. There are several arguable
reasons behind this variation. Some of the factors that can influence repeatability are the
type of material, the design, the type of product produced, and the orientation, or the
location of the build inside the building envelope. The goal of this study was to determine
whether the location of the build inside the surface area of the working envelope can
affect the properties (height, width, depth, and weight) of the product.
Western Kentucky University (WKU) provides students with a few 3D printers on
campus. One of those printers, a Stratasys (model: BST 768/SST 768), is in the Senator
Mitch McConnell Advanced Manufacturing and Robotics Laboratory. The researcher
used this printer for the study to determine if the location of the printer influenced the
final product. The conclusion of the research did reveal that the printing location does
affect the quality of the final product.

Introduction
3DP creates objects of different shapes by laying material down in a layered
structure. Some examples of useful products that are being produced with 3DP include
knee implants, tooth crowns, automotive parts and hearing aids. It is probable that the
3DP industry will grow into an $8.4 billion market by the year 2025, with significant
contributors such as the aerospace, automotive and medical industries (Bhattacharjee,
Urrios, Kang, & Folch, 2016). 3DP has emerged as a game-changer in the global business
environment, mainly because of its ability to reduce lead-time (Petrick & Simpson,
2013). 3-Dimensional printing is also highly useful in creating customized products due
to a fast and straightforward design-to-create manufacturing cycle.
Despite the many applications and services that 3DP offers, manufacturers are
still not taking full advantage of the technology when it comes to end-use products due to
several obstacles. Some of these barriers include the limited variety of materials and the
variation in repeatability. Traditional manufacturing processes are still winning the race
when it comes to mass production and end-use products. However, 3DP has an
advantage when it comes to the pre-production stage, namely in the prototyping and
designing phases.
In this case study, the researcher tested the 3-dimensional printer to determine
whether the location of the build on the printing surface affected the measurements
(height, width, depth, and weight) of the final products. The 3D printer, made by
Stratasys (BST 768/ SST 768), is located at the Senator Mitch McConnell Advanced
Manufacturing and Robotics Laboratory. Completion of this study required multiple
steps: design, Gage R&R, measurement devices, and making the products.
1
2
First, the researcher designed a product using CAD (Computer Aided Design)
software. The product has a simple design to minimize the possibility of error, especially
in the measurement phase. The design, a one-inch cube, included specific markers to
determine the orientation of the product. The design utilized a small sphere indentation
on the top face and a planned vertex. The weight and volume of the indentations were
calculated and deducted from the initial weight (See methodology section for more
details).
Following the design phase, the researcher performed a Gage R&R study on the
measurement devices used to measure the products. Testing the measurement devices
ensured that they would not introduce any false data to the study. The Gage R&R method
allowed the researcher to test repeatability and the reproducibility of the measurement
devices (Pyzdek & Keller, 2014). Because there was only one operator recording
measurements for this study, it was not necessary to test the reproducibility of the
devices. Two instruments used during the study, a digital scale for weight and a digital
caliper for height, depth and width. The researcher tested the caliper using three different
cera gage blocks made by Mitutoyo, certifying the blocks on June 15, 2005. The sizes of
the blocks are 1”, 1.2” and 0.9” or 25.4 mm, 30.48 mm and 22.86 mm, respectively.
Additionally, the accuracy of the scale was tested using three different US currency
coins: a penny, which weighs 2.5 g, a nickel, which weighs 5.0 g and a dollar, which
weighs 8.1 g (Weight specifications are from the US Mint website).
First, the measurement devices were checked and readied. Then the researcher
started building batches, containing five different products with the same specifications
and assigned each product a different location on the working envelope of the printer.

3
Once the products were ready, the researcher took the measurements needed and
recorded the findings.
The goal of this study was to determine whether the location of the build on the
printing surface affects the final products. Based on William Gosset’s theory, to have a
valid study with a normal distribution, at least 30 different products were required. The
researcher used five different locations in six different runs, which resulted in 30 parts.
The five sections of the printing surface were named A, B, C, D, and E. Each sequence
was assigned a numeral: 1, 2, 3, 4 and 5. The number of the run and the name of the
location determined the name of each product. For example, the name of the product at
location C in the third sequence would be C3.
Problem Statement
The usage, and applications, of 3DP are rapidly growing. However, there are
some obstacles to overcome for this new technology to change the face of manufacturing.
The main problem associated with this technology is its repeatability when it comes to
the four areas mentioned earlier: height, width, depth, and weight. Using a Stratasys
(BST 768/ SST 768) 3-dimensional printer, this case study tested one of the factors that
can result in the lack of accuracy. The researcher experimented with the location of the
build on the printing envelope to determine if it influenced the outcome.
Significance of the Research
Berman, B. (2012) anticipated that 3DP technology would be a critical factor in
the third industrial revolution. However, to be part of this new revolution, this technology
has many areas to improve upon, including types of material available, prices of printers
and most importantly, the accuracy and repeatability. This research examined the

4
variability in products when using different locations on the printing surface of the
Stratasys 3-dimensional printer (BST 768/ SST 768). The focus of the study was the
location of the build inside the printer. The researcher investigated the potential role of
the locale in conjunction with the inconsistency of product dimensions.
Purpose of the Research
This study attempted to determine whether the location of the build in the 3D
printer can result in vast variation in final product measurements. The areas that the
researcher measured and considered were height, width, depth, and weight. The outcome
of this study showed the variation between the products in a statistical way using the
ANOVA test method.
Research Questions
Based on the problem statement highlighted in the previous section, this research
attempts to answer the following research questions:
Does the location of the build have any effect on the height of products?
Does the location of the build have any effect on the width of products?
Does the location of the build have any effect on the depth of products?
Does the location of the build have any effect on the weight (mass) of products?
This research attempted to experiment with the 3DP available in the School of
Engineering and Applied Science Laboratory (Stratasys BST 768/ SST 768) to answer
these research questions.
Assumptions
a. The printer worked perfectly, and there was no variation in its performance
during the study.
5
b. The material used in the printer was in decent condition.
c. The researcher cleaned the printer of any previous products and projects.
d. The researcher used the same measuring devices for each product.
Limitations
a. The printer is a few years old. There is no previous data available on the wear
associated with the printer, and if it will affect the build.
b. Not having control over the temperature and humidity of the room caused
some variation in the study.
c. The cost of the materials used limited the sample.
Definition of Terms
3DP- 3-Dimensional Printing. According to Petrovic et al. (2011), it is the
evolved form of printing technology that can produce, as well as
reproduce, sophisticated freestanding structures through additive layer
fabrication process in one piece.
Gage R&R- Gage repeatability and reproducibility, a statistical test to
determine the variation in the measurement devises used in the study.
ANOVA- Analysis of variance to test the variation between or within
groups of products.

6
Review of Literature
According to Lu and Reynolds (2008), the process of 3D Printing involves two
stages. In the first phase, the data/designs transfer from software to the 3D printer. Then,
in the second stage, the printer head works in all X, Y and Z directions to print the
required product layer-by-layer. Lu and Reynolds further explain in detail that the
printing process starts with designing the required product in CAD (Computer Aided
Design) software. The operator then sends the design to the printer, which begins to print
two-dimensional slices layer-by-layer that join to represent a 3D object. The printing
process continues until completion of the job and the component, or product, is ready.
CAD systems allow designers to design and manipulate design data. Using the
software, they can create three-dimensional figures, with variations in design, size or
features, and send it for approval. Once the operator approves the design, the process
moves on to the second stage. Petrovic et al. (2011) describes the second phase as the
coating and fusing stage during which the printer creates the layers. The raw materials,
and the energy source, for the second stage depend on the techniques used by the
manufacturer. According to Kain et al. (2009), 3DP allows a high level of flexibility in
manufacturing because of its ability to print customized designs and ability to alter the
configuration at the last moment before printing. This flexibility provides the
manufacturer with more control over the design, producing a highly detailed finished
product.
3DP technology has been in the development and application phase since the
1980s. The development of cost-effective 3DP solutions has led to breakthroughs in

7
dimensional printing technology. Scholars consider 3DP technology breakthroughs in
manufacturing technology in a similar light to the recognition of the Internet, and
personal computers as breakthroughs in information technology (Jenkins et al., 2015;
Barnatt, 2016). However, in the last five years, owing to the development of 3DP
technology, the potential for 3DP has increased to a tremendous degree and across
several fields.
According to Marchese, Crane, and Haley (2015), the market size for 3D printers,
services, and materials have reached approximately $44.2 billion. Application of this
technology has extended to a range of industries, for example consumable goods,
consumable food, building prototypes, and creation of spare parts and objects (Millsaps,
2016; Dillow, 2011).
Additive Manufacturing (AM)
Additive manufacturing, also known as AM, is the industrialized version of 3DP.
AM refers to the layer-by-layer building of a product until the final product is ready. The
technology uses several types of powder formed materials, including plastics,
composites, and metals. It is a design-driven manufacturing process, offering a serial
production as well as high degree of customization (Manners-Bell & Lyon, 2014). AM
offers new possibilities for designing and manufacturing. It allows for the creation of
exclusive products having complex geometries. Moreover, 3DP enables the creation of
one-piece functional parts, which results in a reduction of time and cost (Campbell et al.,
2011). According to Karagol (2015), there are several types of AM technology
categorized by the type of raw material used. These include powder-based, solid-based
and liquid-based 3DP.
8
History of 3DP
Charles Hull, an American engineer, developed the first 3D printer in 1984
(Paukku, 2013). The idea of the 3D printer came to Hull while studying photopolymers,
i.e., plastics having the potential to harden with light. He conceived of building a device
that could gradually create an object by hardening one thin plastic layer over another
(Paukku 2013). He applied for a patent on the equipment, as well as the technology,
terming the technology as stereolithographic. Patenting the technology led to the
development of the company ‘3D Systems', which is still one of the world's largest
manufacturers of 3D printers. Stratasys is another major player in the industry, with a
similar origin story. Scott Crump founded the company a year after inventing fused
deposition modeling (FMD). According to Barnatt (2013), both 3D Systems and
Stratasys are similar regarding scale.
Scholars also describe 3DP as rapid prototyping, because some manufacturers use
AM to build scale models, prototypes, or parts, before sending them for mass production.
Rapid prototyping does not refer to instant printing, but it does decrease the time
compared to traditional manufacturing. Although AM can take hours, sometimes days, to
manufacture an object, the conventional production is still considerably slower. The
development of prototype by hand or making a mold of the object, and then tooling
machinery, and finally producing the required object takes a lot of time. 3DP, or AM,
provides a more rapid solution. Gershenfeld (2005) suggests that building a prototype
using 3DP is better for the manufacturer as the cost of mold, as well as tooling, can be
avoided in case a change in design is required.
9
Diffusion of 3DP
Although 3DP technology has been around for more than 30 years, the adoption
rate has been low. In 2016, AM was approximately a $5.1 billion industry (McCue,
2016), while the overall manufacturing industry in 2012 was worth approximately $15
trillion (Lipson & Kurman, 2013). The overall worth of the industry highlights the low
adoption rate of 3D technology.
According to Wohlers Associates (2013), the 3DP industry could be worth $10
billion by 2021. However, Wohlers is skeptical about the adoption of 3D printers at a
consumer level. He predicts that the majority of people will never operate or purchase a
3D printer regardless of their happiness and satisfaction with customized 3D printed
goods. The consumers will get the printing done by a retailer, but will not purchase a 3D
printer for themselves (Lipson &Kurman, 2013). Similarly, according to Dougherty
(2013), 3DP is like espresso makers and jet skis and should be considered a toy rather
than a manufacturing tool. Marsh (2012) highlights several experts and researchers who
believe 3DP will become a mainstream manufacturing technology by the year 2040. The
unique characteristics of AM indicate a tremendous potential for mass production,
reduced supply chain costs, and reduction in lead-time. By adopting 3DP, organizations
can differentiate themselves from other manufacturers. 3DP allows companies to add
variety in their products at almost zero extra cost.
The diffusion of 3DP accelerated from the start of the year 2014 mainly because
of a couple of events that occurred in the 3DP industry. As a result, the potential of 3DP
reached a new level. In 2014, the unpatented technology selective laser sintering (SLS)
was developed. The unpatented technology was available for everyone to use, which

10
resulted in new 3D printer manufacturers entering the market. In 2009, a similar thing
occurred when there was a lapse in patenting FDM (fused deposition modeling).
However, SLS is a more advanced 3DP technology as compared to other available
technologies. SLS can produce ready-to-use metal objects. The lapse in patenting the SLS
technology resulted in an efficient technological breakthrough. The 3DP market saw an
unexpected inflow of affordable 3D printers based on SLS technology. This breakthrough
made 3DP technology available to a higher number of SMEs who manufactured
customized metal parts. Since the 3DP technology was expensive, these SMEs could not
afford to purchase multiple printers for different locations. However, with the availability
of the unpatented SLS technology, they were now able to afford the 3DP technology
previously denied to them by cost.
Another event that enhanced the potential for 3DP was the entry of Hewlett
Packard (HP) into the 3DP industry. HP is one of the biggest companies in 2D printing.
The hope of greater diffusion of the 3DP technology increased because of the success of
HP in the printing industry. The industry expected that the household name, HP, would
make the 3DP technology feel more established among consumers. Also, HP is a more
established company than both 3D Systems and Stratasys combined. They have massive
production facilities, which can reduce prices of the 3D printers and increase the
adaptability of this technology.
3D Printing Disrupt Manufacturing
According to Petrick and Simpson (2013), manufacturers produced goods
differently before the industrial revolution. The industrial revolution disrupted the
industry and created something new called ‘supply chain.' As the industrial revolution

11
did, Petrick and Simpson suggest that 3D Printing will interrupt manufacturing again.
They highlight the example of a hammer. Ordering one single customized product like a
hammer will cost consumers a lot more using traditional manufacturing compared to
additive manufacturing. This price gap will lean towards conventional production, as the
firm produces more hammers due to the economics of scale. Petrick and Simpson then
predict the future of production with the 3DP and its impact on consumers and
manufacturers (Petrick& Simpson, 2013). They claim that two main rules will control
manufacturing.
The first rule is ‘mass production;’ economies of scale for interchangeable parts
produced at high volume. The second is ‘craft production;’ economies of one for highly
customized products that can be built layer by layer. Petrick and Simpson also discussed
the materials used in 3DP. These materials range from polymers, which are the most
common, to ceramics and metals, which are the least common. Some limitations exist
concerning the capabilities and variety of materials, the speed of the printers and lack of
standards of the printers. Moreover, when building any part using a 3D printer, the
finished piece will still need some final touches, and sometimes there is a variation when
printing two similar components using the same printer (Petrick& Simpson, 2013).
The Future of 3DP
According to D’Aveni (2015), 3DP technology has come to a point where its
usage is about to enter mainstream manufacturing. He further adds that approximately
12% of the large-scale manufacturing organizations have adopted 3DP technology to
produce products in large volumes. However, for firms to consider this technology as a
part of the mainstream manufacturing method, 3DP must achieve at least 20% saturation

12
of the mainstream market. Managers should look for the potential of using 3D printers
within their organization, assessing how the technology can strategically fit their
institution’s needs to utilize this technology to reap all the possible benefits fully.
D'Aveni (2015) suggests that the future is manufacturing and that there is no doubt about
it. He predicts that the technology will be competing with conventional methods of
production within five years. However, organizations will have to explore how they can
attain the maximum possible benefits from this technology to increase the percentage of
usage in the mainstream market.
Commercial 3DP.
From the commercialization perspective, 3DP technology has been developing
and achieving maturity. Nonetheless, the benefits of this technology have favored some
specific situations and industries. Concerning the current research, it is essential to
comprehend the reasons behind the adoption and implementation of 3DP into
organizations’ manufacturing strategy. It is important to understand how commercializing
3DP technology can influence supply chain costs. The following sections provide insight
into the industries that have recognized 3DP as a modern and efficient manufacturing
method.
Prototyping
Manufacturers have been using 3DP to create prototypes in the initial phases of
this technology. According to Berman (2012), creating a prototype using 3DP is different
from making a prototype from traditional methods, using clay and wood. 3DP technology
allows making prototypes with different materials and moving parts. In fact, 3DP allows
developing prototypes for different markets, using different materials, without making

13
any costly change in the 3D Printer (Berman, 2012). Using 3DP technology for
producing prototypes has several advantages. First, 3DP allows making two identical
products, with slight variation, suggesting that economies of scale do not depend on serial
production in a 3DP context (Berman, 2012). Moreover, manufacturers and designers can
use cheap material, such as recycled paper, plastic, and resins to produce less expensive
3D prototypes. 3DP technology reduces the time and costs to develop a prototype
because it does not require dies and tools (Berman, 2012). Supporting Berman’s view,
Bogue (2013) explains that a 3D printer can produce a prototype directly from the CAD
design eliminating the requirement of costly specialized equipment. Berman (2012) cited
an example of Black and Decker and highlighted that a prototype that usually took three
to five days to produce, now required only a few hours using an on-site 3D printer. Bogue
(2013) suggests that 3DP can help start-up companies, particularly in situations in which
they want to do extensive market testing of their product before attempting a full-scale
launch.
Aircraft Industry
One industry that has been utilizing the 3DP technology the most is the aircraft
industry (Campbell et al., 2011; Bogue, 2013), particularly with the use of metal as the
3DP material (Petrick& Simpson, 2013). The aircraft industry used 3DP to produce low
volume, customized products not readily available. In their work, Campbell et al. (2011)
cited an example of an environmental control system duct produced using 3DP
technology for the F-18 fighter aircraft. The aircraft manufacturer uses 3DP technology
to save time, and reduce the number of parts involved for environmental control system
duct from sixteen to one. The complicated component produced did not need assembly.

14
Airbus also commercially utilizes the 3DP technology (Bogue, 2013). In fact, the
A380 is the first commercial plane to use parts manufactured using 3DP. The benefit for
the A380 was that 3DP technology allowed development of lighter components within
short lead times (Airbus, 2014). Thus, Airbus was able to reduce material usage, while
still ensuring the quality of the parts, and improved their lead-time. According to Airbus
(2014), in comparison to the traditional manufacturing technique, 3DP allowed them to
reduce 30% percent to 55% of the component’s weight, as well as reduce 99% of the raw
material requirement. The most notable advantage of 3DP for Airbus was that the
company can now produce cost-effective out-of-production spare parts in a very short
lead-time (Airbus, 2014). Ehrenberg (2013) highlighted that Airbus is working on the
development of a 3DP facility to print entire wings of their planes and is planning to
produce whole planes using 3DP by 2050.
Medical Industry
Another industry that has been increasingly using 3DP is the medical industry.
This industry is developing medical appliances like orthopedic implants and hearing aids
through 3DP technology. According to Campbell et al. (2011), Phonak and Siemens use
laser sintering to produce customized hearing aids. Using a 3D scan of the ear canal, they
can create a customized hearing aid that perfectly fits the ear of the patient. Titanium is
used to print the hearing aids. 3DP is also useful in the production of human prosthetic
bones to replace bones that have suffered damage from illness or injury (Bogue, 2013).
More importantly, any geometrical or complicated design can be developed in CAD to be
printed on a 3D printer later making this technology particularly ideal for the prosthetic
medical industry. Li et al. (2007), suggests that using porous implants with perfect
15
geometrical design can enhance the integration of implants with the newly grown bone.
There are many tremendous opportunities to expand 3DP technology within the medical
industry.
Locations Difficult to Access
Another area where 3DP has a considerable advantage regarding manufacturers is
in locales that are very difficult to access. For instance, sites like military or navy
facilities, or naval aircraft carriers in the middle of the sea. Deploying 3D printers in such
aircraft carriers will reduce the vulnerability of supply chains. Stinson (2014) argues that
if any component is required which is not available in the inventory, it can be printed on
demand using the 3D Printer. Stinson further adds that the US Navy has a 3D printer
installed on the USS Essex and considers the technology as the future of logistics. 3DP
can reduce the number of supplies and spare parts kept in supply as healthcare providers
can easily print as per requirement directly on the naval ship. Osborn (2014) contends
that printing parts at the destination will reduce lead-time from months to moments. The
potential of this technology at locations that are remote or difficult to access is limitless.
Osborn (2014) further adds that logistics in the future will have the following
characteristics: decreased costs, improved readiness, less frequently shipping parts, and
increased the speed of execution. Better logistics will eventually lead organizations to
produce products as complicated as printed unmanned aerial vehicles that have
microprocessors, communication capabilities, sensors, and electronics embedded in them.
In summary, organizations have been embracing 3DP as a method of manufacturing
products. The technology has been used to produce prototypes, components in medicine

16
and aircraft industry and to manufacture at the point of destination in remote, or difficult
to access locations.
Previous Studies
Previous studies are insufficient in researching and discussing whether the
location of the build in 3DP influences the final products. However, some scholars have
discussed other reasons for variation and quality when it comes to finished products.
Ollison and Berisso (2010) researched if the orientation of the build effects the outcome
using ZCast build material with a ZCorp 310 printer. It turned out that the direction was a
factor that had a significant influence on their final product.
Sample Size Validity
There are many arguments about the size of samples needed when conducting
statistical research. According to William Gosset’s rule of thumb, to have a valid study
with normal distribution levels, researchers need at least 30 samples. Box (1987)
discussed how and why this theory started. First, he began with a brief history of how
Gosset and Fisher came up with the rule of thumb that requires at least 30 examples. One
of the reasons that the rule of thumb of 30 became popular is that computers were not
able to be utilized statistically, so tables were used to determine the cut-off points. The
author also talked about the misconception of the rule of thumb. Having 30 samples
ensures that the researcher has enough examples to have a study that contains a normal
distribution.
ANOVA Studies
ANOVA is a set of statistical formulas used to calculate the variance of several
parts or products (Miller Jr, 1997). Biologist Ronald Fisher first introduced the ANOVA

17
test. ANOVA works by testing the means of the groups and then creating the t-test to
determine the statistical significance of the scores calculated. At least 30 samples are
necessary to have a valid ANOVA test with a normal distribution. (Miller Jr, 1997)

18
Methodology
Procedure
The goal of this study was to determine whether the location of the build on the
3D printer’s envelope influences the accuracy of the products when using a Stratasys
BST768/SST768 3D printer. The researcher designed, printed and measured multiple
products built on different locations of the printing surface.
In the designing phase, the researcher designed and determined the size and the
material of the product. The design was small and simple, setting the design dimensions
at X = 25.4 mm, Y = 25.4 mm and Z = 25.4 mm. The design allowed the researcher to
print more than one product in a single run while minimizing time and cost. The total
weight of the initial design was 20.5 g based on the calculation of the material’s density.
The researcher subtracted the weight of the indentations used as markers from the total
weight to get the exact volume of the product.
WTC – WI = WFC (1)
W = D V (2)
D of ABS plastic = 1.25 g/cm3
V = (X) (Y) (Z) (3)
WTC = the total weight of the initial cube
WI = the weight of the indentation
WFC = the final weight of the cube
W = weight
D = density of the material
V = volume

19
V = (25.4) (25.4) (25.4) = 16.4 g
WTC = (1.25) (16.4) = 20.5 g
To calculate the cut of the corner which was shaped as a triangle, the researcher
calculated the base and height first to get the area of the triangle.
A2 + B2 = C2 (4)
(0.25)2 + (0.25)2 = C2
.0625 + 0.625 = C2
.125 = C2
C = 0.3535533” = 8.98 mm
To calculate the area of the triangle:
A = (1/2) (B) (H) (5)
A = area
B = base
H = height
A = (1/2) (4.49) (4.49) = 10.08 mm2
To get the weight of the cut piece:
(A) (Hc) (D) (6)
Hc = height of the cube
(10.08) (25.4) (1.25) = 3.2 g.
To calculate the area of the circle:
A = (4) (pi) (R)2 (7)
R = radius
A = (4) (3.14) (1.587)2
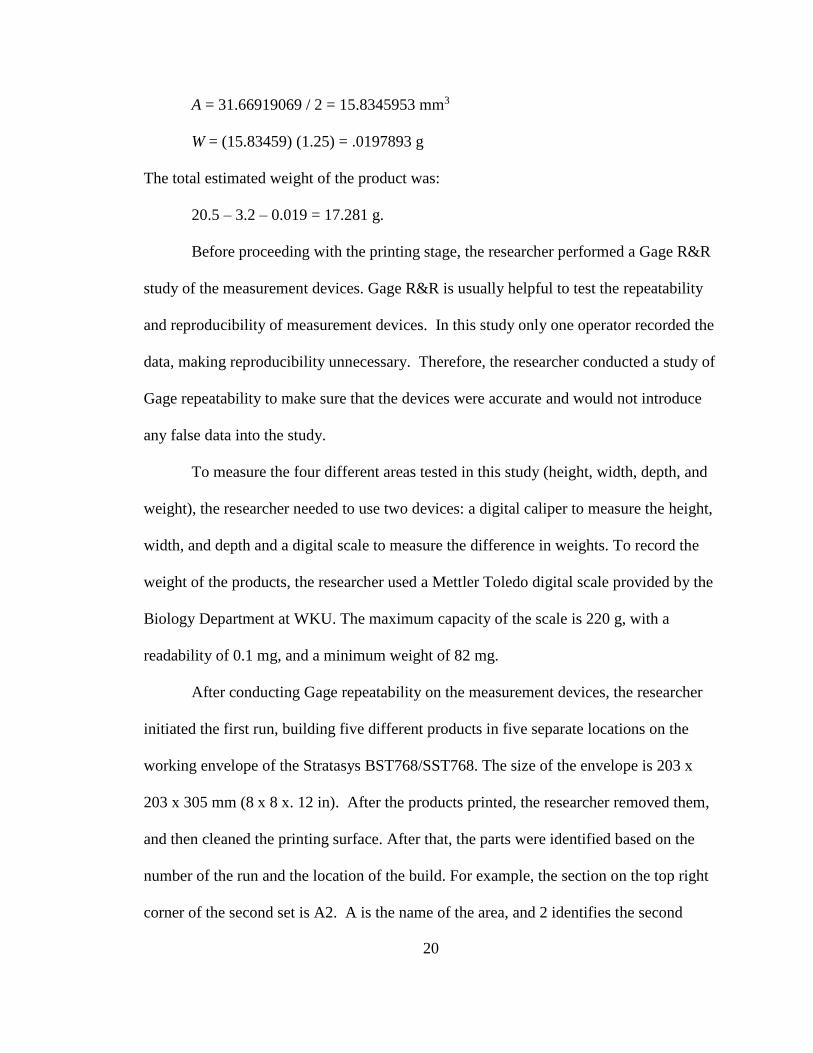
20
A = 31.66919069 / 2 = 15.8345953 mm3
W = (15.83459) (1.25) = .0197893 g
The total estimated weight of the product was:
20.5 – 3.2 – 0.019 = 17.281 g.
Before proceeding with the printing stage, the researcher performed a Gage R&R
study of the measurement devices. Gage R&R is usually helpful to test the repeatability
and reproducibility of measurement devices. In this study only one operator recorded the
data, making reproducibility unnecessary. Therefore, the researcher conducted a study of
Gage repeatability to make sure that the devices were accurate and would not introduce
any false data into the study.
To measure the four different areas tested in this study (height, width, depth, and
weight), the researcher needed to use two devices: a digital caliper to measure the height,
width, and depth and a digital scale to measure the difference in weights. To record the
weight of the products, the researcher used a Mettler Toledo digital scale provided by the
Biology Department at WKU. The maximum capacity of the scale is 220 g, with a
readability of 0.1 mg, and a minimum weight of 82 mg.
After conducting Gage repeatability on the measurement devices, the researcher
initiated the first run, building five different products in five separate locations on the
working envelope of the Stratasys BST768/SST768. The size of the envelope is 203 x
203 x 305 mm (8 x 8 x. 12 in). After the products printed, the researcher removed them,
and then cleaned the printing surface. After that, the parts were identified based on the
number of the run and the location of the build. For example, the section on the top right
corner of the second set is A2. A is the name of the area, and 2 identifies the second

21
series. Upon completion of the first series, the researcher started the second run following
the same procedure. The researcher performed six different runs with five products in
each series for a total of 30 parts to have a normal distribution. After the production of
the batches, the researcher recorded the necessary measurements for the ANOVA test.
This test is a statistical tool to help observe the variance in a set of parts, or products.
After recording the data, the researcher divided the parts into five different groups
(group A, B, C, D, and E). Group A will have all the products built on location A; group
B will have all the products produced in group B, etc. Since the researcher used each
location six times, each group had six products. The researcher performed an ANOVA
test on each product measuring height, width, depth, and weight.
Creating groups simplified the process of recording the data into Excel speeding
up the development of an ANOVA test for each location. After conducting the ANOVA
test, the experiment yielded an F score and a P score. The F score determined if the
means between the groups was significantly different. The P score showed the calculated
probability of finding the projected side of the hypothesis.
First step: Design
Before getting to the designing phase, the researcher had to choose the
dimensions of the product. The preferred size of the product was X: 25.4 mm, Y: 25.4
mm Z: 25.4 mm. These measurements were selected to allow the researcher to print
multiple products in one run, to reduce time, and to reduce the overall cost of the
experiment. Determining the size of the product made it easier to decide which measuring
devices to consider. Also, the simple design reduced the error of the measurement phase.
The product had a circle (3.175mm diameter) and 2mm deep indention on the top and a
22
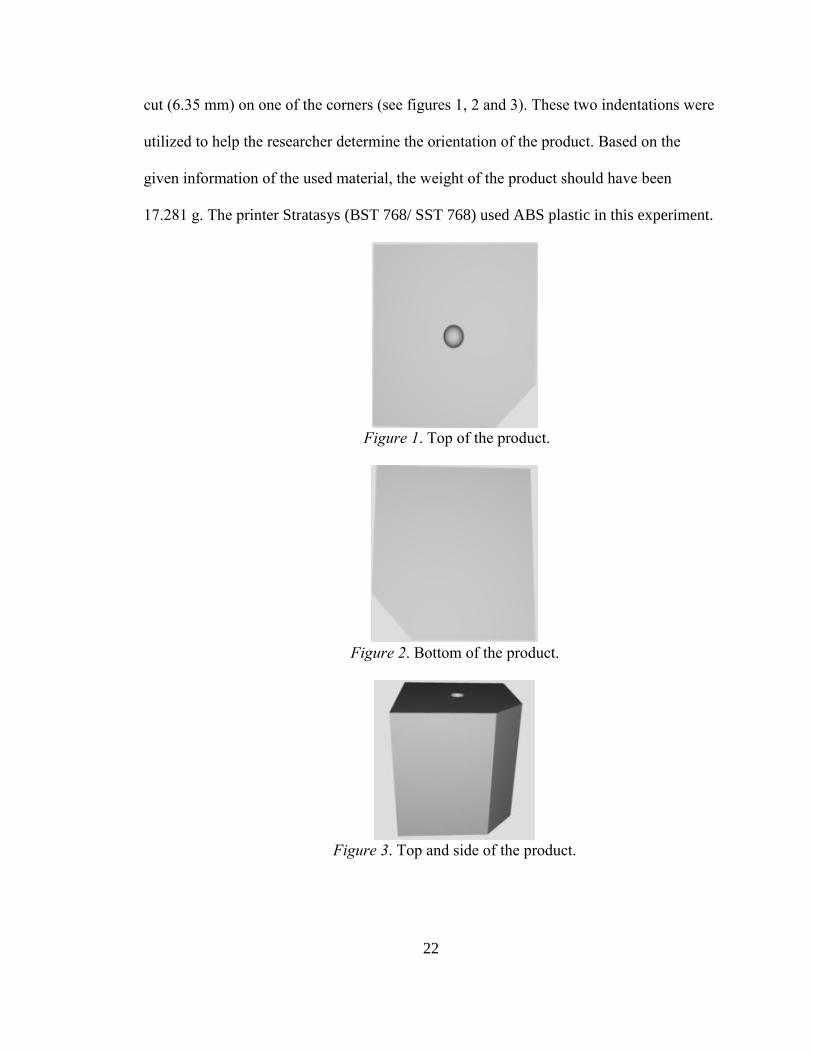
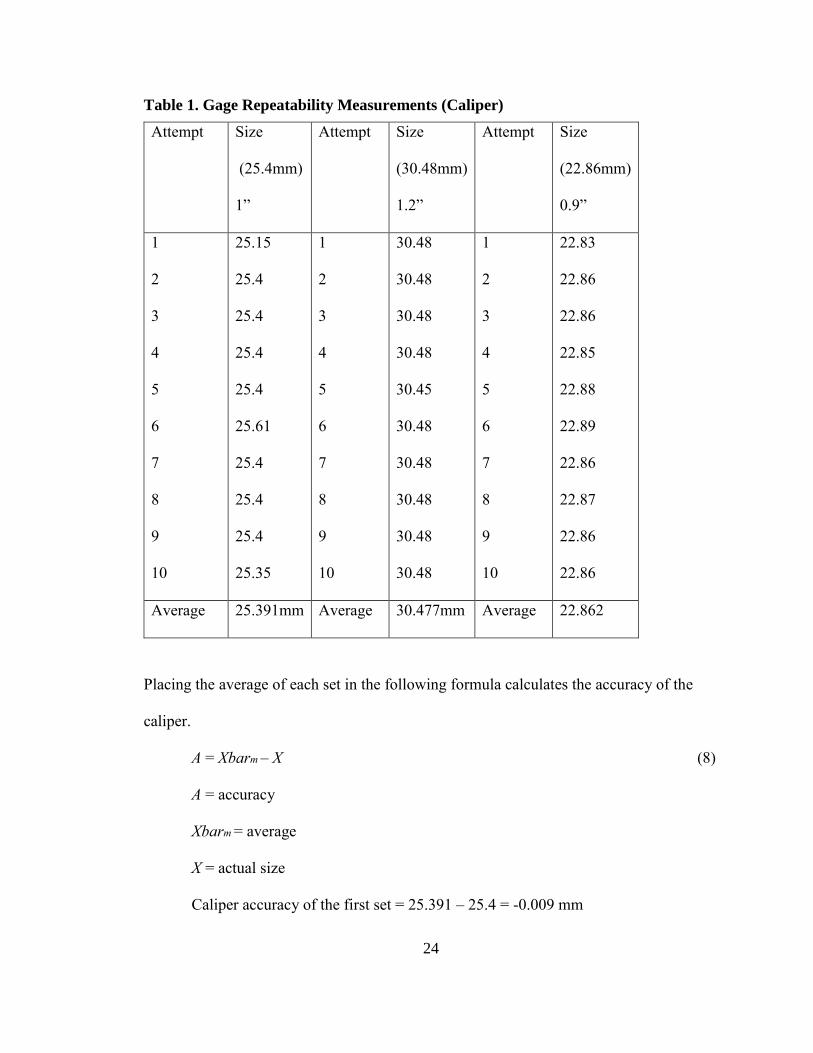
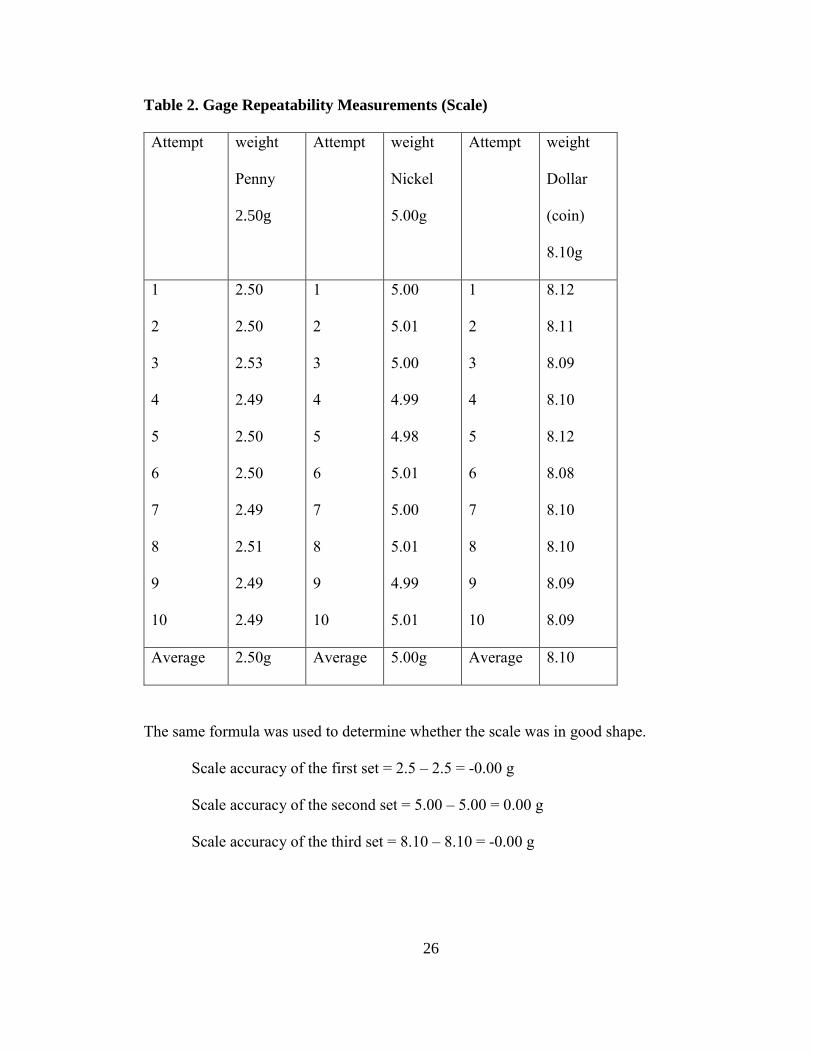
cut (6.35 mm) on one of the corners (see figures 1, 2 and 3). These two indentations were
utilized to help the researcher determine the orientation of the product. Based on the
given information of the used material, the weight of the product should have been
17.281 g. The printer Stratasys (BST 768/ SST 768) used ABS plastic in this experiment.
Figure 1. Top of the product.
Figure 2. Bottom of the product.
Figure 3. Top and side of the product.

23
Second step: Gage R&R
Once the design stage was ready, the researcher tested the measurement devices.
After choosing the measurement devices for the properties measured (height, width,
depth, and weight), Gage repeatability was conducted to check if the measurement
devices were ready for the measurement step. The research lacked having Gage's
reproducibility tested with the measurement devices due to a single operator recording
the data. The researcher used a digital caliper to measure the height, width, and depth.
This study also used a digital scale to measure the weight of the products. To test the
repeatability of the caliper, the researcher used three different cera gage blocks 1", 1.2"
and .9". The measurements convert to mm 25.4 mm, 30.48 mm and 22.86 mm. The
researcher performed the test using three different US currency coins, a penny which
weighs 2.5 g, a nickel which weighs 5.00 g and a dollar which weighs 8.1 g, using
specifications on the US Mint website, was used to check the repeatability.
24
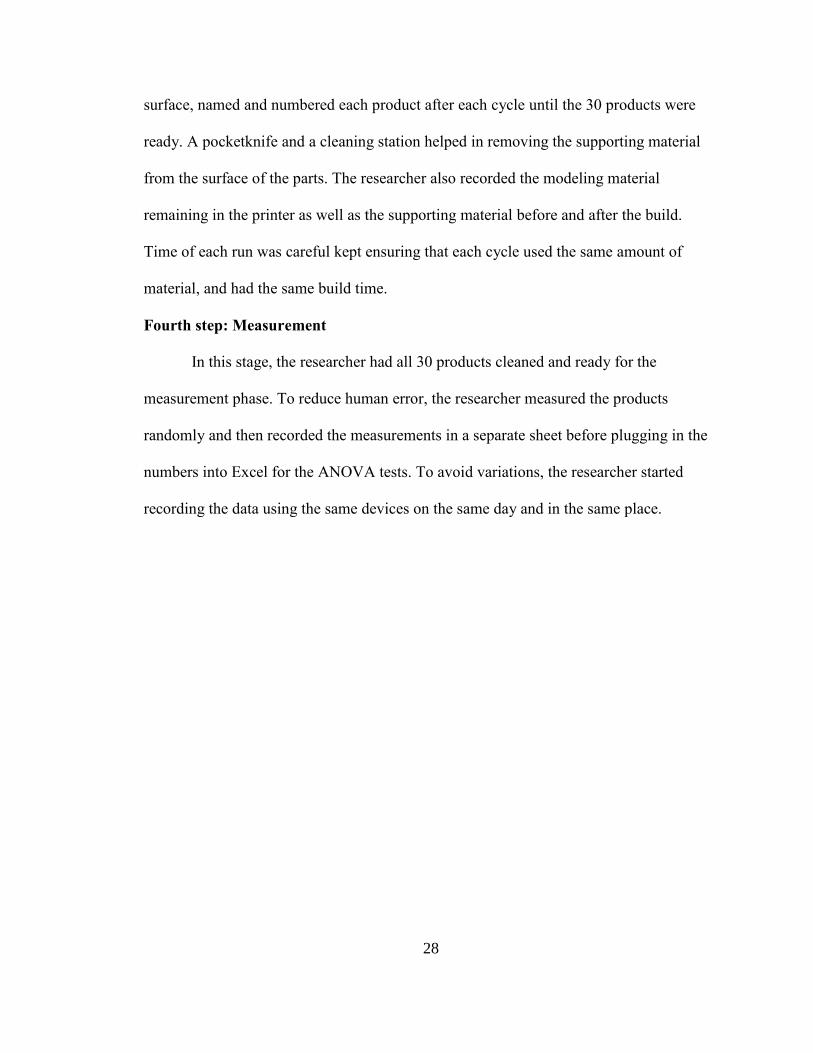
Table 1. Gage Repeatability Measurements (Caliper)
Attempt Size
(25.4mm)
1”
Attempt Size
(30.48mm)
1.2”
Attempt Size
(22.86mm)
0.9”
1
2
3
4
5
6
7
8
9
10
25.15
25.4
25.4
25.4
25.4
25.61
25.4
25.4
25.4
25.35
1
2
3
4
5
6
7
8
9
10
30.48
30.48
30.48
30.48
30.45
30.48
30.48
30.48
30.48
30.48
1
2
3
4
5
6
7
8
9
10
22.83
22.86
22.86
22.85
22.88
22.89
22.86
22.87
22.86
22.86
Average 25.391mm Average 30.477mm Average 22.862
Placing the average of each set in the following formula calculates the accuracy of the
caliper.
A = Xbarm – X (8)
A = accuracy
Xbarm = average
X = actual size
Caliper accuracy of the first set = 25.391 – 25.4 = -0.009 mm

25
Caliper accuracy of the second set = 30.477 – 30.48 = -0.003 mm
Caliper accuracy of the third set = 22.862 – 22.860 = 0.002 mm
The previous Gage study indicated that the caliper would not cause any variation or error
in the study.
26
Table 2. Gage Repeatability Measurements (Scale)
Attempt weight
Penny
2.50g
Attempt weight
Nickel
5.00g
Attempt weight
Dollar
(coin)
8.10g
1
2
3
4
5
6
7
8
9
10
2.50
2.50
2.53
2.49
2.50
2.50
2.49
2.51
2.49
2.49
1
2
3
4
5
6
7
8
9
10
5.00
5.01
5.00
4.99
4.98
5.01
5.00
5.01
4.99
5.01
1
2
3
4
5
6
7
8
9
10
8.12
8.11
8.09
8.10
8.12
8.08
8.10
8.10
8.09
8.09
Average 2.50g Average 5.00g Average 8.10
The same formula was used to determine whether the scale was in good shape.
Scale accuracy of the first set = 2.5 – 2.5 = -0.00 g
Scale accuracy of the second set = 5.00 – 5.00 = 0.00 g
Scale accuracy of the third set = 8.10 – 8.10 = -0.00 g

27
Third step: Printing
After testing the measurement devices, the researcher determined the location of the
build inside the printer working envelope. Five different locations were used to determine
whether the location will influence the accuracy of the build.
Figure 4. Top of the building table inside the 3D printer.
It was decided to name each product after its location (A, B, C, D, and E). This step
helped the researcher to determine which product came from which site to group them
when conducting the ANOVA tests. The organizational placement of each letter is as
follows: A is in the top left corner, B is in the bottom left corner, C is in the top right
corner, D is in the bottom right corner, and E is in the middle. Since the researcher
performed five different runs, each product had a name consisting of a letter and a
number. The alphabetical character indicated the location and the number determined the
series. For example, the name of the product in the top left corner of the second run
would be A2. The researcher took the products out after each run, cleaned the printing
28
surface, named and numbered each product after each cycle until the 30 products were
ready. A pocketknife and a cleaning station helped in removing the supporting material
from the surface of the parts. The researcher also recorded the modeling material
remaining in the printer as well as the supporting material before and after the build.
Time of each run was careful kept ensuring that each cycle used the same amount of
material, and had the same build time.
Fourth step: Measurement
In this stage, the researcher had all 30 products cleaned and ready for the
measurement phase. To reduce human error, the researcher measured the products
randomly and then recorded the measurements in a separate sheet before plugging in the
numbers into Excel for the ANOVA tests. To avoid variations, the researcher started
recording the data using the same devices on the same day and in the same place.

29
Table 3. Products Measurements
Number of the
product
Weight Width Depth Height
A1 15.12 25.30 25.41 25.42
A2 15.14 25.33 25.33 25.42
A3 15.13 25.30 25.30 25.43
A4 15.12 25.35 25.33 25.45
A5 15.12 25.31 25.42 25.45
A6 15.12 25.32 25.35 25.46
B1 15.14 15.14 25.33 25.45
B2 15.13 15.13 25.27 25.49
B3 15.12 15.12 25.25 25.49
B4 15.12 15.12 25.30 25.43
B5 15.12 15.12 25.30 25.45
B6 15.11 15.11 25.36 25.48
C1 15.09 25.34 25.27 25.46
C2 15.11 25.36 25.39 25.46
C3 15.11 25.35 25.32 25.46
C4 15.11 25.32 25.30 25.45
C5 15.10 25.34 25.30 25.44
C6 15.10 25.35 25.32 25.44
D1 15.12 25.31 25.40 25.45
D2 15.13 25.30 25.30 25.47
D3 15.12 25.28 25.41 25.45
D4 15.13 25.30 25.33 25.45
D5 15.11 25.27 25.35 25.47
D6 15.11 25.30 25.35 25.46
E1 15.12 25.45 25.27 25.45
E2 15.14 25.47 25.25 25.47
E3 15.13 25.43 25.32 25.42
E4 15.12 25.41 25.30 25.48
E5 15.13 25.42 25.28 25.46
E6 15.13 25.45 25.29 25.46

30
Findings
After recording the measurements, the data was transferred to Microsoft Excel to
start the ANOVA tests. The goal was to examine the variance within the groups, as well
as between groups. ANOVA tests are also used to determine the F and P scores; those
scores determine how statistically significant the variation was.
Table 4. Weight ANOVA
Group A Group B Group C Group D Group E
A1= 15.12 B1=15.14 C1=15.09 D1=15.12 E1=15.12
A2=15.14 B2=15.13 C2=15.11 D2=15.13 E2=15.14
A3=15.13 B3=15.12 C3=15.11 D3=15.12 E3=15.13
A4=15.12 B4=15.12 C4=15.11 D4=15.13 E4=15.12
A5=15.12 B5=15.12 C5=15.10 D5=15.11 E5=15.13
A6=15.12 B6=15.11 C6=15.10 D6=15.11 E6=15.13
Sum= 90.75 Sum= 90.74 Sum=90.62 Sum= 90.72 Sum= 90.77
Mean=15.125 Mean=15.1233 Mean=15.1033 Mean=15.12 Mean=15.1283
Table 5. Weight ANOVA Calculations
Source SS df MS F P
Between
groups
0.0023 5 0.0005 6.0526 0.0008
Within groups 0.0019 25 0.0001
Totals 0.0042 30

31
Since the degrees of freedom for the weight ANOVA are 5 and 25 with the
confidence level of alpha 0.05, the critical value of F would be 2.60. The ANOVA
calculations are showing that the P-value = 0.0008 and F value = 6.0526 which means the
difference is statistically significant. The initial calculated weight in the methodology
section was 17.281 g, which is almost two grams more than the actual average weight.
Table 6. Width ANOVA
Group A Group B Group C Group D Group E
A1=25.30 B1=25.27 C1=25.34 D1=25.31 E1=25.45
A2=25.33 B2=25.32 C2=25.36 D2=25.30 E2=25.47
A3=25.30 B3=25.34 C3=25.35 D3=25.28 E3=25.43
A4=25.35 B4=25.31 C4=25.32 D4=25.30 E4=25.41
A5=25.31 B5=25.31 C5=25.34 D5=25.27 E5=25.42
A6=25.32 B6=25.30 C6=25.35 D6=25.30 E6=25.45
Sum= 151.91 Sum=151.85 Sum= 152.06 Sum=151.76 Sum=152.63
Mean=25.3183 Mean=25.3083 Mean=25.3433 Mean=25.2933 Mean=25.4383
Table 7. Width ANOVA Calculations
Source SS df MS F P
Between
groups
0.0800 5 0.0160 43.8647 >0.0001
Within groups 0.0091 25 0.0004
Totals 0.0891 30
32
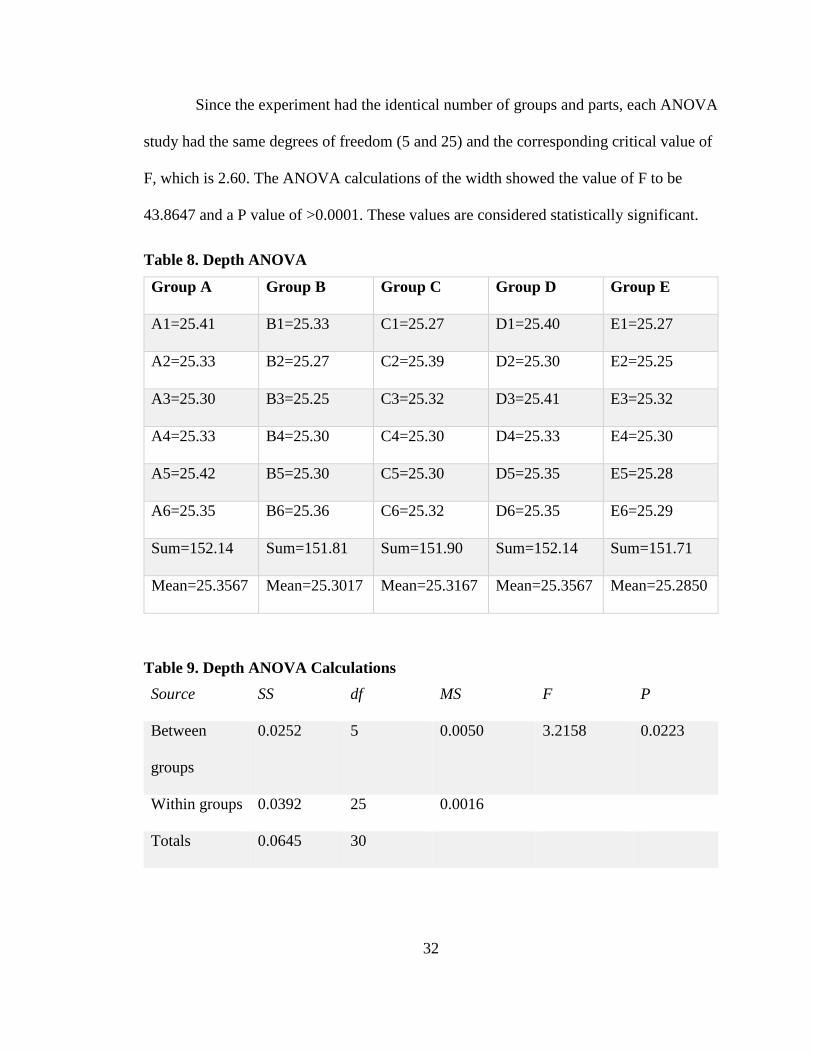
Since the experiment had the identical number of groups and parts, each ANOVA
study had the same degrees of freedom (5 and 25) and the corresponding critical value of
F, which is 2.60. The ANOVA calculations of the width showed the value of F to be
43.8647 and a P value of >0.0001. These values are considered statistically significant.
Table 8. Depth ANOVA
Group A Group B Group C Group D Group E
A1=25.41 B1=25.33 C1=25.27 D1=25.40 E1=25.27
A2=25.33 B2=25.27 C2=25.39 D2=25.30 E2=25.25
A3=25.30 B3=25.25 C3=25.32 D3=25.41 E3=25.32
A4=25.33 B4=25.30 C4=25.30 D4=25.33 E4=25.30
A5=25.42 B5=25.30 C5=25.30 D5=25.35 E5=25.28
A6=25.35 B6=25.36 C6=25.32 D6=25.35 E6=25.29
Sum=152.14 Sum=151.81 Sum=151.90 Sum=152.14 Sum=151.71
Mean=25.3567 Mean=25.3017 Mean=25.3167 Mean=25.3567 Mean=25.2850
Table 9. Depth ANOVA Calculations
Source SS df MS F P
Between
groups
0.0252 5 0.0050 3.2158 0.0223
Within groups 0.0392 25 0.0016
Totals 0.0645 30

33
As mentioned previously, since all the ANOVA tests share the same degrees of
freedom and the same F critical value, the depth ANOVA calculations indicate that the F
and P values are statistically significant. The test showed that the F value at 4.0198,
which is higher than the critical F value (2.60).
Table 10 height ANOVA
Group A Group B Group C Group D Group E
A1=25.42 B1=25.45 C1=25.46 D1=25.45 E1=25.45
A2=25.42 B2=25.49 C2=25.46 D2=25.47 E2=25.47
A3=25.43 B3=25.49 C3=25.46 D3=25.45 E3=25.42
A4=25.45 B4=25.43 C4=25.45 D4=25.45 E4=25.48
A5=25.45 B5=25.45 C5=25.44 D5=25.47 E5=25.46
A6=25.46 B6=25.48 C6=25.44 D6=25.46 E6=25.46
Sum=152.63 Sum=152.79 Sum=152.71 Sum=152.75 Sum=152.74
Mean=25.4383 Mean=25.4650 Mean=25.4517 Mean=25.4583 Mean=25.4567
Table 11 height ANOVA Calculations
Source SS df MS F P
Between
groups
0.0024 5 0.0005 1.5431 0.2126
Within groups 0.0077 25 0.0003
Totals 0.0101 30

34
On the other hand, the height ANOVA calculations indicated that the value of F at
1.5431 is lower than the F critical value (2.60). The ANOVA test also calculated the P
value which was 0.2126. These values are considered statistically insignificant.

35
Conclusion
The goal of this experiment was to determine whether the location of building
products inside the 3D printer at the School of Engineering and Applied Science
Laboratory affected the parts. The areas that the researcher focused on are height, width,
length, and weight. The idea was to print multiple components in different locations
using the same design and specifications then check if there is a variation between them.
Based on William Gosset theory, and to have a normal distribution, the researcher had to
build at least 30 parts.
To answer the questions of the study, the researcher had to go through a few
steps. First, the design of the product was as simple as possible to ease the process of the
build when it comes to time and materials. Keeping the design simple also helped in
reducing the human error when taking measurements. The parts were set to be a simple
one-inch cube all the way around (25.4 mm) with a cut on one of the sides and a small
sphere cut on the top. Those two indentations were utilized to help the researcher to
determine the orientation of the parts.
Before starting the printing phase, the researcher identified ABS plastic as the
type of the modeling material used in the experiment. The density of this material is 1.25
g/cm3, the estimated weight for each part was 20.5 g. However, after calculating the
weight of the indentations and subtracting it from the total weight of the cube, the final
initial weight was 17.281 g. Moreover, the researcher named and numbered every part
made right after each set. Five different locations were used in six sets to produce 30
pieces. Each section has a name consisting of a letter and a number. The alphabet
character determines the position of the component inside of the printer and the numeral
36
character identifies from which sequence the part originated. For example, the product
D3 means that this product came from location D of the third run.
To start the printing phase, the researcher had to transfer the design from the CAD
software to the printers’ software and determine the location and the number of parts
needed for each run. The printer took 4 hrs. and 21 min. to complete each cycle. Few
obstacles arose removing the supporting material from the actual parts removing the
necessity of having a cleaning station. However, in some cases, the researcher used a
pocketknife to remove some of the supporting materials from the pieces and the printing
surface.
Before recording measurements, the researcher conducted a Gage R&R study to
make sure that the measuring devices would not introduce any falls data into the study.
The research needed Gage repeatability, as only one operator recorded the measurements.
After conducting the Gage repeatability study, it turned out that the measuring devices
were in good shape and ready for the measurement phase.
The researcher recorded the measurements needed, height, width, depth, and
weight, in the same place at the same time to prevent any uncontrolled variation. After
recording the measurements, the researcher noticed some variations in the properties
tested, especially in weight. The calculations of the final estimated weight came out as
17.281 g; however, the actual weight of the parts was fluctuating from 15.10 g to 15.12 g.
The way the head inside the printer works could be the reason behind the variation in
weight as some air could enter between the layers of the products.
The researcher then transferred all the recorded data into Microsoft Excel to start
the ANOVA test. Four different ANOVA studies examined the height, width, depth, and

37
weight. Since the experiment has the same number of parts and groups, the four ANOVA
tests shared the same degrees of freedom (4 and 25) and the same F critical value (2.60).
The results of the ANOVA tests showed that the calculated F and P values are
statistically significant for the width, depth, and weight. On the other hand, the calculated
P and F value for the height were statistically insignificant.
Suggestions for Further Research
A few recommendations can be made to revalidate the data gathered from this
study. The researcher noticed some of the proposals during the testing and some after the
experiment. The first suggested change had to do with the printing surface inside the
Stratasys 3D printer used in this test. The manufacturer of the printer recommends
changing the printing surface after each use no matter how big or small the project is.
Using the same printing surface for each cycle could have introduced some variation into
the study and could be avoided in the future.
Another suggestion that would be helpful for further research is to anchor the
printer. The researcher noticed that the printer was vibrating during the printing phase.
The printer weighs 136 kg (300 lbs.) and is on a small table that is not attached to the
ground. Setting the printer on a bigger, more substantial and more stable table would help
prevent this issue from reoccurring.

38
References
Airbus (2014). Airbus expands its applications of the revolutionary additive layer
manufacturing process. Airbus Press Centre. March3. Retrieved from:
http://www.airbus.com/presscentre/pressreleases/press-release-
detail/detail/printing-the-future-airbus-expands-its-applications-of-the-
revolutionary-additive-layer-manufacturi/
Barnatt, C. (2016). Future Technologies: 3D Printing. Retrieved from:
http://explainingthefuture.com/3dprinting.html
Barnatt, C. (2013). 3D Printing - The Next Industrial
Revolution.ExplainingTheFuture.com®.
Berman, B. (2012). 3-D printing: The new industrial revolution. Business
Horizons, 55(2), 155-162.
Bhattacharjee, N., Urrios, A., Kang, S., & Folch, A. (2016). The upcoming 3D-printing
revolution in microfluidics. Lab on a Chip, 16(10), 1720-1742.
Bogue, R. (2013). 3D printing: the dawn of a new era in manufacturing? Assembly
Automation, 33(4), 307-311.
Box, J. F. (1987). Guinness, Gosset, Fisher, and small samples. Statistical Science, 2(1),
45-52.
Brüggemann, J., &Bizer, K. (2016). Laboratory experiments in innovation research: a
methodological overview and a review of the current literature. Journal of
Innovation and Entrepreneurship, 5(1), 1-13.
39
Campbell, T. A., Williams, C., Ivanova, O., & Garrett, B. (2011). Could 3D printing
change the world? Technologies, potential and implications of additive
manufacturing, strategic foresight. Atlantic Council, Washington, DC.
D’Aveni, R. (2015). The 3-D printing revolution. Harvard Business Review. Retrieved
from: https://hbr.org/2015/05/the-3-d-printing-revolution
Dillow, C. (2011). UK engineers print and fly the world’s first working 3-D printed
aircraft. Popular Science. Retrieved from:
http://www.popsci.com/technology/article/2011-07/uk-engineers-print-and-fly-
worlds-first-working-3-d-printed-aircraft?cmp=tw
Dougherty, D. (2013). How Many People Will Own 3D Printers? Retrieved from:
http://makezine.com/2013/04/05/how-many-people-will-own-3d-printers/
Ehrenberg, R. (2013). The 3‐D printing revolution: Dreams made real, one layer at a
time. Science News, 183(5), 20-25.
Gershenfeld, N. (2005). Fab - The Coming Revolution on Your Desktop - from Personal
Computers to Personal Fabrication. Basic Books.
Jenkins, J., Mills, P., Maidment, R., & Profit, M. (2007). Pharma Traceability Business
Case Report. Bridge. Retrieved from http://www.bridge-
project.eu/data/File/BRIDGE_WP06_Business_Case_Report.pdf
Kain, A., Mueller, C., & Reinecke, H. (2009). High aspect ratio-and 3D-printing of
freestanding sophisticated structures. Procedia Chemistry, 1(1), 750-753.
Karagol, B. (2015). 3D Printing: What does it offer and for whom? TEKPOL Working
Paper Series. Retrieved from:
http://stps.metu.edu.tr/sites/stps.metu.edu.tr/files/STPS-WP-15-02_0.pdf

40
Li, J. P., Habibovic, P., van den Doel, M., Wilson, C. E., de Wijn, J. R., van Blitterswijk,
C. A., & de Groot, K. (2007). Bone ingrowth in porous titanium implants
produced by 3D fiber deposition. Biomaterials, 28(18), 2810-2820.
Lipson, H., & Kurman, M. (2013). What we do know about the future of 3D printing.
Retrieved from: http://bigthink.com/in-their-own-words/what-we-do-know-about-
the-future-of-3d-printing
Lu, K., & Reynolds, W. T. (2008). 3DP process for fine mesh structure printing. Powder
Technology, 187(1), 11-18.
Manners-Bell, J., & Lyon, K. (2014). The implications of 3D printing for the global
logistics industry. Supply Chain 24/7. Retrieved from:
http://www.supplychain247.com/article/the_implications_of_3d_printing_for_the
_global_logistics_industry
Marchese, K., Crane, J., & Haley, C., (2015). 3D opportunity for the supply chain:
additive manufacturing delivers. Deloitte. Retrieved from:
http://dupress.com/articles/additive-manufacturing-3D-printing-supply-chain-
transformation/?coll=8717
Marsh, P. (2012). The New Industrial Revolution - Consumers, Globalization and the End
of Mass Production. Yale University Press.
McCue, T.J. (2016, April).Wohlers Report 2016: 3D Printing Industry Surpassed $5.1
Billion. Forbes. Retrieved from:
https://www.forbes.com/sites/tjmccue/2016/04/25/wohlers-report-2016-3d-
printer-industry-surpassed-5-1-billion/#16f239af19a0
41
Miller Jr, R. G. (1997). Beyond ANOVA: basics of applied statistics. CRC press.
Millsaps, B. B. (2016). Philips celebrates 125th anniversary with pilot program for 125
3D printed shavers, designed by consumers. 3DPrint.com. Retrieved from:
http://3dprint.com/116441/philips-125-3d-printed-shavers/
Osborn, K. (2014). Navy Brings 3-D Printing to Sea. Military.com. July 8. Retrieved
from: http://www.military.com/daily-news/2014/07/08/navy-brings-3d-printing-
to-sea.html
Ollison, T., & Berisso, K. (2010). Three-dimensional printing build variables that impact
cylindricity. Journal of Industrial Technology, 26(1).
Paukku, T. (2013). Ten New Miracle - Technologies that Change the World
(Kymmenenuuttaihmettä - Teknologiat, Jotkamuuttavatmaailmaa). Helsinki:
Gaudeamus.
Petrick, I. J., & Simpson, T. W. (2013). 3D printing disrupts manufacturing: how
economies of one create new rules of competition. Research-Technology
Management, 56(6), 12-16.
Petrovic, V., Vicente Haro Gonzalez, J., Jorda Ferrando, O., Delgado Gordillo, J., Ramon
Blasco Puchades, J., & Portoles Grinan, L. (2011). Additive layered
manufacturing: sectors of industrial application shown through case studies.
International Journal of Production Research, 49(4), 1061-1079.
Pyzdek, T., & Keller, P. A. (2014). The Six Sigma Handbook (p. 25). New York:
McGraw-Hill Education.

42
Stinson, T.N. (2014). Dam Neck Explores Future of 3D Printing for Navy. America’s
Navy. June 27. Retrieved from:
http://www.navy.mil/submit/display.asp?story_id=81936
Wohlers Associates (2013). Wohlers Report 2013 Reveals Continued Growth in 3D
Printing and Additive Manufacturing. Wohler Associates. Retrieved from:
http://wohlersassociates.com/press59.html