repeated survey of public attitudes following an extended period of exceptional drought in texas -...
TRANSCRIPT
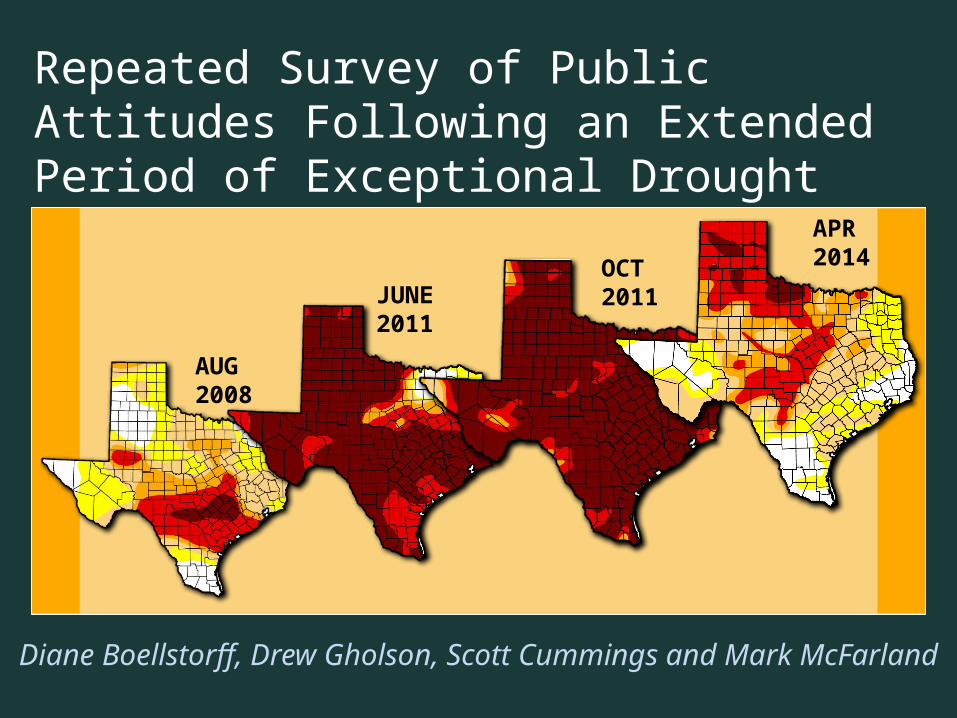
Repeated Survey of Public Attitudes Following an Extended Period of Exceptional Drought
Diane Boellstorff, Drew Gholson, Scott Cummings and Mark McFarland
AUG 2008
JUNE 2011OCT 2011
APR 2014

2
Acknowledgements
• Project is part of the National Water Survey Needs Assessment (2001-present) led by Dr. Robert Mahler, Univ. of Idaho.
• Funded by the USDA/CSREES National Water Program.
• Questionnaire was developed by institutional water quality coordinators nationwide. State-level modifications were accepted.
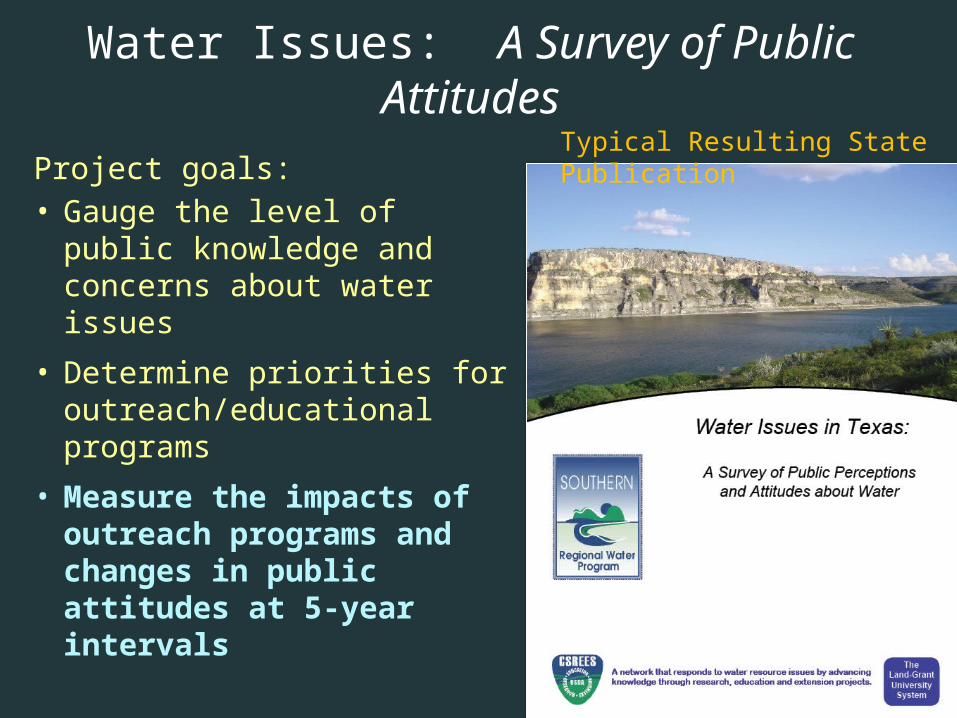
Water Issues: A Survey of Public Attitudes
Project goals:• Gauge the level of public
knowledge and concerns about water issues
• Determine priorities for outreach/educational programs
• Measure the impacts of outreach programs and changes in public attitudes at 5-year intervals
Typical Resulting State Publication
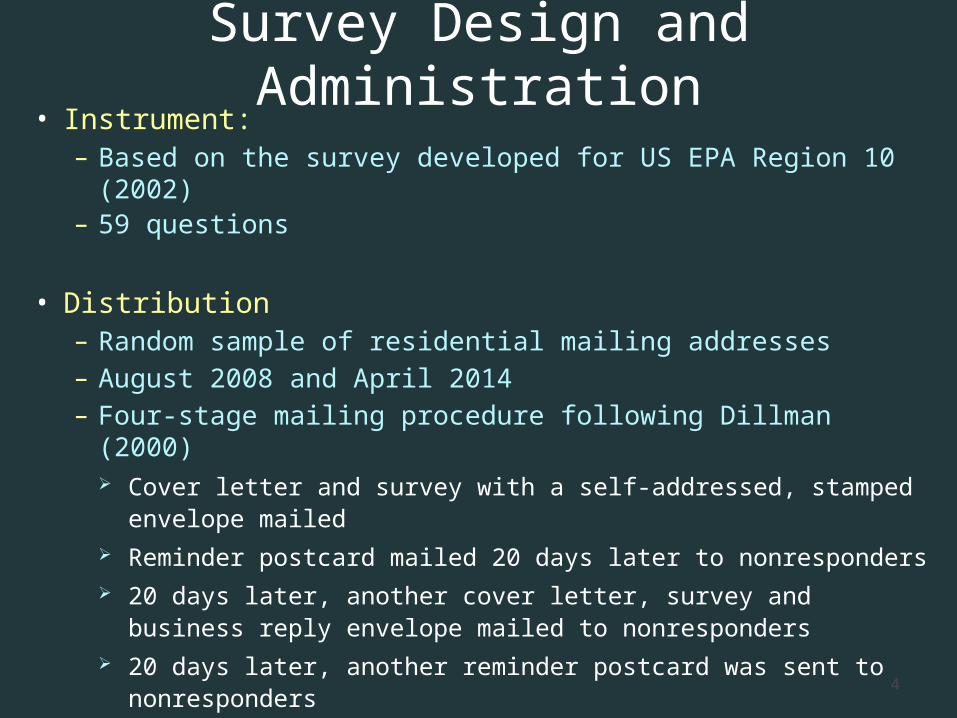
Survey Design and Administration• Instrument:
– Based on the survey developed for US EPA Region 10 (2002)– 59 questions
• Distribution– Random sample of residential mailing addresses– August 2008 and April 2014– Four-stage mailing procedure following Dillman (2000)
Cover letter and survey with a self-addressed, stamped envelope mailed
Reminder postcard mailed 20 days later to nonresponders 20 days later, another cover letter, survey and business reply
envelope mailed to nonresponders 20 days later, another reminder postcard was sent to nonresponders4
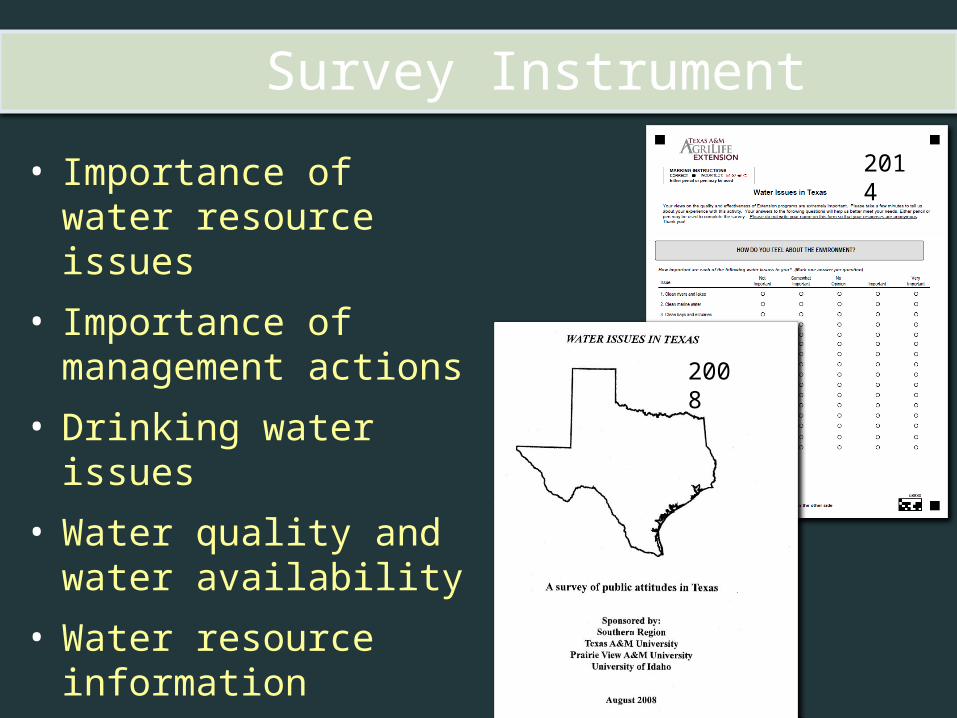
Survey Instrument
• Importance of water resource issues
• Importance of management actions
• Drinking water issues
• Water quality and water availability
• Water resource information
• Demographics and residence
2014
2008
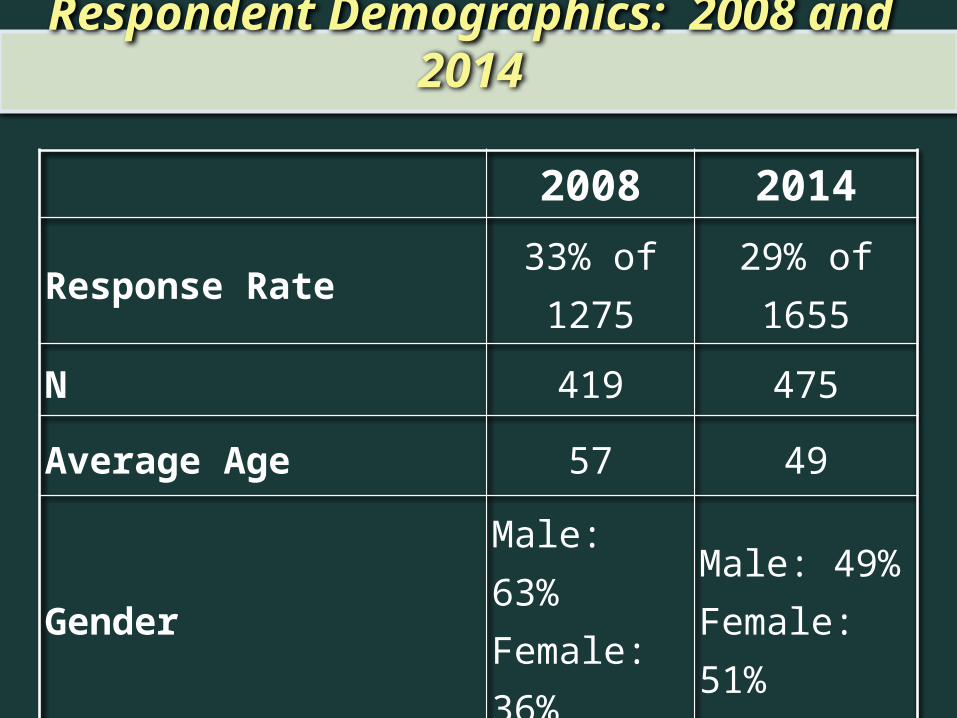
Respondent Demographics: 2008 and 2014
2008 2014
Response Rate 33% of 1275 29% of 1655
N 419 475
Average Age 57 49
Gender Male: 63%Female: 36%
Male: 49%Female: 51%
Years in Texas: All my life or more than 10 years 89% 92%

Respondent Demographics: 2008 and 2014
2008 2014
Response Rate 33% of 1275 29% of 1655
N 419 475
Average Age* 57 49
Gender* Male: 63%Female: 36%
Male: 49%Female: 51%
Years in Texas: All my life or more than 10 years 89% 92%
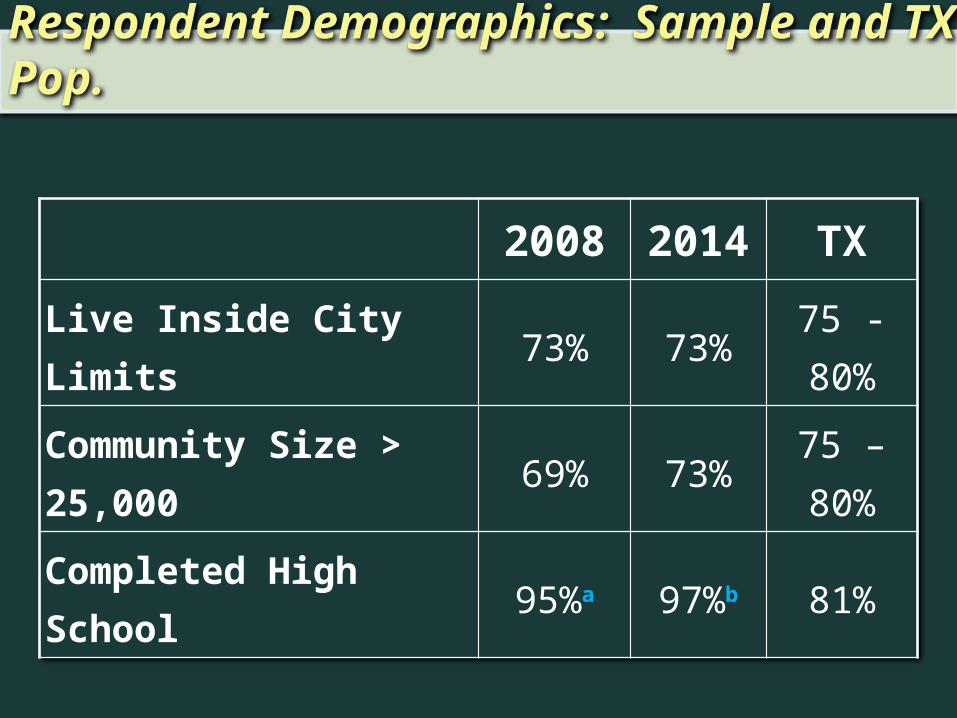
Respondent Demographics: Sample and TX Pop.
2008 2014 TX
Live Inside City Limits 73% 73% 75 - 80%
Community Size > 25,000 69% 73% 75 – 80%
Completed High School 95%a 97%b 81%
9
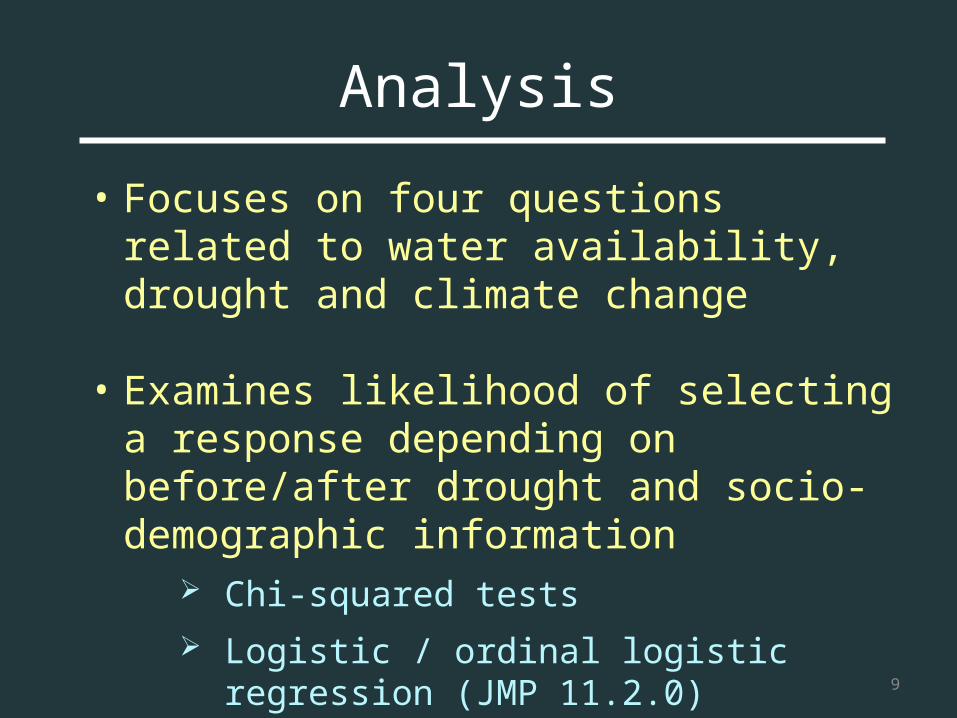
Analysis
• Focuses on four questions related to water availability, drought and climate change
• Examines likelihood of selecting a response depending on before/after drought and socio-demographic information
Chi-squared tests Logistic / ordinal logistic regression (JMP
11.2.0)
10
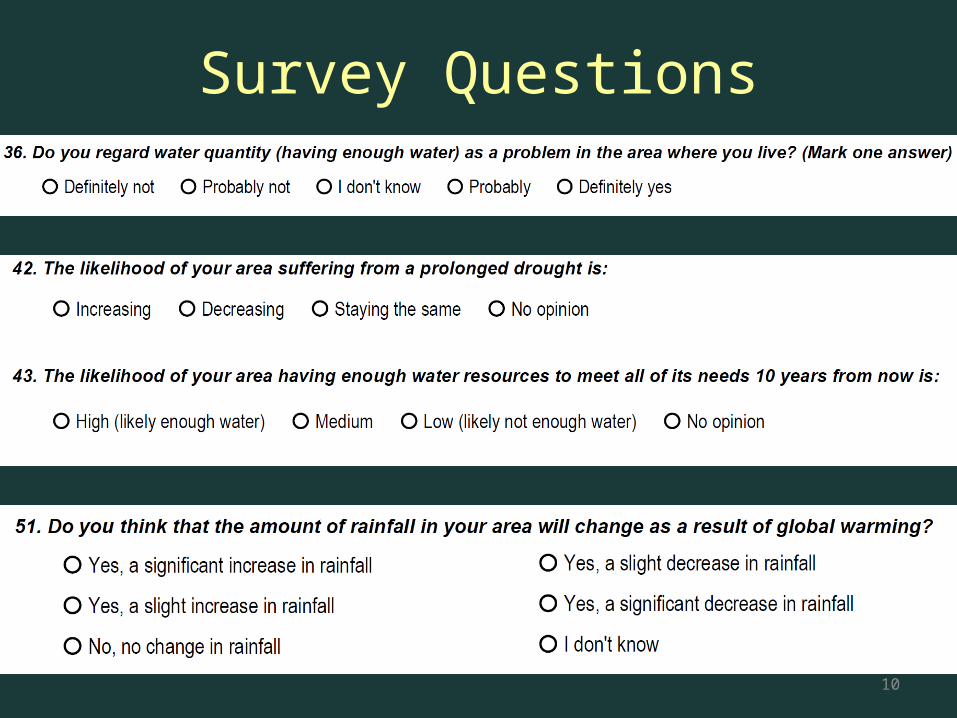
Survey Questions
Definitely not
Probably not
I don't know
Probably
Definitely
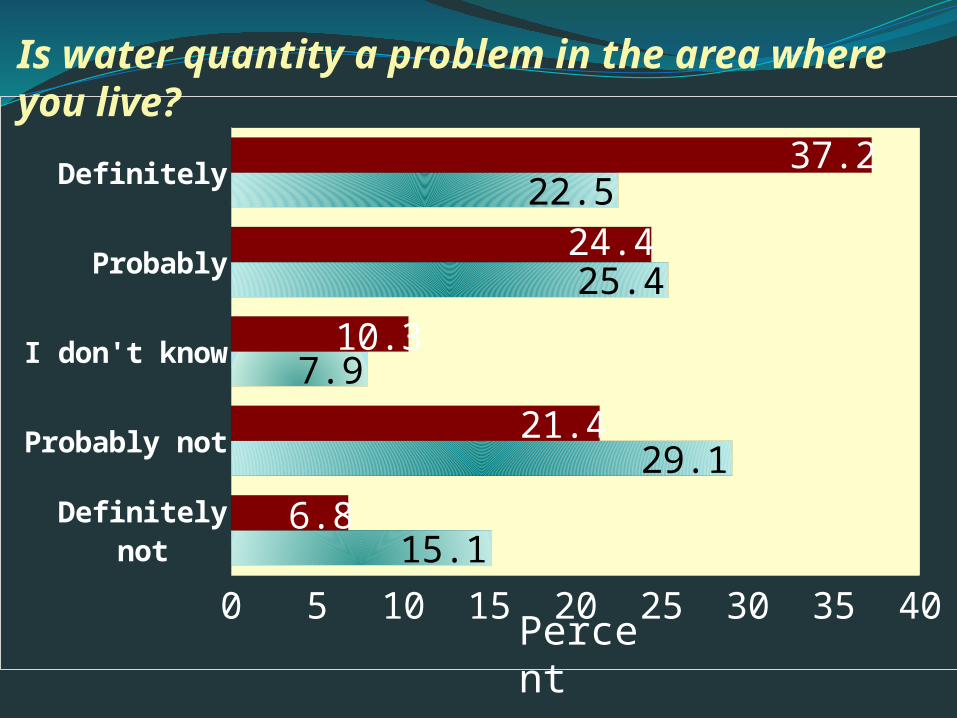
0 5 10 15 20 25 30 35 4015.1
29.1
7.9
25.4
22.5
6.8
21.4
10.3
24.4
37.2
Percent
Is water quantity a problem in the area where you live?
Definitely not
Probably not
I don't know
Probably
Definitely
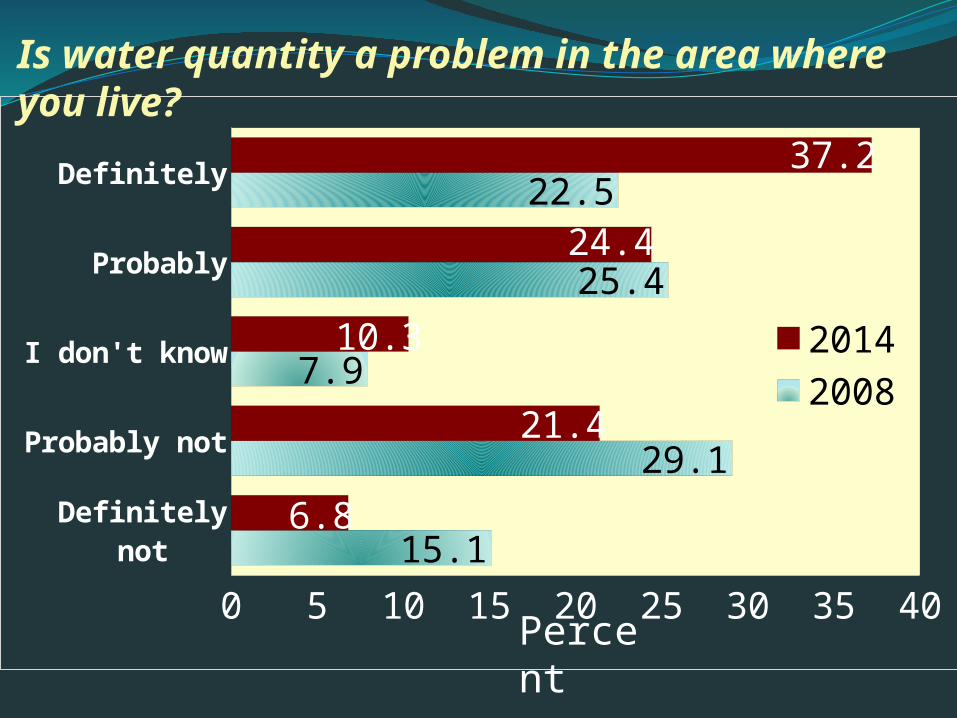
0 5 10 15 20 25 30 35 4015.1
29.1
7.9
25.4
22.5
6.8
21.4
10.3
24.4
37.2
20142008
Percent
Is water quantity a problem in the area where you live?

I don't know
Definitely Not or Probably Not
Definitely or Probably
0 10 20 30 40 50 60 70
7.9
44.2
47.9
10.3
28.2
61.6
20142008
Percent
Is water quantity a problem in the area where you live?
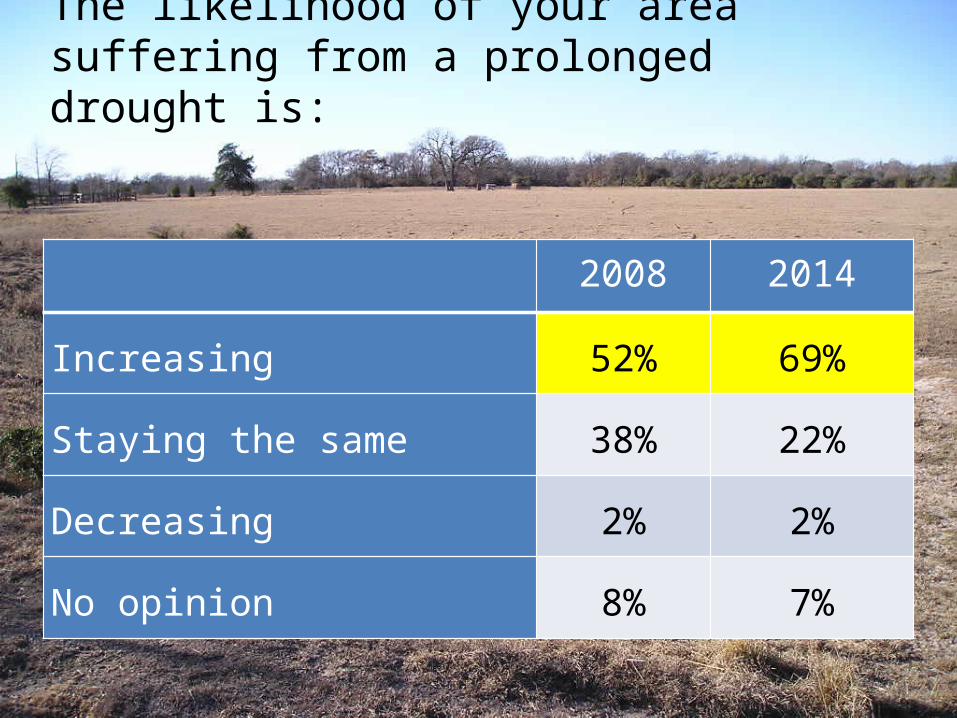
2008 2014
Increasing 52% 69%
Staying the same 38% 22%
Decreasing 2% 2%
No opinion 8% 7%
The likelihood of your area suffering from a prolonged drought is:
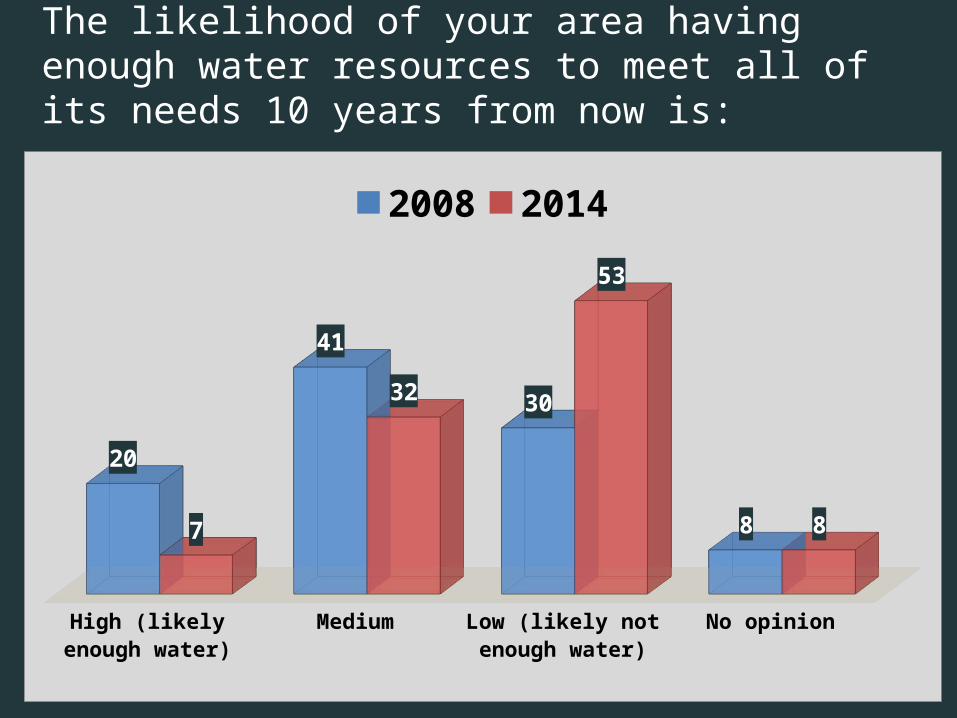
The likelihood of your area having enough water resources to meet all of its needs 10 years from now is:
High (likely enough water)
Medium Low (likely not enough water)
No opinion
20
41
30
87
32
53
8
2008 2014
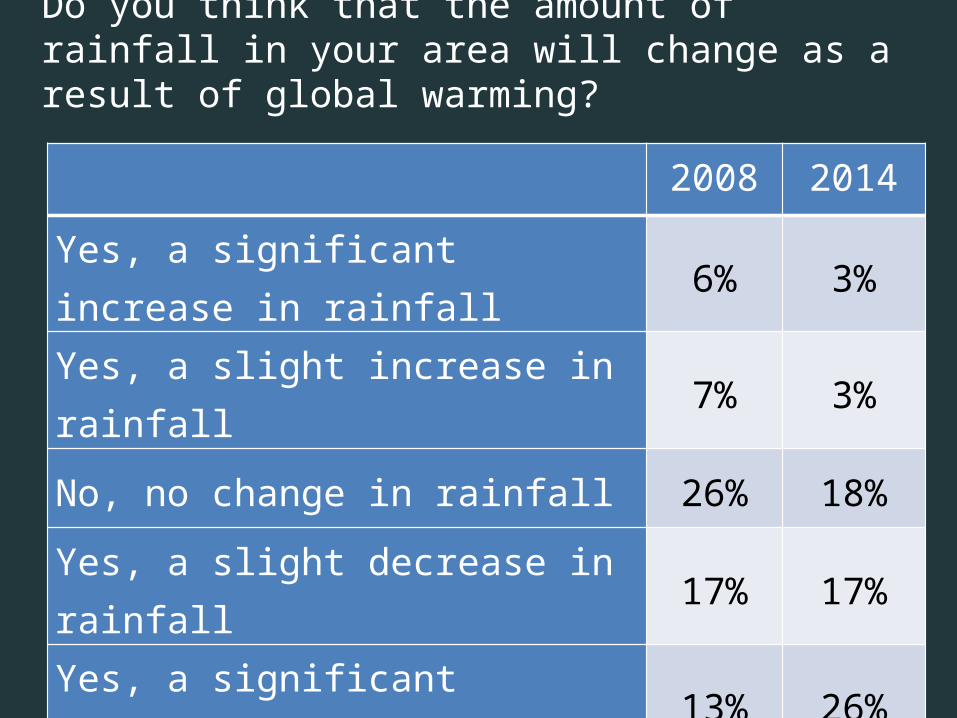
Do you think that the amount of rainfall in your area will change as a result of global warming?
2008 2014
Yes, a significant increase in rainfall 6% 3%
Yes, a slight increase in rainfall 7% 3%
No, no change in rainfall 26% 18%
Yes, a slight decrease in rainfall 17% 17%
Yes, a significant decrease in rainfall 13% 26%
I don’t know 30% 34%

Conclusions• From 2008 to 2014, the percentage of Texans replying
that water quantity is an issue in their area increased from 47% to 61% (p < 0.0001).
• Similarly, the percentage of Texans believing that that their area will experience prolonged drought increased from 52% to 69% (p < 0.0001).
• Texans believe that there is only a low likelihood that their areas will have enough water resources to meet needs 10 years from now increased from 30% to 53%.
• Texans indicating that global warming will cause significant decreases in rainfall increased from 13% to 26%; however, about a third still say, “Don’t Know.”
Questions?